Abstract
The starting phase for pumps in water transportation pipelines is crucial and has significant transient characteristics which merit further study in order to evaluate the operational stability of the pumping system. This paper presents the results of a study in which the relative steady operating conditions and starting period of a large double-suction centrifugal pump were monitored in real time, including pressure fluctuations, shaft run-out and vibration at the bearing. The transient characteristics of a double-suction centrifugal pump under different operating conditions have been analyzed using fast Fourier transform (FFT) and continuous wavelet transform (CWT). Results indicate broadband frequency components within the spectrum of pressure fluctuations in the volute casing under all test conditions, and the central frequency of the broadband frequency gradually decreases as flow rate increases and approaches the blade frequency, which is the primary reason for an increase in blade-frequency amplitude. This may produce a vibration frequency that is similar to the natural frequency of a certain part of the double-suction centrifugal pump during the starting period, which causes the resonance phenomenon. The radial force is also large during the starting period, which causes eccentric wear of the seal ring at the impeller inlet.
1. Introduction
In China, the power of all kinds of pumps can currently reach 950 million kW and accounts for about 16% of all electricity consumption in the country. The power of all kinds of pumping stations in China has reached 160 million kW, with an annual power consumption of 530 billion kW·h, accounting for about 10% of the country’s total electricity consumption. More than 435 million pumping stations are used for agricultural irrigation and drainage in the water conservancy industry, and the total power is 27 million kW. A reasonable pump type and an effective real time control for urban pipe network will play a positive role in the utilization efficiency and reasonable distribution of water resources [1]. The double suction centrifugal pumps are widely used because of their high efficiency, large flow rate and good balance of axial force. In recent years, with the increasing scale of pipeline water transmission projects in China and the development of large-scale pumps, more attention has been paid to the transient characteristics of double-suction centrifugal pumps. During the starting period, the pump has to withstand all the partial flow rates in a very short space of time. An unstable internal flow pattern leads to pressure fluctuation, vibration and shaft run-out in the unit, and major accidents can sometimes result. There is, therefore, a need to study the transient characteristics of large double-suction centrifugal pumps during the starting period. In this paper, the pressure fluctuation, vibration and shaft run-out of a double-suction centrifugal pump were measured, and its transient characteristics were analysed by means of FFT and CWT methods during the relative steady operating conditions and the starting period [2,3].
When the centrifugal pump runs at a constant flow rate, the pipeline system is in a relatively stable operating condition, and the flow in the centrifugal pump presents only periodic fluctuation characteristics. The frequency components of pressure fluctuation in a centrifugal pump are usually analysed by the FFT method [3,4,5,6]. It is generally considered that the frequency components under design operating conditions mainly include rotation frequency, blade-passing frequency and their harmonic frequencies. However, the frequency components of pressure fluctuation are more complex due to significant levels of secondary flows at partial flow rates. Wang et al. [5] performed an experimental investigation and found that the pressure fluctuation of a double-suction centrifugal pump is greatly affected by the velocity and rotational speed of the pump. The pressure fluctuation is one of the main factors causing the vibration of the unit. Hodkiewicz et al. [6] tested the vibration of pump bearings in horizontal and axial directions and found that the radial force of the impeller is relatively large at partial flow rates, and the amplitude of radial force at 0.6Qn is more than twice that at design flow rates. Yao et al. [7] analysed the radial force under different operating conditions and found that the value of shaft run-out clearly increases as the flow rate decreases, which is likely to cause the impeller seal ring to become worn. Pei et al. [8,9] studied the pump shaft run-out under different flow rates using the method of fluid–solid interaction and qualitatively analysed the transient characteristics of the single-suction centrifugal pump.
The start-up process of a centrifugal pump includes starting the pump with the valve closed and open. When the valve is closed, the pressure in the pump increases rapidly because of the rapid change of impeller rotational speed in the starting stage. During the valve opening stage, the flow rate of the pump gradually increases to the design flow rate. The flow is complex and changes quickly, so it is highly likely to cause unstable operating conditions [10]. Tsukamoto et al. [11,12] evaluated the transient characteristics of the pump by measuring the parameters such as instantaneous speed, flow rate and total pressure during the starting period. Yao et al. [13] have shown through experiments that low-frequency pressure fluctuations often occur in the pump at partial flow rates and sometimes even cause resonance in the piping system. Zhou et al. [14] found that with a decrease in flow rate, the amplitude of pressure fluctuations increased in a centrifugal pump, but the frequency and propagation speed of stall vortex decreased. Adamkowski [15] found that resonance caused by the natural frequency and rotational frequency of the pump shaft will lead to serious fractures of the pump shaft.
Impeller is an important part of a centrifugal pump, and it is an important way to improve the efficiency of the pump system by optimizing the design of impeller. Skrzypacz et al. [16] found that the micro blade makes the flow field near the wall produce better velocity distribution by studying the hydraulic characteristics of an impeller with micro-grooved blades and general impeller, which leads to an increase of the head and total efficiency of the pump system. Capurso et al. [17] proposed a novel impeller, which has the same specific speed number as the conventional impeller. The efficiency of the novel impeller can be increased by about 1–2%, and the outlet flow pattern of the impeller can be improved.
Computational fluid dynamics (CFD) is used to simulate the transient startup and shutdown process of centrifugal pumps. There are two commonly used approaches: one is to divide the startup or shutdown process into several time periods. These time periods are connected sequentially to simulate the startup and shutdown process by assuming that the flow rates in each time period remain constant. Wu et al. [18] set three different startup times, and compared steady-state and transient hydraulic characteristics. It was found that the transient Q-H curve was under the steady-state Q-H curve due to acceleration of the rotational speed. Wu et al. also studied the influence of different moments of inertia during the stopping period by setting flywheels on the shaft. They found that transient characteristics during the stopping period were also quite different from the hydraulic characteristics in the steady state (especially at a low impeller speed), and the difference was more obvious at partial flow rates [19]. The other approach is to simulate the transient process by taking the boundary condition of the inlet flow rate or the rotational speed of the impeller as a function of time. Zou et al [20] . evaluated the variation of radial force during the starting period of a double-suction centrifugal pump by using this method and summarized the function, describing the variation of radial force with time during the starting period. Chalghoum et al. [21] found that the valve-opening percentages and the starting time had a significance influence on the pressure evolution but had little impact on the steady-state characteristic curve. Li et al. [22] analysed the transient characteristics of a centrifugal pump during the starting period by using a dynamic mesh method and analysed the relationship between instantaneous flow evolution and corresponding transient flow, head, efficiency and power. However, due to the constantly changing flow rates in the pump, it is difficult to determine the boundary conditions of the pump inlet and outlet in a numerical simulation [23,24], so the accuracy of the numerical calculation needs further verification.
Although the hydraulic characteristics of a centrifugal pump can be partly predicted by CFD simulation, experimental study is still the most reliable method for investigating the transient characteristics of double-suction centrifugal pumps [25]. The key goal of this paper is to accurately investigate the transient characteristics of a large double-suction centrifugal pump in a real pumping station during the starting period and to analyse the differences between transient characteristics during the starting period and operating conditions with constant flow rates. The operating stability of a double-suction centrifugal pump system was analysed comprehensively by testing the internal pressure fluctuation, shaft run-out and bearing vibration at different constant flow rates and during the starting period. This may be the first experimental site of a double suction centrifugal pump during the starting period and verifies the data for numerical calculation of this type of water supply system during the starting period and also provides scientific guidance for engineering operation.
2. Experimental Scheme
2.1. The Tested Pumping System
The experimental pumping system was composed of an inlet pipe, an inlet butterfly valve, an inlet shrinkage pipe, a double-suction centrifugal pump, an outlet diffusion pipe, an outlet butterfly valve, an outlet pipe, a coupling and a motor, as shown in Figure 1. The diameter of the inlet pipe Din = 1400 mm, and the diameter of the outlet pipe Dout = 1600 mm. The main hydraulic structure of the pump was composed of a semi-spiral suction chamber, an impeller and a spiral volute. The flow direction is indicated by the arrow in Figure 1.
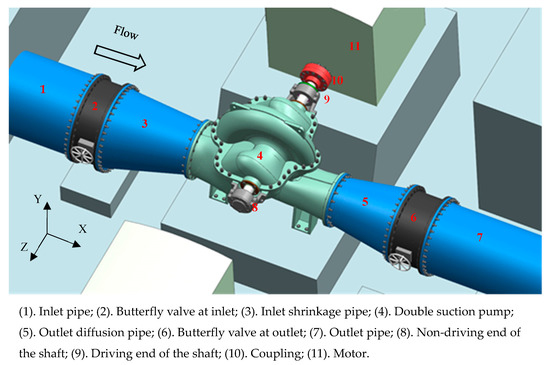
Figure 1.
A double-suction centrifugal pump system in a real pumping station.
2.2. Tested Pump
The geometry of the double-suction centrifugal pump is shown in Figure 2. The inlet diameter was 1000 mm; the outlet diameter was 900 mm; the impeller had six blades; the inlet diameter of the impeller was 490 mm; the outlet diameter was 1155 mm; and the outlet width was 240 mm. The design parameters for the double-suction centrifugal pump are listed in Table 1. The specific speed of the double-suction centrifugal pump was calculated using the following formula, which was the basis for calculating the structural parameters of the pump [26]:
where is rated rotational speed, r/min; is rated flow rate, m3/s; and is rated head, m.
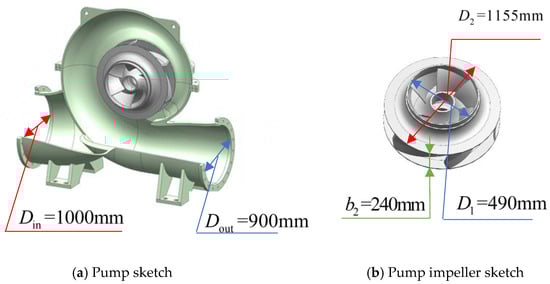
Figure 2.
Geometry and geometric parameters of the double-suction centrifugal pump.

Table 1.
Hydraulic performance of the tested pump.
2.3. Experiment Facilities
The flow rate was measured by a ZRN-100F external clip ultrasonic flowmeter, which recorded the diameter range as being between 200 and 4000 mm, the output current as being between 4 and 20 mA, and the accuracy was within 0.10%. The flowmeter was placed in the straight pipe of the pump outlet, and the value was found to be almost equal to the value measured by the electromagnetic flowmeter installed in the pumping station. The shaft run-out of the pump was measured by an eddy current sensor (a non-contact displacement sensor). The range was 0–4 mm; the output current ranged from 4 to 20 mA; the accuracy was within 0.3%; and the dynamic response frequency was between 0 and 1000 Hz.
The vibration parameters were measured by low-frequency vibration velocity sensors, combined with signal conditioning integral amplifiers. The sensor exported the voltage signal (proportional to the vibration velocity) by using the earth as the reference frame. In conjunction with the amplifier, the measurement ranged from 0.1 μm to 70 mm, and the frequency response was between 0.5 and 100 Hz.
The range of the inlet pressure fluctuation sensor was −100 to 200 kPa, and the range of the outlet pressure fluctuation sensor was 0 to 1 MPa. The power supply was 24 VDC; the output current was between 4 and 20 mA; and the accuracy was 0.25%. The dynamic response was 0–1500 Hz. A DPI832 standard pressure gauge was used to calibrate all the sensors used for pump pressure fluctuation measurement.
The CWP-S-1000-A-P rope displacement sensor manufactured by CALT SENSOR was used to measure the motion law and time of the hydraulic valve. This sensor is a high-precision linear displacement measuring device, which converts the linear displacement motion of an object into a quantifiable linear proportional current signal through the steel wire and angle-measuring components, enabling accurate output of displacement measurement data to be obtained. The measuring range is 0 to 1000 mm; the working voltage is 24 VDC; the output signal is between 4 and 20 mA; the linearity is 0.15%; and the maximum drawing speed is 1 m/s. The displacement sensor is located on the valve shaft, and there is a positive linear relationship between the displacement value and the valve rotation angle.
The 5-mm-thick steel sheet was placed in four symmetrical parts of the pump shaft, and the pump rotational rate was obtained by measuring pulse time intervals using the eddy current axial vibration sensor with a dynamic response of 0–1000 Hz.
The current and voltage transformer secondary terminal were connected to a power transmitter. The transformation ratio of the voltage transformer was 10000/100 V. The transformation ratio of the current transformer was 250/5 A. The power transmitter used was model S3WRD3, with an accuracy of 0.2%.
The experimental uncertainty analysis can be found in Appendix A.
2.4. Measurement Points Arrangement
As shown in Figure 3, the shaft run-out sensors in two directions (X and Y) were arranged at the driving end and non-driving end of the double-suction centrifugal pump shaft to monitor the shaft run-out data. Vibration sensors in three directions (horizontal: X; vertical: Y; and axial: Z) were placed on the drive end and the non-drive end to monitor vibration data at the bearings. The pressure fluctuation measuring points were arranged at the inlet, the top of the pump casing, the pump outlet and the hydraulic butterfly valve outlet (represented by P1, P2, P3 and P4, respectively), as shown in Figure 4. The layouts of the measuring points were referred to the references [3,5,13].
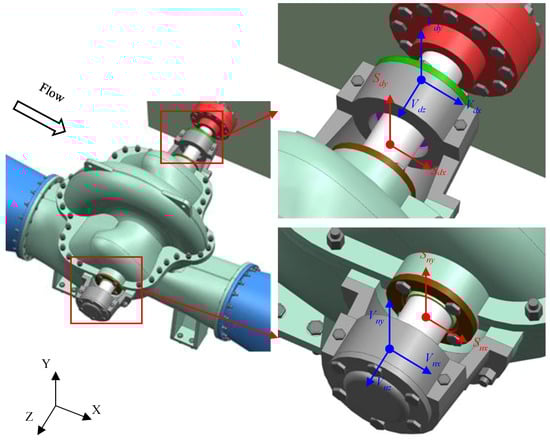
Figure 3.
The measuring points for shaft run-out and vibration at driving and non-driving ends.
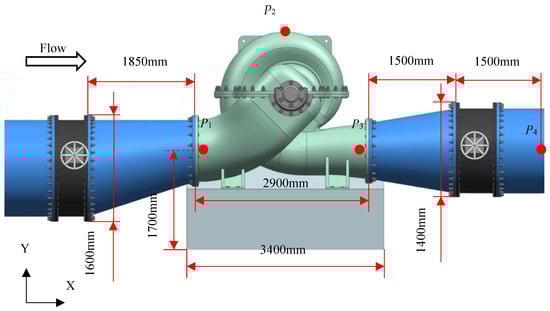
Figure 4.
The measuring points for pressure fluctuation.
3. Data Analysis Methods
This section will mainly introduce the theoretical formulas and calculation methods applied in this paper. For hydraulic performance, the calculation formulas of head and efficiency of pumps are included in this paper. The theoretical formulas of data processing methods are also briefly introduced, including FFT and CWT. During the starting period, the data, such as pressure fluctuation, change dramatically and need to be analyzed, so the methods of the trend line will also be explained. The shaft run-out data will be decomposed into three components to analyze its variation characteristics, which may be a better analysis scheme. In steady state, the evaluation methods of vibration are mainly intensity, that is, root mean square value, and the calculation formulas will be given in Section 3.5. The main evaluation criterion of pressure fluctuation is peak-to-peak value, which can clearly obtain the characteristics of pressure fluctuation at different flow rates.
3.1. Hydraulic Parameters
(1) Head
The static head of the pump was obtained from the pressure sensor connected to the pump inlet and outlet. The total head of the pump was calculated by the static head plus the installation height and velocity head of the sensor [26] as follows:
where and are the static pressure of the pump outlet and inlet. and are the velocity of the pressure-measuring section of the pump outlet and inlet. and are the height of the pressure-measuring points of the pump outlet and inlet. Since the inlet and outlet installation elevation of the double-suction centrifugal pump were at the same height, the third item of the above formula is 0. The local acceleration of gravity is represented by , and ρ is the density of the water. The test was conducted according to IEC standards [27]:
where, the installation elevation Z of the unit was 17.5 m; the latitude of the pumping station was φ = 23°; and the calculated local gravity acceleration was g = 9.817 m/s2.
(2) Pump efficiency
3.2. Fast Fourier Transform
The Fourier transform formulas for continuous time are [28]:
During the experiment, discrete signal values were collected, and the Fourier transform of the discrete signal xn was calculated as follows:
where, is the sampling time interval, s; and N is the number of points sampled.
In this paper, the sampling interval for pressure fluctuation, shaft run-out and vibration data was in a steady state. During the starting period, the sampling interval for pressure fluctuation, shaft run-out and vibration data was , and each sample was measured continuously for 30 s. The resulting data were used to analyse transient characteristics of the double-suction centrifugal pump.
3.3. Continuous Wavelet Transform
During the starting period of the double-suction centrifugal pump studied in this paper, the recorded signal was found to have transient and variable characteristics, and the wavelet analysis had better localized properties in both the time domain and the frequency domain, which can focus on any details of the research object. Yao [29] analysed the unsteady structure of the pressure fluctuation by using many methods, including wavelet transform, short-time Fourier transform. Pavesi et al. [30] performed a spectral analysis of the pressure fluctuation signal and applied the wavelet analysis method to evaluate the pressure fluctuations transient characteristics. Previous studies [31,32] have also used wavelet correlation to analyse the unique capability for decomposing the correlation of arbitrary signals. Continuous wavelet transform was, therefore, used to analyse the pressure fluctuation and vibration signal during the starting period.
For any function, , the continuous wavelet transform is:
where a is the scale of expansion; b is the translation parameter; is a mother wavelet function; and is changed by expanding. The symbol * stands for a complex conjugate. In wavelet analysis, there are many wavelet basis functions, such as Morlet wavelet, Marr wavelet, Harr wavelet, spline wavelet, Daubechies wavelet and so on. Through comparison, the Morlet wavelet was found to have better time and frequency resolution for analysing transient data and was, therefore, selected for transformation in this study. The function is expressed as:
3.4. Definition of the Trend Line
For a set of RR interval time series z:
where N is the number of detected R peaks. z can be written as the sum of two components:
where is the low-frequency aperiodic trend component to be removed, and is the detrend signal pulsation component. The trend components can be modelled using linear observation models as follows:
where is the observation matrix, ; is the regression parameter; and is the observation error. For reviewing parameters , a more general method was used to estimate the regular least squares solution:
where is a regularization parameter; and represents the discrete approximation of the dth order. In this paper, d = 2 [33]:
Tarvainen et al. [33] applied this trend-line method to analyse heart-rate variability signals and to study heart-rate trends. As a heart-rate signal has transient characteristics similar to the data monitored in this paper, , which is obtained by pressure fluctuation P during the starting period, was defined as a trend line.
Signal data relating to shaft run-out during the starting period was decomposed into three components, the expression of which is as follows:
where L represents the distance of deviation from the centre, which was obtained using the above trend-line method (mm); L’ represents the pulsating value after removing the trend (mm); and θ represents the angle of deviation from the centre (degree). The positional relationship of the three components is shown in Figure 5. Figure 5a shows the relative position of the shaft before starting the pump, at which time the shaft and the bearing were concentric; Figure 5b shows the relative position of the shaft after starting the pump. At this time, the shaft deviated from the geometric centre “O”. The position of the shaft at a certain moment is represented by a solid black circle, and the position of the calculated trend line is indicated by a hollow black circle. Direction X was defined as aligning with θ = 0°, and the counterclockwise direction was positive.
S = S (L, L’, θ)
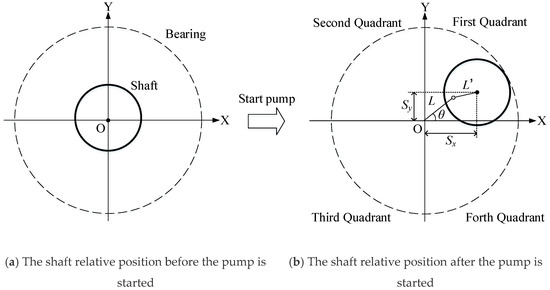
Figure 5.
Schematic diagram of the three components (L, L’, θ) of the shaft run-out.
3.5. Vibration Intensity
There are usually three criteria for evaluating the vibration of an object: displacement, velocity and acceleration. Vibration intensity is generally used to characterize vibration. Vibration intensity refers to the root mean square value of the vibration velocity, that is, the effective value of the vibration velocity. Vibration intensity reflects the magnitude of the total vibration energy, including the energy of each harmonic, and its expression is
where T is the time of the measured signal, s; and is the vibration velocity of the object, mm/s. If the signal measured in the experiment was a discrete signal, then Equation (16) could be written as:
where N is the number of discrete points of the measured signal.
3.6. Peak-to-Peak Value of Pressure Fluctuation
The maximum value was defined in the pressure fluctuation time domain waveform as ; the minimum value was . The pressure fluctuation peak-to-peak value can be calculated as:
According to the IEC regulations [34], in order to avoid the error caused by signal interference, a certain confidence interval is considered when calculating the peak-to-peak value. The double-peak is usually selected by a probability and statistics method, and 95% or 97% is generally adopted. In this paper, a 97% confidence interval was chosen for the pressure fluctuation signals.
4. Experimental Results and Discussion
4.1. Pump Performance
The performance curves of the double-suction centrifugal pump are shown in Figure 6. The Q-H is represented by a black curve; the Q-η is represented by a red curve; and the Q-P is represented by a blue curve. At a design flow rate of Qn = 3.75 m3/s, the pump head was 52.04 m; shaft power was 2.33 MW; and the best efficiency was 81.72%. It is clear from the Q-η curve that efficiency increased and then decreased with an increase in flow rate. When the flow rate ranged from 1.17 to 2.72 m3/s, the efficiency increased rapidly with an increase in flow rate. When the flow rate ranged from 2.72 to 4.03 m3/s, efficiency decreased slowly with an increase in flow rate, and efficiency was maintained above 80%, which characterizes a wide highly efficient zone.
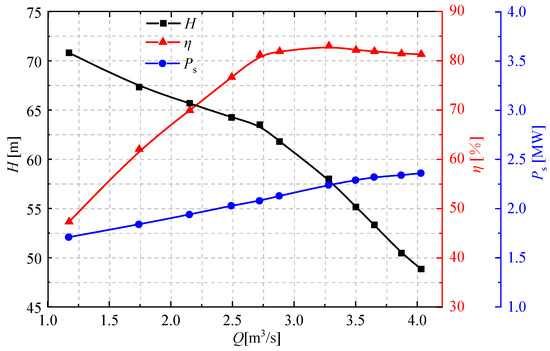
Figure 6.
External characteristic curves of the double-suction centrifugal pump.
4.2. Pump Operating Characteristics in Steady State
(1) Pressure Fluctuation
Figure 7a,b,c,d shows the frequency domain waterfall diagrams of the pressure fluctuation of the pump with different flow rates at P1, P2, P3 and P4, respectively. As shown in Figure 7a, the main frequency components of pressure fluctuation at the inlet of the pump had a low frequency (less than 1 Hz), a rotational frequency (9.9 Hz) and a blade-passing frequency (59.4 Hz) at the Q < 3.5 m3/s partial flow rate. Among these, the amplitudes of low frequency and rotational frequency were larger. The low-frequency component was probably due to the asymmetric structure of the semi-spiral suction chamber, which led to a pressure difference, and the inlet vortex band was thus formed at the inlet. Similar conclusions have also been found in other research (see Section 4.1, [13]). At the same time, we also found a low-frequency band zone at the inlet, mainly associated with rotational frequency. The smaller the flow rate, the larger the amplitude and the wider the width of the band frequency. In the case of Q > 3.5 m3/s, the zone of the low-frequency band gradually shrank as the flow rate increased, and the main frequencies were rotational frequency and harmonic frequencies instead. The amplitude of each frequency was also relatively close.
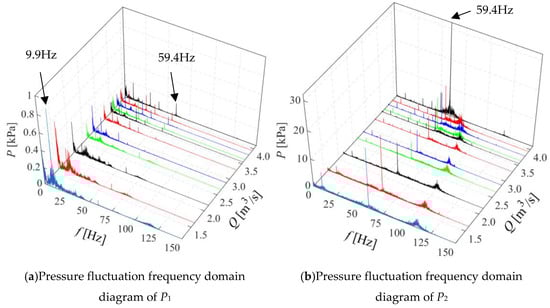
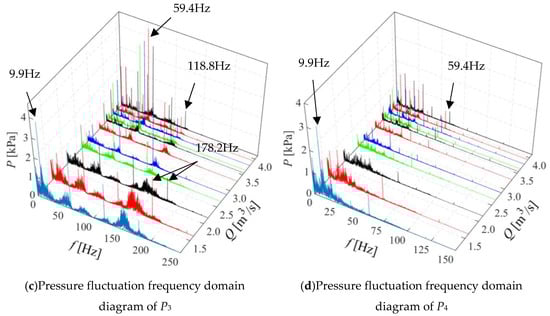
Figure 7.
Waterfall charts of pressure fluctuation at four measuring points.
As can be seen in Figure 7b, the main frequency component at the top of the pump volute was the blade-passing frequency, mainly because the volute would have been strongly affected by rotor and stator interaction. Under the Q < 3.5 m3/s partial flow rate, the amplitude of the blade-passing frequency was much larger than the other frequency, and it clearly increased with a decrease in flow rate. In addition, there was a frequency band whose centre frequency was larger than the blade-passing frequency. At a partial flow rate, the flow of both sides of the symmetric impeller might be unequal, and a frequency band with a central frequency close to twice the blade-passing frequency was produced. However, as the flow rate increased, the flow of the two sides of the symmetrical impeller gradually tended to be equal, the centre frequency was gradually reduced and finally was close to the blade passing frequency. At Q > 4.0 m3/s, the frequency band coincided with the blade-passing frequency, which made the amplitude of the blade frequency increase rapidly. Its amplitude was about three times that of the designed flow rate (Q = 3.75 m3/s), which could easily cause extremely unstable operation of the unit and should definitely be avoided.
As shown in Figure 7c, the main frequency components of the pump outlet were rotational frequency, blade-passing frequency and harmonic frequencies. At the Q < 3.5 m3/s partial flow rate, there were also broadband frequencies between these main frequencies. The broadband frequency width increased and the amplitude decreased with an increase in flow rate. Meanwhile, the centre frequency gradually approached the main frequencies, such as the rotational frequency and the blade-passing frequency, which caused an increase in the amplitude of the main frequencies. At this point, premature fatigue damage of the pump impeller is easily incurred.
As can be seen in Figure 7d, the main frequency of P4 was rotational frequency and blade-passing frequency at the Q < 3.5 m3/s partial flow rate, and there was also a wide band frequency zone whose centre frequency was rotational frequency. The frequency ranged from 0 to 100 Hz, and the band frequency amplitude near the rotational frequency was higher. The band frequency and the main frequency overlapped when the flow rate increased, resulting in an increase in the main frequency amplitude. In addition, there was a low frequency component of 0–3 Hz after the valve. Such phenomena are affected by the butterfly valve, which produces a vortex zone in the pipe after the valve. At the Q > 3.5 m3/s flow rate, the broadband frequency zone gradually disappeared, and the main frequencies were rotational frequency, blade-passing frequency and their harmonic frequencies.
Figure 8 shows the pressure fluctuation peak-to-peak value at each measuring point in the 97% confidence interval. P2 was found to be subjected to strong rotor and stator interaction, and the peak-to-peak value of pressure fluctuation was larger than that of the other positions. The peak-to-peak value size of the points was in the order: ΔP2 > ΔP3 > ΔP4 > ΔP1. The peak-to-peak value at the top of the volute firstly decreased and then increased as the flow rate increased, and the flow rate ranged from 2.75 to 3.5 m3/s (0.73–0.93 Qn). The other measuring points also showed a tendency to decrease initially and then increase: the peak-to-peak value at the partial flow rate was higher, and the peak-to-peak value decreased as the flow rate increased. At Q > 3.5 m3/s, the increase in peak-to-peak value was not obvious, which is different from the value measured at the top of the volute.
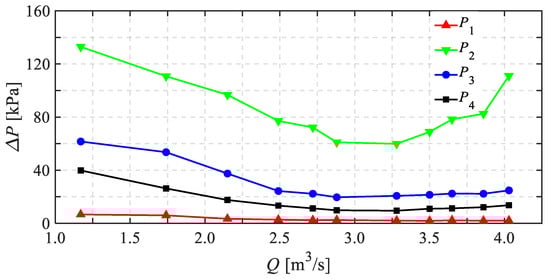
Figure 8.
The pressure fluctuation peak-to-peak value of each measuring point in the 97% confidence interval.
(2) Shaft Run-out
Figure 9 shows the shaft run-out of the double-suction centrifugal pump in a steady state. In Figure 9a, black, red and blue represent the shaft run-out of the high flow rate (Q = 4.10 m3/s), the design flow rate (Q = 3.75 m3/s) and the partial flow rate (Q = 2.17 m3/s), respectively. In Figure 9b, the left side is the shaft run-out track of the driving end during one period, and the right side is the shaft run-out track of the non-driving end during one period. It can be seen that at a partial flow rate, the amplitude of the vertical direction (Y) of the driving end was 0.30 mm; the amplitude of the horizontal direction (X) was 0.16 mm, and the amplitude of the vertical direction of the non-driving end was 46.7% smaller than that of the driving end, while the amplitude of the horizontal direction was similar to that of the driving end. At the design flow rate, the shaft run-out amplitude of the driving end in both directions was 0.1 mm, while that of the non-driving end in the vertical direction was 0.24 mm and that of the horizontal direction was 0.20 mm. In the case of the high flow rate, the amplitude of shaft run-out in the two directions of the driving end was mostly the same as that in the design flow rate. The amplitude of shaft run-out in the vertical direction of the non-driving end was 0.40 mm and that in the horizontal direction was 0.24 mm. Therefore, at the design flow rate, the seal ring at the driving end was more susceptible to wear, as was the mouth ring at the non-driving end at the design flow rate or a high flow rate. The pressure fluctuation at P2 was relatively large at high flow rate and partial flow rate, which was reflected in the shaft run-out. In addition, the specific performance was as follows: At partial flow rate, the shaft run-out amplitude of the driving end is large; at high flow rate, that of the non-driving end is large. This may be due to the fact that the motor vibration at a partial flow rate was more severe than at a high flow rate.
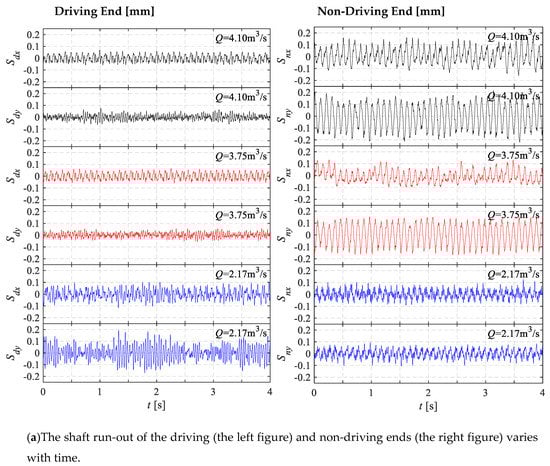
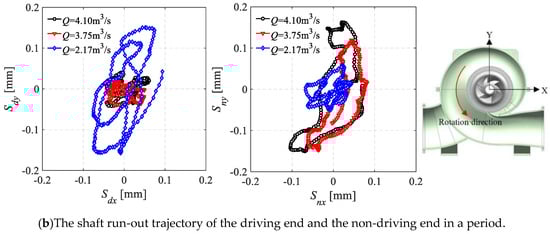
Figure 9.
Shaft run-out of the double-suction centrifugal pump under steady state.
(3) Vibration
Figure 10 shows the vibration at the bearing of the double-suction centrifugal pump in a steady state. Figure 10a,c,e is the vibration-frequency domain diagrams of directions X, Y and Z of the drive end, respectively, and Figure 10b,d,f is the vibration-frequency domain diagrams of directions X, Y and Z of the non-drive end, respectively. It was found that the vibration-frequency domain diagrams of the three measuring points in three directions were basically similar, and the blade-passing frequency dominated. At the partial flow rate, there were broadband zones whose central frequency was about 26.2 Hz and a blade-passing frequency in vertical (Y) and axial (Z) directions. The frequency of 26.2 Hz would be explained in Section 4.3. In the horizontal direction (X), the centre frequency of broadband was 40 Hz. The frequency range of the blade-passing frequency was 20–110 Hz, and this gradually shrank as the flow rate increased.
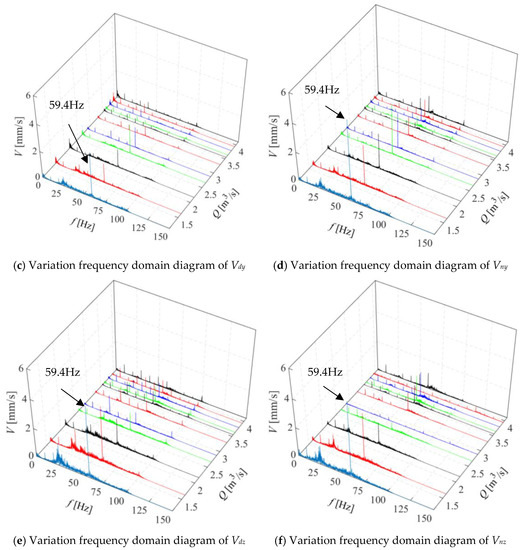
Figure 10.
Waterfall charts of vibration for three directions.
Figure 11 shows the variation of vibration intensity in each direction of two measuring points at different flow rates. It can be seen that the vibration intensity in the horizontal direction of the non-driving end was large at the partial flow rate. The reason for the larger vibration amplitude in direction X may be that the momentum increment of the flow was mainly in the direction of X, which was the direction of flow. The vibration intensity decreased at first and then increased as the flow rate increased, which is similar to the peak-to-peak value of pressure fluctuation. This indicates that the vibration at the bearing is mainly caused by pressure fluctuation.
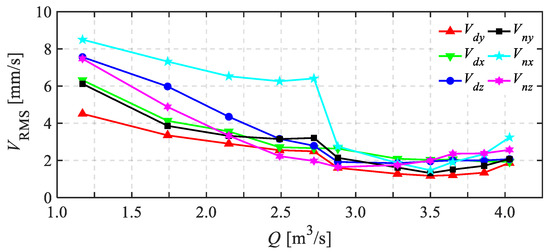
Figure 11.
Vibration intensity in each direction with different flow rates.
4.3. Experimental Results of the Starting Period
The double-suction centrifugal pump was started with a closed valve. At t = 0–2 s, it represents the period during which the valve was closed. The pump was started at t = 1 s. After 1 s, the pump rapidly reached the rated speed, and the head of the unit rose to 75 m. The outlet hydraulic butterfly valve began to open linearly at t = 2 s. At t = 24 s, the valve was fully opened, and the head of the unit was stable at 50 m at the end of the starting period. Variations in the pump head and valve opening during the starting period are shown in Figure 12. In this paper, the starting period was divided into three stages: Stage 1 was the valve-closing stage (from 0 s to 2 s). Stage 2 was the linear opening stage (from 2 s to 24 s), and Stage 3 was the stage in which the valve was fully opened (from 24 s to 30 s).
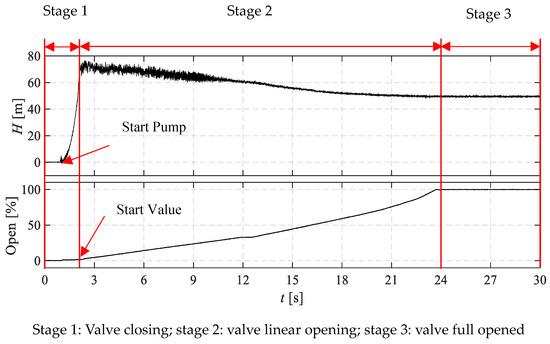
Figure 12.
Head and opening of the pump unit varying with time in starting period.
(1) Pressure Fluctuation
Variation of pressure fluctuation with time during the starting period is shown in Figure 13. Figure 13a,b,c and d shows the pressure fluctuation of measuring points P1, P2, P3 and P4, respectively. Pressure fluctuation at each measuring point is presented in three graphs as follows: in Part 1, the red curve represents the time-domain diagram of pressure fluctuation of the measuring point during the starting period, and the black dotted line is the pressure fluctuation trend line of the measuring points; in Part 2, the blue curve represents the pressure deviation after removing the trend line; in Part 3, the three-dimensional diagram represents the time-frequency diagram obtained by using the continuous wavelet transform of the pressure fluctuation.
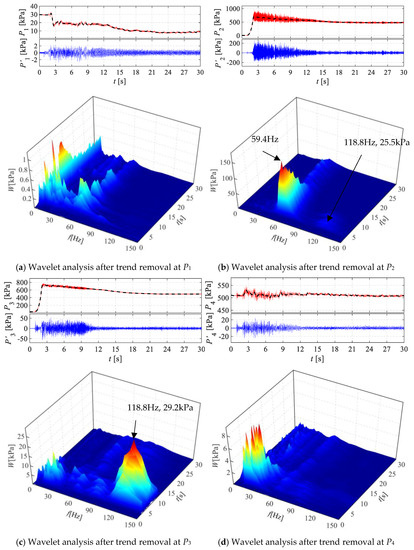
Figure 13.
The pressure fluctuation varies with time during starting period.
As can be seen in Figure 13a, pressure fluctuation at the pump inlet during the valve-closing stage was 30 kPa. When the valve was opened, pressure fluctuation at the inlet decreased rapidly to 19 kPa. In the linear opening stage, pressure fluctuation at the inlet decreased gradually with time. When the valve was fully opened, pressure fluctuation decreased to 10 kPa and finally stabilized near 10 kPa. Analysis of the time-frequency diagram indicated that there was almost no frequency component at the inlet when the valve was closed at t = 0–2 s. At t = 2–15 s, the frequency components at the inlet were more complex with the valve opening from 0% to 44%, ranging from 9.9 Hz (rotational frequency) to 59.4 Hz (blade-passing frequency). At t = 5–15 s, the opening of the valve ranged from 44% to 100%, and the components of rotational frequency and blade-passing frequency were dominant. At this time, the opening of the valve was small, which resulted in large rotational frequency and blade-passing frequency amplitude. The amplitude of the rotational frequency was 0.96 kPa, and the amplitude of the blade-passing frequency was 0.40 kPa. The amplitude of the rotational frequency and blade-passing frequency gradually decreased as the valve opened further. Finally, the amplitude of the rotational frequency was stable at 0.40 kPa; the amplitude of the blade-passing frequency was stable at 0.10 kPa; and the amplitude of the rotational frequency was about four times that of the blade-passing frequency.
As indicated in Figure 13b, the pressure fluctuation at the top of volute rose rapidly from 0 to 900 kPa within 1 s of the pump being started. During t = 2–24 s, there was a decreasing linear trend in the pressure fluctuation as the valve opened linearly. At t = 2–15 s, the amplitude of the pressure fluctuation gradually decreased from 400 kPa to 80 kPa. When the valve was fully opened, the pressure level was maintained near 478 kPa. Analysis of the time-frequency diagram indicates that the pressure fluctuation component was relatively single, and the main frequency was the blade-passing frequency. When the pump was on but the valve was closed, the pressure fluctuation amplitude level reached 179.2 kPa. The amplitude level decreased to about 30 kPa when the valve was 44% open. The amplitude of the pressure fluctuation remained almost the same from t = 15 s.
As shown in Figure 13c, the pressure fluctuation trend line at the pump outlet was basically the same as that at the top of the volute, but its fluctuation amplitude was 82.5% smaller than that at the top of the volute. The fluctuation amplitude here decreased to 15 kPa at t = 11 s and remained stable.
Analysis of the time-frequency diagram for the measuring point revealed that the double blade-passing frequency was the main frequency component at t = 2–11 s. It was concluded that the amount of water flowing out of the two symmetrical impellers was not equal when there was a partial flow rate during the starting period, leading to double blade-passing frequency. The double frequency phenomenon was found at P2 and P3 (marked with arrows in Figure 13b,c), and the time was within 8 s of the pump being started. In addition, there was a frequency component of 28 Hz during t = 2–5 s, for two possible reasons: Firstly, 28 Hz may be the natural frequency of part of the hydraulic structure of a double-suction centrifugal pump, which causes system resonance; secondly, water hammer occurs when the pump is started quickly. After t = 11 s, the valve opening reached 30%; the amplitude of the double blade frequency and the 28 Hz frequency decreased rapidly; and the rotational frequency and the blade-passing frequency dominated.
As can be seen in Figure 13d, there was a 28 Hz frequency component similar to the frequency component at the outlet of the pump during t = 2–8 s, but there was no double blade-passing frequency component. This was mainly due to the high frequency component of the double blade-passing frequency disappearing under the influence of the valve, and 28 Hz may be the natural frequency of part of the hydraulic structure of a double-suction centrifugal pump. The flow rate increased gradually as the valve opened further, and the frequency component of 28 Hz gradually disappeared.
(2) Shaft Run-out During Starting Period
Figure 14 shows the shaft run-out of the drive end and the non-drive end over time during the starting period, and Figure 15a,b represents the shaft run-out in directions X and Y. Actual displacement of the shaft run-out is represented by a red line; deviation from the centre (marked as L) is represented by a black dotted line; and the pulsation value after removing the trend (marked as L’) is represented by a blue line. In Figure 15c, the left-hand figure represents the motion track of L; the middle figure represents the real track of the shaft run-out; and the right-hand figure represents the direction sketch. Direction X is 0 degrees and the counterclockwise rotation direction is positive. Figure 15d shows, in turn, the variation of L, L’ and the angle of deviation from the centre (marked as θ) during the starting period.
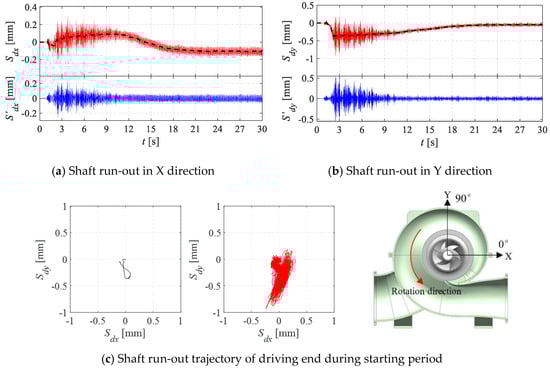
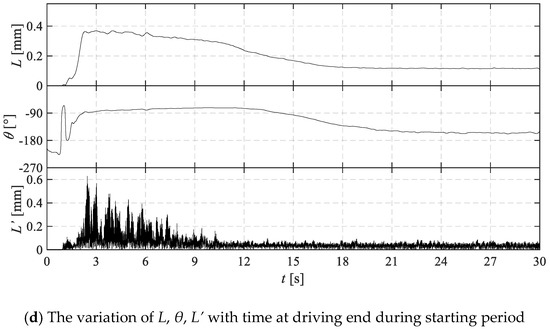
Figure 14.
Shaft run-out at driving end.
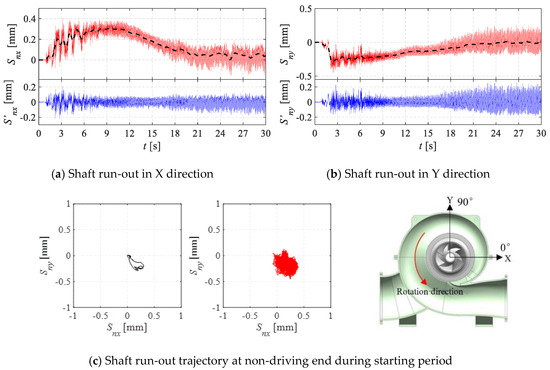
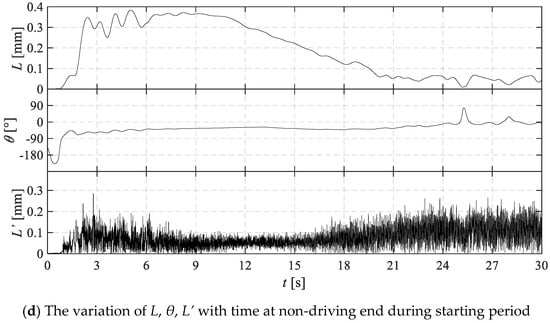
Figure 15.
Shaft run-out of non-driving end.
As can be seen in Figure 14d and Figure 15d, at t = 1–2 s, the pump was activated, but the valve was still closed. At this time, the pressure value at the pump outlet rose rapidly with time to the maximum, leading to a rapid rise in the radial force of the pump impeller. Severe friction was created between the impeller and the mouth ring within a short amount of time, which may have produced a lot of heat. The value of L rose to 0.36 mm, L’ rose to 0.60 mm, and the shaft run-out range was 0.96 mm at the driving end. L rose to 0.34 mm, L’ rose to 0.20 mm, and the shaft run-out range was 0.54 mm at the non-driving end. At t = 2–6 s, the value of L at the driving end was basically invariant, and the amplitude of L’ was large. However, L fluctuated violently at the non-driving end, but the amplitude of L’ was small. In general, when the power was on, the shaft run-out at the drive end was greater than the shaft run-out at the non-drive end. As the valve opening gradually increased, the amplitude of the shaft run-out at both ends was significantly reduced. At this time, friction between the impeller and mouth ring gradually weakened. Due to the thermal stress, the outer diameter expanded outwards and the inner diameter shrank inwards.
After t = 24 s, the pump gradually stabilized, and the deformation and wear of the mouth ring reached a state of equilibrium. The amplitude of the shaft run-out also gradually became stable. The peak-to-peak value of the shaft run-out was stable at 0.14 mm at the driving end and was stable at 0.25 mm at the non-driving end. At t = 2–11 s, the angle of deviation from the centre at the driving end shifted to the direction of −80°, pointing to the position of the tongue, and the non-driving end shifted to the direction of −45°. The deviation of the shaft run-out to the fourth quadrant was mainly due to the spiral volute structure making the flow area of the fourth quadrant smaller than that of the second quadrant. The flow velocity in the fourth quadrant was larger, so the pressure was lower, directing the radial force on the impeller to the fourth quadrant, thus the shaft run-out deviated to the fourth quadrant. This also reflects the fact that the radial force of the impeller was greater during the starting period, meaning that eccentric wear of the ring was more likely to occur in a specific direction.
(3) Vibration During Starting Period
Figure 16 shows the vibration at the bearing of the double-suction centrifugal pump during the starting period. Figure 16a,c,e shows the vibration time-frequency diagrams of the driving end in directions X, Y and Z, respectively. Figure 16b,d,f is the vibration time-frequency diagrams of the non-driving end in directions X, Y and Z, respectively.
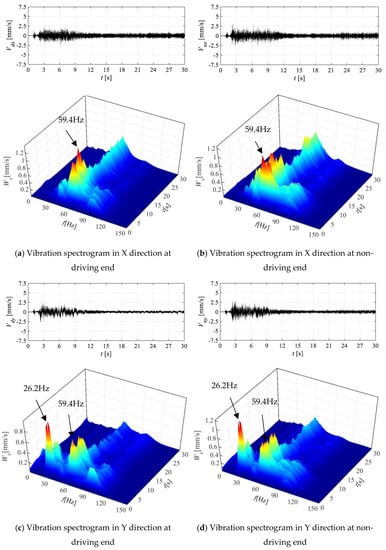
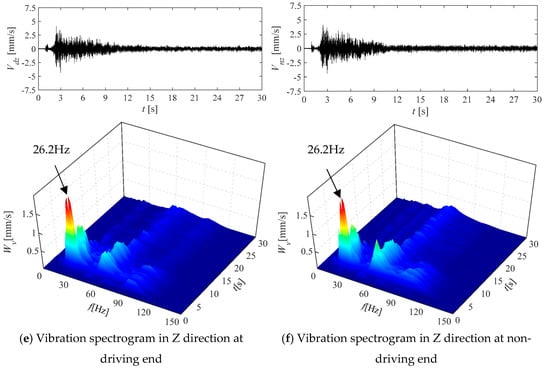
Figure 16.
Wavelet analysis of vibration in all directions during starting period.
As can be seen in Figure 16, the vibration situation is basically similar. The vibration amplitude of the axial direction (Z) was largest during the valve closing stage. When the valve was fully open, the vibration amplitude of the radial direction (X) was clearly larger than that of the other two directions once the pump was running stably. It is worth noting that vibrations occur within 0.7 s. The frequency components were 45.5 Hz and 91.0 Hz, and the amplitude was about 2 mm/s. At t = 1.7 s, the amplitude almost became zero. This phenomenon was caused by the impeller from stationary to rotating. There were some sub synchronous frequencies varying with time in this very short time. When the impeller reached the working speed, the main vibration frequency became to the rotational frequency. At t = 2–15 s, the main vibration frequency was the blade-passing frequency, indicating that the next vibration was caused by dynamic and static interference between the impeller and the pump body. The vibration amplitude was reduced as the valve opened further. The stage when the pump was started with the valve closed produced considerable vibration, especially when the valve was less than 50% open.
The frequency components of directions Y and Z were similar in different directions (X, Y and Z). At t = 3 s, there was a frequency of 26.2 Hz (except for the blade-passing frequency), and the amplitude of the frequency was larger than the amplitude of the blade-passing frequency. There was also a 28 Hz frequency when pressure fluctuated during the starting period (as discussed above), and the two frequencies were basically the same. Therefore, this frequency may also be the natural frequency of part of the hydraulic structure of a double-suction centrifugal pump, which causes resonance of the system. It was interesting that, in Figure 10, the vibration waterfall charts obtained by FFT also had such a frequency component of 26.2 Hz, which might be the natural frequency mentioned above. However, this frequency component was not found in direction X. The time-frequency diagrams for directions Y and Z were also highly similar from different positions at the driving end and non-driving end. Direction X of the non-driving end had more complex frequency components when the valve closed, and the vibration amplitude was greater.
5. Conclusions
In this paper, the transient characteristics of pressure fluctuation, shaft run-out and bearing vibration under steady state and during the starting period were studied by using FFT and CWT analysis methods. The main conclusions were as follows:
- (1)
- Rotational frequency, blade-passing frequency and harmonic frequency were the main frequency components of pressure fluctuation and vibration. A broadband frequency with a centre frequency greater than the blade frequency was also found in the pressure fluctuation spectrum. As the flow rate increased, the central frequency decreased linearly, gradually approaching the blade-passing frequency and, finally, coinciding with the blade-passing frequency, making the amplitude of the blade frequency increase rapidly and rendering the unit unstable. The object studied in this paper was the symmetrical axial form of the impeller. An impeller type of staggered arrangement in circumferential direction might be beneficial to pressure fluctuation and vibration. It was found that there was a low frequency component at inlet, which might be due to the fact that there is a vortex at the inlet, and the low frequency was probably the vortex frequency. Adding a baffle into the suction chamber might improve the inlet flow pattern.
- (2)
- At a partial flow rate, the amplitude of the vertical direction (Y) of the driving end was 0.30 mm, the amplitude of the horizontal direction (X) was 0.16 mm, and the amplitude of the vertical direction of the non-driving end was 46.7% smaller than that of the driving end. However, under the design flow and overflow conditions, the shaft run-out amplitude of the driving end in both directions was 0.1 mm, while that of the non-driving end in the vertical direction was 0.24 mm and that of the horizontal direction was 0.20 mm. The shaft run-out of the driving end was found to be about 2.3 times as much as that of the non-driving end when the pump was started up. As the valve opening gradually increased, the shaft run-out of the non-driving end was about 3.4 times that of the driving end. In addition, the shaft run-outs, both the driving end and the non-driving end, were uniformly biased to the fourth quadrant during the starting period, also indicating that the impeller was subjected to a larger radial force during the starting period, meaning that the mouth ring was susceptible to eccentric wear in a specific direction. The hydraulic structure of double volutes could be considered to improve the radial force, so as to improve the shaft run-out.
- (3)
- The main cause of vibration was found to be pressure fluctuation inside the pump. Vibration amplitudes were found to be relatively large during the stage in which the valve opened linearly, especially when the valve was between 0 and 50% open. Within 3 seconds of opening the valve, the vibration frequency might be the natural frequency of part of the hydraulic structure of the double-suction centrifugal pump, thus causing system resonance. It is suggested that modal analysis of the whole pump should be calculated when designing centrifugal pumps. In addition, the staff should check the coaxiality of the pump shaft before starting up and ensure that the shaft run-out is within the feasible range.
These experimental results can provide a basis for CFD simulation to calculate the steady state or starting period of a double-suction centrifugal pump and guide the design and operation of pumping stations.
Author Contributions
Conceptualization, F.J. and Z.Y.; Methodology, Z.Y.; D.L., R.X. and F.W.; Software, F.J.; Validation, C.H., Z.Y. and F.W.; Investigation, F.J. and Z.Y.; Writing-Original Draft Preparation, F.J.; Writing-Review & Editing, Z.Y.; Visualization, F.J.; Supervision, Z.Y. and F.W.; Funding Acquisition, Z.Y. and F.W.
Funding
This research was funded by the National Natural Science Foundation of China grant number [51879266 and 51839001], National Key R&D Program of China grant number [2017YFC0403206], Beijing Municipal Science and Technology Project grant number [Z181100005518013] and Chinese Universities Scientific Fund grant number [2019TC040].
Acknowledgments
The authors would like to acknowledge the support given by the management office of Shenzhen dongjiang water resource.
Conflicts of Interest
The authors declare no conflict of interest.
Nomenclature
Latin symbols
| b2 | Width of impeller outlet (mm) |
| D1 | Diameter of impeller inlet (mm) |
| D2 | Diameter of impeller outlet (mm) |
| Din | Diameter of suction chamber inlet (mm) |
| Dout | Diameter of volute outlet (mm) |
| f | Frequency (Hz) |
| g | The local acceleration of gravity (m/s2) |
| H | Head of the pump (m) |
| Hn | Rated head (m) |
| L | The distance of deviation from the center (mm) |
| L’ | The pulsating value after removing the trend (mm) |
| M | Torque of the pump shaft (N·m) |
| nd | Rated rotational speed (r/min) |
| ns | Specific speed |
| P | Pressure fluctuation amplitude (Pa) |
| P1 | Pressure fluctuation of pump inlet (Pa) |
| P2 | Pressure fluctuation of pump top (Pa) |
| P3 | Pressure fluctuation of pump outlet (Pa) |
| P4 | Pressure fluctuation after pump outlet butterfly valve (Pa) |
| Pin | The static pressure of the pump inlet (Pa) |
| Pout | The static pressure of the pump outlet (Pa) |
| Ps | Shaft power of the pump (W) |
| Q | Flow rate of the pump (m3/s) |
| Qn | Rated flow rate (m3/s) |
| Sdx | Horizontal shaft run-out of driving end (mm) |
| Sdy | Vertical shaft run-out of driving end (mm) |
| Snx | Horizontal shaft run-out of non-driving end (mm) |
| Sny | Vertical shaft run-out of non-driving end (mm) |
| t | Time (s) |
| Vdx | Radial vibration of driving end (mm/s) |
| Vdy | Vertical vibration of driving end (mm/s) |
| Vdz | Axial vibration of driving end (mm/s) |
| Vin | The velocity of pressure measuring section of pump inlet (m/s) |
| Vny | Vertical vibration of non-driving end (mm/s) |
| Vnz | Axial vibration of non-driving end (mm/s) |
| Vnx | Radial vibration of non-driving end (mm/s) |
| Vout | The velocity of pressure measuring section of pump outlet (m/s) |
| VRMS | Effective value of vibration velocity (mm/s) |
| Zin | The heights of pressure measuring point of pump inlet (m) |
| Zout | The heights of pressure measuring point of pump outlet (m) |
Greek symbols
| η | Efficiency of the pump (%) |
| θ | The angle of deviation from the center (°) |
| ρ | The density of water (kg/m3) |
| ω | Rotation angular velocity of the pump shaft (rad/s) |
| φ | The latitude of the pumping station (°) |
Appendix A. Experimental Uncertainty Analysis
(1) Direct Measurement Error
Random Uncertainty
According to IEC [35], the random uncertainty in the measurement of a variable is taken as twice the standard deviation of this variable. this is expressed as σ1:
In order to carry out sample standard deviation for the results of the repetitive test, the following formula was used to solve the sample standard deviation:
System uncertainty
Even when all known errors are eliminated by calibration, careful measurement of dimensions and correct installation, inaccuracies may still remain. This part of the error component is called “system uncertainty”, expressed as in this paper.
Total uncertainty of measurement
The overall uncertainty measurement was calculated by the square root of the sum of the squares of the systematic and random uncertainties. Total measurement uncertainties for all measurement data are shown in Table A1.
Table A1.
Total measurement uncertainty of each measurement data.
Table A1.
Total measurement uncertainty of each measurement data.
| Measurement Data Type. | Symbols | Facilities | Range | |||
|---|---|---|---|---|---|---|
| Flow rate | Q | ZRN-100F | 0–64m/s | 1.88% | 0.10% | 1.88% |
| Shaft run-out | S | TRIN | 0–4mm | 0.22% | 0.30% | 0.37% |
| Vibration | V | 891-2 | 0–0.5m/s | 1.23% | 0.01% | 1.23% |
| Pressure fluctuation | P | CGYL-201 | P1: −100–200kPa | 0.69% | 0.20% | 0.72% |
| P2: 0–1MPa | 0.13% | 0.25% | 0.28% | |||
| P3: 0–1MPa | 0.31% | 0.25% | 0.40% | |||
| P4: 0–1MPa | 0.47% | 0.25% | 0.53% | |||
| Value opening | Open | CWP-S-1000-A-P | 0–1000mm | 0.01% | 0.15% | 0.15% |
| Power transmitter | Ps | S3-WRD-3 | Voltage variation ratio:10000/100V;Current variation ratio: 50/5 A | 0.70% | 0.20% | 0.73% |
(2) Indirect Measurement Error
Head accuracy
The pump head was calculated from Equation (2). The inlet and export installation elevation and import/export speed errors were ignored, and the pump head uncertainty was calculated by the following formula:
where, indicates the static pressure error of the inlet, and indicates the static pressure error of the outlet.
Efficiency accuracy
Pump efficiency uncertainty was calculated by the following formula:
where, represents the flow rate error, represents the head error, and represents the input power error of the motor.
References
- Creaco, E.; Campisano, A.; Fontana, N.; Marini, G.; Page, P.; Walski, T. Real time control of water distribution networks: A state-of-the-art review. Water Res. 2019, 161, 517–530. [Google Scholar] [CrossRef] [PubMed]
- Wan, W.; Huang, W. Investigation on complete characteristics and hydraulic transient of centrifugal pump. J. Mech. Sci. Technol. 2011, 25, 2583–2590. [Google Scholar] [CrossRef]
- Zhang, Y. Transient Internal Flow and Performance of Centrifugal Pumps During Startup Period. Ph.D. Thesis, Zhejiang University, Hangzhou, China, 2013. [Google Scholar]
- Wang, Y.; Luo, K.; Wang, K.; Liu, H.; Li, Y.; He, X. Research on pressure fluctuation characteristics of a centrifugal pump with guide vane. J. Vibroeng. 2017, 19, 5482–5496. [Google Scholar] [CrossRef]
- Wang, Z.; Qian, Z.; Lu, J.; Wu, P. Effects of flow rate and rotational speed on pressure fluctuations in a double-suction centrifugal pump. Energy 2019, 170, 212–227. [Google Scholar] [CrossRef]
- Hodkiewicz, M.R.; Norton, M.P. The effect of change in flow rate on the vibration of double-suction centrifugal pumps. J. Process Mech. Eng. 2002, 216, 47–58. [Google Scholar] [CrossRef]
- Yao, Z.; Wang, F.; Zhang, Z.; Xiao, R.; He, C. Numerical and experimental investigation on the radial force characteristic of a large double suction centrifugal pump in a real pumping station. In Proceedings of the ASME-JSME-KSME 2015 Joint Fluids Engineering Conference, Korea, Seoul, 26–31 July 2015. [Google Scholar] [CrossRef]
- Pei, J.; Dohmenb, H.J.; Yuan, S.; Benra, F.-K. Investigation of unsteady flow-induced impeller oscillations of a single-blade pump under off-design conditions. J. Fluids Struct. 2012, 35, 89–104. [Google Scholar] [CrossRef]
- Pei, J.; Yuan, S. Numerical Prediction of Unsteady Pressure Field Within the Whole Flow Passage of a Radial Single-Blade Pump. J. Fluids Struct. 2012, 134, 101103. [Google Scholar] [CrossRef]
- Wang, W.; Lu, H.; Meng, G.Q.Q.G. Pressure fluctuation characteristics induced by cavitation in a centrifugal pump. In IOP Conference Series: Earth and Environmental Science; IOP Publishing: Bristol, UK, 2018; Volume 163, p. 012040. [Google Scholar] [CrossRef]
- Tsukamoto, H.; Ohashi, H. Transient Characteristics of a Centrifugal Pump During Starting Period. J. Fluids Eng. 1982, 104, 6–13. [Google Scholar] [CrossRef]
- Tsukamoto, H.; Matsunaga, S.; Yoneda, H. Transient Characteristics of a Centrifugal Pump During Stopping Period. J. Fluids Eng. 1986, 108, 392–399. [Google Scholar] [CrossRef]
- Yao, Z.; Wang, F.; Qu, L.; Xiao, R.; He, C.; Wang, M. Experimental Investigation of Time-Frequency Characteristics of Pressure Fluctuations in a Double-Suction Centrifugal Pump. J. Fluids Eng. 2011, 133, 101303. [Google Scholar] [CrossRef]
- Zhou, P.; Wang, F.; Mou, J. Investigation of rotating stall characteristics in a centrifugal pump impeller at low flow rates. Eng. Comput. 2017, 34, 1989–2000. [Google Scholar] [CrossRef]
- Adamkowski, A.; Henke, A.; Lewandowski, M. Resonance of torsional vibrations of centrifugal pump shafts due to cavitation erosion of pump impellers. Eng. Fail. Anal. 2016, 70, 56–72. [Google Scholar] [CrossRef]
- Skrzypacz, J.; Bieganowski, M. The influence of micro grooves on the parameters of the centrifugal pump impeller. Int. J. Mech. Sci. 2018, 144, 827–835. [Google Scholar] [CrossRef]
- Capurso, T.; Bergamini, L.; Torresi, M. Design and CFD performance analysis of a novel impeller for double suction centrifugal pumps. Nucl. Eng. Des. 2019, 341, 155–166. [Google Scholar] [CrossRef]
- Wu, D.; Wu, P.; Li, Z.; Wang, L. The Transient Flow in a Centrifugal Pump During the Discharge Valve Rapid Opening Process. Nucl. Eng. Des. 2010, 240, 4061–4068. [Google Scholar] [CrossRef]
- Wu, D.; Wu, P.; Yang, S.; Wang, L. Transient Characteristics of a Closed-Loop Pipe System During Pump Stopping Periods. J. Press. Vessel Technol. 2014, 136, 021301. [Google Scholar] [CrossRef]
- Zou, Z.; Wang, F.; Yao, Z.; Tao, R.; Xiao, R.; Li, H. Impeller radial force evolution in a large double-suction centrifugal pump during startup at the shut-off condition. Nucl. Eng. Des. 2016, 310, 410–417. [Google Scholar] [CrossRef]
- Chalghoum, I.; Elaoud, S.; Akrout, M.; Taïeb, E.H. Transient behavior of a centrifugal pump during starting period. Appl. Acoust. 2016, 109, 82–89. [Google Scholar] [CrossRef]
- Li, Z.; Wu, D.; Wang, L.; Huang, B. Numerical Simulation of the Transient Flow in a Centrifugal Pump During Starting Period. J. Fluids Eng. 2010, 132, 081102. [Google Scholar] [CrossRef]
- Li, D.; Gong, R.; Wang, H.; Xiang, G.; Wei, X.; Liu, Z. Dynamic analysis on pressure fluctuation in vaneless region of a pump turbine. Sci. China Technol. Sci. 2015, 58, 813–824. [Google Scholar] [CrossRef]
- Li, D.; Wang, H.; Li, Z.; Nielsen, T.K.; Goyal, R.; Wei, X.; Qin, D. Transient characteristics during the closure of guide vanes in a pump turbine in pump mode. Renew. Energy 2018, 118, 973–983. [Google Scholar] [CrossRef]
- Tanaka, T.; Tsukamoto, H. Transient behavior of a cavitating centrifugal pump at rapid change in operating conditions - Part 1: Transient phenomena at opening/closure of discharge valve. J. Fluids Eng. 1999, 121, 841–849. [Google Scholar] [CrossRef]
- Guan, X. Modern Pumps Theory and Design; China Astronautic Publishing House: Beijing, China, 2011; ISBN 978-7-80-218942-3. [Google Scholar]
- International Electrotechnical Commission (IEC). Field Acceptance Tests to Determine the Hydraulic Performance of Hydraulic Turbines, Storage Pumps and Pump-Turbines; International Standard IEC 60041; International Electrotechnical Commission (IEC): Geneva, Switzerland, 1991. [Google Scholar]
- Oppenheim, A.V.; Willsky, A.S.; Hamid Nawab, S. Signal and Systems, 2nd ed.; Publishing House of Electronics Industry: Beijing, China, 2013. [Google Scholar]
- Yao, Z. Experimental Investigation on Pressure FluctuationCharacteristics of Double-suction Centrifugal Pumps. Ph.D. Thesis, China Agricultural Universityz, Beijing, China, 2013. [Google Scholar]
- Pavesi, G.; Cavazzini, G.; Ardizzon, G. Time-Frequency Characterization of Rotating Instabilities in a Centrifugal Pump with a Vaned Diffuser. Int. J. Rotating Mach. 2008, 2008, 202179. [Google Scholar] [CrossRef]
- Farge, M. Wavelet transforms and their applications to turbulence. Annu. Rev. Fluid Mech. 1992, 24, 395–457. [Google Scholar] [CrossRef]
- Li, H. Identification of coherent structure in turbulent shear flow with wavelet correlation analysis. J. Fluids Eng. 1998, 120, 778–785. [Google Scholar] [CrossRef]
- Tarvainen, M.P.; Ranta-aho, P.O.; Karjalainen, P.A. An Advanced Detrending Method with Application to HRV Analysis. IEEE Trans. Biomed. Eng. 2002, 49, 172–175. [Google Scholar] [CrossRef]
- International Electrotechnical Commission (IEC). Equipment Reliability Testing—Part 4: Statistical Procedures for Exponential Distribution-Point Estimates, Confidence Intervals, Prediction Intervals and Tolerance Intervals; International Standard IEC 60605-4; International Electrotechnical Commission (IEC): Geneva, Switzerland, 2001. [Google Scholar]
- International Electro technical Commission (IEC). Hydraulic Turbines, Storage Pumps and Pump-Turbines—Model Acceptance Tests; International Standard IEC; International Electro technical Commission (IEC): Geneva, Switzerland, 1999; Volume 60193. [Google Scholar]
© 2019 by the authors. Licensee MDPI, Basel, Switzerland. This article is an open access article distributed under the terms and conditions of the Creative Commons Attribution (CC BY) license (http://creativecommons.org/licenses/by/4.0/).