1. Introduction
Tests on equipment under nominal conditions with general requirements defined in standards [
1,
2] are useful to verify their behavior in operation, allowing the detection of possible problems before their effective use. In power transformers, it becomes relevant because it allows verifying their performance in operational conditions in aspects such as heating, voltage regulation, robustness of the assembly, and others. Ensuring the reliability of the equipment strengthens the quality of the energy processing in the system to which the transformer is inserted.
Being able to perform the test with recirculation of energy also meets energy efficiency requirements, because the power consumed will be of small order, basically to feed losses in the process. Some works in the technical literature relate in different ways the subject that is of interest of this paper and will be briefly described in this section.
The authors in References [
3,
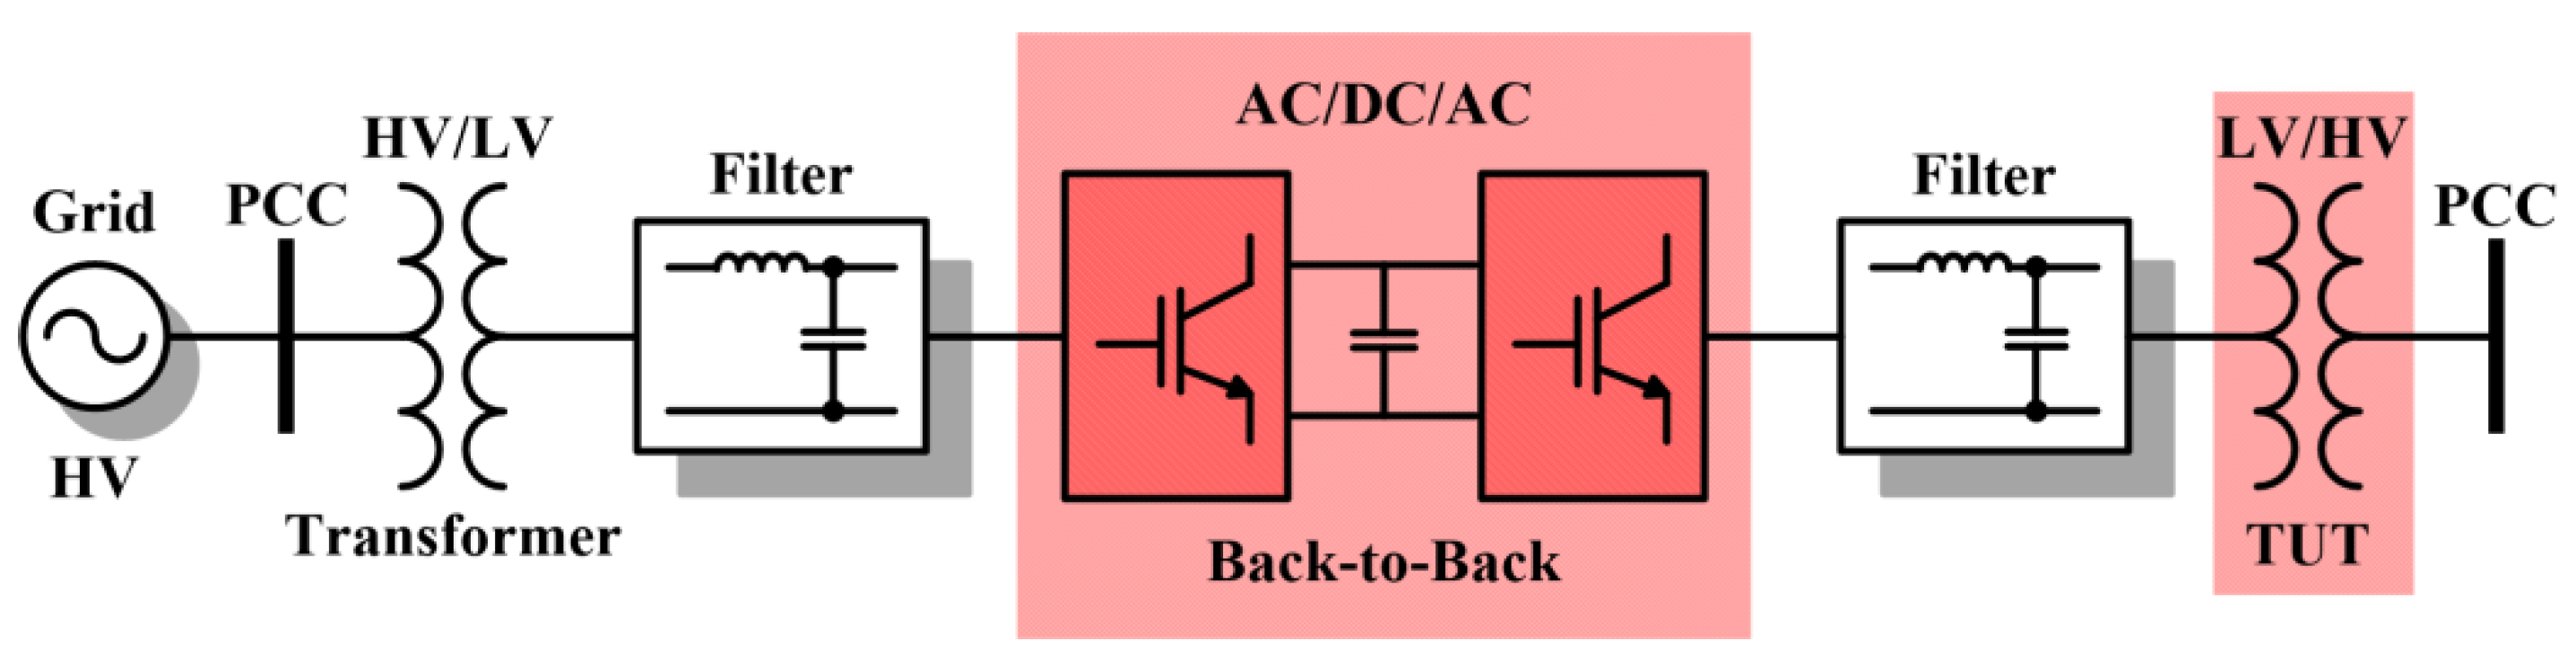
4] present a laboratory structure capable of performing tests on power transformers in conditions that are faithful to reality, which becomes a challenge when a high level of energy is required in the tests. It employs two Back-to-Back (B2B) converters whose rated power is the same power as the transformer under test, “TUT”, allowing regeneration of energy. The control is performed by the classical models that adopt proportional–integral controller (PI), and the methodology is proved by computational simulation.
Structures that carry out the load simulation to test equipment of different nature are presented in References [
5,
6,
7,
8,
9,
10,
11,
12,
13,
14,
15,
16], also using B2B converters. Reference [
17] describes an active approach to series line compensation in which a synchronous voltage source is used to provide controllable series compensation. This compensator is also found in Reference [
18], representing a Static Synchronous Series Compensator (SSSC). The SSSC structure is similar to a series active filter, used for power systems, seen in a low-voltage distribution system with nonlinear loads in Reference [
19].
For reliable regenerative load operation, current and/or power detection and control techniques have been extensively studied in References [
20,
21,
22,
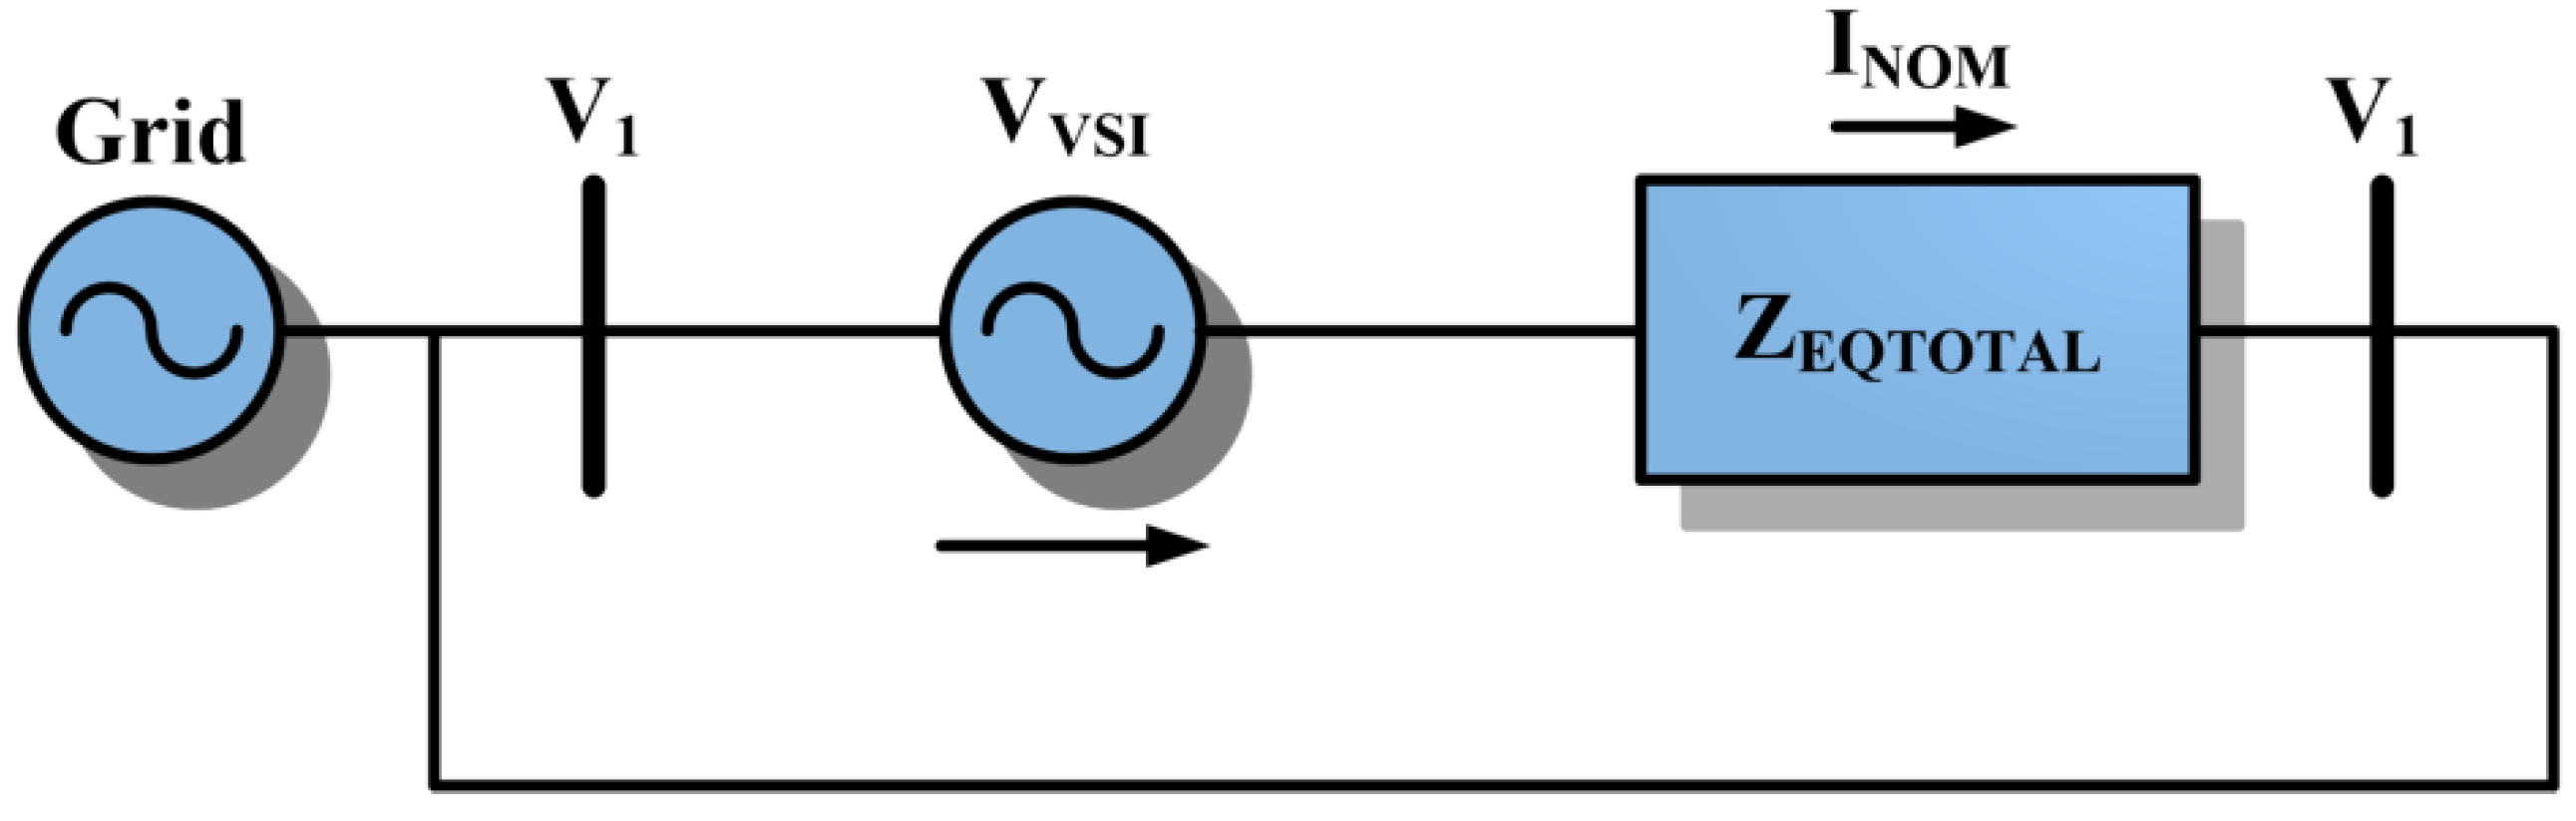
23]. The disadvantage of the structure of
Figure 1 is the rated power of the B2B, which needs to be at least the same as the TUT, in other words, high power level. Generally, the use of large amounts of energy for transformers analysis or other loads is not justified by the amount of energy wasted on testing. This work proposes a new configuration in which the power of the converter is a fraction of the TUT rated power.
The structure of this paper is as follows.
Section 2 presents the proposed configuration of the system.
Section 3 presents the topology developed to fractional power converter tests.
Section 4 presents the control strategy to voltage modulation at inverter.
Section 5 presents the simulation results and, finally,
Section 6 presents the conclusions.
2. Proposed Configuration
The topology was inspired by the operation of a phase-shift transformer used in power systems, which enables the control of active (P) and reactive (Q) power flow between the point of common coupling (PCC), observed in
Figure 1, but using a series-connected inverter instead of the B2B converter.
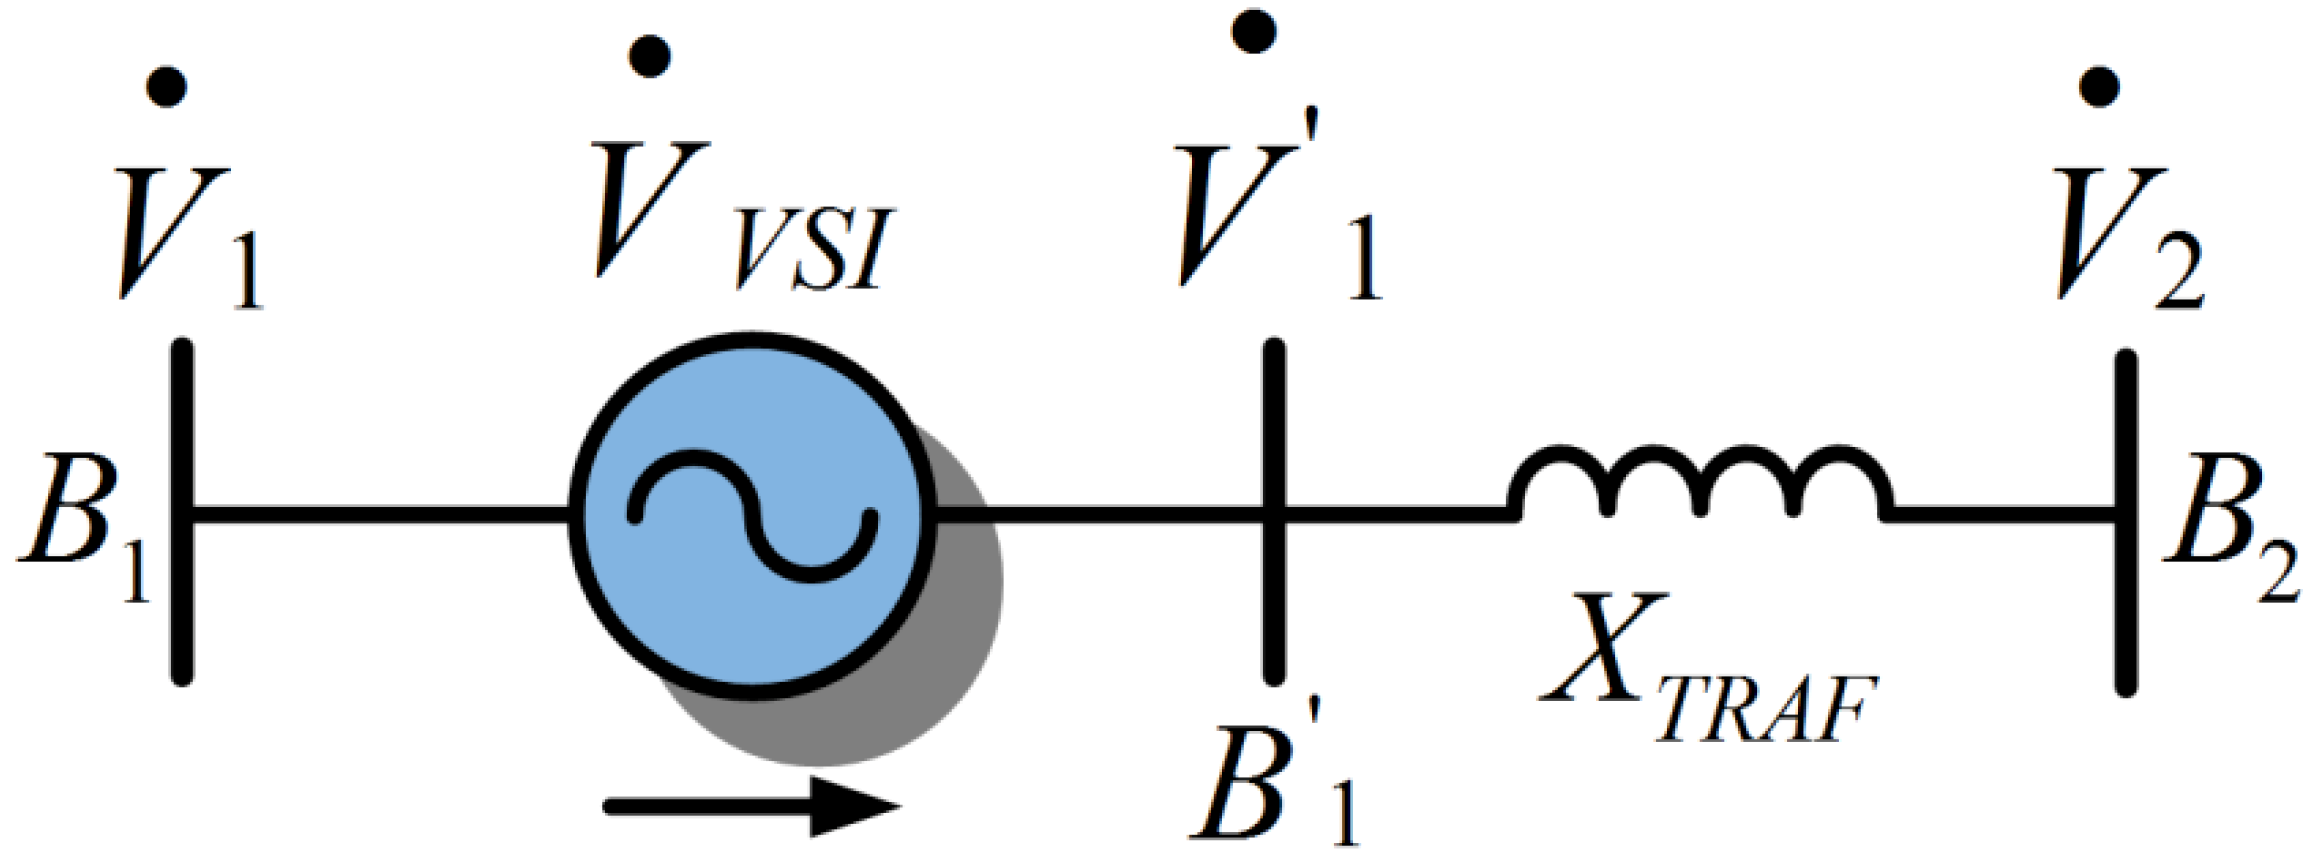
Figure 2 shows a simplified scheme of the system, considering the bus
B1 and
B2 (which may be the primary or secondary windings of the transformers), and the inverter represented as a voltage source
. (
means phasor voltage).
At steady-state operation, the circulating power between transformers can be controlled by adjusting the external voltages
(rms voltage and angle) to an appropriate value, since the relations shown in Equations (1) and (2) are known:
where
P12 and
Q12 are the active and reactive power flow that circulates between the bus 1 and 2.
represents the controlled rms voltage of a virtual bus.
V2 represents the rms voltage in the transformer winding TUT.
XTRAF represents the reactance of transformer and TUT, seen in
Figure 1. The power angle is represented by δ in the equation with the
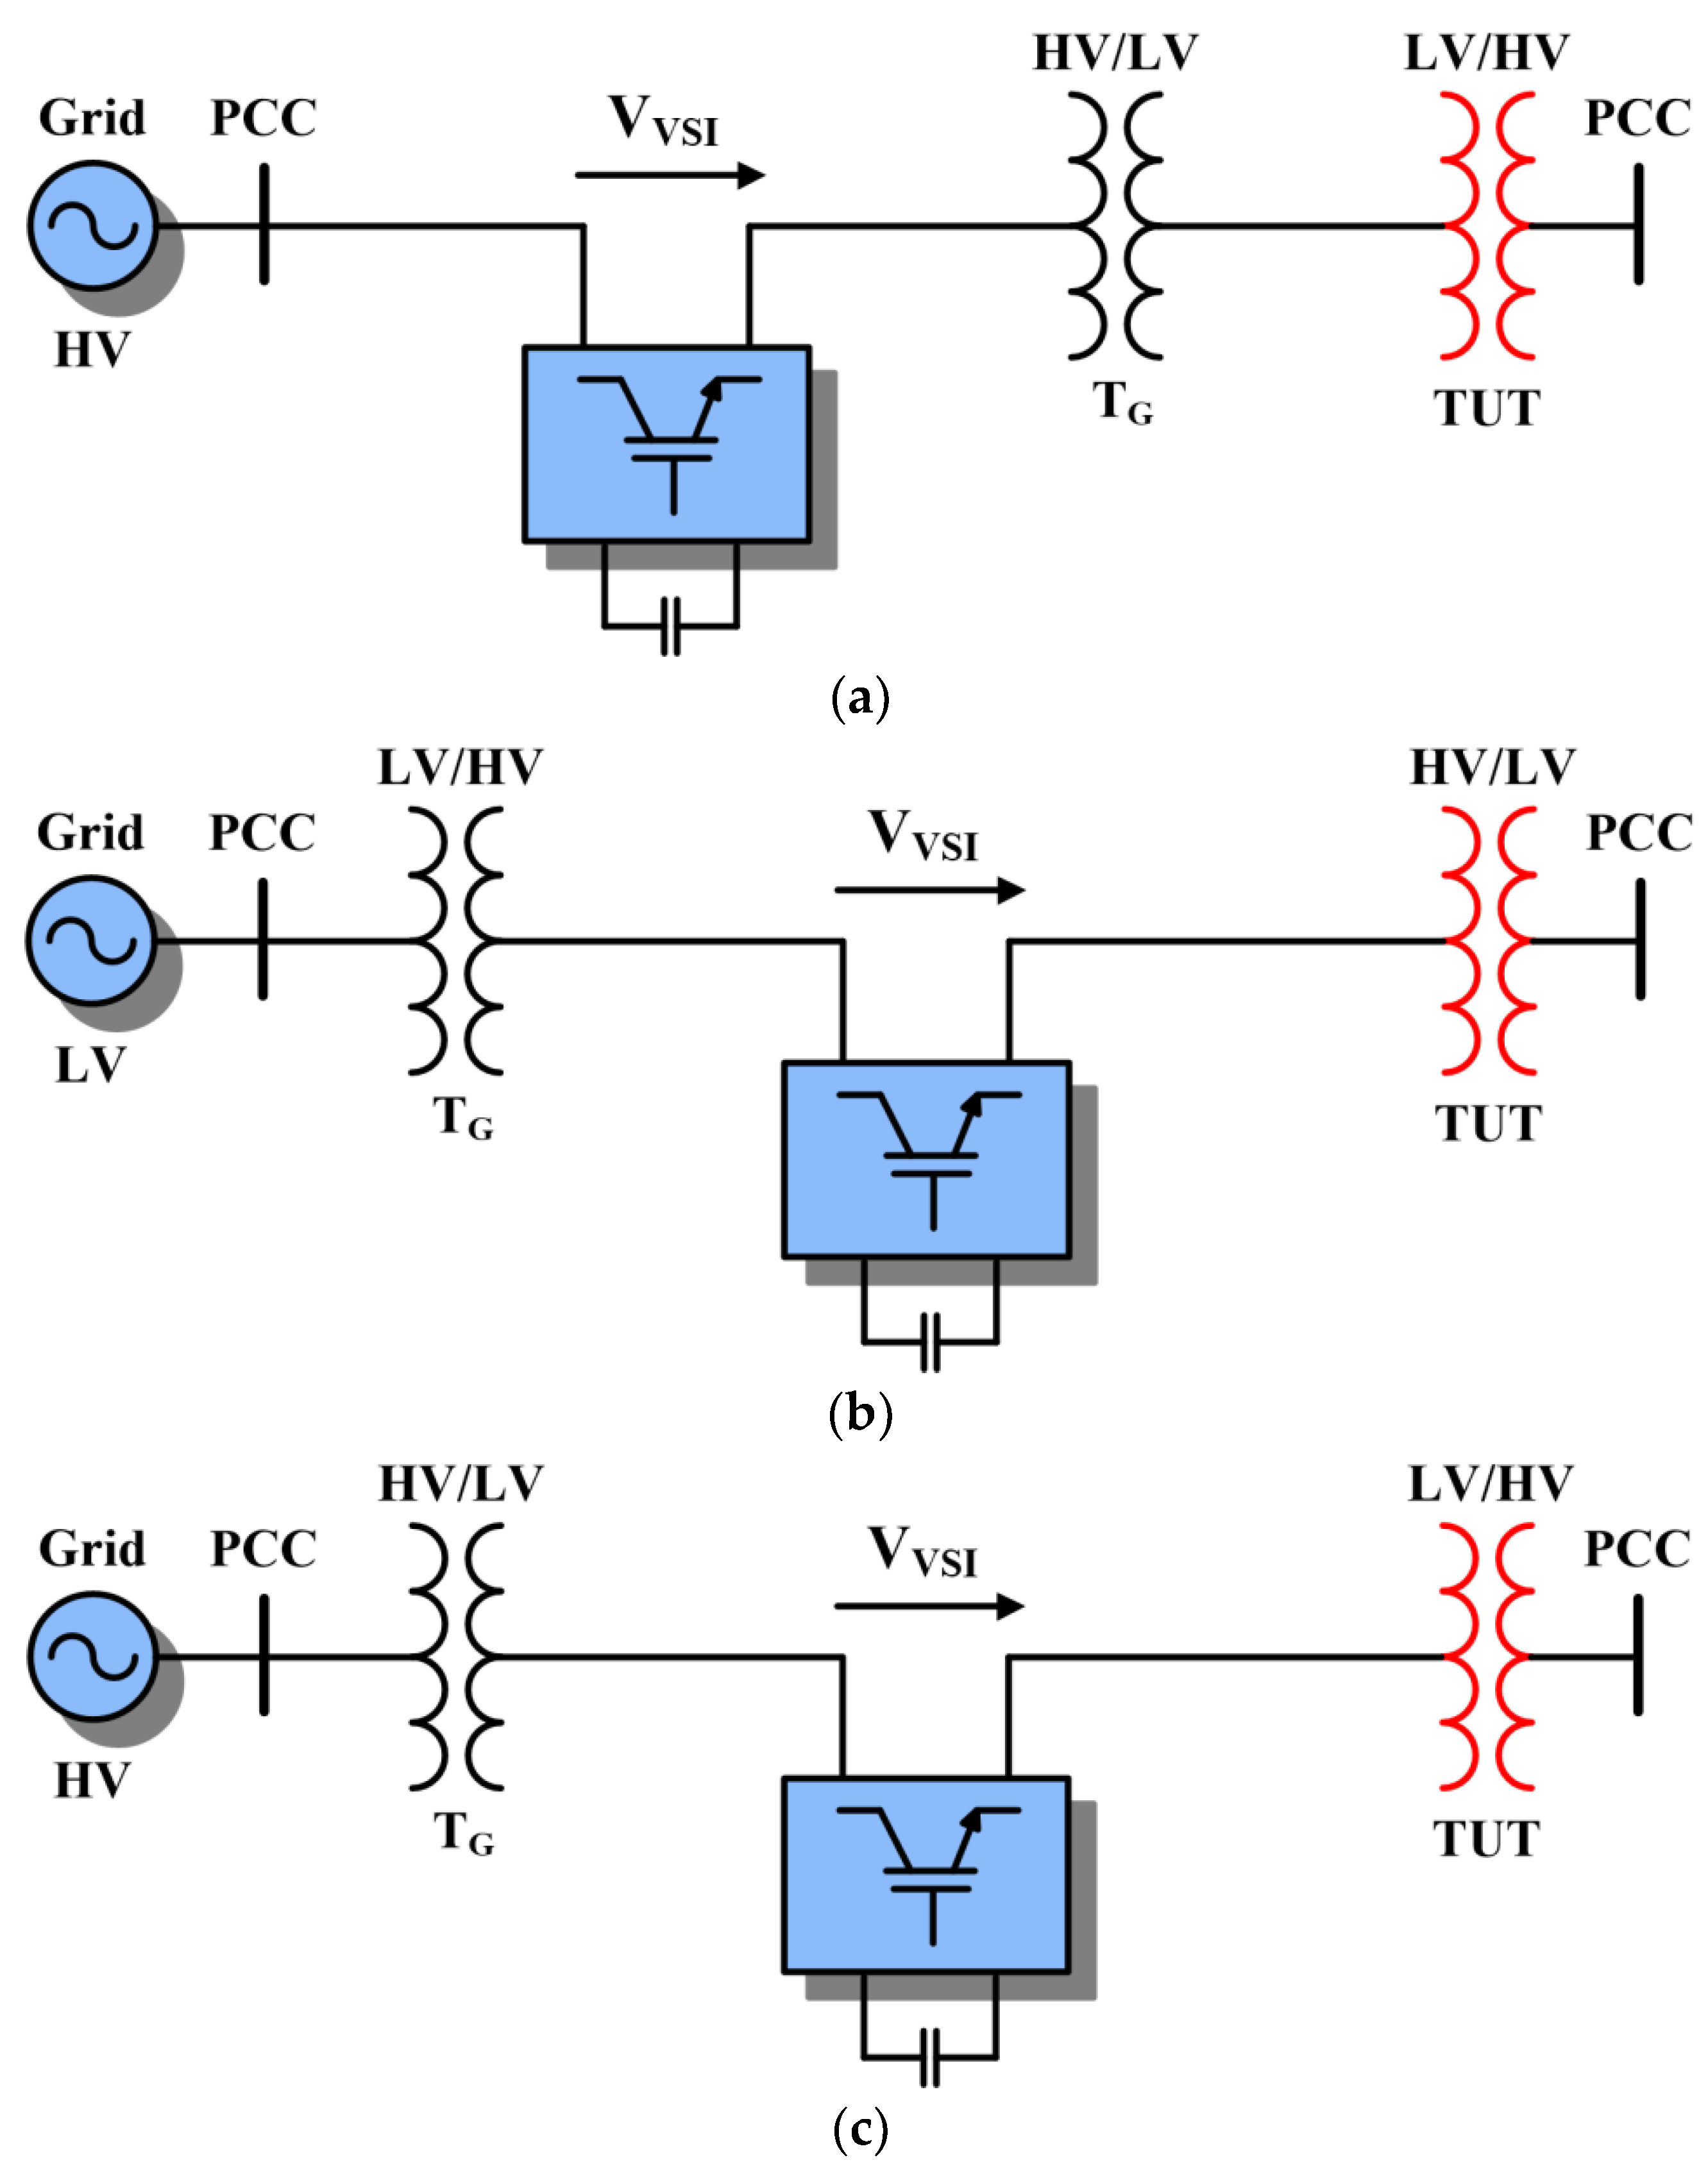
inserted in the high voltage (HV) branch; (a) applies when the HV bus is available, while (b) is used if only the low voltage (LV) bus is available. In (c), a configuration is presented in which the converter is connected in the branch of LV.
Several topologies to build the series-connected inverters are possible, depending on the available power supply.
Figure 3 shows in (a) and (b) two alternatives of connection. In (c) a configuration is presented in which the converter is connected in the branch of LV.
TG is a general transformer required to match voltage levels.
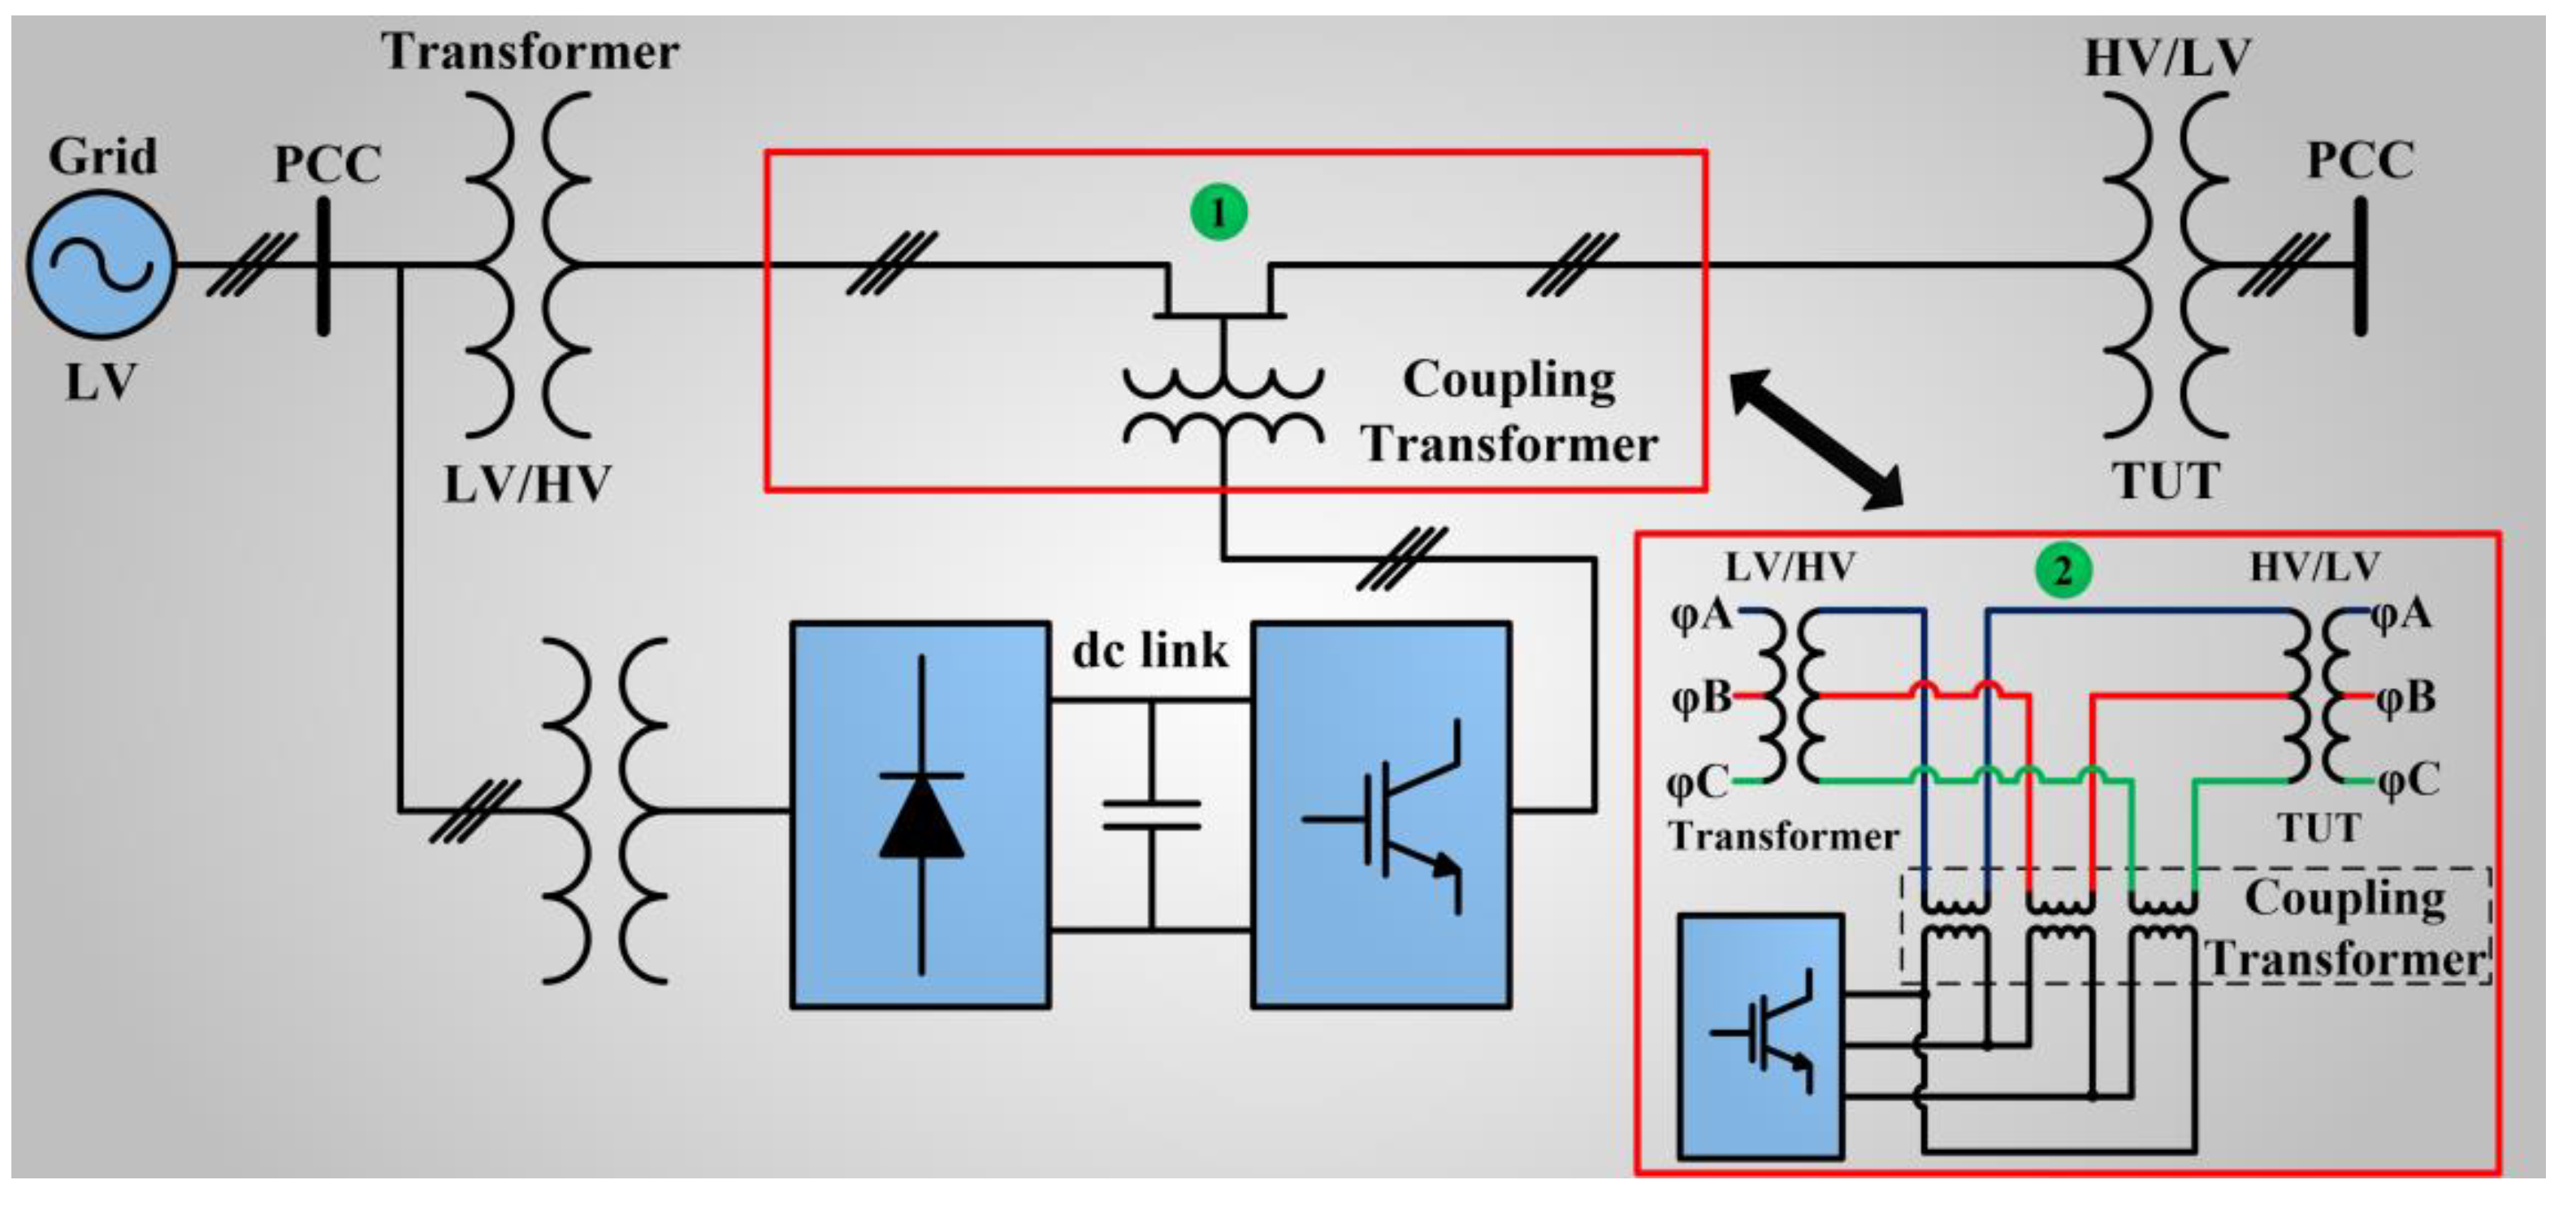
The structure used in the analysis is depicted in
Figure 4. The Voltage Source Inverter (VSI) is connected at LV through a three-phase transformer with a rms voltage of 220 V on the primary winding and 380 V on the secondary, Δ/Δ connection. The secondary voltage enables an adequate level of dc link voltage and has a direct effect on the voltage synthesized by the converter. The capacitor in the dc link is equal to 1 mF.
Area 1 of
Figure 4 indicates through coupling transformers the series connection of the converter to the system between the TUT transformer and the transformer connected to the PCC bus. Area 2 details the effective transformers’ connection of area 1.
An initial estimation of the voltage value that must be introduced in series with the system might be obtained by applying Kirchhoff’s voltage law to the circuit, which can be represented as in
Figure 5 considering the
Figure 3b configuration.
Equation (3) presents the mesh voltage where all the path impedance (basically series impedance of transformer) is represented by
ZEQTOTAL. Since the voltage at the two ends of the mesh is the same, the required voltage to circulate the nominal current I
NOM is given by Equation (4):
The analysis and topology of the system considered in this paper were simulated on the MATLAB/Simulink platform.
3. System Description
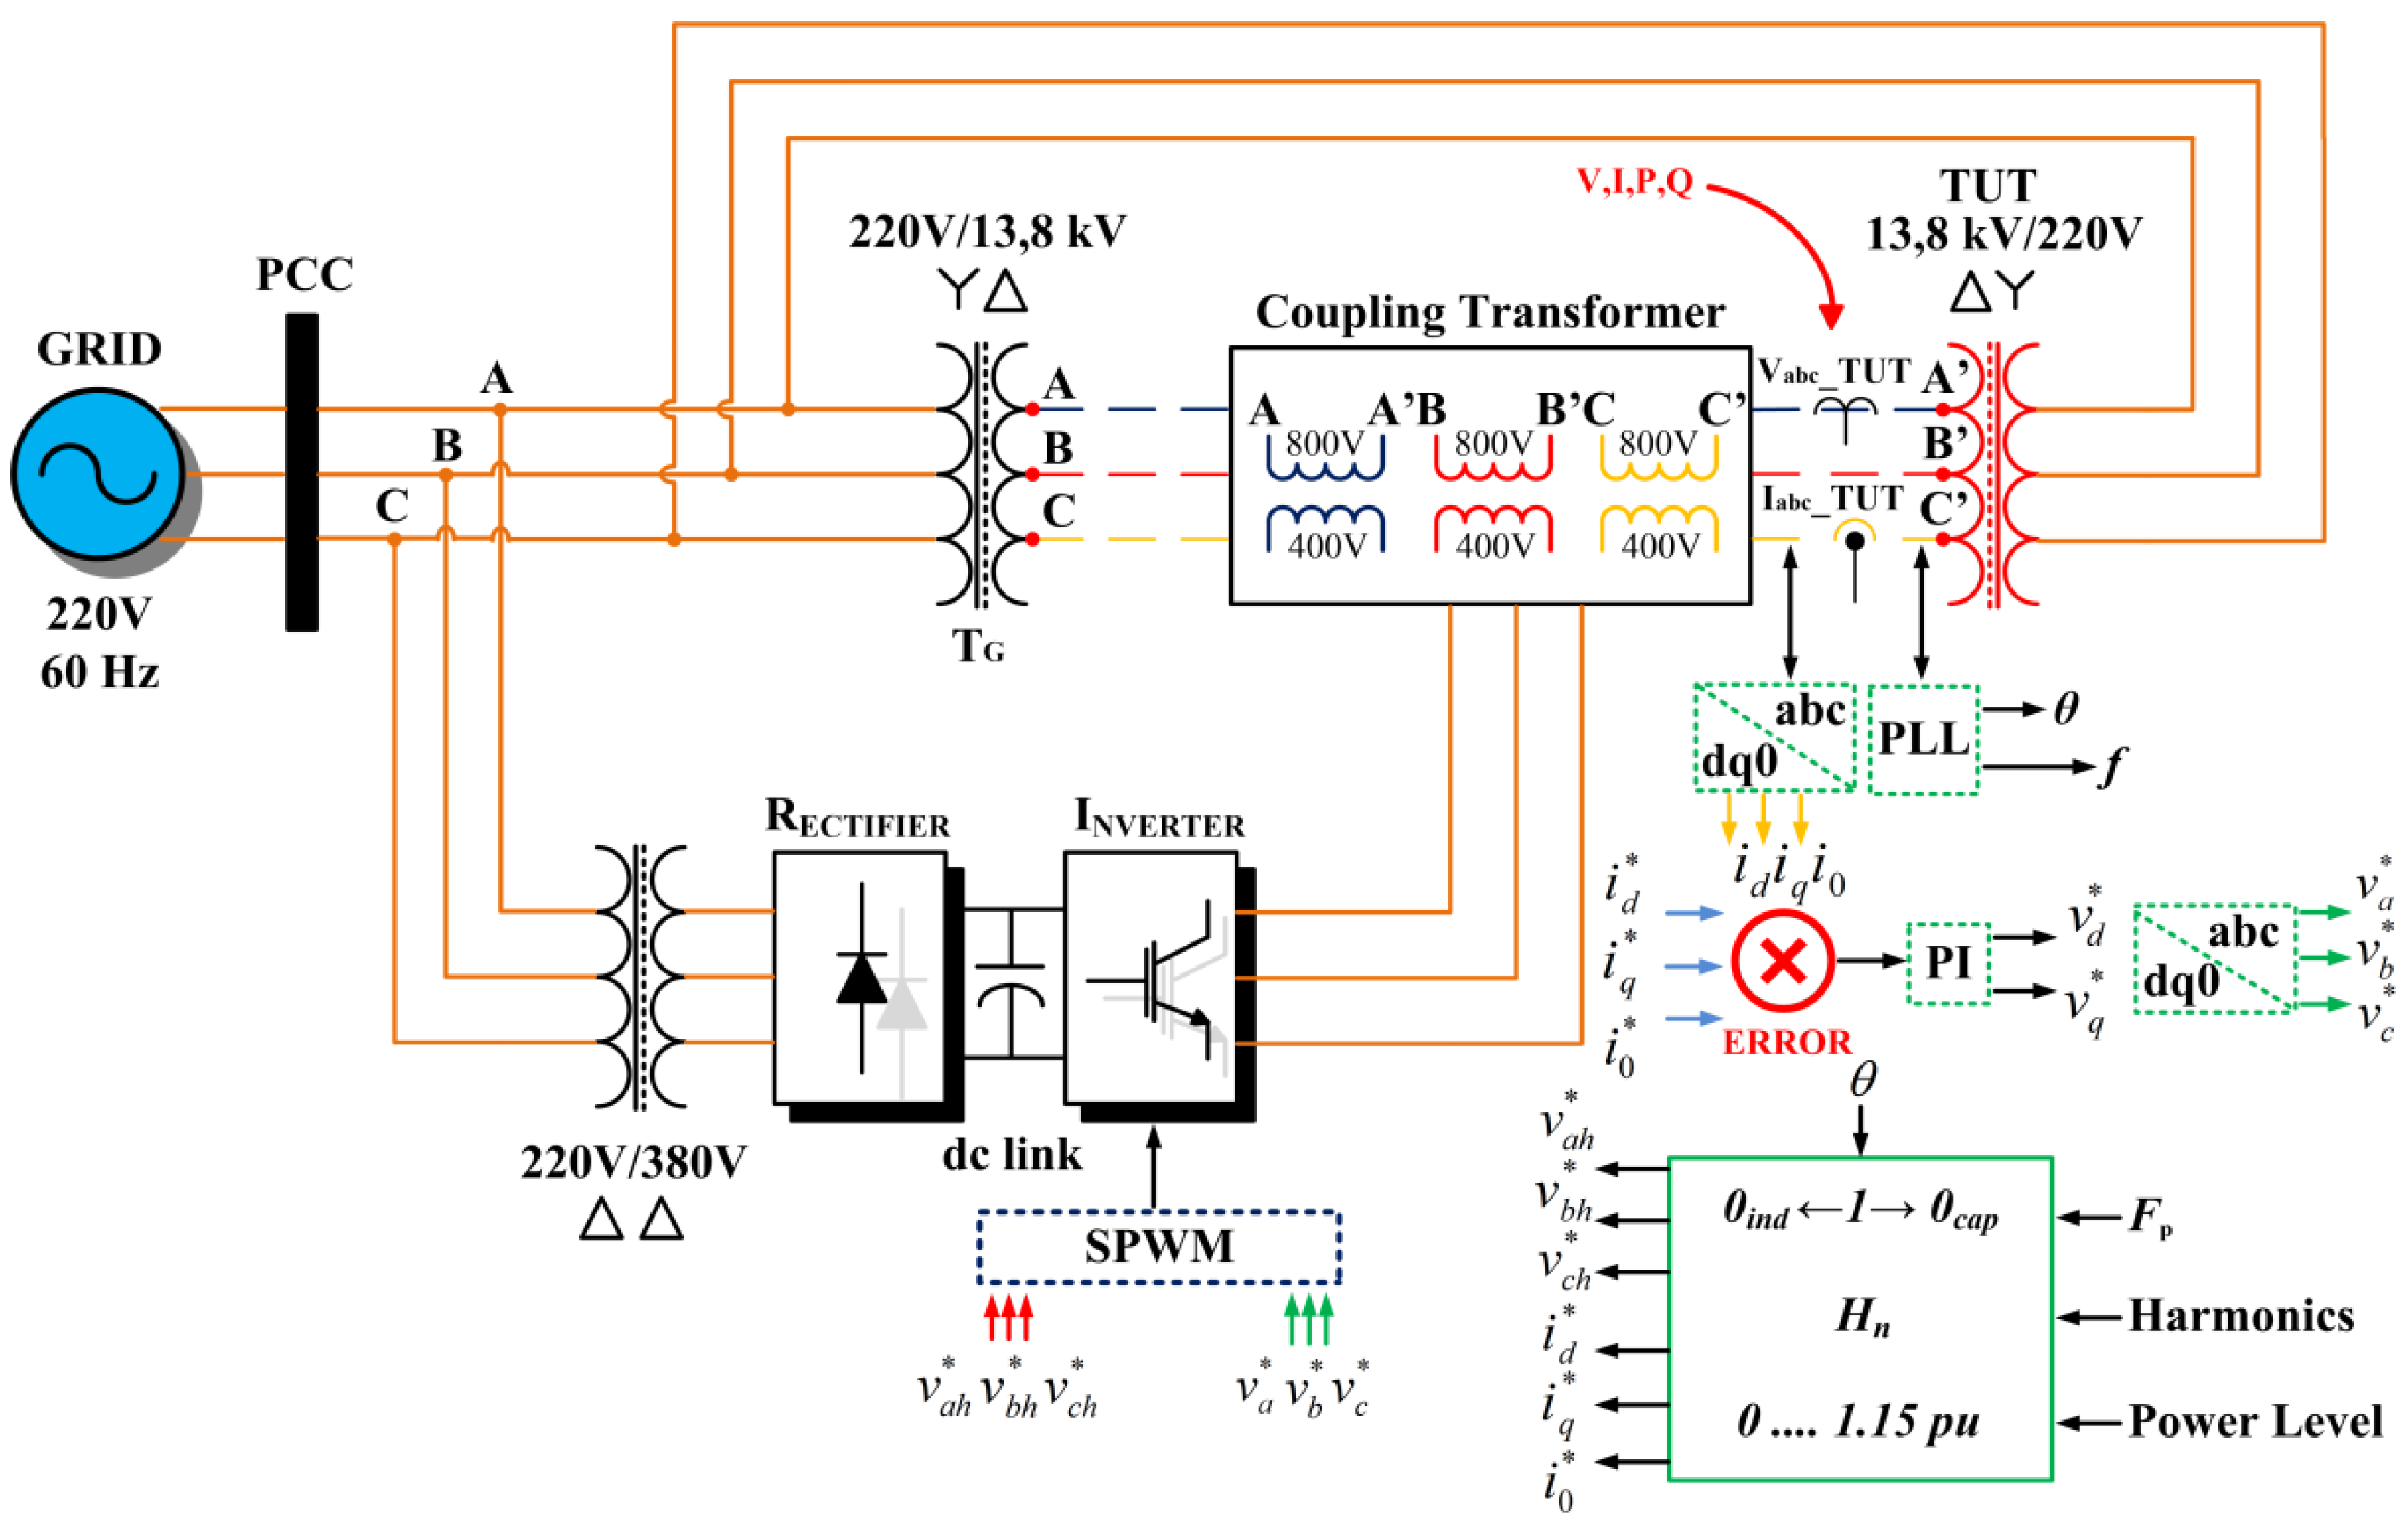
The simulated system, shown in
Figure 6, is composed by a three-phase voltage source that provides a line voltage of 220 V/60 Hz. Two transformers (
TG and TUT) with characteristics of distribution transformers are used with voltage of 220 V/13.8 kV and Y/Δ connection in the primary and secondary, respectively. The transformer under test is the TUT, in which the parameters of
V,
I,
P, and
Q are monitored to evaluate the power conditions that are applied to it.
A three-phase Δ/Δ transformer with voltage of 220 V/380 V is used in the converter connection with the low voltage in order to obtain an adequate dc link voltage in the inverter. An alternative is to replace the three-phase transformer by three single-phase autotransformers.
Three single-phase coupling transformers with voltage 400 V/800 V are used to connect the inverter on the high voltage. The transformers allow voltage level adequacy available by the inverter to the required voltage level in series with the system to impose the reference currents. They are necessary knowing the fact that the inverter output cannot be directly connected to the three-phase line.
The transformers
TG (general transformer) and TUT (transformer under test) chosen for the simulation represent identical transformers with the characteristics that are presented in
Table 1.
In general descriptions, TG and TUT have Yn connection in the low voltage winding (LV) and delta connection in the high voltage (HV) winding. Both transformers have equal R and L parameters in the primary and secondary winding. The impedance of each transformer, seen at the HV windings, is 38.645 + j80.371 ohms, applied on the Matlab/Simulink platform.
The total equivalent impedance of the circuit to be simulated is 178.36 Ω with a phase angle of 64.32°. With this information, the required voltage in the circuit corresponds to 792 V. The decision was to use an inverter with a 400 V dc link voltage. For voltage compatibility, three equal linear single-phase transformers were used for series connection of the power converter to the system. The nominal apparent power defined corresponds to 2 kVA, 400 V/800 V, nominal frequency of 60 Hz.
4. Control Strategy
The control strategy makes use of synchronous reference frame (SRF) representation in Reference [
24]. The phase currents are measured and transformed into dq currents by Equation (5):
The currents of each axis are compared with the respective direct and quadrature reference currents (
and
), composed in order to, most of the time, result in the rated current of the transformer and the error is applied to a PI regulator. As the transient behavior is not being evaluated, cross-components are neglected. The output of the regulators are the reference voltages
and
for the controlled voltage source, being
,
, and
obtained from the inverse Park transform of
and
in [
25]. These reference voltages are applied to the SPWM (sinusoidal pulse width modulation) inverter for the desired voltage modulation, using here a carrier frequency of 5 kHz. The three-phase voltages are measured at the point of connection of the controlled source (PWM inverter) with the TUT and, using a Phase Locked Loop (PLL), the synchronization angle
θ, as well as the frequency
f of the system, is found, which reference to dq0 coordinates. The angle of fundamental
va voltage was used as reference.
A series of tests can be applied in the system considering power factor (Fp), harmonics, and power level. The Fp can be adjusted with inductive or capacitive characteristic through the relation between and . Harmonics of any order (Hn) and amplitude can be applied. In the main test, it is possible to load the TUT up to 1.15 pu.
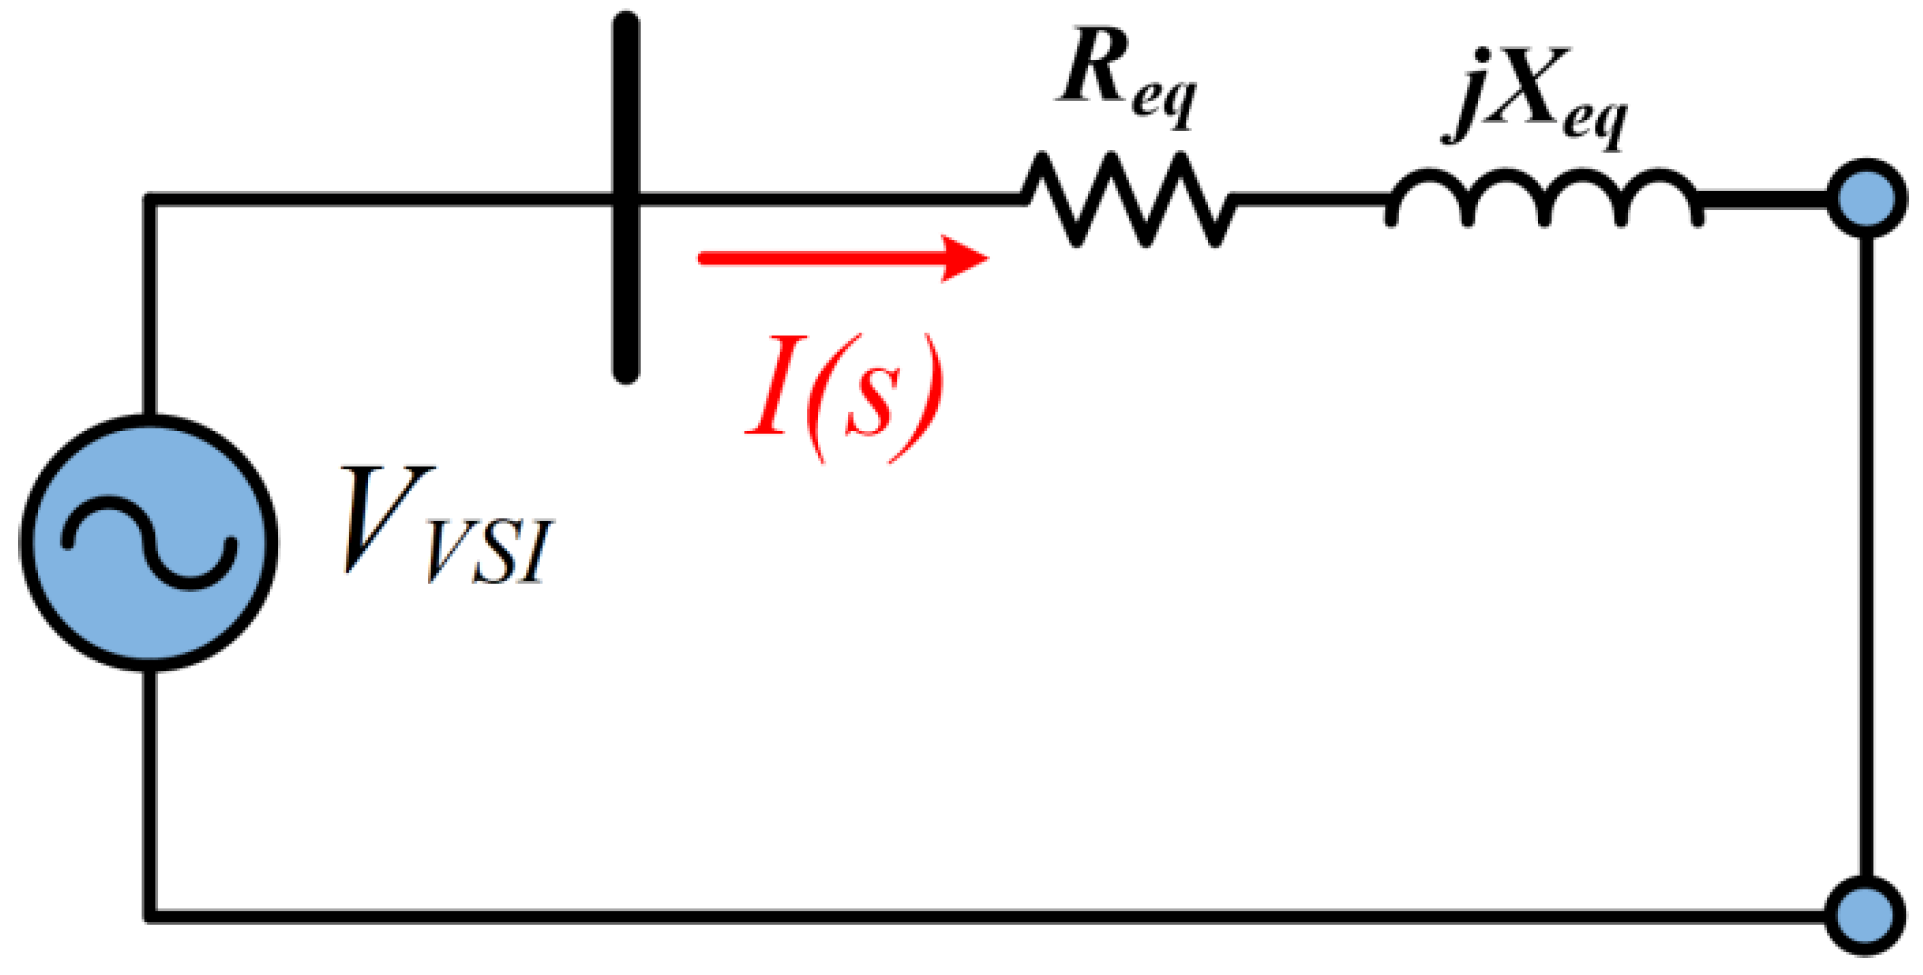
For the analysis of the control loop, the transformer is analyzed as follows. Considering
Figure 5, from the controlled series voltage source viewpoint, the grid voltage is zero. The controlled voltage source imposes currents that flow in a closed loop through transformers, with only equivalent series resistance and reactance, as shown in
Figure 7.
Applying a voltage
VVSI(
s) and short-circuiting the branch, the relation between the current that will circulate
I(
s) and the applied voltage, in Laplace, is given by Equation (6):
where
represents the time constant of the system. It is considered the presence of two transformers in series, in which the parameters of
R and
L are presented in
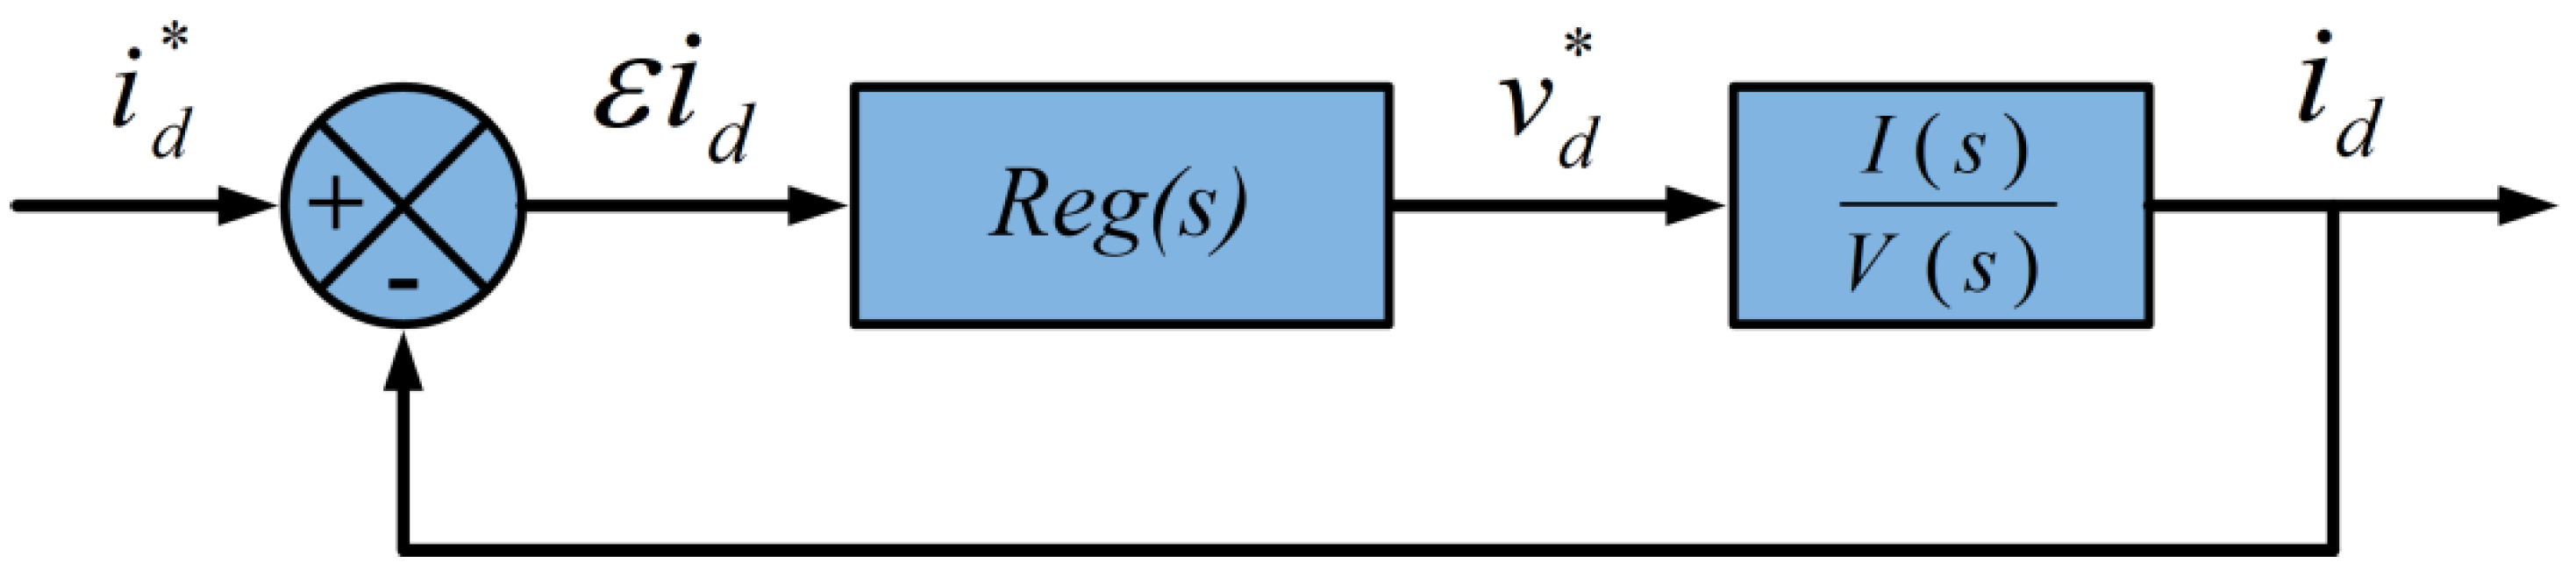
Table 1. The representation of the Laplace structure for controller design in dq coordinates is given in
Figure 8 (shown here for the d axis):
The transfer function is a first order system. To avoid current overshoot during transitions, a PI regulator is employed, of the form
, with pole-zero cancellation, resulting:
The
K gain can be found from the desired time constant for a closed-loop step response, that is:
For the transformers used in this study, = 5.3 ms. In the simulation, it was used = 188.67 ms, resulting K = 1000.
Injection of Harmonics
With the increasing development of power electronics, the use of electronic converters has reached a high level of insertion in the power systems. Its advantages, however, do not allow ignoring negative aspects, such as energy efficiency issues resulting from losses in the switching of the converter and the appearance of harmonic content caused by the converter itself in [
26] and other nonlinear loads.
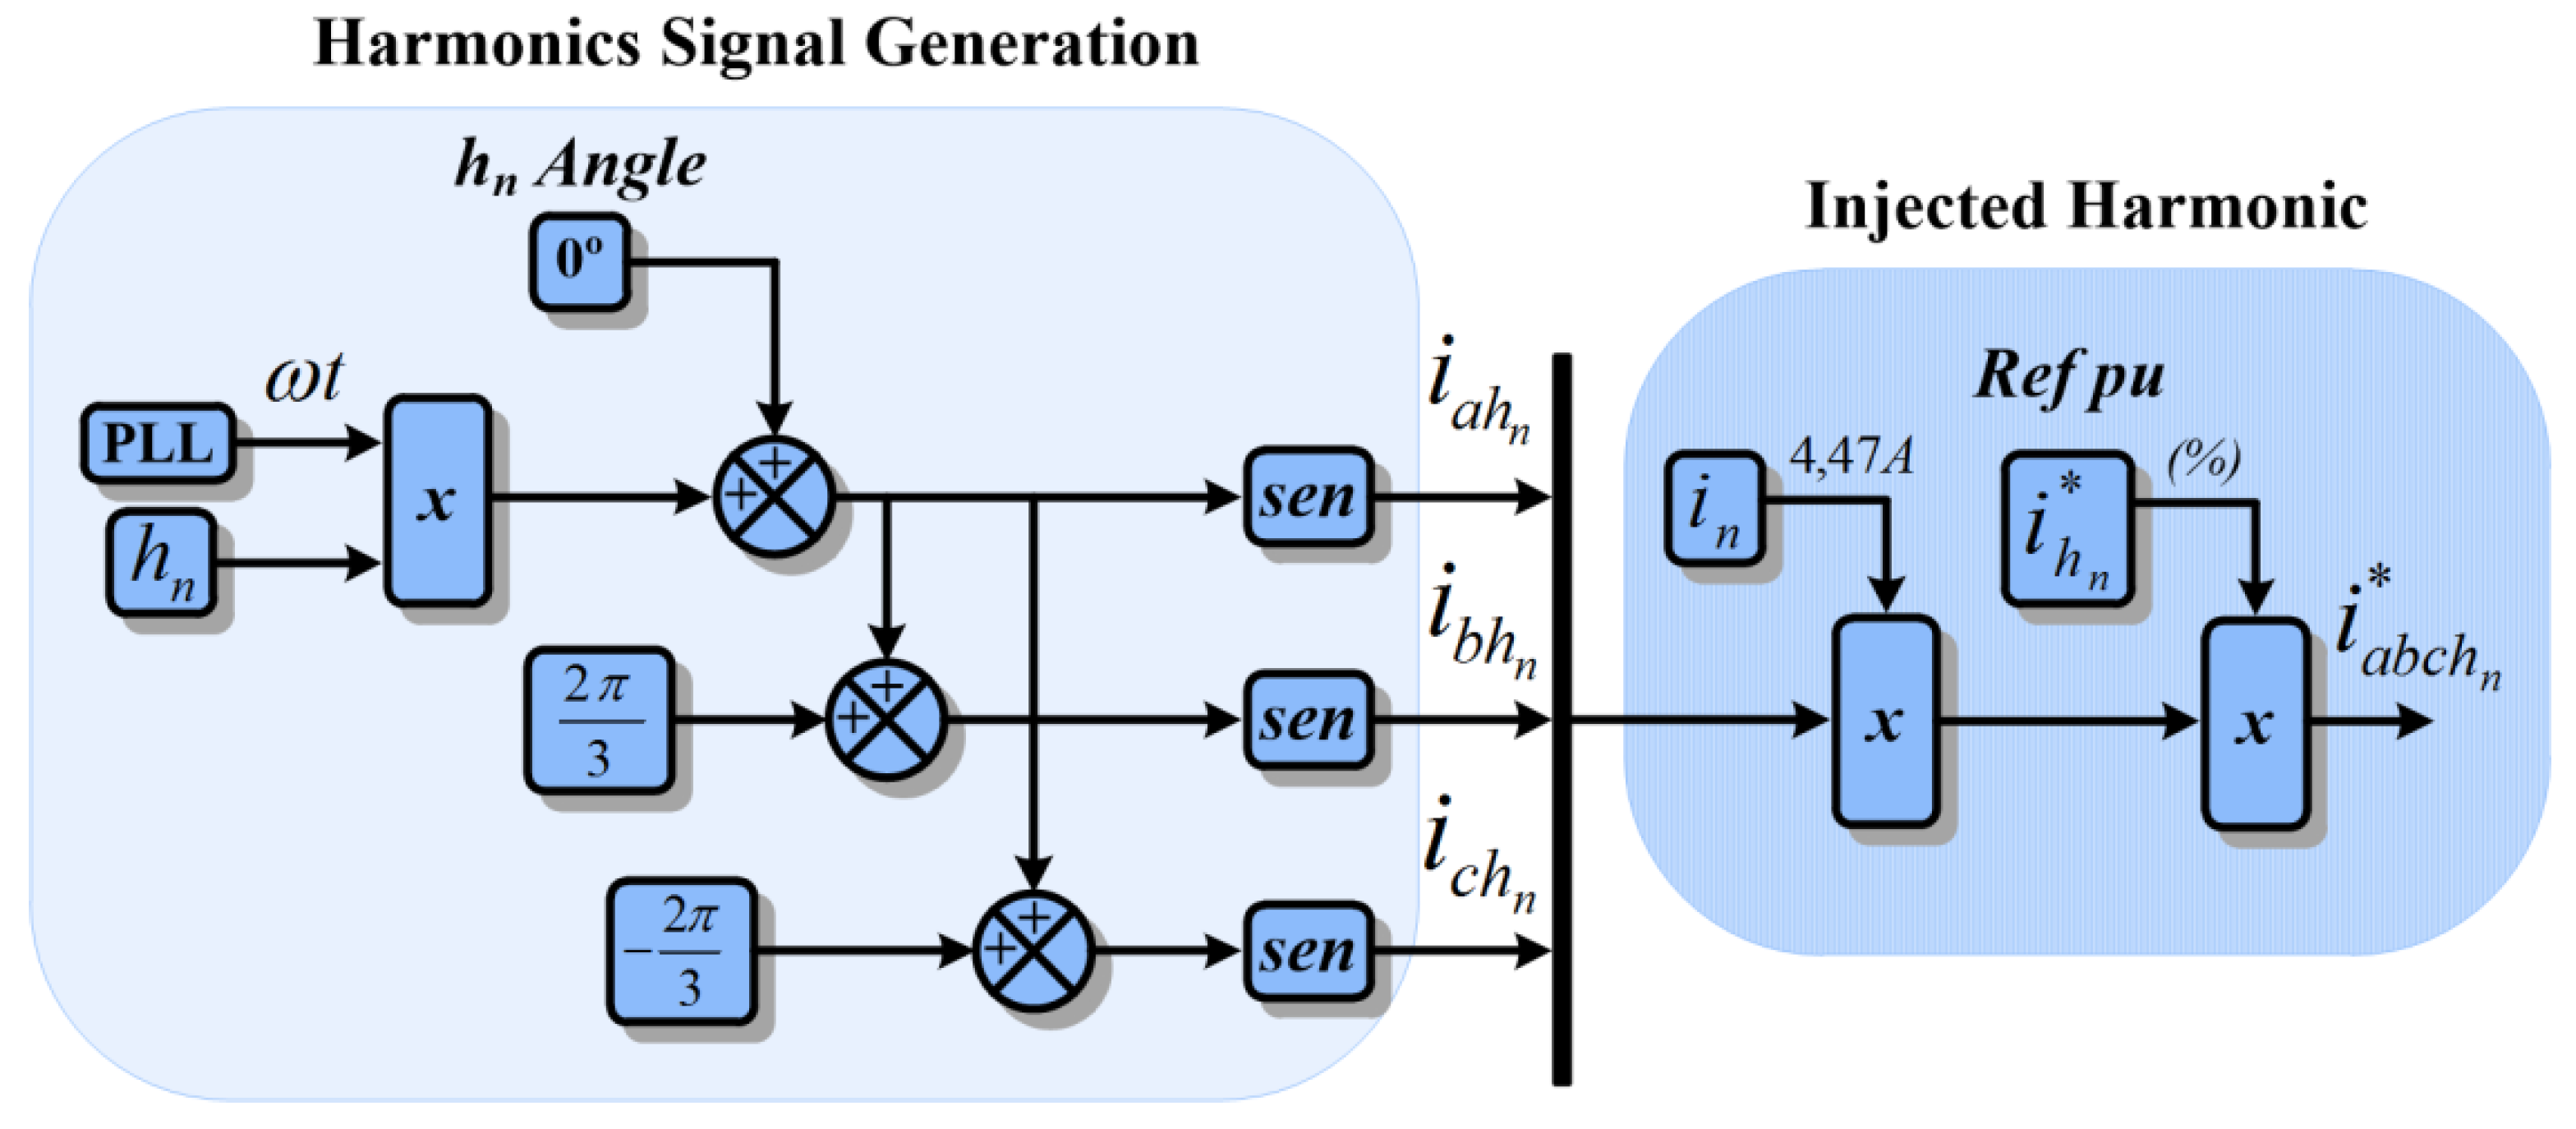
In order to perform a simulation analysis close to real conditions referring to the presence of harmonic distortion in the system, it was chosen to reproduce such characteristics by forcing harmonic current circulation on the TUT. The block diagram of
Figure 9 illustrates how harmonics are imposed.
In signal generation, the harmonic order is defined in hn with angular frequency ωt obtained from the voltage PLL. Once the harmonic three-phase current signal (, , ) is established, the reference harmonic current is injected based on the nominal current in and the desired percentage whatever in pu. The generated harmonic current is applied to the control strategy block diagram, which multiplied by the inductive reactance XL results in the voltages , , and .
These voltages
,
, and
are obtained by multiplying the specified harmonic current
and the harmonic inductive reactance
XL, as obtained applying Equations (9)–(11):
where
XL corresponds to the harmonic reactance of TUT transformer due to its inductance
LT,
f represents the nominal frequency of the system and
hn the order of the harmonic chosen.
The set of Equation (10) defines the current harmonic level applied in each phase
,
, and
, resulting in the product of the nominal value of current imposed on the TUT by the reference value in pu of the harmonic current
.
The set of Equation (11) results in the harmonic voltage originating from the current harmonic and added at each phase:
The PLL (Phase Locked Loop) used the native PLL from Simulink. In the harmonic injection tests, the PLL and (Dual Second Order Generalized Integrator) DSOGI-PLL tracker was used in [
27].
5. Simulation Results
The results presented were obtained through Matlab/Simulink software.
5.1. First Simulation
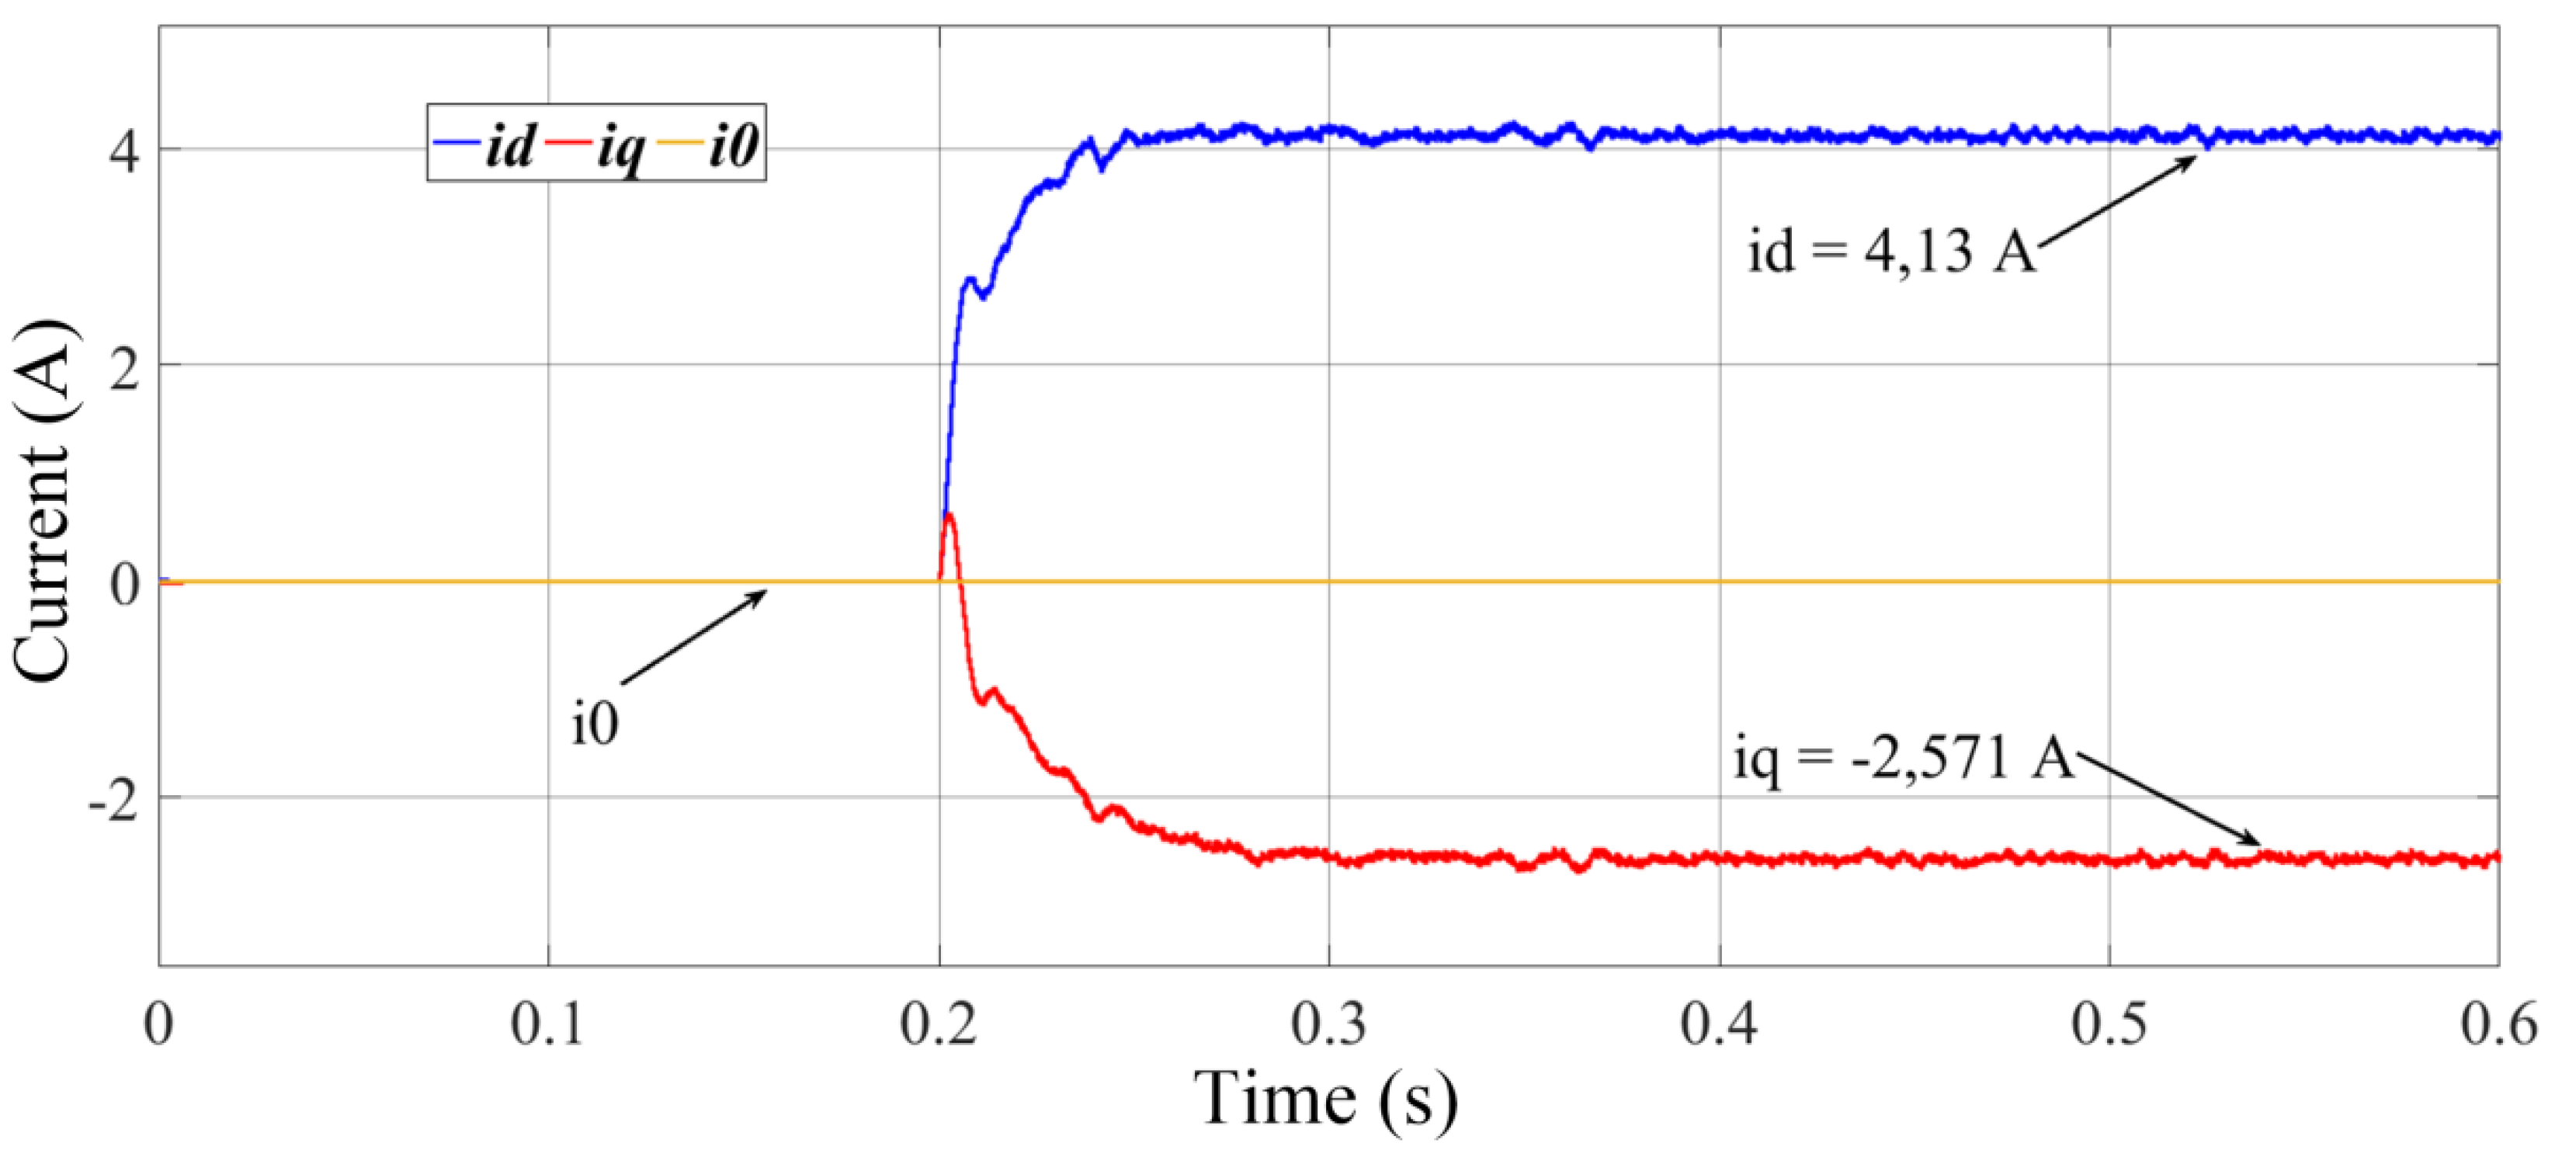
The results found are from the system without harmonics, 1.1 pu and Fp = 0.85 inductive. For this configuration, it means to apply the currents = 4.13 A and = −2.57 A.
Figure 10 shows the i
d (4.14 A) and i
q (−2.57 A) currents after 0.2 s, equal to the reference values.
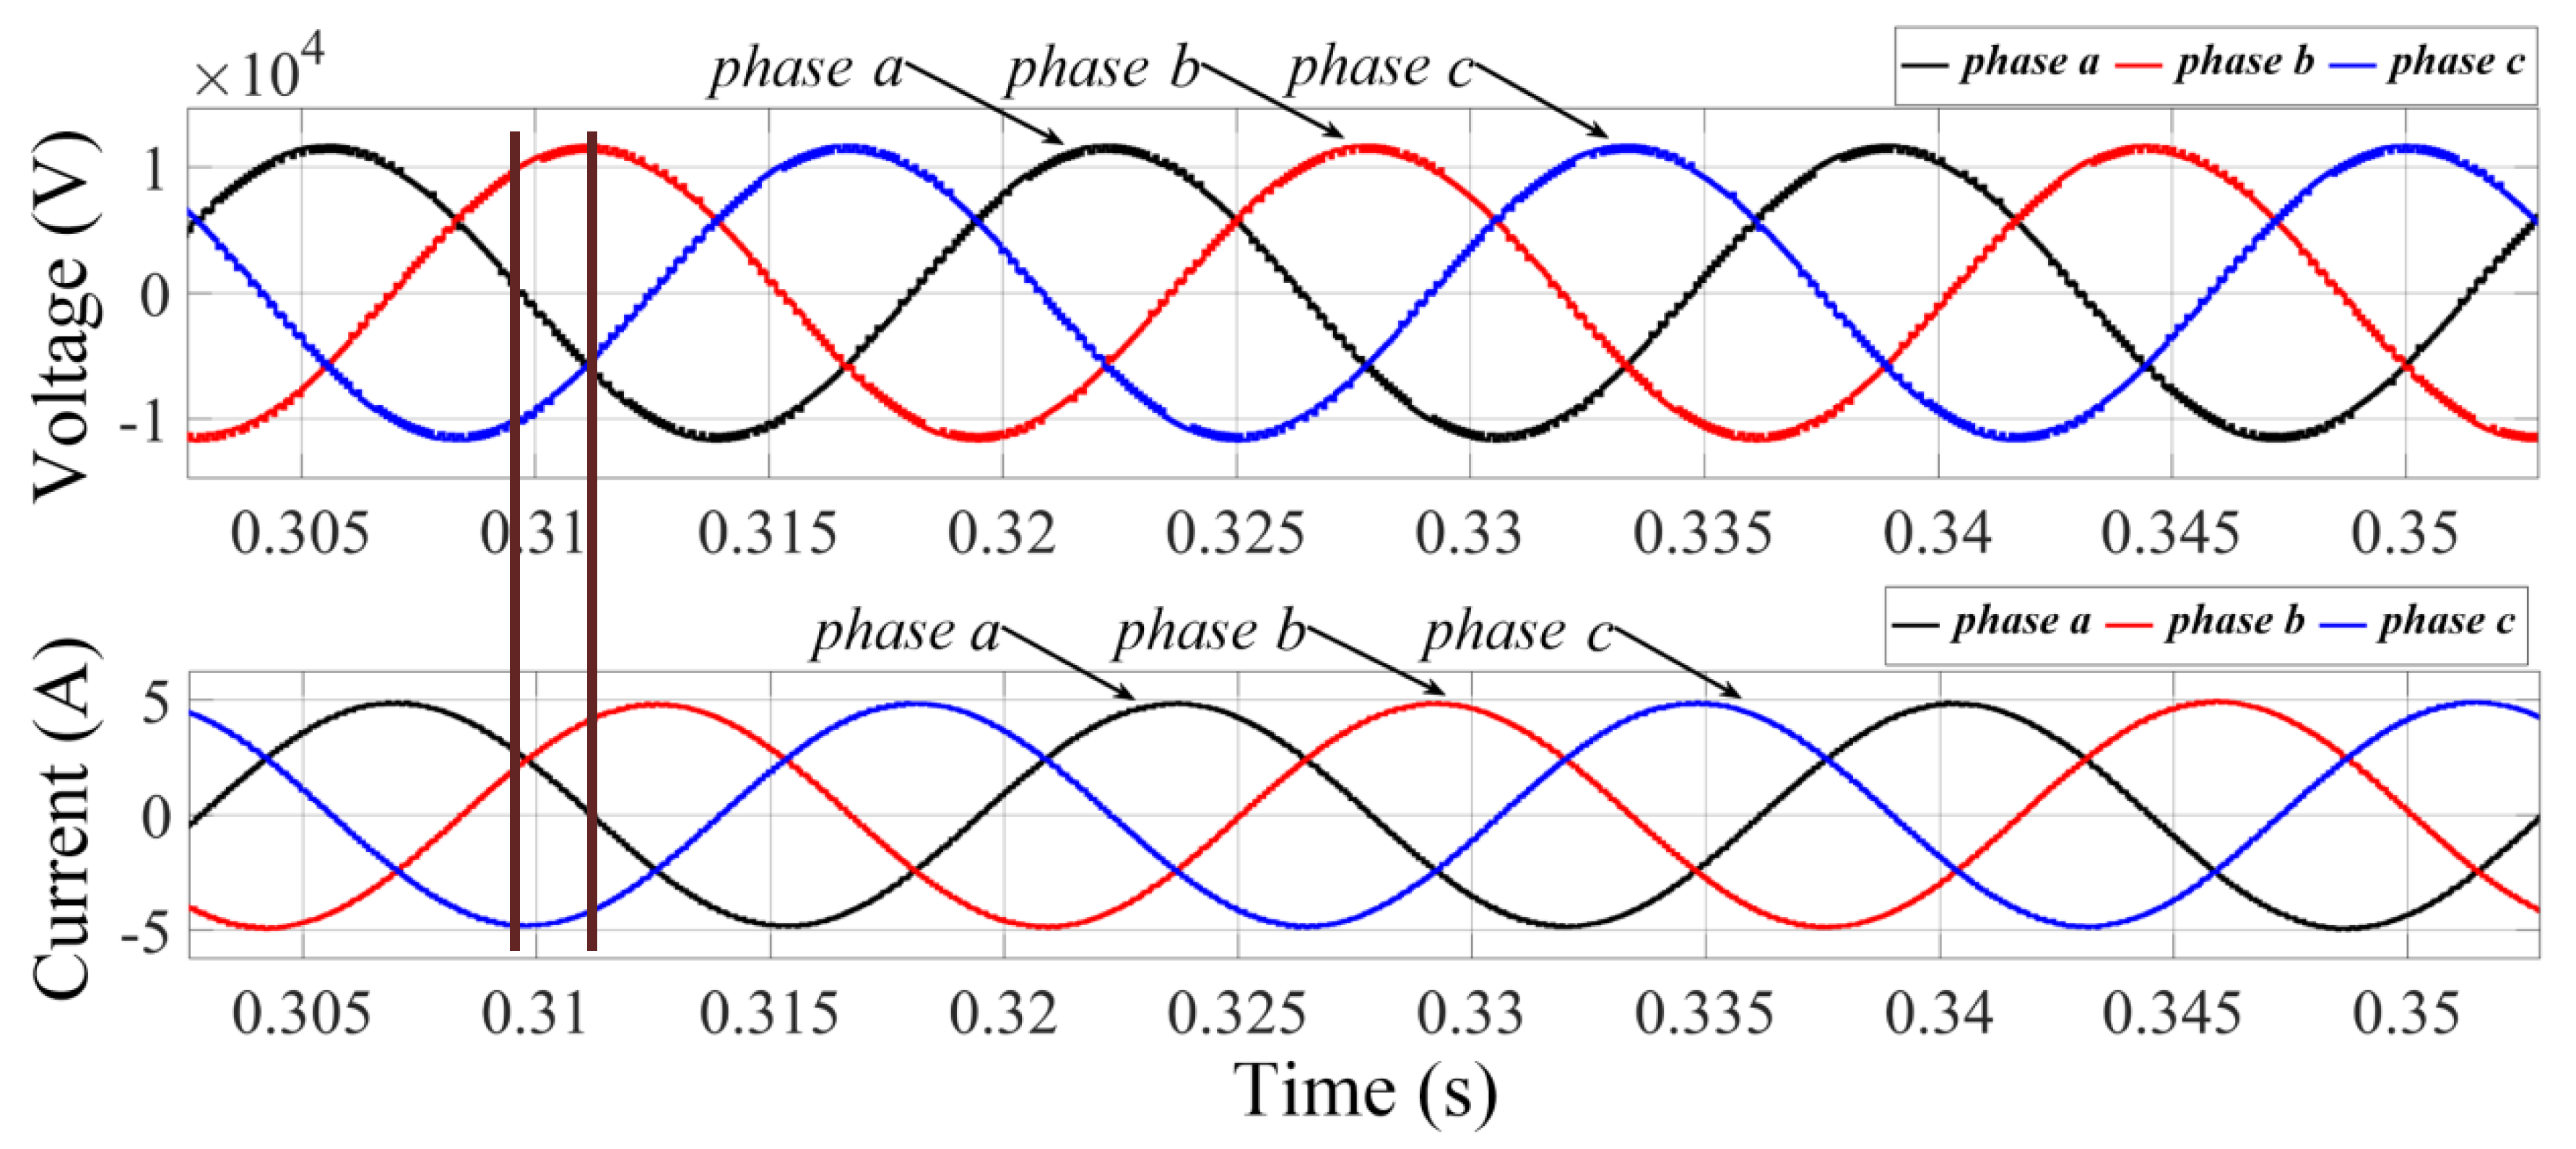
Figure 11 shows measured voltage and current at the TUT input. Two vertical lines of brown color indicate the passage of voltage and current through zero with an approximate time difference equal to 1.5 ms. By the Δt between voltage and current, the angle of 31° at phase “a” is found, confirming
Fp = 0.85 inductive. This condition of overload voltage and current reached 11.5 kV and 4.88 A, respectively, exceeding the nominal values of 11.3 kV and 4.47 A.
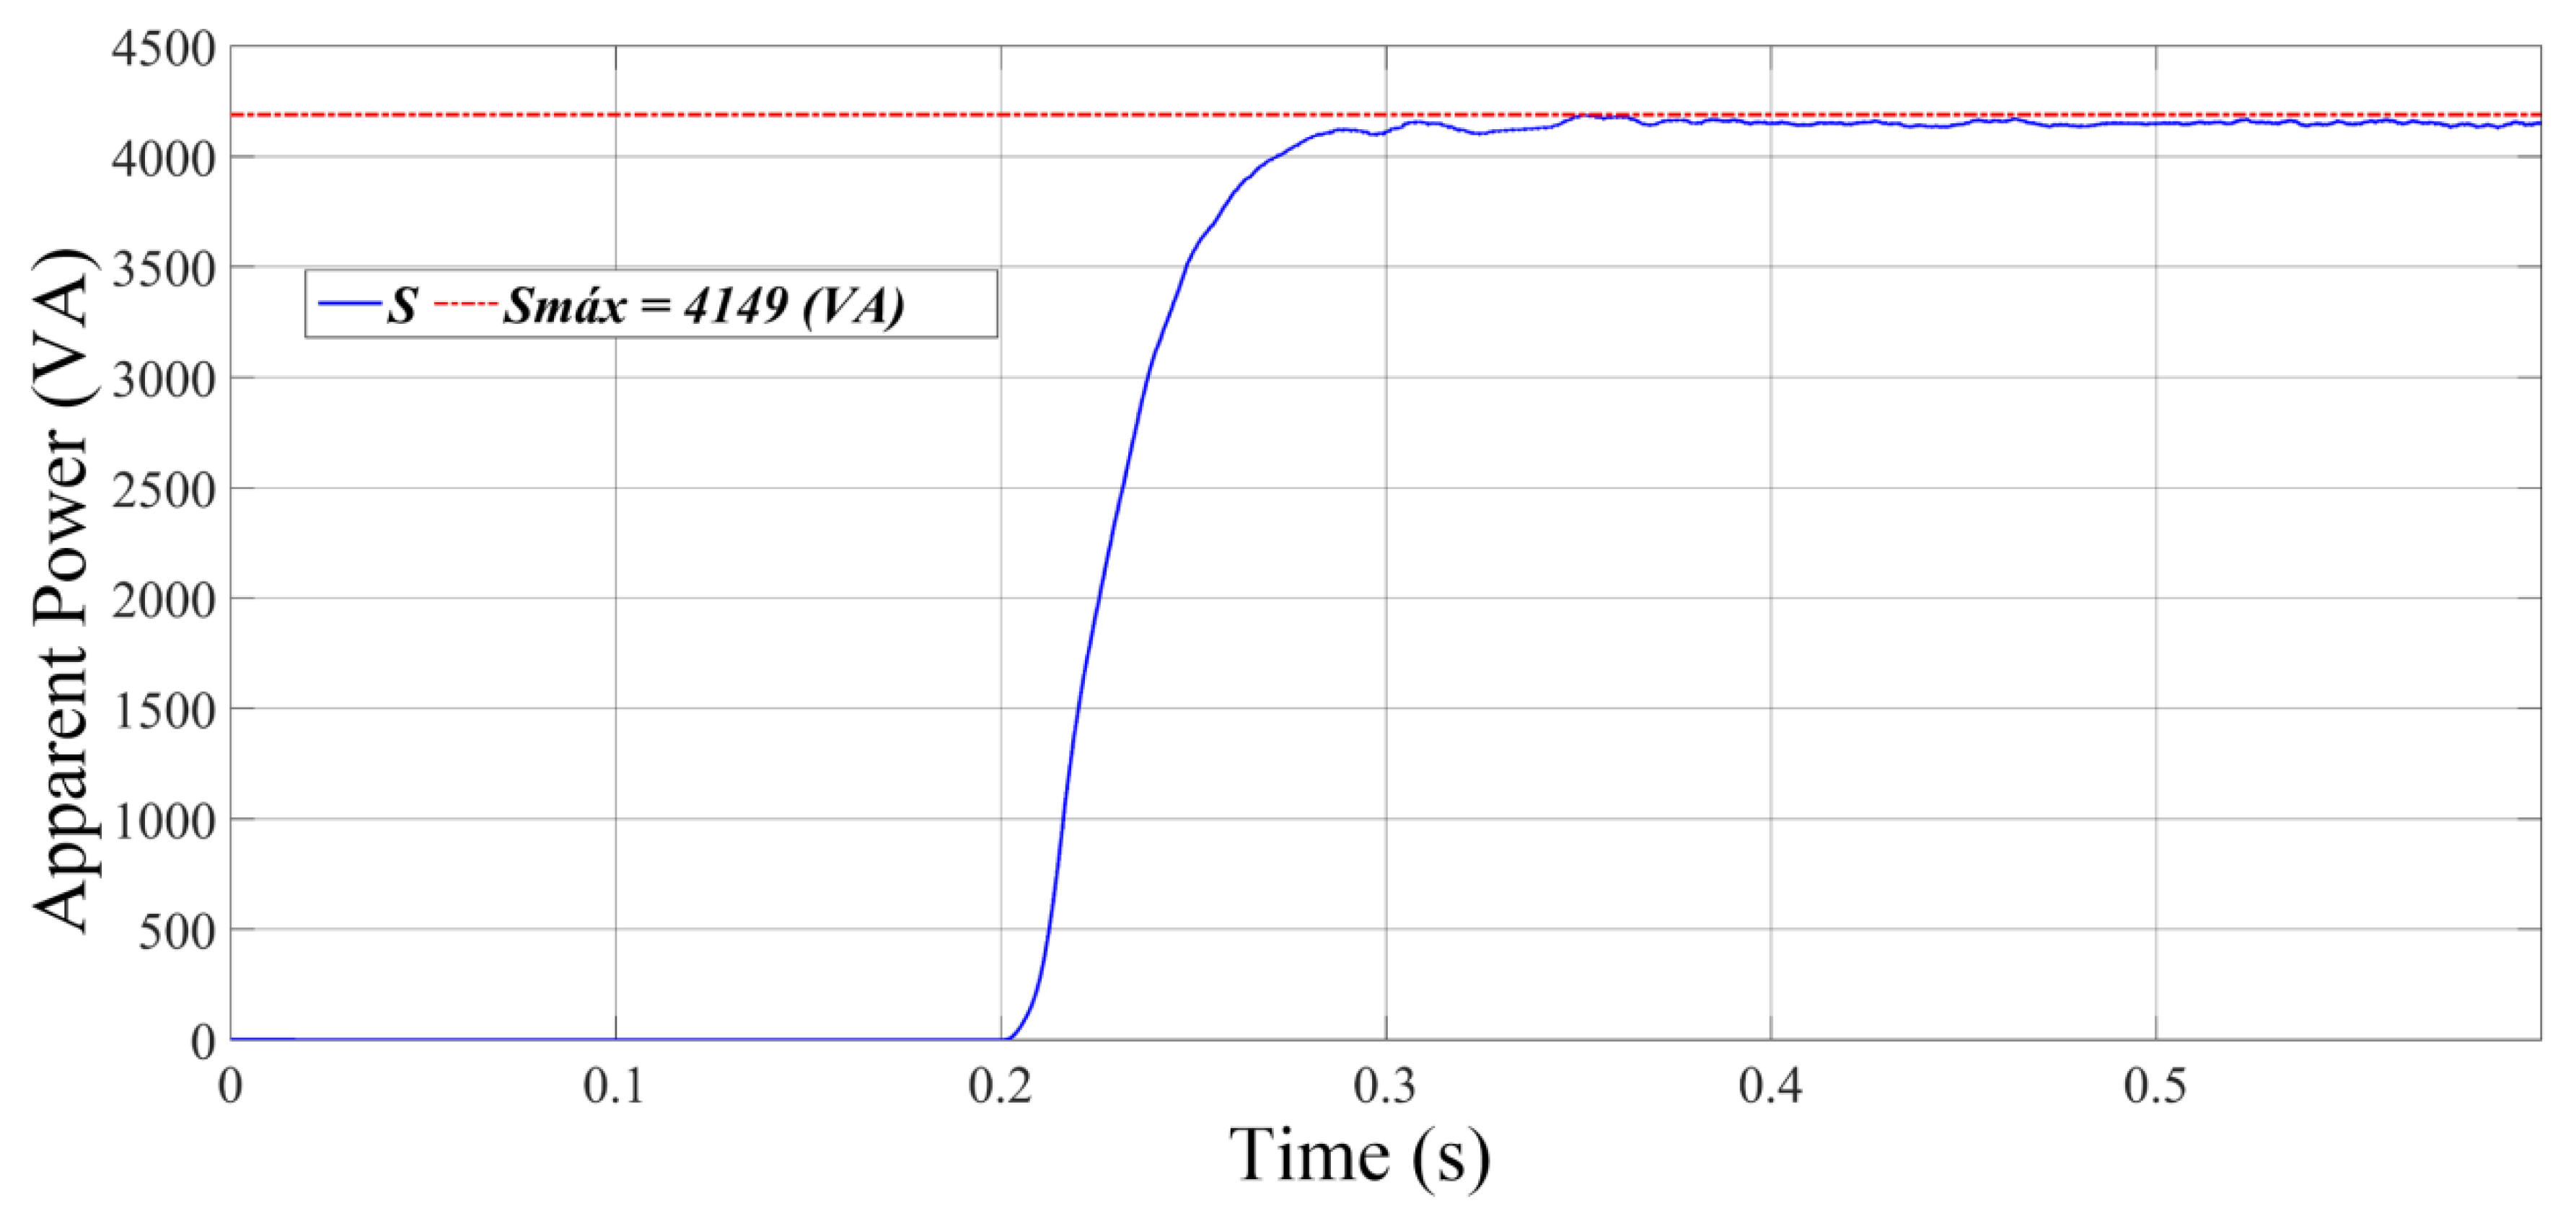
Figure 12 shows the main result of this paper, which refers to the apparent power at the inverter output of fractional value (4.1 kVA) compared to the 75 kVA of the TUT transformer. The previous work [
3] used 75 kVA B2B inverter with power at least equal to the power of the TUT. This result is achieved in all simulation scenarios.
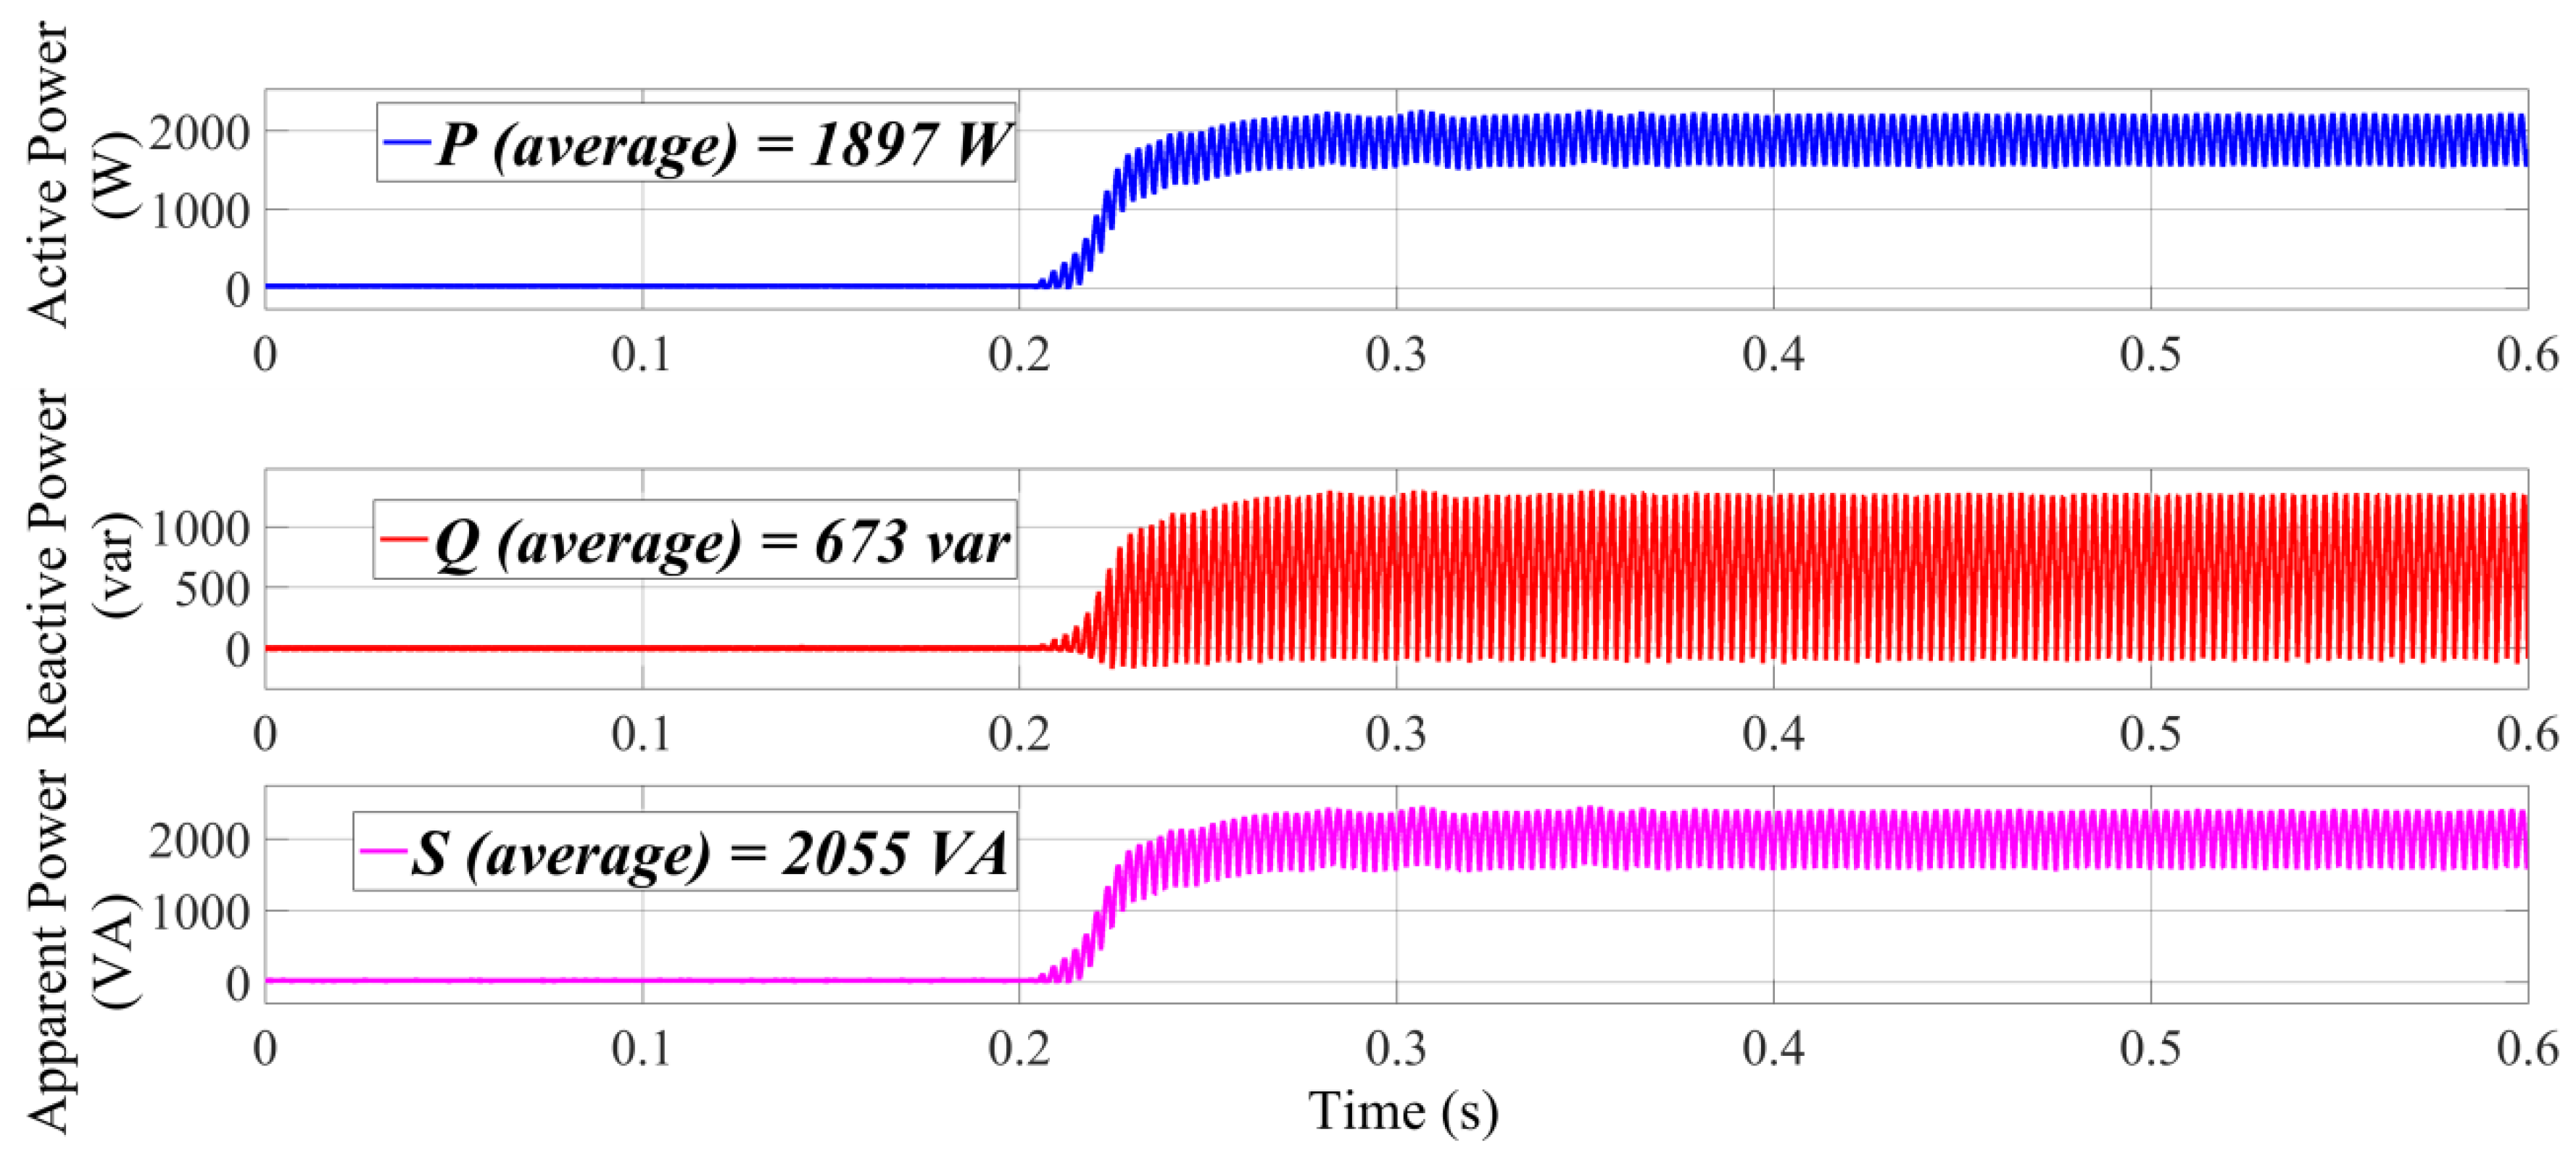
Figure 13 shows optimal result of active and reactive power supplied by the grid. The resulting apparent power from P (1.897 kW) and Q (0.673 kvar), about 2.055 kVA, demonstrates low system power consumption, which is consumed by inverter switching losses as well as system impedances.
5.2. Second Simulation
The following test scenario continues without harmonics, 1.0 pu and
Fp = 0.7 capacitive. For this configuration, it means to apply the current
= 3.13 A and
= 3.17 A.
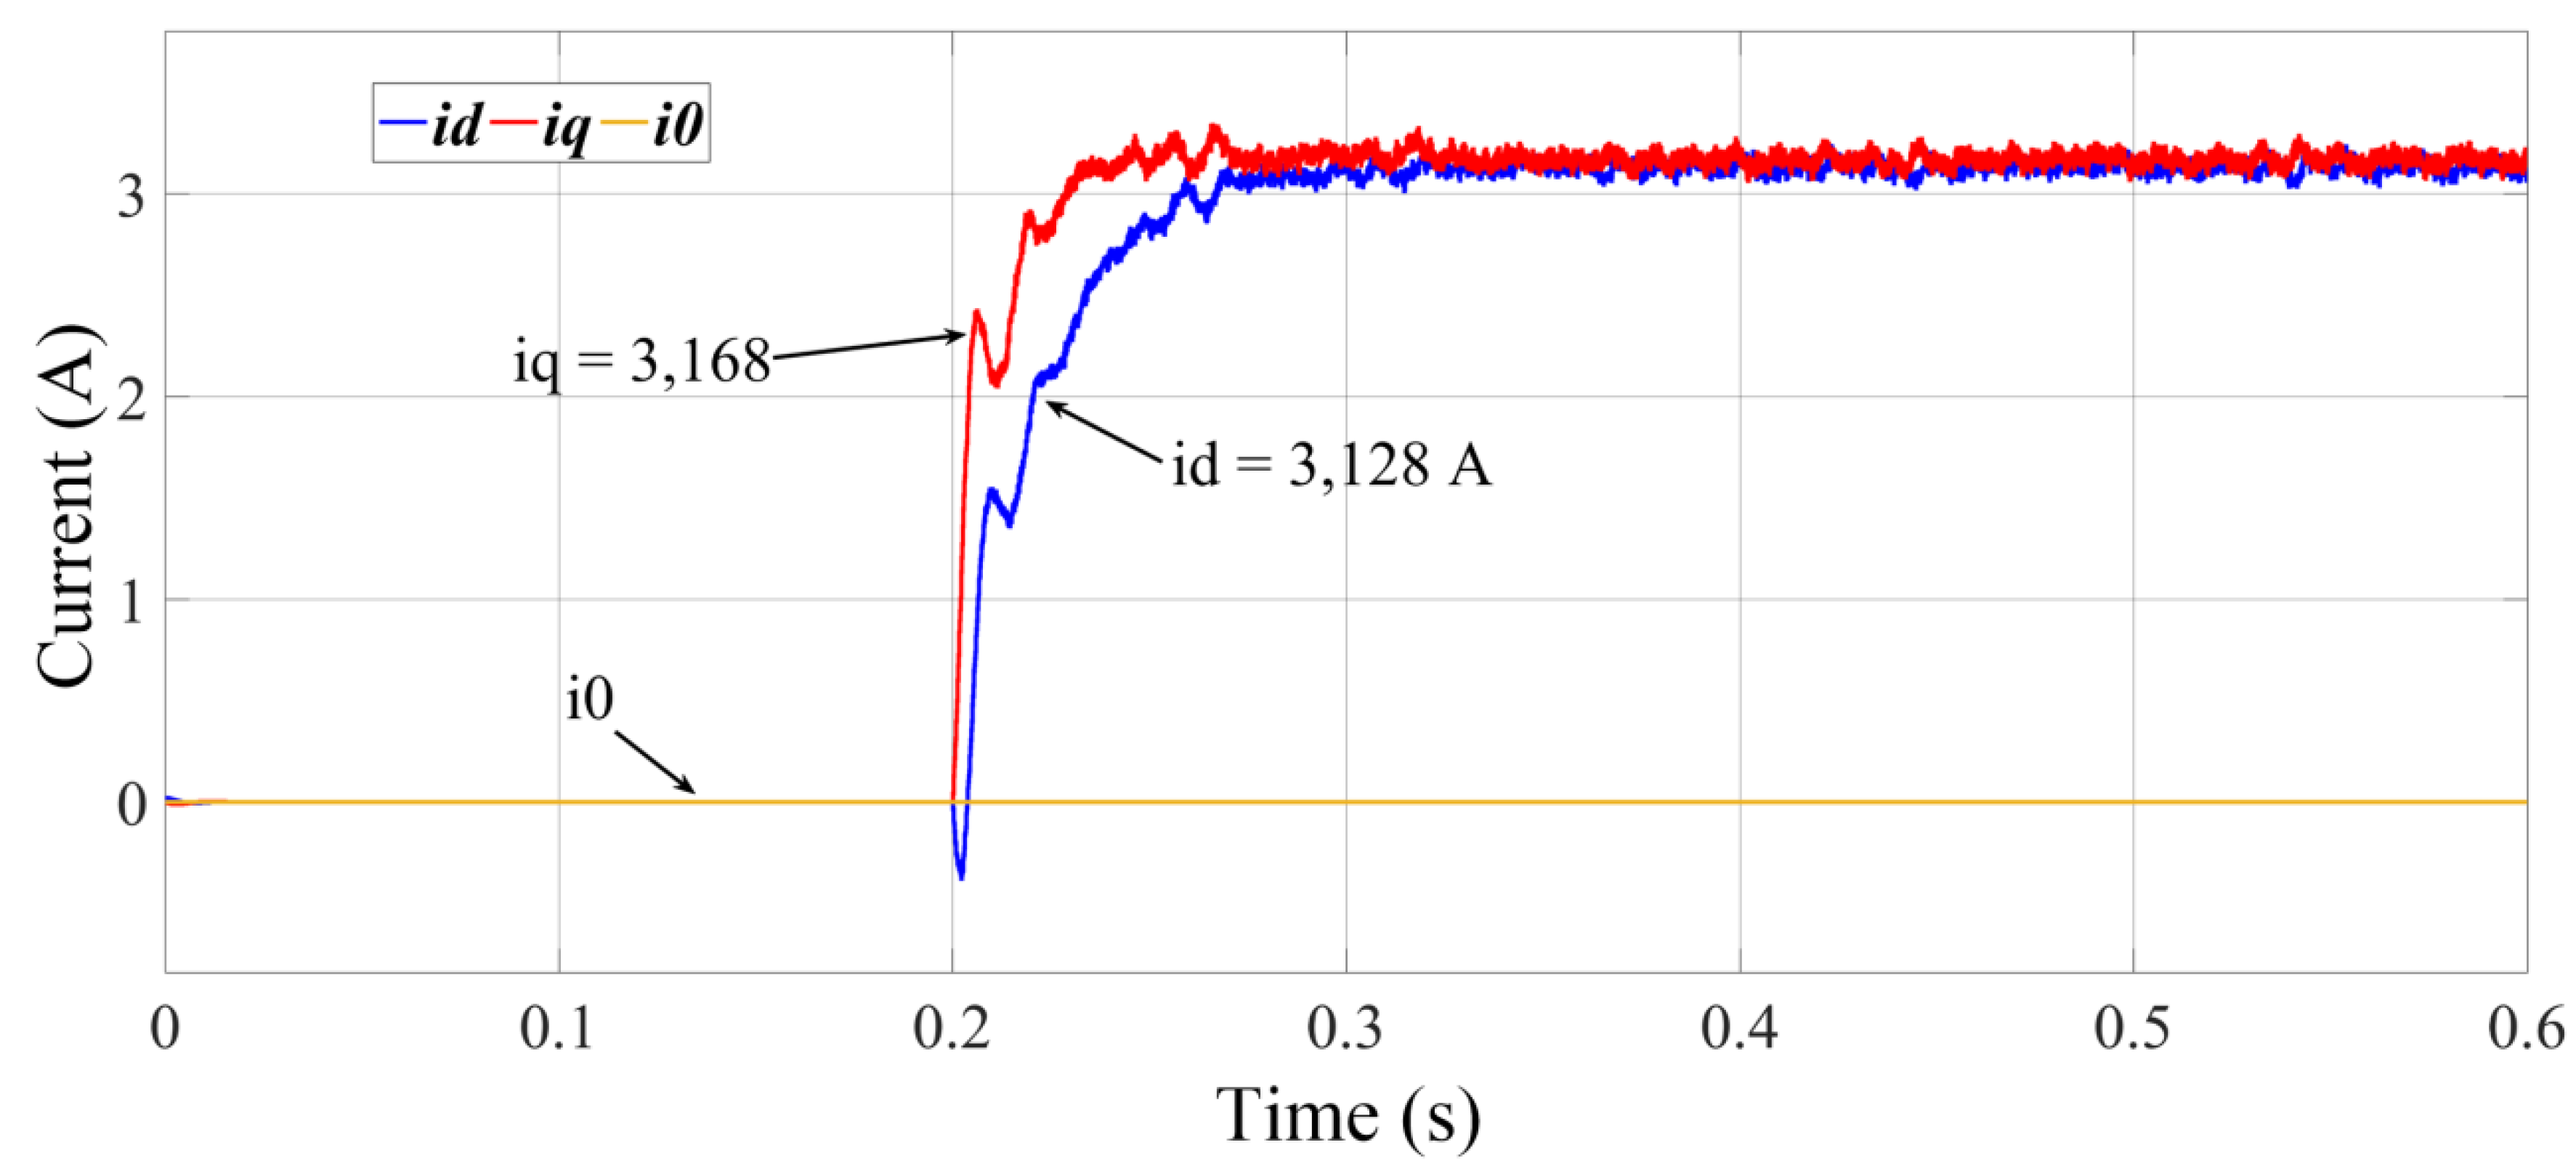
Figure 14 shows the
and
currents after 0.2 s. The measured values are the same as the reference values, 3.13 A and 3.17 A, respectively.
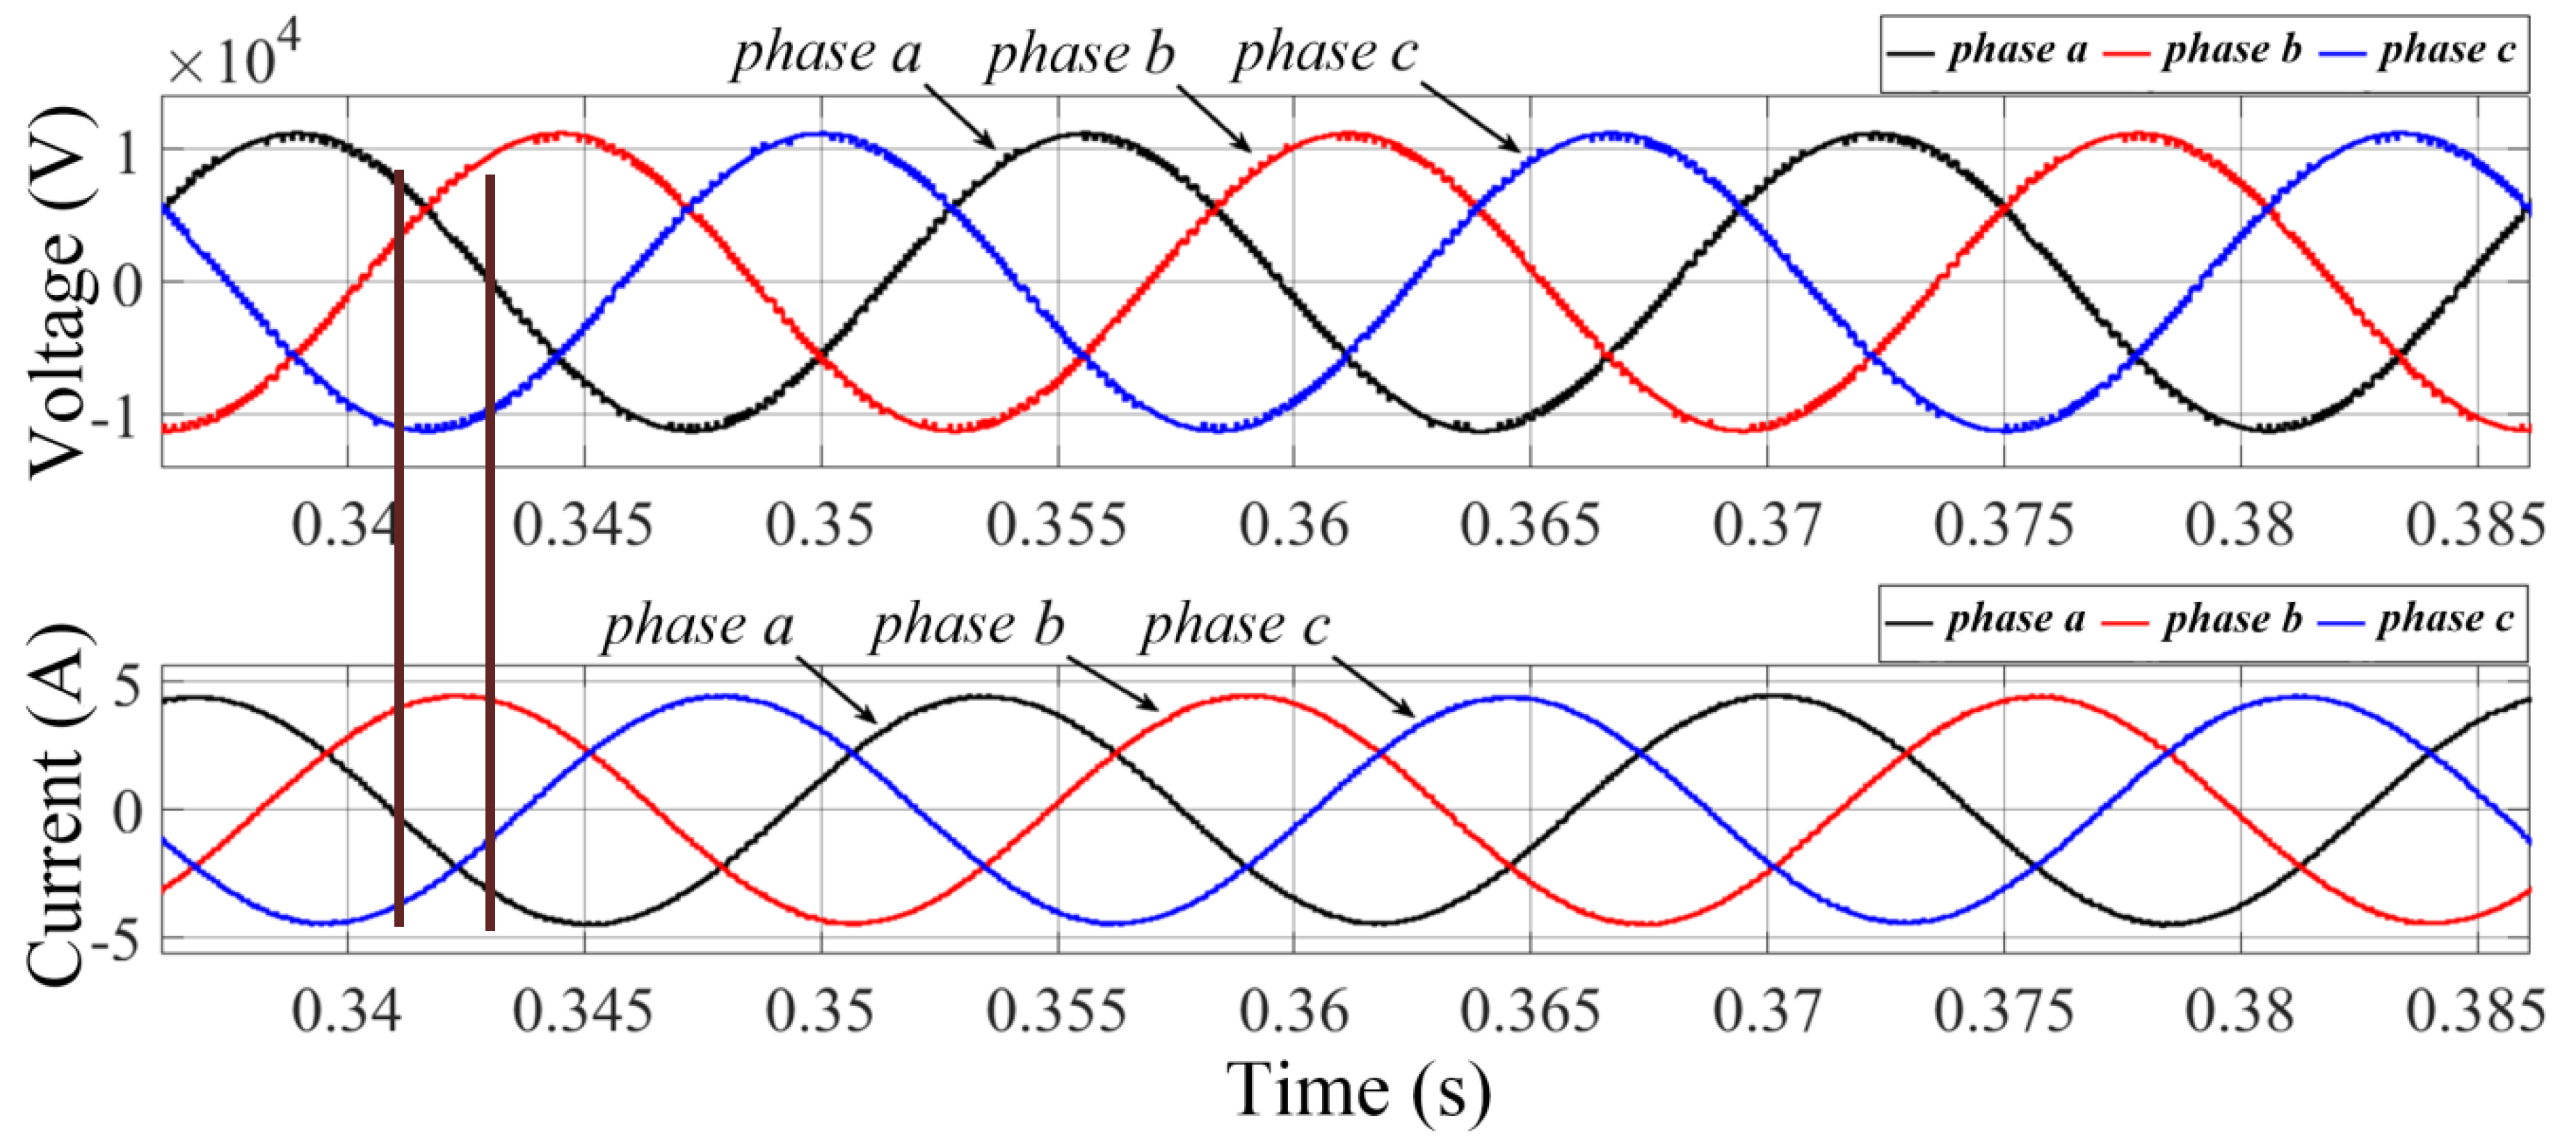
Figure 15 shows the current leading of the voltage at the input of the TUT. The vertical lines of brown color show the time interval of approximately 2 ms between the passage of the current and voltage by the zero. Thus, it is possible to confirm the 0.7 capacitive power factor with a measured phase difference of approximately 44° relative to phase a.
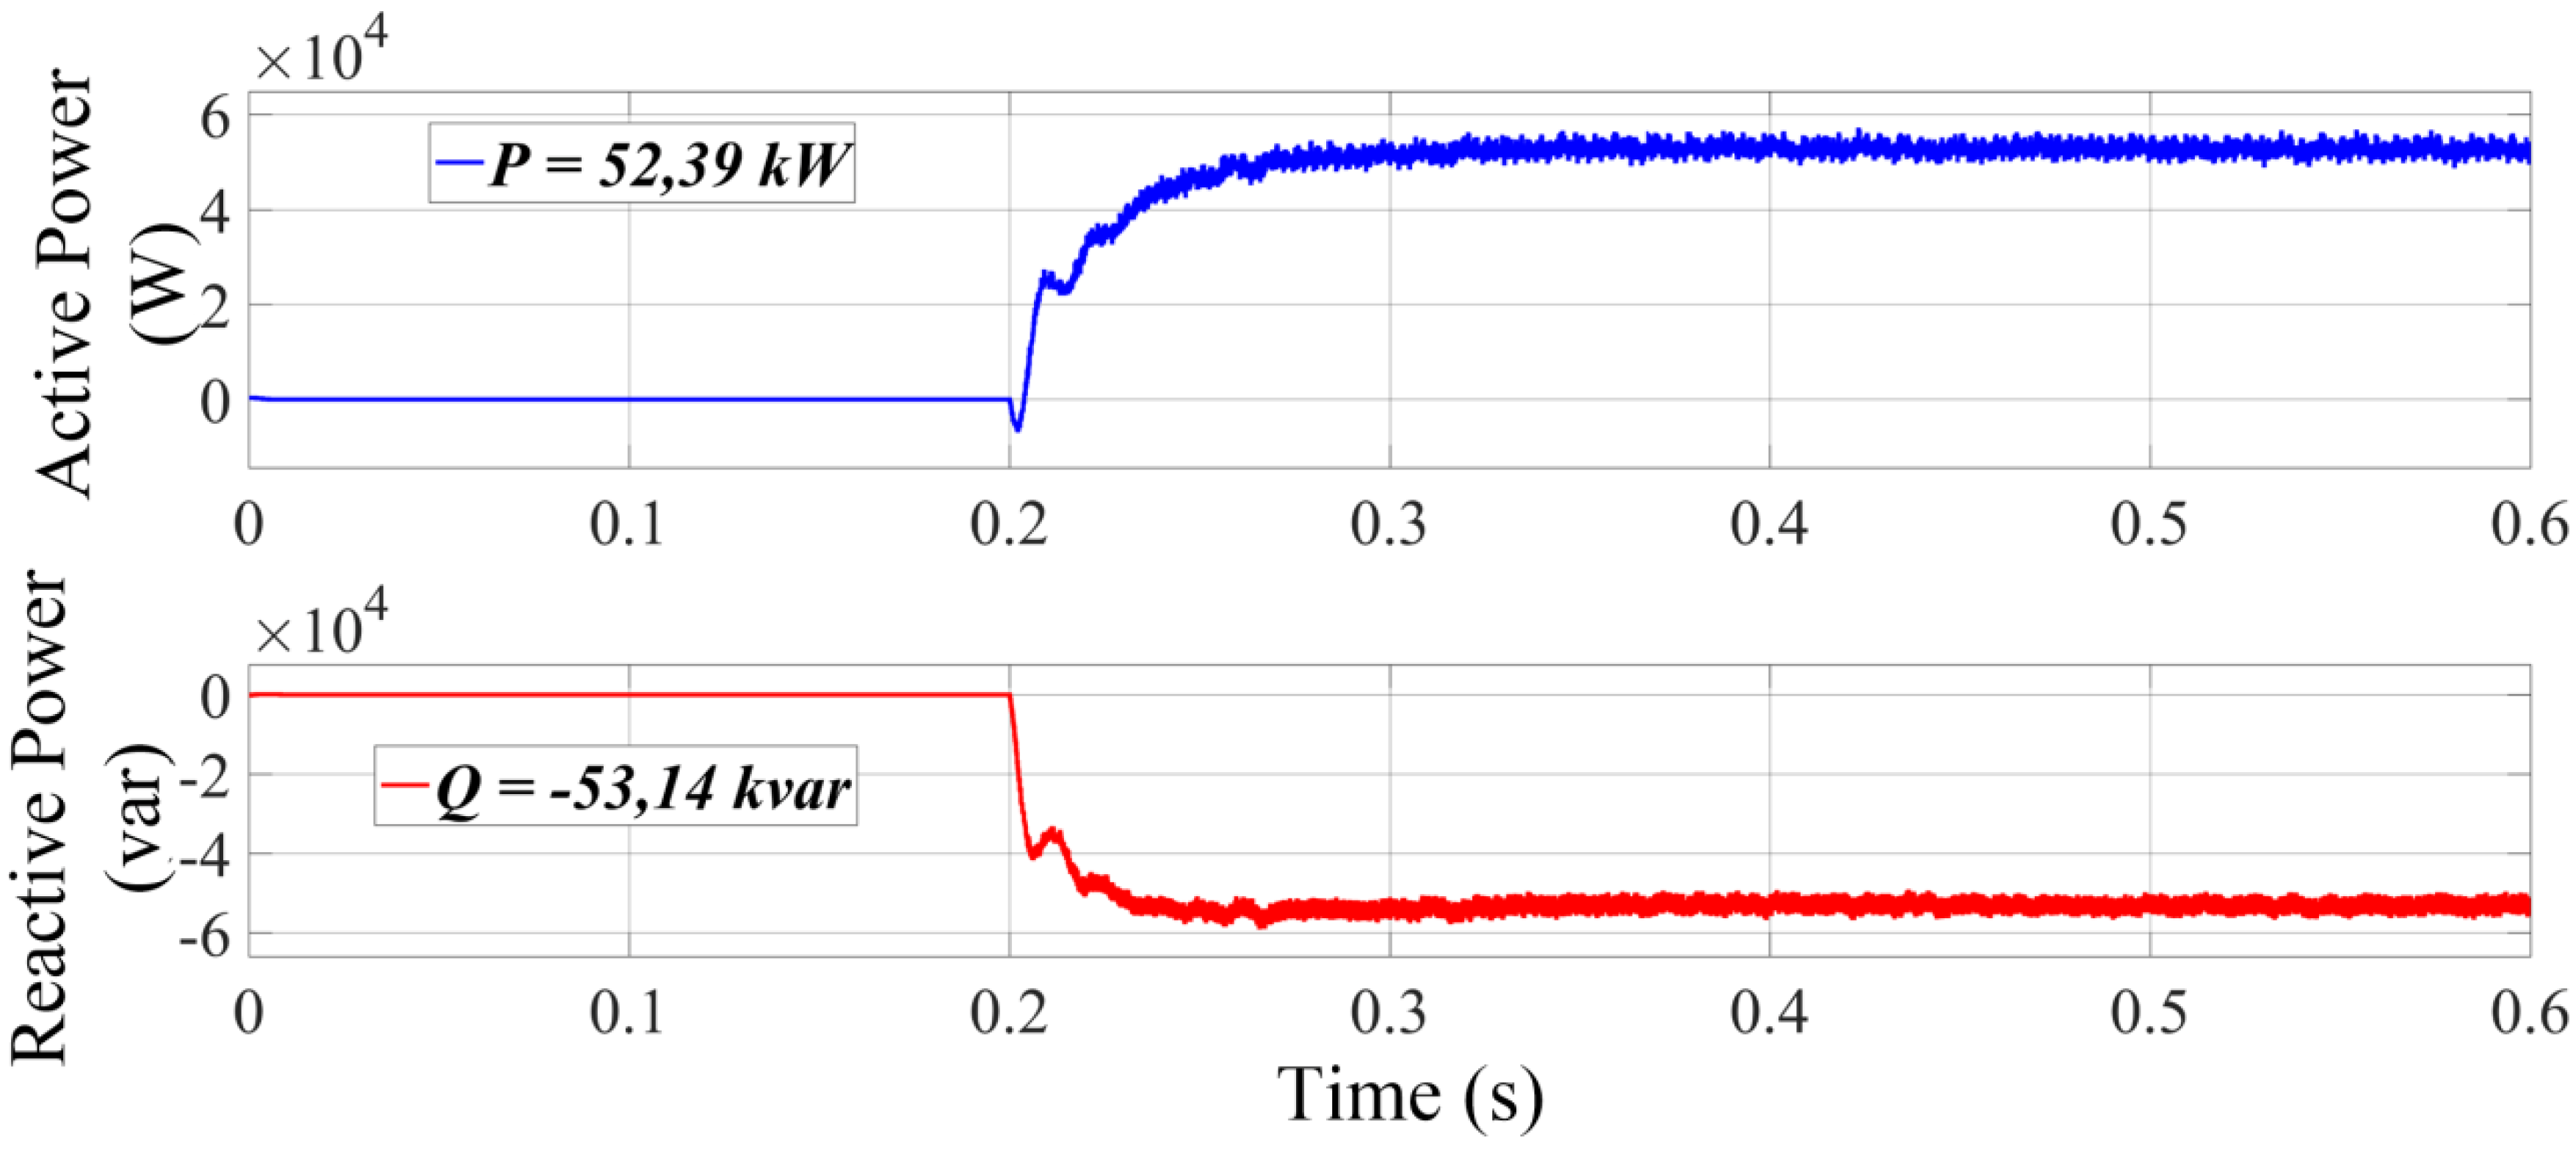
Figure 16 shows the active and reactive power circulating through the TUT after step at
t = 0.2 s. The active power measured was 52.39 kW for the defined load level, close to the calculated value of 52.5 kW. The reactive power was −53.14 kvar and the calculated power was 53.5 kvar. The negative sign of Q indicates the capacitive power factor. The resulting S value was approximately 74.6 kVA, close to the nominal 75 kVA of the TUT.
5.3. Third Simulation
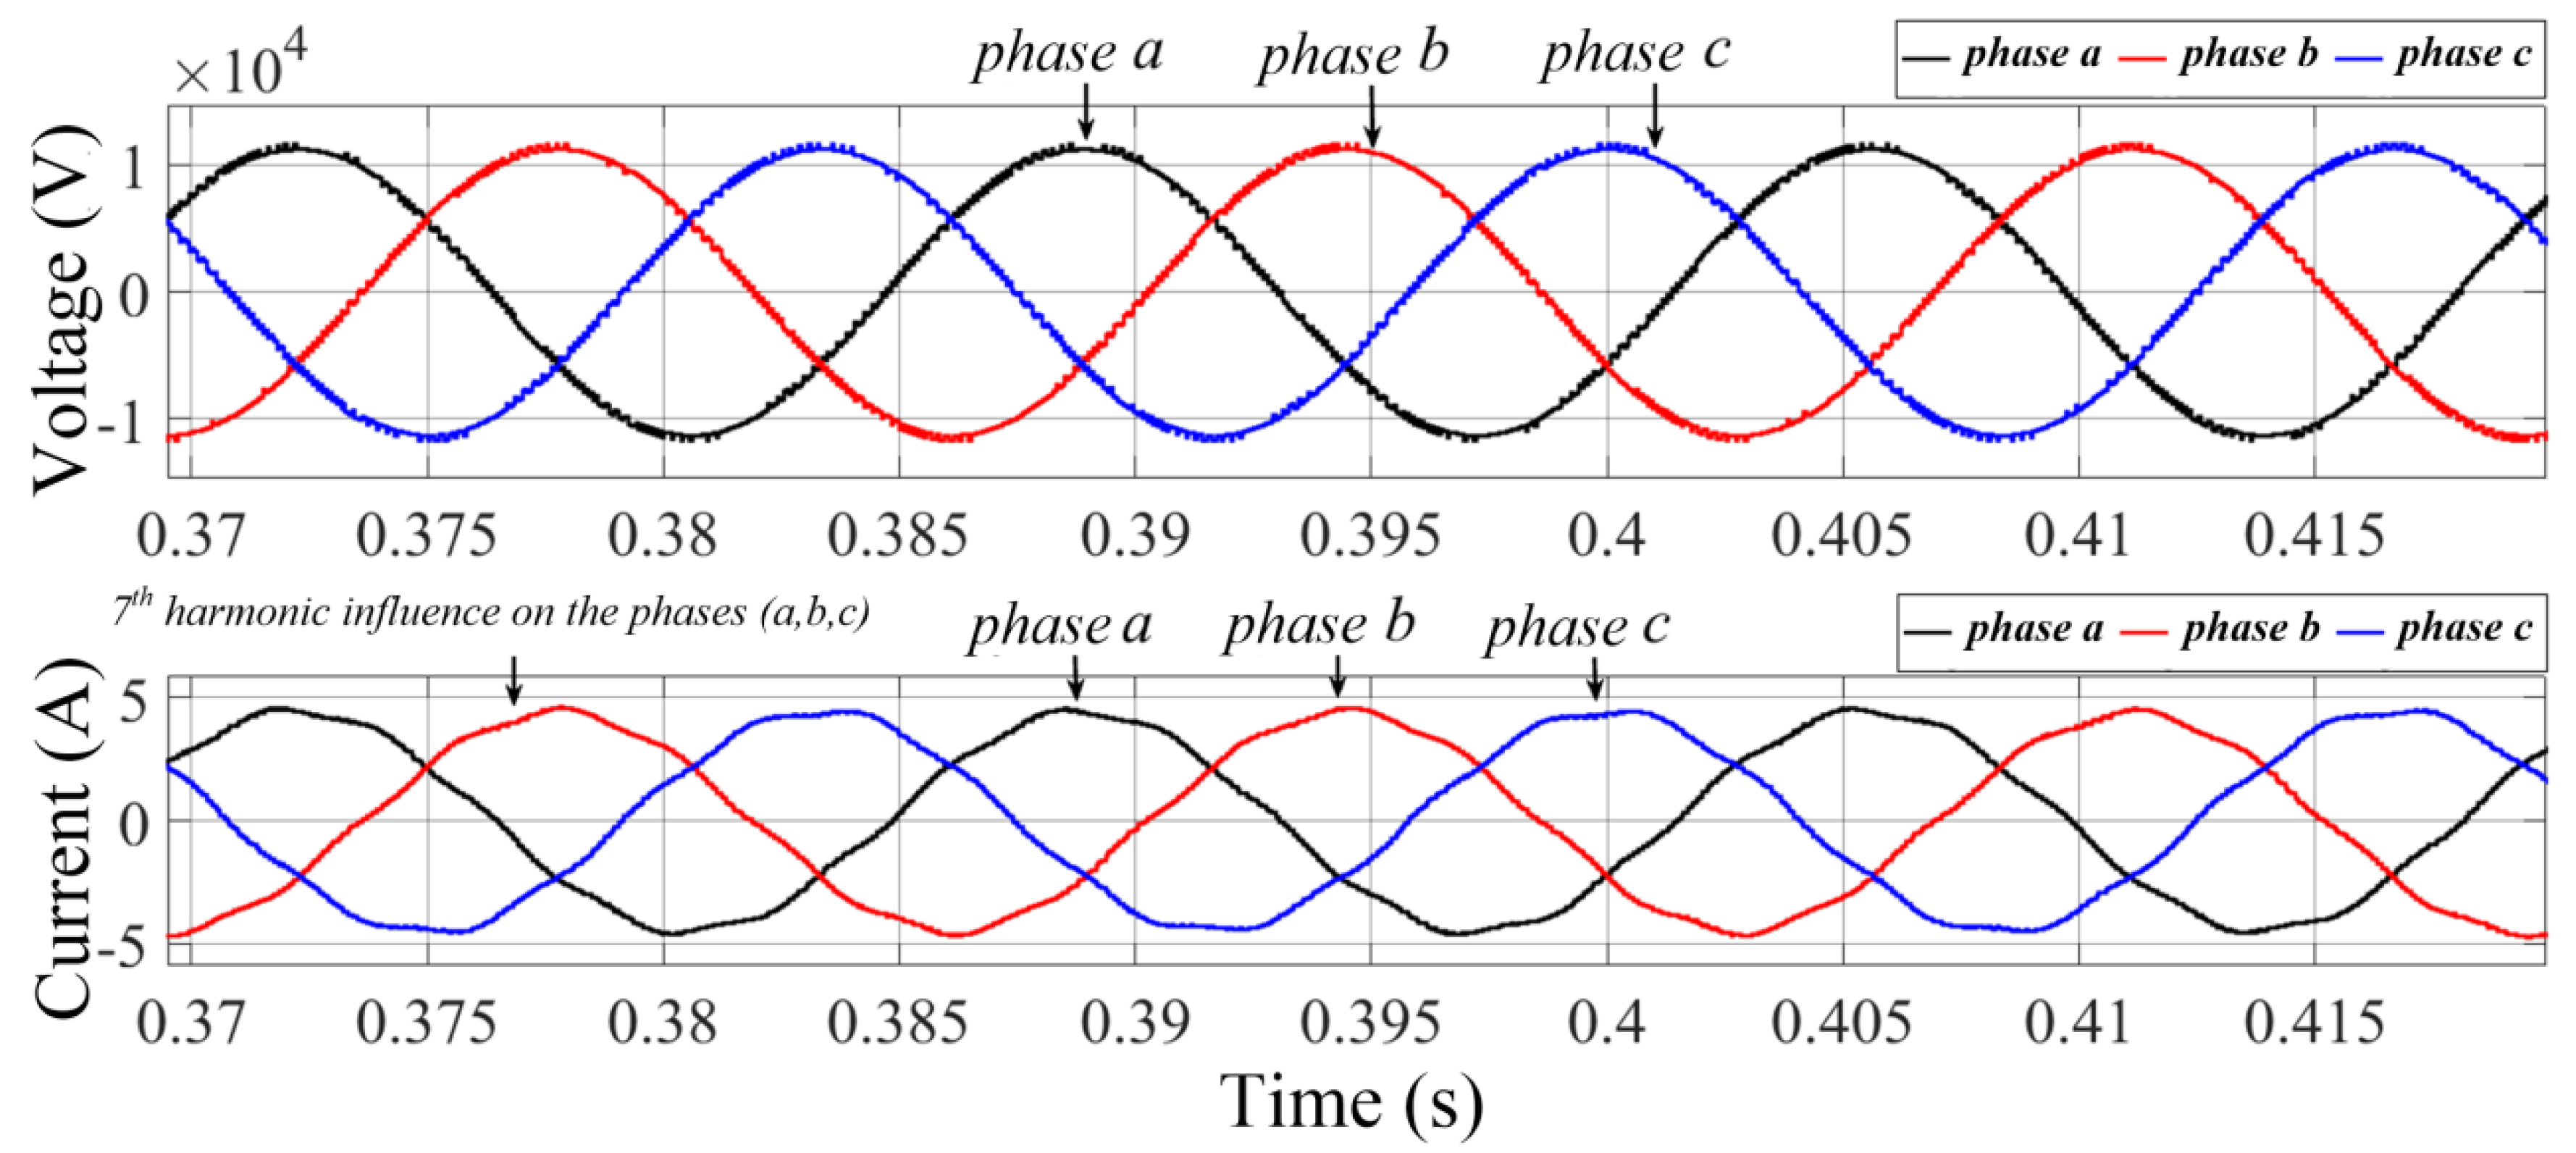
This last test scenario corresponds to 1.0 pu, Fp = 1.0, and adding 7th order harmonic with amplitude of 3%. For this configuration, it means to apply the current = 4.47 A and = 0 A.
Figure 17 shows the voltage (upper) and current (lower) at HV winding of TUT. In the voltage signal the influence of the harmonic is imperceptible, but the harmonic distortion observed in the current signal is evident.
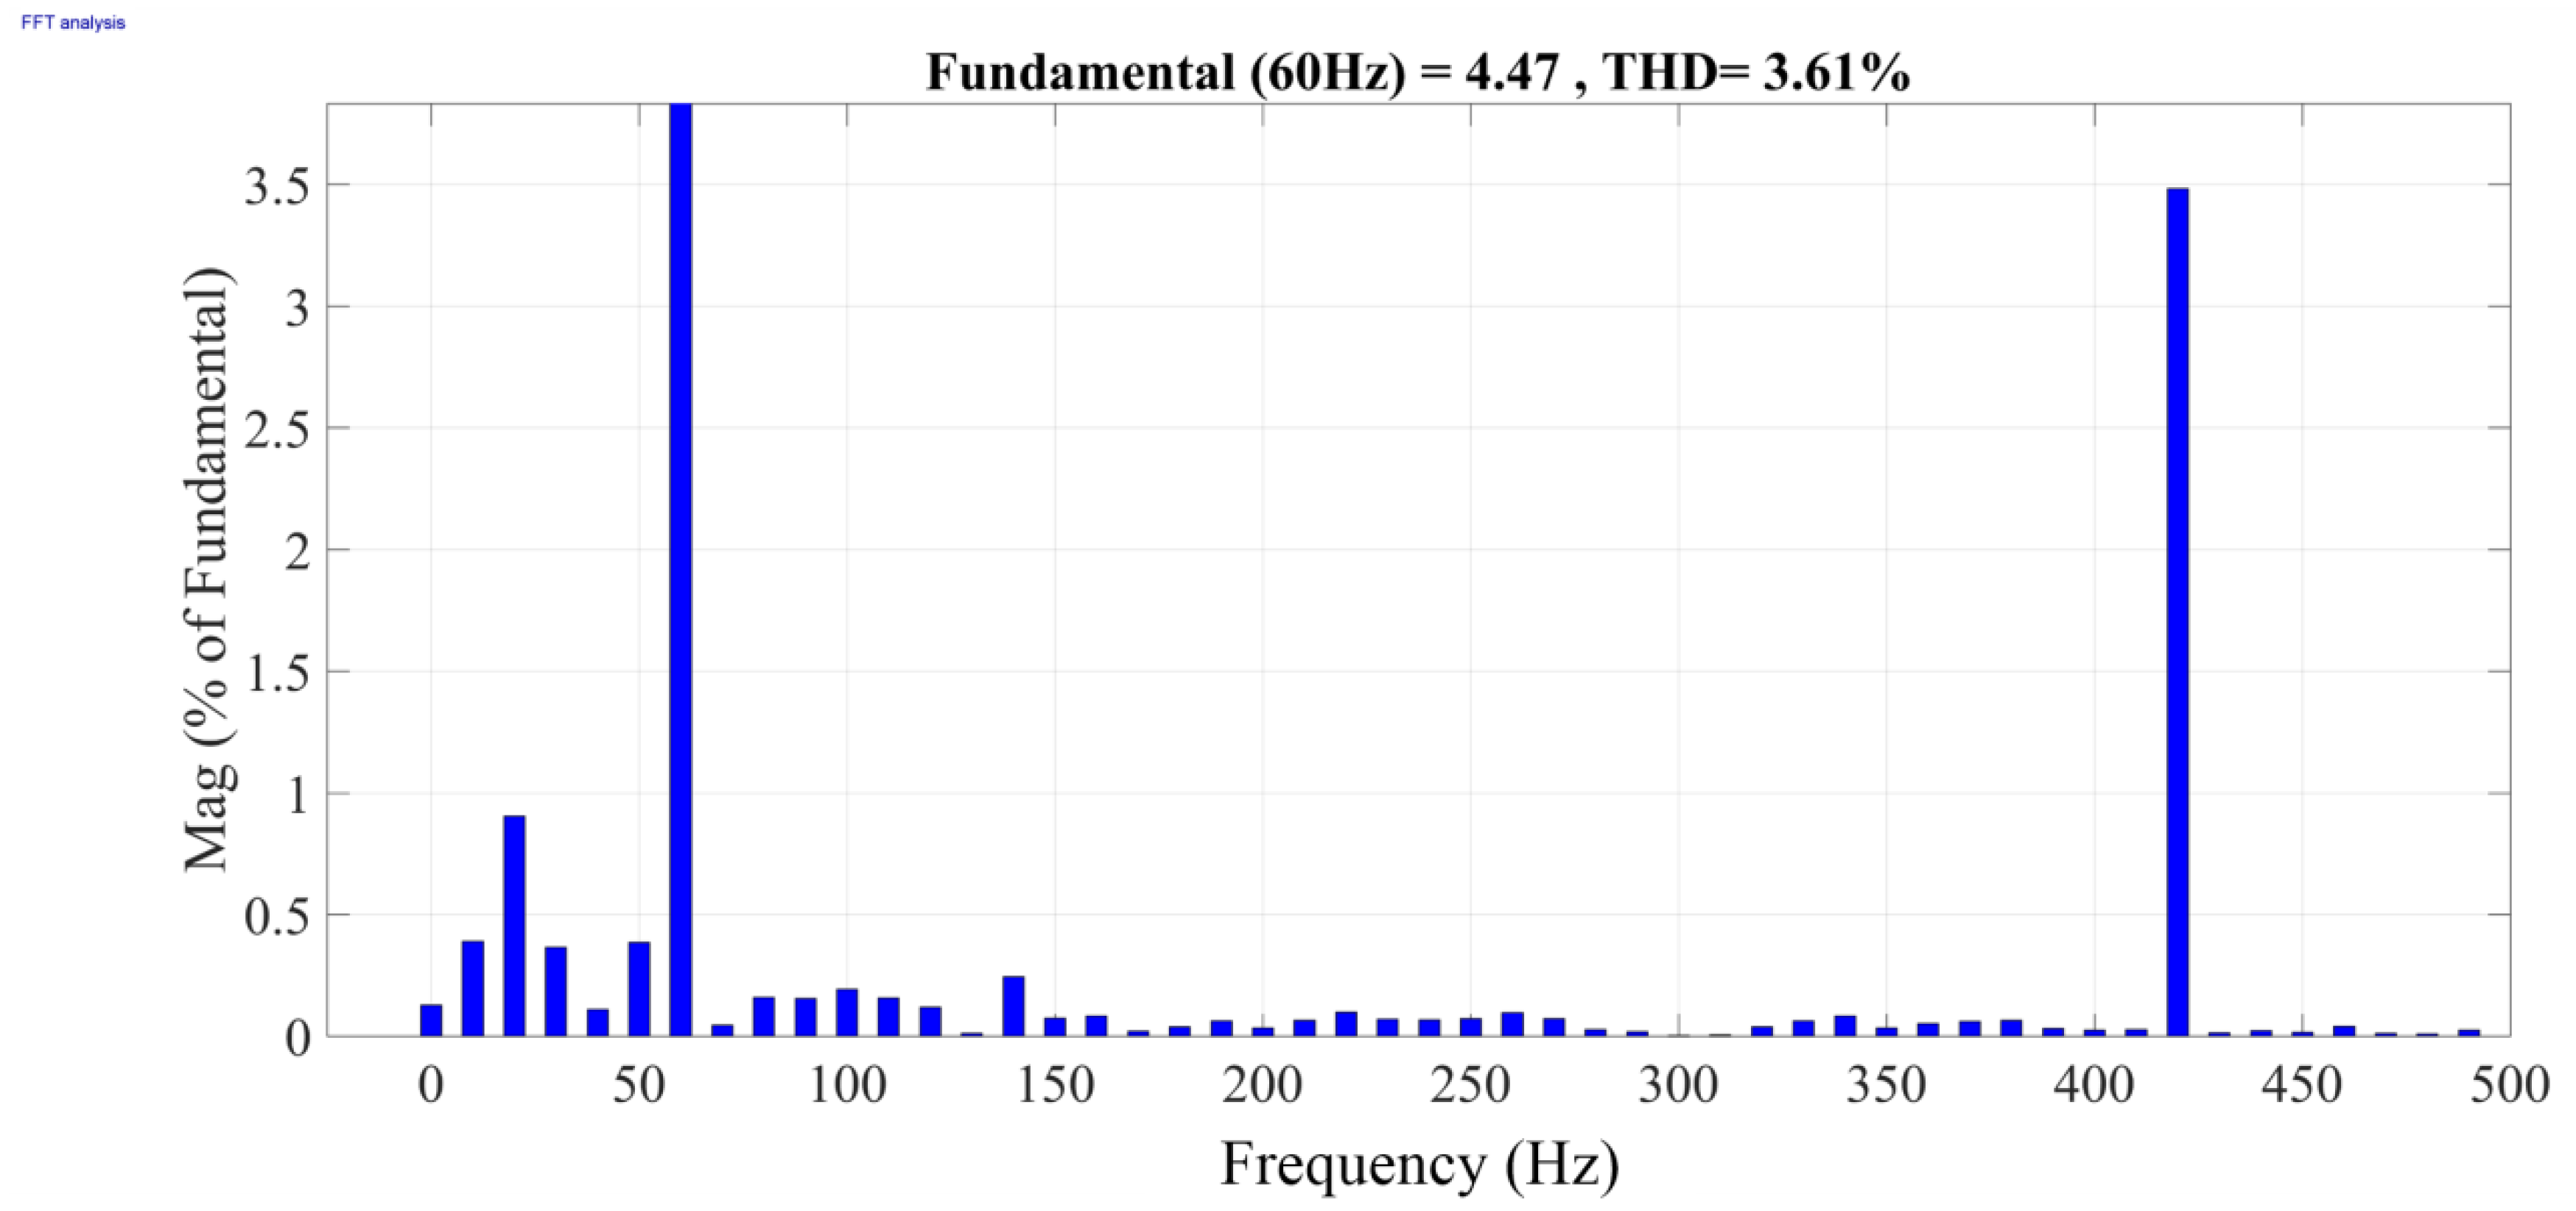
Figure 18 shows the current harmonic spectrum in the TUT. It is observed that, at 420 Hz (h7), the percentage of 3.48% is in relation to the fundamental frequency (4.47 A) and Total Harmonic Distortion (THD) of 3.61%. Thus, the 3% value applied to the 7th order harmonic is confirmed.
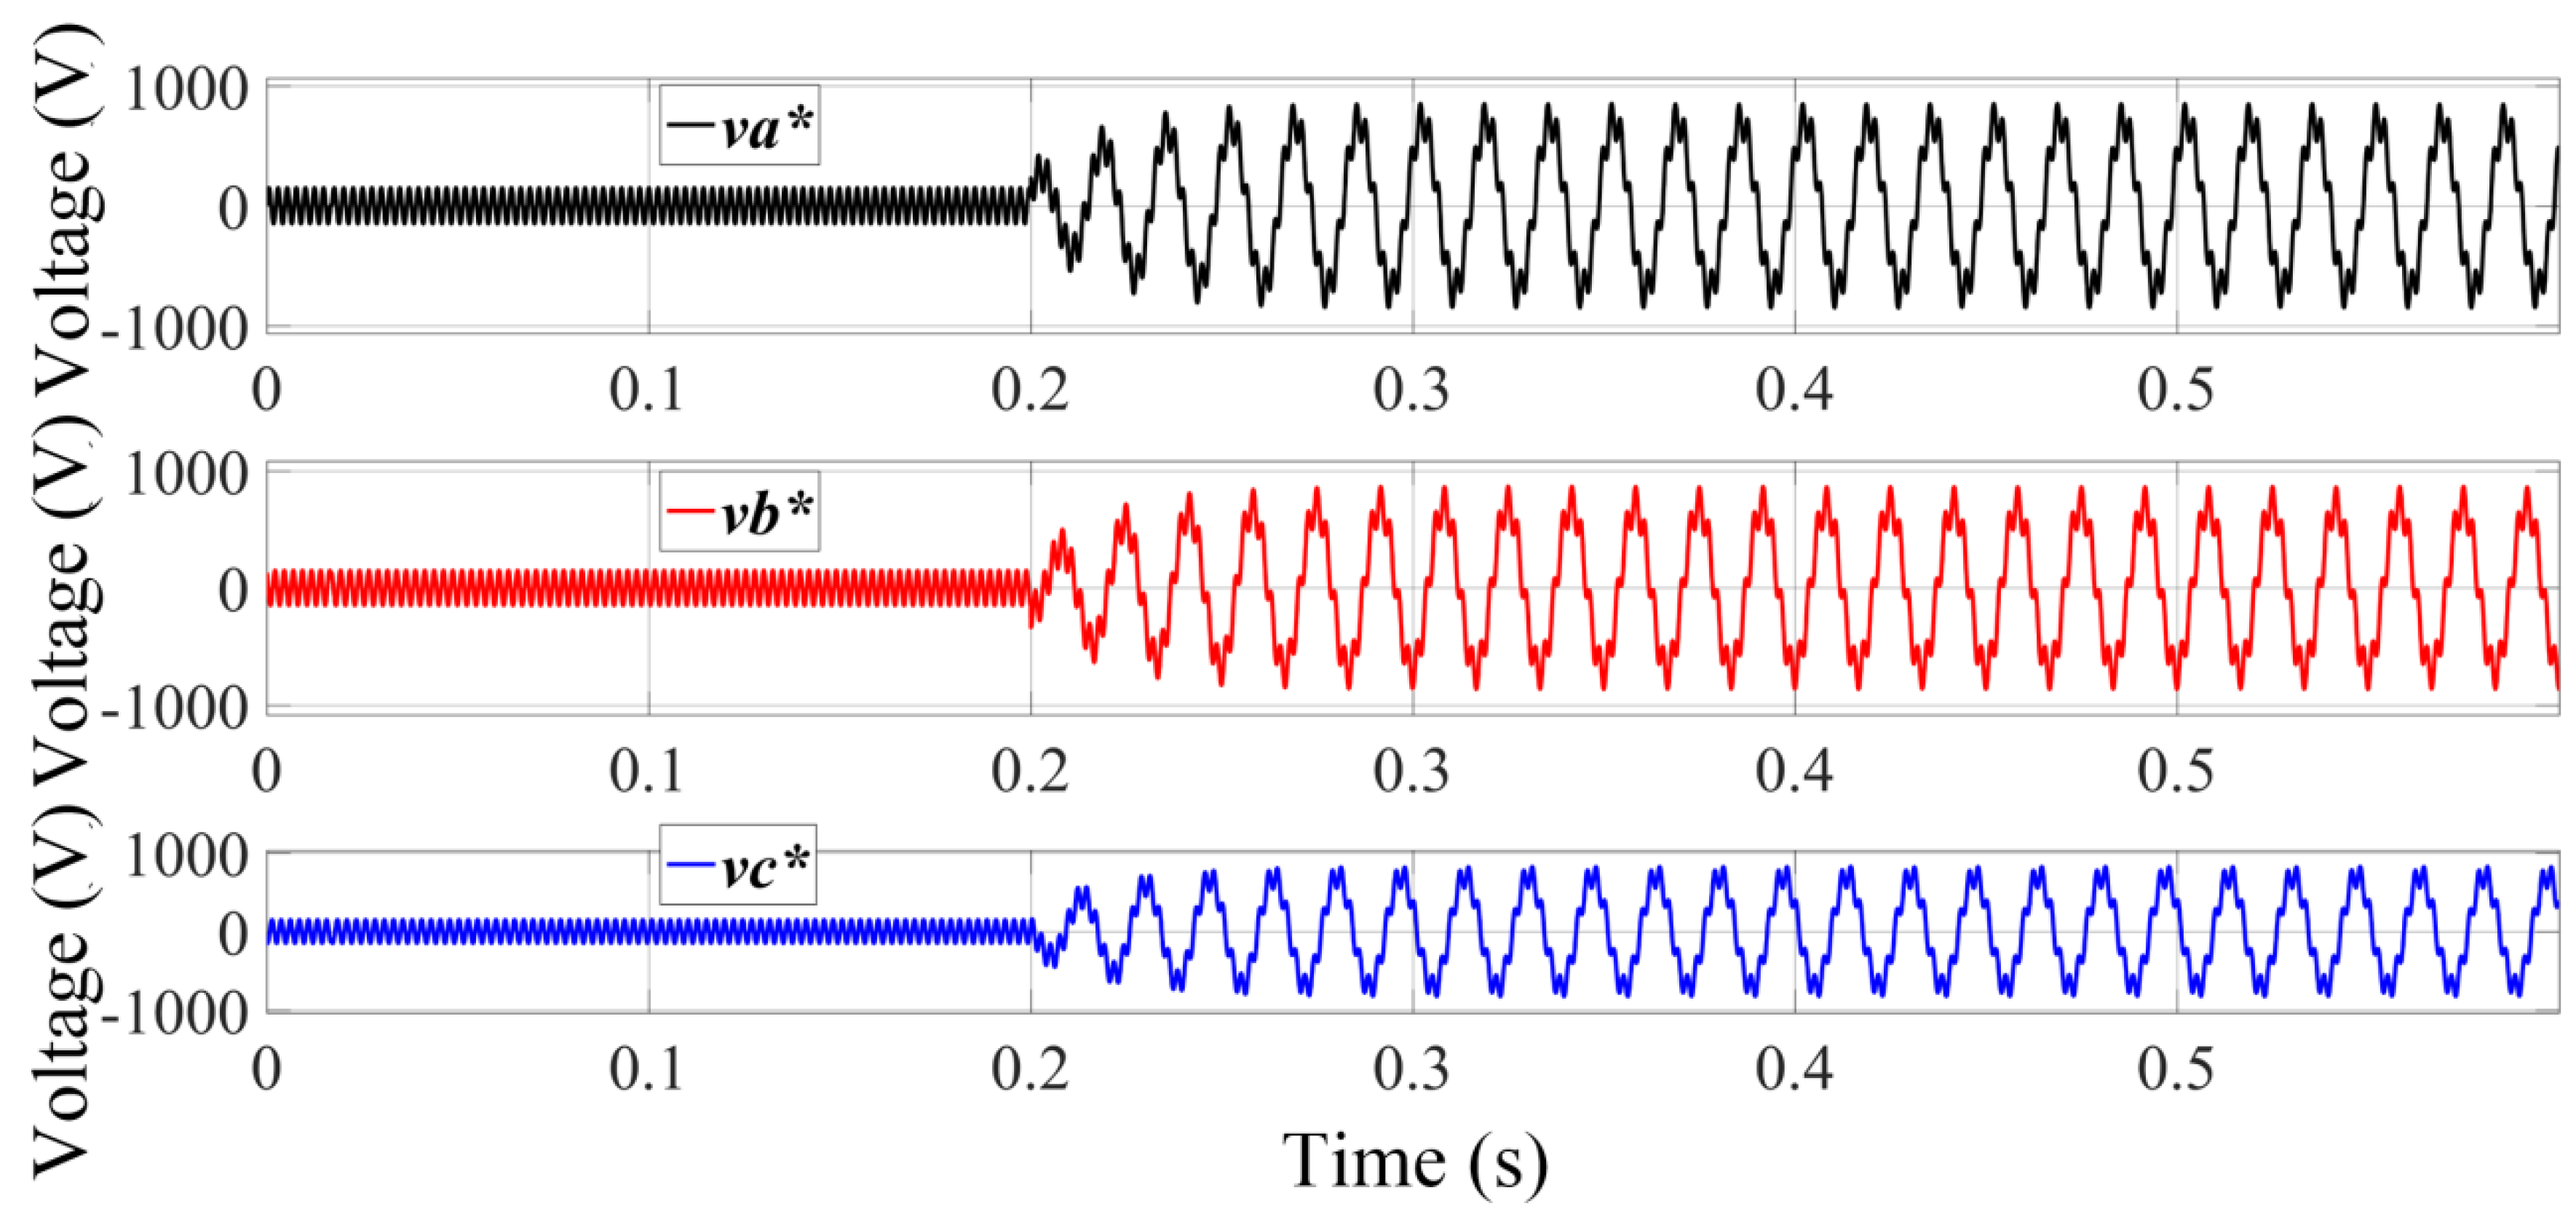
Figure 19 shows the reference voltages
,
, and
, added the reference harmonic voltages
,
, and
.
6. Conclusions
A fractional power converter for the test of transformers under full load was presented in this paper. The main contribution was to be able to test a 75 kVA transformer with fractional power converter around 4 kVA, which previously adopted a B2B converter of 75 kVA, the same power at the TUT transformer, seen in Reference [
3]. The structure was verified by Matlab/Simulink
® simulation.
Several simulations were carried out on the TUT transformer and the main ones were presented, basically for power factor, harmonics, and power level. Regarding the power factor, it was possible to vary it with inductive and capacitive characteristics. Concerning injected harmonics, it was possible to test the system for this condition and to validate the current harmonics generation. Overload tests up to 1.15 pu were realized.
The proposed topology is of minimum consumption compared to the power of the TUT, confirmed by the power values that flow from the grid to the system. For a 75kVA, 13.8 kV/220 V full-load test, a three-phase value of 2.0 kVA was found. This great result characterizes the model used as an energy regenerator. The power consumed by the grid is justified by losses in the transformers and power conversion harmonics. The simulations have shown that it is possible to test transformers up to rated power and a little above for any power factor making use of a low-power series-connected inverter, compared to the power of the TUT. Furthermore, it is easy to introduce harmonics in the circulation of current.


