Selective Removal of Water Generated during Hydrogenotrophic Methanation from Culture Medium Using Membrane Distillation


Abstract
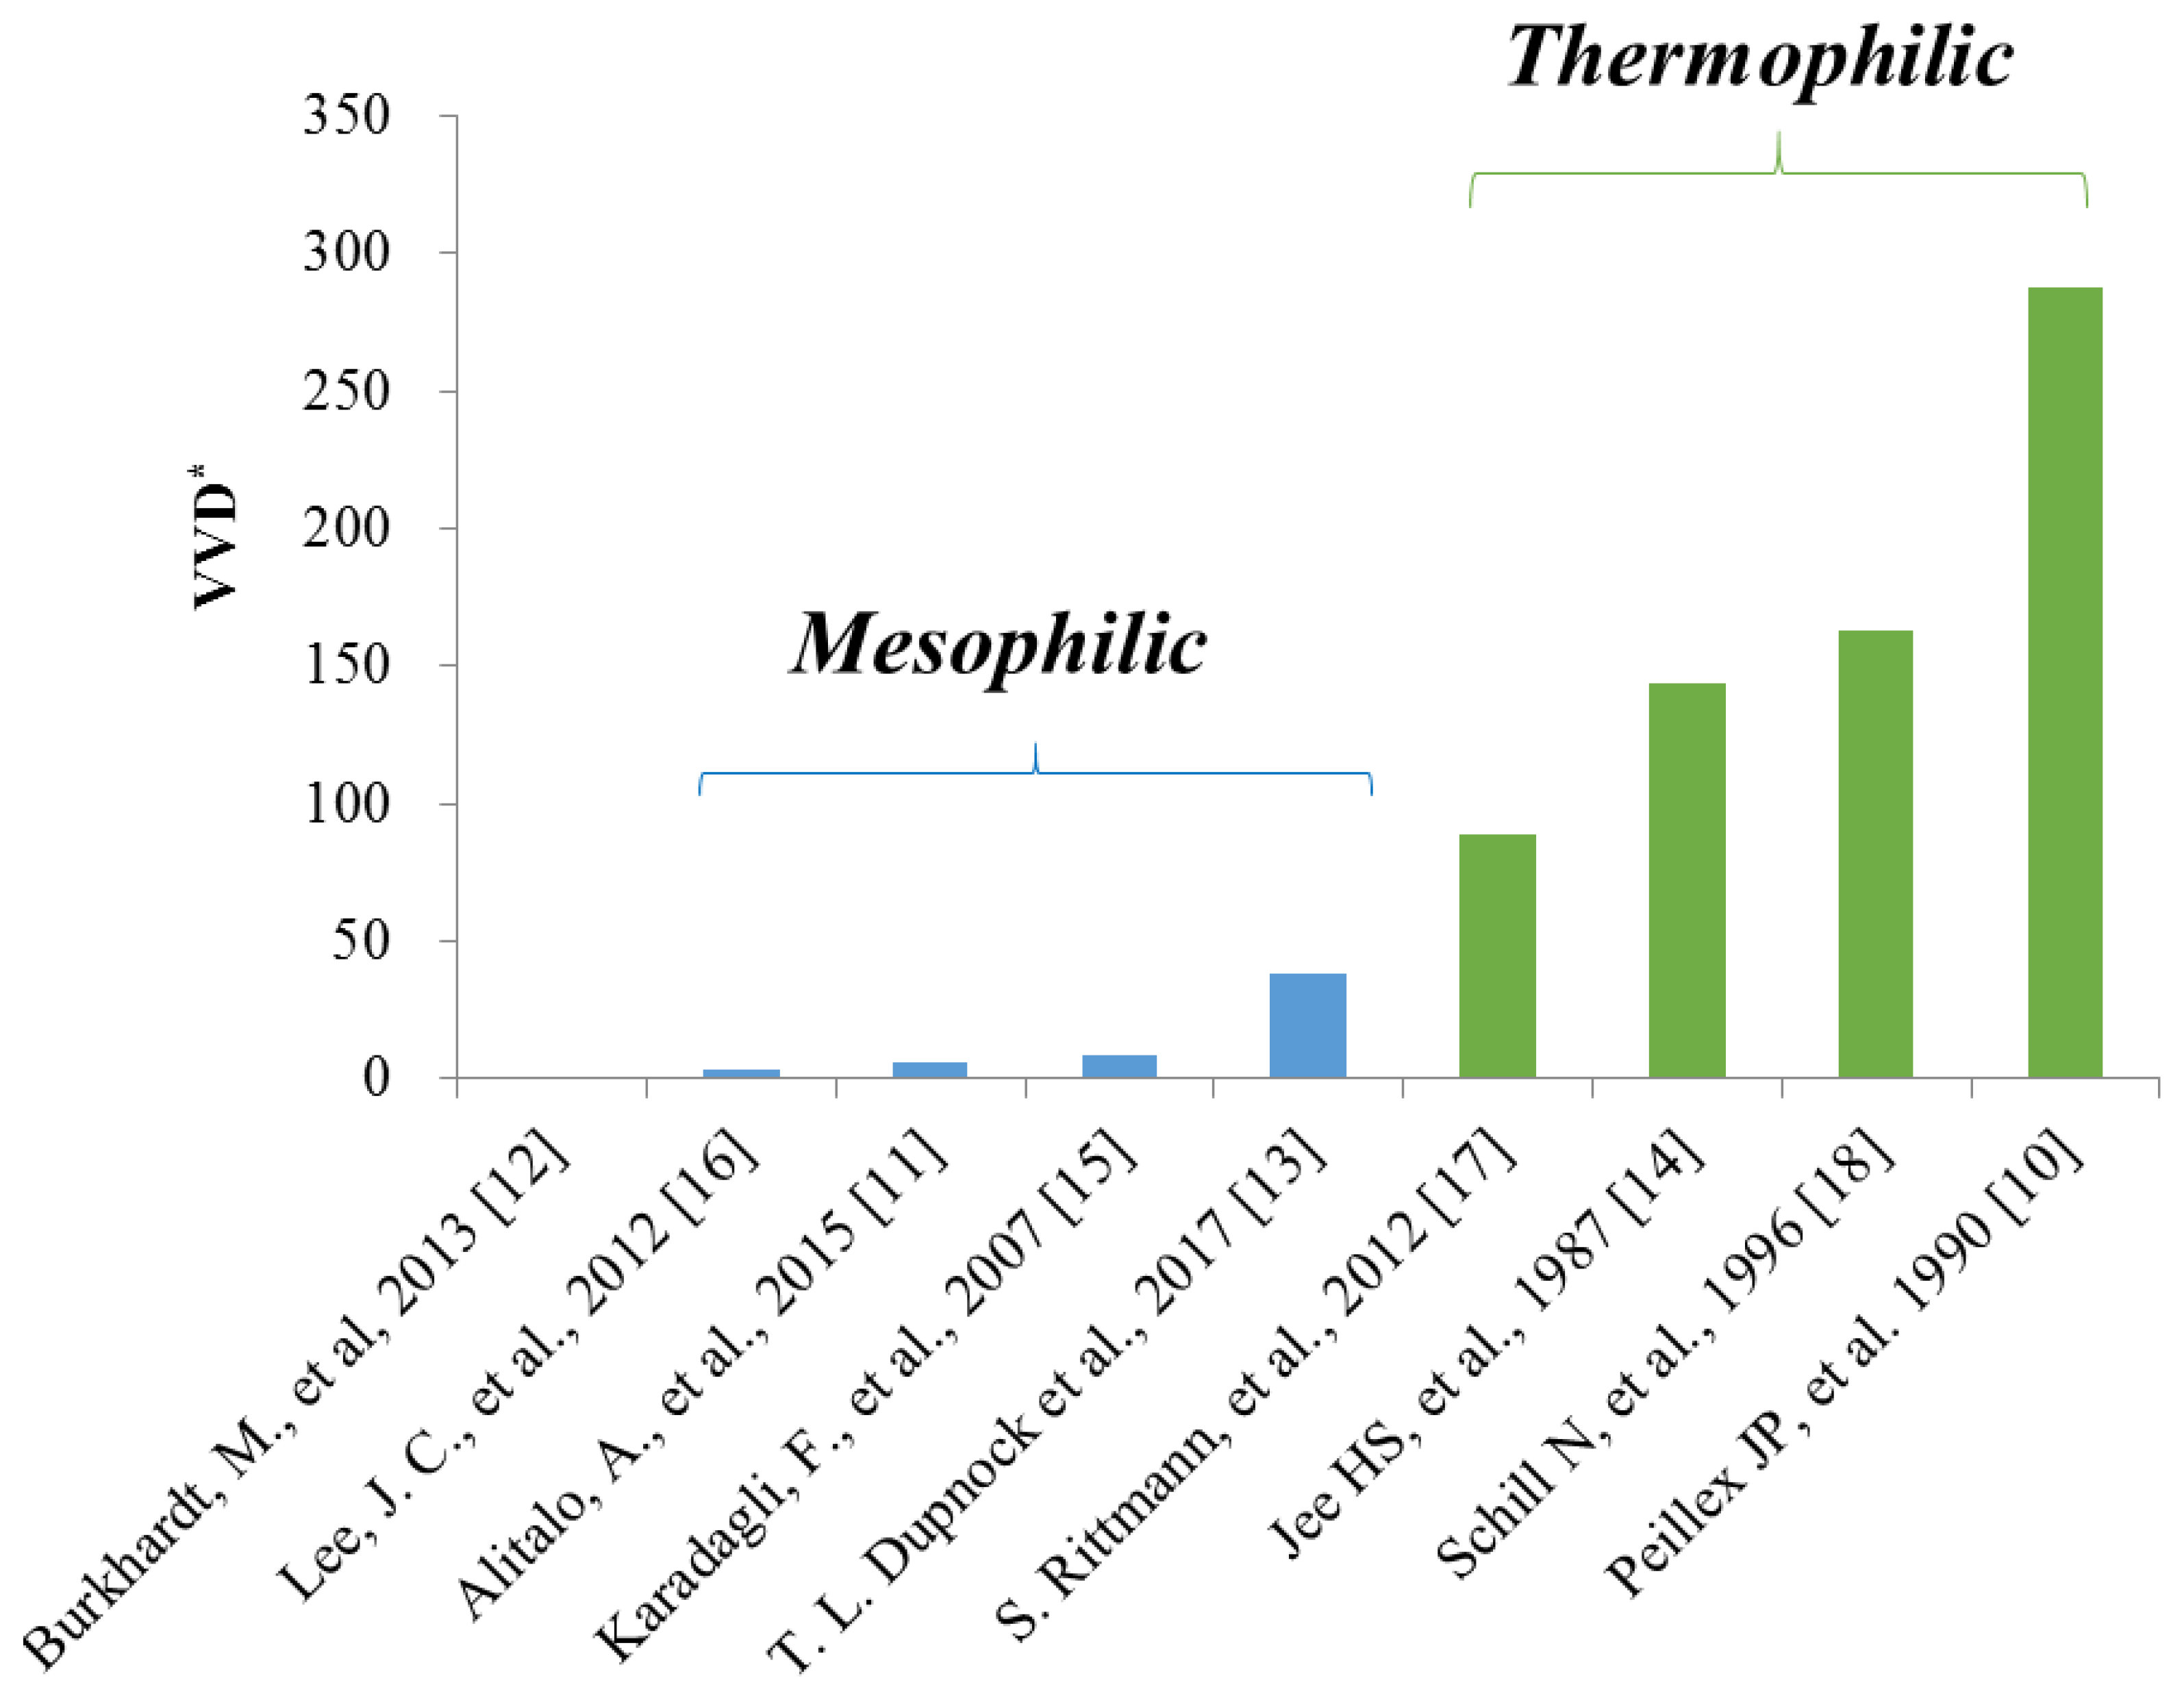
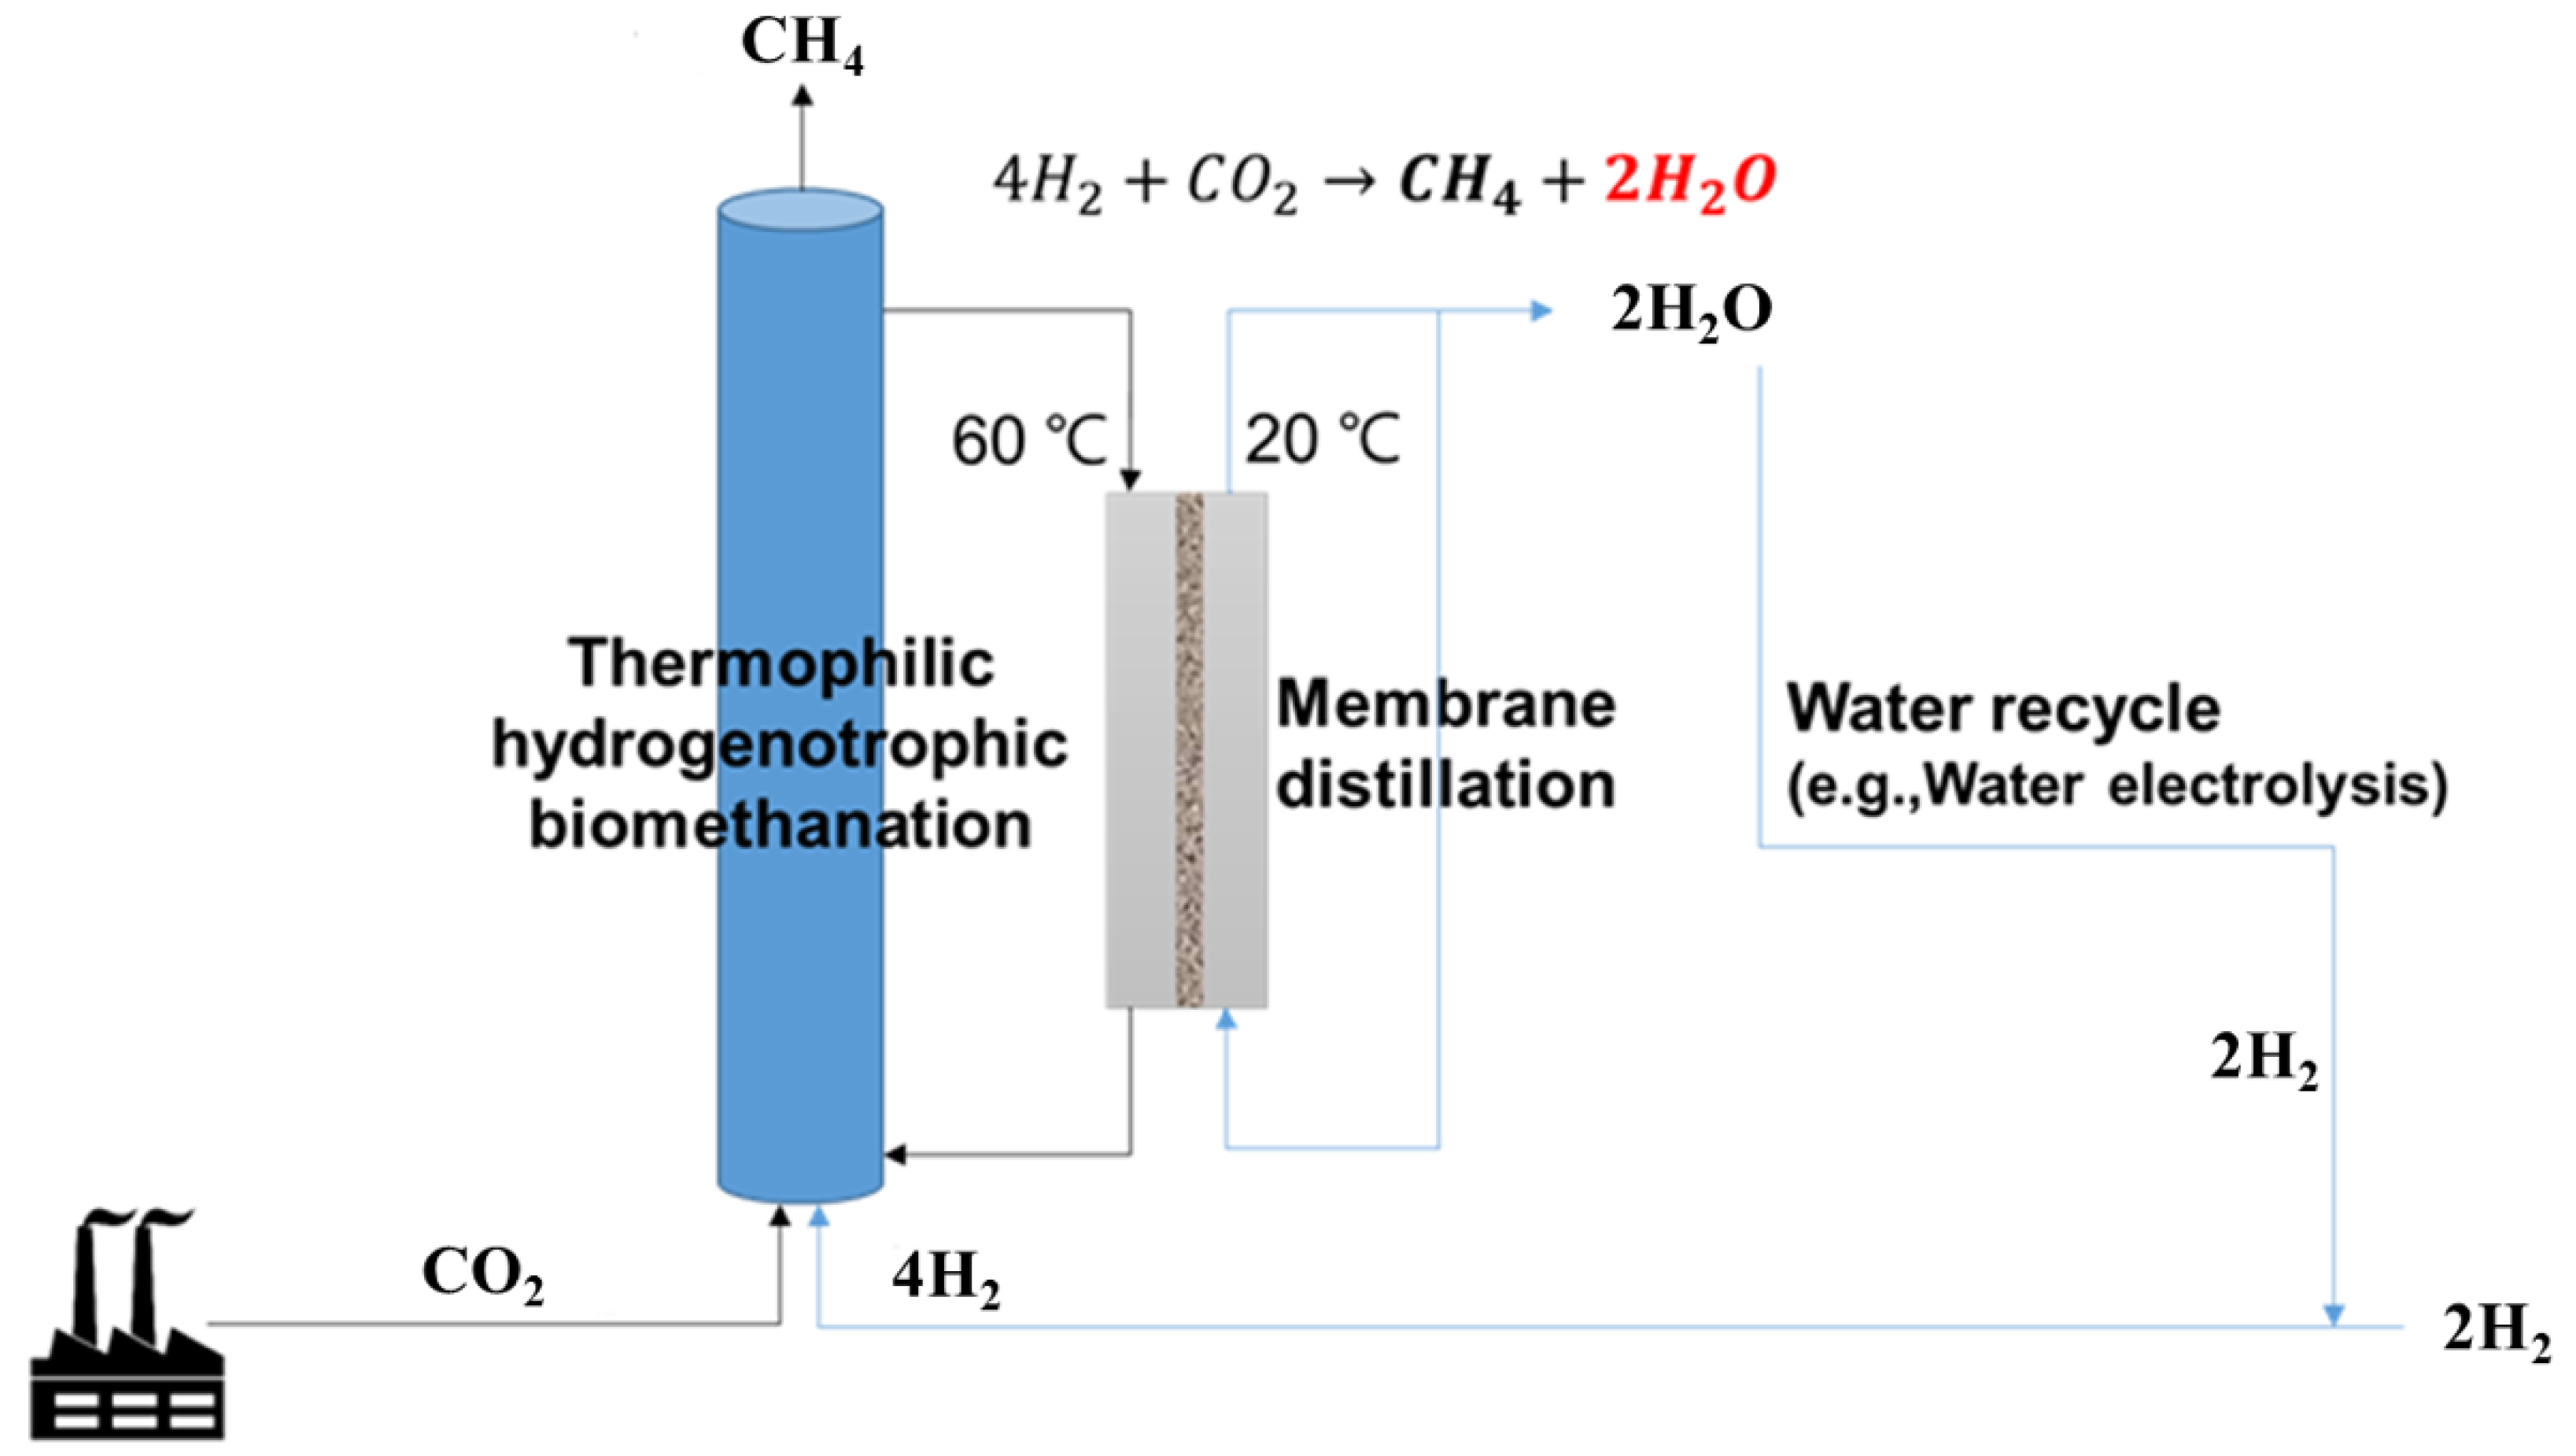
1. Introduction
2. Methods and Materials
2.1. Methanogen
2.2. Methanation Reactors
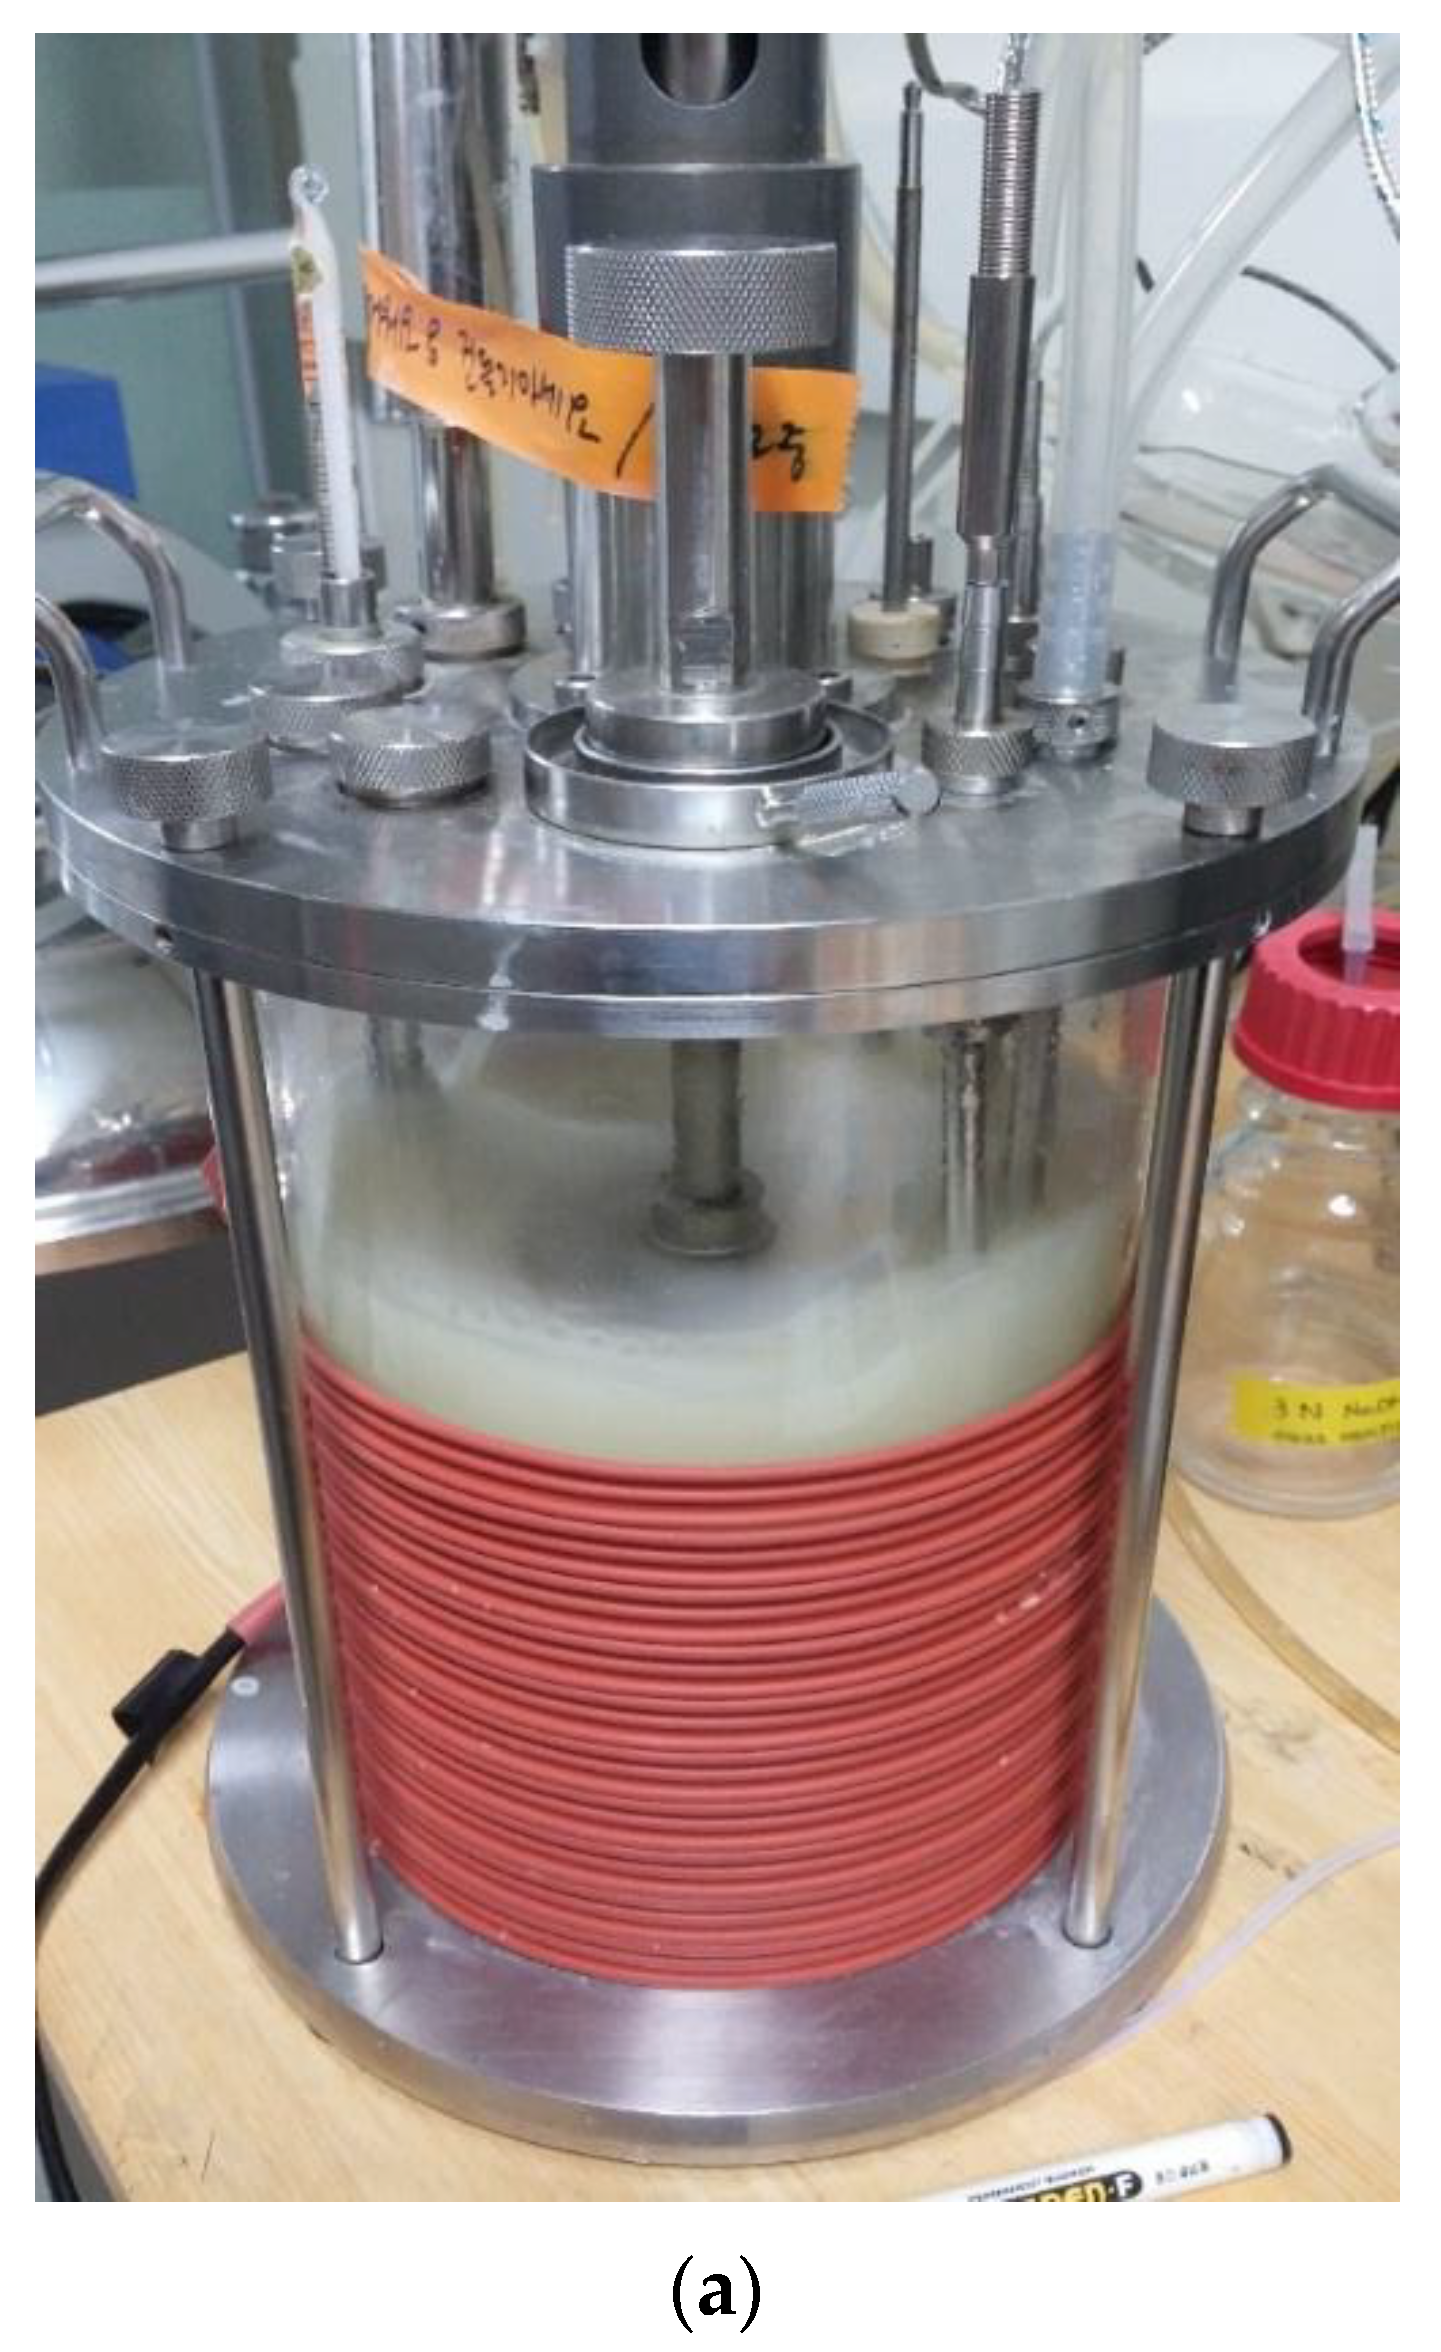
2.2.1. Stirred-Tank Reactor (ST)
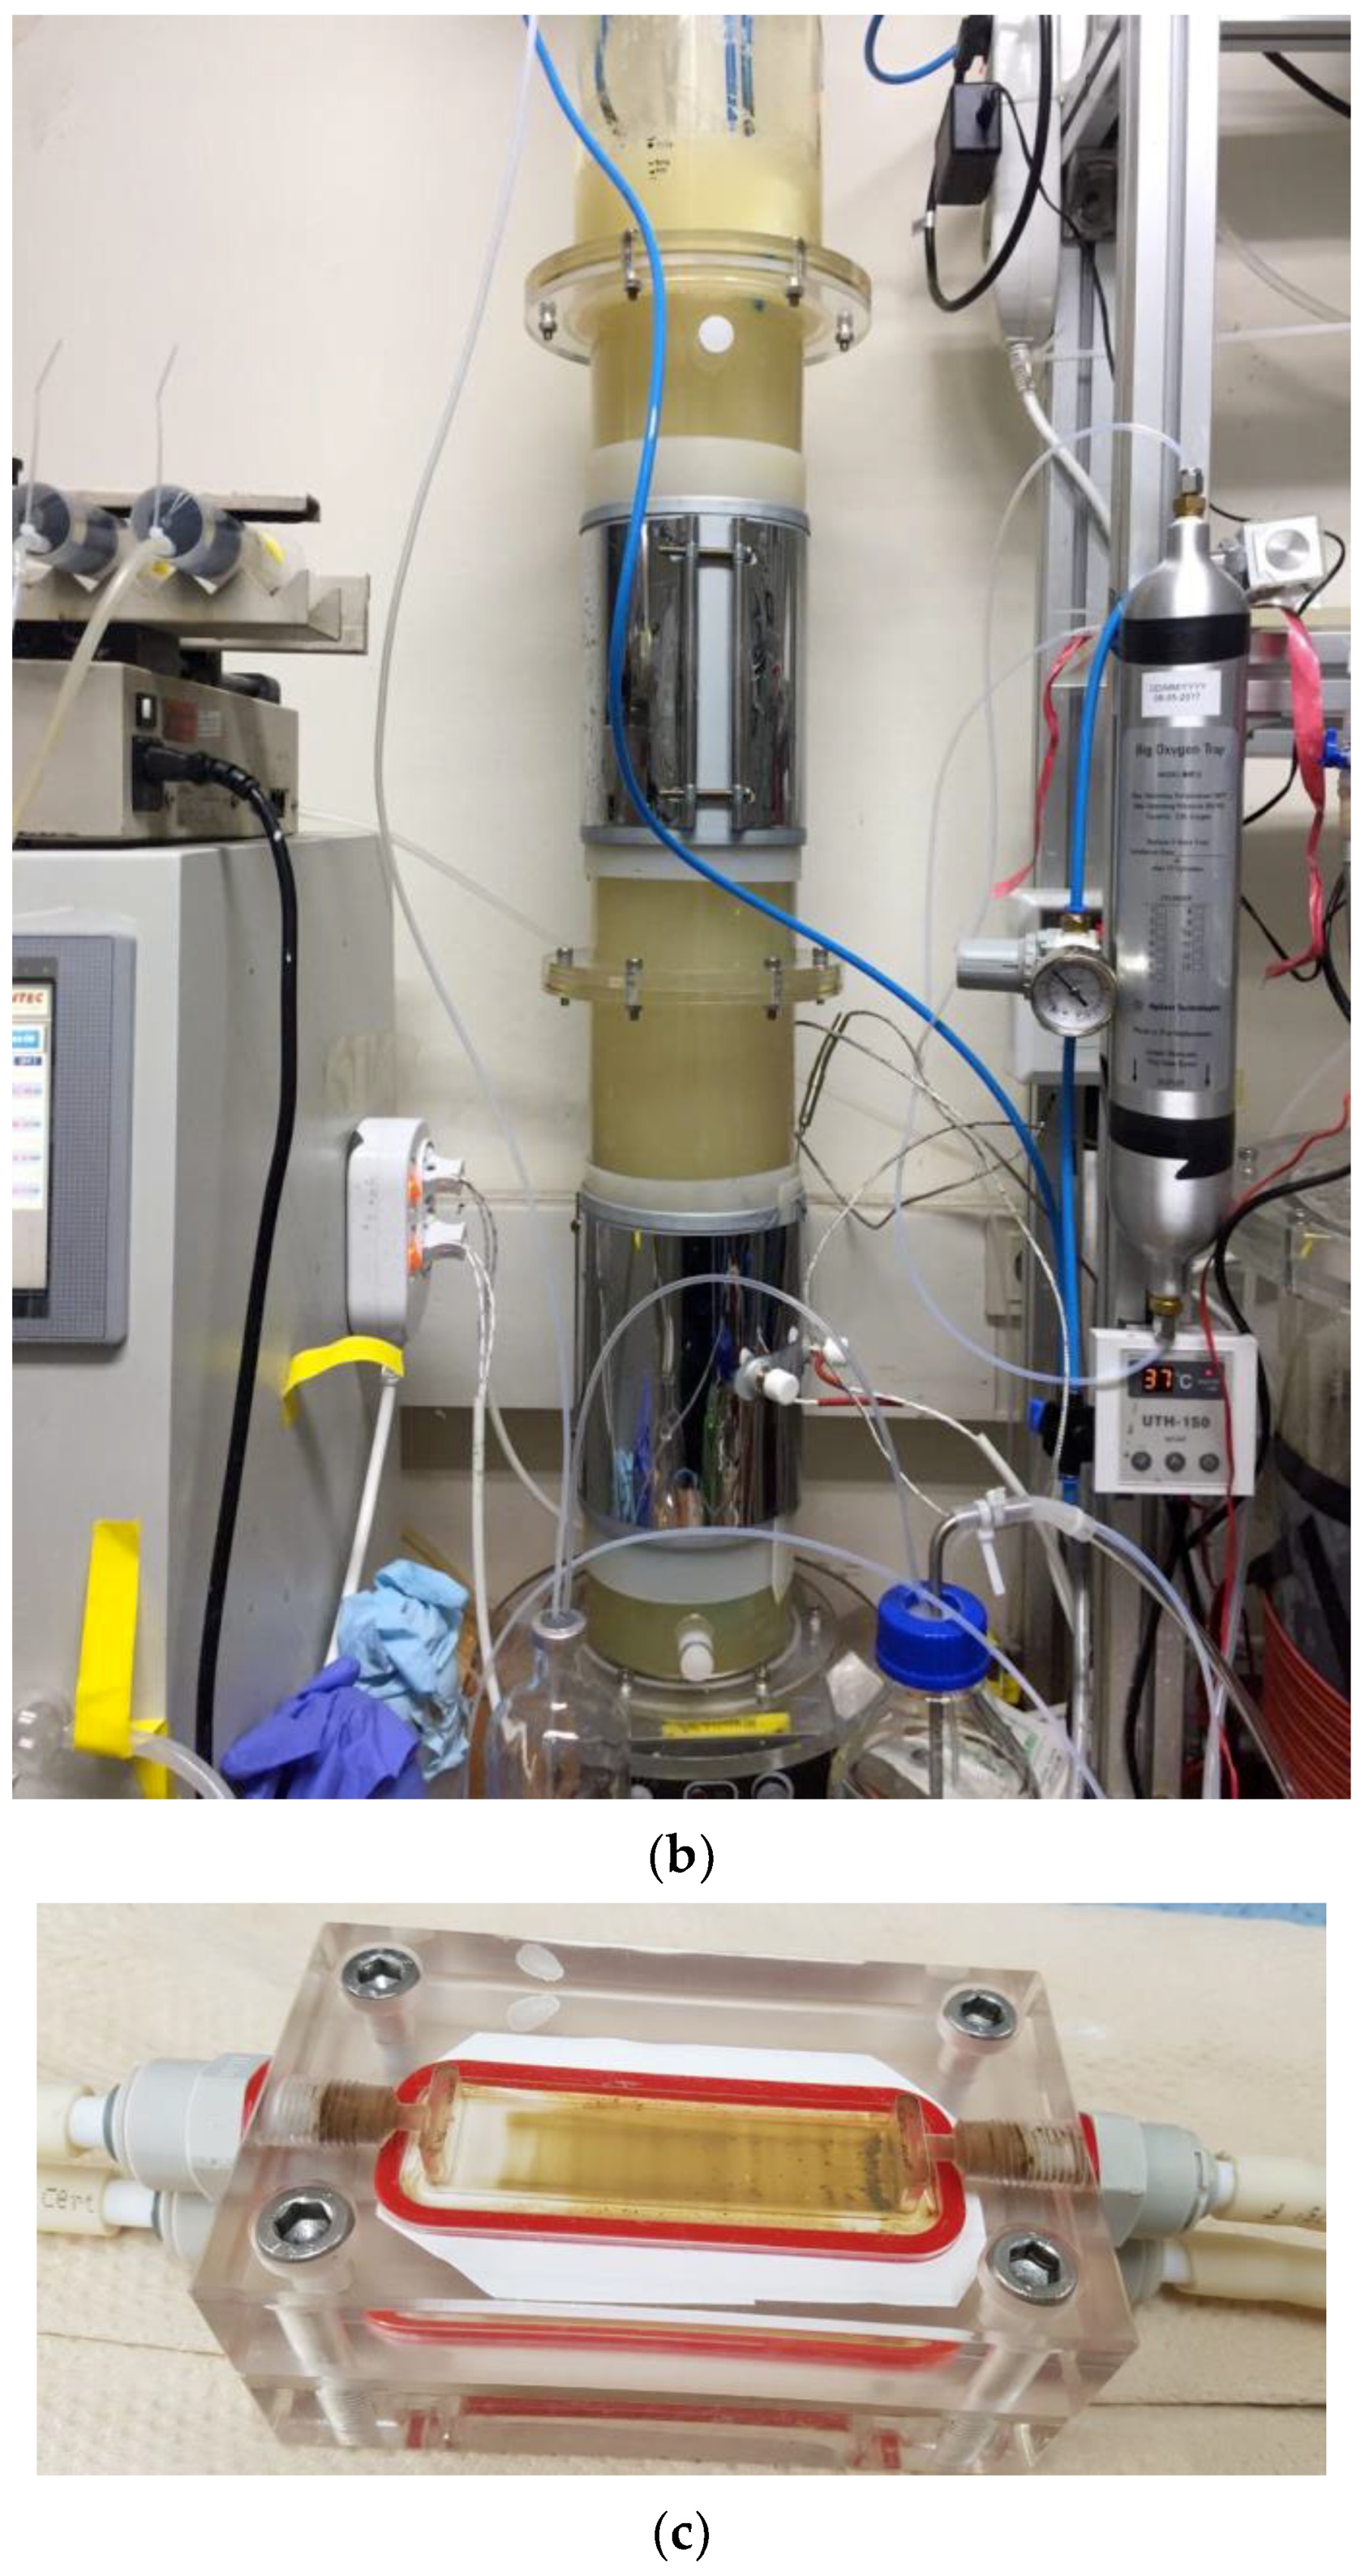
2.2.2. Bubble Column (BC)
2.3. Membrane Distillation
2.4. Monitoring and Experimental Analysis
3. Results and Discussion
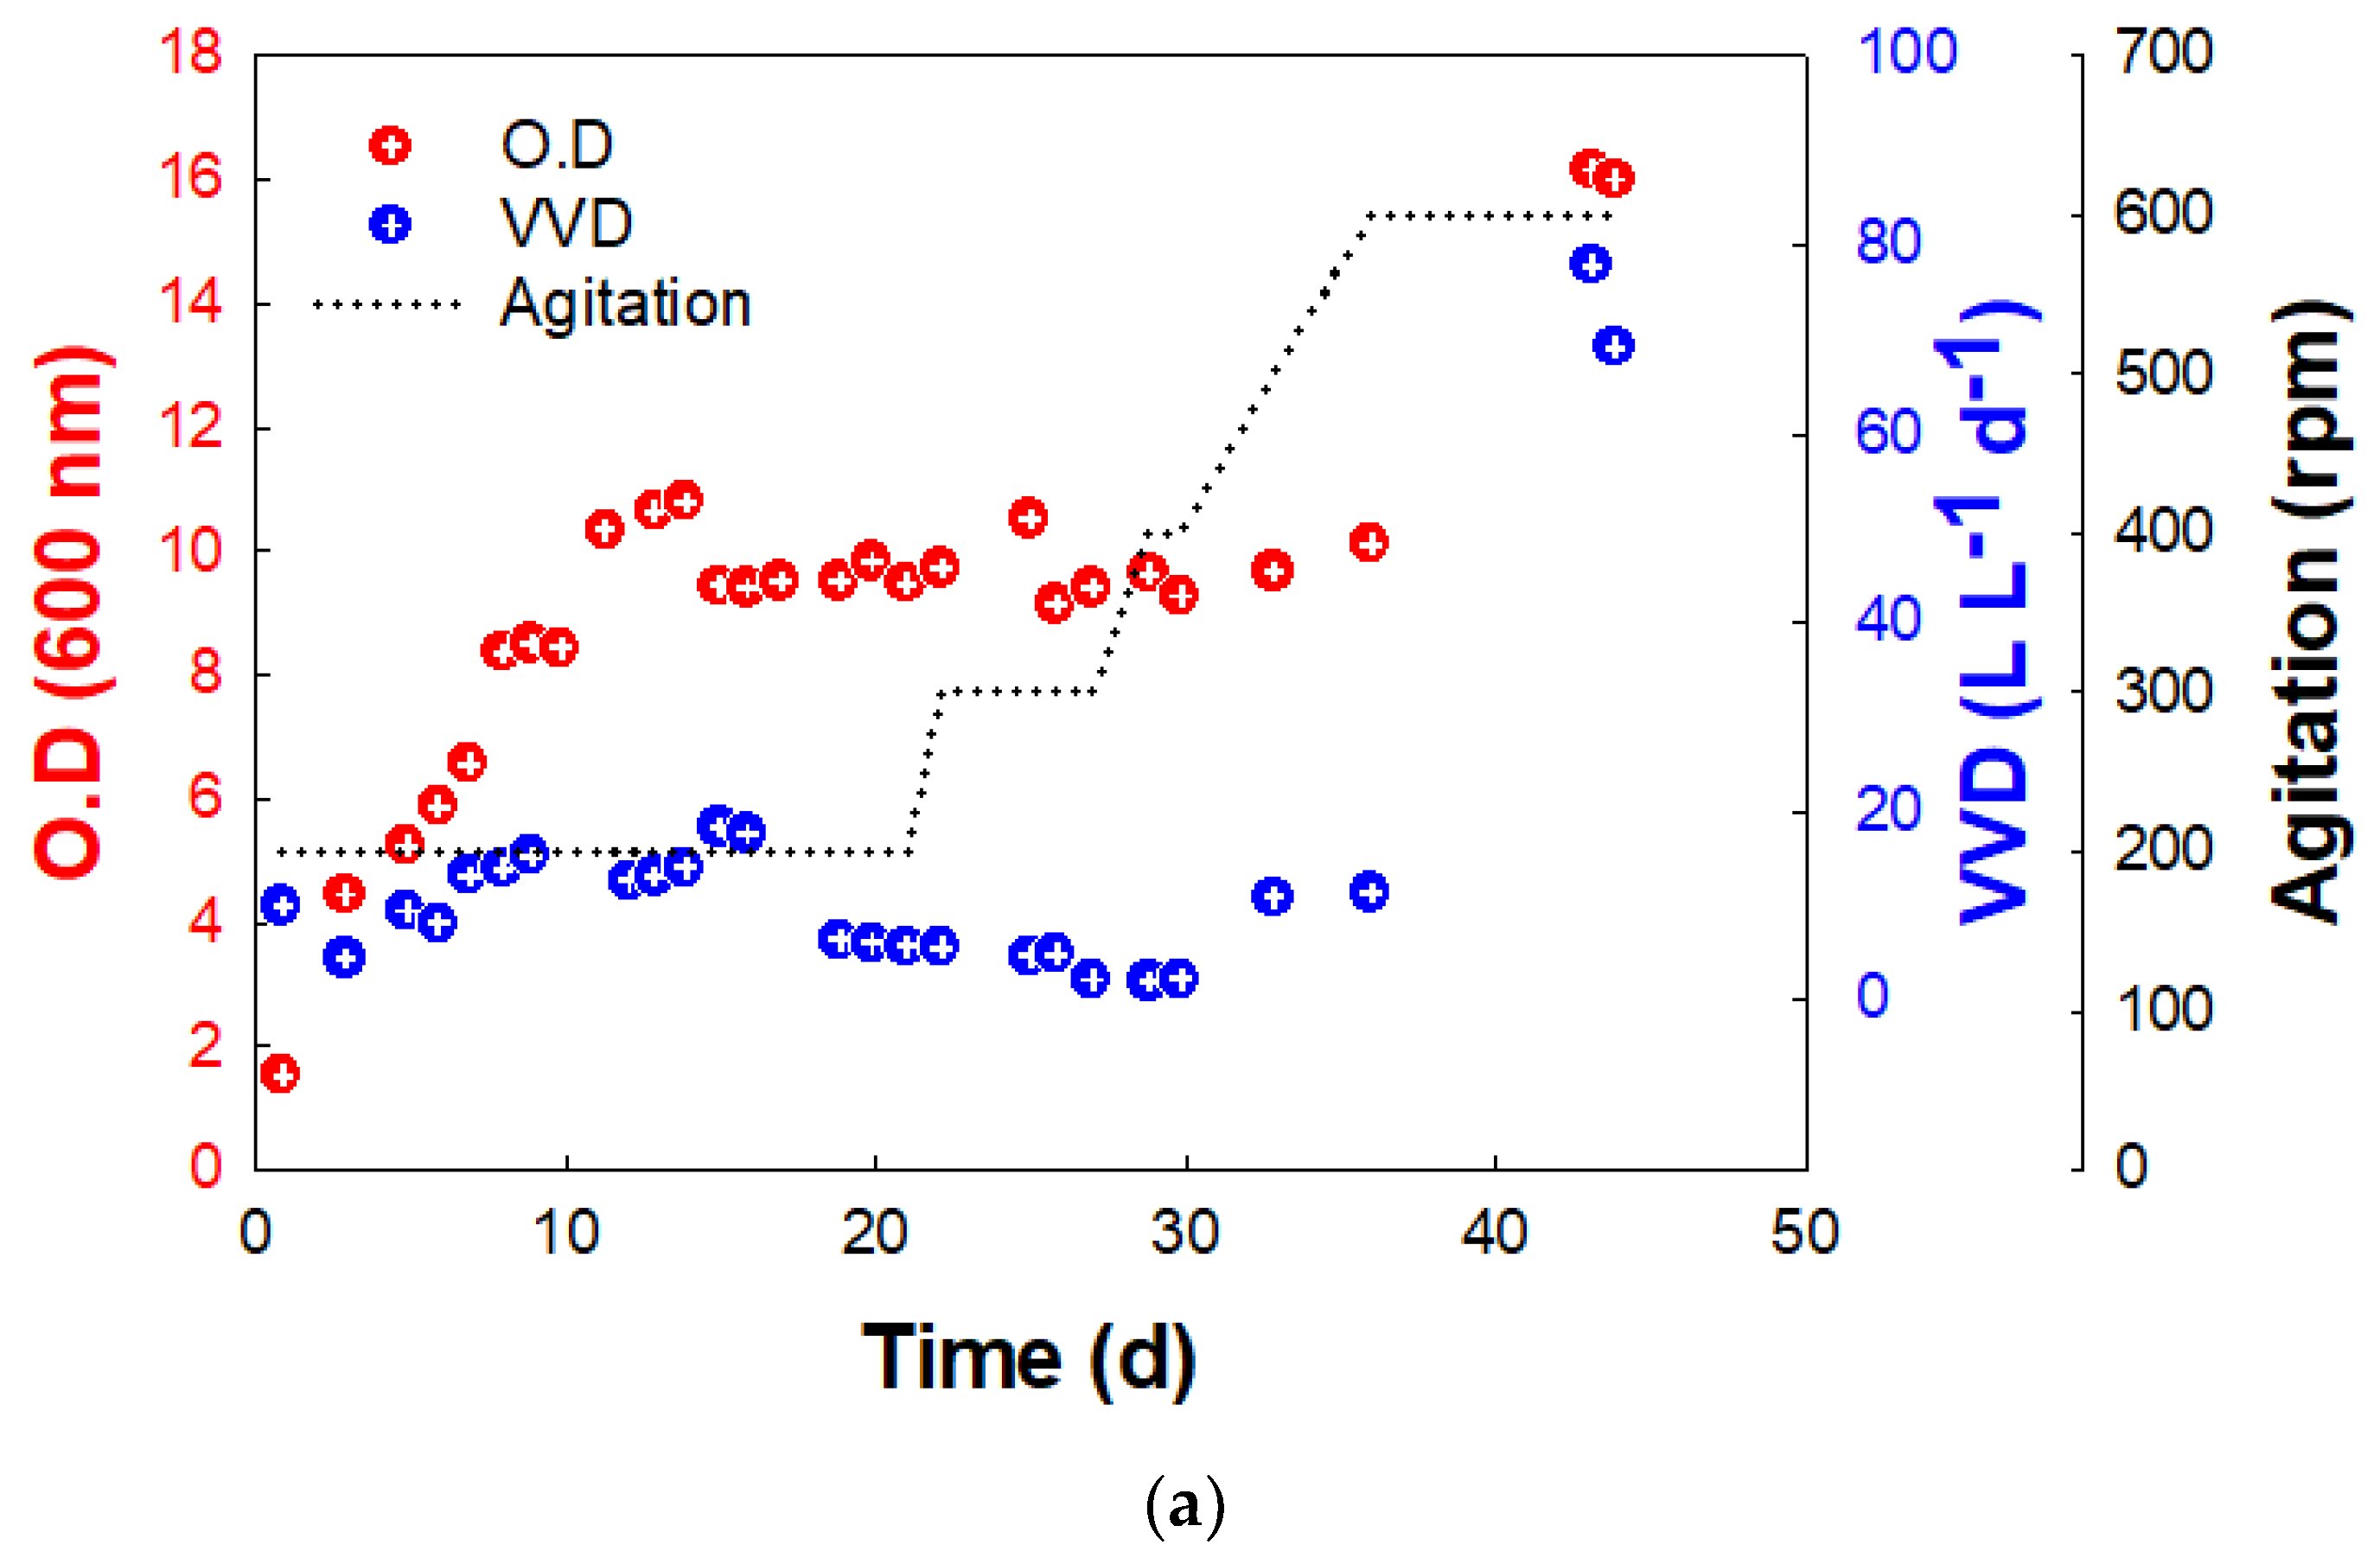
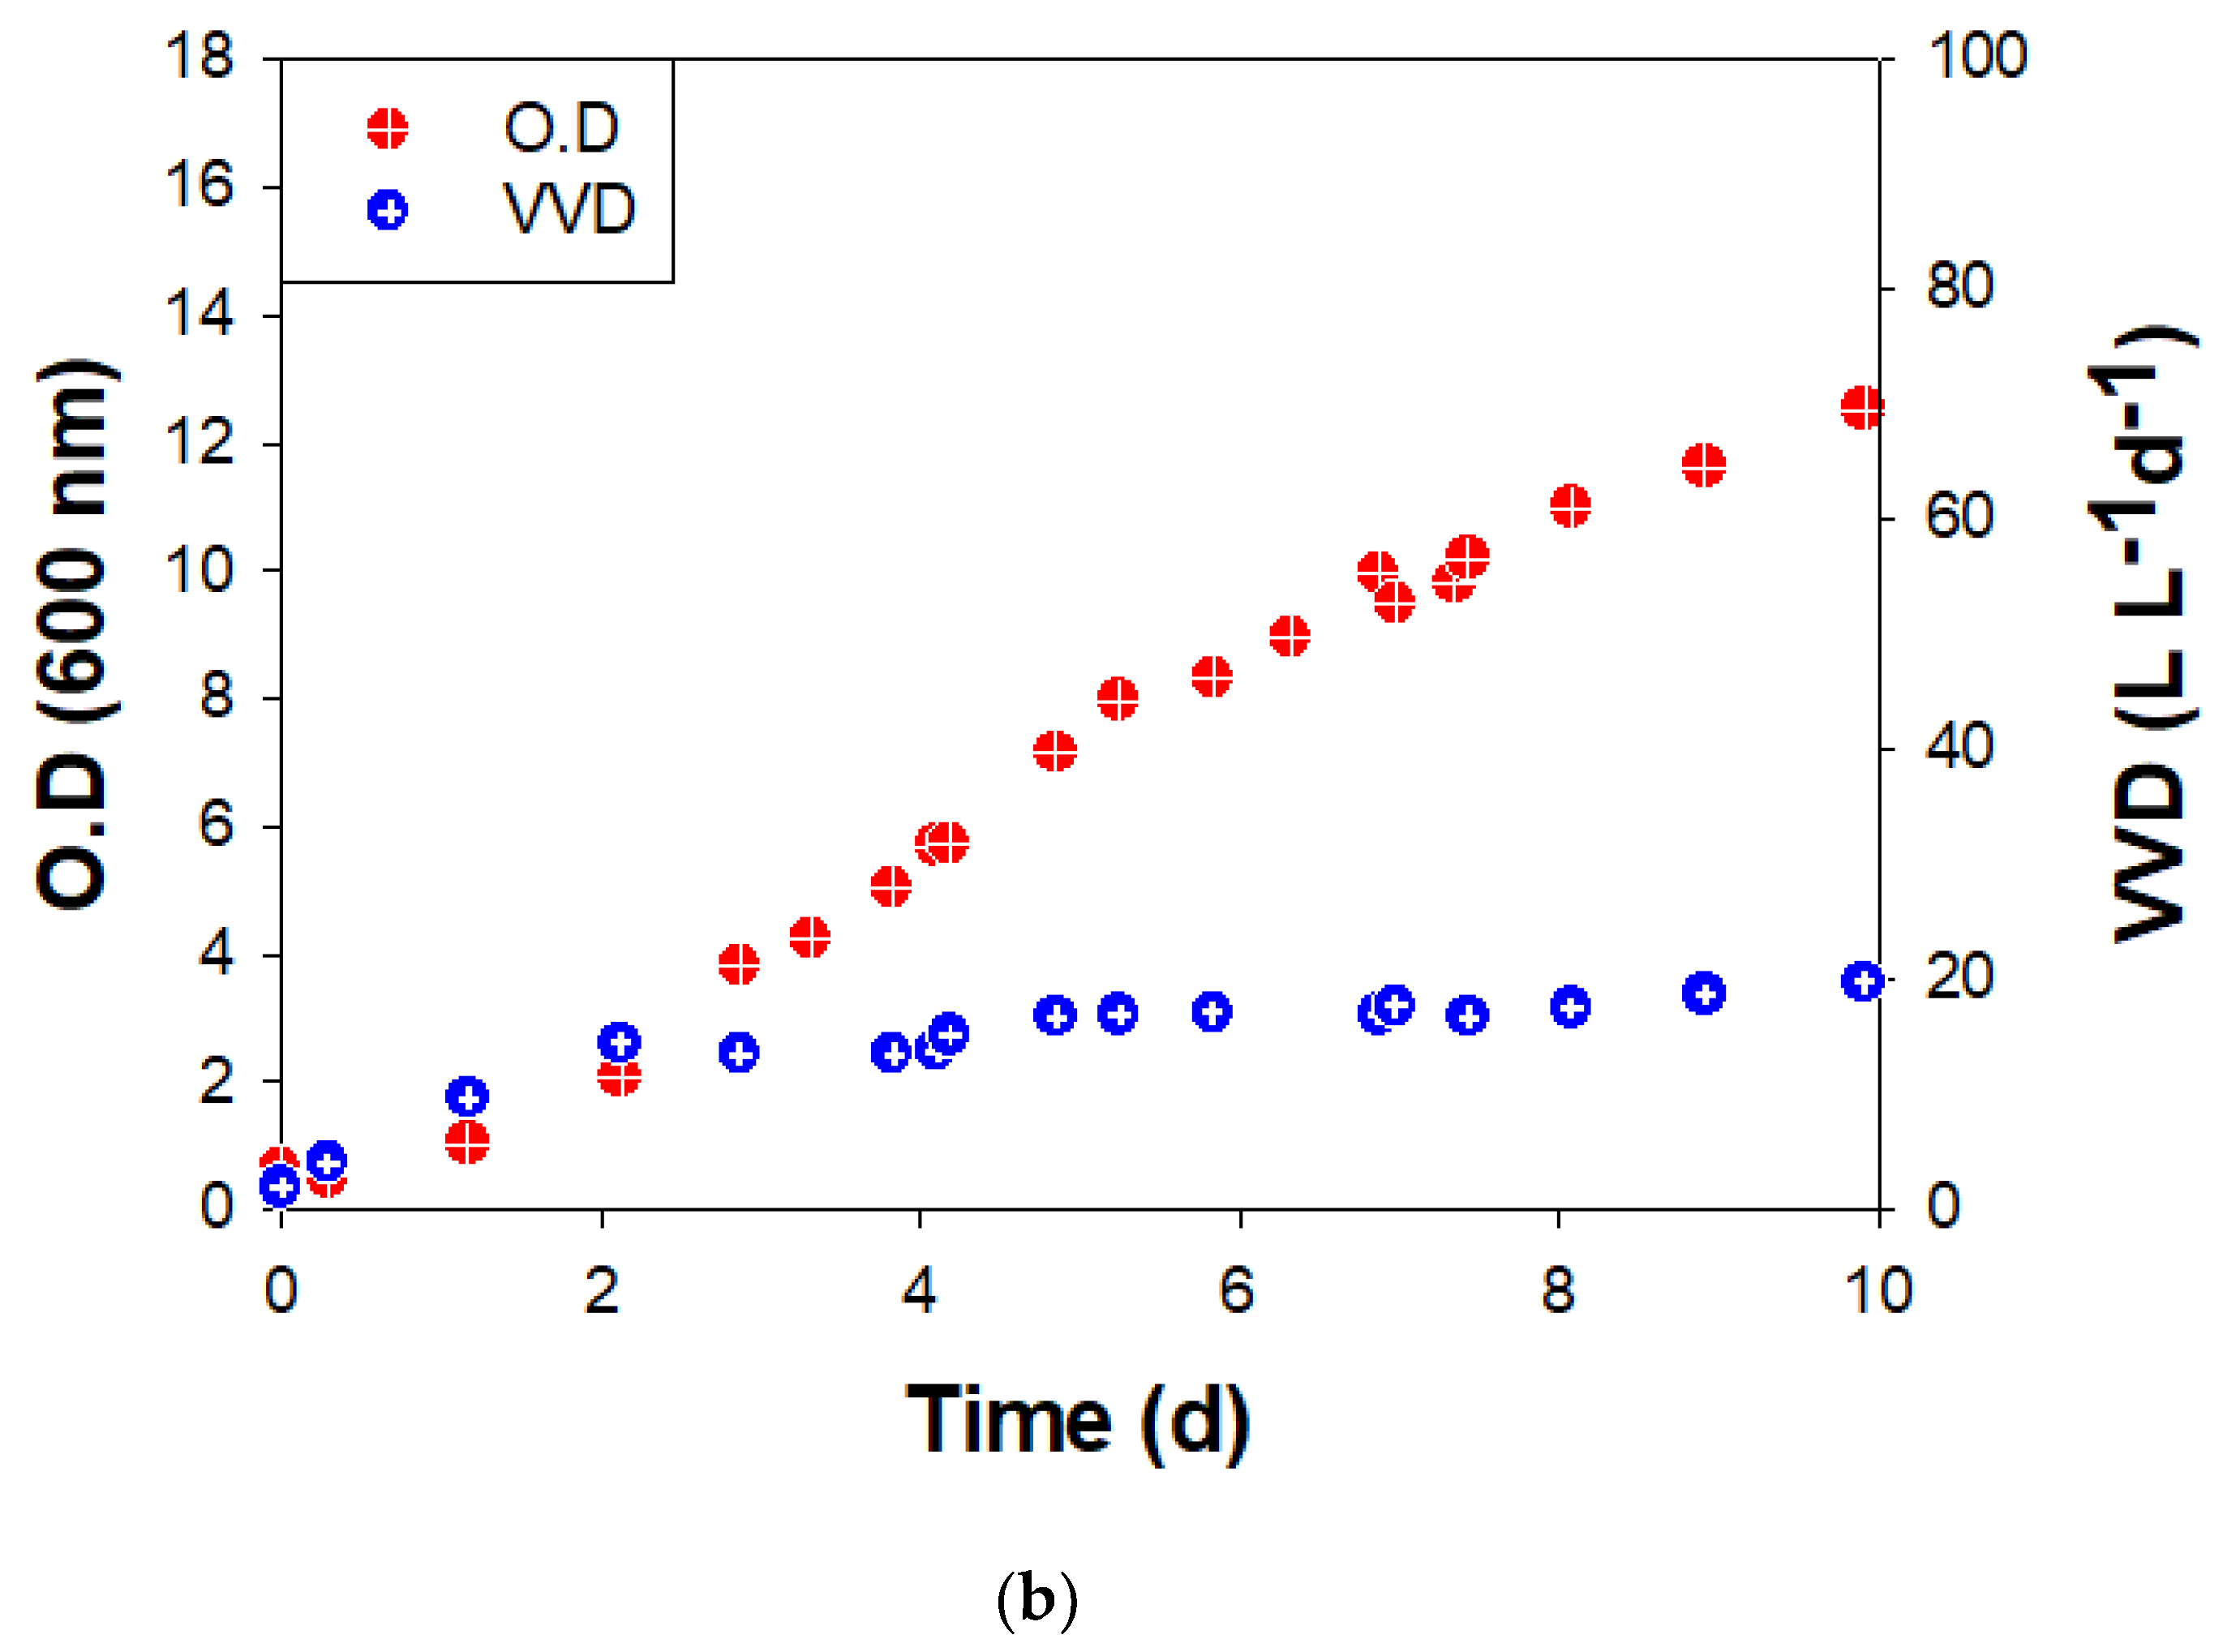
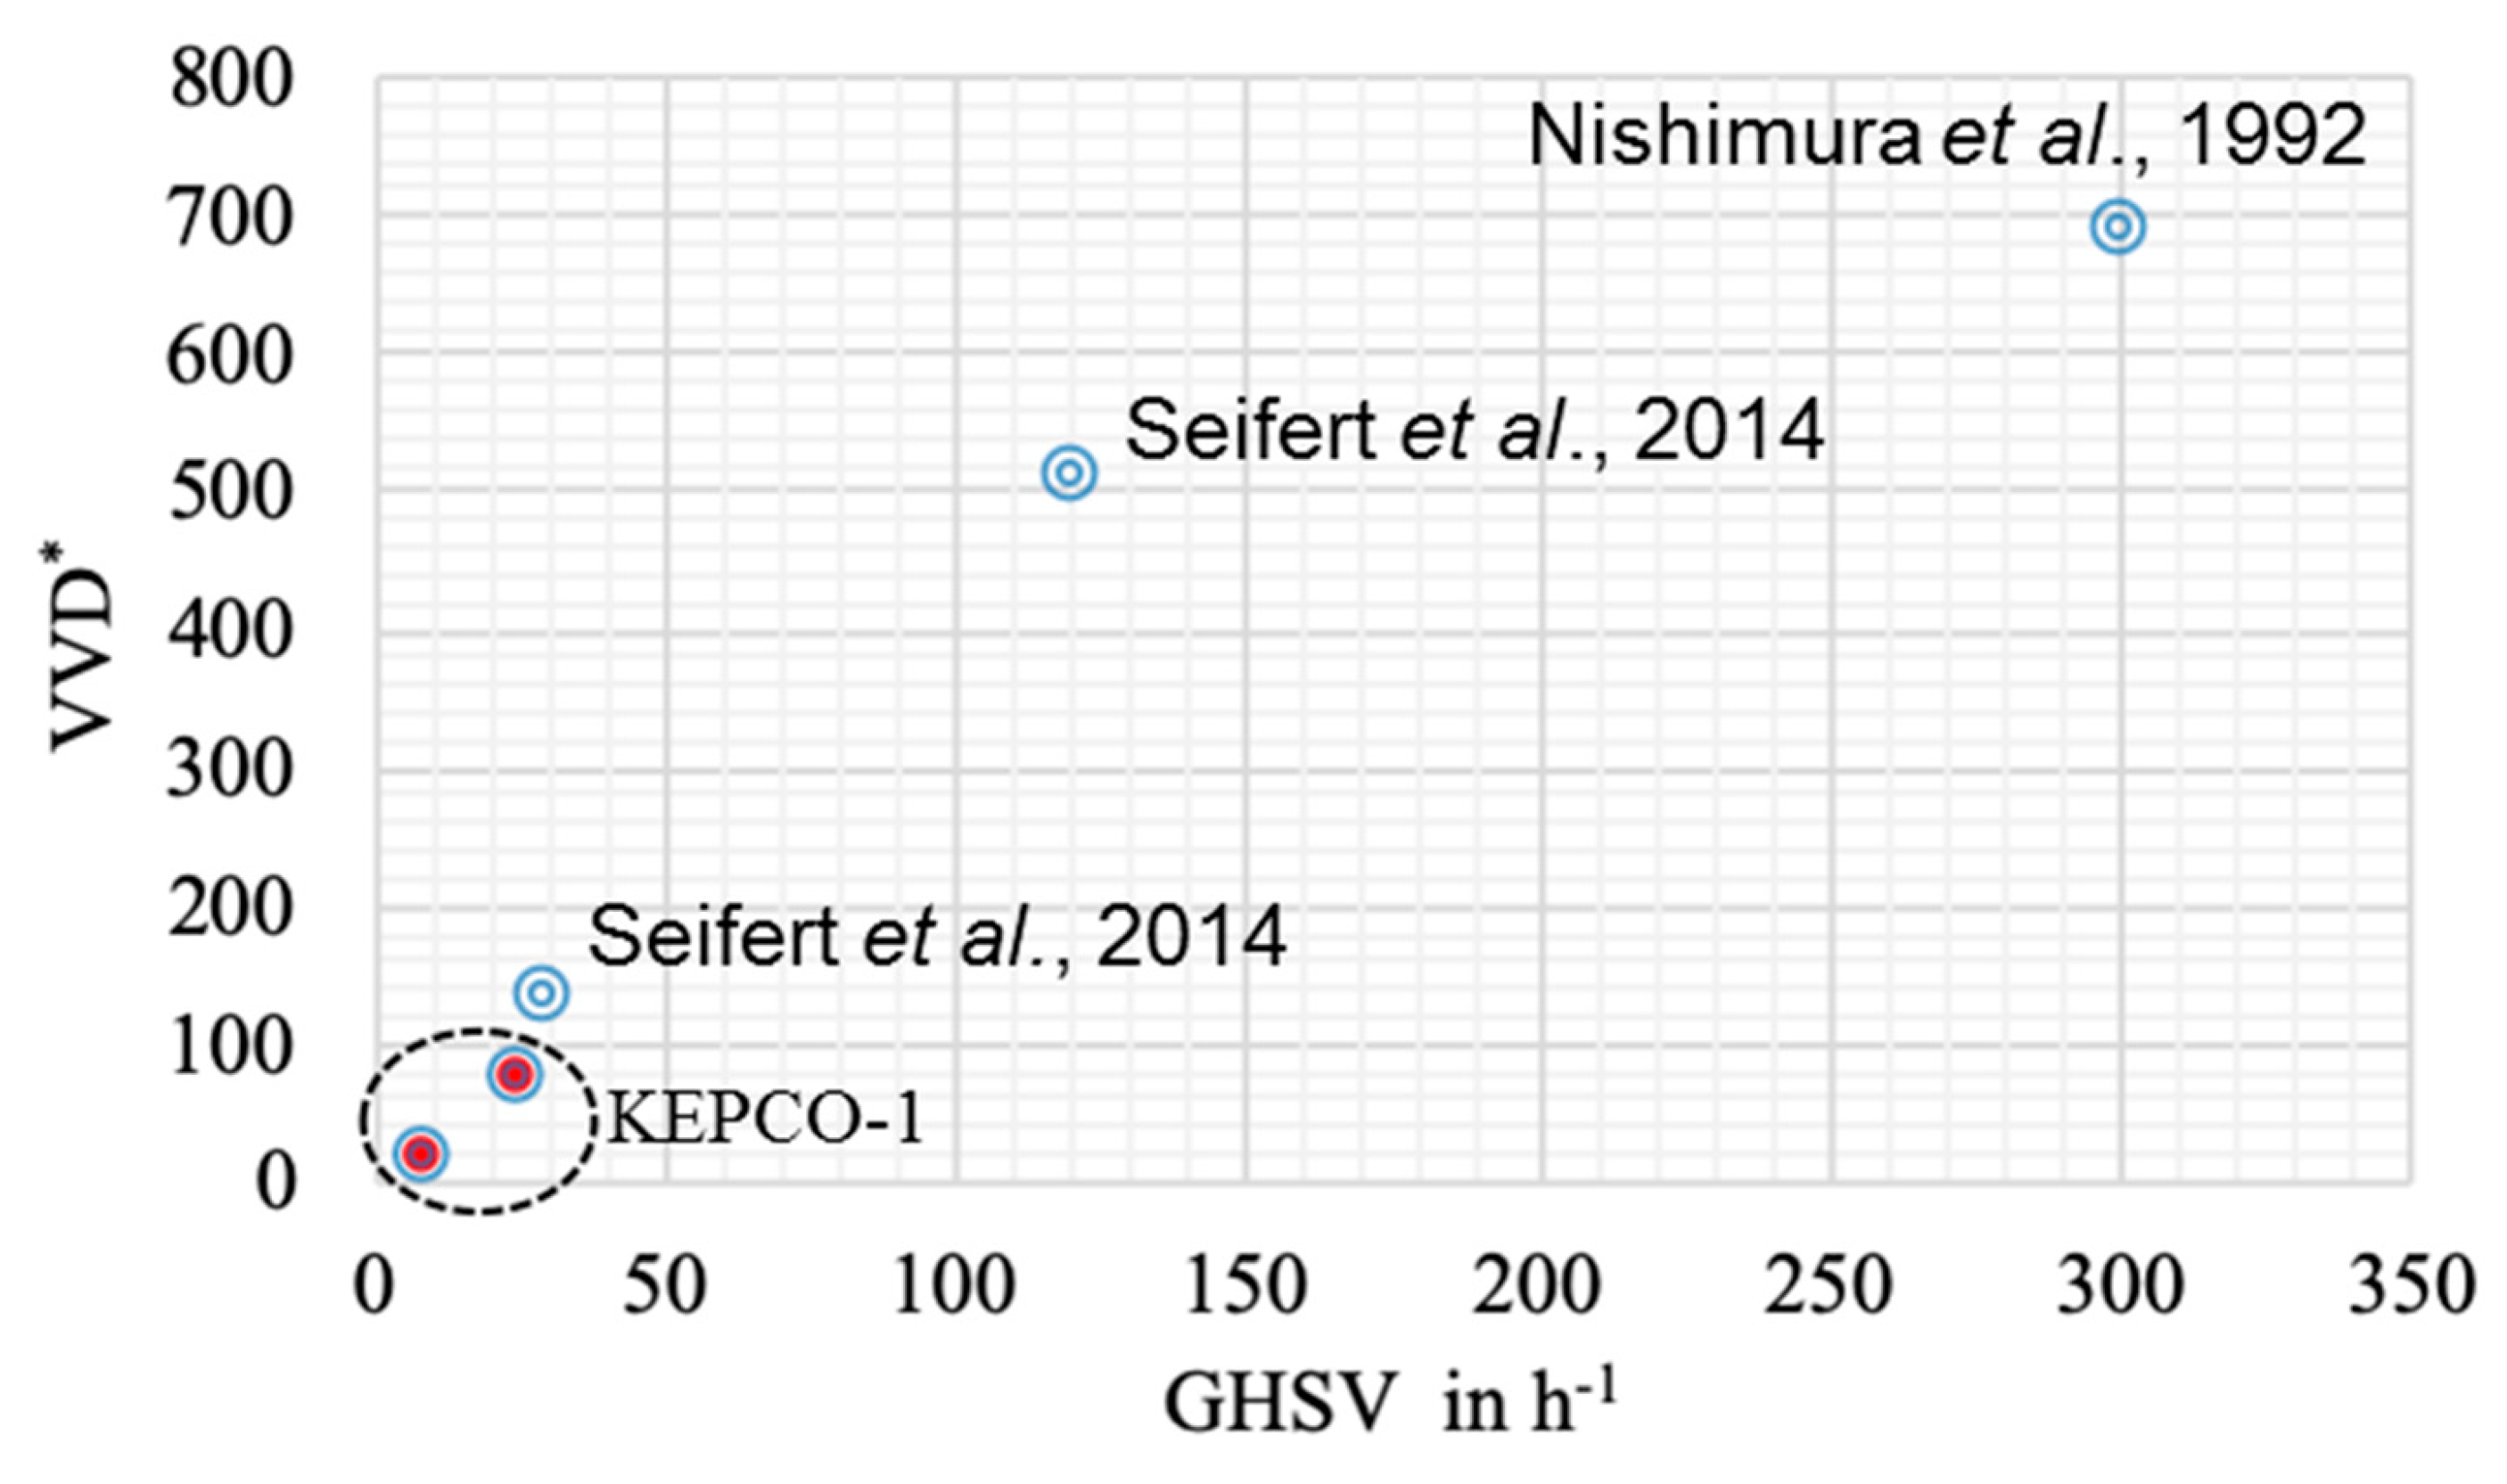
3.1. Methane Production in the ST and BC
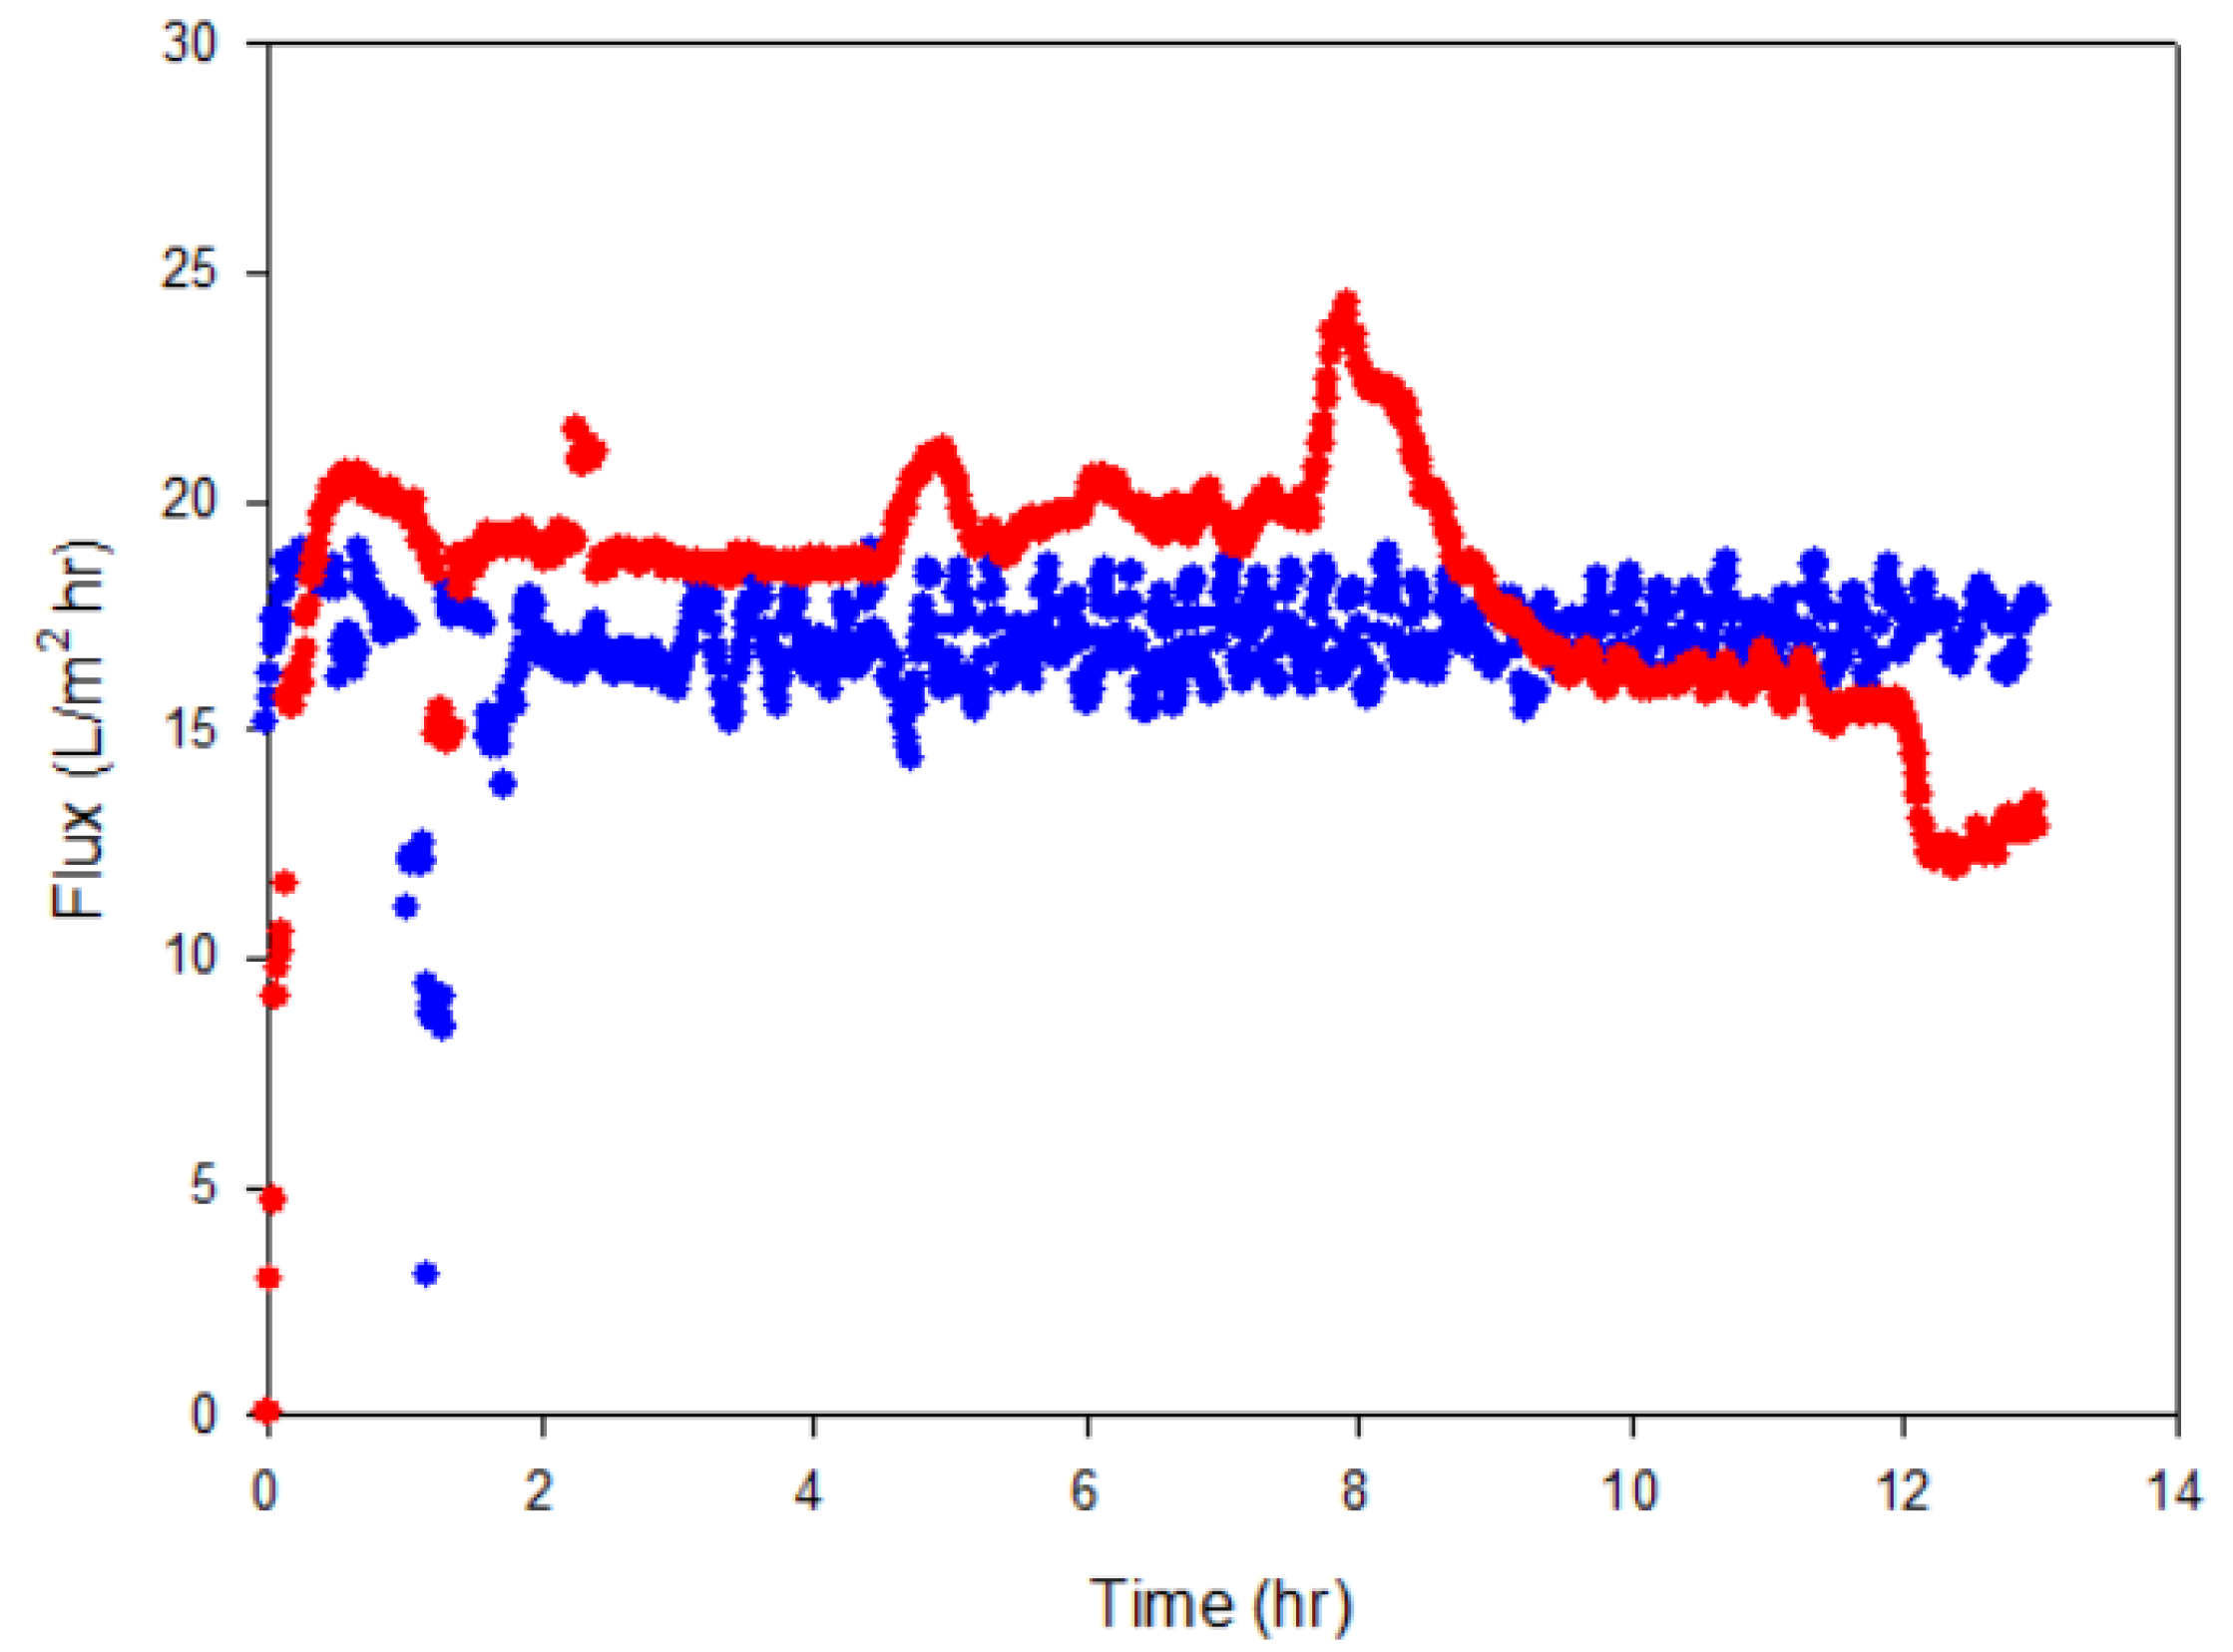
3.2. Water Generation and Removal from Reactors
4. Conclusions
Supplementary Materials
Author Contributions
Funding
Conflicts of Interest
Abbreviations
| MD | Membrane distillation |
| ST | Stirred-tank reactor |
| BC | Bubble column |
| PVDF | Polyvinylidene fluoride |
| VSS | Volatile suspended solid |
| MLVSS | Mixed liquor volatile suspended solid |
| VVD | Methane volume per working volume per day, L/L/d |
| GHSV | Gas hourly space velocity |
References
- Götz, M.; Lefebvre, J.; Mörs, F.; McDaniel Koch, A.; Graf, F.; Bajohr, S.; Reimert, R.; Kolb, T. Renewable Power-to-Gas: A technological and economic review. Renew. Energy 2016, 85, 1371–1390. [Google Scholar] [CrossRef]
- Götz, M.; McDaniel Koch, A.; Graf, F. State of the art and perspectives of CO2 methanation process concepts for power-to-gas applications. In Proceedings of the International Gas Union Research Conference (IGRC), Copenhagen, Denmark, 17–19 September 2014. [Google Scholar]
- Lindorfer, J.; Reiter, G.; Tichler, R.; Steinmüller, H. 14—Hydrogen fuel, fuel cells, and methane. In Managing Global Warming; Letcher, T.M., Ed.; Academic Press: Cambridge, MA, USA, 2019; pp. 419–453. [Google Scholar] [CrossRef]
- Ghaib, K.; Ben-Fares, F.-Z. Power-to-Methane: A state-of-the-art review. Renew. Sustain. Energy Rev. 2018, 81, 433–446. [Google Scholar] [CrossRef]
- Taubner, R.S.; Schleper, C.; Firneis, M.G.; Rittmann, S.K. Assessing the ecophysiology of methanogens in the context of recent astrobiological and planetological studies. Life 2015, 5, 1652–1686. [Google Scholar] [CrossRef] [PubMed]
- Pan, X.; Angelidaki, I.; Alvarado-Morales, M.; Liu, H.; Liu, Y.; Huang, X.; Zhu, G. Methane production from formate, acetate and H2/CO2; focusing on kinetics and microbial characterization. Bioresour. Technol. 2016, 218, 796–806. [Google Scholar] [CrossRef]
- Jabłoński, S.; Rodowicz, P.; Łukaszewicz, M. Methanogenic archaea database containing physiological and biochemical characteristics. Int. J. Syst. Evol. Microbiol. 2015, 65, 1360–1368. [Google Scholar] [CrossRef]
- Nishimura, N.; Kitaura, S.; Mimura, A.; Takahara, Y. Growth of thermophilic methanogen KN-15 on H2-CO2 under batch and continuous conditions. J. Ferment. Bioeng. 1991, 72, 280–284. [Google Scholar] [CrossRef]
- Nishimura, N.; Kitaura, S.; Mimura, A.; Takahara, Y. Cultivation of thermophilic methanogen KN-15 on H2-CO2 under pressurized conditions. J. Ferment. Bioeng. 1992, 73, 477–480. [Google Scholar] [CrossRef]
- Peillex, J.-P.; Fardeau, M.-L.; Belaich, J.-P. Growth of Methanobacterium thermoautotrophicum on on hydrogen-carbon dioxide: High methane productivities in continuous culture. Biomass 1990, 21, 315–321. [Google Scholar] [CrossRef]
- Alitalo, A.; Niskanen, M.; Aura, E. Biocatalytic methanation of hydrogen and carbon dioxide in a fixed bed bioreactor. Bioresour. Technol. 2015, 196, 600–605. [Google Scholar] [CrossRef]
- Burkhardt, M.; Busch, G. Methanation of hydrogen and carbon dioxide. Appl. Energy 2013, 111, 74–79. [Google Scholar] [CrossRef]
- Dupnock, T.L.; Deshusses, M.A. High-performance biogas upgrading using a biotrickling filter and hydrogenotrophic methanogens. Appl. Biochem. Biotechnol. 2017, 183, 488–502. [Google Scholar] [CrossRef] [PubMed]
- Jee, H.S.; Yano, T.; Nishio, N.; Nagai, S. Biomethanation of H2 and CO2 by Methanobacterium thermoautotrophicum in membrane and ceramic bioreactors. J. Ferment. Technol. 1987, 65, 413–418. [Google Scholar] [CrossRef]
- Karadagli, F.; Rittmann, B.E. Thermodynamic and kinetic analysis of the H2 threshold for Methanobacterium bryantii MoH. Biodegradation 2007, 18, 439–452. [Google Scholar] [CrossRef] [PubMed]
- Lee, J.C.; Kim, J.H.; Chang, W.S.; Pak, D. Biological conversion of CO2 to CH4 using hydrogenotrophic methanogen in a fixed bed reactor. J. Chem. Technol. Biotechnol. 2012, 87, 844–847. [Google Scholar] [CrossRef]
- Rittmann, S.; Seifert, A.; Herwig, C. Quantitative analysis of media dilution rate effects on Methanothermobacter marburgensis grown in continuous culture on H2 and CO2. Biomass Bioenergy 2012, 36, 293–301. [Google Scholar] [CrossRef]
- Schill, N.; Van Gulik, W.; Voisard, D.; Von Stockar, U. Continuous cultures limited by a gaseous substrate: Development of a simple, unstructured mathematical model and experimental verification with Methanobacterium thermoautotrophicum. Biotechnol. Bioeng. 1996, 51, 645–658. [Google Scholar] [CrossRef]
- Thauer, R.K.; Kaster, A.-K.; Seedorf, H.; Buckel, W.; Hedderich, R. Methanogenic archaea: Ecologically relevant differences in energy conservation. Nat. Rev. Microbiol. 2008, 6, 579. [Google Scholar] [CrossRef]
- Alklaibi, A.M.; Lior, N. Membrane-distillation desalination: Status and potential. Desalination 2005, 171, 111–131. [Google Scholar] [CrossRef]
- Hsu, S.T.; Cheng, K.T.; Chiou, J.S. Seawater desalination by direct contact membrane distillation. Desalination 2002, 143, 279–287. [Google Scholar] [CrossRef]
- Warsinger, D.M.; Swaminathan, J.; Guillen-Burrieza, E.; Arafat, H.A.; Lienhard, V.J.H. Scaling and fouling in membrane distillation for desalination applications: A review. Desalination 2015, 356, 294–313. [Google Scholar] [CrossRef]
- Gryta, M.; Tomaszewska, M.; Karakulski, K. Wastewater treatment by membrane distillation. Desalination 2006, 198, 67–73. [Google Scholar] [CrossRef]
- El-Abbassi, A.; Hafidi, A.; Khayet, M.; García-Payo, M. Integrated direct contact membrane distillation for olive mill wastewater treatment. Desalination 2013, 323, 31–38. [Google Scholar] [CrossRef]
- Gryta, M.; Tomaszewska, M.; Grzechulska, J.; Morawski, A. Membrane distillation of NaCl solution containing natural organic matter. J. Membr. Sci. 2001, 181, 279–287. [Google Scholar] [CrossRef]
- Alkhudhiri, A.; Darwish, N.; Hilal, N. Membrane distillation: A comprehensive review. Desalination 2012, 287, 2–18. [Google Scholar] [CrossRef]
- Park, S.-M.; Lee, S. Influence of Hydraulic Pressure on Performance Deterioration of Direct Contact Membrane Distillation (DCMD) Process. Membranes (Basel) 2019, 9, 37. [Google Scholar] [CrossRef] [PubMed]
- Cho, H.; Choi, Y.-J.; Lee, S.; Koo, J.; Huang, T. Comparison of hollow fiber membranes in direct contact and air gap membrane distillation (MD). Desalin. Water Treat. 2016, 57, 10012–10019. [Google Scholar] [CrossRef]
- Liu, Y.; Wang, Y.; Wen, X.; Shimizu, K.; Lei, Z.; Kobayashi, M.; Zhang, Z.; Sumi, I.; Yao, Y.; Mogi, Y. Enhanced bioconversion of hydrogen and carbon dioxide to methane using a micro-nano sparger system: Mass balance and energy consumption. RSC Adv. 2018, 8, 26488–26496. [Google Scholar] [CrossRef]
- Martin, M.R.; Fornero, J.J.; Stark, R.; Mets, L.; Angenent, L.T. A single-culture bioprocess of Methanothermobacter thermautotrophicus to upgrade digester biogas by CO2-to-CH4 Conversion with H2. Archaea 2013, 2013, 11. [Google Scholar] [CrossRef]
- Seifert, A.H.; Rittmann, S.; Herwig, C. Analysis of process related factors to increase volumetric productivity and quality of biomethane with Methanothermobacter marburgensis. Appl. Energy 2014, 132, 155–162. [Google Scholar] [CrossRef]
- Braga, A.; Mesquita, D.P.; Amaral, A.L.; Ferreira, E.C.; Belo, I. Aroma production by Yarrowia lipolytica in airlift and stirred tank bioreactors: Differences in yeast metabolism and morphology. Biochem. Eng. J. 2015, 93, 55–62. [Google Scholar] [CrossRef]
- Garcia-Ochoa, F.; Gomez, E. Prediction of gas-liquid mass transfer coefficient in sparged stirred tank bioreactors. Biotechnol. Bioeng. 2005, 92, 761–772. [Google Scholar] [CrossRef] [PubMed]
- Garcia-Ochoa, F.; Gomez, E. Bioreactor scale-up and oxygen transfer rate in microbial processes: An overview. Biotechnol. Adv. 2009, 27, 153–176. [Google Scholar] [CrossRef] [PubMed]
- Borgschulte, A.; Gallandat, N.; Probst, B.; Suter, R.; Callini, E.; Ferri, D.; Arroyo, Y.; Erni, R.; Geerlings, H.; Züttel, A. Sorption enhanced CO2 methanation. Phys. Chem. Chem. Phys. 2013, 15, 9620–9625. [Google Scholar] [CrossRef] [PubMed]
- Walspurger, S.; Elzinga, G.D.; Dijkstra, J.W.; Sarić, M.; Haije, W.G. Sorption enhanced methanation for substitute natural gas production: Experimental results and thermodynamic considerations. Chem. Eng. J. 2014, 242, 379–386. [Google Scholar] [CrossRef]
- Gerhard, E.; Butsch, B.M.; Marison, I.W.; von Stockar, U. Improved growth and methane production conditions for Methanobacterium thermoautotrophicum. Appl. Microbiol. Biotechnol. 1993, 40, 432–437. [Google Scholar] [CrossRef]
- Macedonio, F.; Ali, A.; Poerio, T.; El-Sayed, E.; Drioli, E.; Abdel-Jawad, M. Direct contact membrane distillation for treatment of oilfield produced water. Sep. Purif. Technol. 2014, 126, 69–81. [Google Scholar] [CrossRef]
- Goh, S.; Zhang, J.; Liu, Y.; Fane, A.G. Fouling and wetting in membrane distillation (MD) and MD-bioreactor (MDBR) for wastewater reclamation. Desalination 2013, 323, 39–47. [Google Scholar] [CrossRef]
- Rezaei, M.; Warsinger, D.M.; Duke, M.C.; Matsuura, T.; Samhaber, W.M. Wetting phenomena in membrane distillation: Mechanisms, reversal, and prevention. Water Res. 2018, 139, 329–352. [Google Scholar] [CrossRef]


| Operation Factors | ST | BC |
|---|---|---|
| Working vol.(L) | 1.5 | 5 |
| Height a/diameter | 0.5 | 3.9 |
| GHSV b in h−1 | 24 | 8.4 |
| Mixer | Agitator | Ceramic membrane diffuser |
| Mixing method | 200~600 rpm | Bubble size, 100~200 μm (manufacturer’s ad.) |
| pH | 7.3 ± 0.24 | 7.2 ± 0.26 |
| NH4+ (mg/L) | 915.2 ± 323.8 | 461.5 ± 83.8 |
| Maximum O.D.600 nm | 16.2 | 12.5 |
| PCH4, max in outflow c | 29.4 % | 16.2% |
| Maximum VVD d | 77.8 (VVD/O.D. = 4.8) | 19.8 (VVD/O.D. = 1.6) |
© 2019 by the authors. Licensee MDPI, Basel, Switzerland. This article is an open access article distributed under the terms and conditions of the Creative Commons Attribution (CC BY) license (http://creativecommons.org/licenses/by/4.0/).
Share and Cite
Choi, O.; Kim, M.; Go, Y.; Hong, M.-G.; Kim, B.; Shin, Y.; Lee, S.; Kim, Y.G.; Joo, J.S.; Jeon, B.S.; et al. Selective Removal of Water Generated during Hydrogenotrophic Methanation from Culture Medium Using Membrane Distillation. Energies 2019, 12, 4130. https://doi.org/10.3390/en12214130
Choi O, Kim M, Go Y, Hong M-G, Kim B, Shin Y, Lee S, Kim YG, Joo JS, Jeon BS, et al. Selective Removal of Water Generated during Hydrogenotrophic Methanation from Culture Medium Using Membrane Distillation. Energies. 2019; 12(21):4130. https://doi.org/10.3390/en12214130
Chicago/Turabian StyleChoi, Okkyoung, MinJeong Kim, Youngwook Go, Moon-Gi Hong, Bomin Kim, Yonghyun Shin, Sangho Lee, Young Gook Kim, Ji Sun Joo, Byoung Seung Jeon, and et al. 2019. "Selective Removal of Water Generated during Hydrogenotrophic Methanation from Culture Medium Using Membrane Distillation" Energies 12, no. 21: 4130. https://doi.org/10.3390/en12214130
APA StyleChoi, O., Kim, M., Go, Y., Hong, M.-G., Kim, B., Shin, Y., Lee, S., Kim, Y. G., Joo, J. S., Jeon, B. S., & Sang, B.-I. (2019). Selective Removal of Water Generated during Hydrogenotrophic Methanation from Culture Medium Using Membrane Distillation. Energies, 12(21), 4130. https://doi.org/10.3390/en12214130