Abstract
During the heating period in Northeast China, the electricity generated by Combined Heat and Power (CHP) plants has caused a large amount of wind power curtailment. To avoid this curtailment, Heat Storages (HS) and Electric Boilers (EB) are being widely applied to CHP plants. However, the effectiveness of HS and EB on the curtailment of wind power has still not been well evaluated. This paper proposes a new evaluation method consisting of an operation boundary model and an internal coordinated operation model for each flexible CHP plant with HS and EB. Then a system power balance model based on hour-by-hour analysis is established to determine the wind power integration, down-regulation subsidy and the utilization degree of the flexible equipment. The models are validated by using field measured data of a province in China. The results show that the capacity change of the EB has a bigger impact on the down-regulation subsidy than that of the HS, while the EB is more effective when the level of wind power integration is high.
1. Introduction
In recent years, a high amount of wind power curtailment has become a severe problem in Northeast China. In 2017, the total amount of wind power generation in this region was 34.5 billion kWh. The total amount of wind power curtailment is 5.33 billion kWh. 89% of this curtailment occurs in the heating period [1].
There are two main reasons for this high percentage of wind power curtailment in the heating period: (1) Wind power output in winter is higher than that in summer; (2) Heat loads are increasingly supplied by centralized cogeneration so as to improve energy efficiency and reduce emissions in China. The number of power-on central CHP units increases as the heating demand goes up. As a result, the minimum electricity output of CHP units increases [2]. If this increase exceeds the amount of wind power generation, the wind power will be curtailed.
To support the integration of wind power, China is updating CHP units to decouple thermal and electric outputs and further reduce minimum electricity output of CHP units [3]. The main way of flexibility transformation is to install heat storages (HS), electric boilers (EB) on CHP plants [4], such as a 260 MW solid electric heat storage down-regulation boiler build on Dandong Jinshan CHP plants [5], three 16.7 MW direct heating electric boilers build on Jilin CHP plants [6], two 50 MW immersion-type electrode boilers build on Datang Harbin No.1 CHP [7], and a 26,000 cubic meter hot water storage tank build on Datang Liaoyuan Power Plant. Although heat pumps are more efficient than electric boilers, however in northern China, there is currently no case of applying heat pump to decouple thermal and electric outputs to increase flexibility in CHP plants, nor in future flexibility transformation plans, as described in Reference [4], probably because of more expensive cost than electric boiler, significant efficiency reduction under the very cold weather, and limited utilization hours.
To provide an effective guidance for the flexible transformation of CHP plants, a proper evaluation method of wind power integration is critical for analyzing different transformation plans. Currently, the evaluation methods can be divided into two main types. The first type is to establish a comprehensive CHP dispatch model with flexible CHP plants, and use it to determine the wind power integration at each time interval through optimization calculation. References [8,9,10] establish a daily short-term dispatching model that only considering HS or both HS and EB. The effect of HS or EB to enhance wind power integration is simulated and analyzed from daily time scale. Reference [11] analyzes the influence of EB and pumped storage on the wind power integration potential of West Inner Mongolia in different scenarios based on the daily dispatching model from year time scale by rolling calculation. Another type of evaluation method is to use traditional heuristic power balancing [12], but fully considering the impact of flexible equipment such as HS and EB on electric power balance and heat balance. References [13,14] use EnergyPLAN (Developed by Henrik Lund and expanded into the present version 15 in the period since year 1999, Aalborg University, Denmark) to analyze the annual wind power capacity of energy systems in northeast China and all over China after installing HS and heat pumps.
The evaluation of wind power integration is essentially the balance of power and heat in the framework of an electrical-thermal power system. In theory, the method based on the optimized dispatching model is more accurate but requires more boundary condition data. The deviation of the planning time scale, model and boundary condition data is unlikely to show the superiority of accurate modelling [12].
Relatively speaking, the principle of heuristic power and heat balance method is simpler, less boundary-data dependent, less computational complexity, and more transparent. For example, EnergyPLAN software aggregates units into a single unit model according to their classifications, and makes balance according to the operation strategies of various aggregated units, so as to obtain the data of fuel cost, CO2 emission and surplus electricity of the energy system as a whole. This software has been widely used due to its simple operating principle and user-friendly operation [15,16,17,18]. However, the software aggregates all the CHP units into a single unit during the analysis process, which cannot specify the differences between CHP units and heat load. Therefore, it is fair to say the results merely reflect the overall operation of various types of power sources, rather than the specific conditions of each CHP plant. They are not in line with the actual local balance of the thermal system, nor can they provide effective guidance for the specific CHP plant in flexible implementation.
Therefore, based on the heuristic power balance model established in reference [12], this paper further proposes a wind power integration evaluation method for power systems with flexible CHP plants. According to the objective reality of local heat balance, this method establishes the operation boundary model and internal coordinated operation model for each CHP plant with HS and EB. Through analyzing the down-regulation balance in time intervals, the wind power integration of the whole power grid can be determined, as well as the cost of down-regulation subsidy in the system for each plant and the utilization of each flexible equipment. This method provides a simple, fast, and effective analysis tool for system operators and plant managers.
2. Flexible CHP Plant
The installation of HS and EB will expand the feasible operation range of CHP plants, thus improving their operational flexibility. In actual operation, it is necessary to coordinate the operation of HS, EB, and generator to meet both the power generation and heating load demand of CHP plants. Therefore, the overall feasible operating interval of flexible CHP plants and the internal coordination operation model of flexible CHP plants are introduced in this section.
2.1. Feasible Operation Interval of Traditional CHP Units
China’s power system is dominated by large-scale extraction coal-fired CHP units, and their feasible operation intervals are shown in Figure 1 [19].
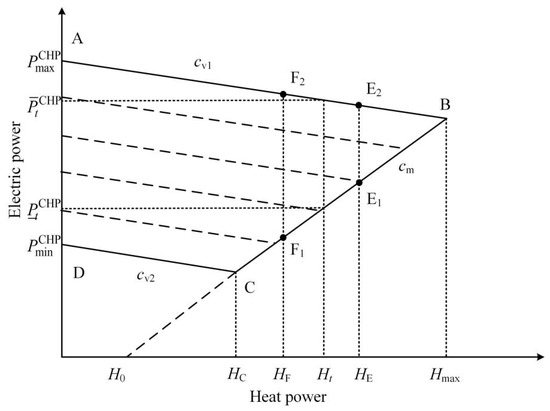
Figure 1.
Electric and heat power characteristics of the Combined Heat and Power (CHP) units.
From Figure 1, it can be seen that there is a coupling relationship between the electricity output and the heat output of CHP units. The abscissa indicates the heating power of the unit and the ordinate indicates the generating power of the unit. When the heat power output of the unit increases from HF to HE, the adjustable range of the electric power output decreases from F1F2 to E1E2, the minimum power output increases, the maximum power output decreases and the adjustable range decreases. The operation range shown in Figure 1 can be expressed mathematically as follows:
where and are the maximum and minimum electric power output of the CHP unit with heat power output at , respectively; and are the maximum and minimum electric power output of CHP plant under pure condensation condition, respectively; the slopes of AB, BC, and CD are , , and , respectively; is constant; is the heat power output corresponding to the minimum power output of the unit; and is the maximum extraction heat power output of the CHP unit.
2.2. Overall Feasible Operating Interval of Flexible CHP Units
The overall operating range of a CHP plant after installing HS and EB (indicated by the black dotted line in Figure 2) is shown in Figure 3. For an arbitrary operating point of the unit, the overall heat power output increases through HS, so AB and BC move to the right. The overall heat power output decreases through HS and CD moves to the left, thus expanding the original operating range to a new range surrounded by AEFQNM. As a result, the electricity output of the CHP plant decreases. More heat output is obtained from the electric boiler, which moves the lower boundary move to the right and downward, thus enlarging the operation interval to a new range surrounded by AEFGIKLM.
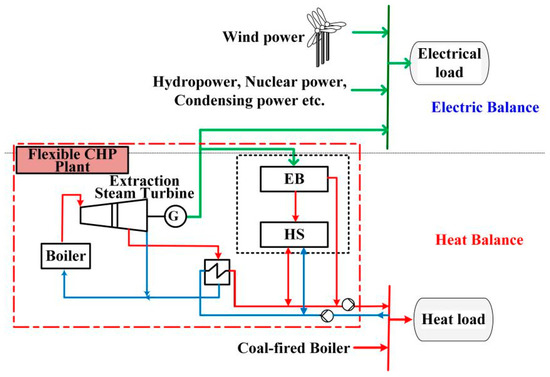
Figure 2.
Power system with flexible CHP plant.
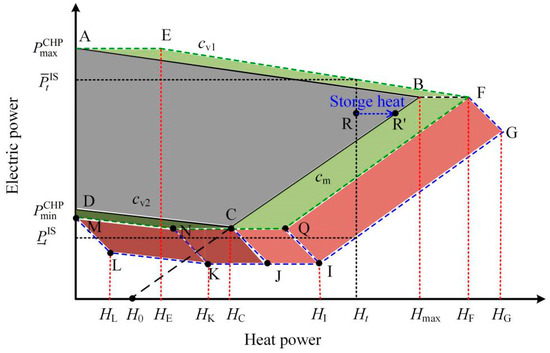
Figure 3.
Electric and heat operation range of flexible CHP unit.
The above operation range can be described as follows:
(1) The upper boundary of the overall operating range electricity output:
where is the maximum heat power output of the HS at time t, which is determined by the residual heat at the end of the last period of the HS and its maximum heat release power, which is a dynamic value. can be expressed as:
where is the residual heat of HS at the end of the last period and is the maximum heat release power of the HS.
(2) The lower boundary of the overall operating range electricity output is:
where is the maximum operating power of the EB; is the electric and heat conversion efficiency of the EB, and is the maximum heat storage power of HS at time t, which can be expressed as:
where is the capacity of the HS and is the maximum heat storage power of the HS.
2.3. The Internal Coordination Operation Model of a Flexible CHP Plant
On the basis of the overall feasible operation interval, it is necessary to determine the state of coordinated operation of the HS, the EB and the generator according to the overall heat load demand and the electric load demand. The overall feasible operation interval is divided into three areas, as shown in Figure 3. For each area, the coordinated operation model is as follows.
Area 1: When the overall operating point is located in the gray area as shown in Figure 3, e.g., point R theoretically, the generator can be operated independently at this time. However, the maximum heating capacity of the unit under the electric load is greater than the maximum capacity under the heat load. If HS is not full at this time, the excess heat power output of the unit should be fully utilized to store heat for HS. The actual operating point of the unit becomes R’, So the coordination model is as follows:
where is the electric load allocated to the CHP by the system; and are the electric power output and heat power output of the unit, respectively; is the residual heat of the HS at the end of time t; is the operation power of EB at time t.
Area 2: When the overall operation point is located in the green area in Figure 3, only the HS is running. HS releases heat when the operation point is in the AEFQCBA area:
HS stores heat when the operating point is in the DCNMD area:
Area 3: When the operation point is located in the red area in Figure 3, both HS and EB are running. HS releases heat when the operation point is located in the FGIJCQF area:
HS releases heat when the operating point is located in the JKLMNC area:
3. Wind Power Integration Evaluation for Power Systems with Flexible CHP Plants
The curtailment of wind power is determined by the minimum allowable electricity output of CHP plants. Based on the model established in Section 2, simplified model and accurate model for calculating the minimum electric output of flexible CHP plants are presented. With the accurate model, not only the abandoned wind power of each period can be calculated, but also the amount of down-regulation of each CHP unit and the operating power of each HS and EB can be obtained, which provides a basis for further calculation of additional evaluation indicators.
3.1. Principle of Wind Power Integration Assessment
The evaluation principle of wind power integration based on down-regulation analysis is as follows:
- Calculate the peak adjustable capacity required for the day based on the daily maximum load and spare capacity;
- Determine the operating capacity of each type of power supply according to the energy-saving scheduling or other scheduling principles;
- Calculate the minimum electric power output of each operating plant according to the regulation of the grid-connected power plant auxiliary service management method and their operational constraints (such as heating, water, etc.);
- Obtain the minimum electric power output of the system by adding the minimum electric power output of all the operating plants;
- Wind power curtailment occurs when the minimum electric power output of the system is greater than the equivalent load (electric power demand minus the wind power output).
The above principle is shown in Figure 4, where the black solid line indicates the minimum electric power output of the system before the CHP plants flexibility transformation, Obviously, when the minimum electric power output of the system is higher than the equivalent load, the wind energy must be abandon the wind to ensure the power balance.
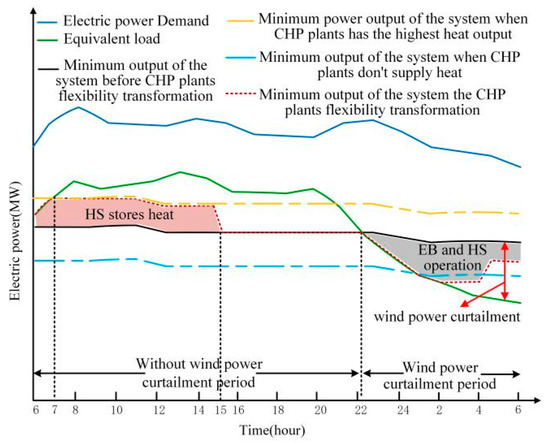
Figure 4.
Factors that determine the curtailment of wind power.
For any moment, the relationship between the wind power curtailment and the minimum electric power output of the system can be expressed as:
where is the wind power curtailment at moment t; is the equivalent load; is the electric power demand; is the wind power output; is the minimum electric power output of the system.
3.2. Calculation of Minimum Electric Output of CHP Plants after Flexibility Transformation
As mentioned above, the key to calculating the wind power curtailment is the minimum electric power output of the system, which is obtained by summing the minimum electric output of each power supply. For CHP plants, the minimum electric power output is determined by the current heat demand before flexibility transformation as Figure 1. After flexibility transformation, the minimum electric output of the CHP plants can be reduced by the coordinated operation of the generator, HS and EB. Therefore, the minimum electric power output of the system is reduced (as shown by the red dotted line in Figure 4) to adopt more wind power.
According to the Equations (5)–(7) in Section 2.2, the minimum electric power output of the CHP plants at moment t after transformation depends on the residual heat of the HS at the end of moment t-1(), the maximum heat release power () and the capacity of EB (). Therefore, there is a time series coupling relationship of each stage between the minimum electric power output of the CHP plants after the transformation.
3.2.1. Simplified Calculation of Minimum Electrical Power Output of the CHP Plants
When considering the thermal timing coupling relationship of the HS, it is more complicated to calculate the minimum electric power output of CHP plants. For this reason, this section proposes a simplified calculation method. Assuming that the HS is always full, that is . According to Equation (4):
By substituting the above formula into Section 2.2, the minimum electric power output of the flexible CHP plants at each time can be obtained. By substituting the minimum electric power output of the flexible CHP plants into Equation (13) the wind power curtailment of each time can be calculated.
In the actual operation, there will be cases where the heat is not filled or even empty in the HS during wind power curtailment period, the amount of curtailed wind calculated in the simplified method is less than that in actual conditions, and the scale of deviation needs to be analyzed by combining with the actual system.
3.2.2. Accurate Calculation of Minimum Electrical Power Output of the CHP Plants
In order to take the coupling relationship between the HS at each time period into account, and to calculate the minimum electric power output of CHP plants in each period more accurately, the method of rolling calculations hour by hour from the initial time period can be used. The specific steps of the calculation are as follows:
- (1)
- Calculate the wind power curtailment of the system () before the CHP plants flexibility transformation according to the method described in Section 3.1. At this time, the minimum electric power output of CHP plants is determined by the current heat demand.
- (2)
- Calculate the minimum electric output of CHP plants after the flexibility transformation from the initial period, and the heat in the HS is assumed to be zero at the initial time.
According to the wind power curtailment before CHP plants transformation, each time period can be divided into the following two cases:
① .
At this time, the wind power curtailment is zero (As shown in Figure 4, 6:00–22:00). The part of the generating space where the equivalent load is greater than the minimum electric power output of the system before the transformation (referred to as the remaining generating space) can be used to distribute to CHP plants. Then the electric power output of CHP plants is greater than the electric power generated by the heat-led mode. In this way, CHP plants can use the opportunity of power generation for cogeneration heating and store the heat to the HS for using in the subsequent wind power curtailment period.
For unit i, assuming that the current heating load is (as shown in Figure 1), in order to fill the HS as soon as possible, the heat demand power of the period () can be calculated by Equation (7). Considering that the heat power of CHP plants can only increase during this period, the expected increased electric power output of CHP plants at this time is:
Then for all CHP plants, the total expected increased electric power output is.
Considering that the remaining power generation space of the system may be less than, the equal distribution is used to meet the fairness principle. The increased electric power output of each plant can be calculated as follows:
where is the remaining power generation space of the system. The sum of the increased electric power output of each plant and the minimum electric power generated by the heat-led mode of CHP plants is the minimum electric power output of the plant after correction:
By substituting and into the relevant Equation of Section 2.3, the heat output of CHP plants, the EB power and the residual heat of the HS at the end of the period can be obtained which are the inputs to calculate the minimum electric power output of the plants at next period.
②
At this time, the wind power curtailment is not zero, so each CHP plant needs to reduce the electric power output by using HS and EB to eliminate wind power curtailment.
For unit i, assuming that the current heating load is , the maximum down-regulation provided by CHP plants after the transformation calculated by Equation (5) is . The maximum down-regulation that all CHP plants in the system can provide is .
Considering that the wind power curtailment may be less than the maximum down-regulation. The actual down-regulation of the system is:
That is, the amount of wind power curtailment consumed by the flexible operation of CHP plants during this period. The part of greater than , is the wind power curtailment of this period.
In order to calculate the residual heat of the HS at the end of this period (which is also the input to calculate the minimum electric power of CHP plants in the next period), it is necessary to allocate the overall down-regulation to each CHP plant. In the current down-regulation ancillary service market, the CHP plant needs to be provided with down-regulation subsidy when the load rate of it is lower than 50%. Therefore, this paper allocates the peak amount based on the principle that the total down-regulation subsidy of the system is minimum.
In the down-regulation ancillary service market in Northeast China, the down-regulation can be divided into 3 levels [20], as shown in Figure 5: Basic down-regulation with no subsidy; 50% –40% , 0–400 ¥/MW; < 40% , 400–1000 ¥/MW.
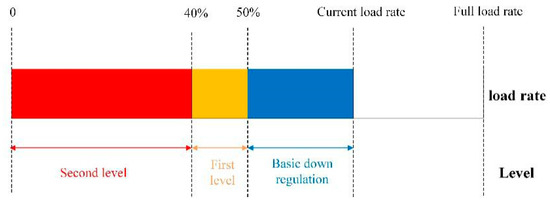
Figure 5.
Unit load rate and down-regulation subsidy.
Therefore, the allocation is as follows: Basic down-regulation capacity, first-level down-regulation capacity, and the second-level down-regulation capacity. The calculation steps are as follows:
Firstly, the maximum down-regulation of the CHP plant during this period is divided into three levels of –50% , 50%–40% , and < 40% according to the basic down-regulation, first-level down-regulation, and second-level down-regulation. The down-regulation of each level is:
Secondly, calculate the total amount of down-regulation at each level:, , .
Thirdly, the down-regulation calculated by the Equation (18) is allocated to each level:
Then allocate the total down-regulation of each level to each CHP plant in proportion:
Finally, calculate the electrical power output of CHP plants:
By substituting into the relevant formula of Section 2.3, the internal coordinated operation result of CHP plants in the period can be calculated, and the residual heat of the HS at the end of this period can be obtained which are the inputs to calculate the minimum output of the plants at next period.
By repeating the above steps, the wind power integration of the system after CHP plants flexibility transformation can be obtained.
4. Evaluation Indicators
Through the above calculation, the wind power curtailment in each period and the down-regulation of CHP plants in each level can be obtained. Through the statistical analysis, the wind power curtailment indicator and down-regulation subsidy indicator can be further obtained.
4.1. The Wind Power Curtailment Indicator
In this paper, the quantity of the wind power curtailment and the rate of the wind power curtailment are used to characterize the wind power curtailment situation of the system.
where represents the quantity of the wind power curtailment; represents the rate of the wind power curtailment; represents the number of time intervals during the evaluation time; represents the quantity of the wind power curtailment in each time period; represents the total wind power generation in the evaluation time period.
4.2. The Down-regulation Subsidy Indicator
The total amount of down-regulation subsidy can be calculated as follows:
where is the total amount of down-regulation subsidy; is the number of CHP units for down-regulation; is the part below the minimum electric power output when the CHP unit is undergoing down-regulation; is the corresponding subsidy obtained when CHP plants perform deep down-regulation to reduce the electric power output.
5. Case Study
Based on the above method, this paper evaluates wind power integration during the heating period after the implementation of flexible CHP plants in a certain province of China.
5.1. Basic Data
5.1.1. Electric Load Data
Since the purpose of this paper is to evaluate the influence of the implementation of flexible CHP plants on the wind power integration, the electric load in the case is the sum of the electric power output of CHP plants and wind power output in each heating period. The total electric load in the heating period is 42.500 GWh, the maximum load is 14.995 GW which occurs in December, and the minimum load is 8. 355 GW which occurs in January.
5.1.2. Power Source Structure
Table 1 shows the structure of the power source, and the relevant parameters of CHP plants are shown in Table A1 [21].

Table 1.
Power supply structure.
5.1.3. Heating Load of the CHP Plant
In this paper, the unit combination mode is adopted when the system is running. The heating load of start-up CHP units in each period is determined by the minimum operating mode of CHP plants and the electric and heat characteristics of units [2]. The heating period is divided into three stages: the initial stage, the middle stage and the last stage. The heating load of CHP units remains unchanged in each stage [6].
5.1.4. Wind Power Data
In this paper, the unit value of wind power output of the province (Figure A1 in Appendix B) is multiplied by the installed capacity of wind power to obtain the wind power output of each period.
5.2. Evaluation Results
5.2.1. Analysis of Evaluation Results before Flexibility Transformation
The evaluation result shows that during the heating period, the total wind power generation is 40.98 hundred GWh, the quantity of the wind power curtailment is 498 GWh, and the rate of the wind power curtailment is 12.15%. The rate of wind power curtailment in January has exceed 30%, which is the worst case in a year. Due to the family gathering that occur for the Chinese Spring Festival (around January), most heavy electric loads, such as for industries, are reduced or temporarily shut down, but the heat requirement within personal households remains the same. Therefore, CHP plants are forced to generate large electric power output, suppressing the amount of grid-connected wind power. The rate of the wind power curtailment evaluated in this paper is basically the same as in reality (12%), which verifies the validity of the model.
During the heating period, the thermal power generation is 38,360 hundred GWh. According to the calculation of 320 g coal/kWh, the coal consumption of thermal power plants in the heating period before the transformation is about 12.28 million tons.
5.2.2. Comparisons between Simplified Calculation and Accurate Calculation
The difference between the simplified calculation and the accurate calculation is that simplified calculation assumes the heat in the HS is always full, ignoring the change of heat in the HS. So the wind power curtailment under the simplified calculation is lower than actual.
To compare the evaluation results of wind power integration under two methods, ten CHP plants with only HS are selected for this section.
The capacities of these HSs are the compensatory heating power required multiplied by the number of heat release hours when the electric power output of the CHP plant is minimum during the middle period of heating. (By considering the duration of the wind power curtailment in the system, the heat release time of the HS is set at 8 h). Under the simplified calculation, the quantity of wind power curtailment is 2.85 hundred GWh. Under the accurate calculation, the quantity is 3.66 hundred GWh. The difference between the two methods is 0.81 hundred GWh and the deviation rate is about 20%. This indicates that accurate calculation can describe the operation of CHP plants more precisely.
Figure 6a is a 24-h balance diagram of the system under simplified and accurate calculation. In the figure, the black shadow area is the wind power curtailment which can only be absorbed through a simplified calculation method. In the simplified calculation process, it is assumed that the heat in the HS is always full in each period of time. However, the heat in the HS is insufficient during 3:00 a.m. to 6:00 a.m., the compensation heat supply is reduced, and the electric power output of the CHP plant cannot be maintained at the minimum state. Therefore, those amounts of wind power curtailment is abandoned in simple calculation method.
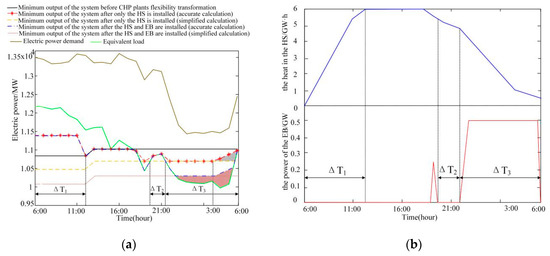
Figure 6.
(a) A 24-h equilibrium diagram of the system under simplified and accurate calculation; (b) operating state diagram of the heat storage device and electric boiler under accurate calculation.
5.2.3. Wind Power integration of the System after Installation of HS and EB
Ten CHP plants are selected to install HS and EB for flexible implementation. The capacity of each HS is the same as that in Section 5.2.2. EB is allocated according to 20% of the installed capacity of each CHP unit.
Figure 7 shows the comparison of the quantity of the wind power curtailment and the rate of the wind power curtailment before and after the implementation of flexible CHP plants under the accurate calculation. After the implementation of flexible CHP plants, the quantity of the wind power curtailment is reduced to 0.96 hundred GWh, the integration of wind power is 40.02 hundred GWh, the rate of the wind power curtailment is reduced to 2.34%, the coal consumption of the unit is reduced to 12.16 million tons which are reduced by 120 thousand tons (1% of the total coal consumption) and CO2 emissions have been reduced by 120,000 tons.
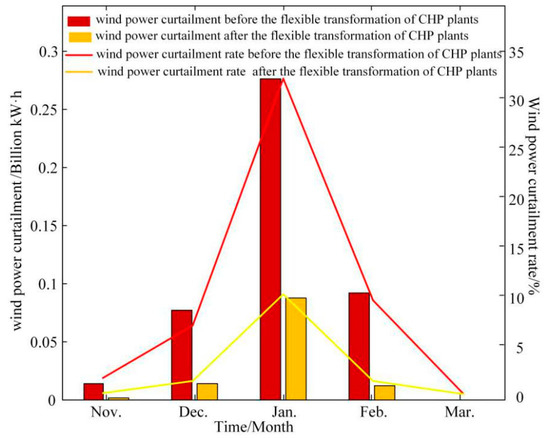
Figure 7.
Wind power curtailment and wind power curtailment rate during system heating period before and after the implementation of flexible CHP plants.
In order to validate the model, an accurate power balance diagram (Figure 6a) and an operating state diagram (Figure 6b) of the HS and EB are used to show the coordinated operation of the CHP unit, the HS and the EB. In the period of Figure 6a, there is no wind power curtailment and the HS is not full. At this time, in order to make full use of the remaining power generation space for co-generation heating and storage heat for the HS, the unit will increase the electric power output to more than heat-led mode, and the heat in the HS will gradually increase until it is full. During the period , there is wind power curtailment which does not exceed the minimum electric power output of the system after the operation of the HS. At this time, only operating the HS can realize the total wind power integration. Therefore, the electric power output of the CHP unit is reduced to less than heat-led mode through the HS releasing heat, the operation power of the EB is 0. During the period , the wind curtailment exceeds the minimum electric power output of the system after the operation of the HS. At this time, the EB needs to be started. But when the power of wind curtailment exceeds the minimum electric power output of the system after the operation of the EB, which means the EB has been running at the maximum power, the remaining wind power cannot continue to be consumed, as shown in the red shadow area in Figure 6a. The above-coordinated operation process is consistent with the theoretical analysis, which verifies the validity of the model.
5.2.4. Down-regulation Subsidy in the System
The system will provide a down-regulation subsidy for CHP units with deep down-regulation according to the offer in the down-regulation ancillary service market. However, due to the different bid prices of each power plant, the down-regulation subsidies of each level in the market may fluctuate. This paper calculates the down-regulation cost with the maximum price of each level (Table A2 in Appendix A).
It can be found in Table 2 that there is less down-regulation subsidy when only HS is installed. This is because the HS can only reduce the electric power output of the unit from heat-led mode to point C shown in Figure 1 (between about 40% and 50% of installed capacity, different units have different values). When both HS and EB are installed, the down-regulation subsidy significantly increases as the EB capacity increases. This is because the EB can reduce the load rate of the unit to the second-level subsidy, and the subsidy is 2.5 times that of the first level.
Table 2.
down-regulation subsidy for different capacity of Heat Storages (HS) and Electric Boilers (EB).
5.2.5. Influence of Wind Power Capacity on Utilization of HS and EB
In order to analyze the influence of wind power installed capacity changes on the utilization degree of the HS and the EB, this section sets the capacity of the HS and EB to infinity. The heat release of the HS and the EB during the heating period is calculated by changing the proportion of the installed capacity of the wind power in the power structure.
From Figure 8, it can be seen that with the increase of wind power installed capacity in the power structure, the heat release of the HS increases first and then decreases, while the heat release of the EB increases continuously. This is because at the beginning, with the increase of installed capacity of wind power, the amount of wind power curtailment increases as well as its duration. For reducing the electrical power output, it requires the unit to absorb more compensatory heat released by HS. When the installed capacity of wind power continues to increase, the duration of wind power curtailment becomes longer, and the duration of non-curtailed wind power becomes shorter, which makes it more difficult for HS to store enough heat, resulting in the decrease of heat release and utilization of the HS. This shows that when the installed capacity of wind power in the system is very high, the HS will be more difficult to operate normally, but the EB always has good applicability.
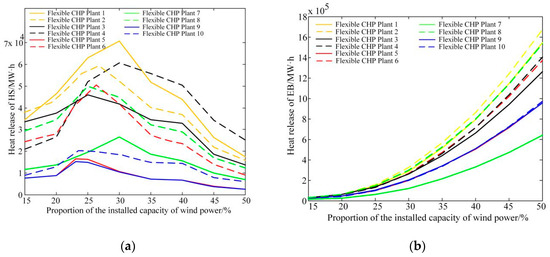
Figure 8.
(a) Effect of installed capacity of wind power on heat release of HS during the heating period; (b) Effect of installed capacity of wind power on heat release of EB during the heating period.
5.2.6. Analysis of the Potential of Wind Power Integration in the Transformed CHP Plant
In order to analyze the potential of wind power integration after the implementation of all flexible CHP plants in the system, the rate of the wind power curtailment under different installed capacity of EB (the parameters of HS are the same as Section 5.2.2) is calculated and analyzed when the installed capacity of wind power increases from 15% to 50%, as shown in Figure 9.
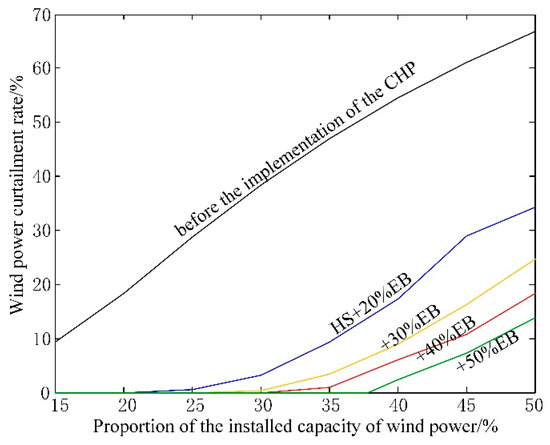
Figure 9.
Influence of flexible CHP plants on the level of wind power curtailment.
It can be seen that with the increasing proportion of the installed capacity of wind power, the rate of the wind power curtailment will increase before and after the implementation of flexible CHP plants.
However, the rate of wind power curtailment decreases dramatically after implementing. The larger the capacity of the EB, the larger the decline is, but the margin of decline is marginally decreasing. When the installed capacity of EB is 50% of the installed capacity of the CHP unit, the rate of the wind power curtailment will be controlled below 5% if the installed capacity of wind power does not exceed 45%, and the rate of the wind power curtailment will be as high as 61% if not transformed.
6. Conclusions
This paper develops a model for CHP plants with HS and EB. The model can evaluate the amount of wind power curtailment and other indicators of wind power integration, Also, down-regulation subsidy brought by using HS and EB in CHP plants can be obtained. The model is validated by an actual CHP plant in China. The results show that:
(1) If store and release processes of the HS are not well coordinated, the wind power curtailment rate can be 20% lower than the maximum allowable level;
(2) The EB can reduce the electricity output of CHP plants to the second level of down-regulation subsidy, while the HS can only reduce the electricity output of CHP plants to the first level of down-regulation subsidy. Thus, the capacity of EB has a bigger impact on the down-regulation subsidy than that of the HS;
(3) When the level of wind power integration is high, the HS becomes less efficient, while the EB is still effective;
(4) By adding HS and EB, CHP plants can significantly increase the amount of wind power integration to power systems. In the example of this paper, if all CHP plants install HS and EB, the ratio of wind power integration can reach about 45% with 5% of wind power curtailed.
Author Contributions
Conceptualization, Q.L.; Methodology, H.G.; Resources, N.Z.; Writing—original draft preparation, Q.L. and H.G.; Writing—review and editing, N.Y., X.X. and H.W.
Funding
This research was funded by the National Natural Science Funds (51607021).
Conflicts of Interest
The authors declare no conflict of interest.
Abbreviations
| CHP | Combined heat and power |
| CON | Condensing power |
| HS | Heat storage |
| EB | Electric boilers |
Appendix A
Table A1.
Typical CHP unit parameters.
Table A2.
Distribution of CHP unit output quotation in heating period.
Appendix B

Figure A1.
Per-unit value of wind power standard in heating period.

References
- The National Energy Administration. The Statistics of Wind Power in 2017. 2017. Available online: http://www.nea.gov.cn/2018-02/01/c_136942234.htm (accessed on 20 July 2019).
- The National Energy Administration. The Minimum Approval of Northeast Power Grid in 2018. Available online: http://www.nea.gov.cn/2017-04/25/c_136234299.htm (accessed on 20 July 2019).
- The National Energy Administration. The National Energy Administration Officially Launched the Pilot Project to Improve the Thermal Power Flexibility Transformation Demonstration. 2016. Available online: http://www.nea.gov.cn/2016-06/20/c_135451050.htm (accessed on 21 July 2019).
- Electric Power Planning & Engineering Institute. Thermal Power Plant Flexibility, a Publication under the Clean Energy Ministerial Campaign; Electric Power Planning & Engineering Institute: Beijing, China, 2018. [Google Scholar]
- The National Research Center of Thermal Power Engineering Technology. Brief Analysis on Flexibility Transformation of Thermal Power Units in Dandong Jinshan Thermal Power Co., Ltd.; The National Research Center of Thermal Power Engineering Technology: Beijing, China, 2017. [Google Scholar]
- Lin, J.; Li, J. Practice of Flexible Reformation of Direct Thermal Electric Boiler in Thermal Power Plant. Jilin Electr. Power 2017, 45, 11–14. (In Chinese) [Google Scholar]
- China Electricity Council. The Flexible Thermal Power Transformation Project of Datang Hayi Thermal Power Plant Has Been Approved by the Project. 2017. Available online: http://www.cec.org.cn/hangyeguangjiao/fadianxinxi/2017-07-12/170750.html (accessed on 24 July 2019).
- Chen, H.; Yu, Y.; Jiang, X. Optimal scheduling of combined heat and power units with heat storage for the improvement of wind power accommodation. In Proceedings of the 2016 IEEE PES Asia-Pacific Power and Energy Engineering Conference (APPEEC), Xi’an, China, 25–28 October 2016; pp. 1508–1512. [Google Scholar]
- Rong, S.; Li, Z.; Li, W. Investigation of the promotion of wind power consumption using the thermal-electric decoupling techniques. Energies 2015, 8, 8613–8629. [Google Scholar] [CrossRef]
- Chen, X.; Kang, C.; O’Malley, M.; Xia, Q.; Bai, J.; Liu, C.; Sun, R.; Wang, W.; Li, H. Increasing the flexibility of combined heat and power for wind power accommodation in China: Modeling and implications. IEEE Trans. Power Syst. 2015, 30, 1848–1857. [Google Scholar] [CrossRef]
- Zhang, N.; Lu, X.; McElroy, M.B.; Nielsen, C.P.; Chen, X.; Deng, Y.; Kang, C. Reducing curtailment of wind electricity in China by employing electric boilers for heat and pumped hydro for energy storage. Appl. Energy 2016, 184, 987–994. [Google Scholar] [CrossRef]
- Lv, Q.; Wang, W.; Han, S.; Yuan, S.; Zhang, J.; Li, W.D. A new evaluation method for wind power curtailment based on analysis of system regulation capacity. Power Syst. Technol. 2013, 37, 1887–1894. (In Chinese) [Google Scholar]
- Xiong, W.; Wang, Y.; Mathiesen, B.V.; Zhang, X. Case study of the constraints and potential contributions regarding wind curtailment in Northeast China. Energy 2016, 110, 55–64. [Google Scholar] [CrossRef]
- Liu, W.; Lund, H.; Mathiesen, B.V. Large-scale accommodation of wind power into the existing Chinese energy system. Energy 2011, 36, 4753–4760. [Google Scholar] [CrossRef]
- Liu, W.; Hu, W.; Lund, H.; Chen, Z. Electric vehicles and large-scale accommodation of wind power-The case of Inner Mongolia in China. Appl. Energy 2013, 104, 455–456. [Google Scholar] [CrossRef]
- Hedegaard, K.; Mathiesen, B.V.; Lund, H.; Heiselberg, P. Wind power accommodation using individual heat pumps-Analysis of different heat storage option. Energy 2012, 47, 284–293. [Google Scholar] [CrossRef]
- Lund, H. Renewable heating strategies and their consequences for storage and grid infrastructures comparing a smart grid to a smart energy systems approach. Energy 2018, 151, 94–102. [Google Scholar] [CrossRef]
- Jakob, Z.T.; Steffen, N.; Henrik, L. Implementing cleaner heating solutions towards a future low-carbon scenario in Ireland. J. Clean. Prod. 2019, 214, 377–388. [Google Scholar]
- Li, P.; Wang, H.; Lv, Q.; Li, W. Combined heat and power dispatch considering heat storage of both buildings and pipelines in district heating system for wind power accommodation. Energies 2017, 10, 893. [Google Scholar] [CrossRef]
- Northeast China Energy Regulatory Bureau of the National Energy Administration. Operation Rules of Northeast Electricity Auxiliary Service Market (Provisional); Northeast China Energy Regulatory Bureau of the National Energy Administration: Shenyang, China, 2018. [Google Scholar]
- Li, C. Research on Optimal Capacity of Heat Accumulators Installed to CHP Plants for the accommodation of the Abandoned Wind. Dalian Univ. Technol. 2016. (In Chinese) [Google Scholar]


© 2019 by the authors. Licensee MDPI, Basel, Switzerland. This article is an open access article distributed under the terms and conditions of the Creative Commons Attribution (CC BY) license (http://creativecommons.org/licenses/by/4.0/).