Article

Suitability of Sm3+-Substituted SrTiO3 as Anode Materials for Solid Oxide Fuel Cells: A Correlation between Structural and Electrical Properties

1
Department of Physics, Indian Institute of Technology (Banaras Hindu University), Varanasi 221005, India
2
Department of Chemical Engineering, Indian Institute of Technology, Kanpur 208016, India
3
Department of Physics, A.R.S.D. College, University of Delhi, Dhaula Kuan, New Delhi 110021, India
4
CNR-ICMATE, c/o DICCA-UNIGE, Via all’Opera Pia 15, 16145 Genova, Italy
5
DICCA-UNIGE, Via all’Opera Pia 15, 16145 Genova, Italy
*
Author to whom correspondence should be addressed.
Energies 2019, 12(21), 4042; https://doi.org/10.3390/en12214042
Submission received: 26 September 2019 / Revised: 21 October 2019 / Accepted: 22 October 2019 / Published: 24 October 2019
(This article belongs to the Special Issue Advanced Materials and Technologies for Fuel Cells)

Abstract

:
Perovskite anodes, nowadays, are used in any solid oxide fuel cell (SOFC) instead of conventional nickel/yttria-stabilized zirconia (Ni/YSZ) anodes due to their better redox and electrochemical stability. A few compositions of samarium-substituted strontium titanate perovskite, SmxSr1−xTiO3−δ (x = 0.00, 0.05, 0.10, 0.15, and 0.20), were synthesized via the citrate-nitrate auto-combustion route. The XRD patterns of these compositions confirm that the solid solubility limit of Sm in SrTiO3 is x < 0.15. The X-ray Rietveld refinement for all samples indicated the perovskite cubic structure with a P m 3 ¯ m space group at room temperature. The EDX mapping of the field emission scanning electron microscope (FESEM) micrographs of all compositions depicted a lower oxygen content in the specimens respect to the nominal value. This lower oxygen content in the samples were also confirmed via XPS study. The grain sizes of SmxSr1−xTiO3 samples were found to increase up to x = 0.10 and it decreases for the composition with x > 0.10. The AC conductivity spectra were fitted by Jonscher’s power law in the temperature range of 500–700 °C and scaled with the help of the Ghosh and Summerfield scaling model taking νH and σdc T as the scaling parameters. The scaling behaviour of the samples showed that the conduction mechanism depends on temperature at higher frequencies. Further, a study of the conduction mechanism unveiled that small polaron hopping occurred with the formation of electrons. The electrical conductivity, in the H2 atmosphere, of the Sm0.10Sr0.90TiO3 sample was found to be 2.7 × 10⁻¹ S∙cm−1 at 650 °C, which is the highest among the other compositions. Hence, the composition Sm0.10Sr0.90TiO3 can be considered as a promising material for the application as the anode in SOFCs.

1. Introduction

Solid oxide fuel cells (SOFC) and solid oxide electrolysis cells (SOEC) are of great interest for their high efficiency of the conversion between chemical energy and electric power without greenhouse gases emissions. Their net-zero environmental impact is becoming truly affordable, as demonstrated by the continuous development of the use of bio-fuels and by the production of hydrogen through SOEC technology [1,2,3,4,5,6,7,8]. SOFCs are more efficient in comparison to a conventional power plant and lower temperature polymer-based fuel cells [9,10]. Electrolyte and electrodes are the essential component of a solid oxide fuel cell. Even if anionic, protonic [11,12] and dual-membrane cells [13] are reported, the first are the most studied in the literature. The state of the art material for the electrolyte is fluorite-structured yttria-stabilized zirconia (YSZ) because of its wide range of stability in oxidizing and reducing media [14], although doped ceria [15] and perovskite Sr- and Mg-incorporated lanthanum gallate (LSGM) are considered as alternatives for intermediate operative temperatures. Lanthanum strontium manganite (LSM)-YSZ composite and Sr- and Fe-doped lanthanum cobaltite (LSCF) are extensively used for cathodes, while Ni-based cermets are conventionally used as anode materials for SOFCs [16,17], although this Ni-based cermet anode material should demonstrate volume instability upon redox cycling and low-tolerance to carbon deposition when exposed to hydrogen [18]. Therefore, nickel-free, alternate-structured anode materials are essential to overcome these issues. Recently, perovskite-structured SrTiO3-based materials received much attention as an alternative anode materials for SOFCs [19]. Pure SrTiO3 is not suitable as an anode material owing to its low electrical conductivity. Additionally, donor-substituted SrTiO3 may be used owing to its better thermal and chemical stability, mixed ionic/electronic conductivity and also carbon or sulphur tolerance [20]. It is widely accepted that the mixed conductivity feature of SrTiO3-based materials enables fuel oxidation to take place at the triple phase boundary region, also decreasing the associated polarization resistance [18,21]. However, combination of this electronic and ionic conductivity is not able to completely satisfy the requirement of electrode materials for SOFC. Therefore, many attempts have been made to enhance the conductivity of this existing anode materials. It was also reported that the doping, as an acceptor, has the possibility to increase the ionic conductivity [22,23], whereas the doping of a donor has been supposed to increase the electronic conductivity [18]. The radii of trivalent Sm3+ (1.24 Å) and divalent Sr2+ (1.44 Å) are nearly equivalent, which coordinated with O dodecahedrally (AO12). Hence, Sm3+ may be one of the suitable candidates to be substituted at the Sr site as a donor dopant. It is also theoretically reported that Sm-doped SrTiO3 may exhibit a high thermal expansion coefficient and conductivity [24].
In this work, Sm-substituted SrTiO3 compositions were synthesized via the auto-combustion citrate-nitrate route and an attempt has been made to understand the influence of Sm3+ substitution on the electrical conductivities. The conductivity spectra of SmxSr1−xTiO3−δ systems with 0.0 ≤ x ≤ 0.2 at measured temperatures have been fitted by using Jonscher’s power law. The validity of the Ghosh and Summerfield scaling models have been studied to explicate the charge carrier dynamics in the system. We have also discussed the experimental authentication of polaron conduction mechanisms obtained from the temperature-dependent conductivity spectra and structural investigation of the studied samples.

2. Materials and Methods

A few compositions of SmxSr1−xTiO3−δ with x = 0.00, 0.05, 0.10, 0.15 and 0.20 were synthesized via the auto-combustion route using citric acid as a fuel agent. The starting materials Sm2O3 (99.9%), SrO (99.5%), C12H28O4Ti (97%) and citric acid were taken in stoichiometric amounts. The oxides were separately dissolved into nitric acid and then diluted with distilled water and mixed together to form a clear and homogeneous solution. The appropriate amount of citric acid to obtain a molar citrate-nitrate ratio (C/N) equal to 0.3 was also added to the solution. The required titanium isopropoxide (C12H28O4Ti) solution with ethylene glycol was mixed at 100 °C to form a homogeneous solution. Finally, all the mixed solutions were dissolved in distilled water with a few drops of NH4OH solution to keep the pH value close to 2. In the final solution, titanium hydroxide in the form of a white precipitate had formed. To dissolve the white precipitate, a few drops of diluted HNO3 were added to keep the pH below 2. A translucent solution was formed which evaporated slowly with continuous stirring with magnetic stirrer on a hot plate at 250 °C. The resultant solution firstly converted into a brown coloured gel, then, after self-ignition, into a black coloured ash. This black coloured ash was pulverized by mortar and pestle to make the powder. Thereafter, the powder was calcined into the alumina crucible in air at 1000 °C for 10 h. The resultant calcined powders were pelletized via 12 mm diameter cylindrical die-set under a hydraulic press of pressure of 5 tons/m3. After that, the resulting pellets were sintered in the air at 1200 °C for 12 h and then cooled to room temperature.
The phase composition of unreduced (as sintered) and reduced SmxSr1−xTiO3−δ samples (x = 0.00, 0.05, 0.10, 0.15 and 0.20) was characterised by using X-ray diffractometer (XRD, Rigaku Miniflex II desktop) with Cu-Kα1 radiation (λ = 1.54098 Å) in 2θ range of 20–70° and a step size of ∆ 2θ = 0.02° at room temperature. The lattice parameters, reliability fitting factors Rexp, RB, RF, etc., were also calculated using FullProf software (LLB, France) from the fitted XRD profiles. Archimedes’ principle was employed to measure the relative density of the samples by using density measurement kit (Denver SI-234). The microstructural properties of the samples were examined by field emission scanning electron microscope (FESEM, model: NOVA NANOSEM 450) and local composition was checked by energy dispersive X-ray spectroscopy (EDX, Model: EDAX TEAM-Pegasus). The average grain size of the samples was calculated by using Image-J software through the linear intercept method. The XPS spectra of the samples were measured by using KRATOS (Model: Amicus) high-performance analytical instrument with Mg target under 1.0 × 10⁻⁶ Pa pressure. The XPS peaks fitted with XPSPEAK 4.1 software (The Chinese University of Hong Kong, Hong Kong) and further analysed. Moreover, the sintered pellets were polished with silver paste on both sides for the conductivity measurement. The resultant polished samples were matured by firing at 700 °C for 20 min. The conductivity measurement was performed in both O2 and H2 atmosphere. Initially, samples were subjected in O2 atmosphere between room temperature and 700 °C and then reduced at 700 °C for 24 h in the pure H2 atmosphere. Thereafter, electrical conductivity was measured again from high temperature to room temperature. A four-probe test station (Probostat, Norecs) was employed for measuring the electrical conductivity, and impedance was measured by a SOLARTRON 1255–1286, Schlumberger frequency response analyser in the frequency range of 1Hz-1MHz.

3. Results and Discussion

3.1. Structural Studies

The samples SmxSr1−xTiO3− δ are designated as SST and the compositions with x = 0.00, 0.05, 0.10, 0.15 and 0.20 are assigned as SST0, SST5, SST10, SST15 and SST20, respectively. In SrTiO3, Sr2+ (1.44 Å) ion is coordinated with O dodecahedrally (AO12) whereas Ti forms octahedrally with O (0.605Å) (BO6) [25,26]. The tolerance factor according to Goldschmidt relation [27,28] is nearly 1, which shows the formation of ideal perovskite structure. Additionally, the ionic radius of Sm3+ in coordination number 12 is 1.24 Å and with the Sm substitution, tolerance factor has been calculated which is observed to decrease from 1.0017 to 0.988 with an increase in Sm content from x = 0.0 to 0.20 as illustrated in Figure 1. Hence, Sm3+ may be one of the suitable substituent candidates to be substituted at the Sr site.
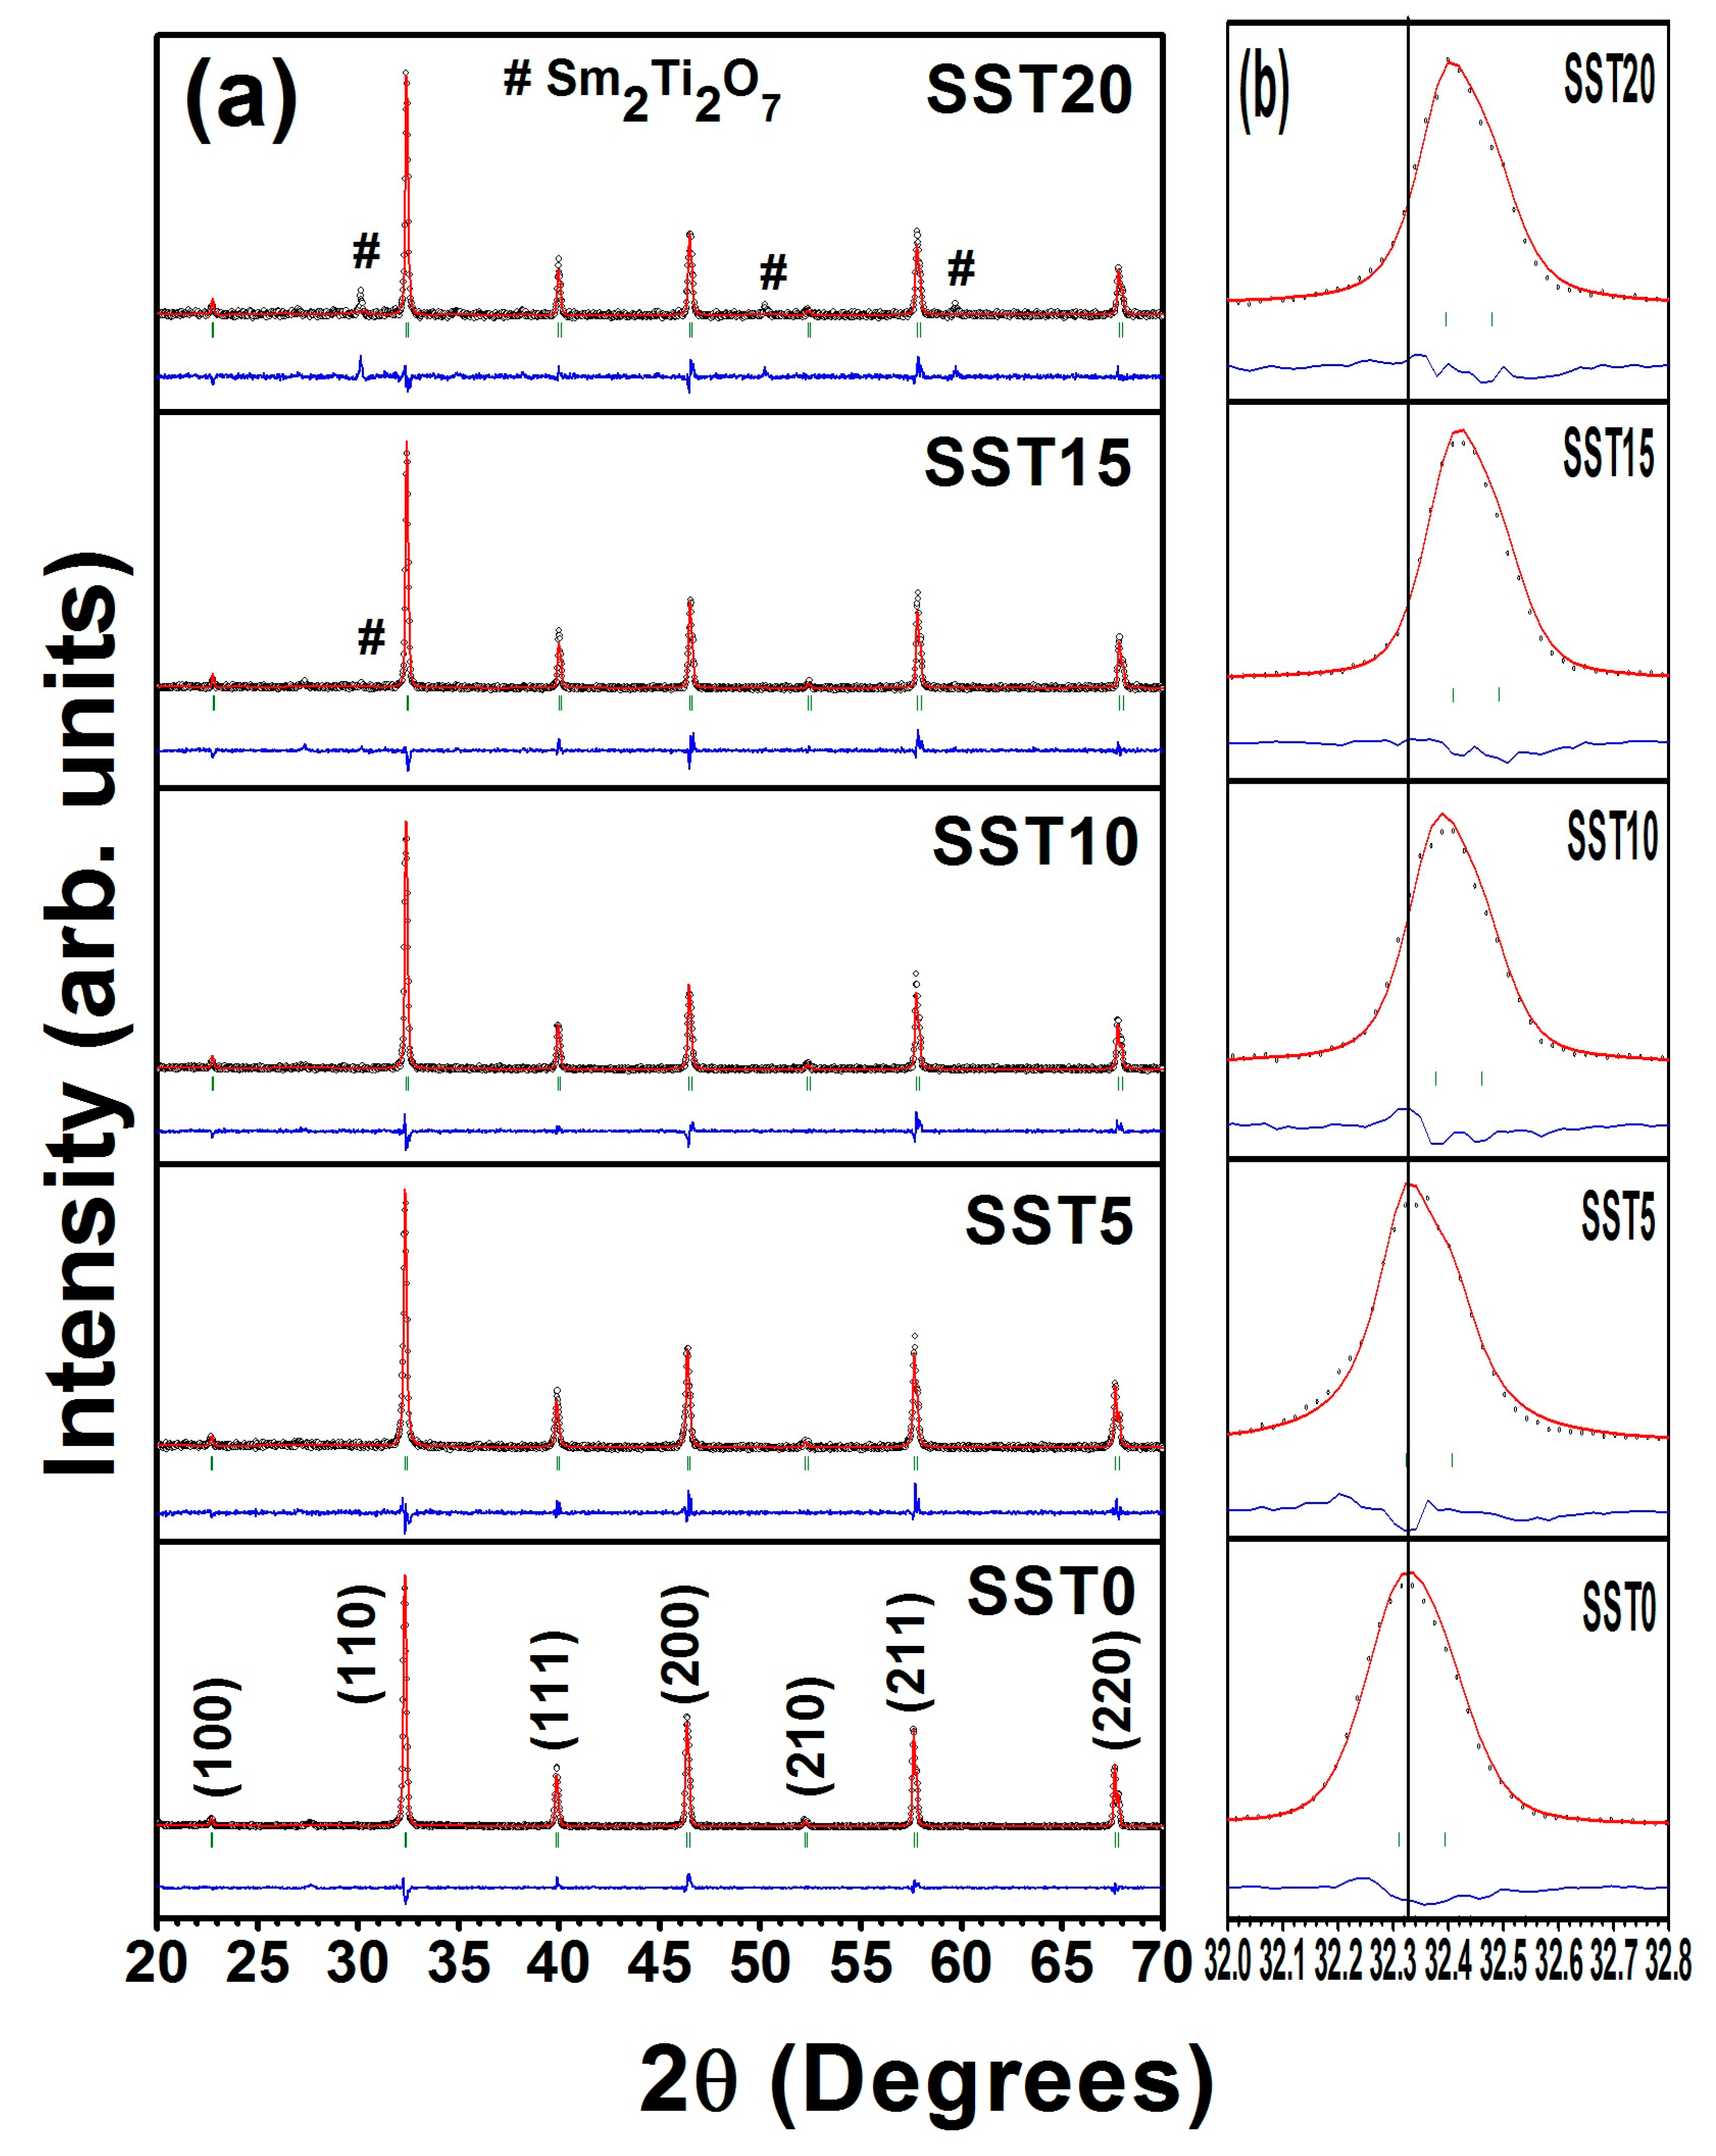
From XRD patterns, shown in Figure 2, it was found that all the samples show cubic phase with space group P m 3 ¯ m (JCPDS card number: 86–0178). There were no impurity peaks for the samples with x ≤ 0.10, while secondary phase started to appear for samples x ≥ 0.15. This secondary phase was identified as Sm2Ti2O7 (JCPDS card number: 73–1699) and the corresponding peak positions are also shown in Figure 2a. Thus, it is rational to state that the solid solubility limit of Sm in SrTiO3 is less than 15 mol%. On the other hand, the diffraction peaks shifted towards higher angle with an increase in the concentration of samarium up to 15 mol% as shown in Figure 2b. All compositions were refined with Rietveld refinement using the FullProf Suite software package using Pseudo-Voigt wave function and 6th order polynomial as demonstrated in Figure 2a. The lattice parameters, cell volume, and reliability factors of Rietveld refinement are listed in Table 1.
Table 1 also shows that as the Sm concentration increases, the porosity also increases up to x = 0.15, and after that it decreases. It is also evident that, as Sm content increases in SrTiO3, the unit cell volume decreases up to 15 mol%. This may be due to the replacement of the larger Sr2+ (1.44 Å, CN 12) by the smaller Sm3+ (1.24 Å, CN 12) [29,30] which also indicates that the corresponding structural parameters follow Vegard’s rule [31,32,33].
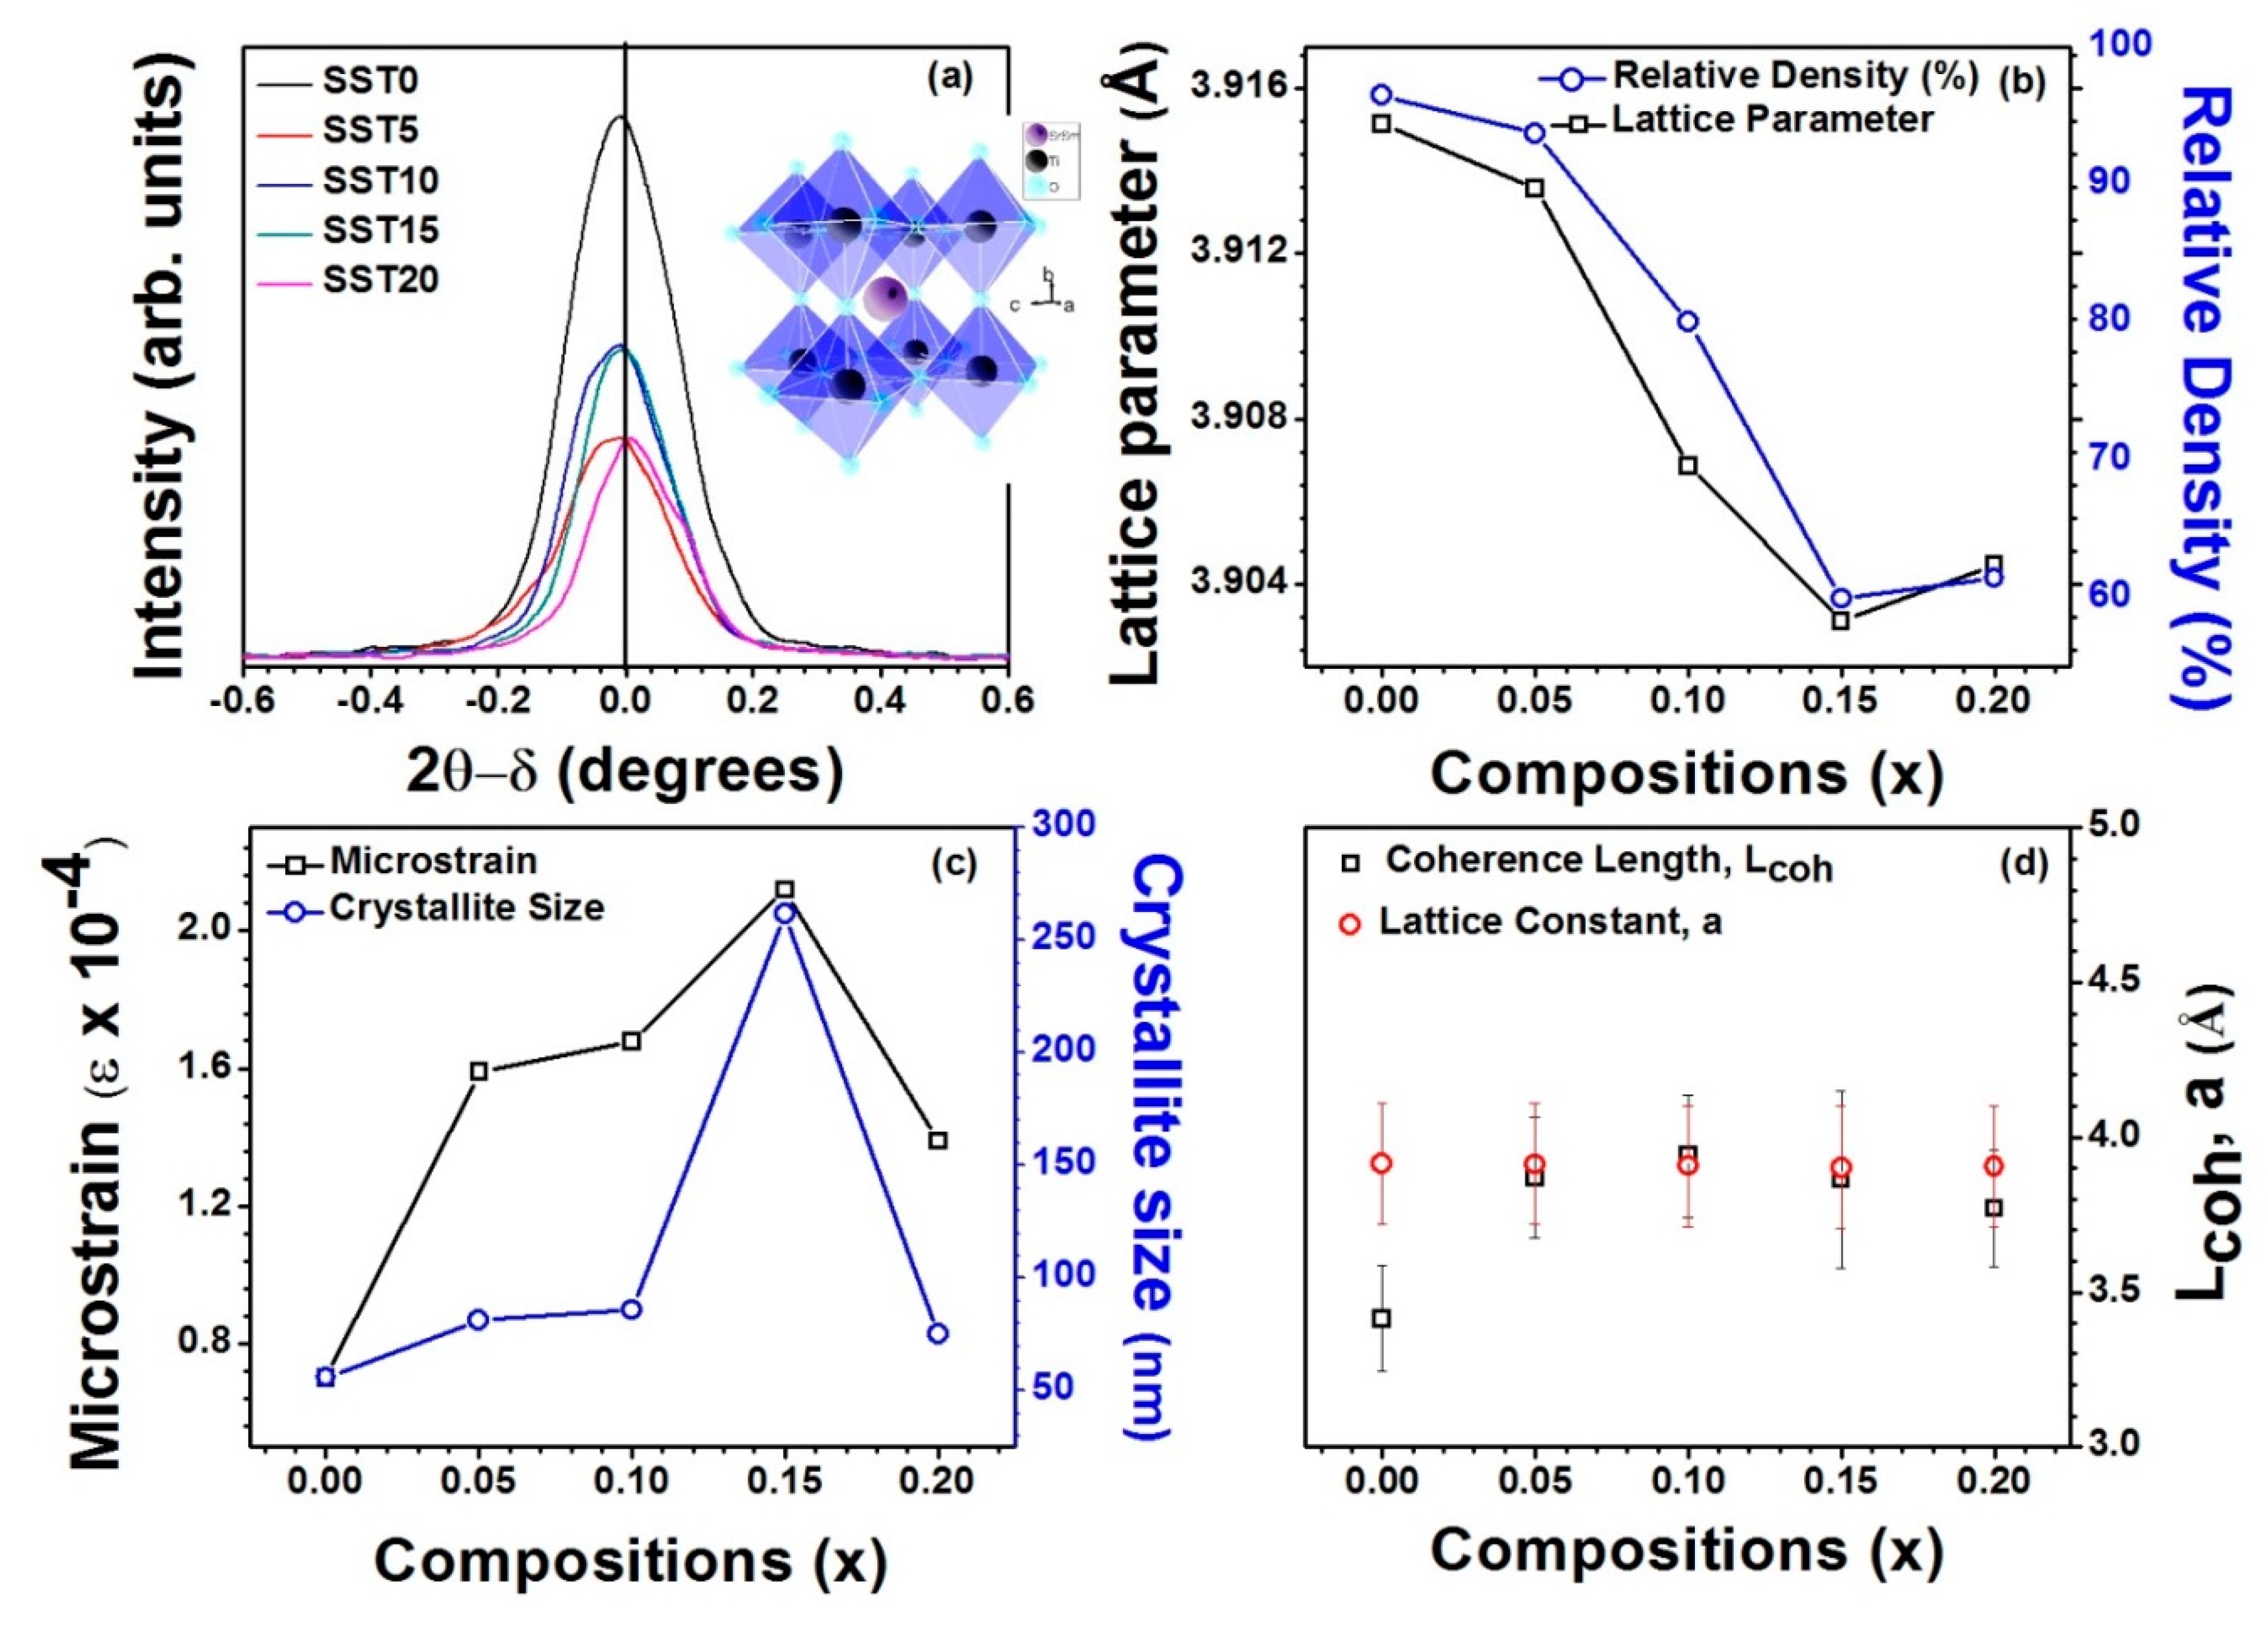
Furthermore, Figure 3a shows that the XRD peak (110) broadens with composition (x) which ensures that the formation of polarons in the system [34], and observed that the width of the XRD peak (110) increases with the increase in Sm mol% in SrTiO3. The inset of Figure 3a shows TiO6 octahedra formation in pure SrTiO3, i.e., without any distortion arising from Sm incorporation. Figure 3b shows the variation of lattice parameter and relative density with x and depicts that lattice parameter and relative density follow the same trend with x, i.e., the lattice parameter and density decrease with the increase in x up to 15. This can be attributed to smaller ionic radius of Sm3+ compared to Sr2+. And slightly increases for x > 15, due to the solubility limit. According to the Williamson–Hall (W–H) model, the microstrain and crystallite size were studied from XRD patterns [34,35,36]. The W–H model as given by:
β c o s θ = 0.9 λ t + 4 ϵ s i n ,
where β is the full width at half maxima (FWHM) at Bragg’s angle (2θ), λ is the X-ray wavelength of Cu-Kα (λ = 1.54098Å), t is the average crystallite size, and ϵ is the microstrain. The change in microstrain and crystallite size with the compositions (x) shown in Figure 3c. It was observed that the microstrain and crystallite size exhibit similar trends of variation with x, i.e., they increase with the increase in Sm content up to x = 0.15, while the microstrain and crystallite size decrease for x > 0.15 due to secondary phase formation, as shown in Figure 2a. For confirmation of polarons, the coherence length of polarons (Lcoh) was calculated and is shown in Figure 3d along with the lattice parameters. It is well known that Lcoh is less than Lattice parameters (Lcoh < a) for the formation of small polarons while Lcoh > a indicates the formation of the large polarons [37]. From Figure 3d, it is observed that Lcoh < a shows the formation of small polarons, except for x = 0.10. Therefore, there may be the possibility of large polaron formation for the SST10 sample.
It is known that large polarons correspond to electrons free to move like in a conduction band, while small polarons are described as electrons hopping between neighbouring potential wells [37]. In some cases, the transition between the two regimes is associated to a step-like increase of conductivity. Therefore, the larger conductivity of SST10 (see below) could be associated with the formation of large polarons.

3.2. Microstructural Analysis

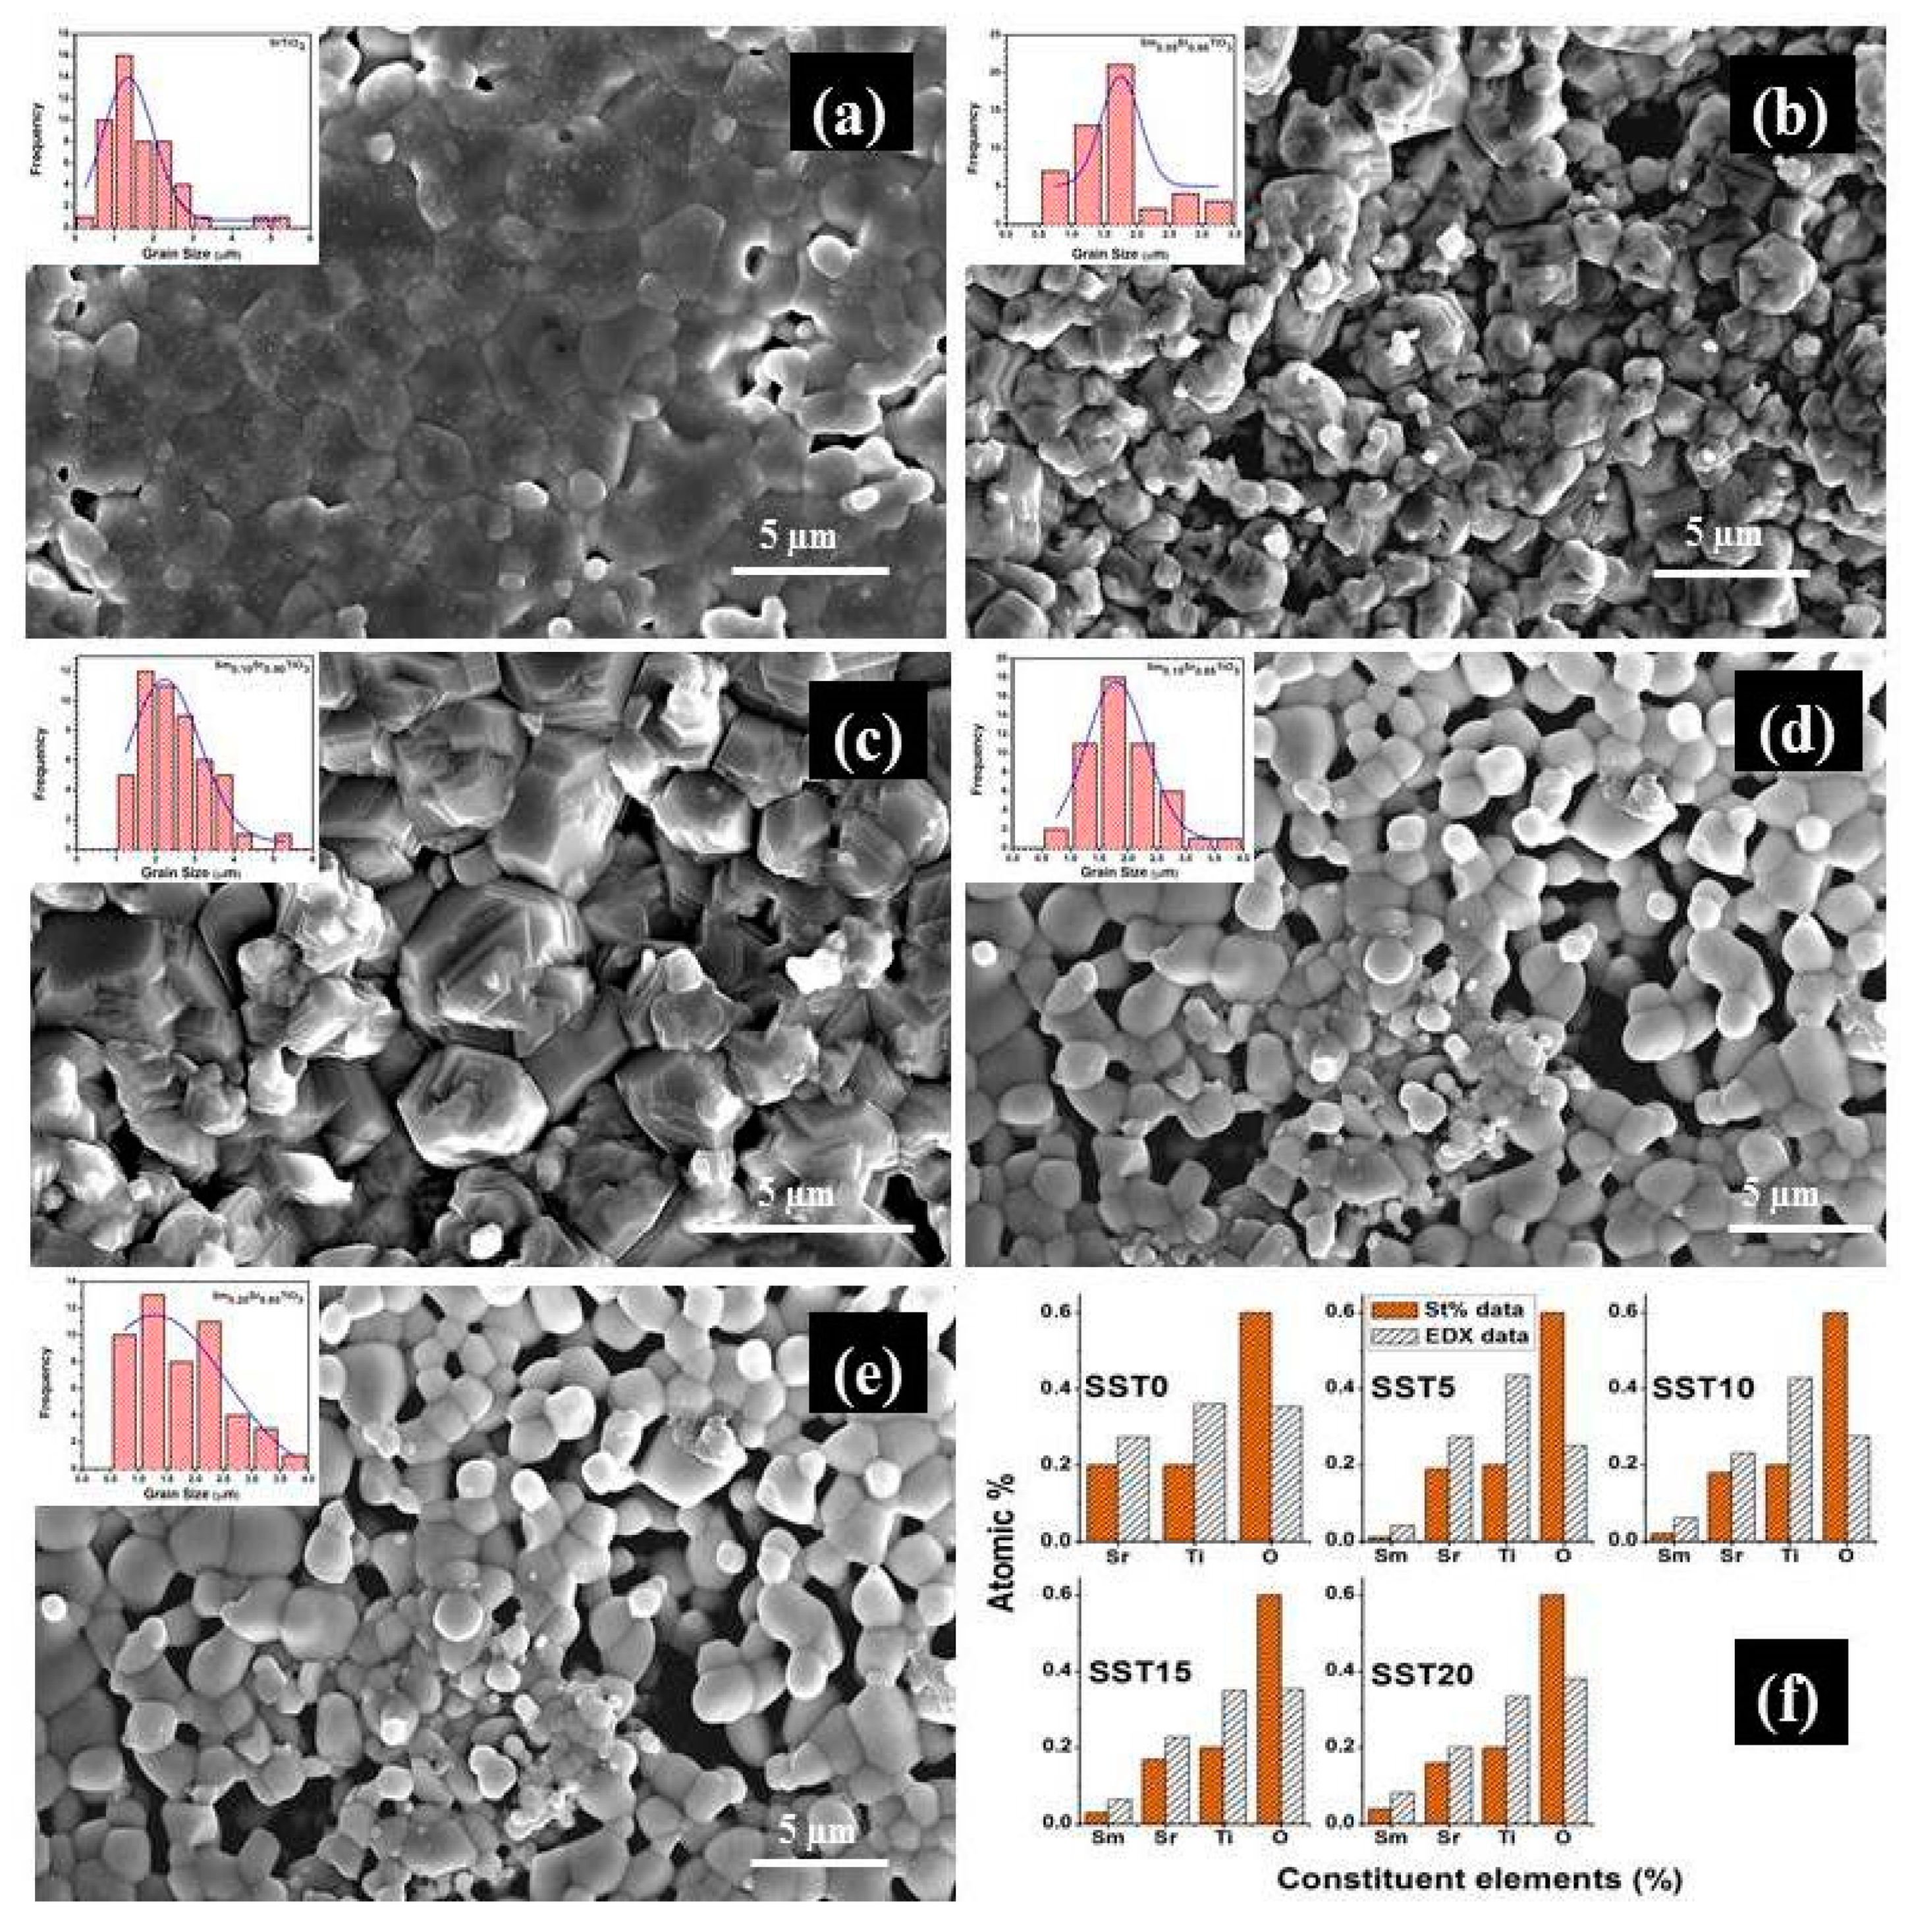
Figure 4a–e show the FESEM micrographs of fractured samples sintered at 1200 °C in air and the grain size distribution (inset). The average grain sizes of all compositions were calculated by using the linear intercept method and were found to be in the range of 1.6–2.5 µm, with largest value associated with sample SST10. In particular, the grain size of SmxSr1−xTiO3 δ samples increases with Sm-doping concentration up to x = 0.10 and decreases for x ≥ 0.15. This can be explained as an effect of Sm-doping activating grain growth during sintering [38] while the solubility limit is not exceeded. For heavy doping (≥ 15 mol), the formation of the pyrochlore secondary phase prevents the mass transportation during the sintering process, thus leading to higher porosity compared to pure SrTiO3.
EDX data were collected in various positions for all specimens. Figure 4f shows the stoichiometric and average EDX at% for all elements in different compounds. An increasing amount of Sm was found along the series, although some deviations from stoichiometric values are visible. Such deviations are largely due to the intrinsic limitation of the technique for the detection of light elements, like oxygen. However, it can be noted that the oxygen concentrations in SST15 and SST20 are significantly higher than in SST5 and SST10. This can be partially attributed to the presence of the pyrochlore secondary phase, which has a higher molar oxygen concentration than the perovskite.

3.3. XPS Analysis

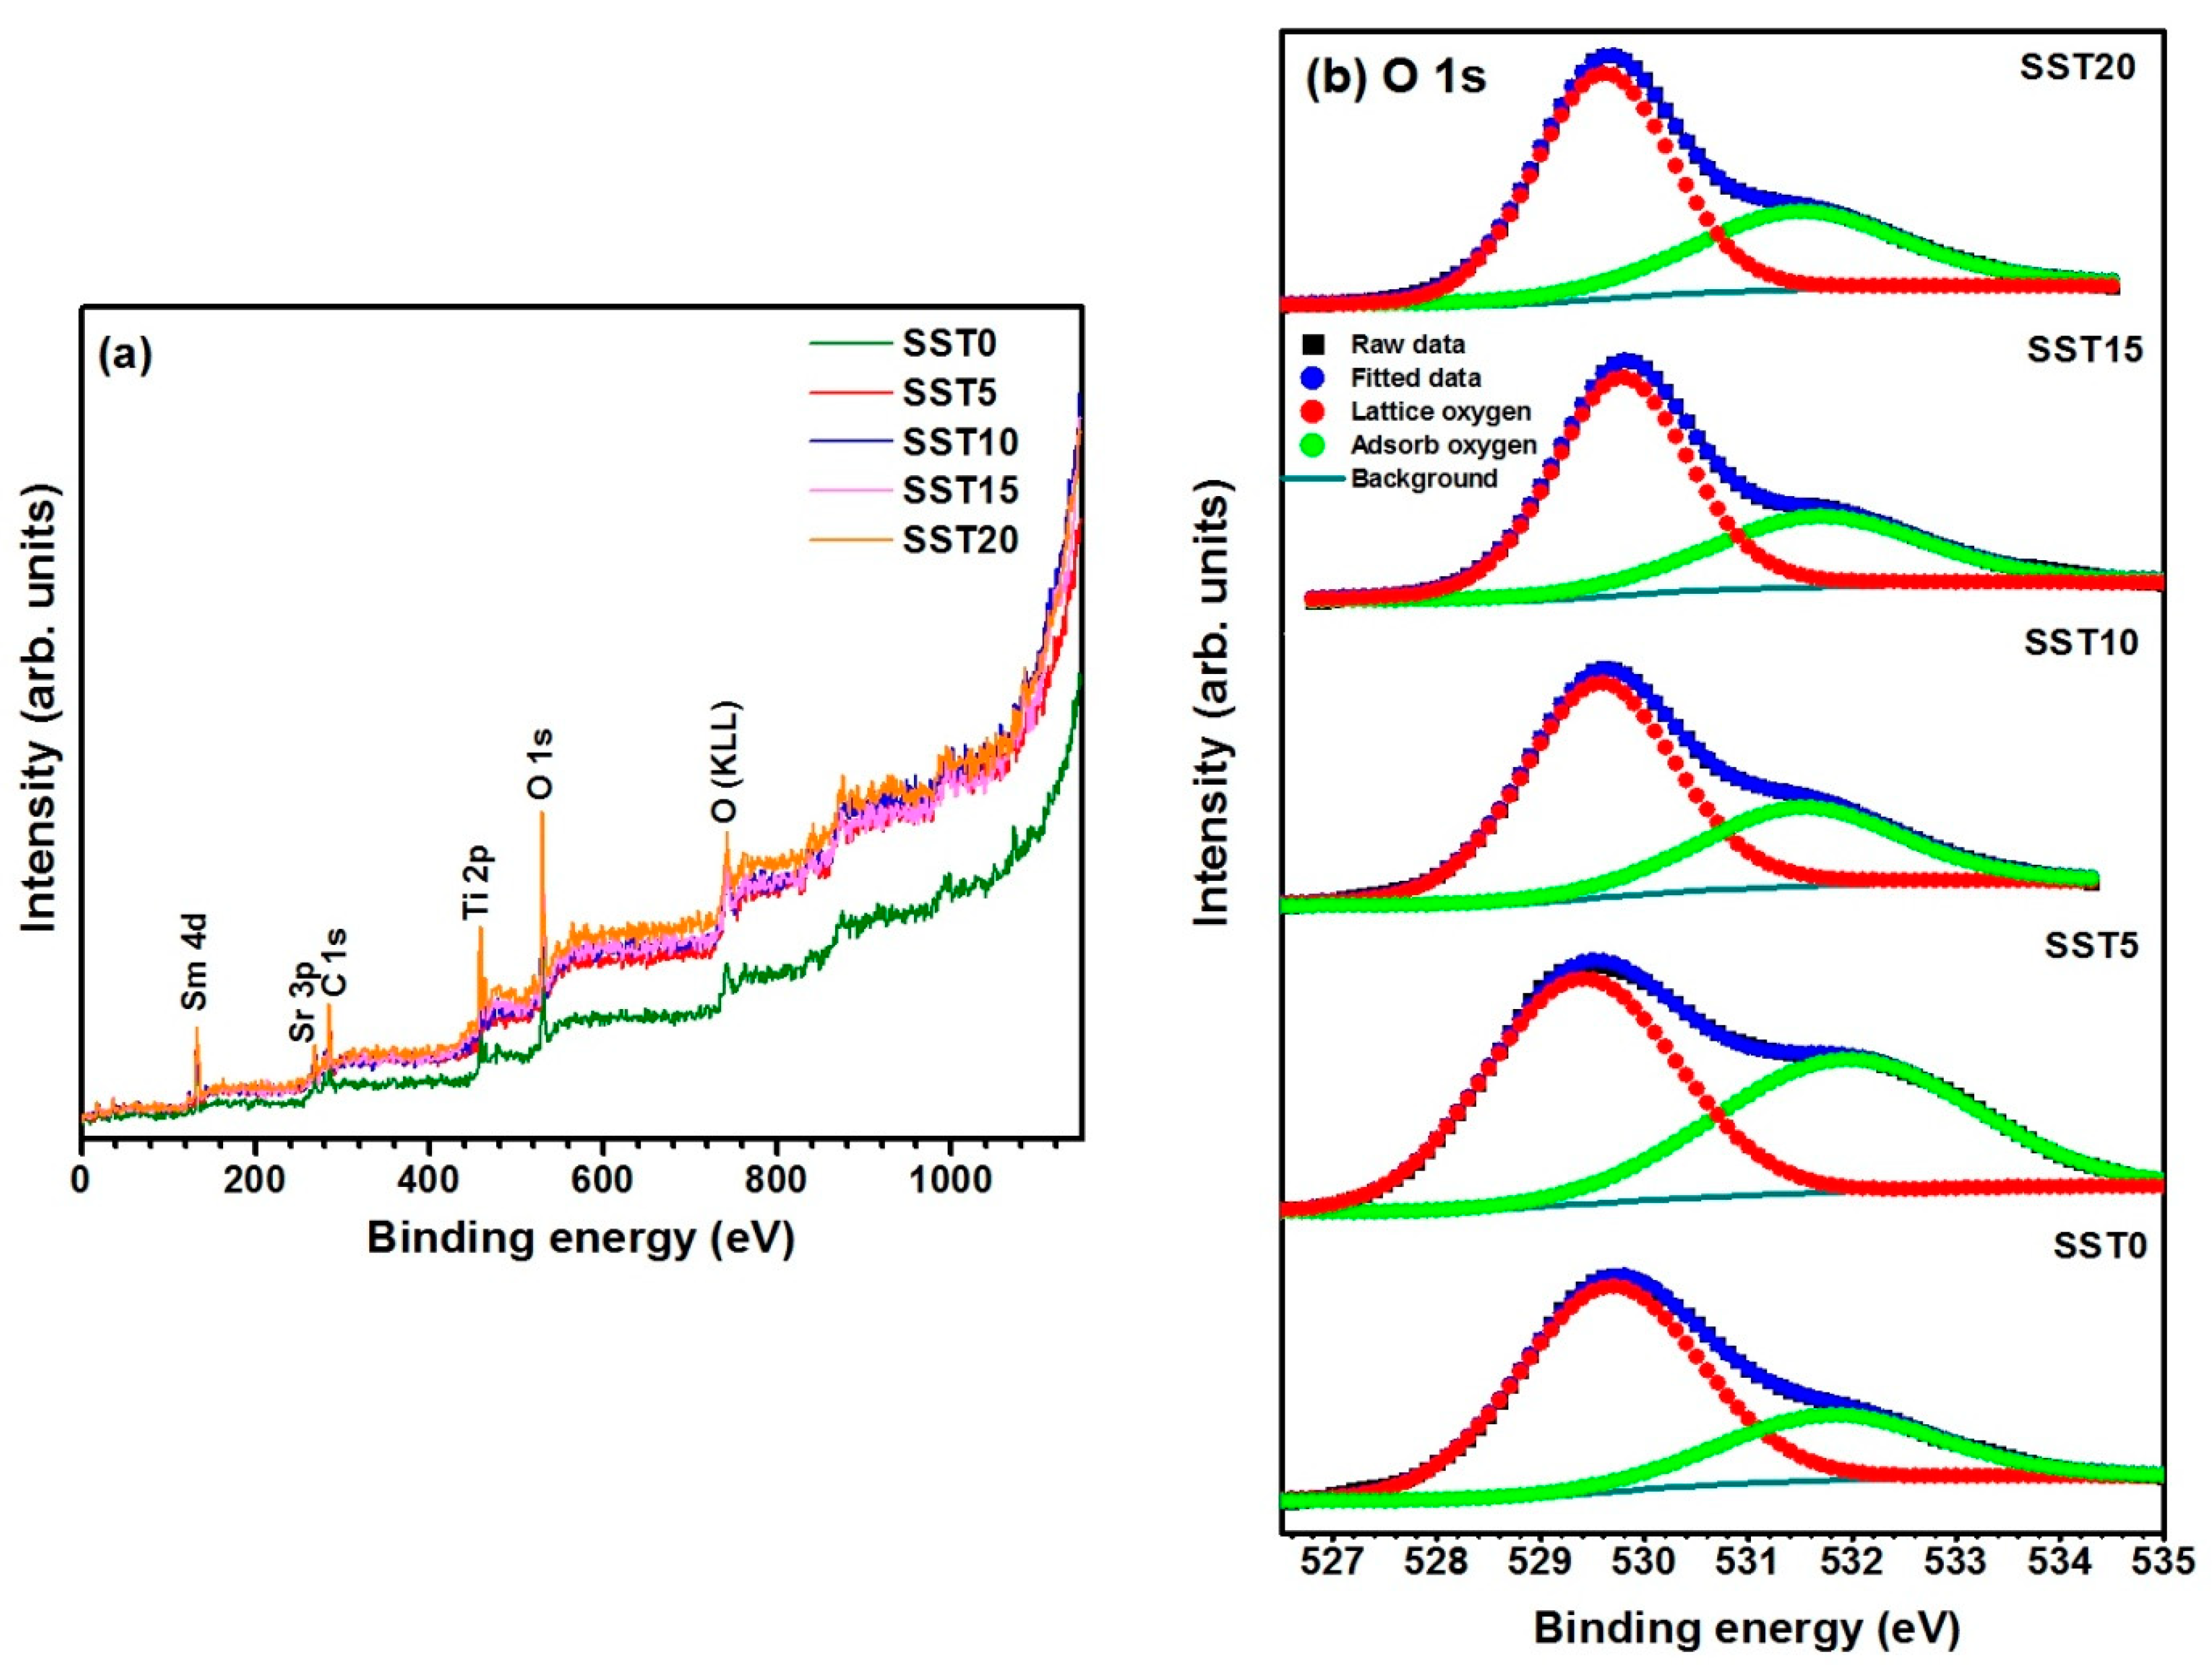
EDX analysis indicated that the samples are oxygen deficient. To verify the oxygen deficiency in the studied samples, X-ray photoelectron spectroscopy (XPS) measurements of each powdered composition were performed. Figure 5a shows the oxidation states of the constituent elements present in the SST system. The complete XPS spectra acquired under the range of 0–1150 eV which renders XPS binding energy (BE) peaks of Sm, Sr, C, Ti and O elements with satellite peaks of O (KLL). The XPS peaks of the constituent elements are assigned for different Sm substituted samples. The C 1s peak originated at ∼286 eV due to external contamination of the samples. The binding energies of the constituent elements were estimated by considering C 1s reference peak at 284.6 eV. The XPS wide spectra of all samples revealed binding energy peaks of Sm 4d at ∼130.8 eV, Sr 3p at ∼269.4 eV, Ti 2p at ∼ 459.4 eV and O 1s at ∼ 530.6 eV. With increasing Sm3+ doping concentration at the Sr site, there is a slight shift in binding energy values to the higher energy side. The O (KLL) satellite peak is also noted at ∼741.3 eV as shown in Figure 5a [39]. Furthermore, the O 1s spectral regions are used to obtain the information concerning the existence of oxygen deficiency present in the samples.
Figure 5b shows the XPS spectra of the O 1s core-level. The peaks in these spectra are broad and asymmetric in nature for all the compositions. Therefore, the peak for all the samples can be split into two peaks, owing to two different types of oxygen species, i.e., adsorbed and lattice oxygen [40]. The amount of lattice oxygen is reported in Table 2, corresponding for each sample to the ratio between the area of the sub-peak centred at 529.7 eV and the total area of the O 1s peak. This quantity is a measure of the oxygen sites’ occupancy or, equivalently, of oxygen vacancies.
The concentration of oxygen vacancies increases for x ≥ 0.1 as expected considering an increasing incorporation of Sm in the perovskite lattice. On the other hand, the lowest occupancy found in the sample SST5 can be explained as an indirect effect of porosity. When materials are fired at 1200 °C for a few hours some of the lattice oxygen is eliminated in the whole body of the ceramic. During the cooling phase, oxygen re-equilibration may be incomplete, especially if the material reaches high density. In fact, SST5 showed much higher density than other samples, which can explain the higher oxygen non-stoichiometry.

3.4. Electrical Conductivity and Chemical Stability

The impedance analysis of Sm-doped SrTiO3 samples was performed by using a frequency response analyser under the frequency range of 1–106 Hz. Several models have been suggested to understand the ion dynamics and conduction mechanism [41]. However, in the present system, Jonscher’s power law (JPL) has been used to study the ion dynamics of the specimens. The conductivity spectra of any polycrystalline materials consist of two components viz. DC and AC conductivities. Thus, the electrical conductivity can be described by Jonscher’s power law using following equation [42,43]:
σ = σ d c + A ν n ,
where σ d c is the DC conductivity, A is the pre exponential factor which depends upon temperature, ν is the frequency and n is the frequency exponent factor varies in between 0 and 1.
Figure 6a shows the conductivity spectra fitted with Jonscher’s power law (JPL) using equation. 2 for the sample SST5 in measured temperature range. The electrical conductivity under low frequency region is found to be independent of frequency which corresponds to the DC or bulk conductivity caused by the random motion of charge carriers. However, the conductivity at high frequency region is frequency dependent and successive dispersion occurs representing hopping motion of charge carriers due to relaxation processes and this also corresponds the AC conductivity [44,45]. Figure 6a clearly indicates that the conductivity spectra of SST5 found to follow Jonscher’s Power Law [46]. It was also observed that all the other samples follow the JPL at the measured temperatures. The variables σ d c , ν H and n have been obtained by fitting of data points at all the measured temperatures. The conductivity spectra were also examined to obey the scaling models. The scaling behaviour of conductivity spectra was checked by using Ghosh and Summerfield scaling laws. Ghosh scaling function using scaling parameters ν H can be expressed with the following equation [47]:
σ / σ d c = F ( ν / ν H ) ,
where F is the scaling function, independent of temperature and the scaling parameters σ d c and ν H are the DC conductivity and hopping frequency, respectively. It was observed that the conductivity spectra at measured temperatures do not merge into a single master curve in the high frequency range as shown in Figure 6b. A similar kind of pattern was also observed with the Summerfield scaling model in which ν H introduced as σ d c · T is shown in inset Figure 6b. Additonally, all the samples do not follow the time temperature superposition principle in the high frequency range. This indicates that the conduction mechanism changes along with the number of charge carriers with temperature in the high-frequency regime.
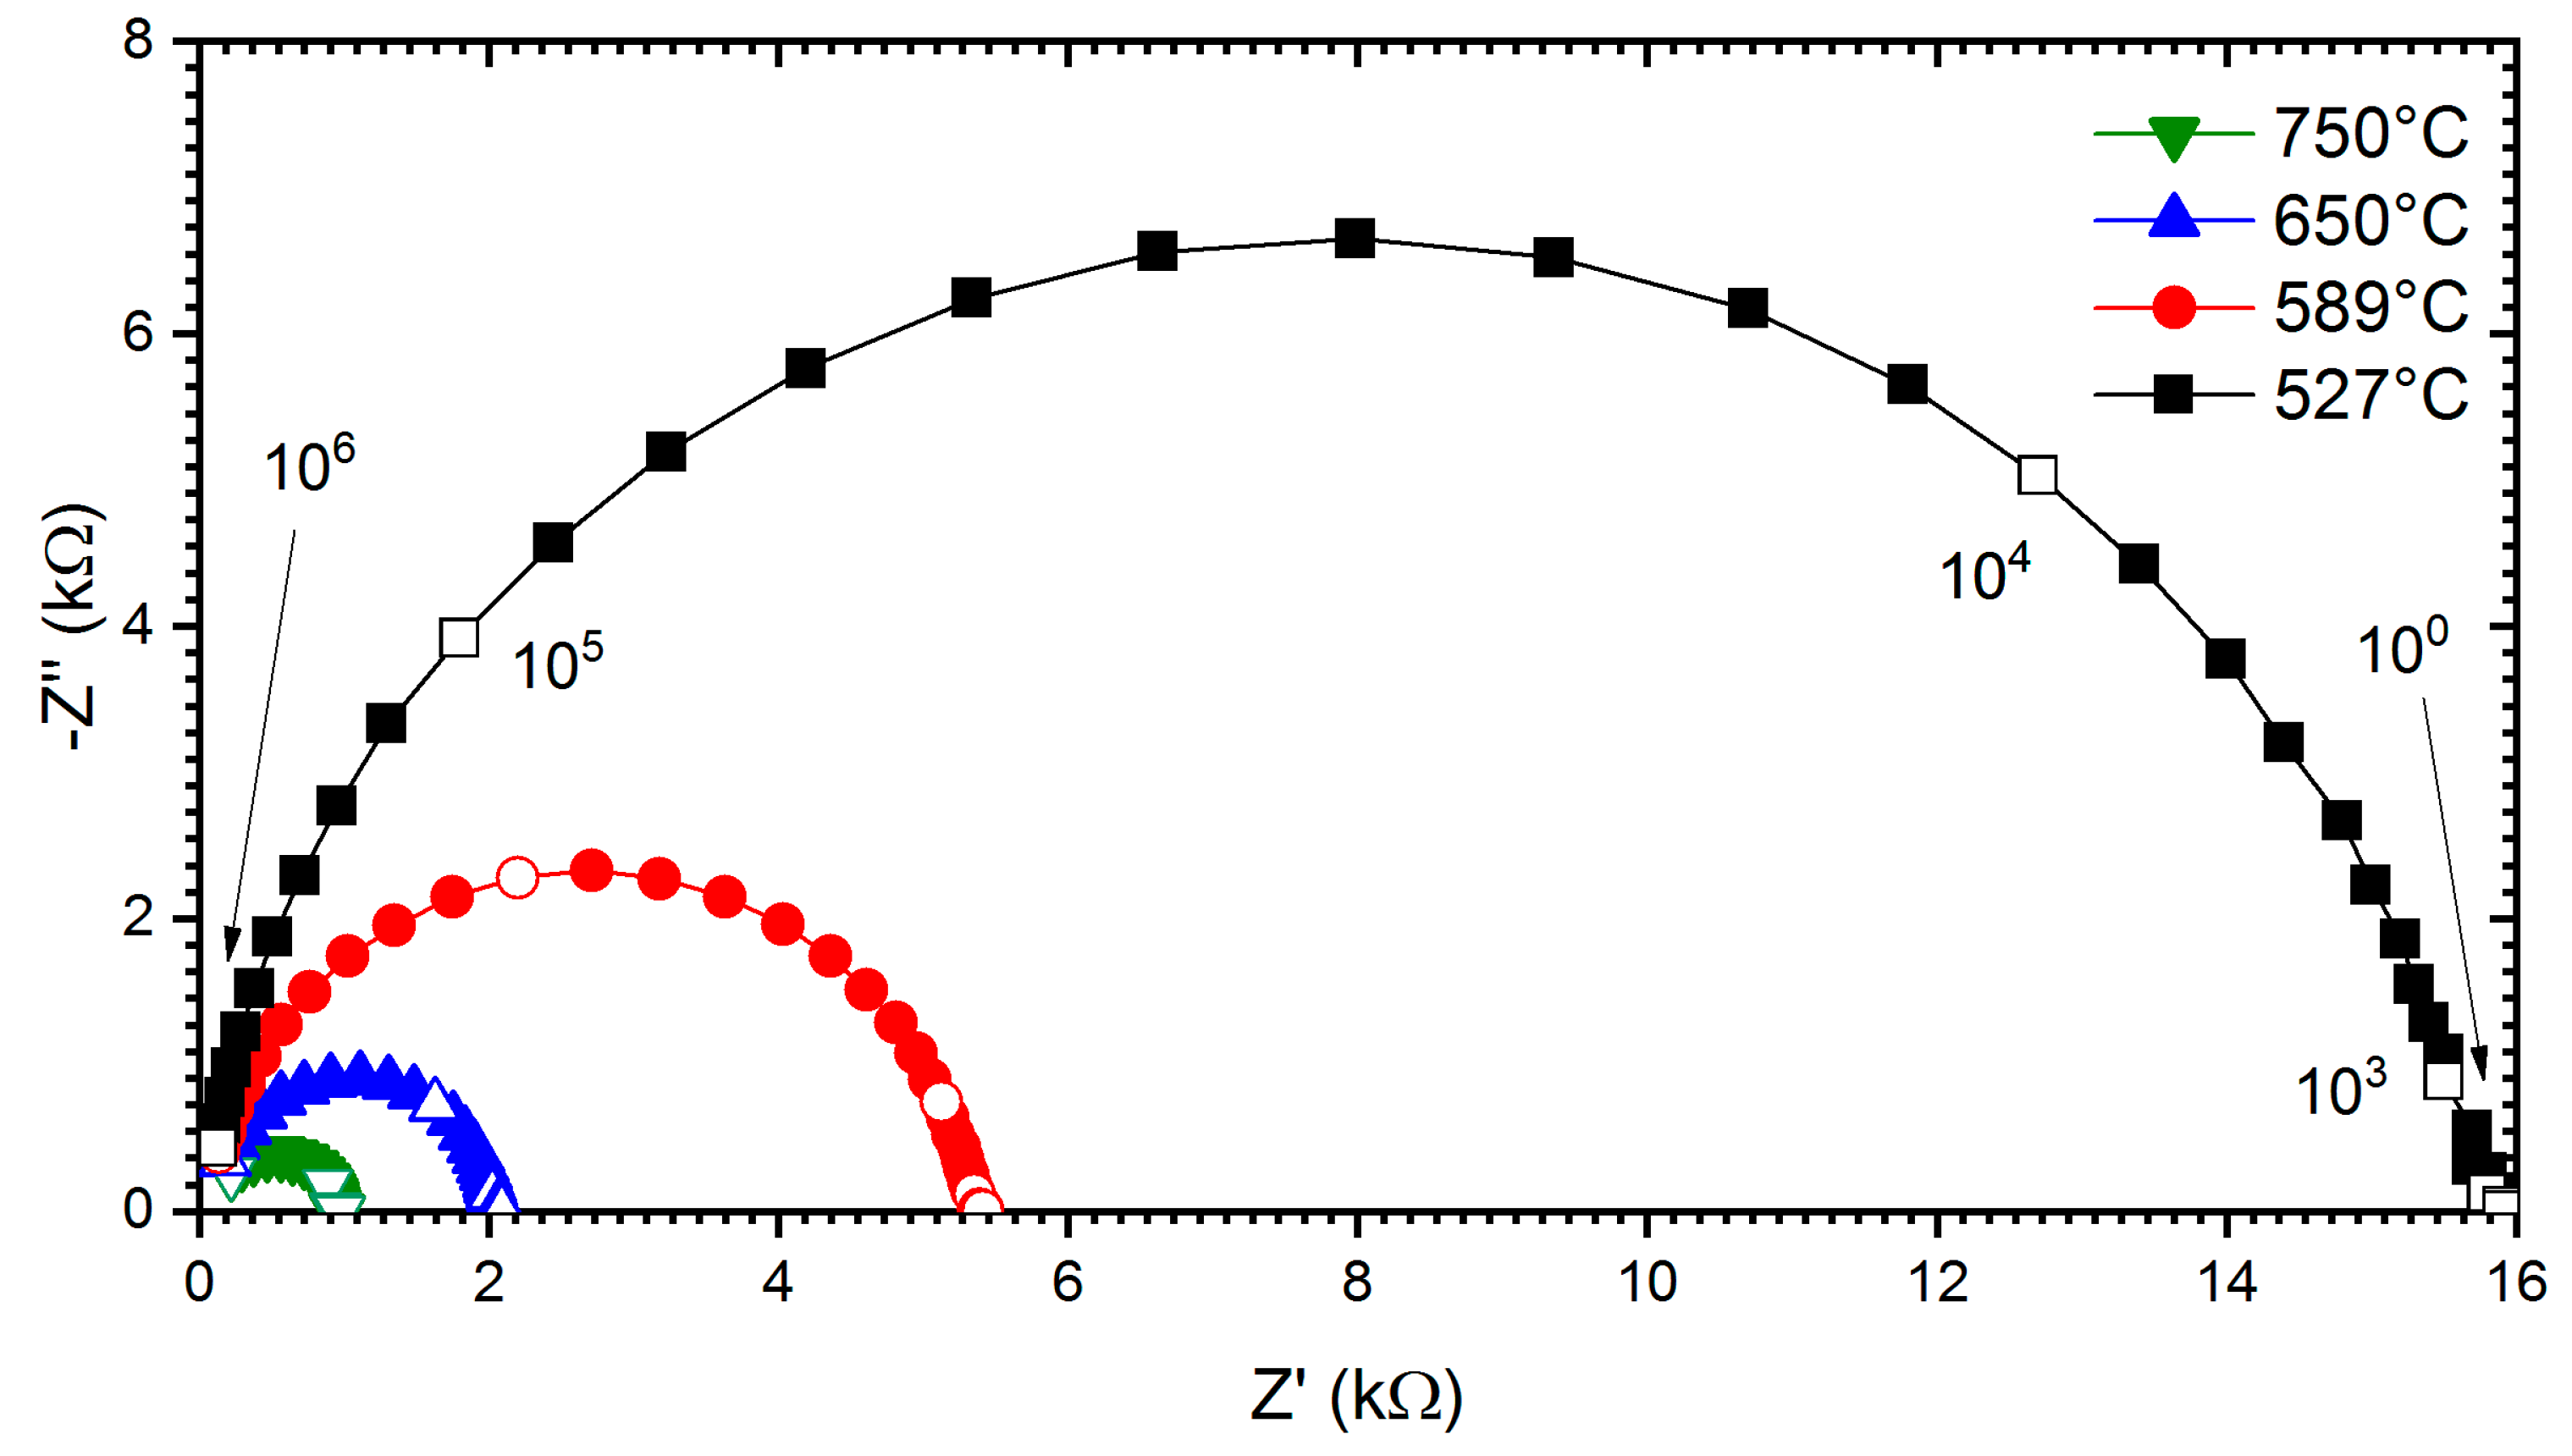
Furthermore, the electrical behaviour of all the compositions was investigated via complex impedance spectroscopy techniques. In Figure 7, the Nyquist plot shows the bulk relaxation for measured temperatures in air for the sample SST5. It was observed that the sample shows the lowest impedance at a higher temperature. The complex impedance plane plots for all other studied samples also show similar behaviour. In the studied samples, only one semi-circular arc has been observed at measured temperatures due to the grain/bulk contribution, and the frequency range of these arcs shift to the higher frequency side with increasing temperature [48,49]. From the impedance plots, the electrical conductivity of the Sm-doped SrTiO3 system was extracted by the following formula:
σ = 1 R t × l S ,
where σ, Rt, l and S are the electrical conductivity, total resistance, thickness, and surface area of the pelletized sample, respectively.
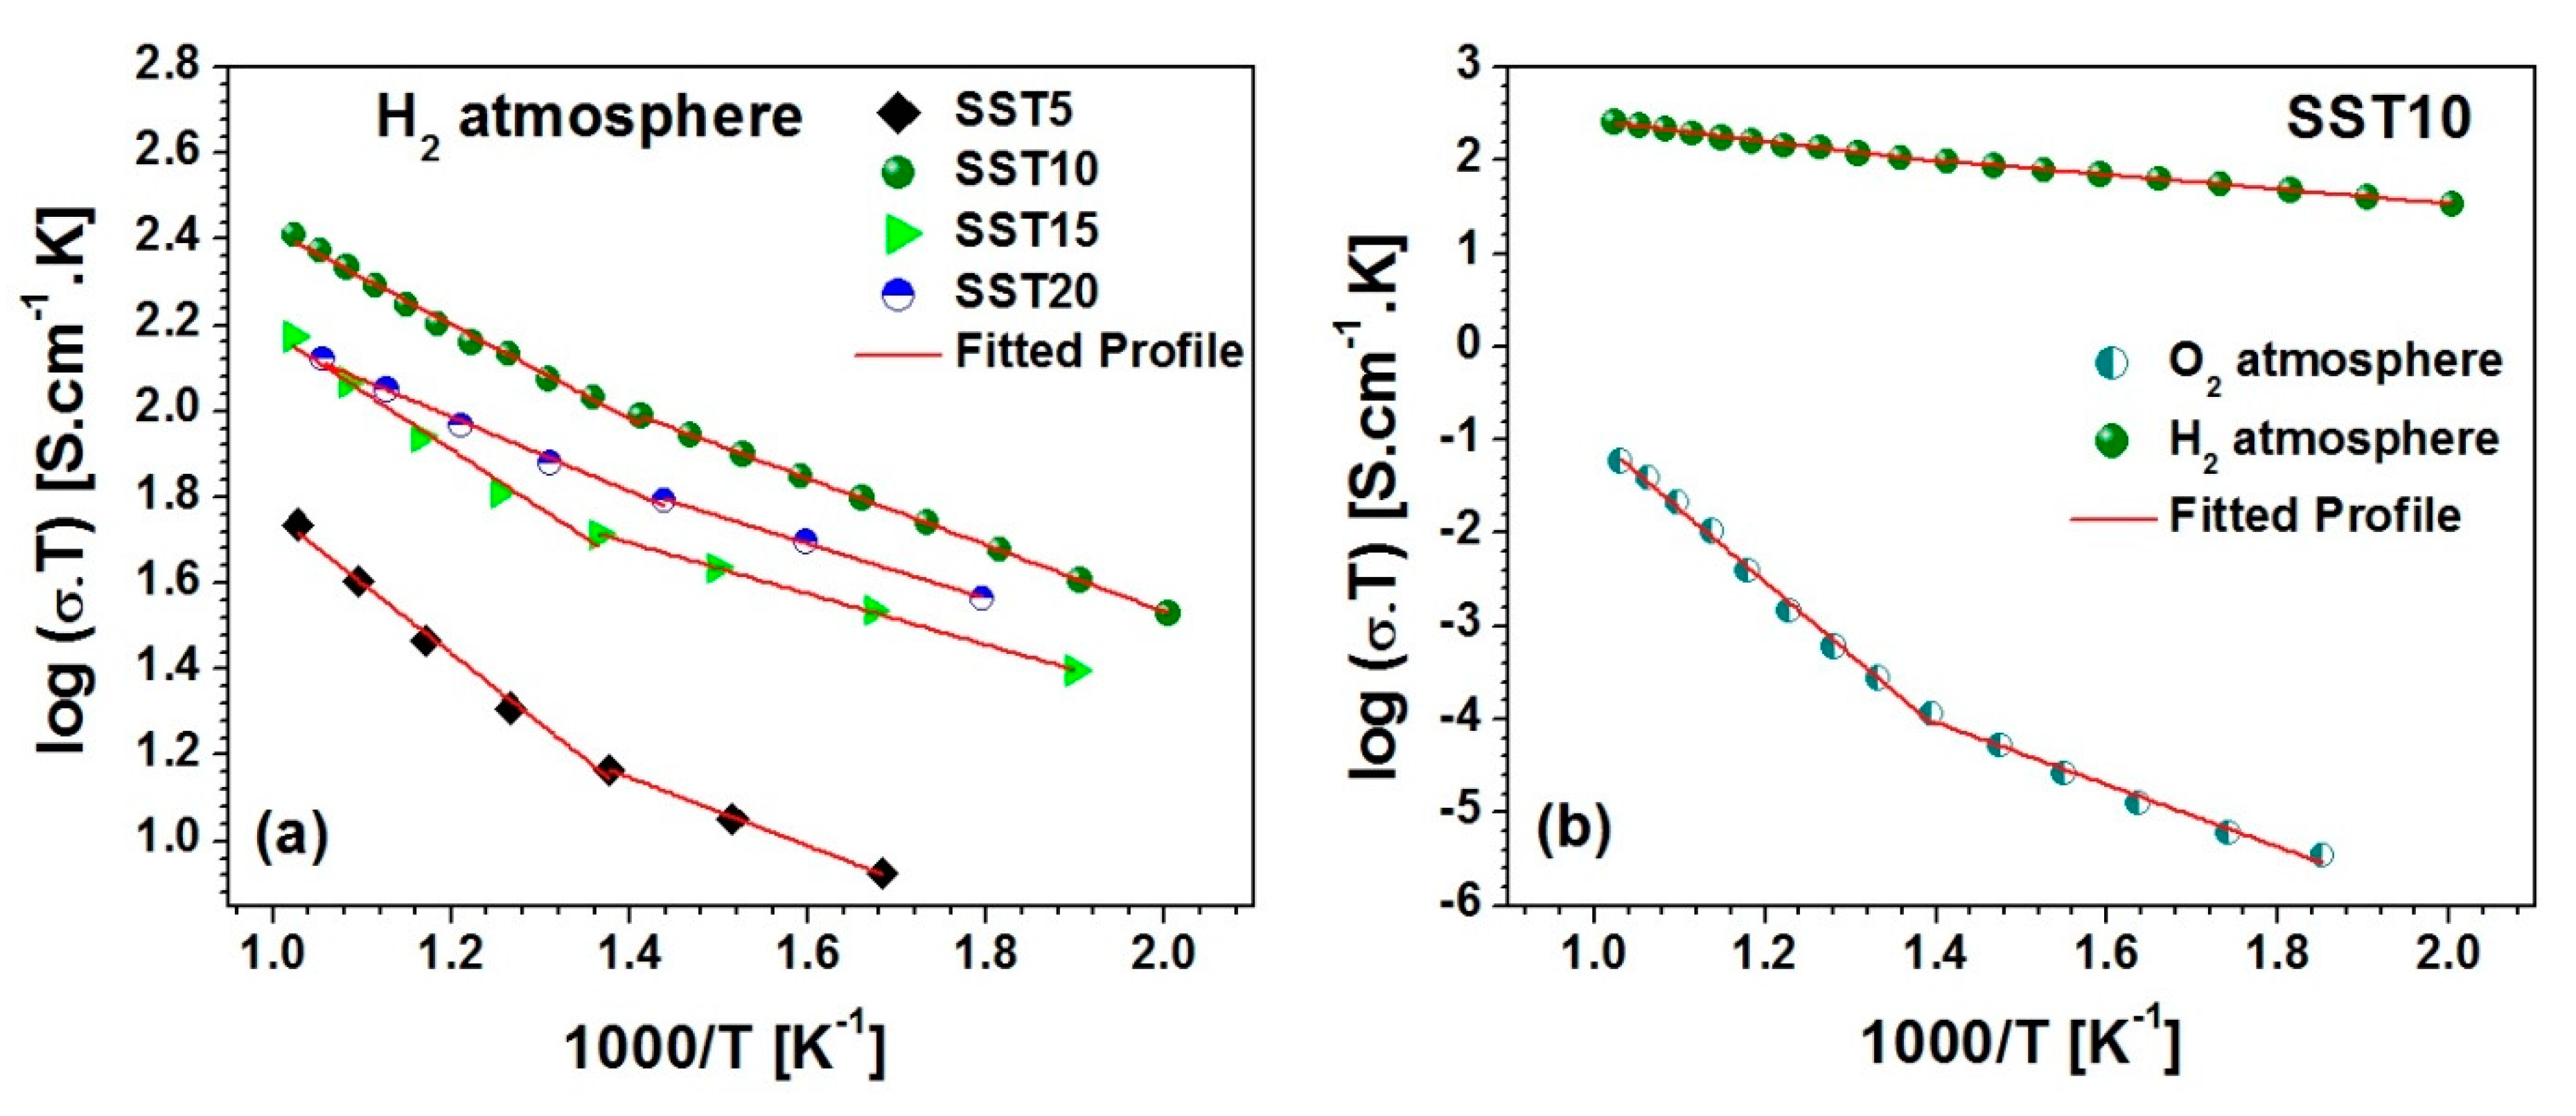
The DC electrical conductivity of all compositions has also been calculated by Jonscher’s power law in air and hydrogen atmospheres. Thereafter, the activation energy of conduction for all studied compositions was calculated by using the Arrhenius relation [50,51]:
σ = σ 0 / T · e E a / K T ,
where σ 0 , E a , K and T are the pre-exponential factor, activation energy for conduction, Boltzmann constant, and absolute temperature, respectively. The Arrhenius plot between log (σT) and 1000/T for Sm-doped samples in a H2 atmosphere is shown in Figure 8a. The Arrhenius plot exhibits two slopes in the two temperature ranges (i.e., 200–450 °C, 450–700 °C) for the studied samples [52], as shown in Figure 8a,b. The maximum activation energy (Ea) is found to be 0.325 eV for the system in a H2 atmosphere, which indicates high electronic contribution as reported in Table 2. It was observed that SST10 possesses the highest conductivity (i.e., 2.6 × 10⁻¹ S.cm−1 at 700 °C) with 0.218 eV activation energy.
It is observed that SST10 possesses higher conductivity in both atmospheres. An activation energy lower than 0.5 eV indicates that the samples contribute to more electronic conductivity than ionic conductivity [53], as shown in Table 2. Additionally, the grain size of the SST10 sample is larger in comparison to others, resulting in a lower concentration of grain boundaries which frequently reduce the total conductivity.
The conductivity of SST10 is also considerable when compared to other doped SrTiO3 compositions. For comparison’s sake, the conductivity at 650 °C of SST10 and other reference materials are reported in Table 3. The reducing conditions, i.e., the temperature and time of treatment under a reducing atmosphere, clearly influence the total conductivity. However, SST10 shows a higher conductivity among compositions treated at temperatures ≤ 850 °C.
Additionally, with the substitution of Sm, there is a slight decrease in the lattice parameters, whereas, for 10 mol% Sm-substituted SrTiO3, no appreciable change in the lattice parameters in comparison to pure SrTiO3 is observed. Further, these samples are found to be oxygen-deficient samples as confirmed through XPS or EDX analysis. The increased conductivity after reduction could also be understood by defect chemistry.
The lattice oxygen might be lost under reducing atmosphere and thus oxygen vacancies will be generated according to the following defect equation:
2 T i O 2 2 T i T i + V O · · + 3 O O x + 1 2 O 2 ,
and the following defect equation must be satisfied for balancing the electro-neutrality:
[ T i T i ] = [ S m S r · ] + 2 [ V O · · ] ,
Therefore, both extrinsic defects, caused by the Sm doping at the Sr-site and intrinsic oxygen vacancies [59], formed under the reducing conditions, subsidize the formation of electrons and the increase of electrical conductivity. The investigation of chemical stability for the reduced compositions was performed by XRD measurements and microstructural studies. From the results as reported in Figure 9, it was found that the XRD patterns of the samples SST5, SST10, SST15, and SST20 show similarity with earlier samples, and no signature of structural and chemical degradations was observed [60,61].
Additionally, FESEM images of corresponding reduced compositions (inset in Figure 9) also confirm that the microstructure was not modified by reduction. Moreover, the XRD peaks of all reduced samples have been slightly shifted towards the right which illustrated lattice contraction. In a H2 atmosphere, the lattice contraction may be attributed to increasing the defects along with oxygen vacancies. Amongst all the explored samples, the most capable anodic material for SOFCs was Sm0.10Sr0.90TiO3−δ, due to its excellent chemical stability without involvement of a secondary phase coupled with high electrical conductivity under reducing conditions [62].

4. Conclusions

The structural and electrical properties of Sm-substituted SrTiO3 (SST) were studied to investigate its suitability as an anode material for SOFCs. SST compositions exhibit high electrical conductivity with excellent chemical stability in reducing atmospheres. It was observed that Sm-substitution at the Sr site was compensated by the formation of electrons. Therefore, there is a decrease in the lattice parameters observed up to the solubility limit. Ghosh and Summerfield scaling laws also predict the change in the conduction mechanism at a higher frequency range and it also depends upon the temperature. The Sr0.90Sm0.10TiO3−δ (SST10) sample shows higher electronic conductivity rather than ionic conductivity without involvement of a secondary phase. Hence, the Sr0.90Sm0.10TiO3−δ (SST10) can be proposed as a suitable anode material for SOFC applications.

Author Contributions

Conceptualization: S.S., R.P., S.P., M.P.C., A.B., M.V. and P.S.; methodology: S.S., R.P. and P.S.; formal analysis: S.S. and S.P.; investigation: S.S., R.P., S.P., M.P.C. and A.B.; writing—original draft preparation: S.S.; writing—review and editing: R.P., S.P., M.V. and P.S.; supervision: M.V. and P.S.

Funding

This research was funded by the BRNS, India through the project grant no. 34/14/15/2015/BRNS.

Acknowledgments

Authors are thankful to A. S. K. Sinha for providing the XPS facility.

Conflicts of Interest

The authors declare no conflict of interest.

References

  1. De Lorenzo, G.; Fragiacomo, P. Electrical and thermal analysis of an intermediate temperature IIR-SOFC system fed by biogas. Energy Sci. Eng. 2018, 6, 60–72. [Google Scholar] [CrossRef] [Green Version]
  2. Fragiacomo, P.; Corigliano, O.; De Lorenzo, G.; Mirandola, F.A. Experimental Activity on a 100-W IT-SOFC Test Bench Fed by Simulated Syngas. J. Energy Eng. 2018, 144, 04018006. [Google Scholar] [CrossRef]
  3. Lo Faro, M.; Trocino, S.; Zignani, S.C.; Italiano, C.; Vita, A.; Aricò, A.S. Study of a solid oxide fuel cell fed with n-dodecane reformate. Part II: Effect of the reformate composition. Int. J. Hydrog. Energy 2017, 42, 1751–1757. [Google Scholar] [CrossRef]
  4. Lo Faro, M.; Trocino, S.; Campagna Zignani, S.; Machado Reis, R.; Monforte, G.; Ticianelli, E.A.; Arico, A.S. Ni-based Alloys as Protective Layer for a Conventional Solid Oxide Fuel Cell Fed with Biofuels. ECS Trans. 2015, 68, 2653–2658. [Google Scholar] [CrossRef]
  5. Yang, C.; Ren, C.; Yu, L.; Jin, C. High performance intermediate temperature micro-tubular SOFCs with Ba0.9Co0.7Fe0.2Nb0.1O3−δ as cathode. Int. J. Hydrog. Energy 2013, 38, 15348–15353. [Google Scholar] [CrossRef]
  6. Miyake, M.; Matsumoto, S.; Iwami, M.; Nishimoto, S.; Kameshima, Y. Electrochemical performances of Ni1−xCux/SDC cermet anodes for intermediate-temperature SOFCs using syngas fuel. Int. J. Hydrog. Energy 2016, 41, 13625–13631. [Google Scholar] [CrossRef]
  7. Fragiacomo, P.; De Lorenzo, G.; Corigliano, O. Performance Analysis of an Intermediate Temperature Solid Oxide Electrolyzer Test Bench under a CO2-H2O Feed Stream. Energies 2018, 11, 2276. [Google Scholar] [CrossRef]
  8. Milewski, J.; Wołowicz, M.; Lewandowski, J. Comparison of SOE/SOFC system configurations for a peak hydrogen power plant. Int. J. Hydrog. Energy 2017, 42, 3498–3509. [Google Scholar] [CrossRef]
  9. Steele, B.C.H.; Heinzel, A. Materials for fuel-cell technologies. Nature 2001, 414, 345–352. [Google Scholar] [CrossRef]
  10. Zhang, X.; Liu, L.; Zhao, Z.; Tu, B.; Ou, D.; Cui, D.; Wei, X.; Chen, X.; Cheng, M. Enhanced Oxygen Reduction Activity and Solid Oxide Fuel Cell Performance with a Nanoparticles-Loaded Cathode. Nano Lett. 2015, 15, 1703–1709. [Google Scholar] [CrossRef]
  11. Da Silva, F.S.; de Souza, T.M. Novel materials for solid oxide fuel cell technologies: A literature review. Int. J. Hydrog. Energy 2017, 42, 26020–26036. [Google Scholar] [CrossRef] [Green Version]
  12. Rashid, N.; Samat, A.; Jais, A.; Somalu, M.; Muchtar, A.; Baharuddin, N.; Isahak, W. Review on zirconate-cerate-based electrolytes for proton-conducting solid oxide fuel cell. Ceram. Int. 2019, 45, 6605–6615. [Google Scholar] [CrossRef]
  13. Presto, S.; Barbucci, A.; Viviani, M.; Ilhan, Z.; Ansar, S.A.; Soysal, D.; Thorel, A.; Abreu, J.; Chesnaud, A.; Politova, T.; et al. IDEAL-cell, an innovative dual membrane fuel-cell: Fabrication and electrochemical testing of first prototypes. ECS Trans. 2009, 25, 773–782. [Google Scholar]
  14. Singh, R.K.; Singh, P. Electrical conductivity of LSGM–YSZ composite materials synthesized via coprecipitation route. J. Mater. Sci. 2014, 49, 5571–5578. [Google Scholar]
  15. Artini, C.; Carnasciali, M.M.; Viviani, M.; Presto, S.; Plaisier, J.R.; Costa, G.A.; Pani, M. Structural properties of Sm-doped ceria electrolytes at the fuel cell operating temperatures. Solid State Ion. 2018, 315, 85–91. [Google Scholar] [CrossRef]
  16. Brunaccini, G.; Lo Faro, M.; La Rosa, D.; Antonucci, V.; Aricò, A.S. Investigation of composite Ni-doped perovskite anode catalyst for electrooxidation of hydrogen in solid oxide fuel cell. Int. J. Hydrog. Energy 2008, 33, 3150–3152. [Google Scholar] [CrossRef]
  17. Presto, S.; Barbucci, A.; Carpanese, M.P.; Viviani, M.; Marazza, R. Electrochemical performance of Ni-based anodes for solid oxide fuel cells. J. Appl. Electrochem. 2009, 39, 2257–2264. [Google Scholar] [CrossRef]
  18. Li, X.; Zhao, H.; Zhou, X.; Xu, N.; Xie, Z.; Chen, N. Electrical conductivity and structural stability of La-doped SrTiO3 with A-site deficiency as anode materials for solid oxide fuel cells. Int. J. Hydrog. Energy 2010, 35, 7913–7918. [Google Scholar] [CrossRef]
  19. Verbraeken, M.C.; Ramos, T.; Agersted, K.; Ma, Q.; Savaniu, C.D.; Sudireddy, B.R.; Irvine, J.T.S.; Holthappels, P.; Tietz, F. Modified strontium titanates: From defect chemistry to SOFC anodes. RSC Adv. 2015, 5, 1168–1180. [Google Scholar] [CrossRef]
  20. Moos, R.; Härdtl, K.H. Electronic transport properties of Sr1−xLaxTiO3 ceramics. J. Appl. Phys. 1996, 80, 393–400. [Google Scholar] [CrossRef]
  21. Slater, P.R.; Fagg, D.P.; Irvine, J.T.S. Synthesis and electrical characterisation of doped perovskite titanates as potential anode materials for solid oxide fuel cells. J. Mater. Chem. 1997, 7, 2495–2498. [Google Scholar] [CrossRef]
  22. Hui, S.; Petric, A. Electrical Properties of Yttrium-Doped Strontium Titanate under Reducing Conditions. J. Electrochem. Soc. 2002, 149, J1–J10. [Google Scholar] [CrossRef]
  23. Li, X.; Zhao, H.; Gao, F.; Zhu, Z.; Chen, N.; Shen, W. Synthesis and electrical properties of Co-doped Y0.08Sr0.92TiO3−δ as a potential SOFC anode. Solid State Ion. 2008, 179, 1588–1592. [Google Scholar] [CrossRef]
  24. Shannon, R.D. Revised effective ionic radii and systematic studies of interatomic distances in halides and chalcogenides. Acta Crystallogr. Sect. A 1976, 32, 751–767. [Google Scholar] [CrossRef]
  25. Wang, Y.; Lee, K.H.; Hyuga, H.; Kita, H.; Inaba, K.; Ohta, H.; Koumoto, K. Enhancement of Seebeck coefficient for SrO(SrTiO3)2 by Sm substitution: Crystal symmetry restoration of distorted TiO6 octahedra. Appl. Phys. Lett. 2007, 91, 242102. [Google Scholar] [CrossRef]
  26. Panahi, S.N.; Samadi, H.; Nemati, A. Effect of Samarium Oxide on the Electrical Conductivity of Plasma-Sprayed SOFC Anodes. JOM 2016, 68, 2569–2573. [Google Scholar] [CrossRef]
  27. Goldschmidt, V.M. Die Gesetze der Krystallochemie. Die Nat. 1926, 21, 477–485. [Google Scholar] [CrossRef]
  28. Goldschmidt, V.M. Crystal structure and chemical composition. Ber. Dtsch. Chem. Ges. 1927, 60, 1263–1268. [Google Scholar] [CrossRef]
  29. Maletic, S.; Popovic, D.; Dojcilovic, J. Dielectric measurements, Raman scattering and surface studies of Sm-doped SrTiO3 single crystal. J. Alloy. Compd. 2010, 496, 388–392. [Google Scholar] [CrossRef]
  30. Ma, Q.; Tietz, F.; Stöver, D. Nonstoichiometric Y-substituted SrTiO3 materials as anodes for solid oxide fuel cells. Solid State Ion. 2011, 192, 535–539. [Google Scholar] [CrossRef]
  31. Johnson, D.W.; Cross, L.E.; Hummel, F.A. Dielectric Relaxation in Strontium Titanates Containing Rare–Earth Ions. J. Appl. Phys. 1970, 41, 2828–2833. [Google Scholar] [CrossRef]
  32. Eror, N.G.; Balachandran, U. Self-compensation in lanthanum-doped strontium titanate. J. Solid State Chem. 1981, 40, 85–91. [Google Scholar] [CrossRef]
  33. Bamberger, C.E. Homogeneity Ranges of Phases Sr4−xLn2x/3Ti4O12 (Ln = Sm to Lu) and Sr1−yEuy∥TiO3. J. Am. Ceram. Soc. 2005, 80, 1024–1026. [Google Scholar] [CrossRef]
  34. Shimomura, S.; Wakabayashi, N.; Kuwahara, H.; Tokura, Y. X-Ray Diffuse Scattering due to Polarons in a Colossal Magnetoresistive Manganite. Phys. Rev. Lett. 1999, 83, 4389–4392. [Google Scholar] [CrossRef]
  35. Ohon, N.; Stepchuk, R.; Blazhivskyi, K.; Vasylechko, L. Structural Behaviour of Solid Solutions in the NdAlO3-SrTiO3 System. Nanoscale Res. Lett. 2017, 12, 148. [Google Scholar] [CrossRef]
  36. Prabhu, Y.T.; Rao, K.V.; Kumar, V.S.S.; Kumari, B.S. X-ray Analysis by Williamson-Hall and Size-Strain Plot Methods of ZnO Nanoparticles with Fuel Variation. World. J. Nano Sci. Eng. 2014, 4, 21–28. [Google Scholar] [CrossRef]
  37. Mannella, N.; Yang, W.L.; Tanaka, K.; Zhou, X.J.; Zheng, H.; Mitchell, J.F.; Zaanen, J.; Devereaux, T.P.; Nagaosa, N.; Hussain, Z.; et al. Polaron coherence condensation as the mechanism for colossal magnetoresistance in layered manganites. Phys. Rev. B 2007, 76, 233102. [Google Scholar] [CrossRef] [Green Version]
  38. Nasar, R.S.; Cerqueira, M.; Longo, E.; Varela, J.A. Sintering mechanisms of ZrO2·MgO with addition of TiO2 and CuO. Ceram. Int. 2004, 30, 571–577. [Google Scholar] [CrossRef]
  39. Singh, P. Influence of Bi2O3 additive on the electrical conductivity of calcia stabilized zirconia solid electrolyte. J. Eur. Ceram. Soc. 2015, 35, 1485–1493. [Google Scholar]
  40. Kumar, P.; Presto, S.; Sinha, A.S.K.; Varma, S.; Viviani, M.; Singh, P. Effect of samarium (Sm3+) doping on structure and electrical conductivity of double perovskite Sr2NiMoO6 as anode material for SOFC. J. Alloys Compd. 2017, 725, 1123–1129. [Google Scholar] [CrossRef]
  41. Aziz, S.B.; Woo, T.J.; Kadir, M.F.Z.; Ahmed, H.M. A conceptual review on polymer electrolytes and ion transport models. J. Sci. Adv. Mater. Devices 2018, 3, 1–17. [Google Scholar] [CrossRef]
  42. Praharaj, S.; Rout, D. Study of electrical properties of Pb(Yb0.5Ta0.5)O3 by impedance spectroscopy. IOP Conf. Ser. Mater. Sci. Eng. 2016, 149, 12181. [Google Scholar] [CrossRef]
  43. Dhahri, A.; Dhahri, E.; Hlil, E.K. Electrical conductivity and dielectric behaviour of nanocrystalline La0.6Gd0.1Sr0.3Mn0.75Si0.25O3. RSC. Adv. 2018, 8, 9103–9111. [Google Scholar] [CrossRef]
  44. Jonscher, A.K. Dielectric relaxation in solids. J. Phys. D Appl. Phys. 1999, 32, R57–R70. [Google Scholar] [CrossRef]
  45. Dwivedi, R.K.; Kumar, D.; Parkash, O. Valence compensated perovskite oxide system Ca1−xLaxTi1−xCrxO3 Part I Structure and dielectric behaviour. J. Mater. Sci. 2001, 36, 3641–3648. [Google Scholar] [CrossRef]
  46. Peláiz-Barranco, A.; Guerra, J.D.S.; López-Noda, R.; Araújo, E.B. Ionized oxygen vacancy-related electrical conductivity in (Pb1−xLax)(Zr0.90Ti0.10)1−x/4O3 ceramics. J. Phys. D. Appl. Phys. 2008, 41, 215503. [Google Scholar] [CrossRef]
  47. Ghosh, A.; Pan, A. Scaling of the Conductivity Spectra in Ionic Glasses: Dependence on the Structure. Phys. Rev. Lett. 2000, 84, 2188–2190. [Google Scholar] [CrossRef]
  48. Sen, S.; Choudhary, R.N.; Pramanik, P. Structural and electrical properties of Ca2+-modified PZT electroceramics. Phys. B Condens. Matter 2007, 387, 56–62. [Google Scholar] [CrossRef]
  49. Katiliute, R.M.; Seibutas, P.; Ivanov, M.; Grigalaitis, R.; Stanulis, A.; Banys, J.; Kareiva, A. Dielectric and Impedance Spectroscopy of BaSnO3 and Ba2 SnO4. Ferroelectrics 2014, 464, 49–58. [Google Scholar] [CrossRef]
  50. Liu, J.; Wang, C.L.; Li, Y.; Su, W.B.; Zhu, Y.H.; Li, J.C.; Mei, L.M. Influence of rare earth doping on thermoelectric properties of SrTiO3 ceramics. J. Appl. Phys. 2013, 114, 223714. [Google Scholar] [CrossRef]
  51. Li, G.; Liu, H.; Wang, Z.; Hao, H.; Yao, Z.; Cao, M.; Yu, Z. Dielectric properties and relaxation behaviour of Sm substituted SrTiO3 ceramics. J. Mater. Sci. Mater. Electron. 2014, 25, 4418–4424. [Google Scholar] [CrossRef]
  52. Gao, F.; Zhao, H.; Li, X.; Cheng, Y.; Zhou, X.; Cui, F. Preparation and electrical properties of yttrium-doped strontium titanate with B-site deficiency. J. Power Sources 2008, 185, 26–31. [Google Scholar] [CrossRef]
  53. Lai, Y.W.; Wei, W.C. Synthesis and Study on Ionic Conductive (Bi1−x,Vx)O1.5-δ Materials with a Dual-Phase Microstructure. Materials 2016, 9, 863. [Google Scholar] [CrossRef]
  54. Singh, S.; Singh, P.; Viviani, M.; Presto, S. Dy doped SrTiO3: A promising anodic material in solid oxide fuel cells. Int. J. Hydrog. Energy 2018, 43, 19242–19249. [Google Scholar] [CrossRef]
  55. Singh, S.; Jha, P.A.; Presto, S.; Viviani, M.; Sinha, A.S.K.; Varma, S.; Singh, P. Structural and electrical conduction behaviour of yttrium doped strontium titanate: Anode material for SOFC application. J. Alloy. Compd. 2018, 748, 637–644. [Google Scholar] [CrossRef]
  56. Kolodiazhnyi, T.; Petric, A. The Applicability of Sr-deficient n-type SrTiO3 for SOFC Anodes. J. Electroceramics 2005, 15, 5–11. [Google Scholar] [CrossRef]
  57. Liu, J.; Wang, C.L.; Peng, H.; Su, W.B.; Wang, H.C.; Li, J.C.; Zhang, J.L.; Mei, L.M. Thermoelectric Properties of Dy-Doped SrTiO3 Ceramics. J. Electron. Mater. 2012, 41, 3073–3076. [Google Scholar] [CrossRef]
  58. Presto, S.; Barbucci, A.; Carpanese, M.; Han, F.; Costa, R.; Viviani, M. Application of La-Doped SrTiO3 in Advanced Metal-Supported Solid Oxide Fuel Cells. Crystals 2018, 8, 134. [Google Scholar] [CrossRef]
  59. Buscaglia, M.T.; Viviani, M.; Buscaglia, V.; Bottino, C.; Nanni, P. Incorporation of Er3+ into BaTiO3. J. Am. Ceram. Soc. 2002, 85, 1569–1575. [Google Scholar] [CrossRef]
  60. Beltrán Rodríguez, R.; Landínez Téllez, D.; Roa-Rojas, J. Chemical Stability and Crystallographic Analysis of the the Sr2HoNbO6 Cubic Perovskite as Potential Substrate for YBa2Cu3O7−δ Superconducting Films. Mater. Res. 2016, 19, 877–888. [Google Scholar] [CrossRef]
  61. Bernuy-Lopez, C.; Høydalsvik, K.; Einarsrud, M.A.; Grande, T. Effect of A-Site Cation Ordering on Chemical Stability, Oxygen Stoichiometry and Electrical Conductivity in Layered LaBaCo2O5+δ Double Perovskite. Materials 2016, 9, 154. [Google Scholar] [CrossRef]
  62. Barison, S.; Battagliarin, M.; Cavallin, T.; Doubova, L.; Fabrizio, M.; Mortalò, C.; Boldrini, S.; Malavasi, L.; Gerbasi, R. High conductivity and chemical stability of BaCe1−x-yZrxYyO3−δ proton conductors prepared by a sol–gel method. J. Mater. Chem. 2008, 18, 5120. [Google Scholar] [CrossRef]
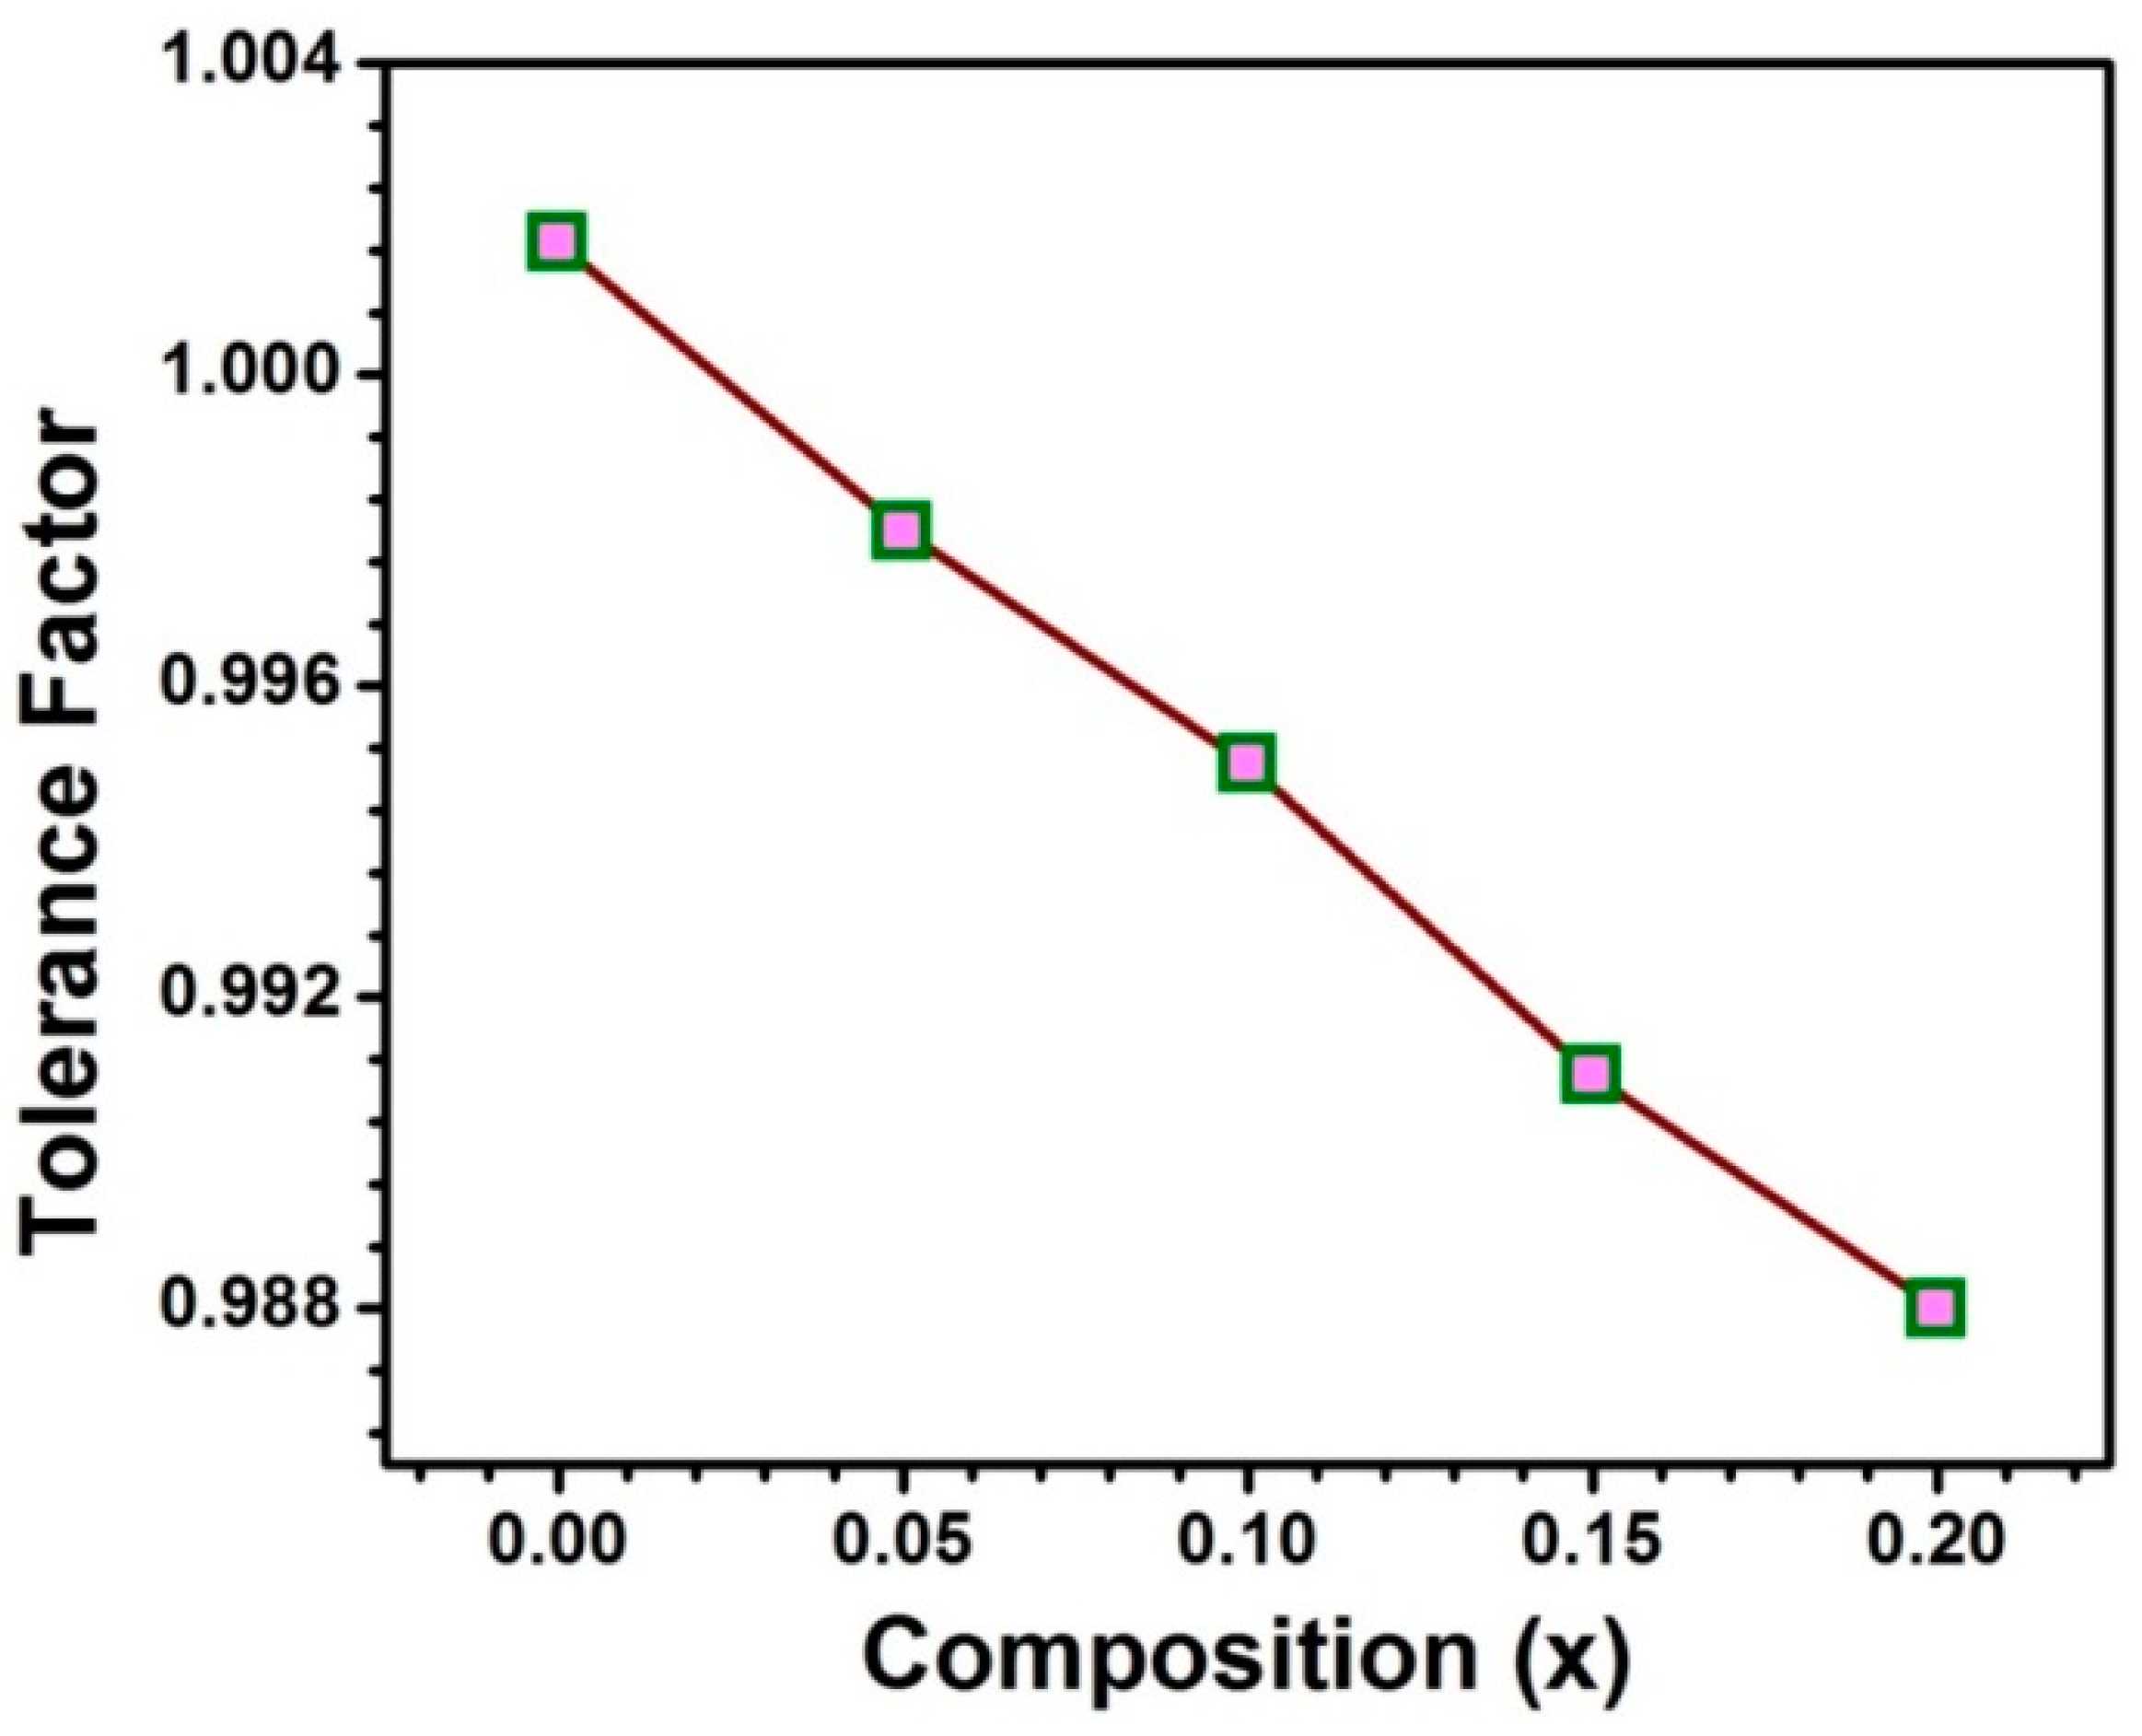
Figure 1. The tolerance factor with the compositions.
Energies 12 04042 g001
Figure 2. (a) The X-ray Rietveld refinement patterns of the sintered samples in air and (b) the shifting of XRD diffraction peaks towards higher angle with Sm concentration.
Energies 12 04042 g002
Figure 3. (a) Variation of intensity of XRD peak with 2θ-δ (°) where δ is the angle at which maxima occurs showing diffuseness of the XRD peak (110) with the compositions; (b) the variation of the lattice parameters and relative density with the compositions; (c) the variation of the microstrain and crystallite size with the compositions; and (d) the variation of the coherence length of the polarons (Lcoh) with the lattice parameters.
Energies 12 04042 g003
Figure 4. The FESEM micrographs of the fractured samples sintered at 1200 °C in air (a) SST0, (b) SST5, (c) SST10, (d) SST15, (e) SST20 and (f) The stoichiometric and EDX at% for the samples.
Energies 12 04042 g004
Figure 5. (a) The XPS wide spectra of Sm-substituted SrTiO3 samples and (b) the illustration of the O 1s core level spectra of the samples.
Energies 12 04042 g005
Figure 6. (a) The typical electrical conductivity spectra of SST5 composition fitted with Jonscher’s power law and (b) scaling of conductivity spectra at measured temperatures for the composition SST5.
Energies 12 04042 g006
Figure 7. Nyquist plots of impedance measured on the SST5 sample under O2 and at different temperatures. Open markers point at frequency decades (Hz) on all plots.
Energies 12 04042 g007
Figure 8. (a) The Arrhenius plot (log (σdcT) vs. 1000/T) for the all studied samples and (b) the comparative Arrhenius plot for the sample SST10 in O2 and H2 atmospheres.
Energies 12 04042 g008
Figure 9. XRD patterns of unreduced and reduced samples and inset FESEM micrographs of reduced compositions.
Energies 12 04042 g009
Table 1. The lattice parameter, cell volume, Rietveld refined parameters, and porosity of the studied samples.
SampleLattice Parameter (Å)Cell Volume (Å3)χ2ReRBRFRpRwpPorosity (%)
SST03.915160.0115.819.214.612.9323.022.23.5
SST53.913659.9425.1413.65.904.1339.332.26.3
SST103.906959.6345.4513.16.464.9741.931.319.9
SST153.903159.4615.6713.67.115.3947.532.940.0
SST203.904559.5255.9215.95.865.7059.139.438.6
Table 2. Activation energy and lattice oxygen content of all Sm-doped samples.
SampleEa in H2
200–450 °C
Ea in H2
450–700 °C
Lattice
Oxygen (%)
SST50.160.3355.8
SST100.150.2266.6
SST150.120.2764.7
SST200.130.1762.4
Table 3. Comparison of conductivity at 650 °C for various doped SrTiO3 compositions after reduction. Reducing conditions and literature references are also listed.
Sampleσ (Scm−1) @ 650°CReduction T (°C)/Time (h)Reference
Sm0.1Sr0.9TiO3−σ2.7 x10−1700/24this work
Dy0.08Sr0.92TiO3−σ1.4 x10−1700/24[54]
Y0.08Sr0.92TiO3−σ6.8 x10−2700/24[55]
Y0.08Sr0.88TiO3−σ1.0 x10−1850/24[56]
Y0.07Sr0.93TiO3−σ5.0 x1001400/5[30]
Dy0.1Sr0.9TiO3−σ7.1 x1011450/4[57]
La0.1Sr0.9TiO3−σ7.0 x1011450/12[58]
Y0.08Sr0.92TiO3−σ5.5 x1011500/10[52]