1. Introduction
In recent years, rapid growth in urban populations has led to an increasing need for fresh food. Controlled environments located in or near the urban network allow for continuous yield production of fresh greens and fruits of high nutritious value and prevent losses in quantity and quality during transportation [
1]. However, one of the major challenges facing vertical farms (controlled environments with artificial lighting) is, among others, the high energy demand cost of the artificial lighting. The annual electricity cost of vertical farms amounts to approximately 25% of the total production cost; where 80% of this cost covers the lighting needs of the system [
2].
Many improvements and studies have been conducted in the field of lighting with the continuous optimization of the LED technology, which is mainly used in vertical farms, as it can consume up to 70% less energy compared to traditional lighting options [
3]. Vertical farms allow their users to simulate the most beneficial conditions for each plant species and provide an optimal environment for the highest yield and best quality of the plants. Today, LEDs are the main lighting source in vertical farms, as they consume around 40% less energy than HPS (High Pressure Sodium) lamps and 86% less than incandescent lighting systems [
4]. Due to the minimal radiant heat emitted, LEDs can be placed close to plants, reducing the cultivation space. Finally, because their function is based on the movement of electrons in a semiconductor material, they are designed to reach in the most beneficial nm for the plants. For this reason, the diodes mainly peak in the red, far-red, and blue part of the spectrum. These narrow bands of the spectrum boost the growth of the plants, as they satisfy the chlorophyll
a (Chl
a) and chlorophyll
b (Chl
b) requirements [
5].
Apart from the research in the LED technology, a very important role in the energy demand of vertical farms is the duration of the plants under the artificial lighting, i.e., their photoperiod. Lighting is the factor that affects the productivity and quality of plants in vertical farms most, and it varies at different growth stages (germination, vegetation, flowering, etc.) [
6]. During germination, plants are grown under long photoperiod conditions, until their roots are activated and they start to uptake nutrients and water from the substrate [
7]. Photoperiod and air temperature are used to control plant responsiveness and development [
8]. However, the adequacy of light for the optimal plant growth is not very clear, especially between wavelengths 400–700 nm of the solar spectrum, where the photosynthetically active radiation (PAR) occurs. Studies have shown that both sunlight duration and the light intensity, particularly in green vegetables that require large amounts of light, play a very important role in the optimal distribution of instant PAR.
Since photoperiod is a crucial factor affecting plant growth and quality, optimization seems very important. Sugumaran et al. (2013) [
9] conducted research testing both light intensity and photoperiod in lettuce plants, proving that higher light intensity combined with a short photoperiod can improve the yield of plants. Kozai Toyoki (2018) [
10] explained that after the plants’ seeding and through their development, the demand in photosynthetic photon flux density (PPFD) can reduced up to 50%.
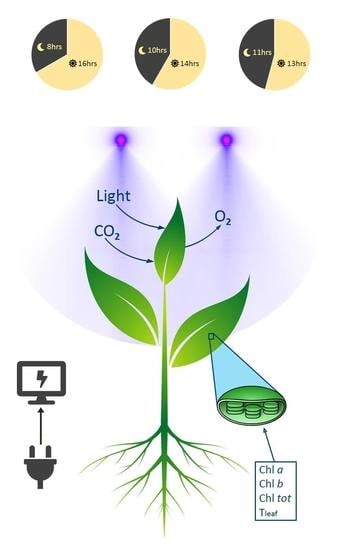
Photosynthesis is one of the most important processes in the plant development that can control the growth rate of plants. During photosynthesis, antenna pigments in leaf chloroplasts can absorb the light radiation (solar or artificial) and, via resonance transfer, it can produce chemical energy. What actually happens it that water and carbon dioxide enter the cells of the leaves and, through the energy trapped in the chlorophyll, photosynthesis produces sugar and oxygen, that exit the leaves.
In the photosynthesis process, chlorophyll is one of the most important antenna pigments, as it promotes the oxygen conversion of light. Chlorophyll
a (Chl
a) molecules can be found in all photosynthetic organisms. All the other pigments absorb the energy that cannot be captivated by Chl
a [
11]. Important pigments in the photosynthesis are also chlorophyll
b (Chl
b), xanthophylls, and carotenoids (β-Carotene). Chl
a has the highest absorption peak at 430 nm and 660 nm, followed by Chl
b at 450 nm and 640 nm, and carotenoids at 450–460 nm and 480–485 nm [
12]. Chlorophyll parameters (biomass, leaf area, etc.) are very useful growth indicators for the phenological development and the physiological state of the plants [
13,
14]. This is why their behavior and development in a crop can be used as a vegetation state indicator for plants that are under healthy cultivation conditions, as well as for plants growing under a stress treatment. Richardson A. (2002) [
15] stated that low concentrations of chlorophyll could directly reduce the photosynthetic rate of plants and, consequently, their primary production. Therefore, the assessment and development of chlorophyll and other important pigment indicators (Chl
a/Chl
b, Chl
tot/car, and carotenoids) can be used for monitoring and detecting the vegetation stage of plants.
In this research, the quality of basil plants was evaluated by measuring different physiological indices, including Chl a, Chl b, total chlorophyll (Chl tot), the fraction of photosynthetically active irradiance absorbed by the leaf (a), and leaf temperature; all under varying photoperiod treatments. In addition, the energy demand and the biomass production were studied to determine the sustainability and efficiency of a given estimation protocol in a small-scale indoor growth chamber.
2. Materials and Methods
2.1. Plant Material and Growing Conditions
The experiments were conducted from March to April 2019 in a controlled small-scale chamber, located at the Department of Business Development and Technology, Aarhus University in Herning, Denmark. The dimensions of the chamber were the following: Height = 1000 mm, width = 915 mm, and length = 457 mm. The air temperature, relative humidity, and CO2 concentration were automatically controlled using a climate control sensor (TROTEC BZ30, UK). The light given in the systems came from the LED (Budmaster II GOD-2, Osram, UK) with a 90-watt energy consumption. In the LED specifications, the peak wavelengths are 400–520 nm (blue) and 610–720 nm (red and NIR); these remained stable throughout the whole experimental period.
Basil plants (Ocimum basilicum) were selected for this study, as they are one of the most frequent plant species cultivated in vertical farms, owing to their high nutritional value and cultivation density; the latter playing a key role in the yield rate of vertical farms.
The basil plants were grown by planting seedlings filled in perlite (ISOCON Perloflor Hydro 1). Two rows of plants were used, each row with four plants. The mean volumetric water content of perlite at field capacity was 53–55%. The measurements started ten days after transplanting, when the plants had about eight leaves each and were about seven cm high. The nutrient solution supplied to the crop via a drip system and was controlled by a commercial time irrigation controller (two irrigation events per day, at 08:00 and 20:00, for ten minutes each) with set points for electrical conductivity at 2.4 dS m−1 and pH at 5.6. In each plant, a constant flow dripper with a flow rate of 1 L/h was installed.
To study the effects of photoperiod on crop quality and quantity characteristics, three different photoperiod treatments were applied. The first treatment lasted for 17 days (control) while the other two treatments lasted 7 days (stress). The control phase experiment started 15 days after transplanting. At the beginning of the control treatment, which covered 100% of the plants’ need for lighting, the scheduled dark hours were from 10:00 to 18:00, i.e., eight hours of dark conditions (P8D16L). In the second part of the experiment, the dark hours were from 09:00 to 19:00, i.e., ten hours of dark conditions (P10D14L), and in the third part of the experiment, the dark hours were from 09:00 to 20:00, i.e., eleven hours of dark conditions (P11D13L). The average light intensity obtained at plant level when the LED was turned on was 240 W m−2.
The total water consumption during the 31 days of the experiment was 35 L of water. At the beginning of the experiment, the water tank was filled with 15 L of water, i.e., the maximum capacity of the tank. A total of 35 L of water (20 during the experiment and 15 from the original water capacity) and 100 ml of nutrient solution (10 ml of nutrient solution for every two liters of water added, according to the protocol) were used during the experiment (excluding the relaxation phase between the two stress treatments, which lasted for two days). During the experiment, most of the water was lost due to the plants’ need for water as well as evapotranspiration.
The experiment was repeated twice in the same indoor small-scale chamber. It was not possible to keep two different climate conditions (different photoperiods) for stress and control, respectively, in the chamber. For this reason, we first conducted the experiment under control conditions, and subsequently, we repeated the same experiment with the sequence described above, creating virtually identical environmental conditions. In the
Table 1, you can see the environmental conditions throughout the whole experiment in each lighting treatment.
2.2. Data Collection
Prior to the experiment, the air temperature (Tair in °C), relative humidity (RH %), and CO2 concentration of the chamber were measured and calibrated using a climate control sensor, placed 50 cm above the crop area in the middle of the chamber, to automatically log data every ten minutes (TROTEC BZ25 CO2 Air Quality Monitor, Germany). The Tair and RH values were used for the calculation of the air vapor pressure deficit values. Leaf temperature (Tleaf in °C) was measured using a thermocouple attached to the leaf surface area (Solfranc, Spain). Substrate moisture content (θ, %) was estimated using a capacitance sensor (WET-2/d Wet Sensor, Delta-T Devices Ltd., UK). Measurements took place every 30 seconds, and the average values of 10 minutes were recorded by the data logger.
The chlorophyll measurements were extracted by a chlorophyll sensor (CM-500, Chlorophyll Meter, Solfranc, Spain) that was calibrated prior to the experiment. The measurements were made manually every day at 08:00 in the morning (open lights). The sampling was done from five leaves of each plant from young to fully developed leaves. The portable sensor acquired data of chlorophyll based on the absorbance of plants at 660 and 940 nm [
1].
Eight basil plants of the same age and size were used for the measurements. Each plant was measured every day. The data were logged every ten minutes and the manual data once a day. According to Gonçalves L.F.C. et al. (2008) [
16], applying the method of Lichtenthaler and Welburn (1983) for detecting chlorophyll concentration with pigment extraction can be equally effective using a portable chlorophyll meter. The photosynthetically active irradiance absorbed in a leaf (a) can be described by the ratio:
(Evans and Porter, 2001) [
17], with Chl
tot (the chlorophyll content) measured in μmol m
−2.
2.3. Plant Biomass Measurements and Evaluation of the Electrical Energy Input Consumed for Basil Production
The fresh weight was measured separately in the root and shoot part of the plants (including stems, flowers, and leaves). For the dry weight measurements, the shoot parts of the plants were placed in an oven at 80 °C for 24 hours, during which all the water evaporated.
The input of electrical energy was measured using a power and energy logger, PEL 103 Chauvin Arnoux. The electrical energy consumed for the basil production was measured for each growing treatment, taking into account the total leaf biomass produced by the eight plants, the length of each treatment, the photoperiod (hours of light), and the energy consumed by the system per hour. The result is presented in kWh kg−1.
2.4. Statistical Analysis
Data were subjected to a one-way analysis of variance (ANOVA), followed by Bonferroni’s multiple comparison test, and Tukey’s post-hoc analysis test. Analyses were performed using SPSS for Windows (IBM Statistics for Macintosh, version 25.0).
3. Results
3.1. Development and Study of Abiotic Indicators under Different Photoperiods
In this section, the data collection results of the physiological parameters of the crop during the experiment are presented.
3.1.1. Development of Leaf Temperature
In
Figure 1, the curve of leaf temperature for the three treatments is shown. The average temperature varied between 20.6 and 25.7 °C throughout the whole experiment. There was a significant effect in the change of leaf temperature at the
p < 0.05 level for the three different photoperiod treatments (F (2,28) = 3.709;
p = 0.037). Post-hoc comparisons using the Tukey HSD (Honestly Significant Difference) test indicated that the mean score for the leaf temperature in the control treatment (M = 20.84; SD = 0.88) did not differ much from the first stress treatment (M = 21.14; SD = 0.30). Meanwhile, it was significantly higher than the second stress treatment (M = 21.68; SD = 0.22).
In
Figure 2, the evolution curve of the substrate temperature (T
sub) for the three treatments is depicted. The average T
sub varied between 17.1 and 24.3 °C throughout the experiment. There was no significant different between the three treatments at the
p < 0.05 level (F (2,28) = 2.168;
p = 0.133).
3.1.2. Development of Chlorophyll Content
In
Figure 3, the evolution curve of the chlorophyll content for the three treatments is shown. As can be seen from the graph, the average value of the chlorophyll content in the plants under the second stress treatment (with a 13-hour photoperiod) was drastically reduced from day 27 of the experiment (the first day of application of the reduced photoperiod for the crop). As the experiment progressed, the chlorophyll values continued to decrease until the end of the experiment, where the value was 25.44 μmol/m
2. More specifically, the chlorophyll concentration of the healthy plants (P8D16L) ranged between 23.455 and 45.72 μmol/m
2 throughout the experiment, while the chlorophyll concentration for the stressed plants was significantly reduced when applying the second stress treatment. The chlorophyll content during the first stress treatment was not statistically significantly reduced compared to the healthy plants with Chl values varying between 32.7 and 38.38 μmol/m
2.
3.1.3. Development of Chl a and Chl b
In this research study, a portable chlorophyll meter was applied to estimate the chlorophyll content of the basil crop. Using the research findings of J.F.C. Gonçalves et al. (2008), we calculated the concentration of Chl
a and Chl
b with the following equation:
where CCI is the measurement of the portable chlorophyll meter (CM-500).
In
Figure 4a, the values of the Chl
a index can be seen. Chl
a is one of the most important chlorophyll pigments (in combination with Chl
b, as they differ minimally in their structure) [
7]. A crucial property of Chl
a is the versatility, enabling active participation in multiple functions in the photosynthetic process [
18], including photon capturing, transfer and storage of photons, and energy storage at the antennas [
19]. Chl
a absorbs radiation in the red and blue nanometers of the light spectrum. Apart from Chl
a, plants use other pigments (Chl
b,
c, carotenoids, and phycobilins), which absorb radiation with intermediate wavelengths. This process makes better use of solar energy.
A one-way between-subjects ANOVA was conducted to compare the effects of the reduced photoperiod on Chl a of basil plants with the P8D16L, P10D14L, and P11D13L treatments. There was a significant effect of photoperiod on the Chl a of the plants at the p < 0.05 level for all three treatments (F (2,28) = 5.304; p = 0.011). Post-hoc comparisons using the Tukey HSD test indicated that the mean score for P8D16L (M = 261.21; SD = 24.91) was significantly different from P10D14L (M = 289.65; SD = 6.45). However, the P11D13L treatment (M = 266.37; SD = 9.48) did not differ significantly from P8D16L.
A one-way ANOVA was also conducted to estimate if Chl b was affected by the different photoperiod treatments. There was a significant effect of photoperiod on Chl b of basil plants at the p < 0.05 level for the three treatments (F (2,28) = 5.954; p = 0.007). The post-hoc analysis revealed a significant difference between P8D16L (M = 114.42; SD = 13.06) and P10D14L (M = 130.23; SD = 4.13). Furthermore, P11D13L (M = 116.48; SD = 5.20) was also significantly different from P8D16L.
Subsequently, a one-way ANOVA was performed for Chl tot under the three treatments. There was a significant effect of photoperiod on Chl tot of the plants at the level p < 0.05 for all three treatments (F (2,28) = 5.390; p = 0.010). A post-hoc comparison test showed significant differences between P8D16L (M = 395.65; SD = 37.93) and P10D14L (M = 439.30; SD = 10.10). However, compared to P8D16L, the P11D13L treatment (M = 403.25; SD = 14.54) showed no statistical difference.
Finally, a one-way ANOVA was performed to find the fraction of photosynthetically active irradiance absorbed by the leaf between healthy plants, a, under the three photoperiods treatments. There was a significant effect of photoperiod on a of the plants at the level p < 0.05 for all three treatments (F (2,28) = 5.17; p = 0.012). A subsequent post-hoc analysis indicated that the mean a of P8D16L (M = 0.83; SD = 0.023) differed significantly from the mean a of P10D14L (M = 0.85; SD = 0.005), but not from the mean a of P11D13L (M = 0.83; SD = 0.009).
In conclusion, these results suggest that chlorophyll pigments are not affected or diminished when the photoperiod is reduced to two hours after the plants enter the germination stage. However, it should be noted that too short a photoperiod of the P11D13L treatment does not appear to significantly increase the chlorophyll pigments of basil plants and leads to a decrease of chlorophyll content.
3.2. Quality and Physiological Evaluation of Basil under Different Lighting Conditions
The length of the growing cycles was 17 days for the control treatment (P8D16L) and 7 days for each of the stress treatments with shorter photoperiods (P10D14L and P11D13L). The control treatment was longer, as the plants were in the germination stage and needed enough light intensity for their optimal development. The plants were subjected to shorter photoperiods at equal days after their germination period.
The yield was measured as the head biomass production for each of the plants.
The leaf area index measured in the plants after the P8D16L treatment was significantly higher, with a value of 638 cm2 compared to the two stress treatments with 379 cm2 for P10D14L and 279 cm2 for P11D13L, respectively.
The height of the plants measured at the end of the P11D13L treatment differed statistically from P8D16L and P10D14L treatment, with a decrease rate of 6.16%, and substantially from the P8D16L treatment, with a reduction of 21%.
The shoot fresh weight (i.e., measurements of stems, leaves, and flowers) of the P8D16L treatment with a mean value of 41 g presented a statistical difference from P10D14L and P11D13L, with mean values of 22.40 g and 19.02 g, respectively.
The leaves grown in P11D13L showed the lowest shoot dry weight (3.44 g) compared to the P8D16L treatment (4.74 g). However, there was no statistical difference compared to the values measured in the plants grown under the other experimental conditions (
Figure 5d).
3.3. Plant Biomass Measurement and Estimation of the Input Energy Consumed for Basil Production
The total dry biomass of the plants was estimated by the following equation:
Figure 6 shows the electrical energy needed for the total crop production in each treatment. The conditions applied in the P8D16L and P10D14L treatments performed the highest biomass production achieved with a reduced electrical energy input compared to the P11D13L treatment. Post-hoc comparisons using the Tukey HSD test indicated that the mean score for the biomass production in the P8D16L treatment (M = 1.44; SD = 0.66) was not substantially different from the total biomass in the P10D14L treatment (M = 1.63, SD = 0.68). Furthermore, the total biomass in the P11D13L treatment (M = 1.21; SD = 0.55) did not differ significantly from the P8D16L and P10D14L treatments. However, from
Figure 6, it can be observed that the highest biomass with a lower electrical energy input than the control treatment was obtained during P10D14L.
4. Discussion
One of the most important aspects of this research was to investigate the sustainability and feasibility of an indoor cultivation system, thereby providing an even ‘greener’ production system for fresh vegetables. The main objective was to study and optimize the energy demand in a small-scale cultivation area without affecting the yield of the crop.
The energy demand in an indoor cultivation area is mainly distributed to the lighting system (in addition to the fans and pumps of the cultivation area). Therefore, we chose to focus primarily on optimizing the light emission by reducing the amount of light, i.e., the photoperiod.
4.1. Different Photoperiod Conditions Affecting Basil Quality, Physiological Parameters, and Leaf Functionality
Quality is one of the most important factors for evaluating plant growth conditions, specifically in herbs such as basil, as it can greatly affects consumer choice. Quality control can be achieved using multiple indices, devices, and protocols from a wide range, one of which can be the visual appearance (color, shape, size) of herbal leaves. Therefore, many researchers use chlorophyll to investigate and extract results of physiological responses to the satisfactoriness and purchasing power of basil. Kopsell D. A. et al. (2005) [
20] state that chlorophyll concentration and the green color gradation of leaves can be used as indicators of the xanthophyll carotenoid levels in basil. In these plants, xanthophyll is one of the most important carotenoids affecting the nutritional value; therefore, further research is needed to estimate xanthophyll pigments during different photoperiods in indoor cultivation areas. Johnson A. et al. (2019) [
2] surprisingly showed that a 24-hour photoperiod of photosynthetically active radiation has a positive effect on the flavor of basil plants cultivated under indoor environmental conditions. Since this study does not examine aroma molecules of basil plants, further research is needed in this area. In the current study, plants exposed to the second photoperiod treatment (P10D14L) showed a significant increase in the chlorophyll content of the basil leaves with a two-hour lower energy demand than the plants in the control treatment (P8D16L). It should be mentioned that after 27 days following the sowing, shorter photoperiods were applied to the plants (10 days from sowing to transplanting and 17 days under control conditions). Furthermore, from these data, we found that the shoot biomass measured in the plants after the P10D14L treatment did not reflect a significant reduction from the shoot biomass accumulation in the plants following the P8D16L treatment. Moreover, the graphs in
Figure 4 suggest that the values of Chl
a, Chl
b, and Chl
tot indicate a slow and stable state of the photosynthesis when putting less energy into the system with stable smaller light periods (two hours less). This might stimulate the activity of Rubisco, a key enzyme in the carboxylation process of the Calvin–Benson cycle. The Calvin–Benson cycle refers to the chemical reactions of photosynthesis that have the ability to convert carbon compounds and other compounds into glucose [
21]. In other words, for most plants, the photosynthesis begins with a reaction between CO
2 and a five-carbon sugar known as RuBP (ribulose bisphosphate). This reaction is then catalyzed by Rubisco, producing the G3P molecule. During the P10D14L treatment, the temperature of the cultivation area remained stable without provoking any kind of stress in the above process. In addition, it allowed leaf stomata to be open and new CO
2 to enter in order to replenish the CO
2 consumed by the cycle [
22]. According to previous studies [
23], when plants use the Rubisco enzyme (and consequently gain additional G3P) and are exposed to controlled night conditions, a short light inductance period used for chlorophyll data acquisition activates no photochemical processes scattering excitation energy to heat. In this study, an increase in Chl parameters (Chl
a: 10.88% from P8D16L to P10D14L) was observed with a lower amount of light, implying that there was a combined effect allowing the plants to continue the photosynthesis process for a specific period of time with less energy demand. However, from P10D14L to P11D13L, there was a reduction in the Chl parameters (Chl
a: 8.03%), indicating that there was a combined effect of the reduced light period in the development of the plants. Based on these results, we can hypothesize that plants continue to develop and increase their abiotic parameters when they fulfill their vegetative stage for a certain period until they realize that they are receiving less light energy and start reacting to the stress. The net photosynthesis was not measured in this research study; however, we can assume that the same results would be obtained with all three treatments. Further research is needed in the specific field to identify when basil plants continue to increase their chlorophyll content with a shorter photoperiod and thus less energy demand.
4.2. Effect of Different Photoperiod Conditions on Biomass Accretion and Energy Demand
Photoperiod is one of the factors that play an important role in the plants’ biomass, leaf size, and area [
24]. Initially, it was expected that a longer photoperiod would result in higher biomass production for the plants. We observed a reduction of the shoot dry biomass in the P10D14L treatment; however, our analysis showed that it was not statistically significant. Nevertheless, when the photoperiod was further reduced, there was a marked decrease in the shoot dry biomass of the plants.
Moreover, it was found that a shorter day length also led to the minimized fresh weight accumulation and a lower leaf area in the shoot of the basil plants. This could be due to the lower radiation in basil production, which would reduce the concentration of nitrate and simultaneously increase the chlorophyll and carotenoid contents of the plants. As to the production of edible biomass in basil plants, Beaman A. R. et al. (2009) found that a higher carotenoid concentration, together with a reduced nitrate content, can produce a highly nutritious product.
Today, LED technology is the most widely used technology in large-scale vertical farms because it is considered the most energy-efficient, with a lower electricity consumption compared to all other types of lighting [
25]. However, in small-scale production environments, several factors can contribute to a specific result and affect the feasibility and efficiency of the LED lighting technology. In this research study, we measured the energy input in the cultivation system that was consumed in each of the three treatments. Our goal was to identify an accurate energy saving and variation in the different growing conditions and how to reduce the production cost, specifically in a small-scale environment, including minimizing energy loss and other demands (heating, ventilation, etc.) [
26].
Based on the data collected from the experiment, the P10D14L treatment included the production of a commercially profitable product that generated the same yield and high-quality herb leaves with lower energy cost and footprint when compared to the control environment (P8D16L). As seen in
Figure 6, the biomass in P10D14L was in the same statistical range as P8D16L, but it used approximately 5.8 kWh less than the control treatment. From an economic perspective, our small-scale cultivation area is equal to an energy cost-saving trend of 4.32 €/m
2/day (since the research took place in Denmark, we used the Danish average electricity price, as follows: 0.3123 €/kWh (Eurostat, 2018)). Although the second stress treatment (P11D13L) provided a further decrease in the energy demand, the results for the total dry biomass of the plants were also the lowest (
Figure 6). A further study is needed to determine the exact period when the basil plants are in a state of growth and where less energy can be provided without affecting the optimal development of the crop. Furthermore, a more detailed study is needed for the economic and environmental impact of a limited photoperiod in indoor farming, as well as the opportunities and results of a large-scale indoor vertical farm.
5. Conclusions
Growing basil in a small-scale indoor cultivation system, where we can control all growth parameters, presented a positive effect on the quality and quantity of the plants. A minimized photoperiod with 10 hours of darkness and 14 hours of light (as opposed to 8 hours of darkness and 16 hours of light) showed positive effects on the chlorophyll content and, thus, the physiological development of basil plants 17 days after the plants were transplanted into a hydroponic substrate and placed in the small-scale indoor chamber. The basil plants did not show significant differences in their yield when comparing the first stress treatment (P10D14L) with the control treatment. In this experiment, the main objective was to maintain a high-value product in terms of quality and quantity, yet at the lowest energy cost possible in a small-scale environment. Future research is needed in the field to examine the optimal lighting conditions (light intensity, tolerance under short-day photoperiods, and optimal nm selection in LEDs) for a larger variety of herbs and fresh vegetables and large-scale installation in order to increase the economic value of the product.
Since vertical farms are a novel type of cultivation that offers numerous advantages for cities to meet their demand for fresh vegetables, herbs, and fruits, many studies have been conducted to analyze and optimize the technologies and the cultivation protocols used. However, the energy demand is one of the main drawbacks limiting the feasibility of vertical farms. This is why it is important to assess the utility of vertical farms under the appropriate framework. Thus, it is crucial to continue with further studies to examine the economic and environmental potentials of vertical farms, and how they can become even more sustainable, especially in a large-scale application.


