Article

Connectedness Between Natural Gas Price and BRICS Exchange Rates: Evidence from Time and Frequency Domains

1
Graduate School of Economics, Kobe University, 2-1, Rokkodai, Nada-Ku, Kobe 657-8501, Japan
2
The Kansai Electric Power Company, Incorporated, 6-16, Nakanoshima 3-chome, Kita-Ku, Osaka 530-8270, Japan
*
Author to whom correspondence should be addressed.
Energies 2019, 12(20), 3970; https://doi.org/10.3390/en12203970
Submission received: 27 August 2019 / Revised: 15 October 2019 / Accepted: 16 October 2019 / Published: 18 October 2019
(This article belongs to the Special Issue Empirical Analysis of Natural Gas Markets)

Abstract

:
In this paper, we investigate the connectedness between natural gas and BRICS (Brazil, Russia, India, China, and South Africa)’s exchange rate in terms of time and frequency. This empirical work is based on the approach of connectedness proposed by Diebold and Yilmaz, who provided an effective way of valuing how much variation in one variable is responsible for the value of other variables, and the method proposed by Baruník and Křehlík, who decomposed the results from Diebold and Yilmaz into different frequencies. We also use the rolling-window method to conduct time-varying analysis. The data used in this paper are from 23 August 2010 to 20 June 2019. We find that the natural gas price hardly influences BRICS’s exchange rates, which provides an important practical implication for policymakers, especially in oil-dependent countries.

Graphical Abstract

1. Introduction

In light of the increasing attention being paid to environmental sustainability, energy systems are gradually transitioning from a dependence on non-renewable resources to the use of environment-friendly resources. This will have a great impact on day-to-day life, economies, businesses, manufacturers, and governments. Compared to coal or petroleum, natural gas has many qualities that makes it burn more efficiently. It also generates fewer emissions of most types of air pollutants, including carbon dioxide. With the expansion of gas pipelines, the increasing number of gas liquefaction plants, and the exploitation of natural gas fields, it is reasonable to consider that the natural gas trade will become more globalized. Natural gas has become a major part of the world’s energy consumption, demand, and supply in recent years. In 2018, for example, natural gas consumption rose by 5.3%, one of the fastest rates of growth since 1984. With the continuing rapid expansion in liquefied natural gas (LNG), the inter-regional natural gas trade grew by 4.3%, which was more than double the 10-year average [1]. As reported in the Global Energy Perspective 2019: Reference Case [2], natural gas will be the only fossil fuel whose share of total energy demand continues to increase until 2035, and China will represent nearly half of the global demand growth. Other developing countries are also expected to increase their demand for natural gas.
Brazil, Russia, India, China, and South Africa (BRICS), a group of five fast-growing developing countries, play an important and expanding role in the world economy. In recent years, BRICS have represented an increasing share of global economic growth. According to the International Monetary Fund (IMF), as of 2018, the combined gross domestic product (GDP) of these five nations accounted for 23.2% of the gross world product (GWP). Given the growth of BRICS and the fact that energy is a crucial ingredient for economic development, these countries’ relationship with natural gas will only become closer. According to the BP Statistical Review of World Energy [1], in 2018, the total consumption of natural gas in BRICS was 835.8 billion cubic meters (BCM), which accounted for 21.7% of the total global consumption. In terms of imports, China became the second largest importer of LNG, with imports increasing from 4.6 BCM in 2008 to 73.5 BCM in 2018. India was the fourth largest importer, with imports increasing from 11.3 BCM to 30.6 BCM over the same period. In terms of exports, Russia was the largest exporter of pipeline gas. It also accounted for nearly 6% of total LNG exports. As the trade of natural gas is usually settled in US dollars, it is meaningful to study the relationship between the natural gas price and the BRICS’s exchange rates.
Against this backdrop, this paper investigates the interdependence between the natural gas price and the BRICS’s exchange rate. In doing so, this study is expected to offer valuable insights for market operators, investors, and economists. We use the Henry Hub natural gas futures as the data for the natural gas price. There are two reasons behind this choice of dataset: First, the shale gas revolution in America has dramatically increased US production of shale gas since 2007. World Energy Outlook 2018 [3], produced by the International Energy Agency (IEA), has predicted that natural gas production in America will increase from 976 BCM in 2017 to 1328 BCM in 2040 and that this increase will be mainly due to the growth in shale gas production. Therefore, the Henry Hub natural gas price, which usually represents pricing for the North American natural gas market, has a great influence on the global energy market. We assume that this influence will become stronger over time. The second reason is that there are multiple natural gas price indexes in the world, such as the Japan Korea Marker and the UK National Balancing Point (NBP); however, we cannot predict which price index has strong connectedness with the BRICS’s exchange rates. Therefore, we select the Henry Hub price given its characteristics of high liquidity and large trading volume.
Our contribution to the literature is twofold. First, we apply the connectedness methodology from Diebold and Yilmaz [4,5,6], which allows us to know how pervasive the risk is throughout the entire market by quantifying the contribution of each variable to the system. We also apply the time–frequency version of connectedness proposed by Baruník and Křehlík [7] to find the connectedness between different variables in the short, medium, and long term. Second, to the best of our knowledge, there is not much research on the relationship between the natural gas price and exchange rates. Nevertheless, there are many studies that analyzed the relationship between crude oil prices and foreign exchange rates, and almost all of them show that exchange rates are highly connected to the oil price. For example, in our previous research on the relationship between the West Texas Intermediate (WTI) crude oil price and BRICS’s exchange rates using the copula method, we found a significant negative dependence between the two variables. Considering the globalization of natural gas trade, high demand growth (1.6% per year), and the expansive market share in the global energy market (World Energy Outlook 2018 [3] has predicted that, by 2030, natural gas will overtake coal and become the second largest source of energy after oil.), it is reasonable to compare the relationship between the crude oil price and exchange rates with that between the natural gas price and exchange rates. Therefore, in this study, we also aim to determine whether BRICS’s exchange rates are closely linked to the natural gas price, as they are to the oil price.
The rest of this paper is organized as follows: A brief review of relevant literature is provided in Section 2. Section 3 introduces the empirical methodology used in this study. Section 4 reports empirical results. Section 5 gives the conclusion. Finally, a robustness analysis is presented in the Appendix A.

2. Literature Review

As we have mentioned above, there is not much literature that has analyzed the relationship between the natural gas price and exchange rates, as far as we know. However, there are many studies on the relationship between the exchange rate and other variables, such as the oil price and the stock market. Chen and Chen [8] investigated the long-term relationship between different crude oil price indexes and G7 countries’ exchange rates using the monthly panel data between January 1972 and December 2005. They found that oil prices may account for the movements of the real exchange rate and there is a link between oil prices and real exchange rates. Additionally, from the results of panel predictive regression, they found that the crude oil price has the ability to forecast the future exchange rate. Andrieș et al. [9] identified the patterns of co-movement of the interest rate, stock price, and exchange rate in India using wavelet analysis. They used the data span from July 1997 to December 2010. The empirical results showed that exchange rates, interest rates, and stock prices are linked to each other and that the stock price fluctuations lag behind both the exchange rates and interest rates. Brahm et al. [10] used monthly data to investigate the relationship between the crude oil price and exchange rates in the long term and short term, respectively. The data span was from January 1997 to December 2009. Empirical results indicated exchange rates Granger-caused crude oil prices in the short term, whereas crude oil Granger-caused exchange rates in the long term. Furthermore, based on impulse response analysis, exchange rate shock had a significant negative effect on crude oil prices. Jain and Pratap [11] explored the relationship between global prices of crude oil and gold, the stock market in India, and the USD–INR exchange rate using the DCC-GARCH (dynamic conditional correlation-generalized autoregressive conditional heteroscedasticity) model. They also examined the lead lag linkages among these variables using symmetric and asymmetric non-linear causality tests. They used daily data from the period of 2006 to 2016, finding that a fall in the value of the Indian Rupee and the benchmark stock index was caused by a fall in gold and crude oil prices.
On the empirical side, the methodology used in this paper has already been applied in many fields. Maghyereh et al. [12] used implied volatility indices (VIX) of the daily close price of crude oil in 11 countries. They found that the connectedness between oil and equity was dominated by the transmissions from the oil market to equity markets and most of the linkages between these two markets were established from mid-2009 to mid-2012, a period that witnessed the start of the global recovery. Lundgren et al. [13] studied the renewable energy stock returns and their relation to the uncertainty of currency, oil price, stocks, and US treasury bonds. They used data covering the period from 2004 to 2016, and found that the European stock market depends on renewable energy stock prices. Singh et al. [14] employed a dynamic and directional network connectedness between the implied volatility index (VIX) of the exchange rates of nine major currency pairs and the crude oil using the data between May 2017 and December 2017. They found that crude oil affected currencies more than currencies affected crude oil, but the reverse was true during the crude oil crisis period. Furthermore, their results revealed that EUR–USD is more sensitive to crude oil price fluctuation than others. Ji et al. [15] combined empirical mode decomposition with a connectedness methodology, and examined the dynamic connectedness among crude oil, natural gas, and refinery products using daily data between 3 January 2000 and 15 September 2017. Employing a constant analysis, they found that crude oil and its refinery product tend to be a net transmitter, while the natural gas tends to be a net receiver. In time-varying analysis, they found that the total connectedness generally increased until the 2014 crude oil crash, and then decreased sharply. Lovch and Perez-Laborda [16] used the connectedness method and frequency decomposition method to investigate the relationship between the natural gas and crude oil price during the period from 1994 to 2018. They found that the volatility connectedness varied over time; the connectedness became weak after the financial crisis; and the volatility had long-run effects, except during some specific periods, when volatility shocks transmitted faster but dissipated in the short-run.

3. Empirical Methodology

In this paper, we employ two methods to establish the nature of the relationship between exchange rates and natural gas price. The first method is provided by Diebold and Yilmaz (DY) [4,5,6], whose approach calculates the connectedness between different objects by introducing variance decomposition into vector autoregression (VAR) models. The second method is based on Baruník and Křehlík (BK) [7], who proposed a new framework to estimate connectedness by using a spectral representation of variance decomposition. In conclusion, the DY framework describes the connectedness as “when shocks are arising in one variable, how would other variables be changing?”, whereas the BK framework estimates the connectedness in short-, medium-, and long-term financial cycles.

3.1. Connectedness Table

Based on Diebold and Yilmaz [6], a simplified connectedness table is presented in Table 1, which gives a clear picture of aggregated and disaggregated connectedness.
In the table, xi is the interested variable, whereas dij is the pairwise directional connectedness from xj to xi, which shows what percentage of the h-step-ahead forecast error variance in xi is due to the shocks in xj (Equation (1)). We can simply understand dij as how much future uncertainty of xi is due to the shocks in xj:
C i j = d i j .
The column “From” is the total directional connectedness from xj to others (Equation (2)), and the row “To” means the total directional connectedness from others to xi (Equation (3)):
C · j = i = 1 i j N d i j ,
C i · = j = 1 j i N d i j .
We were also interested in net pairwise directional connectedness (Equation (4)) and net total directional connectedness (Equation (5)), which are expressed as a negative value to indicate a net recipient and a positive value to indicate a net transmitter:
C i j = C j i C i j ,
C i = C · i C i ·
Finally, the total connectedness (Equation (6)), calculated by the grand total of the off-diagonal entries of dij, is given in the lower-right cell of the connectedness table:
C = 1 N i , j = 1 i j N d i j .

3.2. Generalized Forecast Error Variance Decomposition (GFEVD)

Diebold and Yilmaz [4] measured connectedness based on forecast error variance decompositions from VAR models, which were introduced by Sims [17] and Koop et al. [18]. However, the calculation of variance decomposition requires orthogonalized shocks and depends on ordering the variables, so Diebold and Yilmaz [5] exploited the generalized forecast error variance decomposition (GFEVD) of Pesaran and Shin [19] to solve those problems. In this paper, we employ the method of GFEVD to calculate the connectedness.
We will give a brief introduction to GFEVD, followed by an explanation of Lütkepohl [20] and Diebold and Yilmaz [6].
For easy understanding, we first consider a VAR (1) process with N-variable:
y t = v + A 1 y t 1 + u t ,       t = 0 , ± 1 , ± 2 E ( u t ) = 0 E ( u t u t ) = Σ u E ( u t u s ) = 0 ,       t s .
If the generation mechanism starts at time t = 1, we get:
y 1 = v + A 1 y 0 + u 1 y 2 = v + A 1 y 1 + u 2 = v + A 1 ( v + A 1 y 0 + u 1 ) + u 2 = ( I N + A 1 ) v + A 1 2 y 0 + A 1 u 1 + u 2 y t = ( I N + A 1 + + A 1 t 1 ) v + A 1 t y 0 + m = 0 t 1 A 1 m u t m . .
If all eigenvalues of A1 have modulus less than 1 (VAR process is stable), we have:
( I N + A 1 + + A 1 t 1 ) v     ( I N A 1 ) 1 v   as   t A 1 t y 0 0     as   t .
Then, we can rewrite Equation (7) as:
y t = μ + m = 0 A 1 m u t m ,       t = 0 , ± 1 , ± 2 where   μ ( I N A 1 ) 1 v .
Secondly, let us consider a VAR (p) process:
y t = v + A 1 y t 1 + + A p y t p + u t ,   t = 0 , ± 1 , ± 2 ,
By using matrices, we can rewrite the VAR (p) process as a VAR (1) process:
Y t = v + A Y t 1 + U t Y t ( N p 1 ) [ y 1 y 2 y t p + 1 ] ,       v ( N p × 1 ) [ v 0 0 ] A ( N p × N p ) [ A 1 I N 0 A 2 0 I N A p 1 A p 0 0 0 0 0 0 0 I N 0 ] ,       U t ( N p × 1 ) = [ u t 0 0 ] .
Similar to Equation (10), Equation (12) can be rewritten as:
Y t = μ + m = 0 A m U t m ,         t = 0 , ± 1 , ± 2
By pre-multiplying a N × Np matrix J [ I N : 0 : : 0 ] , we get:
y t = J Y t = J μ + m = 0 J A m U t m = J μ + m = 0 J A m J J U t m = μ + m = 0 Φ m u t m μ ( N × 1 ) = J μ ,       Φ m ( N × N ) J A m J ,       u t ( N × 1 ) = J U t .
Finally, we get a moving average (MA) representation of the VAR(p) process:
y t = μ + m = 0 Φ m u t m E ( u t ) = 0 E ( u t u t ) = Σ u E ( u t u s ) = 0 ,       t s .
The h-step GFEVD can be expressed as:
ω i j , h g = σ j j 1 m = 0 h 1 ( e i Φ m Σ u e j ) 2 m = 0 h 1 ( e i Φ m Σ u Φ m e j ) ,
where ei is the i-th column of IN and σjj is the j-th diagonal element of Σu.
Because the sums of the forecast error variance contribution are not necessarily in agreement, we contribute our generalized connectedness indexes as:
d i j = ω i j g ˜ = ω i j , h g j = 1 N ω i j , h g .

3.3. Spectral Representation of GFEVD

Based on the DY framework, the BK framework defines the general spectral representation of GFEVD and uses it to define the frequency-dependent connectedness measure, which is inspired by the previous research of Geweke [21,22,23] and Stiassny [24].
We still consider the MA representation of the VAR(p) process (Equation (15)). The BK framework provides a frequency response function (Equation (18)), which can be obtained as a Fourier transform of the coefficient Φm:
Ψ ( e i λ ) = m e i λ m Φ m ,       i = 1 .
The generalized causation spectrum over frequencies λ ∈ (−π, π) is defined as:
( f ( λ ) ) j , k = σ k k 1 | ( Ψ ( e i λ ) Σ u ) j , k | 2 ( Ψ ( e i λ ) Σ u Ψ ( e + i λ ) ) j , j ,
where (f(λ))j,k represents the portion of the spectrum of xj at a given frequency λ due to shocks in xk. In order to obtain a natural decomposition of variance decomposition to frequencies, a weighting function is defined as:
Γ j ( λ ) = ( Ψ ( e i λ ) Σ u Ψ ( e i λ ) ) j , j 1 2 π π π ( Ψ ( e i λ ) Σ u Ψ ( e i λ ) ) j , j d λ ,
where Γj (λ) represents the power of the j-th variable at a given frequency.
The entire range of frequencies’ influence of GFEVD from xj to xk is expressed as:
ω j k = 1 2 π π π Γ j ( λ ) ( f ( λ ) ) j , k d λ .
Additionally, the GFEVD on specified frequency band d = (a, b), a, b ∈ (−π, π), a < b, is defined as:
ω j k d = 1 2 π d Γ j ( λ ) ( f ( λ ) ) j , k d λ .
As in Section 3.2, we contribute our scaled GFEVD on frequency band d as below, to make sure that the sums of variance contribution are in agreement:
d i j = ω j k d ˜ = ω j k d k ω j k .

4. Empirical Results

4.1. Data

For this study, we collected daily data from Bloomberg, including the Henry Hub natural gas futures price (GASF), and the nominal dollar-denominated exchange rates for the Brazilian Real (BRL), Russian Ruble (RUB), Indian Rupee (INR), offshore Chinese Yuan (CNH), and South African Rand (ZAR). We used the offshore Chines Yuan instead of the onshore Chinese Yuan (CNY) for the reason that China has reformed its exchange rate regime twice, once in 2005 and the other in 2010. Before and after each reform, CNY kept its exchange rate steady for a long time, with almost no fluctuation or only change in a narrow range. Therefore, we chose CNH, which has more fluctuations, to conduct our analysis. In order to match the data availability for CNH, we used the data sample period from 23 August 2010 to 20 June 2019.
The stationary return series were obtained from Equation (18), and are in percentage points:
r i , t = 100 × l n ( p i , t p i , t 1 ) .
The return series for the natural gas price and exchange rate over time are plotted in Figure 1. Figure 1 shows that the GASF return had the highest volatility compared to the others. We consider that the natural gas price was largely affected by temperature, so most fluctuations occurred concentratedly during the winter season. A small number of fluctuations were recorded in the middle of the year, such as in 2012, when hot weather forecasts and elevated cooling demands created a great demand for natural gas. The RUB return fluctuated drastically at the end of 2014, when the crude oil crash happened, and caused the financial crisis in Russia.
Table 2 provides summary statistics for all return series. CNH has the lowest mean of all return series, as well as standard deviation. Therefore, in some way, CNH remained stable under government regulations. The GASF had the highest standard deviation, as shown in Figure 1. The distribution of all return series significantly deviated from normal, as demonstrated by the Jarque–Bera test.
We were interested in not only the connectedness of the return series, but also the volatility connectedness, because volatility can provide a measure of risk and is particularly crisis-sensitive [25]. As volatility is unobserved and must be estimated, we used generalized autoregressive conditional heteroscedasticity (GARCH) models to obtain the volatilities of BRL, INR, CNH, and GASF return series, and Glosten–Jagannathan–Runkle GARCH (GJR-GARCH) models to obtain the volatility of RUB and ZAR return series (for the sake of brevity, the results of the GARCH model and GJR-GARCH model are omitted).
The plots of volatility are presented in Figure 2. For simplicity’s sake, we used a different scale for the y-axis in RUB and GASF. The GASF fluctuated violently and most fluctuations accumulated during the winter season, which is consistent with the return series. The volatilities of the five exchange rates reached a high level at the end of 2011, compared to the period before and after, when the eurozone debt crisis reached its peak. The BRL’s volatility was turbulent after 2010, especially between 2015 and 2017, when Brazil experienced a severe economic crisis and faced a dramatic economic recession. The volatility of INR reached its peak at the end of 2013, as the Indian rupee had depreciated greatly. The description statistics for volatility are reported in Table 3. Similar to the return series, GASF has the highest standard deviation, whereas CNH has the lowest. All volatilities were skewed and had high kurtosis, indicating that the distributions showed obvious non-normality characteristics. The Jarque–Bera test also verifies our opinion.

4.2. Connectedness and Frequency Decomposition

As the calculation of the connectedness index is based on the VAR model, we conducted an augmented Dickey–Fuller (ADF) test for the unit root before applying the data to the VAR model.
However, it is well-known that the unit root hypothesis can be rejected if the data series contain structural break(s) [26,27,28]. As our sample period is long, from 2010 to 2019, which is almost 9 years, and several big events happened during the sample period, such as the 2014 crude oil crush, which may have had an impact on the economies and caused structural breaks, it is well-founded to consider that structural breaks may exist. Therefore, a Bai–Perron test for structural breaks was conducted. The p-values of the Bai–Perron test for the return series are presented in Table 4. All numbers indicate the acceptance of null hypothesis that no break exists. These results confirm the reliability of the ADF test.
The results of the ADF test are presented in Table 5. All results show that no unit root exists. The p lags of the VAR model were chosen by the Akaike information criterion (AIC). Return series used the VAR (1) model, whereas volatilities used the VAR (2) model (for the sake of brevity, the results of the VAR model are omitted).
The connectedness index based on DY and its spectral representation based on BK of short-, medium-, long-term are reported in Table 6, Table 7, Table 8 and Table 9, respectively. The frequency band of short term, medium term, and long term in Table 6 roughly corresponds to 1 day to 5 days, 5 days to 21 days, and more than 21 days, respectively. The diagonal elements in both tables represent the own-market connectedness and are not important in our paper. We have more interest in the off-diagonal elements, which indicate pairwise connectedness between two variables: the values of the To row, which show when one variable receives a shock; how much influence would be exerted on other variables; the values of the “From” column, which measure the composition of one variable’s change; and the values of the “Net” row, which reveal whether a variable is a net recipient or a net transmitter. The “GAS-FX” column, which exhibits the net pairwise directional connectedness between GAS and the five exchange rates, is the most critical for our study.
As shown in Table 6, the total connectedness of the return series is 22.484%, which is almost twice as much as the connectedness between volatilities (11.697%), but both of them are modest. In this system, no matter what the connectedness from the return series or volatilities was, the shocks transmitted from ZAR to BRL contributed the largest value. The BRL was a net transmitter in return connectedness, but a net recipient in volatility connectedness. The RUB was opposite to BRL in that it was a net recipient in the return case, but a net transmitter in the volatility case. Furthermore, INR, CNH, and GASF were net receivers in both cases, whereas ZAR was a net transmitter. By obtaining the absolute value of the “Net” row, we found that INR had the strongest influence (11.517%) in all return series and ZAR was the most powerful variable (16.677%) in volatilities.
In Table 7, Table 8 and Table 9, we note that the sum of total connectedness in the short term, medium term, and long term is equal to the total connectedness shown in Table 6, which is in agreement with the definition of frequency decomposition for connectedness. It is interesting to find that the total connectedness from the return series is highest in the short term (17.756%), followed by the medium term (3.480%) and long term (1.248%). By contrast, from volatilities, the value is highest in the long term (11.232%), followed by the medium term (0.370%) and short term (0.095%), which means that the uncertainty transmitted by the shock has a long-term impact on the market, rather than the shock itself.
From the values of the GAS-FX column, we found that the net pairwise connectedness between GAS and the exchange rate was higher in volatilities than return series, but both were very weak. All values were almost zero. The possible reason for this is that the GASF data we have chosen are for Henry Hub natural gas, which could be seen as representative of the North American natural gas market. However, as the natural gas pipeline in North America can hardly reach any BRICS countries, and the distance between North America and BRICS countries makes the transportation cost of LNG expensive, whether as an import or export, North American natural gas is not the primary selection for BRICS countries. Our opinion is also supported by statistics from the BP Statistical Review of World Energy [1]. Whether natural gas is traded by a pipeline or LNG, the quantity being directed from the US, Mexico, and Canada to BRICS countries is very low. Consequently, we could say that the natural gas price is unrelated to the exchange rate in BRICS countries.

4.3. Rolling-Window Analysis

We also conducted a rolling-window analysis to investigate the time-varying connectedness between GAS and exchange rates. The window size was 300 (we also obtained the dynamic connectedness from a window size of 400 and obtained similar results to the result produced from the 300 window size). Figure 3 plots the dynamic total connectedness. From Figure 3, we can see that the total connectedness from the return series begins with a high level (around 40%) in the first few windows, and then falls after 2011 (around 25%), when South Africa joined the BRICS group and the period in which the European debt crisis was at its peak. After a temporary rise in late 2012, the connectedness falls again at the beginning of 2013 (around 20%). From 2013 to mid-2015, the connectedness fluctuates between 20% and 25%, and then rises again to over 30% after mid-2015. The connectedness drops dramatically between 2017 and 2018, from almost 35% to around 20%, and then recovers slowly. The trend of dynamic connectedness from volatilities is similar to that of return series. There are several unusual peaks and troughs in the plot, which we think are related to big events, like the Russian financial crisis (2014), the Brazilian economic recession (2015), and the US–China trade war (2018). Figure 4 presents the frequency decomposition of dynamic connectedness. We find that, whether in the short, medium, or long term, the trend of return connectedness is similar to the dynamic total connectedness. However, for volatilities, in the short and medium term, the connectedness exhibits almost no change (except for some abrupt rises and falls), and the long term has a similar trend to total connectedness. We think that long-term connectedness exerts the most influence in the case of volatility.
The time-varying net pairwise connectedness between GAS and exchange rates return series is plotted in Figure 5. Like the result in Section 4.2, all values were low and almost all of them were below 2.5% in terms of the absolute value, so were negligible. The results from volatilities are presented in Figure 6. There are also several sudden rises and falls, which is consistent with the plot of total connectedness. In the net pairwise connectedness of GAS-BRL, GAS-INR, and GAS-ZAR pairs, except for the abnormal value at some points, the values were almost insignificant; thus, we can hardly say that the GAS has an influence on the exchange rate or vice versa. However, in GAS-RUB and GAS-CNH pairs, there are some significant positive or negative periods during our data span. Before 2014, GAS was a net transmitter to RUB, and then turned into a net recipient after 2014, when Russia was undergoing an economic crisis caused by the oil price crash. After 2016, GAS was a net transmitter to CNH, when Australia became the largest supplier of LNG to China instead of Qatar, and the trade kept increasing after that.

5. Conclusions

This paper examined the connectedness between the Henry Hub natural gas price and the BRICS’s exchange rates. To that end, the connectedness methodology from Diebold and Yilmaz (2009, 2012, 2015) as well as frequency decomposition of connectedness proposed by Baruník and Křehlík (2018) were used. We collected data from 23 August 2010 to 20 June 2019 and tested both return series and volatilities from GARCH models.
Our empirical results show that the total connectedness was 22.5% in the return series and 11.7% in volatilities. Compared to results from previous studies—such as Lundgren et al. [13] who found that the total volatility connectedness among renewable energy stock returns, investment assets, and several sources of uncertainty is 67.4%—our results are modest, which means that most variation was due to the variation in the variables themselves. By taking the frequency decomposition of connectedness, we found that, in the return series, the short term contributes to the total connectedness the most, whereas the long term contributes most in relation to volatility. From the results of net pairwise connectedness between the natural gas price and exchange rates, we obtained a value of almost zero in each natural gas and exchange rate pair, which means that natural gas does not play an important role in explaining movements in the exchange rates. We also applied a rolling-window approach to conduct the time-varying analysis. In short, the results are similar to those of the constant analysis and we cannot say for certain that the natural gas price had a great influence on exchange rate movement. Only in the plot of volatility connectedness were there several dramatic fluctuations, which we consider to be connected to some notable events, such as economic crises and trade frictions.
Our results are obviously different from the results of the studies on the relationship between the oil price and exchange rates, such as that conducted by Singh et al. (2018), who found that the total volatility connectedness between the oil price and nine exchange rates reached 72.96%. The shocks transmitted from crude oil to each exchange rate are also significant. We consider some possible reasons for the difference. First, crude oil can be used more widely across different fields than natural gas. For example, it can fuel our cars and make plastics, rubbers, and the like, which are uses that cannot be replaced by natural gas. As indicated in the BP Statistical Review of World Energy [1], crude oil has the highest share in global energy consumption, and its consumption is almost double that of natural gas. Second, the production of crude oil far exceeds that of natural gas. Therefore, whether for energy import countries or energy export countries, crude oil is more easily traded. Third, compared to developed countries, awareness of the environment in developing countries is at a lower level. As the BRICS are the focus of our study, although their consumption of natural gas has increased in recent years, natural gas is still not the primary energy source for these countries (with the exception of Russia). India, China, and South Africa consumed coal the most in 2019, while Brazil consumed oil the most [1].
Although crude oil plays an irreplaceable role in the energy market now, with increasing environmental awareness, we believe that natural gas will become more important and the connectedness between the natural gas price and exchange rates will become stronger in the future.
The empirical evidence in this study may have important implications for policymakers, especially those in oil-dependent countries. As much of the literature shows that exchange rates are highly dependent on the oil price, turbulence in the crude oil market could have a great impact on the foreign currency market, thus causing exchange rate pressure and even economic instability. In order to solve the foreign exchange fluctuation, monetary authorities need to accumulate or reduce foreign exchange reserves, which is not considered desirable in the real world. Changing the dependence structure in relation to energy—from depending on energy that is closely connected with the currency market, such as crude oil, to depending on energy that is hardly connected to the currency market, such as natural gas—could provide an efficient way of maintaining economic stability and reducing exchange rate pressure. By contrast, because of the low connectedness between the natural gas price and exchange rates, foreign exchange fluctuation may barely be affected by the natural gas price. Therefore, for investors, it is less risky to invest in gas-related financial products than oil-related financial products, which are highly connected with currency.
Although this paper conducted thorough research, there were several limitations in the empirical work. First, although we found that natural gas did not have a significant impact on the exchange rate, this result could be influenced by the data selection. We used Henry Hub as our natural gas price data, which represents the North American natural gas market. However, given the restriction of pipelines and high transportation cost, North American countries that produce natural gas may not be the primary selection for BRICS. Second, with technological improvements in exploiting natural gas and the increasing number of gas liquefaction plants, we assumed that the LNG price would have more influence on the exchange rate than the pipeline natural gas price did. However, owing to data limitations, we could only focus on the whole natural gas market, which may be the reason why the connectedness between the natural gas price and exchange rates was modest. Therefore, for further extension of this research, first, we want to collect different natural gas price data, such as the Netherlands Title Transfer Facility (TTF) index and Japan Korea Marker, to exclude the impact of data selection on the results. Second, we want to analyze the relationship between the crude oil price and exchange rates and the relationship between the crude oil price and natural gas price. This would allow us to compare the connectedness between the crude oil price and exchange rates with that between the natural gas price and exchange rates more rationally. Finally, if the data permit, we want to use the data on only LNG to find the connectedness between the natural gas price and foreign exchange rates more precisely.

Author Contributions

Conceptualization, S.H.; investigation, Y.H.; writing—original draft preparation, Y.H.; writing—review and editing, T.N.; project administration, S.H.; funding acquisition, S.H.

Funding

This work was supported by JSPS KAKENHI Grant Number 17H00983.

Acknowledgments

We are grateful to four anonymous referees for their helpful comments and suggestions.

Conflicts of Interest

The authors declare no conflicts of interest.

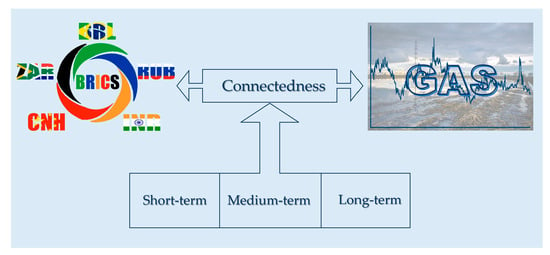
Appendix A. Robustness Analysis

We used the Henry Hub natural gas spot price (GASS) as the natural gas price data to examine the robustness of our results. (The natural gas futures index in the United Kingdom, which is known as the UK National Balancing Point (NBP), was also used to conduct the robustness check, but the results were quite similar to those from GASS, so we only present the connectedness table of NBP and exchange rates (Table A2) in Appendix A).
The plot of GASS’s return and volatility series are reported in Figure A1. We found that some values of volatility were extremely large (the maximum is over 800). We think that the reason for this is that the natural gas spot price was more easily affected by the change of demand and supply than the future price, even though the change was small.
We summarize the results of connectedness and the frequency decomposition of short, medium, and long term in Table A1, Table A3, Table A4, Table A5, respectively. The result is quite similar to that of GASF and exchange rates. We also used a 300 rolling-window to conduct the time-varying analysis. The dynamic connectedness and its spectral representation are plotted in Figure A2 and Figure A3, respectively. The net pairwise connectedness of return series and volatilities are illustrated in Figure A4 and Figure A5, respectively. All results are consistent with those from the analysis using the natural gas future price, except for the net pairwise connectedness of return series (Figure A4). Some values are opposite to the result above, but all of them are low, even the maximum value, which is less than 5% and negligible.
The results of robustness confirm the suitability of our proposed approach, which aimed to capture the relationship between the natural gas price and exchange rates.
Table A1. Connectedness between the natural gas spot price and BRICS’s exchange rates.
BRLRUBINRCNHZARGASSFromGAS-FX
Return
BRL69.8397.7141.4563.12417.6880.17930.161−0.249
RUB8.32373.4052.6813.27612.2300.08526.595−0.058
INR5.5713.83377.7273.6529.0660.15222.2730.040
CNH3.5883.6483.37881.2967.9530.13718.7040.136
ZAR16.23310.5593.2526.20663.6430.10836.3570.094
GASS0.4290.1430.1130.0010.01499.3010.699
To34.14325.89610.87916.25946.9510.66022.465
Net3.983−0.699−11.394−2.44410.593−0.039
Volatility
BRL75.5333.6600.2880.35420.1380.02524.467−0.377
RUB0.89097.5690.7500.2980.4790.0142.431−0.006
INR3.1330.49492.7910.2773.2350.0707.209−0.234
CNH3.6790.2132.71385.5767.1230.69614.4240.678
ZAR11.2510.2820.8011.06786.3630.23613.6370.208
GASS0.4020.0200.3040.0180.02899.2290.771
To19.3564.6694.8562.01531.0031.04110.490
Net−5.1112.238−2.354−12.41017.3670.270
Note: BRL, RUB, INR, CNH, and ZAR are Brazilian Real, Russian Ruble, Indian Rupee, offshore Chinese Yuan, and South African Rand, respectively. GASF is the Henry Hub natural gas futures price. From column reports the total directional connectedness from others to xi. To row reports the total directional connectedness from xi to others. Net row reports the net total directional connectedness. GAS-FX column reports the net pairwise connectedness between the GASS and exchange rates, which is calculated by the GASS to others minus the others to GASS. The number in red represents the largest value in this system. The number in bold means the total connectedness. All results are expressed as a percentage.
Table A2. Connectedness between the UK NBP and BRICS’s exchange rates.
BRLRUBINRCNHZARGASSFromGAS-FX
Return
BRL69.7617.7911.3523.13917.7070.24930.239−0.099
RUB8.33773.3952.6603.30712.2510.04926.605−0.014
INR5.4723.79677.4463.6869.1150.48522.5540.134
CNH3.6003.6763.39180.9047.9710.45819.096−0.088
ZAR16.16210.4913.2276.21563.3460.55936.654−0.286
GASS0.3480.0620.3520.5460.84597.8472.153
To33.91925.81610.98316.89347.8891.80022.883
Net3.680−0.788−11.571−2.20411.236−0.353
Volatility
BRL75.1643.5090.5420.27720.2540.25424.836−0.041
RUB0.94796.0340.9520.1880.5491.3293.9661.213
INR3.4940.24490.7520.3283.4041.7789.248−1.243
CNH3.8790.2692.68485.5776.8040.78814.4230.611
ZAR11.0280.3180.7750.82286.3800.67713.620−0.742
GASS0.2950.1163.0210.1771.41994.9715.029
To19.6434.4567.9741.79232.4304.82711.854
Net−5.1930.491−1.274−12.63118.810−0.202
Note: BRL, RUB, INR, CNH, and ZAR are Brazilian Real, Russian Ruble, Indian Rupee, offshore Chinese Yuan, and South African Rand, respectively. NBP is the UK National Balancing Point. From column reports the total directional connectedness from others to xi. To row reports the total directional connectedness from xi to others. Net row reports the net total directional connectedness. GAS-FX column reports the net pairwise connectedness between the NBP and exchange rates, which is calculated by the NBP to others minus the others to NBP. The number in red represents the largest value in this system. The number in bold means the total connectedness. All results are expressed as a percentage.
Table A3. Connectedness between the natural gas spot price and exchange rates in the frequency domain (short term).
BRLRUBINRCNHZARGASSFromGAS-FX
Return
BRL58.9536.0791.1072.77214.5300.11824.606−0.295
RUB6.71358.8082.1602.7059.5110.05721.146−0.060
INR4.0272.71664.1612.6966.0530.15015.6410.075
CNH2.9693.1242.80966.2386.3610.09615.3570.095
ZAR13.4758.6162.7695.04251.6200.08929.9910.081
GASS0.4140.1180.0750.0010.00881.9320.615
To27.59720.6538.91913.21636.4630.51017.893
Net2.991−0.494−6.722−2.1416.472−0.106
Volatility
BRL2.6980.0020.0280.0020.2050.0020.238−0.003
RUB0.0011.2560.0110.0020.0260.0010.041−0.003
INR0.0160.0091.0990.0060.0300.0000.061−0.001
CNH0.0100.0020.0225.1300.0560.0040.0930.001
ZAR0.0900.0110.0140.0061.1930.0000.121−0.001
GASS0.0050.0040.0010.0040.0018.6370.015
To0.1230.0280.0760.0190.3180.0070.095
Net−0.116−0.0140.015−0.0750.197−0.008
Note: The frequency band of short term roughly corresponds to 1 day to 5 days. All results are expressed as a percentage. Note: BRL, RUB, INR, CNH, and ZAR are Brazilian Real, Russian Ruble, Indian Rupee, offshore Chinese Yuan, and South African Rand, respectively. GASF is the Henry Hub natural gas futures price.
Table A4. Connectedness between the natural gas spot price and exchange rates in the frequency domain (medium term).
BRLRUBINRCNHZARGASSFromGAS-FX
Return
BRL8.0611.1970.2540.2652.3250.0454.0860.032
RUB1.19510.7500.3820.4231.9970.0204.0180.001
INR1.1430.82110.0680.7052.2160.0034.888−0.025
CNH0.4650.3920.42611.1371.1770.0302.4890.030
ZAR2.0451.4230.3590.8568.8680.0144.6970.010
GASS0.0130.0190.0280.0000.00413.0170.065
To4.8613.8521.4482.2507.7200.1133.374
Net0.775−0.166−3.440−0.2403.0230.048
Volatility
BRL9.1810.0050.0520.0201.3310.0051.413−0.030
RUB0.0073.9810.0430.0130.0900.0020.155−0.003
INR0.2530.0765.8280.0150.0840.0020.430−0.012
CNH0.0900.0030.08614.1600.3850.0930.6570.087
ZAR0.4860.0500.0490.0054.4300.0060.5960.002
GASS0.0360.0050.0140.0070.00435.7400.065
To0.8720.1390.2440.0591.8940.1080.553
Net−0.541−0.016−0.186−0.5981.2980.044
Note: The frequency band of medium term roughly corresponds to 5 days to 21 days. All results are expressed as a percentage. Note: BRL, RUB, INR, CNH, and ZAR are Brazilian Real, Russian Ruble, Indian Rupee, offshore Chinese Yuan, and South African Rand, respectively. GASF is the Henry Hub natural gas futures price.
Table A5. Connectedness between the natural gas spot price and exchange rates in the frequency domain (long term).
BRLRUBINRCNHZARGASSFromGAS-FX
Return
BRL2.8250.4370.0950.0870.8330.0161.4680.014
RUB0.4153.8470.1380.1490.7220.0071.4310.001
INR0.4010.2963.4980.2500.7970.0001.744−0.010
CNH0.1550.1320.1443.9210.4150.0100.8570.010
ZAR0.7130.5200.1240.3083.1550.0051.6690.003
GASS0.0010.0060.0100.0000.0024.3520.019
To1.6851.3910.5120.7932.7690.0381.198
Net0.217−0.040−1.232−0.0631.0990.019
Volatility
BRL63.6543.6540.2080.33318.6030.01822.815−0.343
RUB0.88292.3320.6960.2830.3620.0112.2340.001
INR2.8640.40985.8640.2573.1210.0686.719−0.221
CNH3.5800.2092.60566.2856.6820.59813.6740.591
ZAR10.6750.2200.7381.05680.7400.23012.9190.207
GASS0.3610.0110.2890.0080.02354.8510.691
To18.3624.5024.5351.93728.7900.9269.842
Net−4.4542.268−2.183−11.73715.8720.235
Note: The frequency band of long term roughly corresponds to more than 21 days. All results are expressed as a percentage. Note: BRL, RUB, INR, CNH, and ZAR are Brazilian Real, Russian Ruble, Indian Rupee, offshore Chinese Yuan, and South African Rand, respectively. GASF is the Henry Hub natural gas futures price.
Figure A1. Daily return and volatility: (a) return series and (b) volatility.
Energies 12 03970 g0a1
Figure A2. Dynamic connectedness: (a) total connectedness of return series and (b) total connectedness of volatilities. Note: BRL, RUB, INR, CNH, and ZAR are Brazilian Real, Russian Ruble, Indian Rupee, offshore Chinese Yuan, and South African Rand, respectively. GASF is the Henry Hub natural gas futures price.
Energies 12 03970 g0a2
Figure A3. Frequency decomposition of dynamic connectedness: (a) frequency decomposition of total connectedness for return series and (b) frequency decomposition of total connectedness for volatilities. Note: BRL, RUB, INR, CNH, and ZAR are Brazilian Real, Russian Ruble, Indian Rupee, offshore Chinese Yuan, and South African Rand, respectively. GASF is the Henry Hub natural gas futures price.
Energies 12 03970 g0a3
Figure A4. Net pairwise connectedness of return series: (ae) refer to the net pairwise connectedness between GASS and BRL, RUB, INR, CNH, and ZAR return series, respectively. Note: BRL, RUB, INR, CNH, and ZAR are Brazilian Real, Russian Ruble, Indian Rupee, offshore Chinese Yuan, and South African Rand, respectively. GASF is the Henry Hub natural gas futures price.
Energies 12 03970 g0a4
Figure A5. Net pairwise connectedness of volatility. (ae) refer to the net pairwise connectedness between the volatility of GASS and BRL, RUB, INR, CNH, and ZAR, respectively. Note: BRL, RUB, INR, CNH, and ZAR are Brazilian Real, Russian Ruble, Indian Rupee, offshore Chinese Yuan, and South African Rand, respectively. GASF is the Henry Hub natural gas futures price.
Energies 12 03970 g0a5

References

  1. BP p.l.c. BP Statistical Review of World Energy 2019. Available online: https://www.bp.com/content/dam/bp/business-sites/en/global/corporate/pdfs/energy-economics/statistical-review/bp-stats-review-2019-full-report.pdf (accessed on 1 July 2019).
  2. Mckinsey & Company. Global Energy Perspective 2019: Reference Case. Available online: https://www.mckinsey.com/~/media/McKinsey/Industries/Oil%20and%20Gas/Our%20Insights/Global%20Energy%20Perspective%202019/McKinsey-Energy-Insights-Global-Energy-Perspective-2019_Reference-Case-Summary.ashx (accessed on 22 September 2019).
  3. International Energy Agency. World Energy Outlook 2018. 2018. Available online: https://www.iea.org/weo/ (accessed on 22 September 2019).
  4. Diebold, F.X.; Yilmaz, K. Measuring Financial Asset Return and Volatility Spillovers, with Application to Global Equity Market. Econ. J. 2009, 119, 158–171. [Google Scholar] [CrossRef]
  5. Diebold, F.X.; Yilmaz, K. Better to give than to receive: Predictive directional measurement of volatility spillovers. Int. J Forecast. 2012, 28, 57–66. [Google Scholar] [CrossRef]
  6. Diebold, F.X.; Yilmaz, K. Financial and Macroeconomic Connectedness: A Network Approach to Measurement and Monitoring; Oxford University Press: Oxford, UK, 2015. [Google Scholar]
  7. Baruník, J.; Křehlík, T. Measuring the Frequency Dynamics of Financial Connectedness and Systemic Risk. J. Financ. Econ. 2018, 16, 271–296. [Google Scholar] [CrossRef]
  8. Chen, S.-S.; Chen, H.-C. Oil prices and real exchange rates. Energy Econ. 2007, 29, 390–404. [Google Scholar] [CrossRef]
  9. Andrieș, A.M.; Ihnatov, I.; Tiwari, A.K. Analyzing time–frequency relationship between interest rate, stock price and exchange rate through continuous wavelet. Econ. Model. 2014, 41, 227–238. [Google Scholar] [CrossRef]
  10. Brahm, T.; Huang, J.-C.; Sissoko, Y. Crude oil prices and exchange rates: Causality, variance decomposition and impulse response. Energy Econ. 2014, 44, 407–412. [Google Scholar]
  11. Jain, A.; Pratap, B. Dynamic linkages among oil price, gold price, exchange rate, and stock market in India. Resour. Policy 2016, 49, 179–185. [Google Scholar] [CrossRef]
  12. Maghyereh, A.I.; Awartani, B.; Bouri, E. The directional volatility connectedness between crude oil and equity markets: New evidence from implied volatility indexes. Energy Econ. 2016, 57, 78–93. [Google Scholar] [CrossRef] [Green Version]
  13. Lundgren, A.I.; Milicevic, A.; Uddin, G.S.; Kang, S.H. Connectedness network and dependence structure mechanism in green investments. Energy Econ. 2018, 72, 145–153. [Google Scholar] [CrossRef]
  14. Singh, V.K.; Nishant, S.; Kumar, P. Dynamic and directional network connectedness of crude oil and currencies: Evidence from implied volatility. Energy Econ. 2018, 76, 48–63. [Google Scholar] [CrossRef]
  15. Ji, Q.; Geng, J.B.; Tiwari, A.K. Information spillovers and connectedness networks in the oil and gas markets. Energy Econ. 2018, 75, 71–84. [Google Scholar] [CrossRef]
  16. Lovch, Y.; Perez-Laborda, A. Dynamic frequency connectedness between oil and natural gas volatilities. Econ. Model. 2019. [Google Scholar] [CrossRef]
  17. Sims, C.A. Macroeconomics and Reality. Econometrica 1980, 48, 1–48. [Google Scholar] [CrossRef]
  18. Koop, G.; Pesaran, M.H.; Potter, S.M. Impulse response analysis in nonlinear multivariate models. J. Econ. 1996, 74, 119–147. [Google Scholar] [CrossRef]
  19. Pesaran, H.H.; Shin, Y. Generalized impulse response analysis in linear multivariate models. Econ. Lett. 1998, 58, 17–29. [Google Scholar] [CrossRef]
  20. Lütkepohl, H. New Introduction to Multiple Time Series Analysis; Springer: Berlin/Heidelberg, Germany, 2005. [Google Scholar]
  21. Geweke, J. Measurement of Linear Dependence and Feedback between Multiple Time Series. J. Am. Stat. Assoc. 1982, 77, 304–313. [Google Scholar] [CrossRef]
  22. Geweke, J. Measures of Conditional Linear Dependence and Feedback between Time Series. J. Am. Stat. Assoc. 1984, 79, 907–915. [Google Scholar] [CrossRef]
  23. Geweke, J. The Superneutrality of Money in the United States: An Interpretation of the Evidence. Econometrica 1986, 54, 1–21. [Google Scholar] [CrossRef]
  24. Stiassny, A. A spectral decomposition for structural VAR models. Empir. Econ. 1996, 21, 535–555. [Google Scholar] [CrossRef]
  25. Diebold, F.X.; Yilmaz, K. On the network topology of variance decompositions: Measuring the connectedness of financial firms. J. Econ. 2011, 182, 119–134. [Google Scholar] [CrossRef]
  26. Perron, P. The great crash, the oil price shock, and the unit root hypothesis. Econometrica 1989, 57, 1361–1401. [Google Scholar] [CrossRef]
  27. Papell, D.H.; Lumsdaine, R.L. Multiple trend breaks and the unit-root hypothesis. Rev. Econ. Stat. 1997, 79, 212–218. [Google Scholar]
  28. Andrews, D.W.K.; Zivot, E. Further evidence on the great crash, the oil-price shock, and the unit-root hypothesis. J. Bus. Econ. Stat. 2002, 20, 25–44. [Google Scholar]
Figure 1. Daily return. Note: BRL, RUB, INR, CNH, and ZAR are Brazilian Real, Russian Ruble, Indian Rupee, offshore Chinese Yuan, and South African Rand, respectively. GASF is the Henry Hub natural gas futures price. (af) refer to BRL, RUB, INR, CNH, ZAR, and GASF return series, respectively.
Energies 12 03970 g001
Figure 2. Volatility. Note: BRL, RUB, INR, CNH, and ZAR are Brazilian Real, Russian Ruble, Indian Rupee, offshore Chinese Yuan, and South African Rand, respectively. GASF is the Henry Hub natural gas futures price. (af) refer to the volatility of BRL, RUB, INR, CNH, ZAR, and GASF return series, respectively.
Energies 12 03970 g002
Figure 3. Dynamic connectedness: (a) total connectedness of return series and (b) total connectedness of volatilities. BRL, RUB, INR, CNH, and ZAR are Brazilian Real, Russian Ruble, Indian Rupee, offshore Chinese Yuan, and South African Rand, respectively.
Energies 12 03970 g003
Figure 4. Frequency decomposition of dynamic connectedness: (a) frequency decomposition of total connectedness for return series and (b) frequency decomposition of total connectedness for volatilities. Note: BRL, RUB, INR, CNH, and ZAR are Brazilian Real, Russian Ruble, Indian Rupee, offshore Chinese Yuan, and South African Rand, respectively. GASF is the Henry Hub natural gas futures price.
Energies 12 03970 g004
Figure 5. Net pairwise connectedness of return series. (ae) refer to the net pairwise connectedness between GASF and BRL, RUB, INR, CNH, and ZAR return series, respectively. Note: BRL, RUB, INR, CNH, and ZAR are Brazilian Real, Russian Ruble, Indian Rupee, offshore Chinese Yuan, and South African Rand, respectively. GASF is the Henry Hub natural gas futures price.
Energies 12 03970 g005
Figure 6. Net pairwise connectedness of volatility. (ae) refer to net pairwise connectedness between the volatility of GASF and BRL, RUB, INR, CNH, and ZAR, respectively. Note: BRL, RUB, INR, CNH, and ZAR are Brazilian Real, Russian Ruble, Indian Rupee, offshore Chinese Yuan, and South African Rand, respectively. GASF is the Henry Hub natural gas futures price.
Energies 12 03970 g006
Table 1. Connectedness table.
x1x2xNFrom
x1d11d12d1N j = 1 N d 1 j   j 1
x2d21d22d2N j = 1 N d 2 j   j 2
xNdN1dN2dNN j = 1 N d N j   j N
To i = 1 N d i 1
i 1
i = 1 N d i 2
i 2
i = 1 N d i N
i N
1 N i , j = 1 N d i j   i j
Source: Diebold and Yilmaz (2015).
Table 2. Summary statistics for daily returns.
MinMaxMeanStd DevSkewnessKurtosisJB-Test
BRL−5.6017.2700.0340.9490.1403.7841386.046 ***
RUB−9.7719.7310.0321.0240.44013.93318,741.359 ***
INR−3.2943.9040.0170.4510.2867.5465509.334 ***
CNH−1.4712.7470.0010.2270.47314.52220,365.878 ***
ZAR−5.0816.4440.0290.9860.2711.994411.515 ***
GASF−18.05516.691−0.0252.7590.1164.0801607.127 ***
Note: BRL, RUB, INR, CNH, and ZAR are Brazilian Real, Russian Ruble, Indian Rupee, offshore Chinese Yuan, and South African Rand, respectively. GASF is the Henry Hub natural gas futures price. The sample period is from 23 August 2010 to 20 June 2019. The JB-Test refers to the Jarque–Bera test for normality. *** indicates rejection of the null hypothesis that the data are normally distributed at the 1% level of significance.
Table 3. Summary statistics for volatilities of daily returns.
MinMaxMeanStd DevSkewnessKurtosisJB-Test
BRL0.1115.4660.9570.7072.1276.5365847.958 ***
RUB0.13521.9071.0612.0446.10844.688206,321.592 ***
INR0.0483.2970.2230.2776.27552.188276,967.370 ***
CNH0.0050.7750.0550.0683.67521.73750,619.087 ***
ZAR0.3724.2340.9780.5062.2056.7966312.786 ***
GASF2.59647.4077.5475.1022.83711.26615,299.202 ***
Note: BRL, RUB, INR, CNH, and ZAR are Brazilian Real, Russian Ruble, Indian Rupee, offshore Chinese Yuan, and South African Rand, respectively. GASF is the Henry Hub natural gas futures price. The volatilities of BRL, INR, CNY, and GASF return series were calculated by the generalized autoregressive conditional heteroscedasticity (GARCH) (1,1) model, and the volatilities of RUB and ZAR return series were calculated by the Glosten–Jagannathan–Runkle (GJR)-GARCH (1,1) model. The sample period is from 23 August 2010 to 20 June 2019. *** indicates rejection of the null hypothesis that the data are normally distributed at the 1% level of significance.
Table 4. Bai–Perron breakpoint test on return series.
BRLRUBINRCNHZARGASF
p-value0.7690.4480.3160.1900.7730.536
Note: BRL, RUB, INR, CNH, and ZAR are Brazilian Real, Russian Ruble, Indian Rupee, offshore Chinese Yuan, and South African Rand, respectively. GASF is the Henry Hub natural gas futures price. Each number indicates the p-value of the Bai–Perron breakpoint test.
Table 5. Augmented Dickey–Fuller (ADF) test on return series and volatilities.
BRLRUBINRCNHZARGASF
Return
Dickey–Fuller−12.050 ***−11.581 ***−11.718 ***−11.470 ***−14.284 ***−13.837 ***
Volatility
Dickey–Fuller−5.493 ***−4.983 ***−5.471 ***−6.763 ***−4.013 ***−5.422 ***
Note: BRL, RUB, INR, CNH, and ZAR are Brazilian Real, Russian Ruble, Indian Rupee, offshore Chinese Yuan, and South African Rand, respectively. GASF is the Henry Hub natural gas futures price. Each number indicates that Dickey–Fuller is the ADF test statistic. *** indicates rejection of the null hypothesis that a unit root is present in the time series at the 1% level of significance.
Table 6. Connectedness among the natural gas future price and BRICS’s exchange rates.
BRLRUBINRCNHZARGASFFromGAS-FX
Return
BRL69.7197.7901.3603.12917.6920.31030.281−0.124
RUB8.33573.3342.6583.30312.2480.12226.666−0.113
INR5.5023.81477.8173.6869.1650.01722.1830.016
CNH3.6093.6933.39181.3057.9980.00418.695−0.024
ZAR16.24110.5513.2556.23763.6730.04336.327−0.012
GASF0.4330.2350.0010.0280.05599.2480.752
To34.11926.08310.66516.38347.1580.49622.484
Net3.838−0.583−11.517−2.31210.831−0.257
Volatility
BRL75.2063.6300.7230.09219.2301.11824.7940.989
RUB1.04097.4720.7830.0600.3930.2522.528−3.667
INR4.2050.17491.7020.4463.4660.0068.298−0.026
CNH3.7680.1972.85386.0836.9430.15613.917−0.107
ZAR12.2650.2441.0800.44985.1710.79114.829−0.682
GASF0.1293.9200.0320.2631.47394.1835.817
To21.4078.1655.4711.31031.5062.32411.697
Net−3.3875.637−2.826−12.60716.677−3.493
Note: BRL, RUB, INR, CNH, and ZAR are Brazilian Real, Russian Ruble, Indian Rupee, offshore Chinese Yuan, and South African Rand, respectively. GASF is the Henry Hub natural gas futures price. From column reports the total directional connectedness from others to xi. To row reports the total directional connectedness from xi to others. Net row reports the net total directional connectedness. GAS-FX column reports the net pairwise connectedness between the GASF and exchange rates, which is calculated by the GASF to others minus the others to GASF. The number in red represents the largest value in this system. The number in bold means the total connectedness. All results are expressed as a percentage.
Table 7. Connectedness among the natural gas future price and exchange rates in the frequency domain (short term).
BRLRUBINRCNHZARGASFFromGAS-FX
Return
BRL58.2716.2291.1302.70114.4870.28224.829−0.111
RUB6.47058.6592.2072.6849.5130.09620.969−0.134
INR3.7962.56962.8372.6265.9750.01614.9820.015
CNH2.8383.1222.74865.3876.3160.00415.029−0.015
ZAR13.3328.8092.7675.09751.5840.04230.0480.004
GASF0.3930.2290.0010.0200.03982.4640.682
To26.82920.9588.85313.12836.3300.44017.756
Net1.999−0.010−6.129−1.9016.283−0.242
Volatility
BRL2.7830.0010.0270.0000.1930.0010.222−0.001
RUB0.0021.2260.0110.0000.0220.0000.036−0.010
INR0.0120.0061.1070.0060.0390.0010.063−0.002
CNH0.0120.0000.0295.0850.0570.0050.1030.003
ZAR0.0850.0120.0190.0041.1810.0000.120−0.007
GASF0.0010.0100.0040.0020.0083.0050.025
To0.1120.0300.0900.0120.3190.0080.095
Net−0.110−0.0060.026−0.0910.199−0.017
Note: BRL, RUB, INR, CNH, and ZAR are Brazilian Real, Russian Ruble, Indian Rupee, offshore Chinese Yuan, and South African Rand, respectively. GASF is the Henry Hub natural gas futures price. From column reports the total directional connectedness from others to xi. To row reports the total directional connectedness from xi to others. Net row reports the net total directional connectedness. GAS-FX column reports the net pairwise connectedness between the GASF and exchange rates, which is calculated by the GASF to others minus the others to GASF. The number in red represents the largest value in this system. The number in bold means the total connectedness. The frequency band of short term roughly corresponds to 1 day to 5 days. All results are expressed as a percentage.
Table 8. Connectedness among the natural gas future price and exchange rates in the frequency domain (medium term).
BRLRUBINRCNHZARGASFFromGAS-FX
Return
BRL8.4541.1490.1700.3182.3630.0204.020−0.009
RUB1.37210.8020.3340.4572.0110.0194.1930.015
INR1.2500.91211.0410.7772.3320.0015.2720.001
CNH0.5670.4230.47411.7211.2370.0002.701−0.006
ZAR2.1481.2890.3610.8408.9130.0014.639−0.011
GASF0.0300.0050.0000.0060.01212.3910.053
To5.3673.7771.3392.3987.9560.0423.480
Net1.347−0.416−3.933−0.3033.316−0.012
Volatility
BRL8.4520.0180.0910.0020.7120.0060.829−0.002
RUB0.0124.5300.0350.0000.0820.0020.130−0.059
INR0.0720.0344.7910.0200.1930.0010.320−0.003
CNH0.0750.0010.09315.1240.2750.0090.4520.004
ZAR0.2730.0360.0620.0043.8770.0010.375−0.032
GASF0.0080.0610.0050.0050.0339.8960.111
To0.4400.1500.2850.0291.2960.0190.370
Net−0.3890.020−0.035−0.4230.920−0.092
Note: BRL, RUB, INR, CNH, and ZAR are Brazilian Real, Russian Ruble, Indian Rupee, offshore Chinese Yuan, and South African Rand, respectively. GASF is the Henry Hub natural gas future price. From column reports the total directional connectedness from others to xi. To row reports the total directional connectedness from xi to others. Net row reports the net total directional connectedness. GAS-FX column reports the net pairwise connectedness between the GASF and exchange rates, which is calculated by the GASF to others minus the others to GASF. The number in red represents the largest value in this system. The number in bold means the total connectedness. The frequency band of medium term roughly corresponds to 5 days to 21 days. All results are expressed as a percentage.
Table 9. Connectedness among the natural gas future price and exchange rates in the frequency domain (long term).
BRLRUBINRCNHZARGASFFromGAS-FX
Return
BRL2.9940.4120.0600.1110.8420.0071.432−0.003
RUB0.4933.8730.1180.1620.7240.0071.5040.006
INR0.4560.3333.9400.2820.8570.0001.9290.000
CNH0.2040.1480.1694.1980.4440.0000.965−0.002
ZAR0.7610.4530.1260.2993.1760.0001.640−0.004
GASF0.0100.0010.0000.0020.0044.3920.017
To1.9231.3470.4730.8572.8720.0141.248
Net0.491−0.157−1.455−0.1081.232−0.003
Volatility
BRL63.9703.6110.6060.09018.3241.11123.7420.991
RUB1.02691.7160.7370.0590.2890.2502.361−3.598
INR4.1210.13485.8040.4213.2350.0037.914−0.020
CNH3.6810.1962.73165.8746.6110.14213.361−0.114
ZAR11.9060.1961.0000.44280.1130.79014.334−0.642
GASF0.1203.8480.0230.2571.43281.2825.680
To20.8557.9855.0971.26929.8912.29711.232
Net−2.8885.624−2.817−12.09315.558−3.384
Note: BRL, RUB, INR, CNH, and ZAR are Brazilian Real, Russian Ruble, Indian Rupee, offshore Chinese Yuan, and South African Rand, respectively. GASF is the Henry Hub natural gas future price. From column reports the total directional connectedness from others to xi. To row reports the total directional connectedness from xi to others. Net row reports the net total directional connectedness. GAS-FX column reports the net pairwise connectedness between the GASF and exchange rates, which is calculated by the GASF to others minus the others to GASF. The number in red represents the largest value in this system. The number in bold means the total connectedness. The frequency band of long term roughly corresponds to more than 21 days. All results are expressed as percentages.

