Article

Study on the Effect of Turbine Inlet Temperature and Backpressure Conditions on Reduced Turbine Flow Rate Performance Characteristics and Correction Method for Automotive Turbocharger

1
Eco-friendly Vehicle R&D Division, Korea Automotive Technology Institute, Chungnam 31214, Korea
2
Advanced Development Team, Keyyang precision Co. LTD, Gyeongsangbuk 39537, Korea
*
Author to whom correspondence should be addressed.
Energies 2019, 12(20), 3934; https://doi.org/10.3390/en12203934
Submission received: 30 August 2019 / Revised: 15 October 2019 / Accepted: 15 October 2019 / Published: 17 October 2019
(This article belongs to the Section I: Energy Fundamentals and Conversion)

Abstract

:
In actual vehicle operation, the turbocharger turbine operates at various temperatures, inlet, and backpressure conditions, unlike compressors. The flow rate characteristics of the turbine are generally evaluated under certain conditions using an assembled turbocharger with a compressor and a turbine and a hot gas bench from the turbocharger manufacturer. Flow rate characteristics are also presented as the reduced mass flow rate to correct the flow rate characteristics according to the turbine inlet temperature and pressure. Therefore, the turbine mass flow rate seen in many engine development cases and studies—including the analysis of the turbine performance and characteristics, engine model configuration, and matching of the engine and turbocharger—is calculated according to the reduced turbine mass flow rate performance and turbine inlet temperature and pressure obtained through hot gas bench experiments under certain conditions. However, the performance of the reduced turbine mass flow rate is influenced by the compressor power conditions, and additional correction of the reduced turbine mass flow rate is required when the turbine inlet temperature and turbine backpressure differ from the reference test conditions, such as the hot gas bench test conditions. In this study, the effect of the turbine inlet temperature and turbine backpressure on the performance of the reduced turbine mass flow rate were examined based on the power balance relationship between the compressor and turbine of an automotive turbocharger. The principle of its correction is also presented.

1. Introduction

Recently, turbocharged engines have become an important technical solution for improving the fuel economy of vehicles [1].
Meanwhile, the development of engine and turbocharger simulation technologies for turbocharger matching and control development for turbocharged engine development have become important technical challenges [2,3,4].
In many cases, the performance characteristics of the turbocharger used in a simulation are obtained from a performance test using standardized hot gas bench test conditions [5,6].
However, the hot gas bench test with low backpressure characteristics of the test equipment, fixed turbine inlet temperature, and steady-state flow conditions has limitations in reproducing actual engine operating conditions and expanding the turbine test range. Therefore, various studies are being conducted to incorporate the utilization of extended performance predictions and test results for engine development and simulations [7,8,9,10].
In addition, since the compressor and the turbine are connected by a single shaft, a problem exists in which the operation range of the turbine is limited according to the surge and choke limitations of the compressor [5].
In turbochargers, internal heat exchanges between the compressor, the turbine, the coolant, the lubrication oil, and the atmosphere occur concurrently.
This heat transfer causes temperature measurement errors in the after compressor temperature and the before and after turbine temperature in the middle and low speed ranges (in particular, the range of up to approximately 0.4 to 0.5 times the maximum rotational speed of the compressor is relatively small before and after the temperature difference), which is the turbocharger condition during actual engine operation. These measurement errors make it impossible to perform accurate measurements of isentropic efficiency [11].
Therefore, a cold gas test, which sets the turbine inlet temperature as similar to the compressor temperature, has been used to investigate the distortion of the compressor efficiency due to heat exchange with the goal of correcting the efficiency [11,12].
In another study, a compressor efficiency correction method was proposed through an experiment on the change in turbine inlet temperature [13].
On the other hand, various methods for expanding the turbine operating range have been provided [9,10], and a closed loop test method has been proposed to avoid the surge and choking areas on the compressor side to expand the turbine expansion ratio range [5].
Turbine efficiency can also be expressed as a function of the turbine blade speed ratio, which is calculated from the turbine rotation speed, expansion ratio, and inlet temperature. In addition, a method for expanding the blade speed ratio range by changing the turbine inlet temperature or introducing a pulsating flow has been proposed [14].
As such, many studies using various turbine operating conditions (temperature and pressure, etc.) have been carried out to evaluate the turbocharger efficiency accurately and expand the turbine performance evaluation range.
There have also been studies on the effect of turbine operating conditions on turbine flow rate characteristics.
In general, the turbine mass flow rate performance obtained through performance tests is presented as the reduced turbine mass flow rate performance corrected to the inlet pressure and temperature, considering the aerodynamic turbine characteristics. In many cases, engine simulation programs assume that the reduced turbine mass flow rate is not affected by the turbine inlet temperature.
However, some studies have produced experimental results reflecting the effect of turbine inlet temperature changes on the reduced turbine mass flow rate [15].
In the turbine inlet temperature variation experiments (530 K and 850 K), the reduced turbine mass flow rate increased at the same expansion ratio as the turbine inlet temperature increased [15]. On the other hand, a VGT (Variable-geometry turbocharger) turbine inlet temperature experiment was carried out in a wider temperature range (305 K to 973 K), and the results of the turbine inlet temperature change were found to affect the evaluation result of the reduced mass flow rate of the turbine [16]. Both studies explain that the changes in the centrifugal force of the gas flow in the turbine housings were the main cause of the performance change.
These studies further explain that the changes in the reduced turbine mass flow rate due to temperature were on the aerodynamic side of the turbine, independent of compressor conditions.
However, actual turbine operation is related to compressor operating conditions. Therefore, to understand the reduced turbine mass flow rate performance characteristics under various turbine operating conditions, a study that considers both the compressor and turbine operating characteristics is required.
In this study, the turbine power state is related to the compressor power state, and the effects of the turbine inlet temperature and the turbine backpressure on the reduced turbine mass flow rate performance are explained. In addition, the principle of the explanation was used to correct the performance results of the reduced turbine mass flow rate test under different turbine operating conditions.
It is hoped that the results of this study will contribute to various turbine-related studies, such as studies on improving the compatibility of experimental results between gas benches, increasing the accuracy of engine models, and expanding the application of low-temperature experiments.

2. Test Method and Test Bench

2.1. Definitions of Turbine Performance Based on a Gas Bench Test

Many cases of the turbine performance provided by the turbocharger manufacturer are shown in Figure 1. As shown in Figure 1, the turbine performance characteristics are presented as the reduced turbine mass flow rate ( m ˙ r e d ) and effective turbine efficiency ( η T ) for a constant reduced turbine speed ( N redT ) and expansion ratio ( Π T ) .
Π T = P 3 t P 4 s ,
m ˙ r e d = m ˙ T T 3 t P 3 t ,
N r e d T = N T 3 t ,
The reduced turbine mass flow rate defined by Equation (2) signifies the corrected flow rate that can be converted to a Mach number. This definition is derived from the ratio of local flow velocity and sound velocity, as shown in Equation (4), and is based on the aerodynamic characteristics of the turbine.
M = V f V s = m ˙ R T P k R T · 1 A m ˙ T P .
On the other hand, the power balance between the compressor and the turbine power can be presented using the effective turbine efficiency and isentropic turbine power, as shown in Equation (6), using Equation (5).
η T = η m η T , i s ,
p C = η m p T = η m η T , i s p T , i s = η T p T , i s .
In this case, isentropic turbine power ( p T , is ) is defined as Equation (7), where the turbine flow rate is combined with the specific isentropic turbine work ( β ) of Equation (8).
p T , i s = m ˙ T β ,
β = c p 3 × T 3 × ( 1 ( 1 Π T ) k 1 k ) .
As shown in Figure 1, the performance characteristics of the turbine show a drastic change in low expansion ratio conditions (expansion ratio 2 or less in Figure 1) and correspond to actual engine operating conditions. Thus, this study includes testing and considerations under conditions that are not feasible with a typical gas bench.

2.2. Test Methods and Conditions

There were two types of turbochargers used in this experiment. The main specifications of the test turbochargers are shown in Table 1, and the purpose of each experiment and the experimental conditions are described in Table 2 and Table 3.
Experiments using WGT, as shown in Table 2, were performed to validate that the reduced turbine mass flow rate correction principle could correct the effects of turbine inlet temperature and turbine outlet backpressure variations. Experiments were performed on two gas benches (commercial and lab-made). The operating conditions of the turbocharger according to the turbine inlet temperature changes were set according to the characteristics and operating limitations of each gas bench. In addition, because the backpressure after the turbine has a very different characteristic depending on the gas bench, a turbine performance review according to the backpressure change was conducted by comparing the test results at each test bench.
Figure 2 shows the compressor operating conditions during the gas bench test of the WGT. The setting of the compressor operating point was carried out mainly with consideration of the compressor rotation speed conditions and the gas bench operating limits rather than the reduced turbine speed conditions. The turbocharger maker’s tests were carried out at relatively high temperatures, and the experiments performed with the lab-made bench were conducted at low temperatures, which were not possible on a commercial turbocharger maker’s bench.
To simplify the correction equation constructed in this study, the relationship between compressor power and isentropic turbine power needed to be determined. Therefore, to examine the relationship between the two performances under various operating conditions simulating actual vehicle operation, this study performed the gas bench test of the VGT as well as the vehicle test.
In particular, the VGT has the advantage of measuring the turbine flow rate relatively accurately because there is no bypass flow of the turbine during actual engine operation, unlike WGT.
Table 3 presents the VGT test conditions. In the gas bench, vane (PWM) duty (25%, 75%) change tests were performed. During the vehicle test, the chassis dynamometer was controlled with constant speed control, and the engine and VGT operating conditions (vane duty, turbine inlet temperature, and backpressure) were changed by shifting the vehicle’s gears and making accelerator pedal adjustments. Sensor signals (temperature, pressure, and compressor speed) were additionally acquired along with OBD data during vehicle testing.
Figure 3 shows the VGT and engine operating conditions during the gas bench and vehicle experiments.

2.3. Characteristics of Gas Test Benches

The gas benches used in the experiment were divided into commercial and lab-made gas benches, all of which had a two-loop-type gas circulation structure [6].
However, due to the different test bench specifications between the two types, different turbine inlet temperature ranges, maximum rotational speeds, and turbine backpressure characteristics could be implemented.
The lab-made gas bench had a small capacity, but at low compressor speeds (a max. Speed of approximately 100,000 rpm for a 2-liter gasoline engine turbocharger) and low expansion ratios, it could set a relatively wide temperature range (313.15−873.15 K) using a burner and an electric heater. In this study, the experiment at the turbine inlet temperature of 313.15 K used an electric heater instead of a burner.
Figure 4 shows a photograph and schematic diagram of the lab-made gas bench.
To compare the turbine backpressure characteristics between the two gas benches, the turbine backpressure is represented by Equation (10) using Equation (9) derived from Bernoulli’s equation and the assumption that it is released under atmospheric conditions. The results are shown in Figure 5.
Δ P = 1 2 ρ v 2 × μ l d = m ˙ 2 ρ × 1 2 4 π d 2 μ l d ,
Δ P P 4 P a t m c d × m ˙ 2 ρ .
Using Equation (10), the backpressure characteristics between the gas benches used in the experiments can be compared. From the results of Figure 5, it was confirmed that the lab-made gas bench had relatively high backpressure characteristics.
Depending on the backpressure characteristics of each of these gas benches, the two gas benches with different turbine inlet pressure conditions had the same turbine expansion ratio. In the case of the commercial bench, the expansion ratio and the turbine inlet pressure showed a linear relationship due to the low backpressure characteristics, whereas in the lab-made bench, the turbine inlet pressure increased nonlinearly with the expansion ratio (Figure 6).

3. Power Balance-Based Reduced Turbine Mass Flow Rate Correction Method

3.1. Basic Correction Equation and Assumption

In this study, the power relation between the compressor and the turbine was used to obtain the correction equation of the reduced turbine mass flow rate according to the turbine operating conditions (turbine inlet temperature and turbine backpressure).
The first assumption is that there are two turbine operating conditions with the same compressor power performance.
At this time, the power balance can be summarized as Equation (11) based on Equation (6).
p C = [ η T p T , i s ] s t 1 = [ η T p T , i s ] s t 2 .
In this case, by substituting Equation (2), Equation (7), and Equation (8) into Equation (11), the relationship between the compressor power and reduced turbine mass flow rate under two operating conditions is defined by Equation (12).
p C = [ m ˙ r e d η T P 3 t β T 3 t ] s t 1 =   [ m ˙ r e d η T P 3 t β T 3 t ] s t 2 .
Therefore, the reduced turbine mass flow rate in the two cases where the compressor power is the same but the operating conditions of the turbine is different are finally summarized in Equation (13) using the correction factor K (Equation (14)).
[ m ˙ r e d ] s t 1 = K [ m ˙ r e d ] s t 2 ,
K = [ m ˙ r e d ] s t 1 [ m ˙ r e d ] s t 2 = [ η T ] s t 2 [ η T ] s t 1 [ P 3 t ] s t 2 [ P 3 t ] s t 1 [ β ] s t 2 [ β ] s t 1 [ T 3 t ] s t 1 [ T 3 t ] s t 2 = [ η T ] s t 2 [ η T ] s t 1 [ P 4 s ] s t 2 [ P 4 s ] s t 1 [ Π T ] s t 2 [ Π T ] s t 1 [ β ] s t 2 [ β ] s t 1 [ T 3 t ] s t 1 [ T 3 t ] s t 2 .
Equation (14) shows that K is affected by the turbine backpressure and turbine inlet temperature, as well as the turbine efficiency, turbine expansion ratio, and specific isentropic turbine work.

3.2. Simplification of the Correction Equation

To correct the reduced turbine mass flow rate to the reference conditions using Equation (14), each operating condition and effective turbine efficiency must be known. The pressure and temperature parameters in Equation (14) can be preset because they are either target values or dependent on test bench characteristics, but effective turbine efficiency generally requires conditional testing. This implies that all experiments must be performed according to the turbine operating conditions, thus making it the biggest constraint that limits the effectiveness and construction purpose of the basic correction equation.
Therefore, after analyzing the experimental results, the method for setting the efficiency term in Equation (14) was reviewed, and the reliability verification of the correction result was performed using the simplified correction equation.
The WGT tests in this study included very low turbine inlet temperature conditions (313.15 K) and high-temperature (573.15–873.15 K) experiments. Therefore, additional compressor power correction was performed because the measured compressor power at high turbine inlet temperature conditions presented relatively large distortions due to heat transfer from the turbine [11,13,17].
In the case of WGT, various turbine inlet temperature condition gas bench tests were performed, and the construction of the heat transfer equation using the temperature change test results was possible. The relevant method is briefly presented below [11,13].
Assuming that no coolant is supplied during the experiment and only heat transfer by conduction exists, the heat transfer rate to compressor ( Q ˙ c ) can be expressed as Equation (15).
Coefficients α and γ are values related to heat conduction that can be determined as minimizing differences when the compressor efficiency was corrected using turbine inlet variation tests. The representative temperature of the compressor T c o m p is the algebraic average of the inlet and outlet temperature of air [11,13]:
Q ˙ c = α ( T i n , o i l T C ) + γ ( T 3 T C ) ,
T C = ( T 1 T 2 ) / 2 .
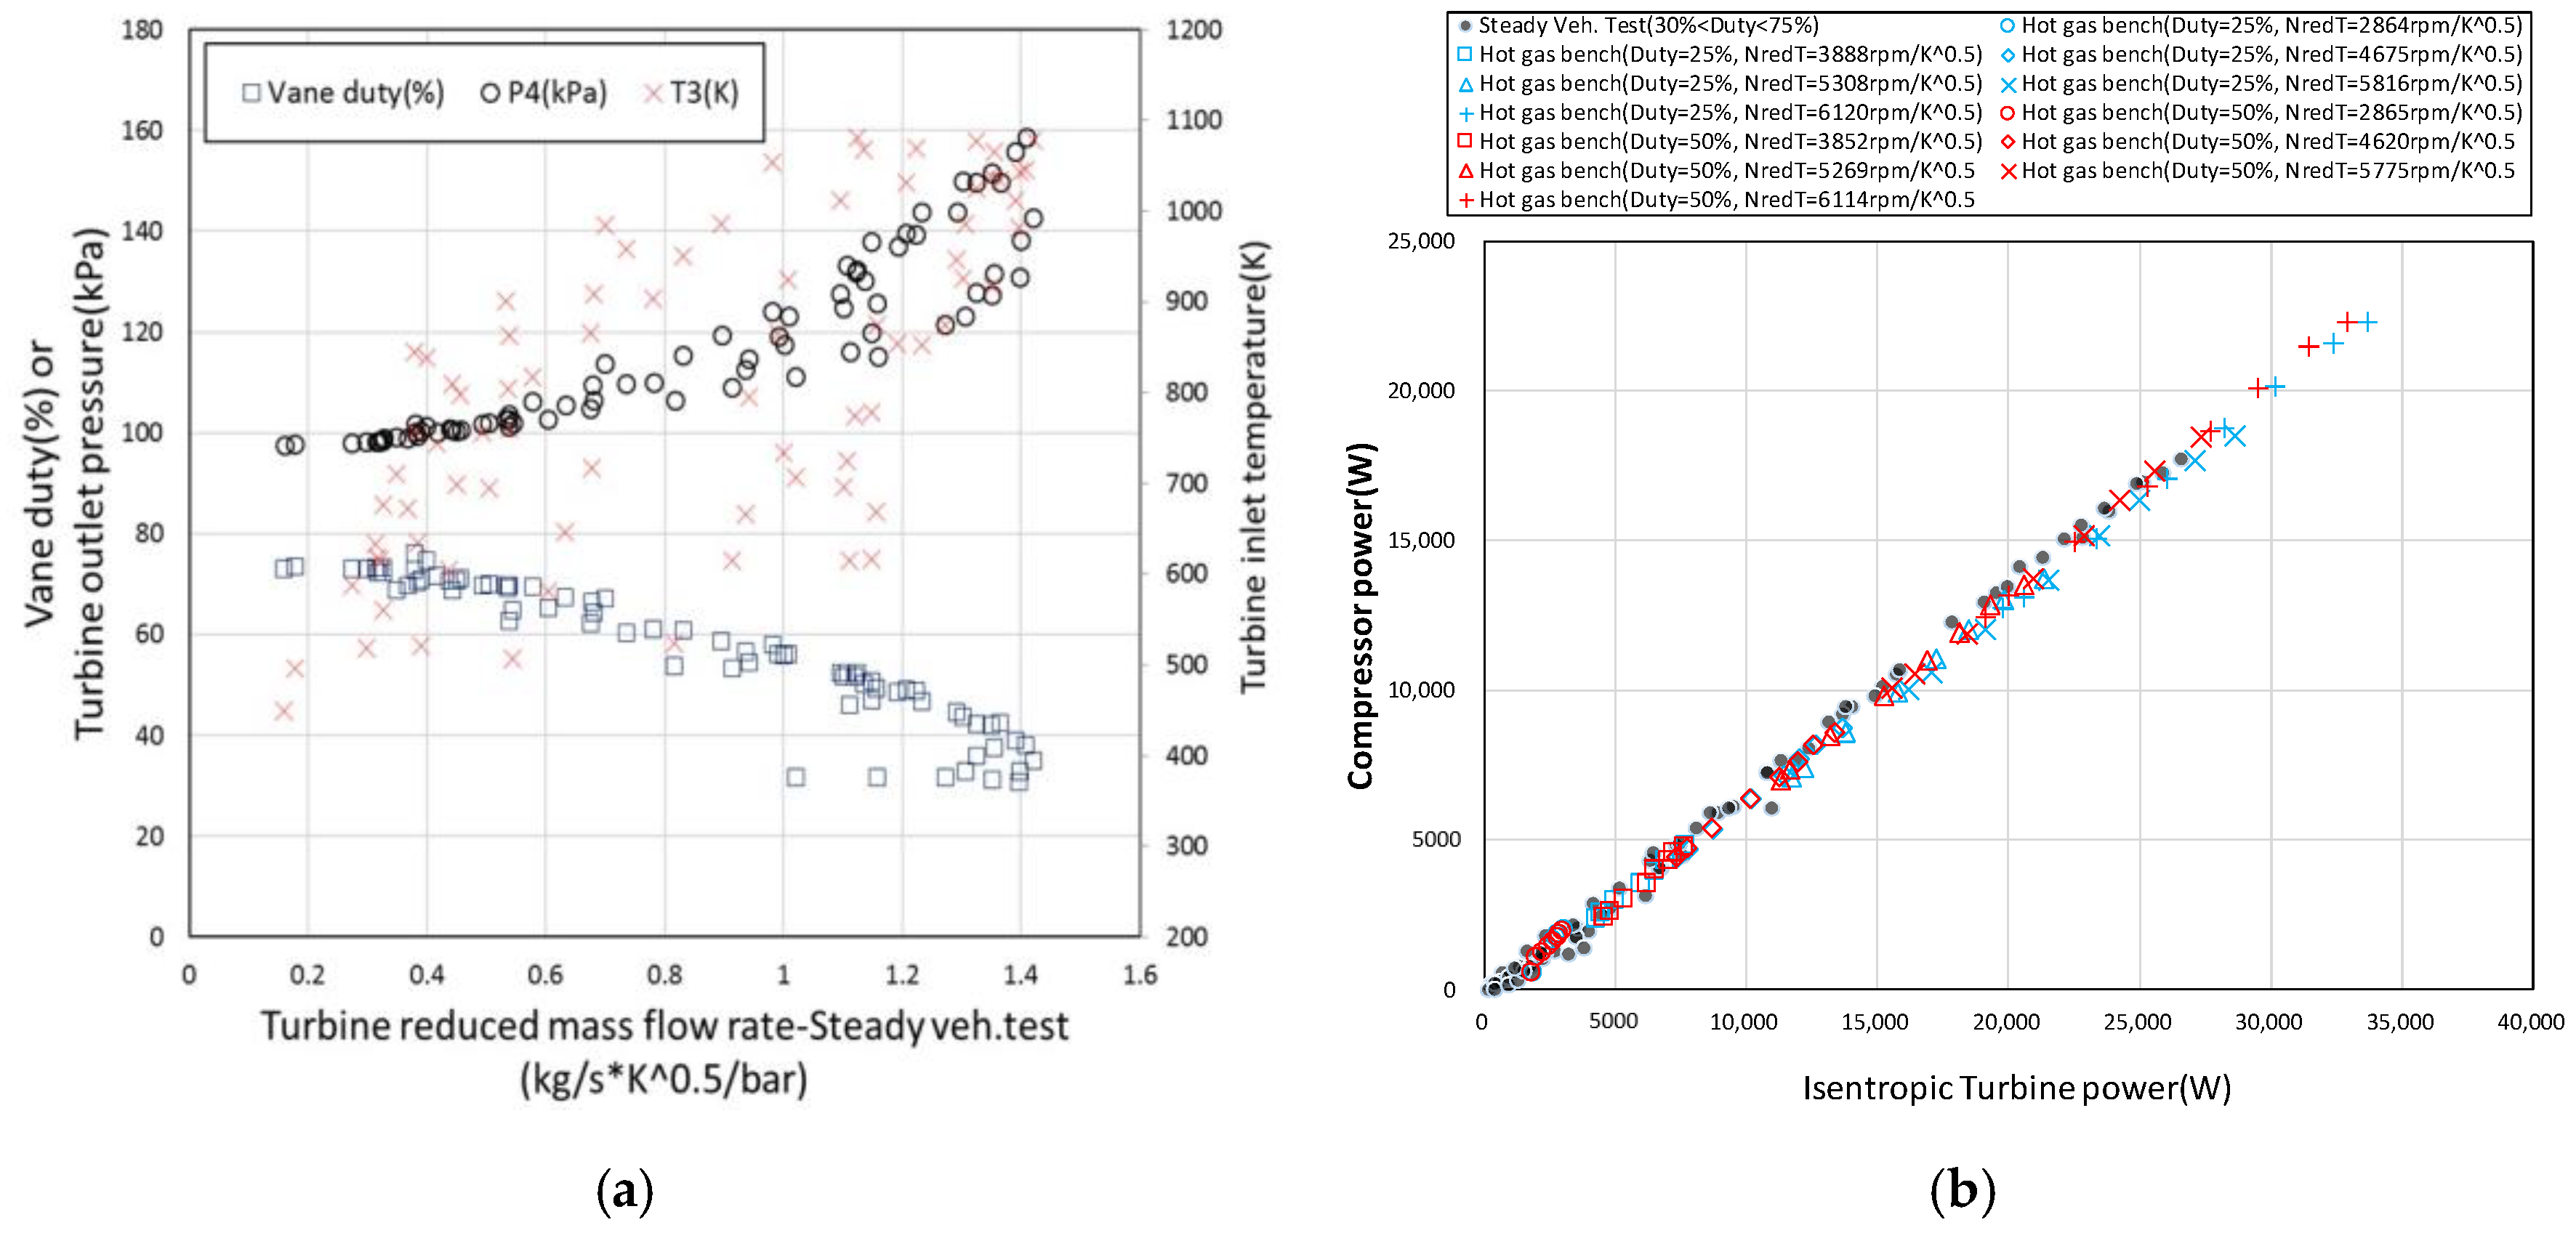
Figure 7a shows the effective turbine efficiency obtained from the gas bench test of WGT for the expansion ratio, which is a general expression method. As shown in the results, under the conditions of an expansion ratio of 1.6 or higher is confirmed, and similar and constant efficiency characteristics are presented despite the turbine inlet temperature and rotation speed changes. However, at lower expansion ratio conditions, there is a large difference in efficiency among the different turbocharger operating conditions.
On the other hand, Figure 8a,b show effective turbine efficiency for compressor power and isentropic turbine power. The compressor power and isentropic turbine power in the low expansion ratio regions where rapid changes in effective turbine efficiency occur are relatively low (see Figure 7b), thus reducing the dispersion of efficiency. In addition, this representation offers the characteristic in which the same compressor rotational speed region exists in a similar compressor power or isentropic turbine power region, thereby reducing interference due to friction loss according to the rotational speed when comparing the efficiency characteristics.
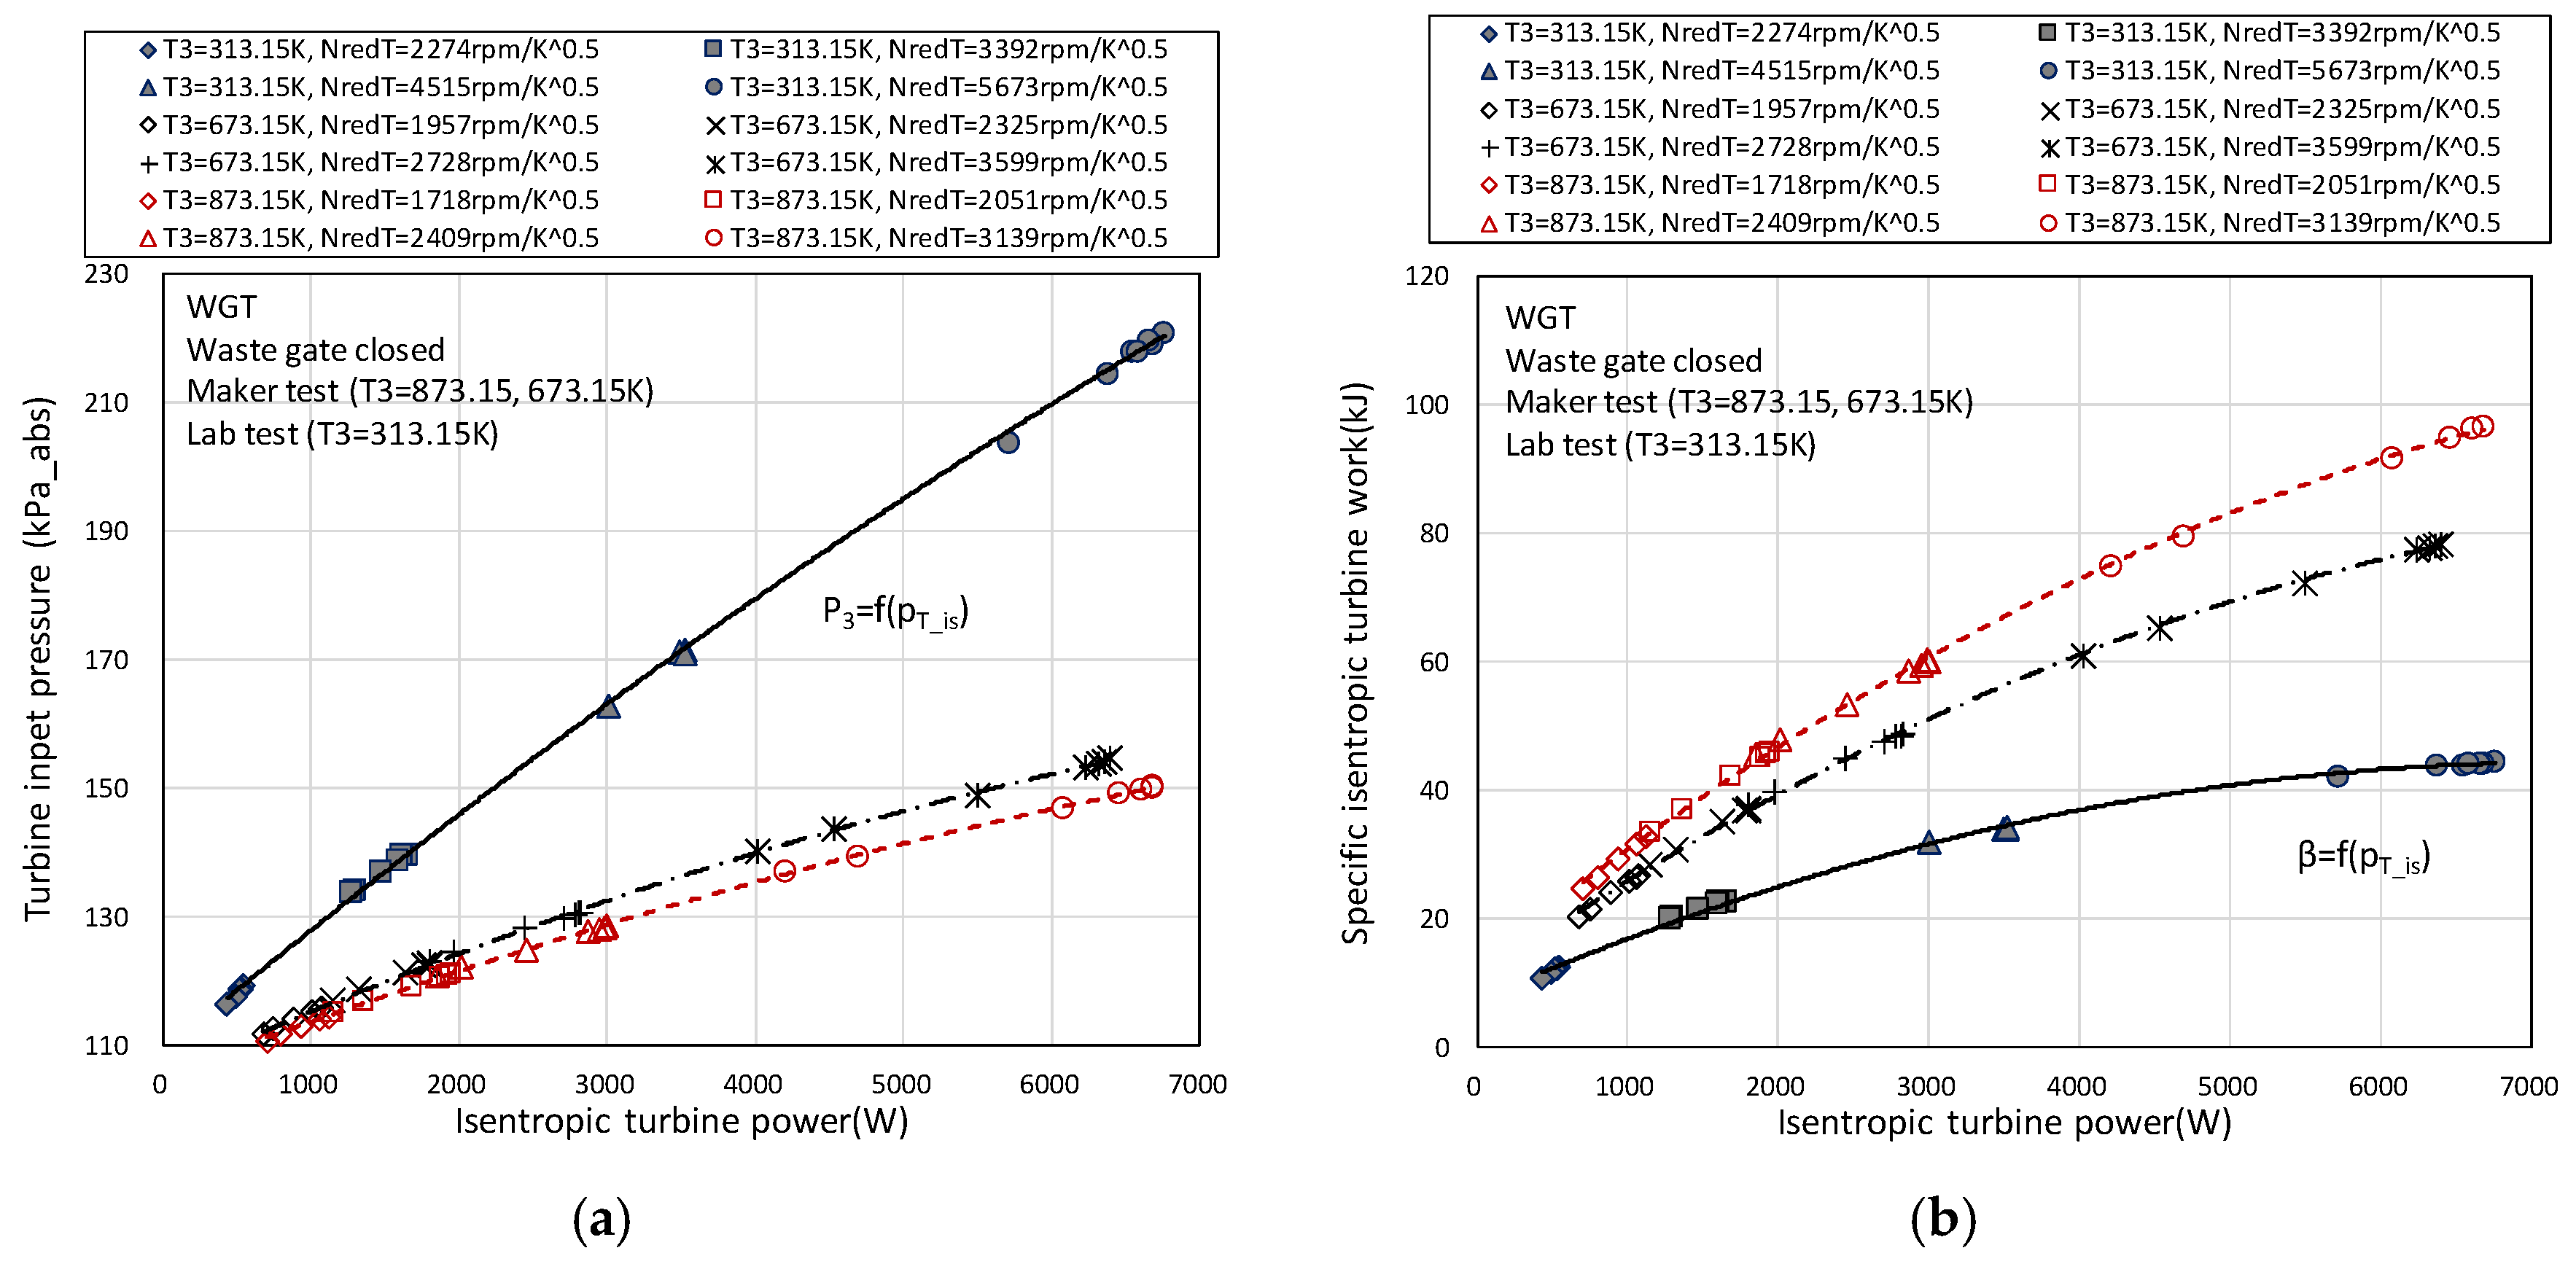
Figure 9 shows the relationship between the compressor power and isentropic turbine power results of the experiment on the commercial gas bench of WGT (turbine inlet temperature 573.15–873.15 K) and the lab-made gas bench (turbine inlet temperature 313.15 K).
Because effective turbine efficiency is the ratio of compressor power to isentropic turbine power, this type of relationship review makes it more suitable for characterizing the effective turbine efficiency at various operating conditions.
The results show that the compressor power for isentropic turbine power shows similar characteristics, despite the temperature changes and the results of experiments on different benches.
In addition, because this linear relationship has similar characteristics in all rotational speed conditions, the influence of rotational speed on reduced turbine mass flow rate correction is considered negligible.
On the other hand, Figure 10 shows the results of the VGT experiment to examine the relationship between compressor power and isentropic turbine power under more random conditions. In vehicle testing, the engine operation was adjusted over a wide range, so the operating temperature, pressure, and vane (PWM) duty ranges of the VGT were very wide and, at the same time, each operating condition could be formed in various combinations.
Figure 10a shows the operating conditions of the turbine during the vehicle test. In the vehicle test, the VGT operated under conditions in which the VGT vane PWM duty was approximately 30% 75%, the turbine inlet temperature was approximately 473.15 to 1073.15 K, and the turbine backpressure was approximately 100 to 160 kPa.
However, the relationship between isentropic turbine power and compressor power obtained from gas bench experiments with a turbine inlet temperature of 873.15 K and vane duties of 25% and 50% shown in Figure 10b existed in a single line with the vehicle test results.
From the above review, assuming that the isentropic turbine power for compressor power being the same in two cases where the turbine operating conditions are different may cause some errors to occur, the efficiency term in Equation (14) can be eliminated.
The assumption that the isentropic turbine work for compressor power in both states is the same means that the turbine efficiency at the same (ratio of effective turbine efficiency ≈1 in Equation (14)) compressor output is the same, even if the turbine operating conditions are different.
Accordingly, based on the assumptions made in this study, the efficiency term in Equation (14) can be eliminated and summarized in Equation (17).
K = [ m ˙ r e d ] s t 1 [ m ˙ r e d ] s t 2     [ P 3 t ] s t 2 [ P 3 t ] s t 1 [ β ] s t 2 [ β ] s t 1 [ T 3 t ] s t 1 [ T 3 t ] s t 2   [ P 4 s ] s t 2 [ P 4 s ] s t 1 [ Π T ] s t 2 [ Π T ] s t 1 [ β ] s t 2 [ β ] s t 1 [ T 3 t ] s t 1 [ T 3 t ] s t 2 .

3.3. Verification of Correction Results

The experimental results and Equation (17) were used to correct the reduced turbine mass flow rate, and the calculation process is shown in Figure 11. The basic assumption of Equation (14) is that the two turbine operating conditions are set to have the same compressor power, but in this case, the regression model of all parameters (turbine inlet pressure, specific isentropic turbine work, etc.) should be constructed using the compressor power. However, the regression model was constructed using isentropic turbine power based on the assumptions made in Equation (17) (the ratio of effective turbine efficiency is close to 1) to restrict the use of compressor operation information.
Figure 12 shows an example of the parameters required for the calculation process in Figure 11. All parameters are presented according to isentropic turbine power and consist of a multi-dimensional regression model for isentropic turbine power.
Using these regression models, the reduced turbine mass flow rate correction factor K (Equation (17) and correction results at the same isentropic turbine power can be obtained.
Corrected reduced turbine mass flow rates after these calculations should be based on expansion ratios under standard conditions. Thus, this correction process involved both the expansion ratio and the reduced turbine mass flow rate. The correction of the expansion ratio with the turbine inlet temperature is discussed in more detail in Chapter 4.2.
Based on these findings, it is possible to correct the reduced turbine mass flow rate under various turbine operating conditions. It is also possible to examine the reliability of the correction method by examining the calculation results. The correction of the reduced turbine speed was carried out by changing only the turbine inlet temperature ( T 3 ) to the standard condition (commercial gas bench, T 3 = 873.15 K) while maintaining the turbine rotational speed in Equation (3).
Figure 13 shows the comparison of before and after the corrections of the WGT test results using the calculation process of Figure 11.
As shown in Figure 13a, it can be seen that there was a difference between the results of reduced turbine mass flow rate measurements for the expansion ratio depending on the gas bench used and the turbine inlet temperature conditions.
However, as shown in Figure 13b, by correcting the reduced turbine mass flow rate while considering the turbine operating conditions, it can be seen that the experimental results of all conditions were corrected to the same value as the standard condition (commercial gas bench, T3 = 873.15 K).
These results indicate that the reduced turbine speed and reduced turbine mass flow rate were properly corrected.

4. Influence of Turbine Operating Conditions on Characteristics of Reduced Turbine Mass Flow Rate

4.1. Turbine Operating Conditions and Reduced Turbine Mass Flow Rate Correction Factor K

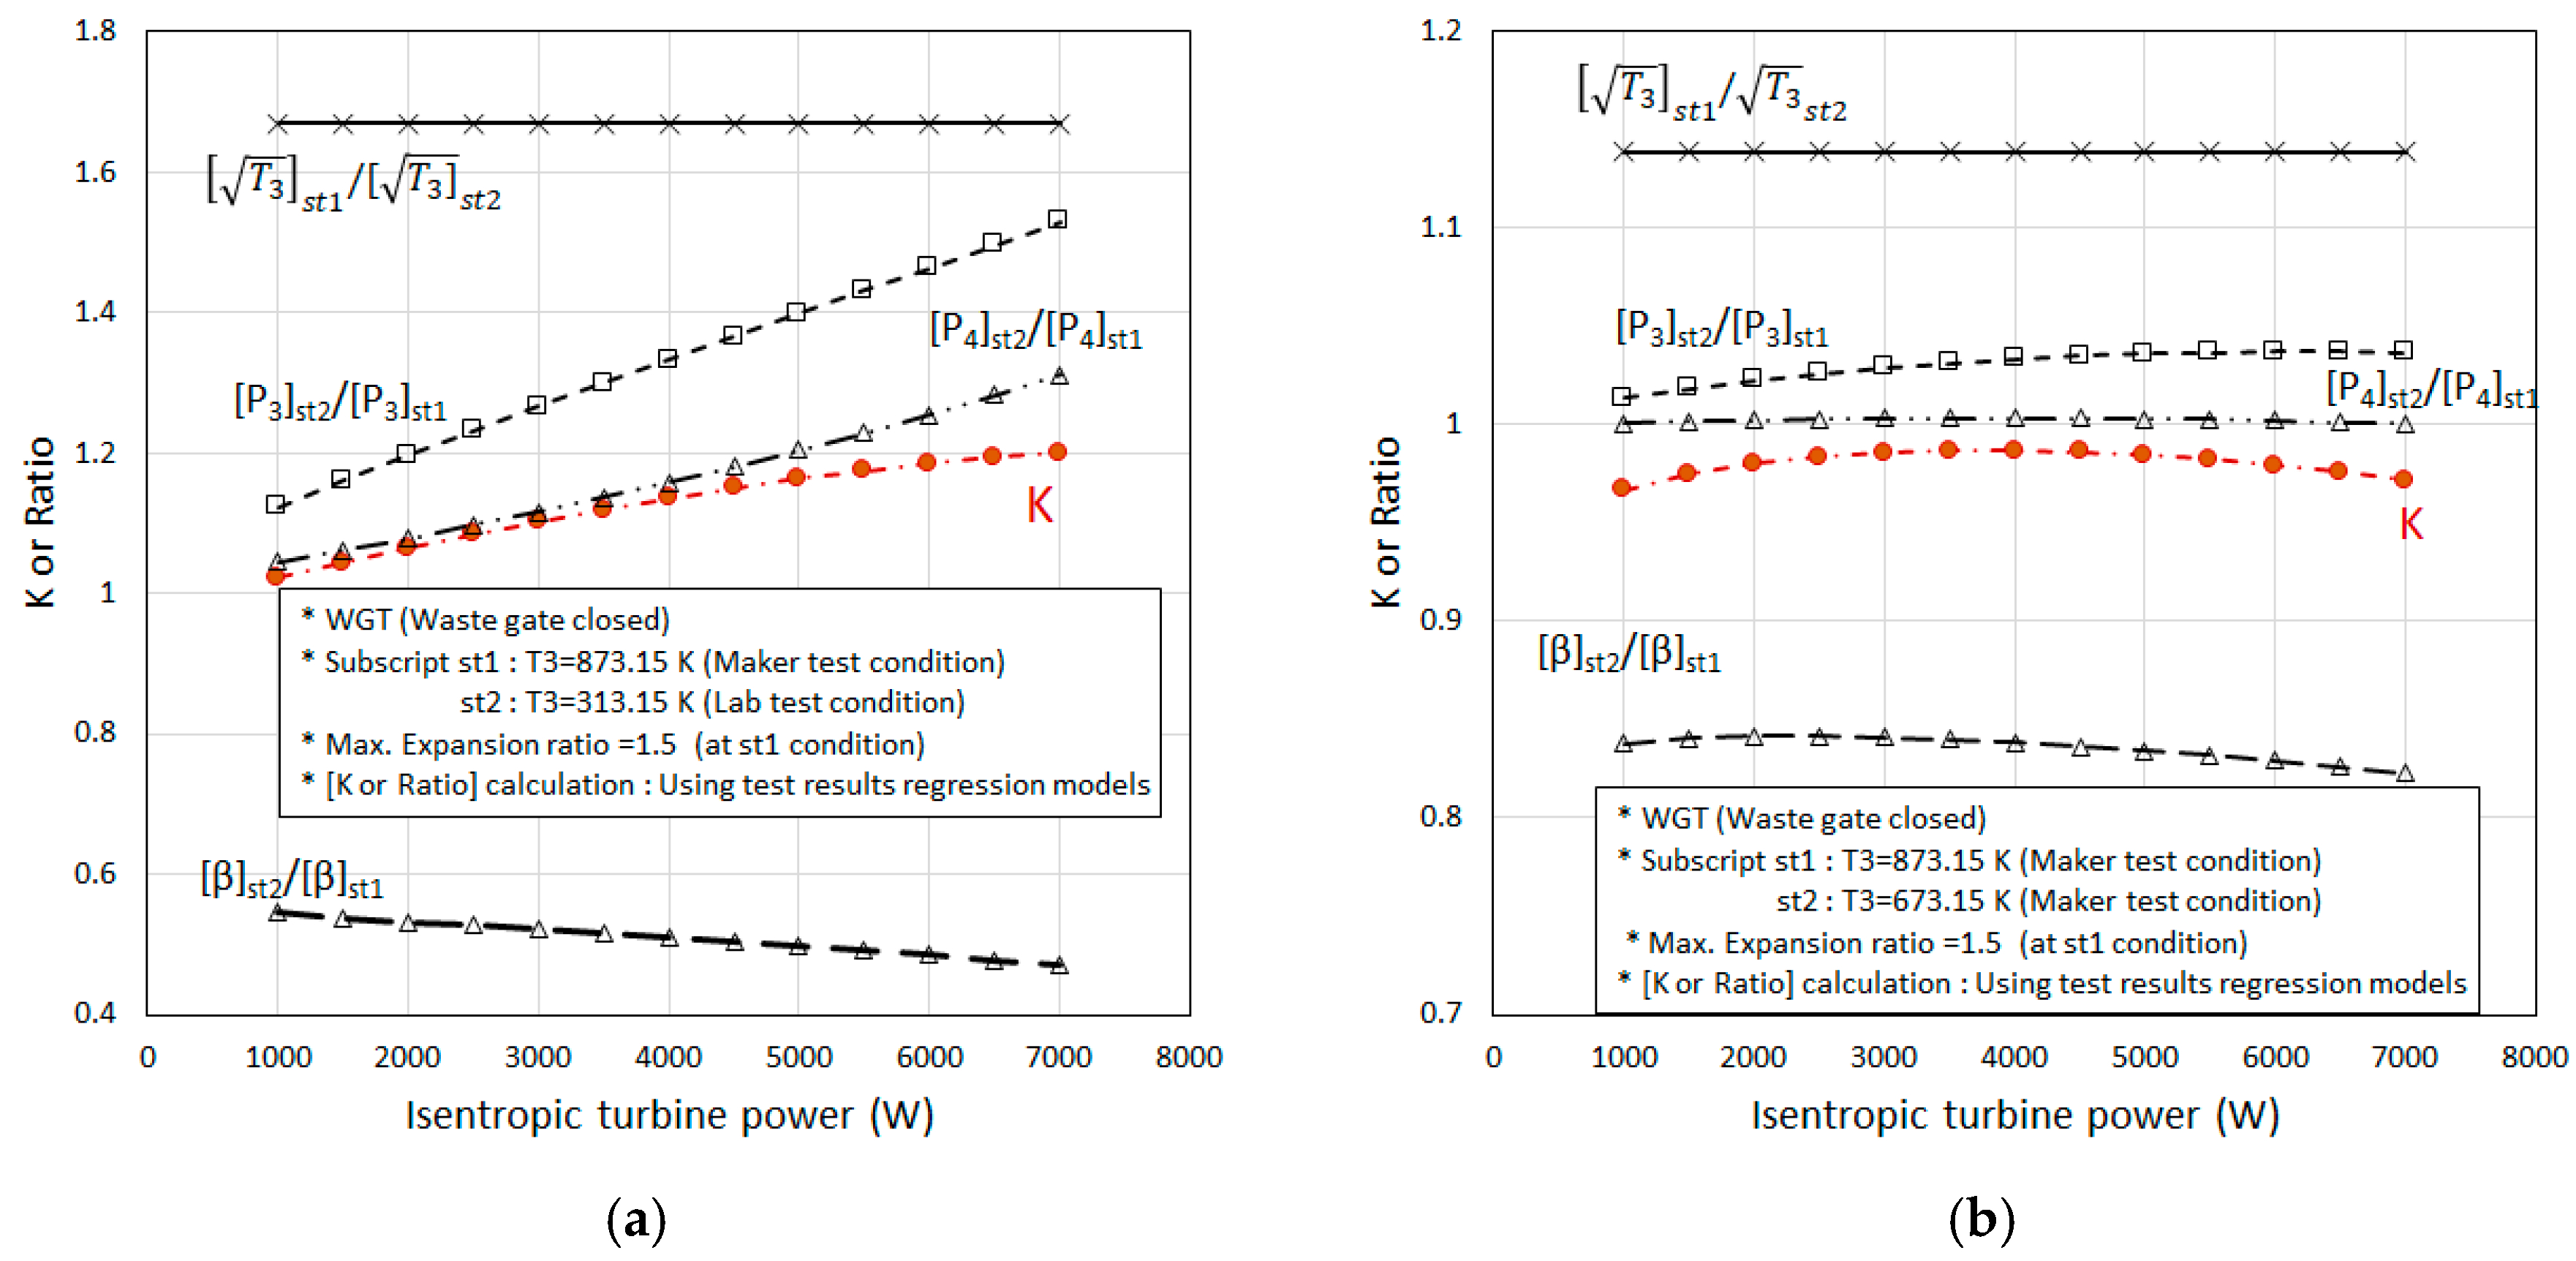
If one can assume the value of the correction factor K between the two turbine operating conditions, then the correction calculation for Equation (17) can be greatly simplified. Therefore, it is necessary to investigate the influence of the turbine operating environment on K.
Figure 14 shows the correction factor K and parameter ratio (from Equation (17)) when the used gas bench and the turbine inlet temperature differed. Due to the difference in the backpressure characteristics of the two gas benches (Figure 14a, the turbine inlet pressure ratio and turbine outlet pressure ratio of the commercial and lab-made benches at the same isentropic turbine power increased as the isentropic turbine power increases. However, in Figure 14b, which shows the results of a commercial gas bench test with relatively low backpressure, the change in the pressure ratio and correction factor K was relatively small despite the increase in isentropic turbine power.
Therefore, it can be seen that changes in the K value according to the isentropic turbine power depended on the variation of the turbine inlet or outlet pressure due to the turbine backpressure characteristics of each gas bench rather than the change in the turbine inlet temperature.
Based on the WGT’s experimental results, the ratio of the correction factor K to the turbine inlet pressure ( K / ( [ P 3 ] s t 2 / [ P 3 ] s t 1 ) ) and the ratio of the correction factor K to the turbine outlet pressure ( K / ( [ P 4 ] s t 2 / [ P 4 ] s t 1 )   ) for isentropic turbine power are presented in Figure 15. In Figure 15b, the correction factor K divided by the turbine outlet pressure ratio shows a trend relatively close to 1 regardless of the isentropic turbine power. In particular, in the case of a turbine inlet temperature of 313.5 K, the difference of the ratio of the correction factor K to the turbine inlet pressure is increased in Figure 15a, but in the case of Figure 15b, the change in the correction factor K to the turbine outlet pressure ratio is relatively small.

4.2. Influence of Turbine Inlet Temperature on Expansion Ratio Correction

The correction process presented in Figure 11 involves the correction of the expansion ratio as well as the reduced turbine mass flow rate with the correction factor K.
If the relationship between the expansion ratios for two turbine operating conditions is known, Equation (17) can be used to predict and correct the reduced mass flow rate in different turbine operating conditions without further experimentation.
In constructing the expansion ratio correction equation according to the turbine outlet temperature variation, for calculation simplicity, the ratio of K and the turbine inlet pressure ratio is assumed to be 1 (considering the results of Figure 15b), as shown in Equation (18).
If Equation (18) is substituted into Equation (17), the relationship between the expansion ratio and the turbine inlet temperature is simply summarized as Equation (19). In addition, the specific turbine isentropic work ( β ) of Equation (19) can be calculated as a function of only the expansion ratio and temperature using Equation (8).
K [ P 4 s ] s t 2 / [ P 4 s ] s t 1 1 ,
[ T 3 t ] s t 2 [ T 3 t ] s t 1 = [ Π T ] s t 2 [ Π T ] s t 1 [ β ] s t 2 [ β ] s t 1 .
Thus, once two turbine inlet temperature conditions are established, the relationship between the two expansion ratios can be established.
When using Equation (19) to correct the turbine flow performance results measured in any turbine inlet temperature conditions to standard experimental conditions (turbine inlet temperature 873.15 K), the equation for the expansion ratio is given by Equation (20).
Experimental data are not required to derive Equation (20), and the physical properties of air are used. In Equation (20), coefficients a and b are expressed as a function of temperature, and the results of the expansion ratio correction and coefficients a and b are shown in Figure 16.
[ Π T ] t 3 = 873 K = a × [ Π T ] t 3 = t e s t + b .
However, when the performance measured at the turbine inlet temperature 873.15 K (standard condition) is corrected to any target turbine inlet temperature condition, the expansion ratio correction equation is as shown in Equation (21). The coefficients c and d are then expressed as a function of the target turbine inlet temperature.
[ Π T ] t 3 = T a r g e t = c × [ Π T ] t 3 = 873 K + d .
Figure 17 shows the corrected expansion ratio and coefficients c and d with temperature changes.
Figure 18. shows the result of correcting the turbine expansion ratio during the turbine inlet temperature variation test using Equation (20) to the expansion ratio based on a turbine inlet temperature of 873.15 K.
The expansion ratio in Figure 18a is the calculation result using the fitting model from each experiment. Figure 18b shows the result of applying the correction equation for recalculation, assuming a turbine inlet temperature of 873.15 K.
Despite the assumption of Equation (18), the expansion ratios of all the experiments are relatively well corrected.
In conclusion, when the turbine inlet temperature is lowered, the expansion ratio is shown to be relatively high, but it is confirmed that the expansion ratio can be easily corrected using Equations (20) and (21).

5. Conclusions

In this study, theoretical and experimental studies based on the estimation of the reduced turbine mass flow rate according to the turbine inlet temperature have been carried out using two gas benches with different turbine backpressure characteristics. The conclusions of this study are summarized below.
  • Two kinds of gas benches with different turbine backpressure characteristics and turbine inlet temperature change experiments showed the occurrence of a difference in the reduced turbine mass flow rate with an expansion ratio.
  • The causes of the deviations of the reduced turbine mass flow rate performance results were examined based on the power balance for compressor power and isentropic turbine power.
  • Through the correction of various experimental results, it is suggested that the reduced turbine mass flow rate and reduced turbine speed can be corrected for the expansion ratio at different gas bench and turbine inlet temperature conditions.
  • The relational expression of the expansion ratio according to changes in turbine inlet temperatures is also presented, and the verification results through the experimental results are presented.

Author Contributions

Conceptualization, J.C.; Data curation, J.C.and S.L.; Formal analysis, J.C., S.L., N.K., B.L. and D.K.; Funding acquisition, J.C. and G.K.; Investigation, S.L., N.K., B.L., D.K., S.C. and G.K.; Methodology, J.C.; Project administration, J.C., N.K., B.L. and D.K.; Resources, G.K.; Software, J.C., S.L., B.L. and D.K.; Supervision, J.C.; Validation, J.C., N.K. and G.K.; Visualization, J.C., S.L. and S.C.; Writing—original draft, J.C.; Writing—review & editing, S.L.and S.C.

Acknowledgments

This study was supported by the World Class 300 R&D Technology Development Project (S2340875, Development of Foundation Technology on Turbocharger for Improving Low Speed Performance and Responding to High Emission Temperature of Over 950℃ of a High Performance Gasoline Engine) funded by the Small and Medium Business Administration and the Technology Innovation Program (20002762, Development of RDE DB and Application Source Technology for Improvement of Real Road CO2 and particulate matter) funded by the Ministry of Trade, Industry & Energy (MOTIE, Korea). I would like to thank these organizations for their support.

Conflicts of Interest

The authors declare no conflict of interest.

Nomenclature

Π Expansion ratio
P Pressure
m ˙ Mass flow rate
T Temperature
N Rotational speed
M Mach number
V Velocity
R Gas constant
k Specific heats ratio
A Cross section area
η Efficiency
p Power
β Specific isentropic turbine work
c p Specific heat at constant pressure
ρ Density
v Mean velocity of flow at the cross section
μ Friction coefficient
l Pipe length
d Pipe diameter
c d Drag coefficient
K Correction factor
Q ˙ Heat transfer rate
α , γ Coefficients
a , b , c , d Coefficients
Subscript
T Turbine
s Static
t Total
3 Turbine inlet
4 Turbine outlet
r e d Reduced
f Flow
S Sound
m Mechanical
i s Isentropic
a t m Ambient
C Compressor
s t 1 State 1
s t 2 State 2
i n , o i l Oil inlet
1 Compressor inlet
2 Compressor outlet

References

  1. Al-Hasan, N.; Beer, J.; Ehrhard, J.; Lorenz, T.; Ludwig, S. Charging Technologies for CO2 Optimization by Millerization; SAE Technical Paper 2015-01-1250; SAE International: Warrendale, PA, USA, 2015. [Google Scholar]
  2. Shamsderakhshan, M.; Kharazmi, S. Turbocharger Matching and Assessments of Turbocharger Effect on a Diesel Engine Based on One-Dimensional Simulation; SAE Technical Paper 2014-01-2557; SAE International: Warrendale, PA, USA, 2014. [Google Scholar]
  3. Eriksson, L.; Muelsen, L.; Brugård, J.; Bergström, J.; Pettersson, F.; Andersson, P. Modeling of a turbocharged SI engine. Annu. Rev. Control 2002, 26, 129–137. [Google Scholar] [CrossRef] [Green Version]
  4. Cavina, N.; Borelli, A.; Calogero, L.; Cevolani, R.; Poggio, L. Turbocharger Control-Oriented Modeling: Twin-Entry Turbine Issues and Possible Solutions. SAE Int. J. Engines 2015, 8, 2120–2132. [Google Scholar] [CrossRef]
  5. Schorn, N. The Radial Turbine for Small Turbocharger Applications: Evolution and Analytical Methods for Twin-Entry Turbine Turbochargers. SAE Int. J. Engines 2014, 7, 1422–1442. [Google Scholar] [CrossRef]
  6. SAE J1826 Reaffirmed MAR95. Turbocharger Gas Stand Test Code; Society of Automotive Engineers, Inc.: Troy, MI, USA, 1995. [Google Scholar]
  7. Aghaali, H.; Angstrom, H.E. Improving Turbocharged Engine Simulation by Including Heat Transfer in the Turbocharger; SAE Technical Paper 2012-01-0703; SAE International: Warrendale, PA, USA, 2012. [Google Scholar]
  8. Scharf, J.; Uhlmann, T.; Schernus, C.; Lückmann, D.; Höpke, B.; Schorn, N. Extended Turbine Mapping and its Benefits for the Development of Turbocharged Internal Combustion Engines. In Proceedings of the 21st Aachen Colloquium Automobile and Engine Technology, Aachen, Germany, 8–10 October 2012. [Google Scholar]
  9. Serrano, J.R.; Tiseira, A.O.; García-Cuevas González, L.M.; Inhestern, L.B.; Tartoussi, H. Radial turbine performance measurement under extreme off-design Conditions. Energy 2017, 125, 72–84. [Google Scholar] [CrossRef]
  10. Salameh, G.; Chesse, P.; Chalet, D. Different Measurement Techniques for Wider Small Radial Turbine Performance Maps. Exp. Tech. 2016, 40, 1511–1525. [Google Scholar] [CrossRef]
  11. Chung, J.E.; Chung, J.W.; Kim, N.H.; Lee, S.W.; Kim, G.Y. An Investigation on the Efficiency Correction Method of the Turbocharger at Low Speed. Energies 2018, 11, 269. [Google Scholar] [CrossRef]
  12. Otobe, T.; Grigoroadis, P.; Sens, M.; Berndt, R. Method of performance measurement for low turbocharger speeds. In Proceedings of the 9th International Conference on Turbochargers and Turbocharging, Institution of Mechanical Engineers, London, UK, 19–20 May 2010; pp. 409–420. [Google Scholar]
  13. Lüddecke, B.; Filsinger, D.; Bargende, M. On wide mapping of a mixed flow turbine with regard to compressor heat flows during turbocharger testing. In Proceedings of the 10th International Conference on Turbochargers and Turbocharging, London, UK, 15–16 May 2012; pp. 185–202. [Google Scholar]
  14. Reuter, S.; Koch, A.; Kaufmann, A. Extension of performance maps of radial turbocharger turbines using pulsating hot gas flow. In Proceedings of the 9th International Conference on Turbochargers and Turbocharging-Institution of Mechanical Engineers, London, UK, 19–20 May 2010; pp. 263–280. [Google Scholar]
  15. Serrano, J.R.; Guardiola, C.; Dolz, V.; Tiseira, A.; Cervelló, C. Experimental Study of the Turbine Inlet Gas temperature Influence on Turbocharger Performance; SAE Technical Paper No.2007-01-1559; SAE International: Warrendale, PA, USA, 2007. [Google Scholar]
  16. Shaaban, S. Experimental Investigation and Extended Simulation of Turbocharger Non-Adiabatic Performance. Technische Informationsbibliothek u. Ph.D. Thesis, Universitätsbibliothek, Hanover, Germany, 2004. [Google Scholar]
  17. Savic, B.; Gao, X.; Baar, R. Turbocharger Heat Transfer Determination with a Power Based Phenomenological Approach and a CHT Validation. In Proceedings of the International Symposium on Transport Phenomena and Dynamics of Rotating Machinery, Maui, HI, USA, 16–21 December 2017. [Google Scholar]
Figure 1. Example of turbine performance map (WGT (Waste-gate turbocharger)).
Energies 12 03934 g001
Figure 2. Compressor operating conditions during WGT bench tests (maker and lab tests) bench.
Energies 12 03934 g002
Figure 3. Compressor and engine operating conditions during VGT tests (bench and Vehicle tests). (a) Compressor operating conditions, (b) Engine operating conditions (vehicle test).
Energies 12 03934 g003
Figure 4. Photograph and schematic of the lab-made turbocharger gas bench. (a) Photograph of the lab-made turbocharger gas bench, (b) Schematic of the lab-made turbocharger gas bench.
Energies 12 03934 g004
Figure 5. Comparison of turbine outlet pressure between the lab-made bench and commercial (turbocharger maker) bench.
Energies 12 03934 g005
Figure 6. Comparison of turbine inlet pressure between the lab-made bench and commercial bench according to the turbine expansion ratio.
Energies 12 03934 g006
Figure 7. Effective turbine efficiency and isentropic turbine power according to expansion ratio from WGT tests (lab and turbocharger maker tests, turbine inlet temperature variation). (a) Effective turbine efficiency according to the expansion ratio; (b) Isentropic turbine power according to the expansion ratio.
Energies 12 03934 g007
Figure 8. Expansion ratio vs. isentropic turbine power of WGT gas bench tests (gas bench and turbine inlet temperature variation). (a) Effective turbine efficiency according to compressor power; (b) Effective turbine efficiency according to isentropic turbine power.
Energies 12 03934 g008
Figure 9. Isentropic turbine power vs. compressor power of WGT gas bench tests (gas bench and turbine inlet temperature variation). (a) Single bench test results (maker test, T 3 = 873.15, 673.15, 573.15 K); (b) Two bench test results (maker test T 3 = 873.15 K, lab test T 3 = 313.15 K).
Energies 12 03934 g009
Figure 10. Isentropic turbine power vs. compressor power of VGT (gas bench and vehicle tests). (a) VGT operating conditions in vehicle test; (b) Isentropic turbine power vs. compressor power (gas bench and vehicle tests).
Energies 12 03934 g010
Figure 11. Calculation flow chart for evaluation of power balance-based reduced turbine mass flow rate correction.
Energies 12 03934 g011
Figure 12. Examples of turbine operating characteristics according to isentropic turbine power. (a) Isentropic turbine power vs. turbine inlet pressure; (b) Isentropic turbine power vs. specific isentropic turbine work; (c) Isentropic turbine power vs. specific isentropic turbine work; (d) Isentropic turbine power vs. reduced turbine mass flow rate.
Energies 12 03934 g012aEnergies 12 03934 g012b
Figure 13. Correction results of WGT test results (correction to standard condition T 3 = 873.15 K, maker test); (a) Before correction; (b) After correction.
Energies 12 03934 g013
Figure 14. Calculation results of K and parameter ratio (from Equation (17)) for different gas bench and different turbine inlet gas temperature condition tests (WGT, standard condition: commercial gas bench, T 3 = 873.15 K); (a) Correction parameters for different gas bench test results (lab and maker tests); (b) Correction parameters for same gas bench test results (maker test).
Energies 12 03934 g014
Figure 15. Isentropic turbine power vs. K / ( [ P 3 ] s t 2 / [ P 3 ] s t 1 ) and / ( [ P 4 ] s t 2 / [ P 4 ] s t 1 ) in various turbine test conditions; (a) Isentropic turbine power vs. K / ( [ P 3 ] s t 2 / [ P 3 ] s t 1 ) ; (b) Isentropic turbine power vs. K / ( [ P 4 ] s t 2 / [ P 4 ] s t 1 ) .
Energies 12 03934 g015
Figure 16. Relationship between expansion ratio of standard condition ( T 3 = 873.15 K) expansion ratio of arbitrary turbine inlet temperature condition (from Equations (19) and (20)); (a) Relationship between expansion ratio (arbitrary T_3 and corrected to T_3 = 873.15 K) (from Equation (19)); (b) Coefficients a and b in Equation (20).
Energies 12 03934 g016
Figure 17. Relationship between expansion ratio of standard condition ( T 3 = 873.15 K) expansion ratio of target turbine inlet temperature condition (from Equations (19), (21)); (a) Relationship between expansion ratio (T_3 = 873.15 K and corrected to arbitrary T_3) (from Equation (19)); (b) Coefficients c and d in Equation (21).
Energies 12 03934 g017
Figure 18. Expansion ratio correction results of WGT tests using Equation (20). (a) Before correction; (b) After correction.
Energies 12 03934 g018
Table 1. Specifications of test turbochargers.
No.TypeApplication EngineBearingWheel Diameter
Turbine (Inducer)Compressor (Exducer)
1WGTGasoline (2.0liter)Journal47 (mm)56 (mm)
2VGTDiesel (2.0liter)Journal58 (mm)52 (mm)
Table 2. Test conditions for WGT.
Test 1UnitTurbocharger Maker TestLab. Test
Test bench maker (characteristics)-Kratzer Automation (Lower turbine backpressure)Laboratory-made (Higher turbine backpressure)
Waste gate state-All closed
Max. expansion ratio (s-t)-1.313.073.611.731.64
Turbine inlet temperatureK573.15673.15873.15313.15853.15
Corrected compressor speedkrpm50, 60, 7050, 60, 70, 92, 121, 143, 16250, 60, 70, 92, 121, 143, 162, 18140, 60, 80, 10080, 100, 120
Coolant circulation-NoneNone
Table 3. Test conditions for VGT (Variable-geometry turbocharger).
Test 3UnitComponent TestVehicle Test
Test Type-Hot Gas Bench TestChassis Dynamometer
Test bench maker-Seoul Industry Engineering Co., Ltd.AVL
Max. expansion ratio (s-t)-2.412.902.29
Vane (PWM) duty%255030–75
Turbine inlet temperatureK873.15473.15–1073.15
Corrected compressor speedkrpm84, 113, 135, 154, 169, 18019–174
Coolant circulation-NoneNone

