Article

The Effect of Hydration on Pores of Shale Oil Reservoirs in the Third Submember of the Triassic Chang 7 Member in Southern Ordos Basin

1
School of Petroleum and Natural Gas Engineering, Southwest Petroleum University, Chengdu 610500, China
2
National Key Laboratory of “Oil and Gas Reservoir Geology and Development Engineering”, Southwest Petroleum University, Chengdu 610500, China
3
Department of Civil, Geological and Mining Engineering, École Polytechnique de Montréal, Montreal, QC H3T 1J4, Canada
4
China Petrochemical Co. Ltd. North China Oil and Gas Branch, Zhengzhou 450000, China
5
Pertro China Southwest Oil and Gas Field Company, Exploration Utility department, Chengdu 610500, Sichuan Province, China
*
Authors to whom correspondence should be addressed.
Energies 2019, 12(20), 3932; https://doi.org/10.3390/en12203932
Submission received: 19 August 2019 / Revised: 24 September 2019 / Accepted: 9 October 2019 / Published: 16 October 2019

Abstract

:
Shale oil is an unconventional kind of oil and gas resource with great potential. China has huge reserves of shale oil, and shale oil resources are abundant in the third submember of the Triassic Chang 7 member in the southern Ordos Basin. At present, this area is in the initial stage of shale oil exploration and development. The reservoir pore is one of the key factors affecting oil accumulation, drilling safety, and oil production. It is also an important reservoir parameter that must be defined in the exploration stage. In general, the clay content in the shale section is high, and is prone to hydration. In order to study the effect of fluid on the pore type, structure, and distribution of shale oil reservoirs, experiments using X-ray diffraction, a porosity–permeability test, mercury porosimetry, rock casting thin section, and scanning electron microscopy were carried out. The experimental results show that the content of clay and quartz is very high in the studied formation. The pore porosity and permeability of the rock is highly heterogeneous because of the obvious stratigraphic bedding and interbeds. Microstructural observation of rocks shows that the main pore types are intergranular pores, intragranular pores, intercrystalline pores, and organic pores. Crack types are dissolution cracks, contraction cracks of organic matter, and abnormal pressure structural cracks. After hydration, the porosity of rock will increase in varying degrees, and pore size, pore content in different sizes, and pore structure will also change. The results show that the pores of tuff mainly changes at the initial stage of hydration, and the pore change of tuff is the most obvious within 6 hours of soaking in clear water. The influence of hydration on the pore of shale is greater than that of tuff, but the main change stage is later than tuff, and the pore change of shale is the most obvious within 12 to 24 hours of soaking in clear water. The soaking experiment of water-based drilling fluid (WBM-SL) shows that it can plug a certain size of holes and cracks and form a protective layer on the rock surface, thus effectively reducing hydration. In actual construction, multisized solid particles should be allocated in drilling fluid according to the formation pore’s characteristics, and the stability of the protective layer should be guaranteed. This can reduce the accident of well leakage and collapse and is conducive to the efficient and safe development of shale oil.

1. Introduction

Shale oil is a kind of unconventional oil and gas resource with great potential. Its large potential reserves and wide distribution have attracted increasing attention. China is rich in shale oil resources and has the third largest recoverable shale oil resources in the world. At present, a few shale oil reservoirs have successfully produced shale oil, but there are still some problems that lead to the inability of large-scale and effective development of shale oil in China [1,2]. The goal of shale oil exploration is to locate the reservoir “sweet spot” and achieve high production in the initial stage and stable production in subsequent stages.
Shale oil in China is mostly located in continental basins with complex geological environments. The sedimentation of continental basins is controlled by many factors, resulting in a complex structure and model of shale oil reservoirs and strong formation heterogeneity. Shale formation has the characteristics of low porosity and permeability, so horizontal well drilling and fracturing are generally needed to achieve effective yield [3,4,5,6]. Shale oil reservoirs have no obvious traps, so they are continuously distributed in a large area on the plane. Organic matter-rich shale in the stage of liquid hydrocarbon generation may accumulate shale oil, so shale oil is widely distributed in vertical burial depths. It is necessary to evaluate the various properties of reservoirs [6,7,8]. The pore characteristics of formation is one of the most important characteristic parameters of a shale oil reservoir because it determines the oil storage capacity of the formation, and also affects the transport capacity of rock in the process of exploitation. In drilling engineering, the formation pores are affected by construction, especially surrounding drilling fluids. Therefore, it is necessary to study the pore characteristics of shale oil formation and the interaction with surrounding fluids.
Usually, shale oil reservoirs are dominated by nanopore throat systems, and micron scale pores or even millimeter scale pores are locally developed. Shale reservoirs show more complex pore throat systems than conventional reservoirs. The type and size of pores and cracks can be observed at various scales by means of preparation and identification of rock casting thin section, multiscale computed tomography (CT), scanning electron microscopy (SEM), field emission SEM (FESEM), and transmission electron microscopy (TEM) [9,10,11,12]. Gas adsorption, mercury porosimetry, nuclear magnetic resonance (NMR), and small-angle neutron scattering (SANS) can be used to quantitatively characterize the distribution range and frequency of pores and cracks [13,14]. The identification technology of rock casting thin section allows us to judge the mineral composition and pore distribution of rocks by means of microscopy, which is mainly used to observe the overall structure of rock surface and larger cracks or pores. Scanning electron microscopy can observe a wide range of pore and crack sizes, but it can not get the distribution of pores and cracks in rocks. Multiscale computed tomography can judge the distribution of pores and cracks in rocks, but the experiment cost is high and data processing is complex. The mercury porosimetry test can be used to test pore size and pore content of each size, but the experimental conditions are strict because the mercury is volatile and toxic. Nuclear magnetic resonance (NMR) can capture almost all the pore sizes, but it requires that the test samples contain no metallic minerals, and the test results need to be expressed by other quantitative methods. Each method has its advantages and disadvantages in evaluating the characteristics of pores and cracks from different angles. Therefore, it is necessary to characterize the pore structure of shale oil reservoirs by multiscale methods [15,16,17].
The Ordos Basin is an important reservoir basin of shale oil in China. In recent years, research and related reports on Ordos shale oil have dramatically increased. Yang, Fan, et al. [18,19] studied and evaluated the distribution and potential of Ordos shale oil, pointing out that the basin has a large amount of shale oil resources and is a promising prospect. Cui, Cao, Xu, et al. [20,21,22] studied the geochemical characteristics of Ordos Basin Chang 7. Chen et al. [23] studied the sedimentation rate and its effect on organic matter abundance in source rocks. Yuan et al. [24] studied the mechanism of organic matter deposition and enrichment, pointing out that tectonism played a role in organic carbon enrichment and deposition, and that the increase of primary productivity caused by volcanism could play a role in the accumulation of carbonaceous sediments. Fan et al. [25] analyzed the influence of formation heterogeneity on hydrocarbon generation, retention, and expulsion. Chen, Sun, et al. [26,27] studied the controlling factors of shale oil transportation and distribution. Han et al. [28] quantitatively analyzed the contribution of organic and inorganic components to the pore volume of Chang 7 shale. Li et al. [29,30] systematically analyzed the main elements and rare earth elements in shale oil samples from the southern Ordos Basin, and discussed their elemental characteristics and corresponding geological significance. Tan et al. [31] proposed a comprehensive evaluation method for an Ordos Chang 7 ultralow permeability reservoir based on geological and logging data. Li et al. [32] conducted experiments on geochemical composition and low-temperature gas adsorption, and obtained the effects of different mineral components on pore development. Liu et al. [33] investigated the pore structure of oil well cement slurry (OCS) in the suspension–solid transition stage and the effect of the hydrated products on the pore structure via isothermal calorimetry, scanning electron microscopy (SEM), nitrogen adsorption, thermogravimetry (TG), and low-field nuclear magnetic resonance (LF-NMR). Xu et al. [34] established a method for evaluating the pore characteristics of tight oil reservoirs by nuclear magnetic resonance (NMR) logs, and analyzed the pore characteristics of the Lucaogou formation in Jimuaser Sag of Junggar basin. The purposes of previous studies were to study the pore characteristics of tight formation or shale formation with deeper burial depth, and the pore hydration characteristics were not studied. The typical continental shale in China is shallow, and the pore changes caused by hydration will affect the wellbore stability, so it is necessary to study the pore characteristics and the influence of hydration on the pore size, distribution, and structure.
Existing studies have studied the oil-bearing capacity and oil-bearing characteristics of the Chang 7 reservoir, indicating that it has great potential, and pointed out that the interference of the geological environment may become a factor restricting shale oil exploration in the work area. Pore parameters are very important geological characteristics of shale oil reservoirs. Studying them is helpful for evaluating reservoirs and drilling operations, especially for optimizing drilling fluid type. In this study, the downhole core of the shale oil reservoir in the third submember of the Triassic Chang 7 member in the southern Ordos Basin is the research object. An experimental study of pore types, distribution, structure, and other characteristics was carried out, and a soaking of drilling fluid was carried out to provide support for reservoir evaluation and drilling fluid design.

2. Materials and Methods
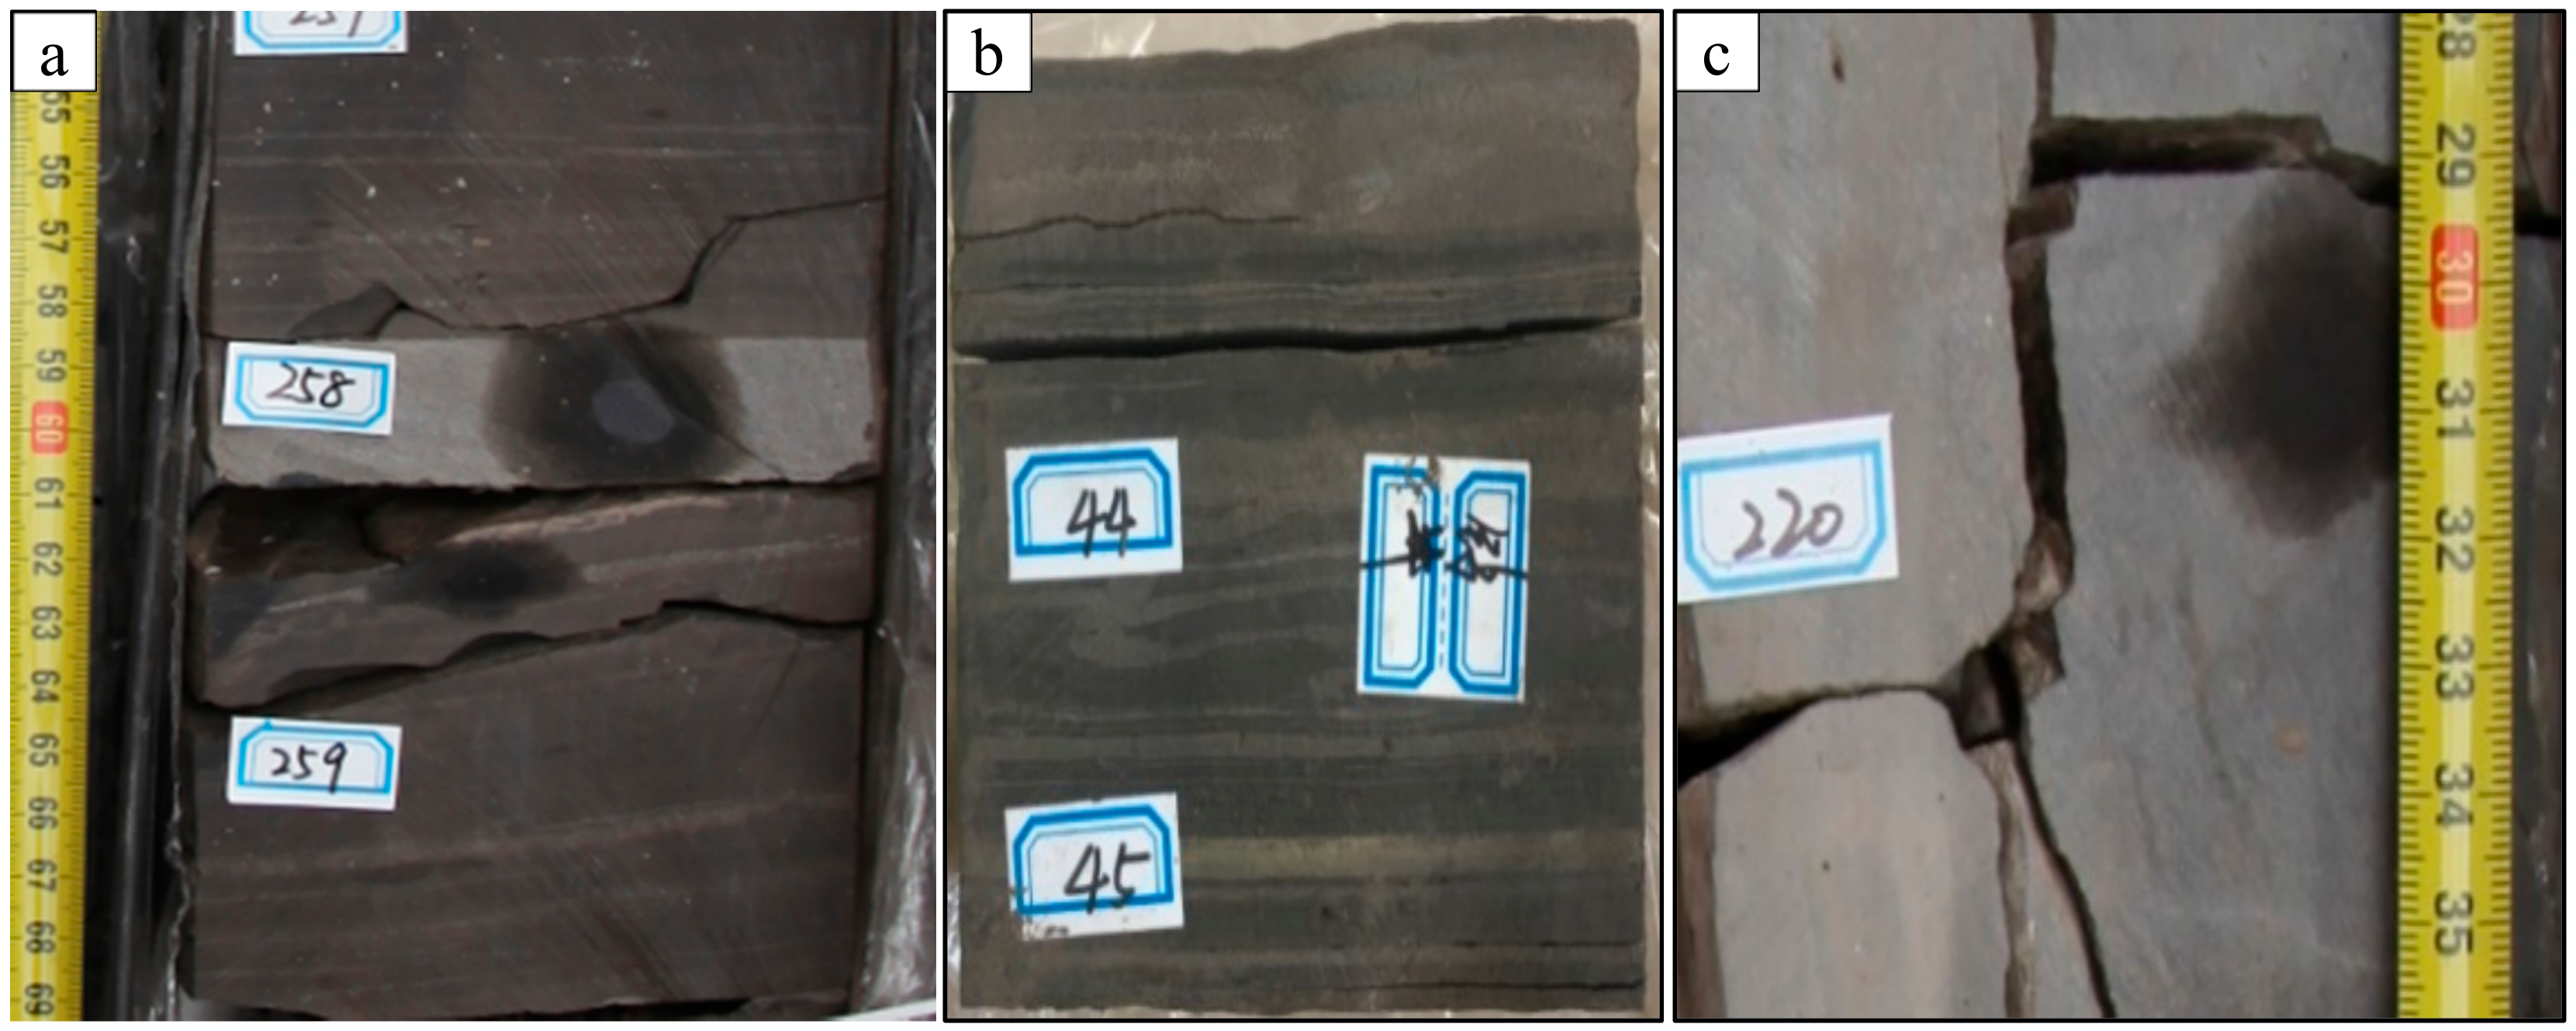
2.1. Rock Core

The experimental cores were taken from Well B1 in B County, southern Ordos Basin, which is the first exploration well for the Palaeozoic group in the BC block (Figure 1). The bottom of Chang 7 member is buried at 900–1550 meters, and the maturity value of organic matter is mainly between 0.5% and 0.75%, which is in the stage of oil generation [35]. According to downhole cores, the third submember of the Triassic Chang 7 member is a high-quality source rock series with good oil-bearing properties, and the total organic carbon (TOC) content of the reservoir reaches 17.41%. The lithology is mainly black laminated shale, and there is a small section of tuff in the lower part. The whole section contains interbedded tuffaceous and argillaceous siltstone. Shale develops interbeds and bedded microcracks, and tuff develops irregular structural cracks. According to the requirements of the experiment, the rock obtained in the well was cut, polished, and drilled into small cores. Small core columns were prepared for porosity and permeability testing, slices of rock were prepared for optical microscopic observation, microscale square cores were prepared for SEM, and rock cuttings were prepared for a mercury porosimetry test.

2.2. Drilling Fluid

Drilling fluid is an important part of exploration and development of oilfields, and the contact and interaction between the drilling fluid and wall rock have various effects on drilling operations. During the drilling process, solid particles of drilling fluid enter formation pores and cracks, which can accumulate to form a plugging effect, reduce permeability and transmission pressure, and enhance rock strength around the well. Solid-phase particles are commonly used in plugging materials, and the plugging effect is formed by entering into the pore and crack bridge. The plugging effect is greatly affected by material size [36,37,38].
In the experiment, a water-based drilling fluid (WBM-SL) with plugging inhibition was used to test the interaction between solid particles in the drilling fluid and pores and cracks in the core. The drilling fluid formula was 2% soil + 0.3% caustic soda + 15% organic salt + 5% KCl + 2% polyol + 0.5% silicate + 2% ultrafine asphalt + 2% ultrafine calcium salt + 3% nanoplugging agent.

2.3. Experiment Methods

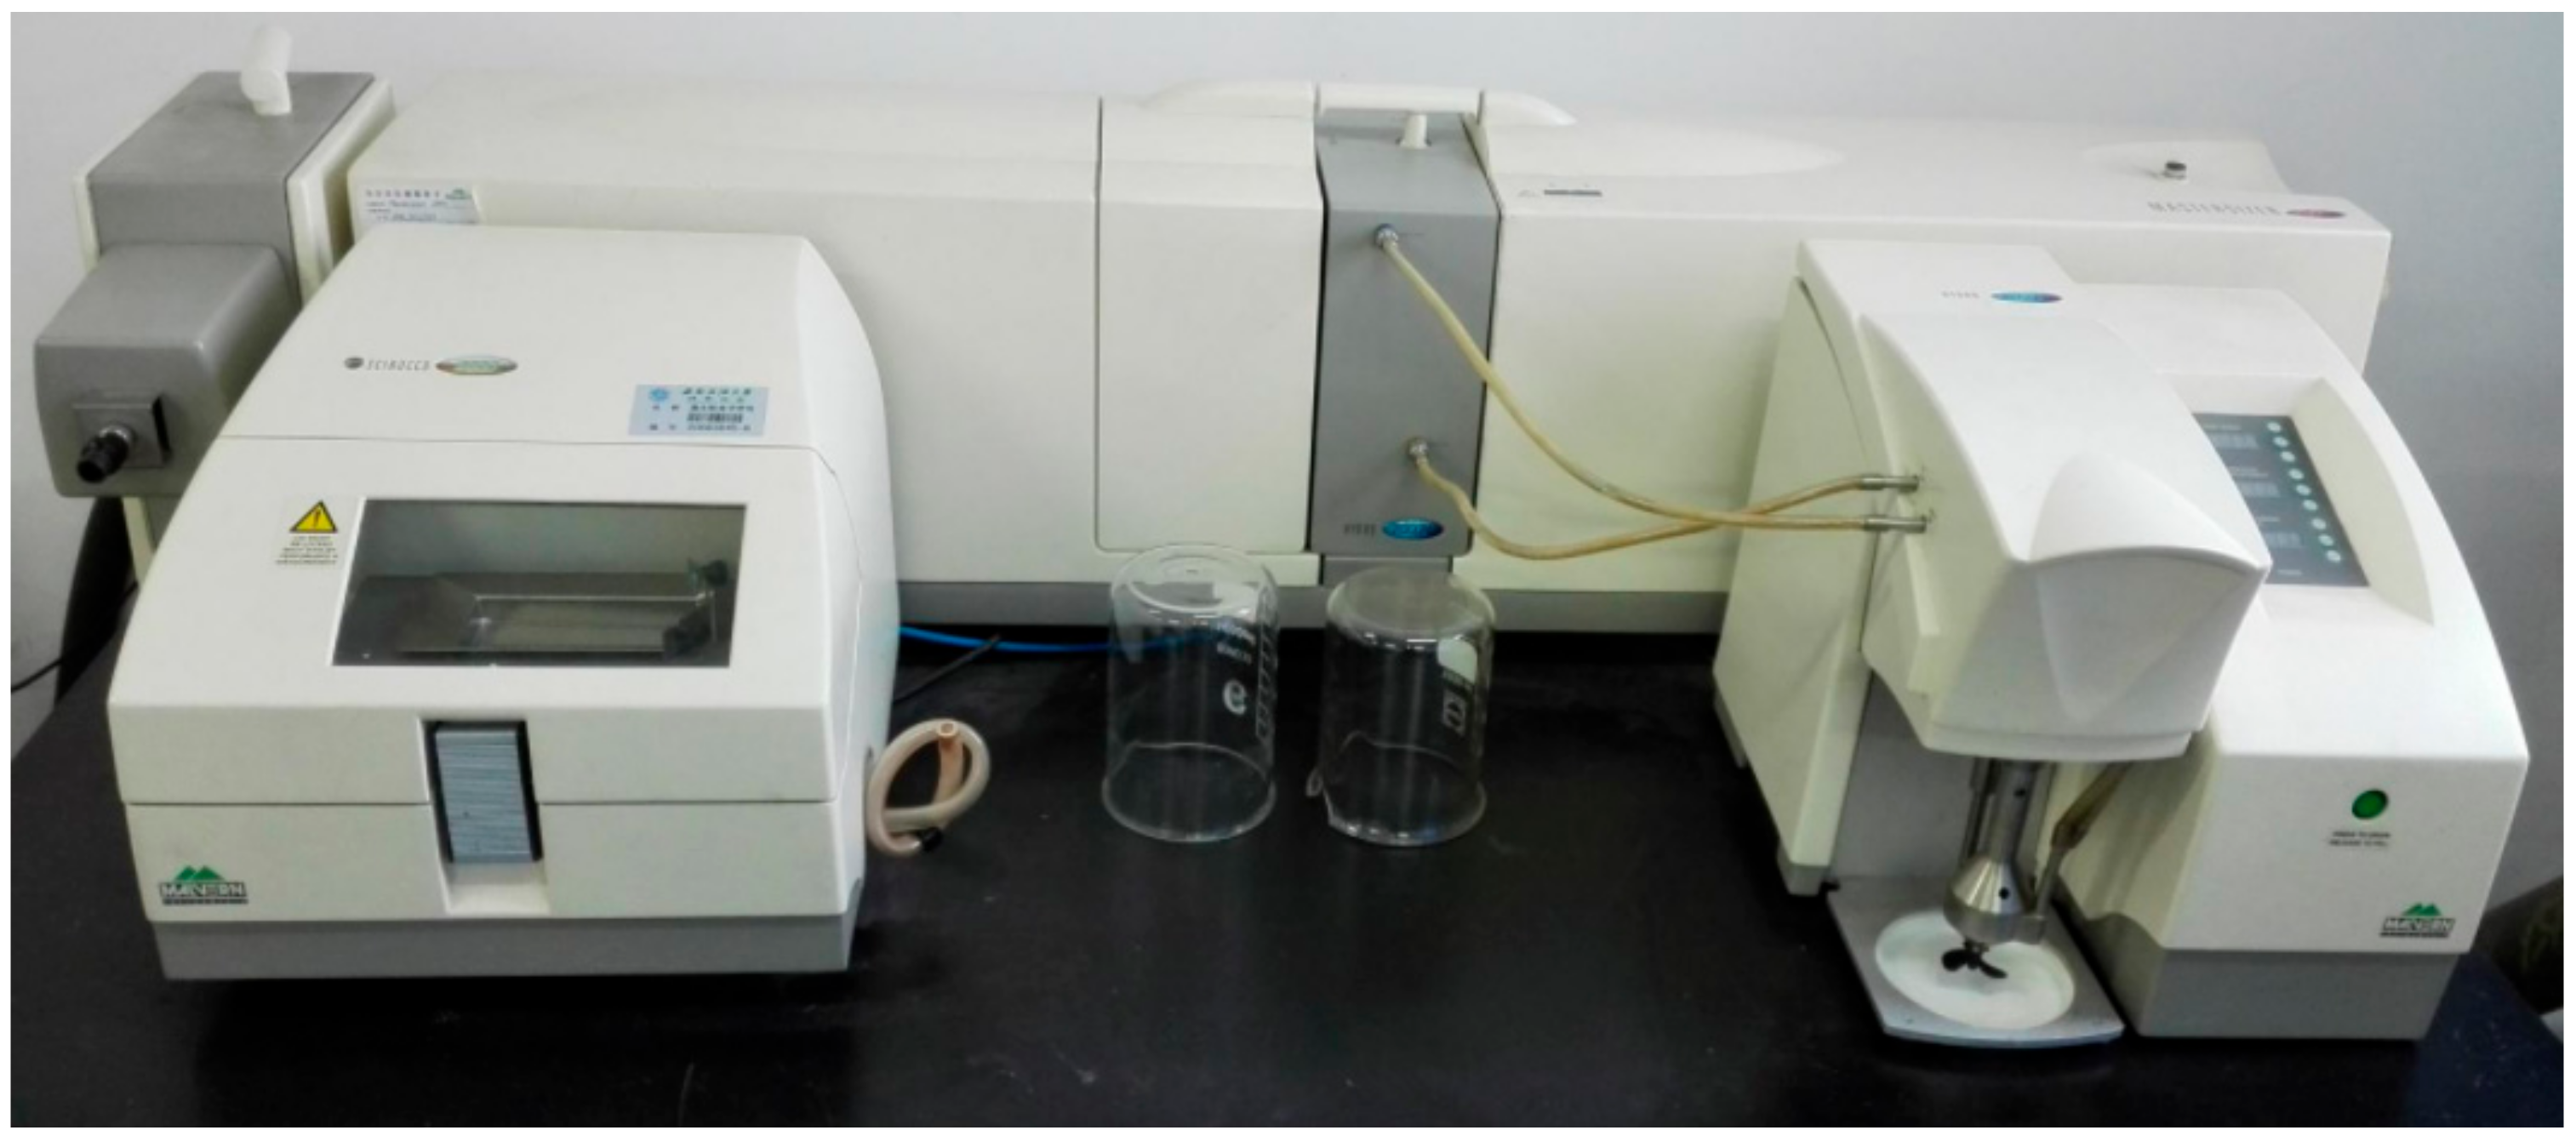
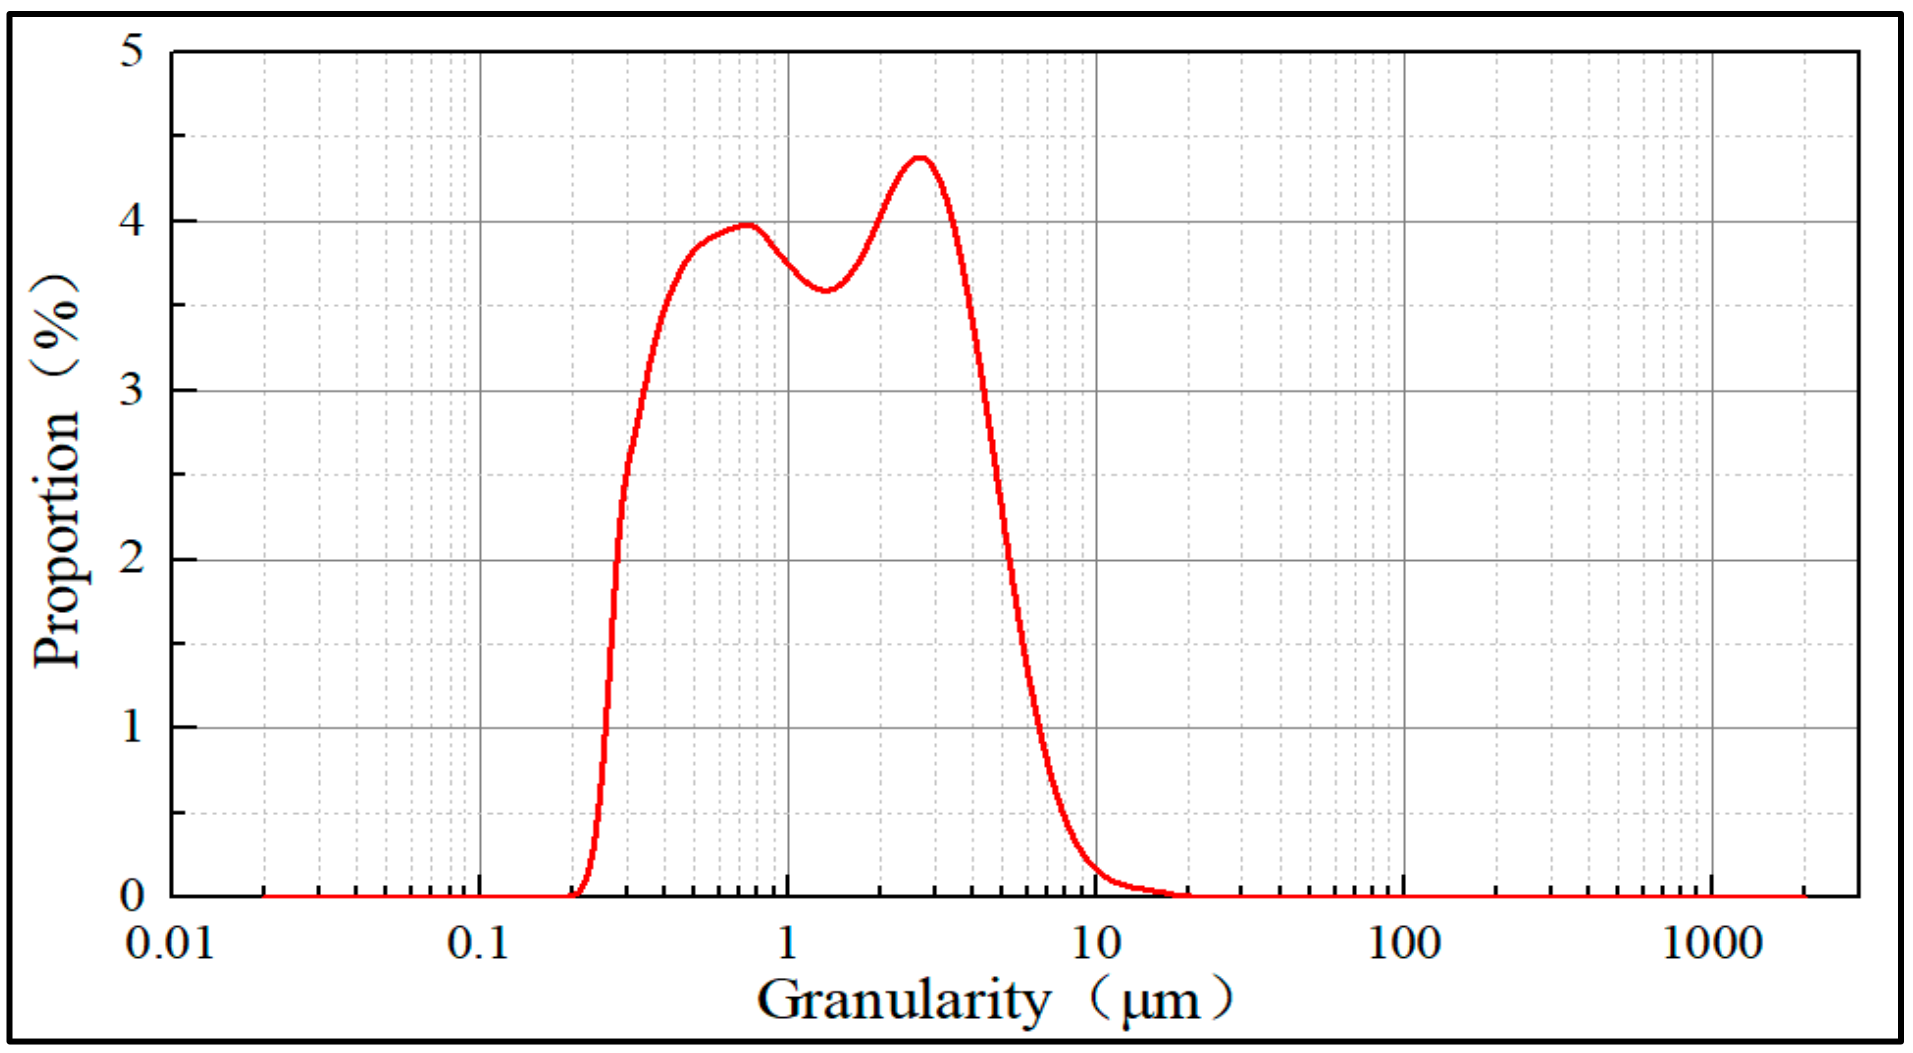
2.3.1. Drilling Fluid Size

Light is an electromagnetic wave. When it encounters particles in the process of propagation, it interacts with them. Some of them deviate from the original direction of travel. This physical phenomenon is called light scattering (diffraction). The deflection angle is related to the size of the particles. According to this principle, the particle-sized composition of the drilling fluid was tested and analyzed with a Master Sizer 2000 laser particle-size analyzer (Figure 2) produced by Malvern Instruments Company, UK. The test range was 20 nm to 2000 μm.

2.3.2. X-ray Diffraction

X-ray diffraction is a common method to measure the mineral and clay components, which is especially important for the study of unconventional reservoirs. The clay content in shale formations is relatively high, which can easily cause hydration, and then affect the pore characteristics [39,40,41]. The atomic composition and arrangement of different minerals is different, so the X-rays scattered by different atoms interfere with each other and produce strong X-ray diffraction in some special directions. The direction and intensity of the diffraction lines in space distribution are closely related to the crystal structure. Therefore, the mineral composition and content of rocks can be analyzed by X-ray diffraction. The X’Pert Pro X-ray diffraction analyzer (Figure 3) produced by PANalytical B.V. Company (Netherlands) was used to analyze mineral species qualitatively and quantitatively. The maximum current was 60 mA and the maximum voltage was 60 KV. The focus size was 12 × 0.4 mm with copper target and ceramic light tube. It can quickly and accurately test the type and content of samples from –193 °C to 450 °C.

2.3.3. Porosity

To test porosity, it was necessary not only to know the total porosity of rock, but also to obtain the pore distribution range and pore content in different sizes, which could be used to study the influence of fluid on pore size distribution. Therefore, the gas balance method was used to measure the total porosity of rock, and a mercury porosimetry test was used to measure the pore size and distribution frequency.
According to Boyle’s law, at a constant temperature, the pressure and volume of gas are inversely proportional, and the total porosity of rock can be measured by the double chamber method [42,43,44]. The HEP-P porosity tester (Figure 4) produced by VINCI Company (France) was used to test the total porosity of samples. Keeping the temperature constant during the experiment, the small core column was put into the extended tank, and helium was put into the standard tank at a preset pressure (100 psi–200 psi). The equilibrium pressure P1 was read out. Then the gas expanded into the extended tank and the equilibrium pressure was P2.
The particle volume of the rock was calculated by Boyle’s law, and sample porosity was calculated by Equation (1)
ϕ = V C P 1 P 2 + V 0 V C V Y / V 0
where ϕ is porosity (%); V0 is volume of sample (cc); VC is volume of standard tank (cc); VC is volume of extended tank (cc); P1 is the first equilibrium pressure (psi); P2 is the second equilibrium pressure (psi).
According to the characteristics of porous media, the pressure that forces nonwetting liquid to enter the pore depends on the radius of the pore, which is the basis of mercury porosimetry. Mercury porosimetry has the advantages of a simple principle, a fast testing speed and a wide size testing range [45,46]. The Poremaster-60 (Figure 5) produced by Quantachrome Instruments Company (USA) was used for the mercury porosimetry test. Before the experiment, the standard sample of aluminium trioxide was tested to calibrate the instrument. Then the samples with a known density and quality were put into the high-pressure mercury chamber. 106 pressure points were set from 20 psi to 56,000 psi, and each point was stabilized for 30s. Finally, the calculation was carried out according to Equation (2). Because mercury is toxic and volatile, low temperature ventilation around the instrument was ensured during the experiment.
R = K / P
where R is pore diameter (nm); K is a proportional constant, which is determined by the experimental parameters, and standard samples are used to correct K before the experiment; P is experimental pressure (psi).

2.3.4. Permeability Experiment

According to Darcy’s law, the volume flow rate of the permeability medium per unit cross-sectional area is proportional to the potential energy gradient and inversely proportional to the viscosity of fluid. Therefore, by measuring the flow of fluid in a direction of rock, the permeability of rock in that direction can be obtained. Axial permeability can be measured by pressurizing one end of core column [47,48]. A Gasperm permeameter (Figure 6) produced by VINCI (France) was used in the experiment.

2.3.5. Rock Casting Thin Section

A rock casting thin section is made by injecting colored liquid glue into the pore space of a rock under vacuum pressure and grinding after solidification of the liquid glue. Because the pore of the rock is filled with colored glue, it is very conspicuous under the microscope and easy to identify. It provides an effective way to study the pore size, distribution, pore type, connectivity, combination characteristics, and geometric shape of the rock [49,50,51]. During the experiment, the core was polished into casting slices of different specifications and observed under a DM2700P microscope (Figure 7) of Leica Instrument Co., Ltd. in Germany.

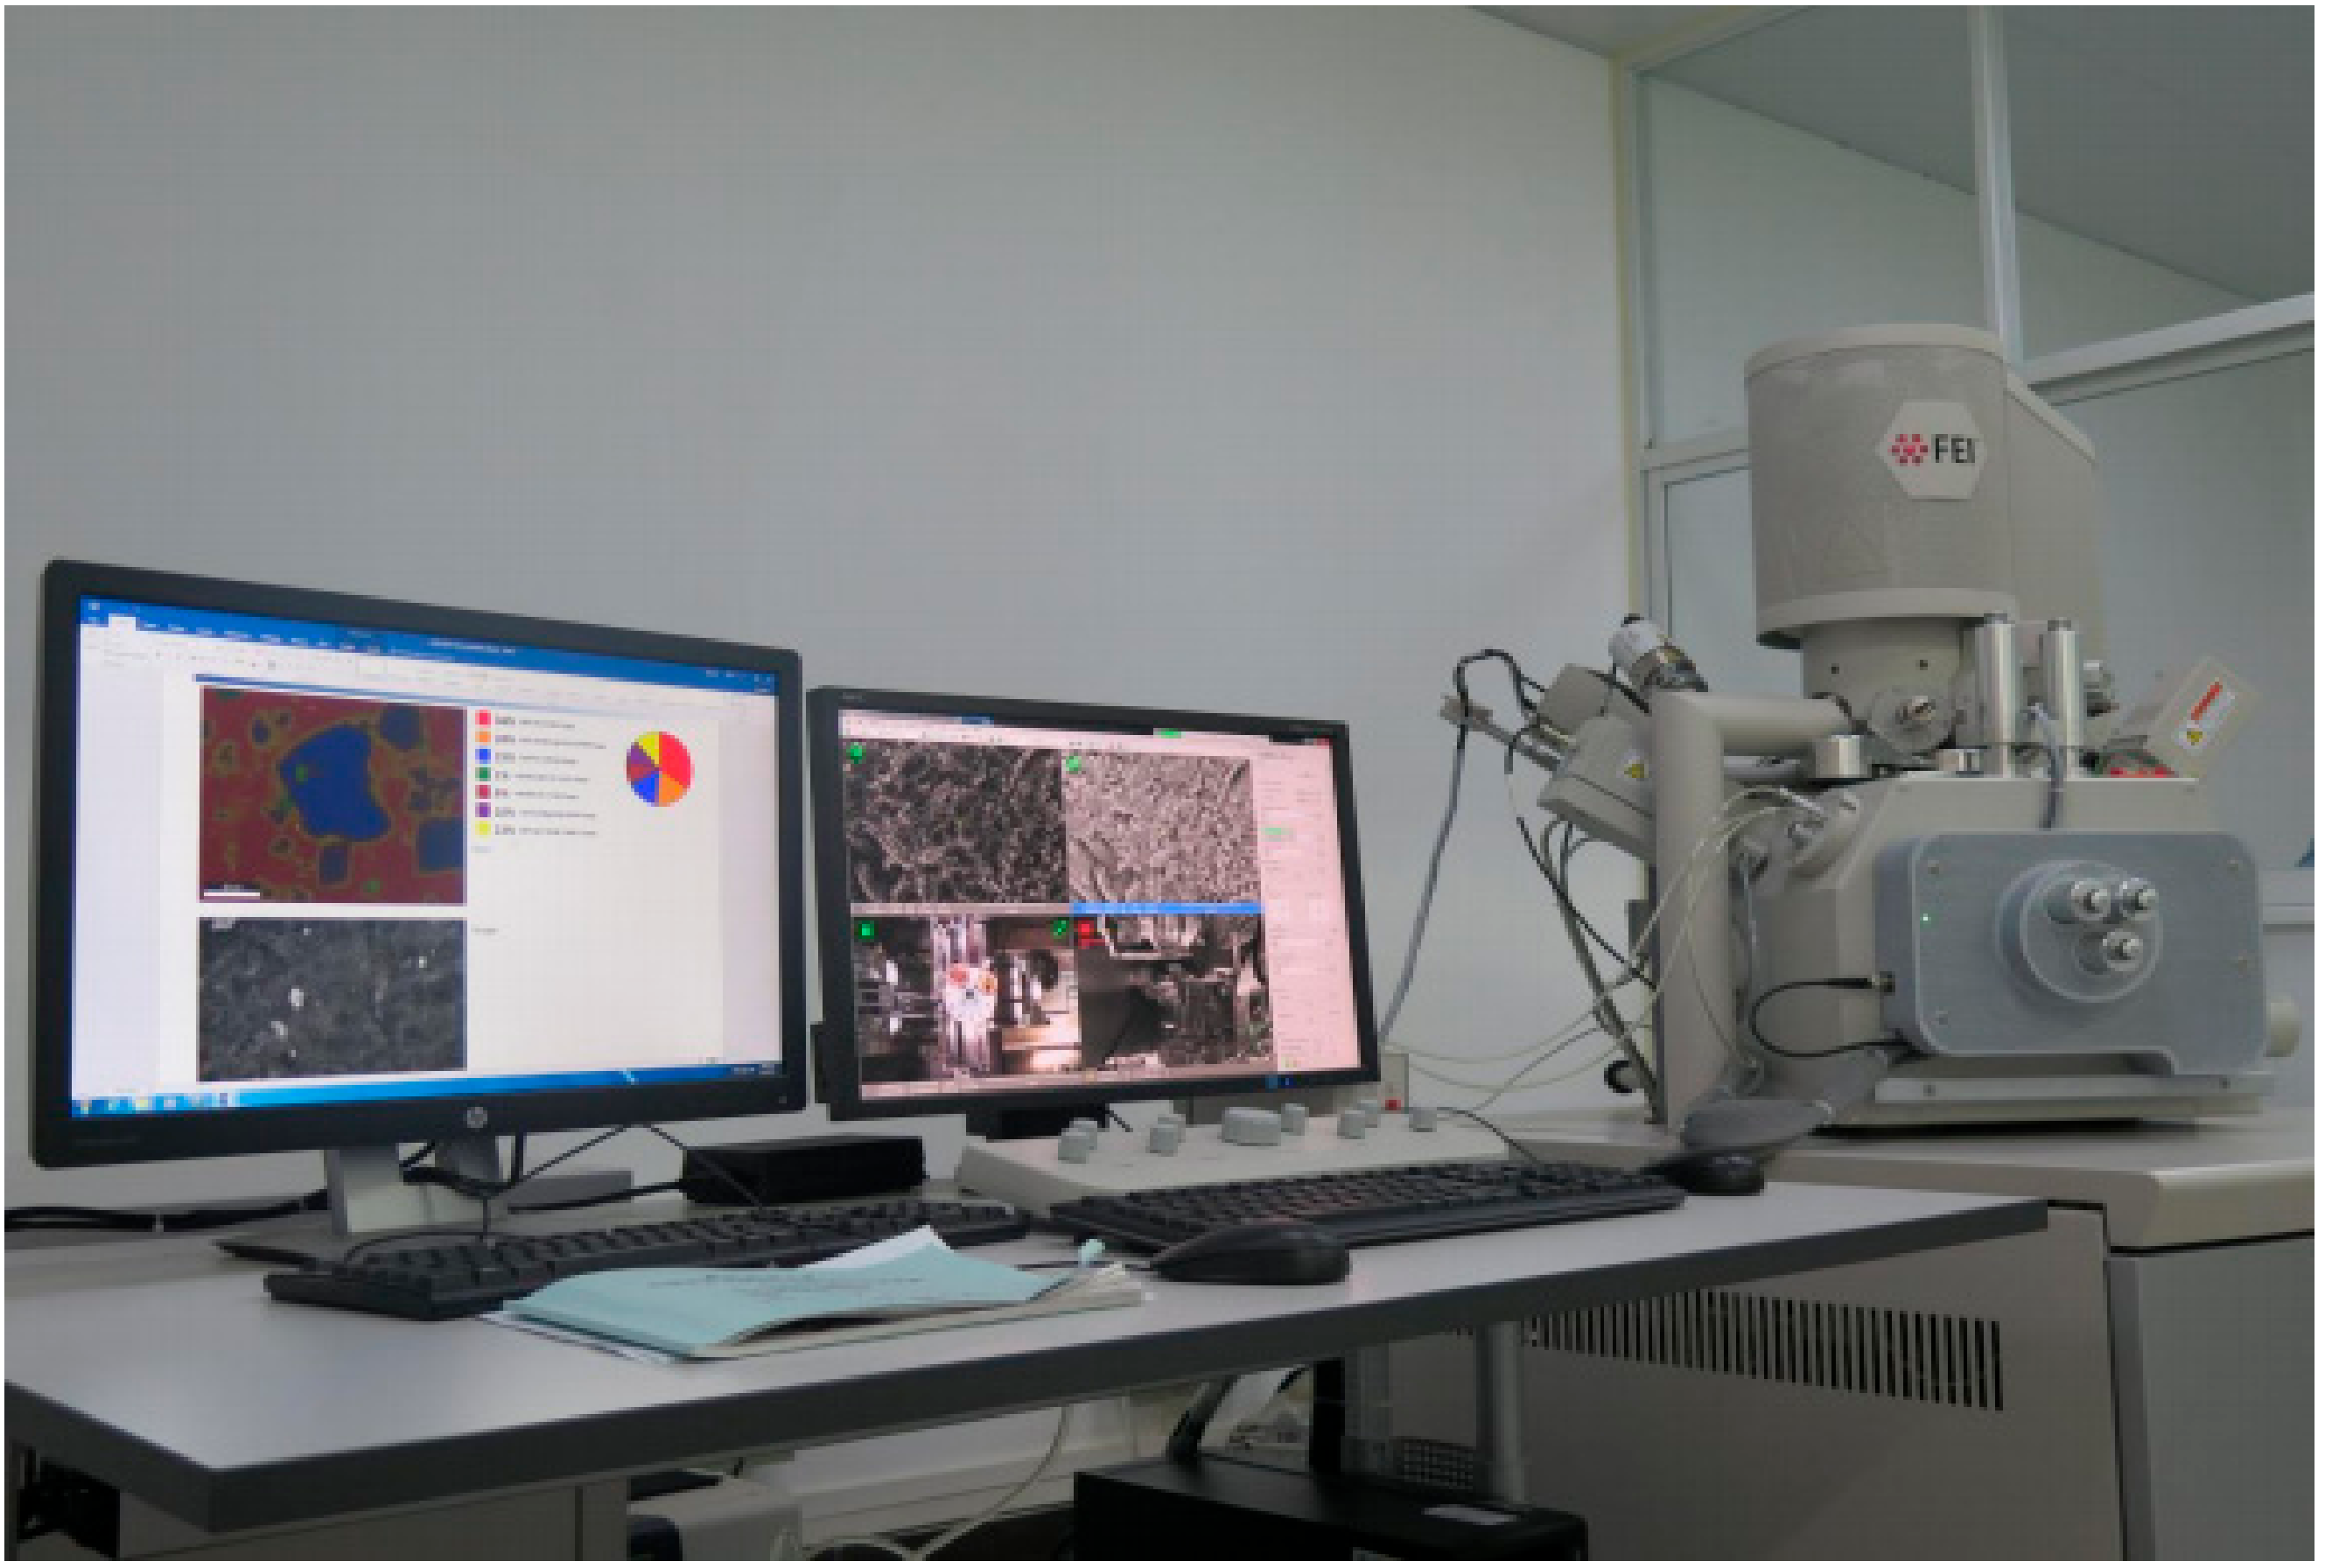
2.3.6. Scanning Electron Microscope

SEM produces various effects through the interaction between an electron beam and the sample. The surface morphology of a sample is observed by secondary electron signal imaging. SEM has high magnification and stereoscopic images, which is an important means to observe the surface characteristics of tight reservoirs [52,53,54]. The FEI Quanta 650 FEG field emission scanning electron microscope (Figure 8) produced by FEI (USA) was used to observe the samples.

3. Results and Discussion

3.1. Mineralogical Compositions

According to the observation of the core profile and the results of the X-ray diffraction experiment, it can be concluded that the research formation can be divided into three parts. The upper part is shale, the middle part is argillaceous tuffaceous siltstone, and the lower part is tuff.
From the analysis of mineral composition results (Figure 9), the overall mineral content is heterogeneous. The clay content is between 10% and 45%, and the quartz content is between 21% and 62%. There are many kinds of minerals in shale, clay content is relatively low, and pyrite content is relatively high. The content of quartz in the transition section is high, the content of clay begins to increase, and the content of pyrite begins to decrease. The content of clay in the tuff section is high and there is no pyrite.
The clay compositions of shale and tuff samples were extracted and tested. The results are shown in Table 1. The experimental results show that the whole core contains many illite/smectite mixed layers. The content of kaolinite in shale is relatively high, while that of chlorite is relatively low. The content of chlorite in tuff is relatively high, but there is no kaolinite. The percentage of smectite layers in interstratified illite/smectite decreases with depth (Figure 10).

3.2. Porosity and Permeability

Table 2 shows the porosity and permeability of the core measured. It can be seen that the reservoir has mainly low porosity and low permeability. Some samples have microcracks, which lead to a large difference between pore and permeability. K/Φ is the ratio of permeability to porosity, representing the permissible ability to pass fluid through the rock. The larger the value, the better the pore connection in rock. Some samples, such as No. 5 and No. 6, have high porosity, but low K/Φ, which indicates that there are many discontinuous pores or cracks. The increased porosity of these disconnected pores and fractures belongs to invalid porosity, which can be used as reservoir space for shale oil, but has limited use in helping the migration of shale oil.

3.3. Effect of Hydration on Pore

The effect of hydration on pore size and distribution frequency can be obtained by mercury porosimetry testing on the rock before and after hydration. According to the formation data, the rock of the experiment is at 80 °C underground, so the experiment took cuttings from the same rock, soaked them in water at 80 °C for different times, and then carried out mercury porosimetry testing to analyze the effect of hydration on the pore. The information of the experimental sample is shown in Table 3.
According to the sample density, mass, and maximum mercury intake, the porosity can be calculated, and then the relationship between porosity and soaking time can be obtained (Figure 11a). From the graph, it can be seen that the porosity of both shale and tuff increases greatly after soaking, and the porosity change of shale is larger than that of tuff. By normalizing the soaking time and porosity and drawing their relationship curves (Figure 11b), it can be concluded that shale pore changes slightly in the initial stage of soaking, and the porosity increases rapidly in the middle stage of soaking, and finally the rate of increase decreases to zero. The porosity of tuff increases rapidly at the initial stage of soaking, and then decreases gradually to zero.
According to pressure and mercury intake, the relationship between pore size and pore volume can be obtained by Equation (2).
Figure 12a reflects the relationship between the pore distribution of shale and soaking time. It can be concluded that the pore size of the sample without soaking is mainly 2–100 nm. When soaking for 6 hours, there are more micron sized pore sizes (larger than 1 micron), while part of the pore sizes below 100 nm are transformed into medium sized pore size (100–1000 nm). A large number of small pores (less than 100 nm) appeared after 24 hours soaking. When soaking for 48 hours, a large number of small pores transformed into medium pores. During the whole process, small pores are increasing and expanding into larger pore.
Figure 12b reflects the relationship between pore distribution of tuff and soaking time. The pore size of tuff without soaking is similar to that of shale, and the pore size is mainly small. After 6 hours of soaking, a micron sized pore appeared, and small pores increased. When soaking for 24 hours and 48 hours, the small pores increased and converted into medium pores.
Combining the results of Figure 11 and Figure 12, it can be concluded that the porosity of shale increases most rapidly during 12–24 hours of soaking because of the large increase of pores. During this period, both the increase of the number of pores and the change of the size of pores are very obvious. After soaking for 24 hours, the change of total porosity is very small, but the change of pore content in different sizes below 100 nm is obvious. The porosities of tuff change most obviously in the initial 6 hours of soaking, and the growth of micron-scale pores is the main reason for this phenomenon. After 6 hours, although the pore size changed, the increase or change range is relatively small, lead to the increase of porosity is not obvious. According to the experimental results of the effect of hydration on pore characteristics, it is necessary to ensure rapid hydration inhibition of drilling fluids in tuff formation and the long-term hydration inhibition of drilling fluids in shale formation.

3.4. Pore Structure

According to the observation of rock casting thin sections, bedding crack networks developed in the rock (Figure 13a), and obvious tuffaceous laminae can be seen under single polarized light (Figure 13b). Locally developed breccia-like muddy tuffaceous siltstone and fragment (Figure 13c) in a single polarized light can be seen with clearly rich organic debris (Figure 13d). The pores and cracks in the rock are well developed, the organic matter content is high, and the total clastic content of the rock is high.
SEM can be used to observe more microscopic pores and fractures in the structure of rocks. Figure 14 shows the reservoir rocks observed under scanning electron microscopy. From the experiment photos, the bed of the rock is obvious, and the distribution and arrangement of minerals are consistent with the direction of bedding (Figure 14a,b). Three kinds of cracks can be seen in the rocks. Corrosion cracks are formed by the acid dissolution of siliceous, calcareous strips or cementite, and their morphology is controlled by the morphology of the corrosion substances (Figure 14c). Shrinkage cracks are formed by hydrocarbon expulsion and contraction of organic matter, which distributes along the edge of organic matter (Figure 14d). Abnormal high-pressure cracks are formed when abnormally high pressure in rocks causes irregular cracks in and between minerals (Figure 14e,f).
Figure 15 shows the pore conditions in the rock observed under scanning electron microscope. It can be seen that the pore is divided into intergranular, intragranular, and intercrystalline pores, and a pore related to organic matter. The intergranular pores are mainly feldspar intergranular solution pores, quartz, and other minerals’ intergranular solution pores (Figure 15a). The intragranular pores were mainly feldspar intragranular solution pores and quartz intragranular solution pores (Figure 15b). The main intercrystalline pores were pyrite intercrystalline pores and clay mineral intercrystalline pores (Figure 15c). Organic pores were mainly the pores formed in kerogen after the conversion of organic matter into hydrocarbon fluid, and the pores formed between the shrinkage of organic matter and the surrounding mineral particles (Figure 15d).

3.5. Effect of Fluid on Pore Structures

In order to test the influence of water and drilling fluid (WBM-SL) soaking on rock microstructure, scanning electron microscopy (SEM) experiments were carried out on the rocks after soaking. The particle size distribution of the WBM-SL is shown in Figure 16. The solid particle size of the drilling fluid is characterized by double peaks, mainly between 0.2 μm to 7 μm.
Figure 17 shows scanning electron microscopy photographs of shale after 12 hours soaking at 80 °C in water. After soaking, some minerals on the rock surface fell off and dispersed into the water, and some large pores or cracks appeared (Figure 17a,b). This is one of the reasons for the occurrence of large pores in the initial stage of soaking, and also weakens the strength of the rock around the wellbore. After soaking in water, layers appeared on the surface of core, accompanied by the generation and expansion of cracks (Figure 17c,d). These cracks and layers are easy to appear in the weak cementation between bedding and interbedding. If the angle of these bedding fractures is relatively large, it is easy to cause rock failure and wellbore collapse in the direction of parallel wellbore trajectory, which affects drilling safety.
Figure 18 shows scanning electron microscopy photographs of shale after 12 hours soaking at 80 °C in WBM-SL. Figure 18a,b shows the situation of solid particles entering the fracture in drilling fluid. It can be seen that solid particles can accumulate in the fracture and play a plugging role. Soil powder accumulates in smaller voids after the bridge is erected by solid particles, thus inhibiting hydration. However, some pores and cracks are not effectively plugged because they do not match the size of the solid particles in drilling fluid. Therefore, when configuring solid particles, the multidimensional complexity of formation pores and fractures should be considered, and different levels of plugging particles should be allocated to ensure that most of formation pores and fractures can be effectively plugged.
Figure 18c,d shows the protective mud layer on the rock surface formed by the drilling fluid, which can reduce the contact between the water and rock. The protective layer has a certain strength, which can prevent minerals on the rock surface falling off and dispersing into the water. In this experiment, some protective layers split or fell off because of the drying treatment needed for observation. In the process of drilling, the stability of the protective layer formed by the drilling fluid should also be considered. For example, it can withstand the disturbance of downhole drilling tools and can withstand high temperatures and high pressure. Only in this way can the borehole be effectively protected for a long time.
The macro-micro analysis of pore hydration characteristics of Chang 7 member shale oil reservoir in southern Ordos Basin was carried out for the first time. The effect of hydration is explained by the increase of total porosity in a macro scale, and the effect of hydration is explained by the change of pore distribution in the rock after immersion in different fluids and the structural change of the rock under electron microscope in a micro scale. This paper studies the complex pore distribution and characteristics of shale oil reservoir and confirms the influence of fluid environment on reservoir pores and that changes in pores will also affect drilling operation. Through the interaction between water-based drilling fluid and the core, it is shown that water-based drilling fluid can inhibit hydration, which is embodied in two aspects: plugging pores and forming protective layers on rock surfaces. In actual construction, the size of solid particles in drilling fluid should be reasonably allocated, such as using multistage solid phase plugging particles to ensure that drilling fluid plugs pores and fractures in drilling, and reduces the risk of leakage. The protective mud cake formed by the drilling fluid should have a certain stability and be able to resist the influence of downhole high temperatures and pressure environments and drilling disturbances. Water-based drilling fluids can play the same role as oil-based drilling fluids in ensuring drilling wellbore safety. At the same time, compared with oil-based drilling fluids, water-based drilling fluids have better economic and environmental protection. This study provides support for the design of water-based drilling fluid in shale oil reservoir drilling process from the characteristics of pore hydration. The economic benefits of our study can reduce drilling fluid cost, as well greatly reduce the risk of well collapse.

4. Conclusions

In this paper, the mineral composition, pore characteristics, and shale hydration of shale oil reservoirs in the third submember of the Triassic Chang 7 members in Southern Ordos Basin were studied and analyzed experimentally. The following conclusions are drawn:
(1)
The lithology of the third member of the Chang 7 members is mainly black laminated shale, and a small tuff is developed in the lower part. The whole rock contains more interbeds and microcracks, and the mineral composition of quartz and clay is higher. The complex structure and mineral composition of the rocks make rock hydration and brittle collapse easier.
(2)
The formation belongs to a low-porosity and low-permeability reservoir, and the density of the rock is lower than that of pure shale and tuff. Some rocks have larger porosity, but K/Φ is small, which indicates that there is more discontinuous pores in the samples. These pores may be oil storage space, but they are of little help to oil migration. Fracturing revamping is needed to break through these closed pores and cracks.
(3)
Water soaking has a great influence on the pore characteristics of shale and tuff. The pore changes of tuff are most obvious within 6 hours of soaking, and the pore changes of shale are most obvious within 12–24 hours of soaking. Therefore, in actual construction, the tuff section requires drilling fluid to have a fast inhibition effect, and the shale section requires drilling fluid to have a long-term and stable inhibition effect.
(4)
Through microscopic observation, the shale bedding is obvious, and the cracks and mineral arrangement are related to the bedding direction. At high magnification, the main types of crack are dissolution cracks, shrinkage cracks of organic matter, and structural cracks. The main types of pores are intergranular pores, intragranular pores, intercrystalline pores, and organic pores. The shape and distribution of pores and cracks is influenced by the mineral type, the mineral structure, hydrocarbon expulsion of organic matter, and rock stress.
(5)
At formation temperatures, the effect of water and drilling fluid on rock structure can be observed; water soaking makes minerals on the rock surface fall off and disperse into the water. Stratification of rocks and expansion of cracks are easy to occur at the weak cementation between bedding. Water-based drilling fluid can plug pores and cracks and form a protective layer on the rock surface, thus effectively reducing hydration. When drilling fluids are allocated in actual construction, multisized solid particles of drilling fluids should be considered according to the actual formation pores and cracks, and the long-term stability of the protective layer formed should be guaranteed.
(6)
In this study, the morphological and structural characteristics of shale oil reservoir rocks are studied from the perspective of pore hydration, but the interaction between mechanical properties and bedding structure is not studied, and the corresponding evaluation theoretical model is not formed. The next step is to carry out relevant work.

Author Contributions

Conceptualization, P.Z. and X.F.; methodology, P.Z. and Q.Z.; formal analysis, X.W. and M.Z.; resources, X.W. and H.W.; data curation, P.Z. and J.S.; writing-original-draft preparation, P.Z. and J.L.; writing—review and editing, P.Z. and J.R.; visualization, P.Z. and D.L.; supervision, X.F. and Q.Z.; project administration, X.F.

Funding

This research was funded by the 13th Five-Year Plan National Science and Technology Major Project’s “Evaluation of Exploration and Development Targets of Continental Shale Oil in Typical Basins of China” (Grant No. 2017ZX05049), the National Natural Science Foundation of China (Grant No. 51774246 and 51474185), the China Postdoctoral Science Foundation (Grant No. 2014M560728), and the National Basic Research Program of China (973 Program, Grant No. 2013CB228003).

Acknowledgments

Scholarship supports provided by China Scholarship Council (CSC) is gratefullyacknowledged. The authors would like to express their gratitude to the editors and anonymous reviewersfor their constructive comments on the draft paper.

Conflicts of Interest

The authors declare no conflict of interest.

References

  1. Jin, Z.J.; Bai, Z.R.; Gao, B.; Li, M.W. Has China ushered in the shale oil and gas revolution? Oil Gas Geol. 2019, 40, 558–570. [Google Scholar]
  2. Li, Z.M.; Tao, G.L.; Li, M.W.; Qian, M.H.; Xie, X.M.; Jiang, Q.G.; Liu, P.; Bao, Y.J.; Xia, D.L. Discussion on prospecting potential of shale oil in the 3rd sub-member of the Triassic Chang 7 member in Binchang block, southwestern Ordos Basin. Oil Gas Geol. 2019, 40, 451–458. [Google Scholar]
  3. Zou, C.N.; Yang, Z.; Cui, J.W.; Zhu, R.K.; Hou, L.H.; Tao, S.Z.; Yuan, X.J.; Wu, S.T.; Lin, S.H.; Wang, L.; et al. Formation mechanism, geological characteristics and development strategy of nonmarine shale oil in China. Pet. Explor. Dev. 2013, 40, 15–27. [Google Scholar] [CrossRef]
  4. Zhang, Y.; Di, Y.; Shi, Y.; Hu, J.H. Cyclic CH4 injection for enhanced oil recovery in the Eagle Ford shale reservoirs. Energies 2018, 11, 3094. [Google Scholar] [CrossRef]
  5. Wang, M.; Guo, Z.Q.; Jiao, C.X.; Lu, S.F.; Li, J.B.; Xue, H.T.; Li, J.J.; Li, J.Q.; Chen, G.H. Exploration progress and geochemical features of lacustrine shale oils in China. J. Pet. Sci. Eng. 2019, 178, 975–986. [Google Scholar] [CrossRef]
  6. Zou, C.N. Unconventional Petroleum Geology; Geological Publishing House: Beijing, China, 2014; ISBN 978-7-116-08864-1. [Google Scholar]
  7. Yang, Z.; Zou, C.N.; Wu, S.T.; Lin, S.H.; Pan, S.Q.; Niu, X.B.; Men, G.T.; Tang, Z.X.; Li, G.H.; Zhao, J.H.; et al. Formation, distribution and resource potential of the “sweet areas (sections)” of continental shale oil in China. Mar. Pet. Geol. 2019, 102, 48–60. [Google Scholar]
  8. Wang, M.; Sherwood, N.; Li, Z.S.; Lu, S.F.; Wang, W.G.; Huang, A.H.; Peng, J.; Lu, K. Shale oil occurring between salt intervals in the Dongpu Depression, Bohai Bay Basin, China. Int. J. Coal Geol. 2015, 152, 100–112. [Google Scholar] [CrossRef]
  9. Yin, S.L.; Chen, Y.K.; Wu, X.J. Different pore structure modalities in sandy conglomerate reservoirs and their forming mechanisms. Arab. J. Geosci. 2018, 11, 654. [Google Scholar] [CrossRef]
  10. Chalmers, G.R.; Bustin, R.M.; Power, I.M. Characterization of gas shale pore systems by porosimetry, pycnometry, surface area, and field emission scanning electron microscopy/transmission electron microscopy image analyses: Examples from the Barnett, Woodford, Haynesville, Marcellus, and Doig units. AAPG Bull. 2012, 96, 1099–1119. [Google Scholar]
  11. Wang, Z.L. Transmission electron microscopy of shape-controlled nanocrystals and their assemblies. J. Phys. Chem. B 2000, 104, 1153–1175. [Google Scholar] [CrossRef]
  12. Wang, X.; Hou, J.; Liu, Y.; Zhao, P.; Ma, K.; Wang, D.; Ren, X.; Yan, L. Overall PSD and fractal characteristics of tight oil reservoirs: A case study of Lucaogou Formation in Junggar Basin, China. Fractals 2019, 27, 1940005. [Google Scholar] [CrossRef]
  13. Gao, H.; Cao, J.; Wang, C.; He, M.Q.; Dou, L.B.; Huang, X.; Li, T.T. Comprehensive characterization of pore and throat system for tight sandstone reservoirs and associated permeability determination method using SEM, rate-controlled mercury and high pressure mercury. J. Pet. Sci. Eng. 2019, 174, 514–524. [Google Scholar] [CrossRef]
  14. Bai, B.; Zhu, R.; Wu, S.; Yang, W.; Gelb, J.; Gu, A.; Zhang, X.; Su, L. Multi-scale method of Nano (Micro)-CT study on microscopic pore structure of tight sandstone of Yanchang Formation, Ordos Basin. Pet. Explor. Dev. 2013, 40, 354–358. [Google Scholar] [CrossRef]
  15. Luo, S.; Lutkenhaus, J.L.; Nasrabadi, H. Multiscale fluid-phase-behavior simulation in shale reservoirs using a pore-size-dependent equation of state. In Proceedings of the SPE Annual Technical Conference and Exhibition, San Antonio, TX, USA, 9–11 October 2017; pp. 806–820. [Google Scholar]
  16. Wang, Y.Z.; Yuan, Y.D.; Rahman, S.S.; Arns, C. Semi-quantitative multiscale modelling and flow simulation in a nanoscale porous system of shale. Fuel 2018, 234, 1181–1192. [Google Scholar] [CrossRef]
  17. Wang, Y.; Wu, C.F.; Zhu, Y.M.; Chen, S.B.; Liu, S.M.; Zhang, R. Morphology and fractal characterization of multiscale pore structures for organic-rich lacustrine shale reservoirs. Fractals 2018, 26, 1840013. [Google Scholar] [CrossRef]
  18. Yang, H.; Niu, X.B.; Xu, L.M.; Feng, S.B.; You, Y.; Liang, X.W.; Wang, F.; Zhang, D.D. Exploration potential of shale oil in Chang7 Member, Upper Triassic Yanchang Formation, Ordos Basin, NW China. Pet. Explor. Dev. 2016, 43, 560–569. [Google Scholar] [CrossRef]
  19. Fan, B.J. Oil reserves of Chang 7 Shale, Triassic Yanchang Formation, Ordos Basin. Pet. Sci. Technol. 2017, 35, 789–794. [Google Scholar]
  20. Cui, J.W.; Zhu, R.K.; Luo, Z.; Li, S. Sedimentary and geochemical characteristics of the Triassic Chang 7 Member shale in the Southeastern Ordos Basin, Central China. Pet. Sci. 2019, 16, 285–297. [Google Scholar] [CrossRef] [Green Version]
  21. Cao, H.S.; Shan, X.L.; Sun, P.C.; Chi, H.Z.; Du, S. Geochemical characteristics of oil shale in the Triassic Chang7 subsection, southern Ordos basin, China, and palaeo-environment reconstruction. Neues Jahrbuch für Mineralogie-Abhandlungen 2016, 193, 45–57. [Google Scholar] [CrossRef]
  22. Xu, Z.J.; Liu, L.F.; Liu, B.J.M.; Wang, T.G.; Zhang, Z.H.; Wu, K.J.; Feng, C.Y.; Dou, W.C.; Wang, Y.; Shu, Y. Geochemical characteristics of the Triassic Chang 7 lacustrine source rocks, Ordos Basin, China: Implications for paleoenvironment, petroleum potential and tight oil occurrence. J. Asian. Earth. Sci. 2019, 178, 112–138. [Google Scholar] [CrossRef]
  23. Chen, G.; Gang, W.Z.; Liu, Y.Z.; Wang, N.; Guo, Y.; Zhu, C.Z.; Cao, Q.Y. High-resolution sediment accumulation rate determined by cyclostratigraphy and its impact on the organic matter abundance of the hydrocarbon source rock in the Yanchang Formation, Ordos Basin, China. Mar. Pet. Geol. 2019, 103, 1–11. [Google Scholar] [CrossRef]
  24. Yuan, W.; Liu, G.D.; Xu, L.M.; Niu, X.B.; Li, C.Z. Petrographic and geochemical characteristics of organic-rich shale and tuff of the Upper Triassic Yanchang Formation, Ordos Basin, China: Implications for lacustrine fertilization by volcanic ash. Can. J. Earth Sci. 2019, 56, 47–59. [Google Scholar] [CrossRef]
  25. Fan, B.J.; Shi, L. Deep-lacustrine shale heterogeneity and its impact on hydrocarbon generation, expulsion, and retention: A case study from the upper triassic Yanchang formation, Ordos Basin, China. Nat. Resour. Res. 2019, 28, 241–257. [Google Scholar] [CrossRef]
  26. Chen, Y.H.; Zhu, Z.W.; Zhang, L. Control actions of sedimentary environments and sedimentation rates on lacustrine oil shale distribution, an example of the oil shale in the Upper Triassic Yanchang Formation, southeastern Ordos Basin (NW China). Mar. Pet. Geol. 2019, 102, 508–520. [Google Scholar] [CrossRef]
  27. Sun, N.Q.; Pan, J.; Zhou, S.B.; Jiao, C.B. Characteristics of faults and their significance in controlling the oil accumulations in Honghe field, Ordos Basin. Interpretation 2019, 7, T195–T206. [Google Scholar] [CrossRef]
  28. Han, H.; Pang, P.; Li, Z.L.; Shi, P.T.; Guo, C.; Liu, Y.; Chen, S.J.; Lu, J.G.; Gao, Y. Controls of organic and inorganic compositions on pore structure of lacustrine shales of Chang 7 member from Triassic Yanchang Formation in the Ordos Basin, China. Mar. Pet. Geol. 2019, 100, 270–284. [Google Scholar] [CrossRef]
  29. Li, D.L.; Li, R.X.; Xue, T.; Wang, B.P.; Liu, F.T.; Zhao, B.S.; Zhao, D. Characteristic and Geological Implications of Major Elements and Rare Earth Elements of Triassic Chang 7 Oil Shale in Tongchuan City, Southern Ordos Basin (China). Minerals 2018, 8, 157. [Google Scholar] [CrossRef]
  30. Li, D.L.; Li, R.X.; Zhu, Z.W.; Wu, X.L.; Zhao, B.S.; Cheng, J.H.; Liu, F.T. Rare earth elements geochemistry characteristics and their geological implications of lacustrine oil shale from Chang 7 oil layer in southern Ordos Basin, China. Geol. J. 2017, 52, 119–131. [Google Scholar] [CrossRef]
  31. Tan, F.Q.; Zhao, R.; Zhao, Y.Y.; Pan, Z.J.; Li, H.Q. A case study: Evaluating low-porosity and ultra-low-permeability Triassic reservoir rocks in the Ordos Basin by the integration of logs and core. Pet. Geosci. 2017, 23, 454–465. [Google Scholar] [CrossRef]
  32. Li, G.Z.; Qin, Y.; Wu, M.; Zhang, B.; Wu, X.; Tong, G.C.; Liu, J.B. The pore structure of the transitional shale in the Taiyuan formation, Linxing area, Ordos Basin. J. Pet. Sci. Eng. 2019, 181, 975–986. [Google Scholar] [CrossRef]
  33. Liu, K.Q.; Cheng, X.W.; Zhang, C.; Gao, X.S.; Zhuang, J.; Guo, X.Y. Evolution of pore structure of oil well cement slurry in suspension-solid transition stage. Constr. Build Mater. 2019, 214, 382–398. [Google Scholar] [CrossRef]
  34. Xu, Z.H.; Zhao, P.Q.; Wang, Z.L.; Ostadhassan, M.; Pan, Z.H. Characterization and Consecutive Prediction of Pore Structures in Tight Oil Reservoirs. Energies 2018, 11, 2705. [Google Scholar] [CrossRef]
  35. Huang, Z.K.; Liu, Q.Y.; Li, M.W.; Chen, J.P.; Li, P.; Zhang, R. Hydrocarbon expulsion efficiency and oil-bearing property of the shale systemin Chang 7 Member, Ordos Basin. Oil Gas Geol. 2018, 39, 513–521. [Google Scholar]
  36. Fan, X.Y.; Zhao, P.F.; Zhang, Q.G.; Zhang, T.; Zhu, K.; Zhou, C.H. A polymer plugging gel for the fractured strata and its application. Materials 2018, 11, 856. [Google Scholar] [CrossRef]
  37. Khodja, M.; Canselier, J.P.; Bergaya, F.; Fourar, K.; Khodja, M.; Cohaut, N.; Benmounah, A. Shale problems and water-based drilling fluid optimisation in the Hassi Messaoud Algerian oil field. Appl. Clay Sci. 2010, 49, 383–393. [Google Scholar] [CrossRef] [Green Version]
  38. Yu, L.; Ding, B.X.; Dong, M.Z.; Jiang, Q. Plugging ability of oil-in-water emulsions in porous media: Experimental and modeling study. Ind. Eng. Chem. Res. 2018, 57, 14795–14808. [Google Scholar] [CrossRef]
  39. Zolfaghari, A.; Dehghanpour, H.; Holyk, J. Water sorption behaviour of gas shales: I. Role of clays. Int. J. Coal Geol. 2017, 179, 130–138. [Google Scholar] [CrossRef]
  40. Borysenko, A.; Clennell, B.; Sedev, R.; Burgar, I.; Ralston, J.; Raven, M.; Dewhurst, D.; Liu, K.Y. Experimental investigations of the wettability of clays and shales. J. Geophys. Res. Solid Earth 2009, 114. [Google Scholar] [CrossRef]
  41. Feng, D.; Li, X.F.; Wang, X.Z.; Li, J.; Sun, F.R.; Sun, Z.; Zhang, T.; Li, P.H.; Chen, Y.; Zhang, X. Water adsorption and its impact on the pore structure characteristics of shale clay. Appl. Clay Sci. 2018, 115, 126–138. [Google Scholar] [CrossRef]
  42. Voorn, M.; Exner, U.; Barnhoorn, A.; Baud, P.; Reuschle, T. Porosity, permeability and 3D fracture network characterisation of dolomite reservoir rock samples. J. Pet. Sci. Eng. 2015, 127, 270–285. [Google Scholar] [CrossRef]
  43. Luquot, L.; Gouze, P. Experimental determination of porosity and permeability changes induced by injection of CO2 into carbonate rocks. Chem. Geol. 2009, 265, 148–159. [Google Scholar] [CrossRef]
  44. Mastalerz, M.; He, L.L.; Melnichenko, Y.B.; Rupp, J.A. Porosity of coal and shale: Insights from gas adsorption and SANS/USANS techniques. Energy Fuels 2012, 26, 5109–5120. [Google Scholar] [CrossRef]
  45. Wang, F.Y.; Yang, K.; You, J.X.; Lei, X.J. Analysis of pore size distribution and fractal dimension in tight sandstone with mercury intrusion porosimetry. Results Phys. 2019, 13, 102283. [Google Scholar] [CrossRef]
  46. Labani, M.M.; Rezaee, R.; Saeedi, A.; Al Hinai, A. Evaluation of pore size spectrum of gas shale reservoirs using low pressure nitrogen adsorption, gas expansion and mercury porosimetry: A case study from the Perth and Canning Basins, Western Australia. J. Pet. Sci. Eng. 2013, 112, 7–16. [Google Scholar] [CrossRef]
  47. Sheng, G.L.; Javadpour, F.; Su, Y.L. Dynamic porosity and apparent permeability in porous organic matter of shale gas reservoirs. Fuel 2019, 251, 341–351. [Google Scholar] [CrossRef]
  48. Shi, J.T.; Sun, Z.; Wu, K.L.; Wang, K.; Huang, L.; Liu, W.Y.; Li, X.F. Effect of pore shape on nanoconfined gas flow behavior: Implication for characterizing permeability of realistic shale matrix. Ind. Eng. Chem. Res. 2019, 58, 8835–8846. [Google Scholar] [CrossRef]
  49. Wang, R.Y.; Ding, W.L.; Zhang, Y.Q.; Wang, Z.; Wang, X.H.; He, J.H.; Zeng, W.T.; Dai, P. Analysis of developmental characteristics and dominant factors of fractures in Lower Cambrian marine shale reservoirs: A case study of Niutitang formation in Cen’gong block, southern China. J. Pet. Sci. Eng. 2016, 138, 31–49. [Google Scholar] [CrossRef]
  50. Fang, S.X.; He, J.; Hou, F.H.; Yang, X.Y.; Qiao, L.; Fu, S.; Yao, J.L.; Wu, Z.; Yan, R.H.; Xu, L.M. Reservoirs pore space types and evolution in M-5(5) to M-5(1) submembers of Majiagou Formation of Middle Ordovician in central gasfield area of Ordos basin. Acta Petrol. Sin. 2009, 25, 2425–2441. [Google Scholar]
  51. Zhu, H.H.; Zhong, D.K.; Yao, J.L.; Sun, H.T.; Niu, X.B.; Liang, X.W.; You, Y.; Li, X. Alkaline diagenesis and its effects on reservoir porosity: A case study of Upper Triassic Chang 7 Member tight sandstone in Ordos Basin, NW China. Pet. Explor. Dev. 2015, 42, 56–65. [Google Scholar] [CrossRef]
  52. Tang, X.; Zhu, Y.M.; Liu, Y. Investigation of shale nano-pore characteristics by scanning electron microscope and low-pressure nitrogen adsorption. J. Nanosci. Nanotechnol. 2017, 17, 6252–6261. [Google Scholar] [CrossRef]
  53. Ambrose, R.J.; Hartman, R.C.; Diaz-Campos, M.; Akkutlu, I.Y.; Sondergeld, C.H. Shale gas-in-place calculations part I: New pore-scale considerations. SPE J. 2012, 17, 219–229. [Google Scholar] [CrossRef]
  54. Bultreys, T.; De Boever, W.; Cnudde, V. Imaging and image-based fluid transport modeling at the pore scale in geological materials: A practical introduction to the current state-of-the-art. Earth-Sci. Rev. 2016, 155, 93–128. [Google Scholar] [CrossRef]
Figure 1. Downhole full diameter core: (a) tuff interbeds and oil spots in shale; (b) siltstone interbeds and bedded microcracks in shale; (c) irregular structural cracks and oil spots in tuff.
Energies 12 03932 g001
Figure 2. Master Sizer 2000 laser particle-size analyzer.
Energies 12 03932 g002
Figure 3. X’Pert Pro X-ray diffraction analyzer.
Energies 12 03932 g003
Figure 4. (a) HEP-P porosity tester; (b) experimental principle and operating interface.
Energies 12 03932 g004
Figure 5. Mercury porosimetry test instrument and operating environment.
Energies 12 03932 g005
Figure 6. Gasperm permeameter.
Energies 12 03932 g006
Figure 7. (a) slices of round rock castings with diameter of 2 cm; (b) the bigger square rock casting sheet can show the complete rock structure more clearly; (c) DM2700P microscope.
Energies 12 03932 g007
Figure 8. FEI Quanta 650 FEG field emission scanning electron microscope.
Energies 12 03932 g008
Figure 9. B1 well mineral composition curve with depth.
Energies 12 03932 g009
Figure 10. Non-penetrating cracks in the sample, which provide little permeability in the axial direction.
Energies 12 03932 g010
Figure 11. (a) the relationship between porosity and soaking time; (b) the relationship between normalized porosity and normalized soaking time.
Energies 12 03932 g011
Figure 12. (a) Relation diagram of pores with soaking time in shale; (b) relation diagram of pores with soaking time in tuff.
Energies 12 03932 g012
Figure 13. Cast slices. (a) Bedded reticulated cracks that developed in the argillaceous layer; (b) tuffaceous lamina; (c) tuffaceous debris and dissolved pore; (d) organic bioclasts.
Energies 12 03932 g013
Figure 14. Cracks under scanning electron microscopy. (a) the distribution and arrangement of minerals are consistent with the direction of bedding; (b) cracks developed in parallel bedding directions; (c) corrosion cracks, 800–3000 nm; (d) edge cracks of organic matter and minerals, 500–600 nm; (e) edge cracks of minerals, 1–2 μm; (f) internal cracks of minerals, 400–600 nm.
Energies 12 03932 g014
Figure 15. Porosity under scanning electron microscopy. (a) Intergranular dissolved pore, 2–10 μm; (b) intergranular dissolved pore in quartz, 400–850 nm; (c) intercrystalline pore, 400–1000 nm; (d) organic pore, 80–250 nm.
Energies 12 03932 g015
Figure 16. Particle size distribution of drilling fluid.
Energies 12 03932 g016
Figure 17. Scanning electron microscopy photographs after soaking in water; (a) and (b) water soaking results in lower cementation strength of minerals on rock surface and the shedding of mineral particles, resulting in cracks; (c) and (d) rock layers and expansion of cracks after water soaking.
Energies 12 03932 g017
Figure 18. Scanning electron microscopy photographs after soaking in WBM-SL; (a) and (b) plugging of pores and cracks by solid particles and soil powder; (c) and (d) protective mud layer on the rock, some protective layers split or fell off because of the drying treatment.
Energies 12 03932 g018
Table 1. Experimental results of clay composition.
No.LithologyDepth
(m)
Clay Mineral Content (%)Percentage of Smectite Layers in Interstratified Illite/Smectite (%)
IlliteKaoliniteChloriteIllite/Smectite Mixed Layer
1Shale1434.626.924.510.538.135
21436.729.128.111.431.435
31439.534.825.412.127.735
41440.134.630.5034.930
51442.330.327.7042.030
61444.232.431.2036.425
7Tuff1447.533.0024.642.425
81448.529.1025.745.225
91449.634.5022.942.625
101450.533.4025.441.220
Table 2. Porosity and permeability.
No.LithologyDepth (m)Density (g/cc)Porosity (%)Permeability (mD)K/Φ (mD/%)
1Shale1434.62.370.660.220.33
21436.72.531.658.715.28
31439.52.310.311.254.03
41440.12.290.882.272.58
51442.32.5610.792.690.25
6Tuff1446.52.428.421.510.18
71447.52.680.210.643.05
81448.52.710.912.442.68
91449.62.571.991.980.99
101450.55.642.362.100.89
Table 3. Mercury porosimetry test sample information.
No.LithologyDepth (m)Density (g/cm3)Mass (g)Soaking EnvironmentSoaking Time (h)Maximum Mercury Intake (cc)
1Shale1436.72.531.696Non00.024551
21.401Water60.023511
31.367Water120.023418
41.371Water240.052754
51.122Water480.043689
6Tuff1449.62.570.983Non00.014004
70.889Water60.022914
81.017Water120.026382
90.854Water240.028782
100.957Water480.032433

