Article

A Hydraulic Model for Multiphase Flow Based on the Drift Flux Model in Managed Pressure Drilling

State Key Laboratory of Oil and Gas Reservoir Geology and Exploitation, Southwest Petroleum University, Chengdu 610500, China
*
Author to whom correspondence should be addressed.
Energies 2019, 12(20), 3930; https://doi.org/10.3390/en12203930
Submission received: 30 July 2019 / Revised: 11 October 2019 / Accepted: 14 October 2019 / Published: 16 October 2019
(This article belongs to the Special Issue Drilling Technologies for the Next Generations)

Abstract

:
Managed pressure drilling (MPD) is a drilling technique used to address the narrow density window under complex geological environments. It has widespread applications in the exploration and exploitation of oil and gas, both onshore and offshore. In this study, to achieve effective control of the downhole pressure to ensure safety, a gas–liquid two-phase flow model based on the drift flux model is developed to describe the characteristics of transient multiphase flow in the wellbore. The advection upwind splitting method (AUSM) numerical scheme is used to assist with calculation and analysis, and the monotonic upwind scheme for conservation laws (MUSCLs) technique with second-order precision is adopted in combination with the Van Leer slope limiter to improve precision. Relevant data sourced from prior literature are used to validate the suggested model, the results of which reveal an excellent statistical consistency. Further, the influences of various parameters in a field application, including backpressure, density, and mass flow, are analyzed. Over the course of later-stage drilling, a combination of wellhead backpressure and displacement is recommended to exercise control.

1. Introduction

In the oil and gas industry, the continuously increasing demand for underground resources has led to a shift in the focus on exploration and exploitation to deep or ultra-deep reservoirs. Due to the complicated geological conditions of these reservoirs, drilling technology aimed at creating a wellbore to reach the gas or oil reservoir encounters a multitude of challenges, particularly within narrow pore-fracture pressure windows [1,2]. Over the course of drilling, incidents occur frequently and cause various disadvantages, such as longer drilling times, higher costs, and vast risks. Conventional drilling is incapable of addressing these issues, and advanced technology-managed pressure drilling (MPD) is proposed as an alternative, which is useful for resolving complicated situations such as leakage, gas-kick, collapse, and trapping within a narrow density window through reducing the non-productive time and avoiding incidents [3,4]. Regarding offshore drilling, MPD shows remarkable advantages in coping with complex situations and has been widely used in drilling engineering, considering the continued exploration of challenging reservoirs [5,6]. Moreover, for the drilling and production of natural gas hydrate, MPD also creates incomparable advantages, including precise monitoring and control of pressure, avoidable formation damage and unwanted fractures, and rare gas kick and lost circulation [7,8].
Managing annular pressure in wellbores is considered a challenging task, as flow materials are likely to contain mud, oil, gas, and cuttings [9]. Typically, a gas–liquid two-phase flow is included in MPD with the homogeneous flow model (HFM), two-fluid model (TFM), and drift flow model (DFM). The HFM is incapable of ensuring accuracy in reflecting the flow characteristics of each phase, and its calculation accuracy is less than satisfactory; thus, it is rarely applied nowadays. A four-dimensional hypercube has been suggested to describe gas–liquid two-phase flow, and a set of hyperbolic partial differential equations (PDEs) can be derived [10,11]. Of these, the most complicated is the high-fidelity model, which has the capability of describing how physical variables (momentum, mass, and energy) are transmitted and meet the requirements of the thermodynamic equilibrium equation [12,13,14,15]. Despite this, these models are highly complicated to solve, and it is possible that the calculation process does not converge enough to use high-order numerical schemes. Therefore, the simplified DFM was first suggested by Zuber and Findlay [16] and was subsequently improved by Ishii [17]. In the DFM, mass conservation of the gas–liquid two-phase is taken into consideration separately, and the interactions occurring between the two phases are discounted. Relative to the TFM, the DFM demonstrates various advantages such as having a simple form and less computation; thus, it has been commonly applied in the theoretical research process [18,19,20]. In order to enhance its accuracy, the majority of the following studies concentrated on the empirical parameters of this constitutive relationship. In fact, the calculation process remains complicated to some extent. In addition, there are many more simplified equations that have been derived for application under different scenarios, including early gas-kick detection and parameter estimation [21,22,23,24]. However, these models give no consideration to how the characteristics of various parameters, which are primarily used for automation and are not suited to fine MPD, are distributed in the wellbore. Figure 1 shows the relation between the models [11].
Concerning the DFM, accuracy and efficiency are crucial for the mathematical algorithm. The DFM is a typical hyperbolic equation that can be solved using the finite volume method. The Godunov and Roe schemes have been suggested to solve the DFM, but they depend on algebraic Riemann solvers or analytic Jacobian matrices of conservation equations [25,26]. A new pressure-based method was developed to address the convergence problem of the drift flux model by Wang [27]. Among the different schemes, it has been confirmed that the advection upwind splitting method (AUSM) schemes are effective solutions to the DFM in terms of their simplicity, accuracy, and robustness [28,29,30]. Not only do these schemes display accuracy in flux difference splitting (FDS) in the boundary layer, they also exhibit robustness in flux vector splitting (FVS) when capturing strong discontinuity. AUSM schemes are relatively late in performing the calculation of gas–liquid two-phase flow, and nearly all of them were studied after the year 2000. Niu [31] applied the AUSM based on flux difference (AUSMD) scheme to solve the flow model of seven equations. Nevertheless, it was discovered that Niu’s method was susceptible to numerical oscillation. Subsequently, Paillère et al. [32] achieved success in applying AUSM+ to solve the TFM of six equations. Evje et al. [28,33] also used the AUSM+ and AUSM based on flux vector (AUSMV) methods on a flow model of four equations and a drift flux model of three equations. Moreover, this method is applicable to engineering computing in drilling [34,35].
According to a general drift flux model of compressed gas–liquid two-phase flow, a model to describe the transient flow dynamics in the wellbore for the MPD is established in this paper. Pressure variations of the throttle valve at the wellhead and flow change resulting from the pressure difference at the bottom hole are considered as well. The governing equation of the DFM is numerically solved by the AUSM scheme with a second-order spatial accuracy and Van Leer slope limiter. The data obtained from published papers are used to validate the established model. In addition, a field application case is researched to support data analysis to make operation decisions.

2. Mathematical Model

2.1. Governing Equations

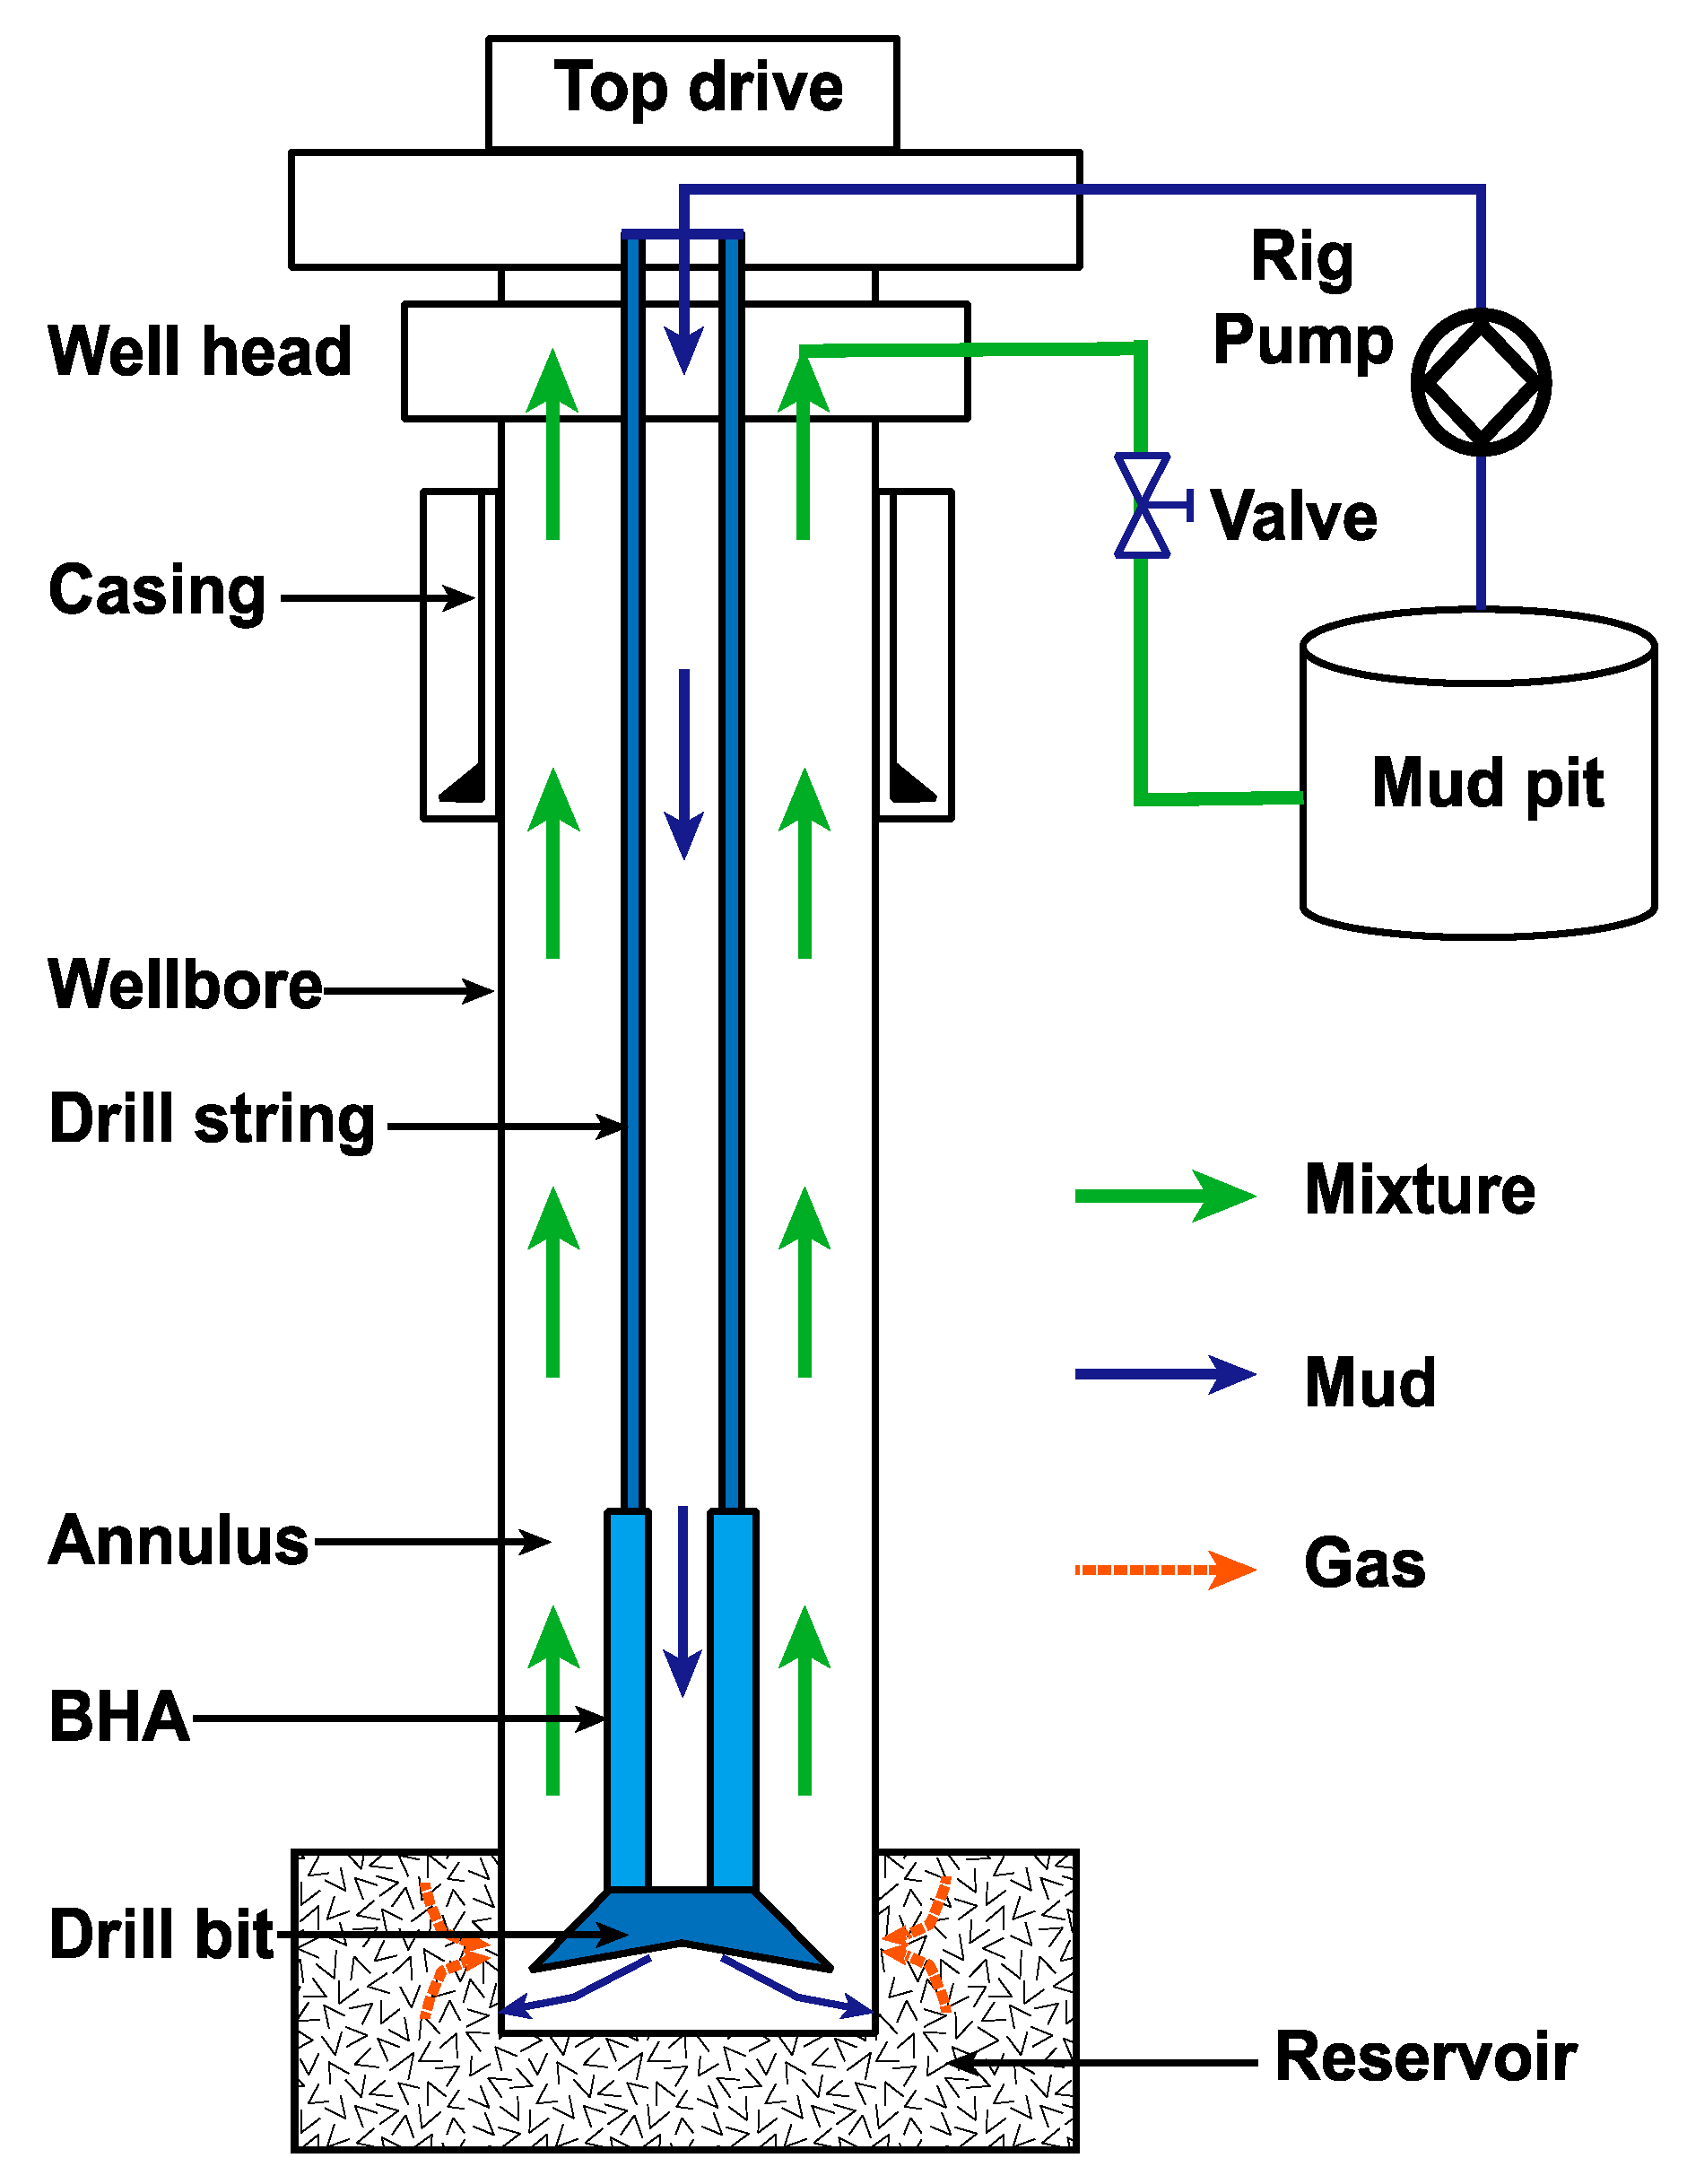
The typical hydraulic cycle used in the process of MPD is shown in Figure 2. The mud from the rig pump flows into the drill pipe through the surface equipment and riser, and flows through the bit nozzle at the bottom of the drill pipe. Then it enters the annular space and flows upward. After reaching the surface, it is processed by the solids control equipment and returns to the mud pit, then enters the rig pump again. The hydraulic model is the basis of the design and calculation of pressure control. MPD requires a real-time estimate based on the measured data, and it inputs the calculated results into the control system to achieve automatic control. It is costly to use pressure while drilling (PWD) tools to measure the downhole pressure, so the hydraulic model is of great significance. Additionally, even in the case of PWD, the hydraulic model is an essential auxiliary analytical tool.
As discussed in the previous section, the DFM is primarily a simplification of high-fidelity models using a complex conservation equation. In DFM, a mixture momentum equation is adopted rather than using an isolated equation for each phase. To achieve a high level of precision, some closure relations are applied into the equations. The basic DFM includes two conservation equations for the gas and liquid and a mixture momentum equation [28]:
t ( ρ l α l ρ g α g ρ g α g v g + ρ l α l v l ) + x ( ρ l α l v l ρ g α g v g ρ g α g v g 2 + ρ l α l v l 2 + p ) ) = ( 0 0 F G F f )
Equation (1) can be written in vector form:
u t + F ( u ) x = Q ( u )
where:
u = ( ρ l α l ρ g α g ρ g α g v g + ρ l α l v l ) ,   F ( u ) = ( ρ l α l v l ρ g α g v g ρ g α g v g 2 + ρ l α l v l 2 + p ) ,   Q ( u ) = ( 0 0 F G F f )
where ρ, p, and υ are the density, pressure, and velocity. α is the volume fraction. The subscripts l and g denote the liquid and gas phases, respectively.
FG represents the gravity term:
F G = g ( α l ρ l + α g ρ g ) cos θ
Ff is the friction term:
F f = 2 f m ρ m v m | v m | D d
where:
ρ m = α l ρ l + α g ρ g
v m = α l v l + α g v g
fm can be calculated by [26]:
f m = { 16 Re m if   Re m 2400 1 [ 4 log ( Δ / ( D d ) 3.7065 5.0452 Re m log Λ ) ] 2 if   Re m 2400
Λ = [ Δ / ( D d ) ] 1.1098 2.8257 + ( 7.149 Re m ) 0.8981
Re m = ρ m v m ( D d ) μ m
where D and d denote the outer diameter and inner diameter of the annulus, respectively. Re is the Reynolds number; and μm is the viscosity.

2.2. Closure Equations

For a constant mass flow, the following equations must be satisfied [20]:
ρ a = ( ρ + d ρ ) ( a + d a )
ρ a = ρ a + a d ρ + ρ d a + d ρ d a
a is the speed of sound in the fluid.
Neglect the last term:
a = ρ d a d ρ
Similarly, for the momentum:
p + ρ a 2 = ( p + d p ) + ( ρ + d ρ ) ( a + d a ) 2
d a = d p + a 2 d ρ 2 a ρ
a = ρ d p + a 2 d ρ 2 a ρ d ρ
a = d p 2 a d ρ + a 2
a 2 = ( d p d ρ )
Therefore, the density of the liquid is described as:
ρ l = ρ l , 0 + p p l , 0 a l 2
Similarly,
ρ g = p a g 2
The following relationship is satisfied:
α g + α l = 1
In addition, the slip velocity equation proposed by Zuber and Findlay [16] is represented by
v g = C 0 v m + v t
where C0 is the distribution parameter and υt is the gas drift velocity.

2.3. Shi Slip Relation

In this research, a Shi slip relation was adopted, which can be found in [36]:
v t = ( 1 C 0 α g ) V c K ( α g , K u , C 0 ) m ( ϕ ) C 0 α g ρ g ρ + 1 C 0 α g
where:
K = { 1.53 / C 0   if   α g a 1 1.53 C 0 + C 0 K u 1.53 2 C 0 [ 1 cos ( π α g a 1 a 2 a 1 ) ]   if   a 1 < α g a 2 K u   if   α g > a 2
with a1 = 0.2 and a2 = 0.4.
Ku is the critical Kutateladze number:
K u = [ C K u N B ( 1 + N B C K u 2 C w 1 ) ] 1 / 2
where C K u and Cw denote the fitted parameters, which are set to 142 and 0.008, respectively.
NB is the Bond number:
N B = [ g ( ρ l ρ g ) σ g l ] ( D d ) 2
where σgl is the gas–liquid interfacial tension.
Vc is the characteristic velocity:
V c = ( σ g l g ( ρ l ρ g ) ρ l 2 ) 1 / 4
The distribution parameter C0 can be determined by:
C 0 = C max 1 + ( C max 1 ) γ 2
Cmax represents the value of the gas distribution parameter, which is usually set to 1.2.
γ is calculated by:
γ = β B 1 B
where:
β = max ( α g , F v α g | v m | v s g f )
where Fυ is a multiplier of the flooding velocity fraction that defaults to 1.0.
v s g f = V c K u ( ρ l ρ g ) 1 / 2
The above relation is based on the derivation of the vertical flow. In an inclined pipe, the terminal rise velocity can be indicated as follows:
V θ = V m ( θ )
where θ is the angle of deviation and m is the drift velocity multiplier.
m(θ) represents the influence of the wellborn inclination:
m ( θ ) = m 0 ( cos θ ) n 1 ( 1 + sin θ ) n 2
For the water–gas flow, m0 = 1.28, n1 = 0.5, n2 = 1.7 (θ < 88°). When 88°≤ θ ≤ 90°, the relation has a large deviation for horizontal wells.

2.4. Primitive Variables

Equation (1) can be expressed as:
t [ u 1 u 2 u 3 ] + x [ v l u 1 v g u 2 v l 2 u 1 + v g 2 u 2 + p ( u 1 , u 2 ) ] = [ 0 0 F G F f ]
where u 1 = α l ρ l , u 2 = α g ρ g and u 3 = α l ρ l v l + α g ρ g v g .
Equation (21) can be expressed in terms of u1 and u2:
u 1 ρ l + u 2 ρ g = 1
Substitute Equations (19) and (20) into Equation (35):
u 1 ρ l , 0 + p p l , 0 a l 2 + u 2 a g 2 p = 1
It can be obtained by simple transformation:
p 2 + B p + C = 0
where:
B = a l 2 ( ρ l , 0 p l , 0 a l 2 u 1 ( a g a l ) 2 u 2 )
C = u 2 ( a g a l ) 2 ( p l , 0 a l 2 ρ l , 0 )
The pressure is then given by:
p ( u 1 , u 2 ) = B + B 2 4 C 2
The volume fractions are determined as:
α l = u 1 ρ l
α g = u 2 ρ g
One can get the following equation by Equation (34):
u 1 v l + u 2 v g = u 3
According to Equation (22):
C o α l v l + ( 1 C o α g ) v g = v t
A system of linear equations from Equations (43) and (44) can be expressed in matrix form:
( u 1 u 2 w 1 w 2 ) ( v l v g ) = ( u 3 v t )
Hence, we can get expressions for υl and υg:
v l = u 3 w 2 u 2 v d u 1 w 2 u 2 w 1 u 3 ( 1 C o α g ) u 2 v d u 1 ( 1 C o α g ) + u 2 C o α l
v g = u 1 v d u 3 w 1 u 1 w 2 u 2 w 1 u 1 v d + u 3 C o α l u 1 ( 1 C o α g ) + u 2 C o α l

2.5. Boundary Conditions

At the inlet, the convective flux is determined by the flow of the gas and liquid. The pressure flux can be obtained by extrapolation:
P   i n l e t   = p ( 1 ) 0.5 ( p ( 1 ) p ( 2 ) )
It is necessary to analyze the two operating conditions of a shut-in and open well at the outlet boundary. During shut-in, the flow rates of gas and liquids at the wellhead are zero, and then the convective flux is zero. The pressure flux can be calculated as:
P   o u t l e t   = p ( N ) + 0.5 ( p ( N ) p ( N 1 ) )
While the well is open, the convective flux can be dealt with using the original variables at the outlet (velocity, density, volume fraction). The pressure flux is equal to the ground backpressure.
The two-phase flow in the choke valve can be represented as [20]:
ρ l v l α l ρ l + ρ g v g α g γ ρ g = K c z c 2 ρ a ( P   c h o k e   P a t m )
where Kc is the valve discharge coefficient, zc is the choke valve opening index, and γ is the gas expansion factor. Pchoke and Patm represent the pressure of the choke and the atmosphere, respectively.
The inflow rate resulting from the pressure difference between the reservoir and the bottom hole can be expressed as:
p r 2 p w f 2 = A q + B q 2
Pr and Pwf are the reservoir pressure and bottom-hole pressure, respectively. q is the inflow rate. A and B are regression coefficients, which are mainly determined by the reservoir.

3. Numerical Scheme

3.1. Advection Upwind Splitting Method Scheme

The flux at the cell interface is composed of the convective flux and pressure flux, which can be represented as [26,31]:
F ( u ) j + 1 / 2 = ( F l c + F g c + F p ) j + 1 / 2
F l c and F g c represent the liquid and gas phase convective flux, respectively, and F p represents the pressure flux.
For the convective terms:
F g c = ( α g ρ g ) Ψ g ± = ( α g ρ g ) L Ψ g L + + ( α g ρ g ) R Ψ g R
F l c = ( α l ρ l ) Ψ l ± = ( α l ρ k ) L Ψ l L + + ( α l ρ l ) R Ψ l R
where Ψ is the speed function, l and g are liquid and gas phases, respectively, and L and R represent left and right cells, respectively.
Ψ g L + = V ¯ + ( 0 1 v ) T , Ψ l L + = V ¯ + ( 1 0 v ) T
Ψ g R = V ¯ ( 0 1 v ) T , Ψ l R = V ¯ ( 1 0 v ) T
where:
V ¯ ± ( v , c , χ ) = { χ V ± ( v , c ) + ( 1 χ ) v ± | v | 2   if   | v | c v ± | v | 2   otherwise
χ is the weight coefficient and can be expressed as:
χ L = 2 ( ρ / α ) L ( ρ / α ) L + ( ρ / α ) R
χ R = 2 ( ρ / α ) R ( ρ / α ) L + ( ρ / α ) R
V ± ( v , c ) = { ± 1 4 c ( v ± c ) 2 | v | c 1 2 ( v ± | v | ) | v | > c
where v is the mixture velocity and c is the sound velocity.
c = { a l a g < ε w ε a g 1 ε a g a g > 1 ε
w = p α g ρ l ( 1 C 0 α g )
ε is a small parameter to ensure smooth transition.
The pressure flux is updated by:
p j + 1 / 2 = P + ( v m , L , c j + 1 / 2 ) p L + P ( v m , R , c j + 1 / 2 ) p R
P ± ( v , c ) = V ¯ ± ( v , c ) { 1 c ( ± 2 v c )   if   | v | c 1 v   otherwise  

3.2. Second-Order Accuracy

In this paper, we use a classical second-order monotonic upwind scheme for conservation laws (MUSCLs) technique to improve the accuracy:
w j + 1 / 2 , L = w j + 1 2 S ( ϕ j ) ( w j + 1 w j )
w j + 1 / 2 , R = w j + 1 1 2 S ( ϕ j + 1 ) ( w j + 2 w j + 1 )
where w = ( p , ρ g , ρ l , α g , α l , v g , v l ) .
S is the Van Leer slope limiter:
S ( ϕ ) = | ϕ | + ϕ 1 + | ϕ |

3.3. Solution Method

When Equation (2) is discretized explicitly:
u j n + 1 = u j n Δ t Δ x ( F j + 1 / 2 n F j 1 / 2 n ) + Δ t Q j n
Whereas Equation (2) is discretized implicitly:
u j n + 1 u j n + Δ t Δ x ( F j + 1 / 2 n + 1 F j 1 / 2 n + 1 ) Δ t Q j n + 1 = 0
The Newton–Raphson method is used for solving the implicit equation, so that the process of the calculation is stable.

3.4. Workflow

The primary calculation steps are shown in Figure 3, as follows. (1) Input the known parameters (well depth, bottom hole assembly (BHA), fluid properties, etc.) and complete the initialization according to the calculation requirements. (2) Calculate the raw data with the MUSCLs of second-order accuracy and obtain temporary data. (3) Use the AUSM method to analyze the elements from the bottom up, considering the Shi slip relationship, and then convert the conservative variables to primitive variables. (4) After one time step, store the result of this moment as the initial condition for calculating the next time step. (5) Repeat the above steps until the preset time period is over, and then store all of the data.

4. Experimental Validation

4.1. Laboratory Test

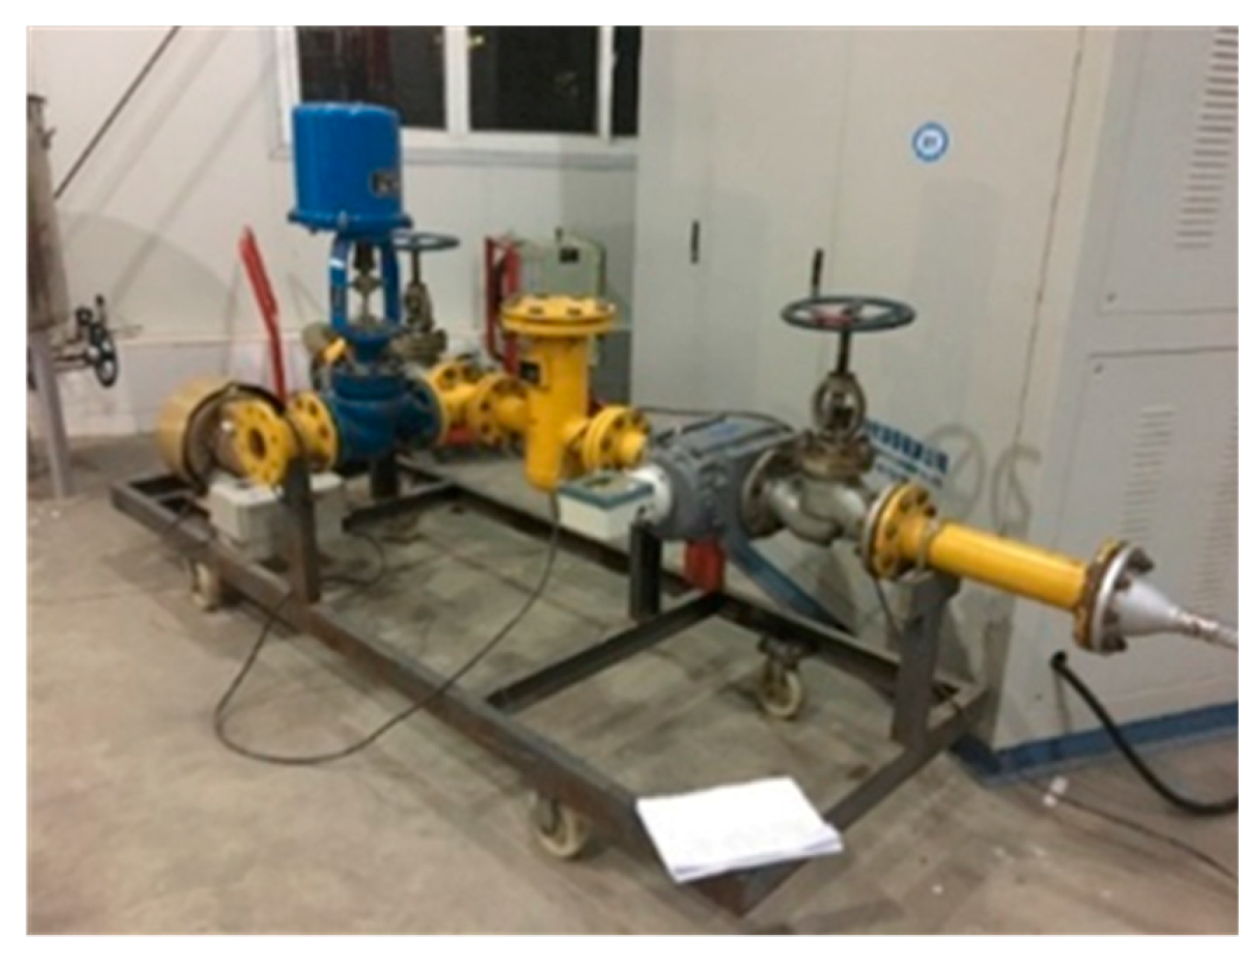
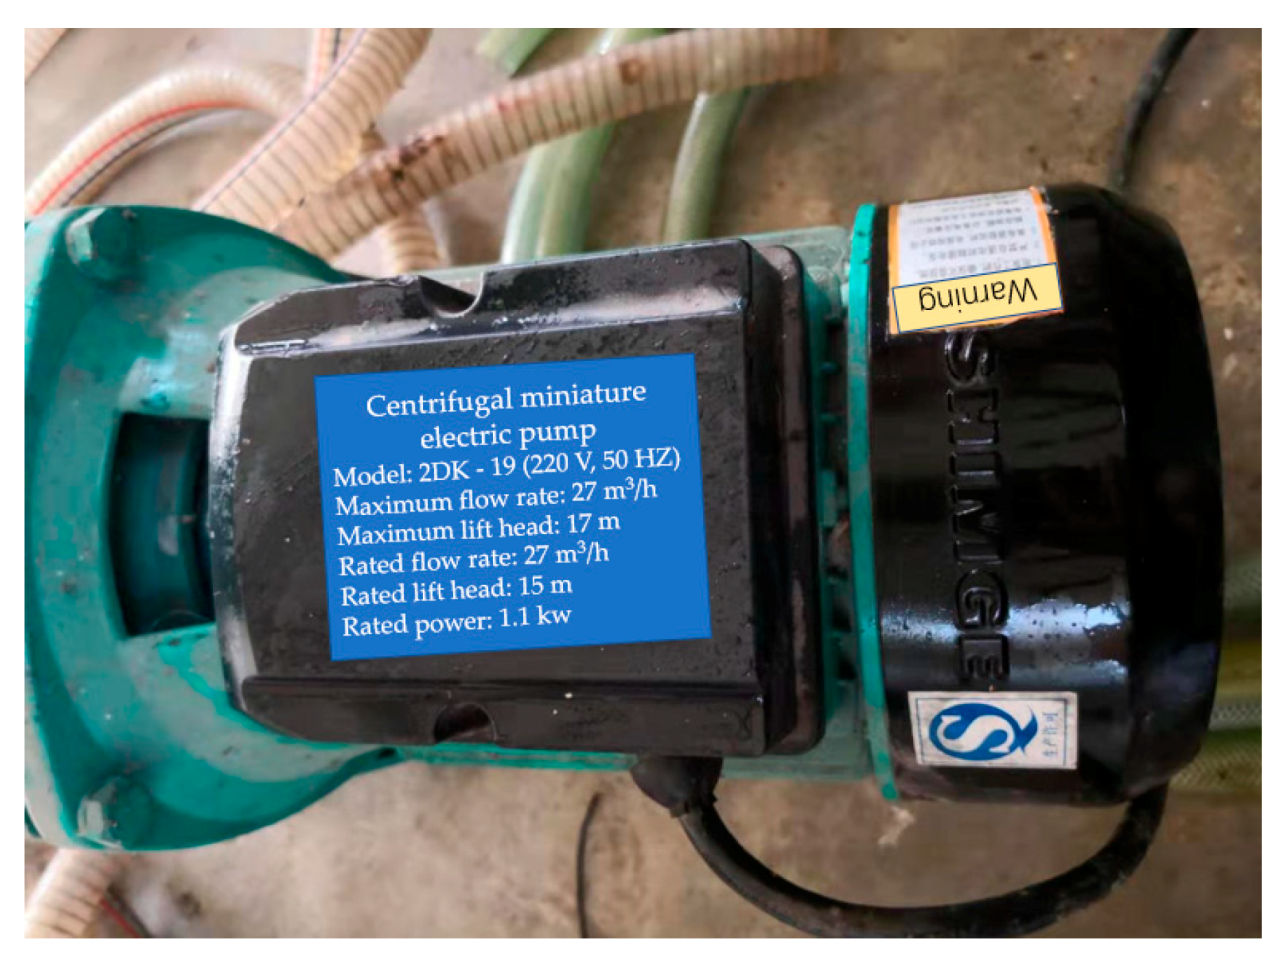
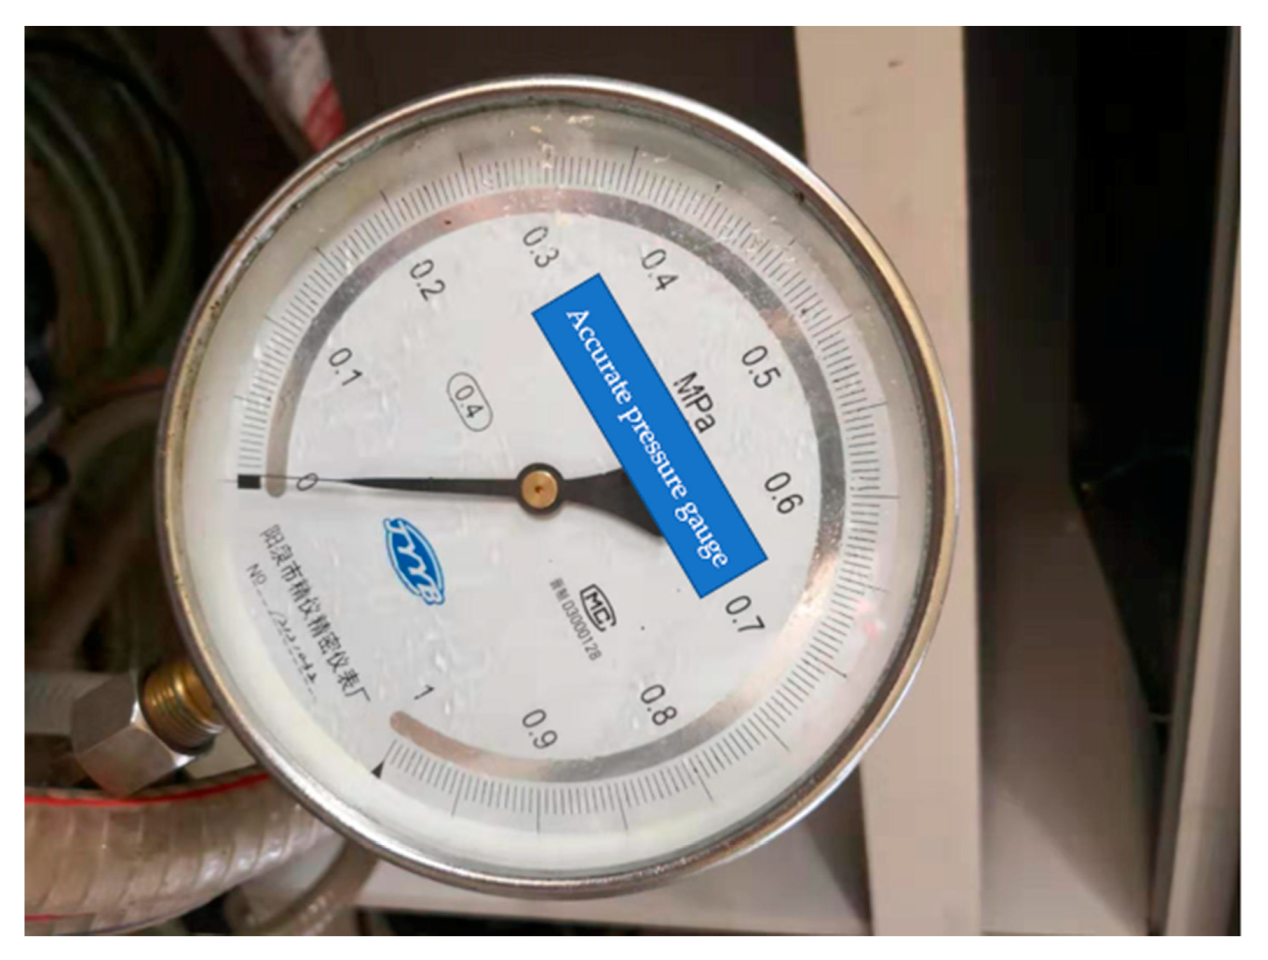
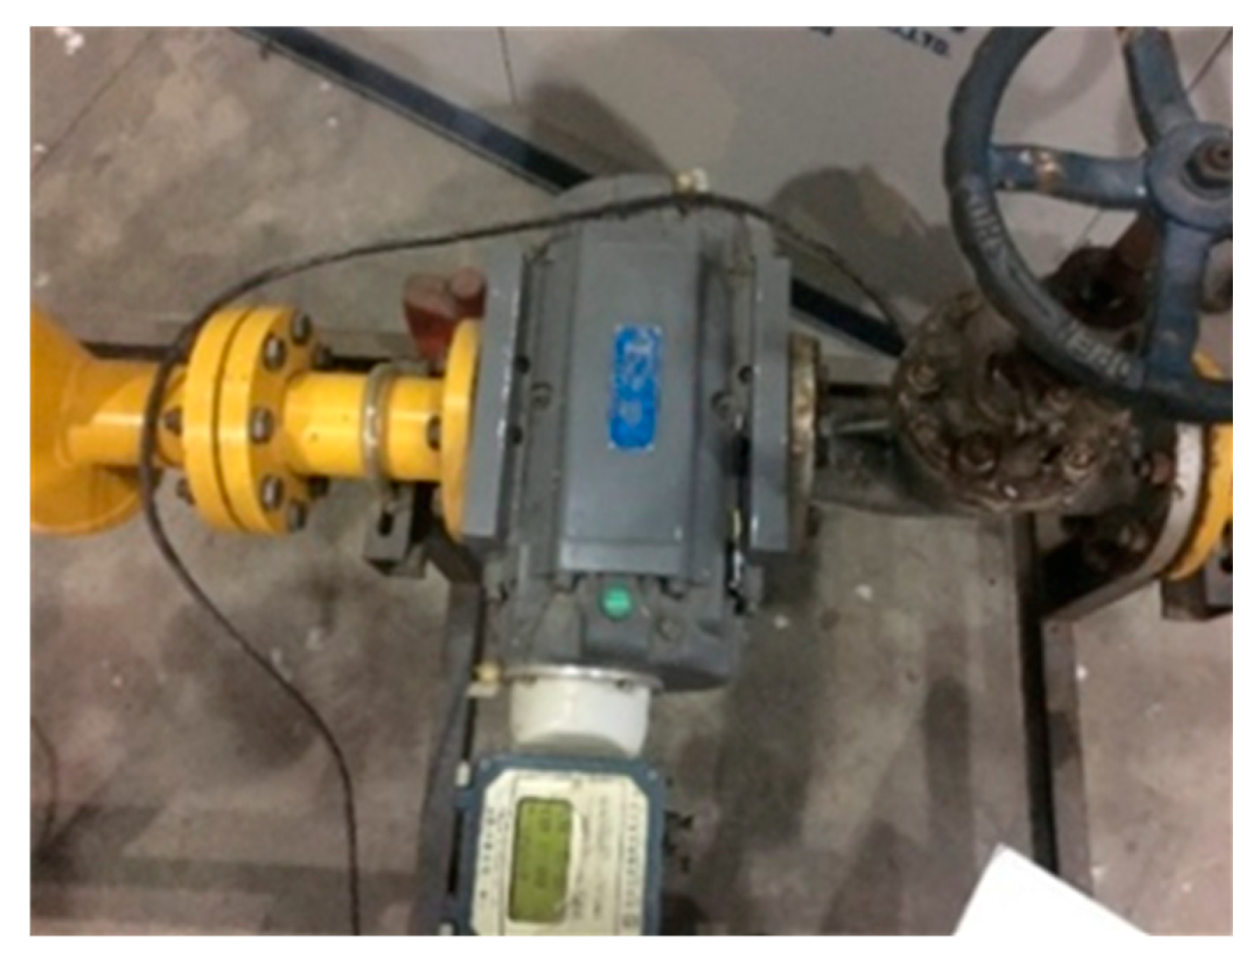
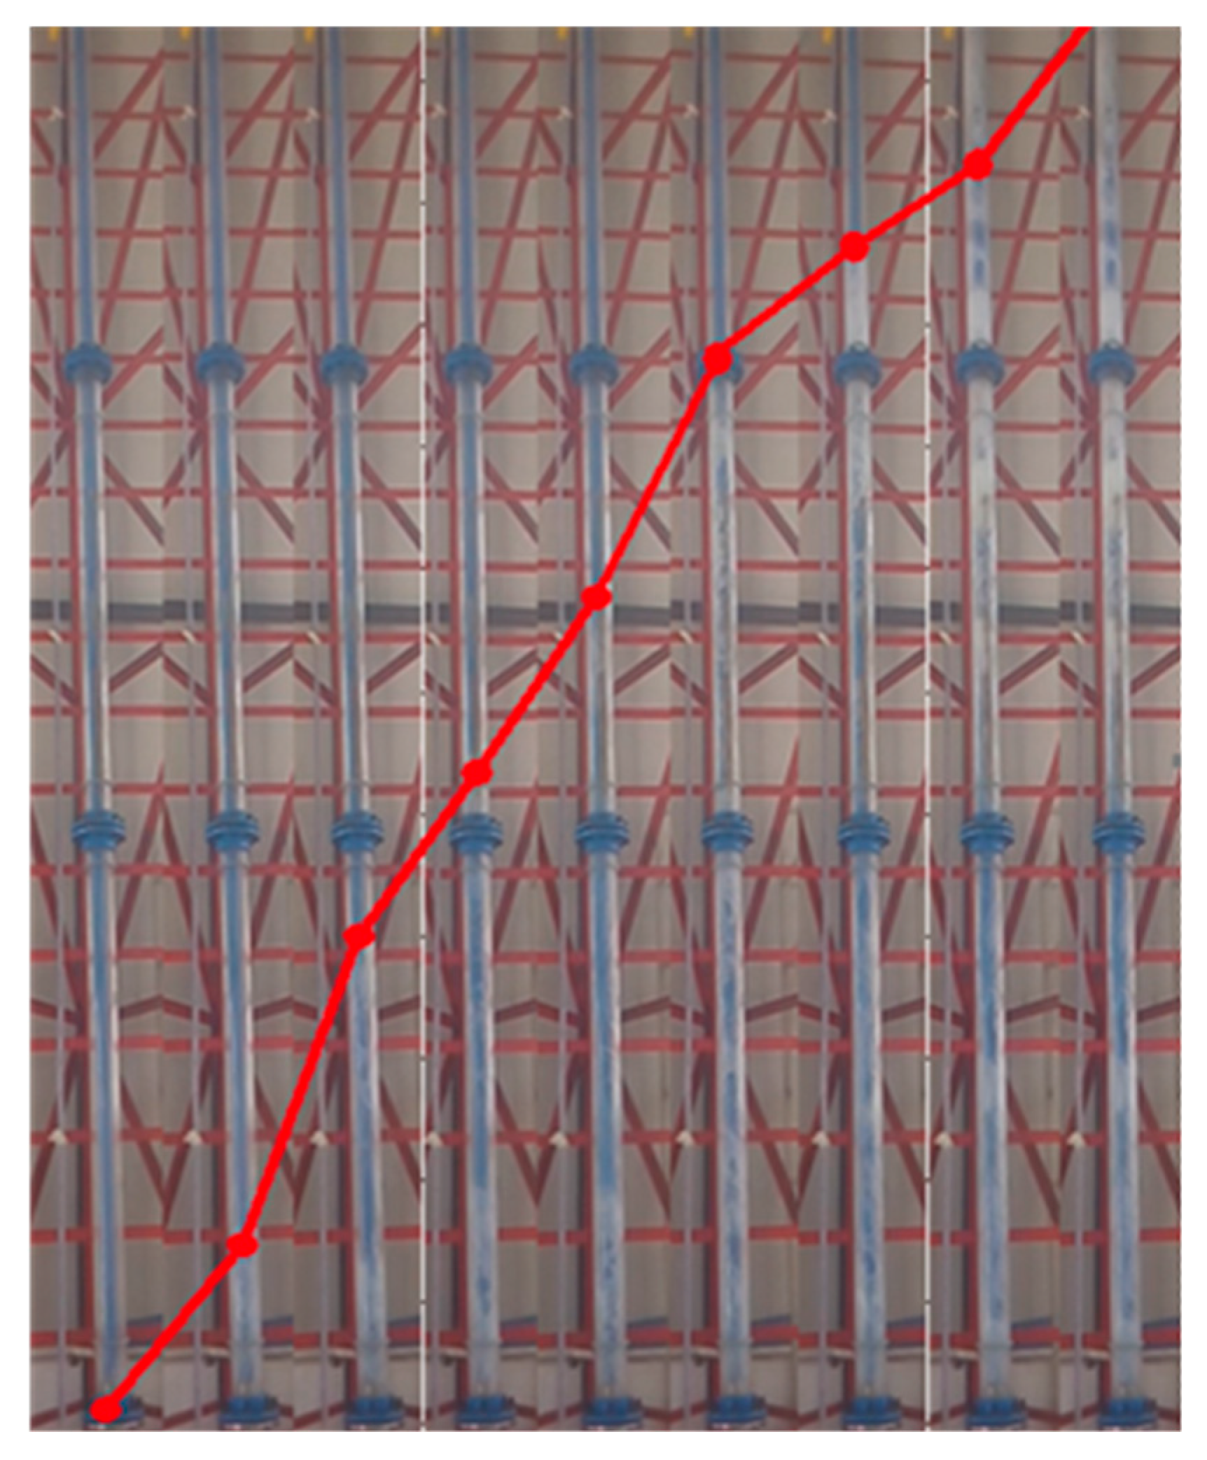
To complete the verification of the established model, we designed a simple experimental device, as shown in Figure 4. The device mainly includes a wellbore simulator, liquid circulation system, and air supply unit, as shown in Figure 5, Figure 6, Figure 7 and Figure 8. The wellbore is a 6 m long transparent glass tube with a diameter of 180 mm, inside of which is an 80 mm blue plastic tube. The fluid is injected into the blue string, and the air is injected at the bottom. The air enters the annulus, and a gas–liquid two-phase flow is formed. Multiple pressure sensors are set in the wellbore to record the changes in pressure.
During the experiment (Figure 9), the annulus was filled with liquid at the beginning with a flow rate of 0.0028 m3/s and then injected with gas at 25 s, of which the flow rate was 0.01 kg/s. Figure 8 shows the annulus flow dynamics. The flow state is mainly divided into three stages: the liquid phase flow stage (0–25 s), the transient gas–liquid two-phase flow stage (25–32 s), and the stable flow stage (32–60 s). Generally, the pressure in the wellbore increases first and then decreases, and finally, tends to be stable.
Figure 10 shows how the bottom hole pressure changes over time, and the simulated data are in good agreement with the experimental results. The error range is within ±10%.

4.2. Full-Scale Experiment

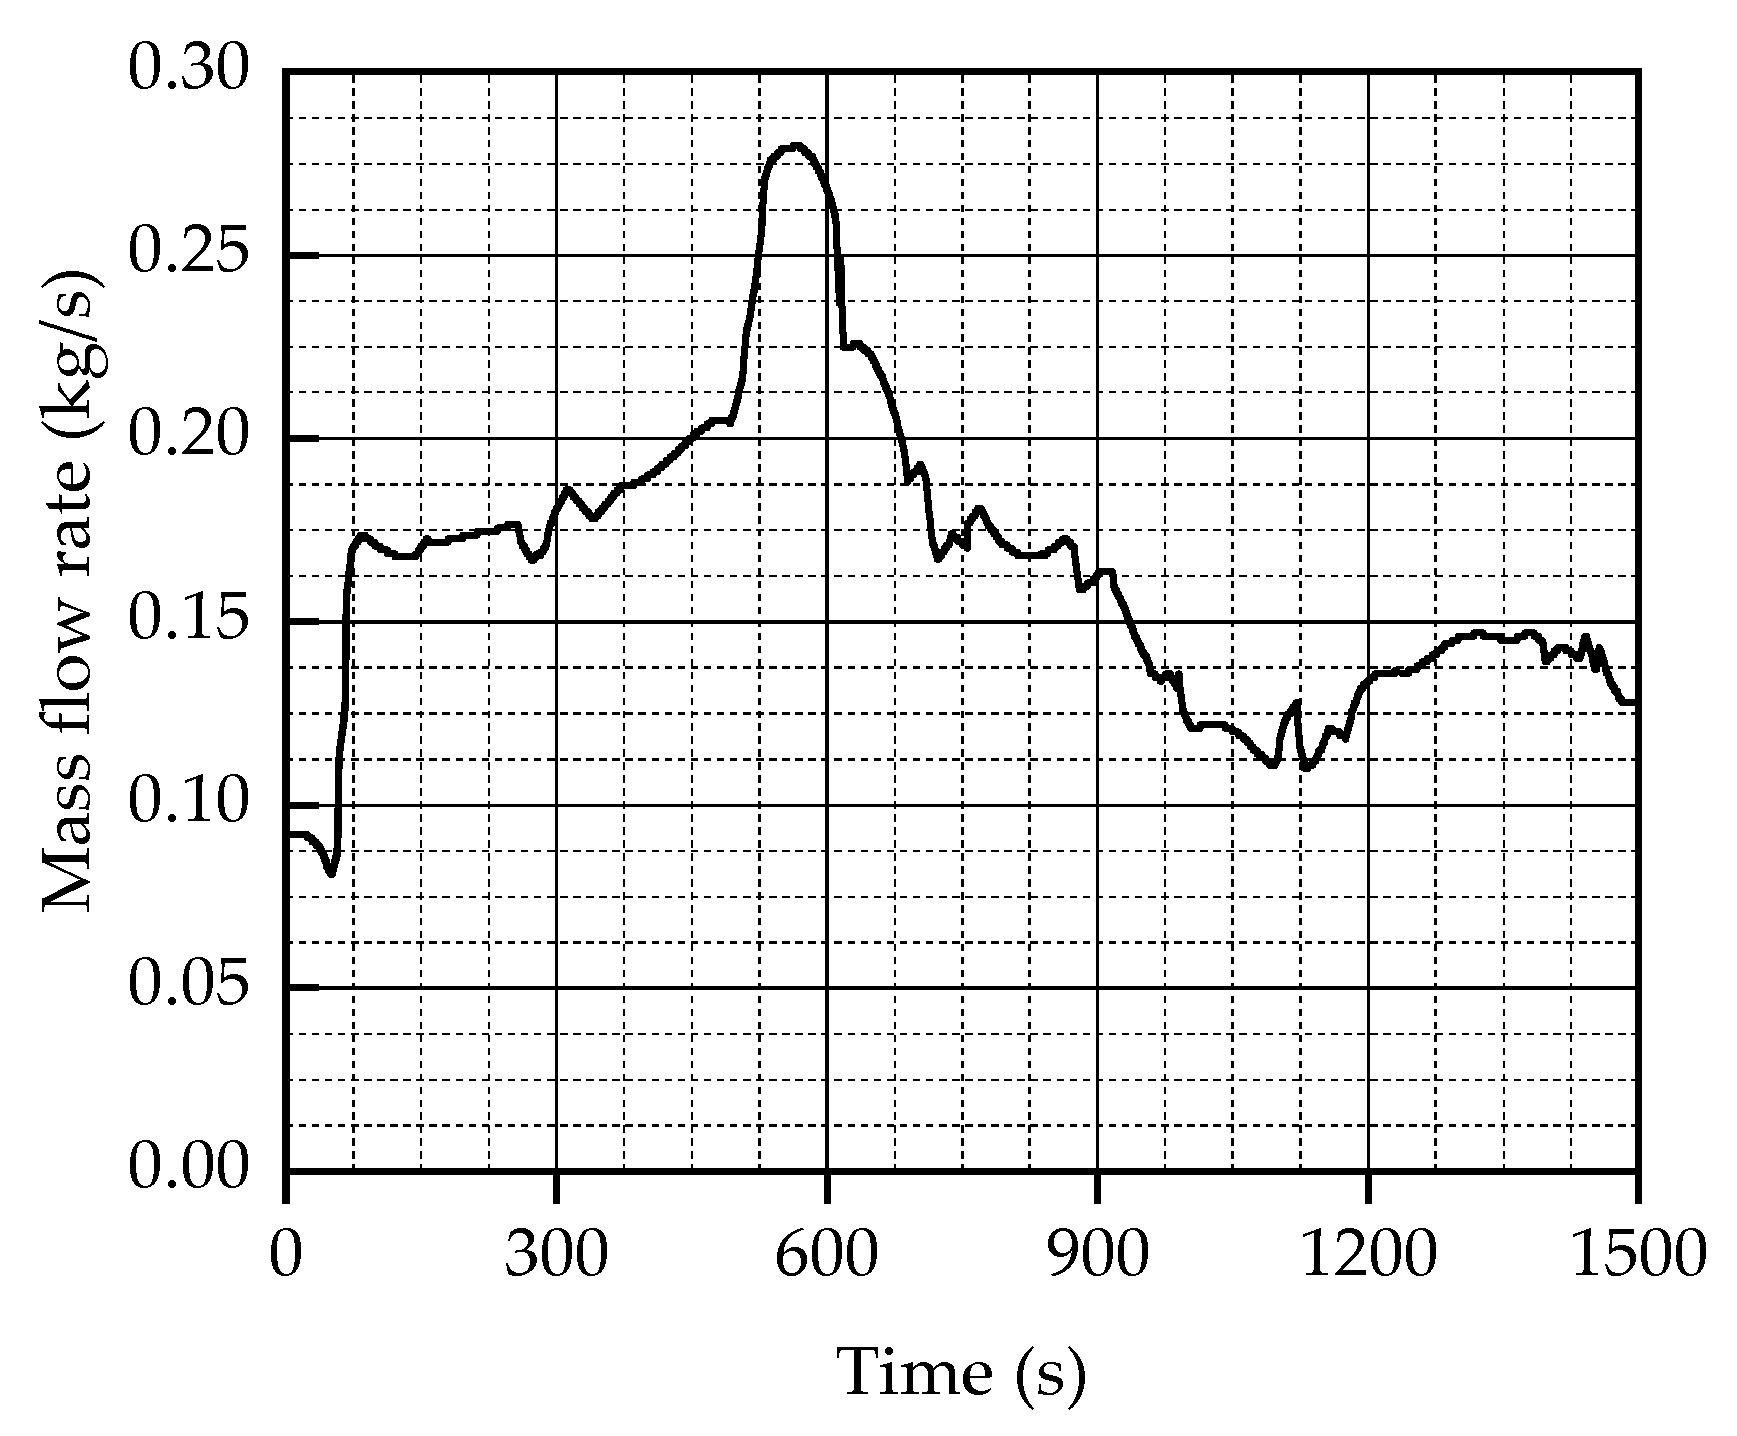
Lage and Fjelde [37] conducted their injection experiments in a real well. The vertical test well was 1275 m deep with a parasitic pipe used for gas injection at a depth of 760 m and a pressure sensor fitted at 605 m. At the start, the wellbore was filled with water at a flow rate of 10.11 m3/s prior to the air being injected into the wellbore. The change in gas flow is presented in Figure 11. Over the course of gas injection, there was a significant change in the gas volume. The total time taken to conduct this experiment amounted to 1500 s, and the injection depth was relatively deep, which was used to exhibit the characteristics of the gas invasion process in practice.
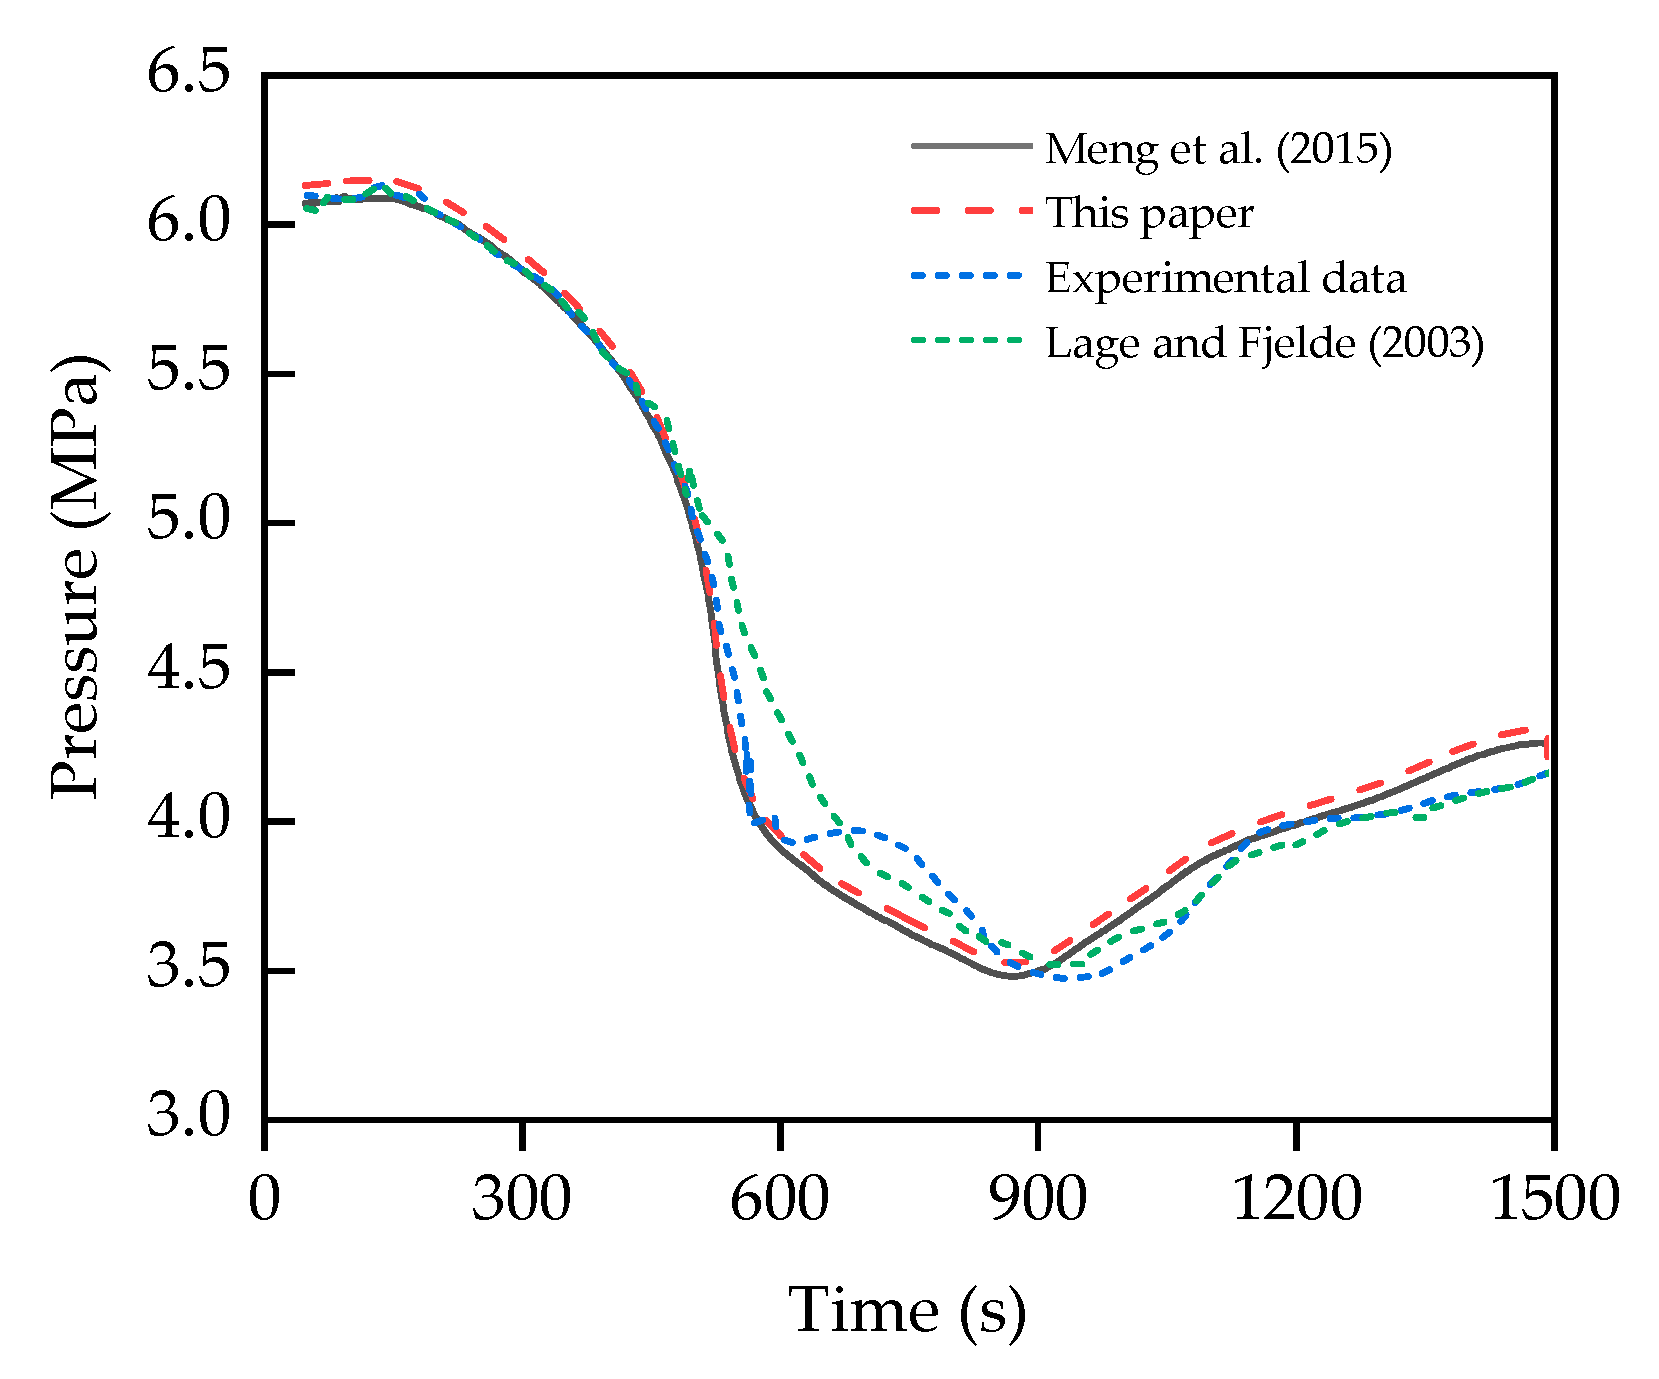
Figure 12 presents a diagram that shows the changes in pressure over time at a latitude of 605 m. In this paper, the original measurement data as well as the calculation results obtained by Meng et al. [35] and Lage and Fjelde [37] are compared. As revealed by this figure, there is a decent consistency between the simulation results and the on-site testing data. The curve obtained in this study is smoother than that obtained by Lage and Fjelde. Meanwhile, the measurement data were contrasted with the calculation results, which indicates that the resulting error is within ±5%.
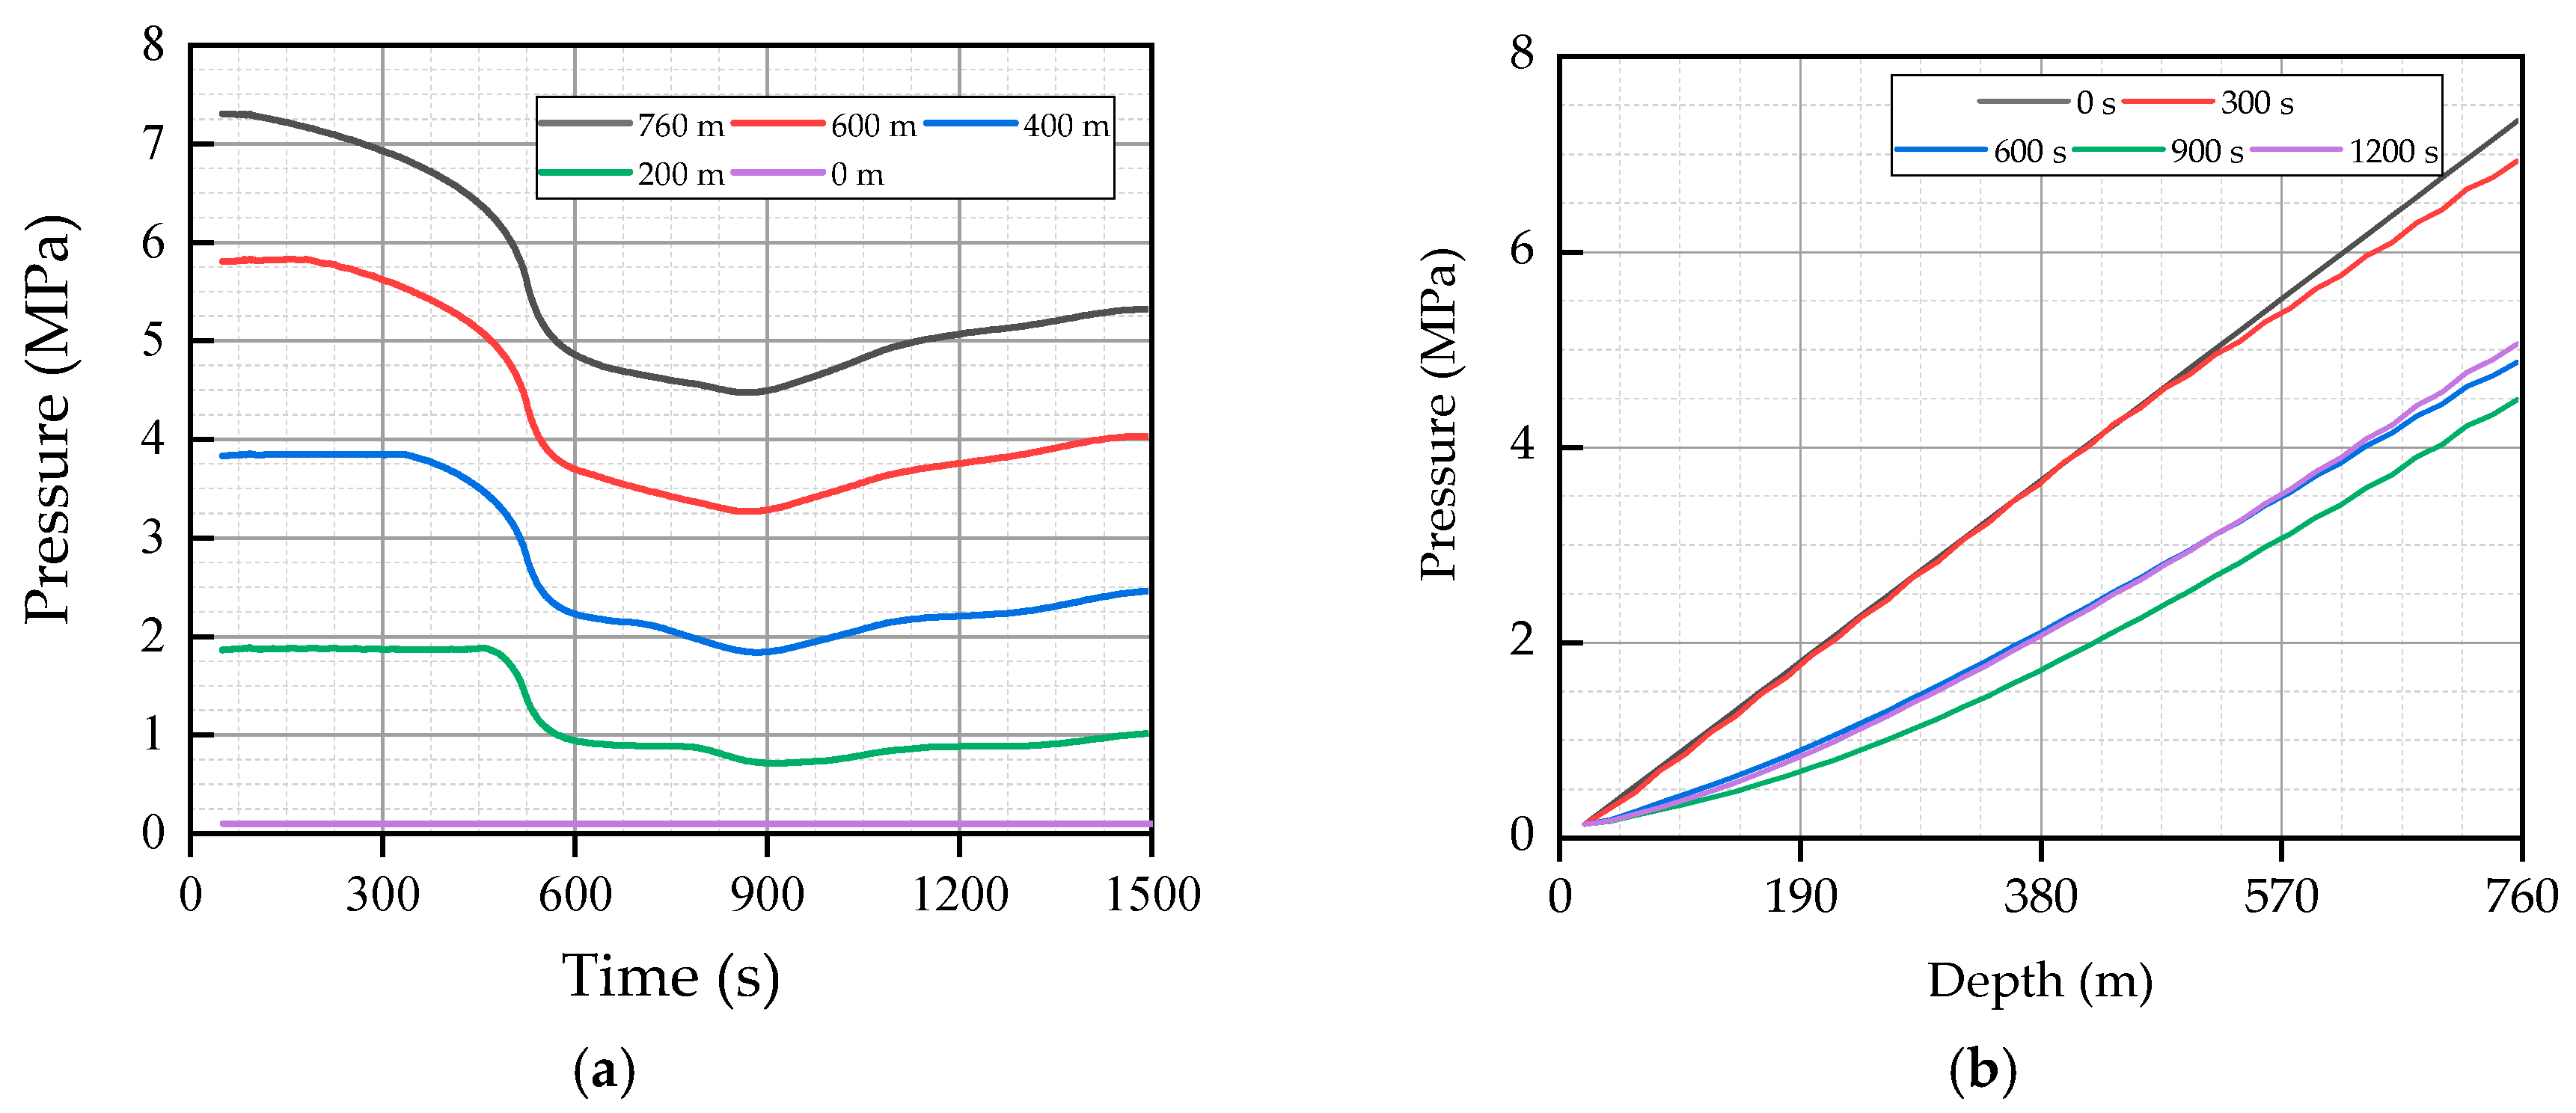
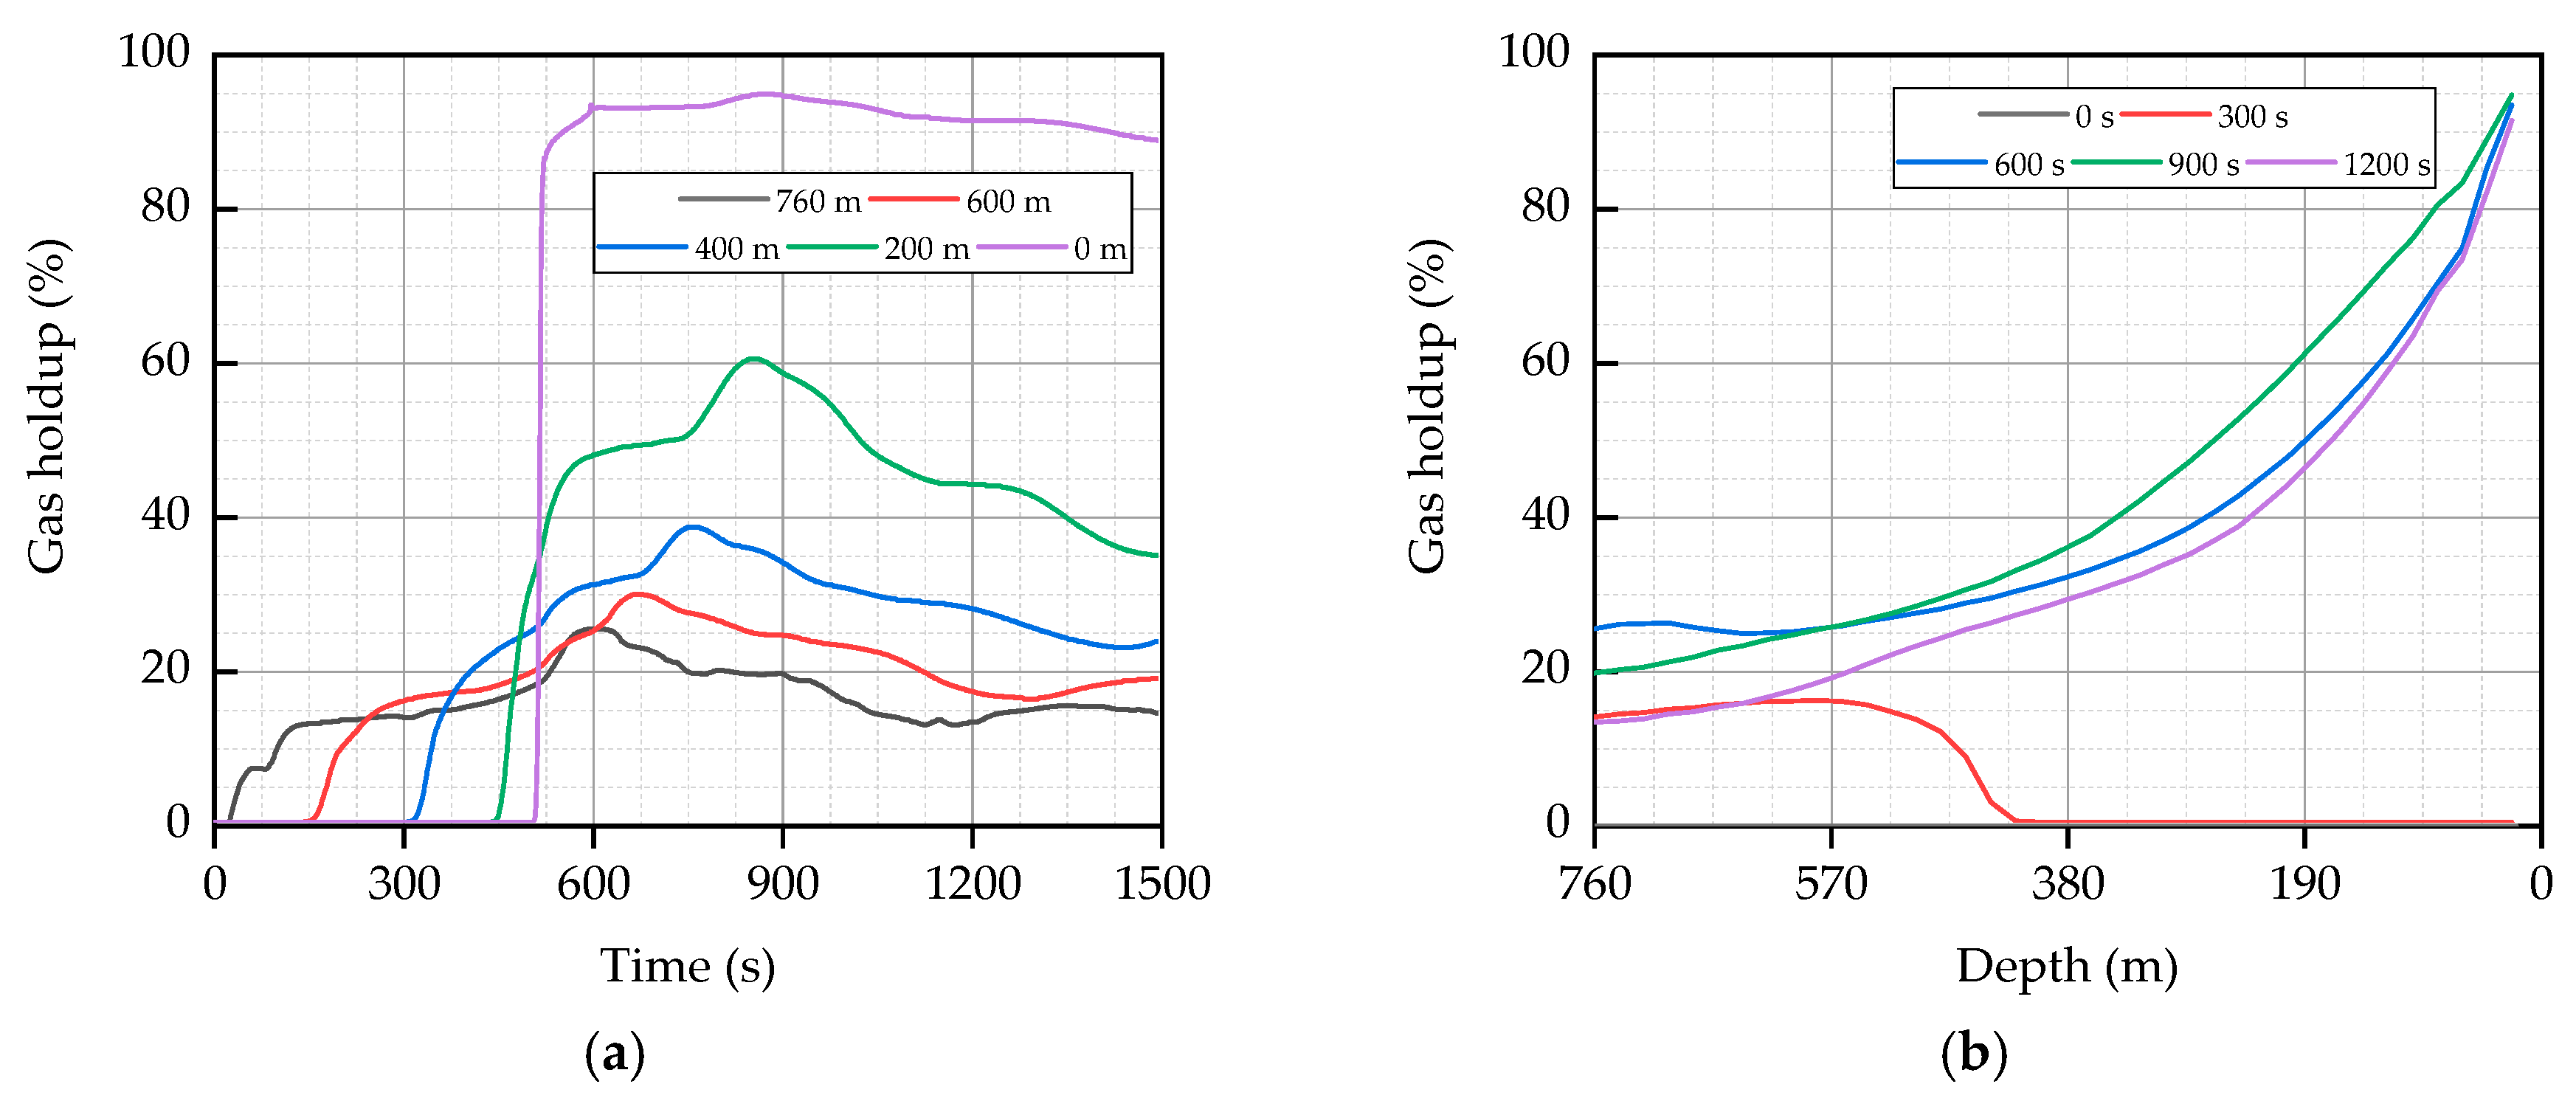
In order to further understand the flow dynamics in the wellbore, we analyzed the variation of other parameters according to the simulated data. Figure 13 reflects the changes in pressure with time and depth. As can be seen from the figure, in both the measured and simulated data, the pressure shows a gradual decline, which is followed by a sharp fall, before an incremental increase again. The drop in pressure is due to the original fluid within the ambient environment being dispelled with the ingress of gas. It is known that gas has a lower density than fluid, causing the downhole pressure to decline on a continued basis. As the gas moves upwards, the pressure it is subjected to decreases, which causes the gas to expand further. As a result, more fluid is dispelled, and the drop in pressure occurs faster. Up to the point when the gas reaches the wellhead, the downhole pressure is at its minimum. With the continued ingress of gas, there will be an increase in downhole pressure to some extent until the gas–fluid two-phase flow stabilizes. Figure 14 shows the changes in the gas holdup. As revealed by this figure, there is a constant change in gas holdup at varying depths over time, which is consistent with the changes in the gas mass flow. This is most obvious at the wellhead. The gas holdup reaches its maximum at the wellhead when the maximum gas mass flow reaches the wellhead.
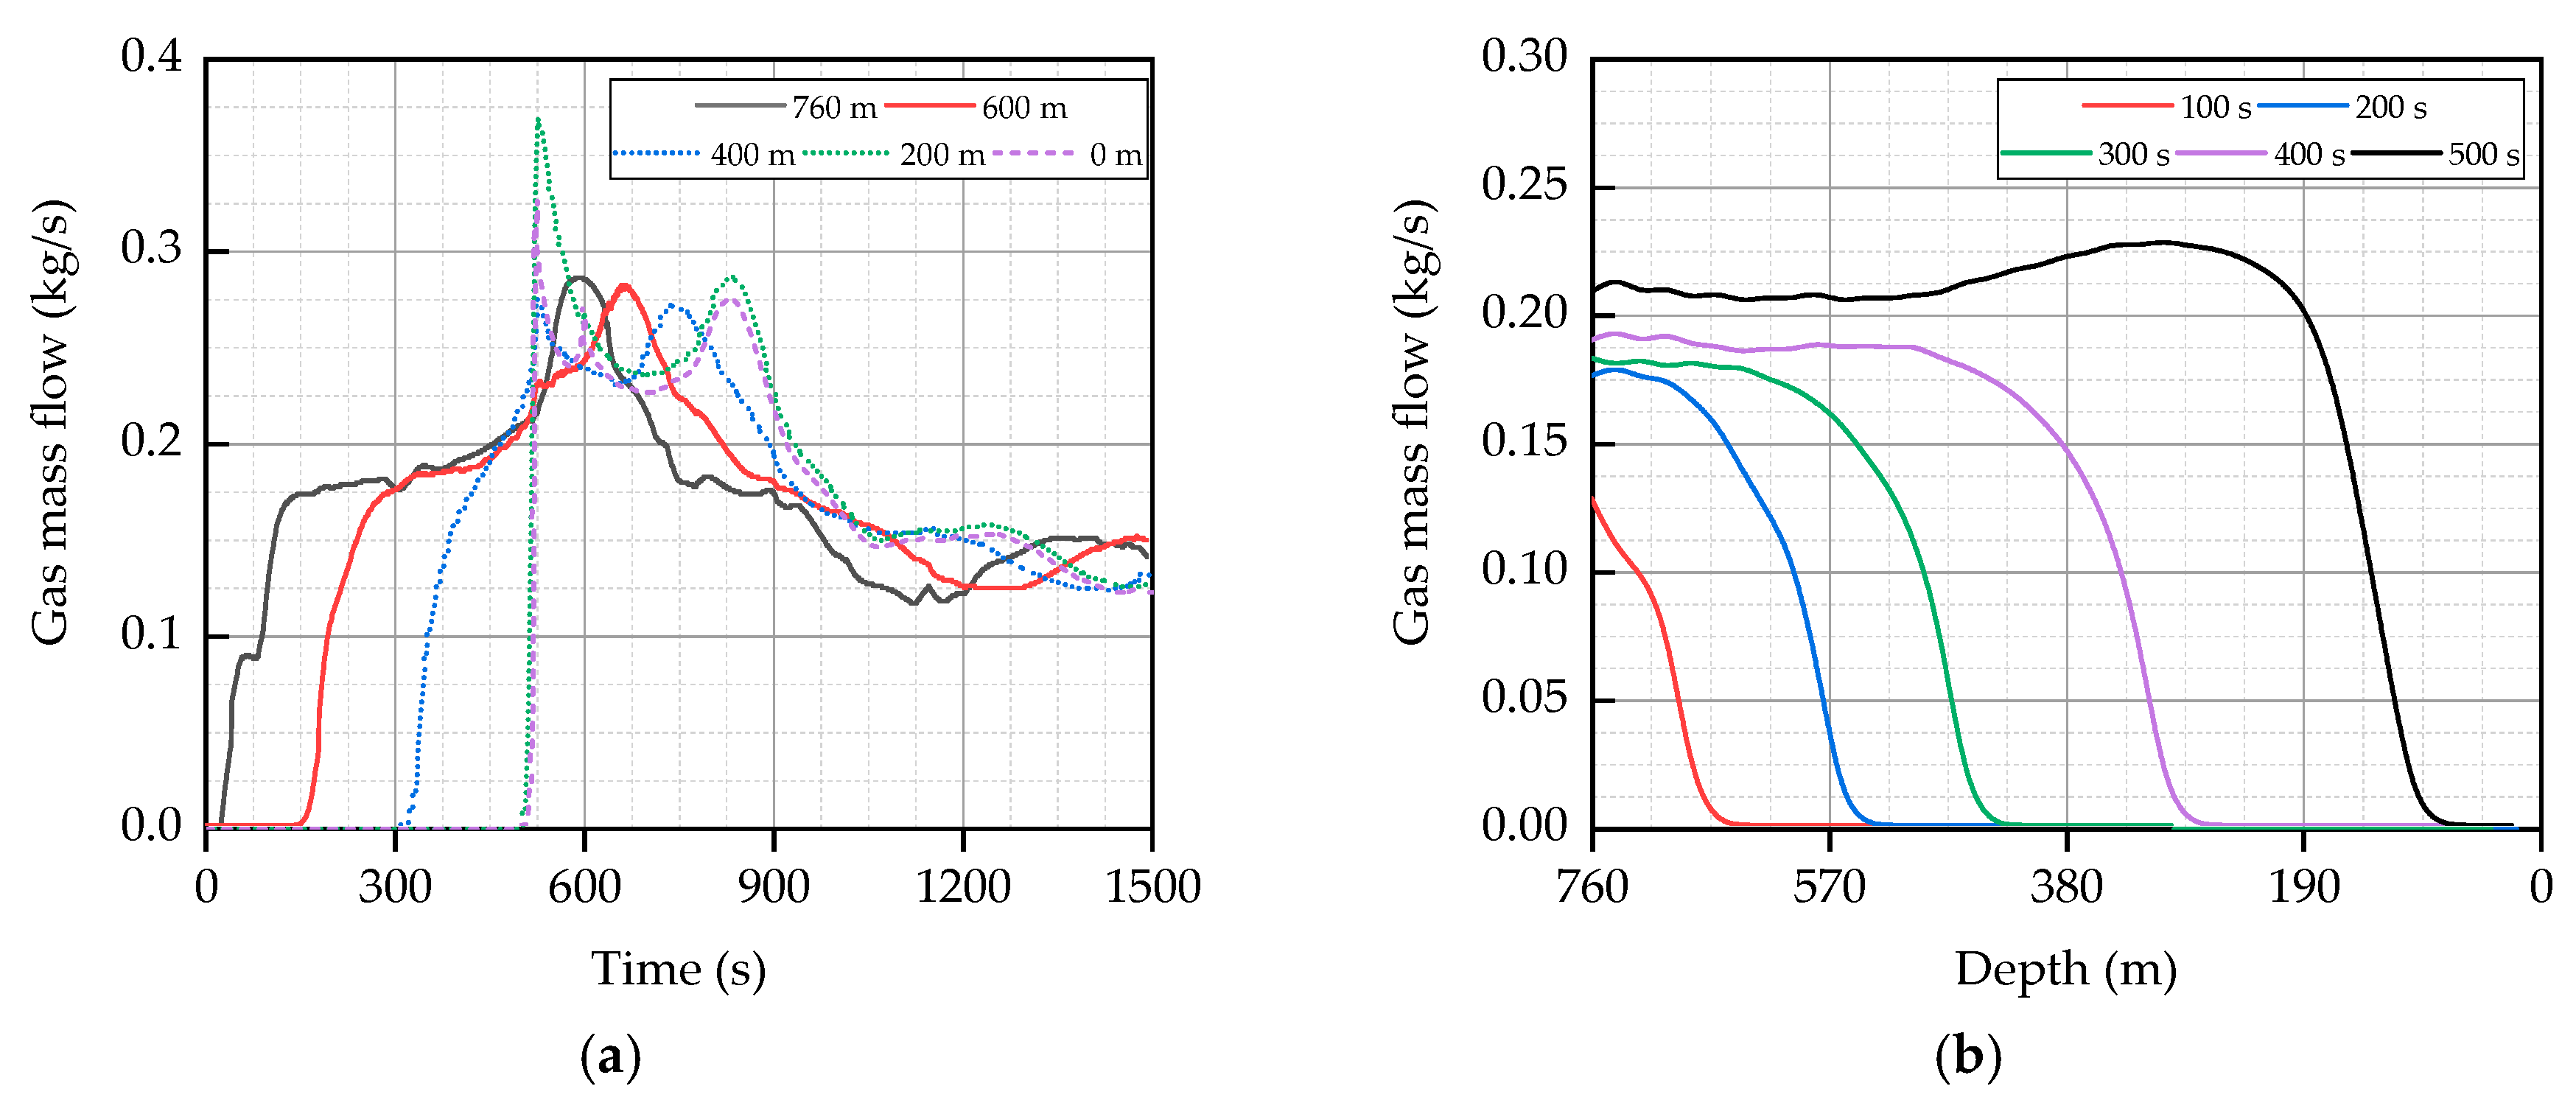
Figure 15 presents an analysis of the gas mass flow. As revealed in the figure, there is a significant change in gas mass flow, with the maximum at 0.265 kg/s. The variation in gas mass flow accounts for the changes to all other characterizing parameters for the wellbore. In practice, due to the difference between the geological pressure and that at the downhole, there will be a constant change in the gas mass flow, as a result of which the characteristics exhibited by the transient multiphase flow will change inside the wellbore. Figure 16 reflects the changes in fluid mass flow. The maximum fluid mass at the wellhead is 63 kg/s, and the minimum is 4 kg/s, which is because as the amount of filled gas is on the rise and the fluid inside the wellbore is dispelled, the fluid mass flow is significant when there is less gas ingress. When the gas mass increases, the fluid mass flow will drop noticeably.

5. Sensitivity Analysis

In the previous sections, the model proposed in this paper was validated and shown to be suited to industrial application in the oil and gas industry. One example is a well located in the north of Sichuan Province, where the MPD technique is applied. To complete the calculation, it was supplemented with the following parameters (Table 1 and Table 2). For more effective control of the downhole pressure during drilling, the application of the existing technology to improve the effectiveness in downhole pressure control is discussed, and an analysis is conducted of the impact of different parameters on flow inside the wellbore.
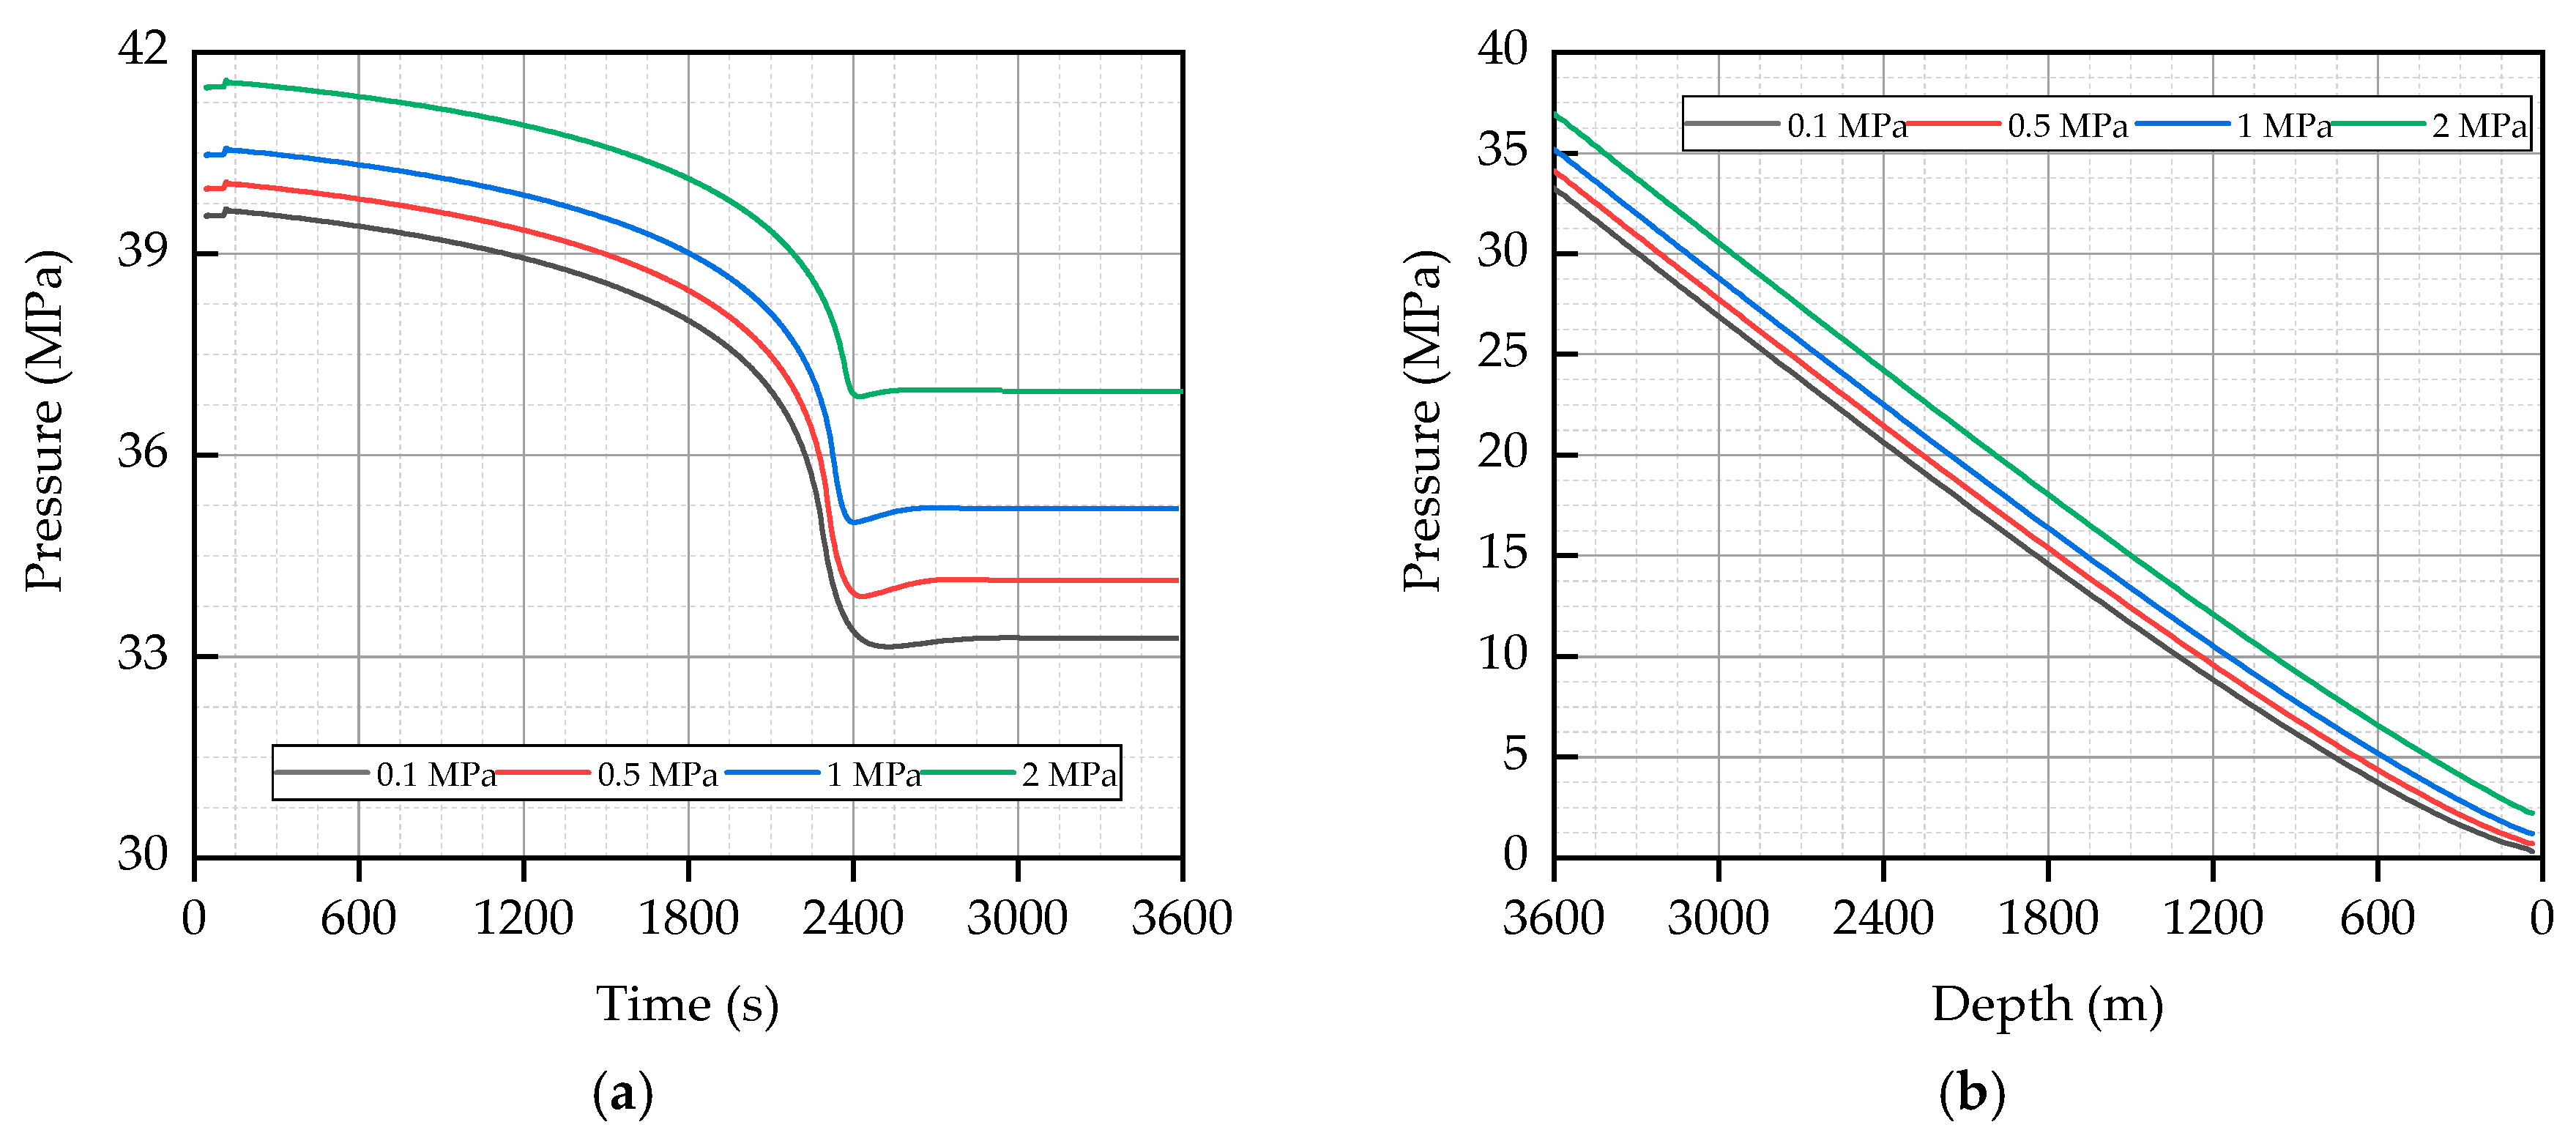
The wellhead backpressure has a direct effect on the downhole pressure. As shown in Figure 17, lower wellhead backpressure leads to a faster decline in the downhole pressure when overflow arises. When the wellhead backpressure is 0.1 MPa, the downhole pressure declines by 7.5 MPa, which means an increment of 1.9 MPa as compared to the time point when the wellhead backpressure is 2.0 MPa. Therefore, it can be seen that applying pressure to some extent at the wellhead is effective for bringing the reduction in the downhole pressure under control.
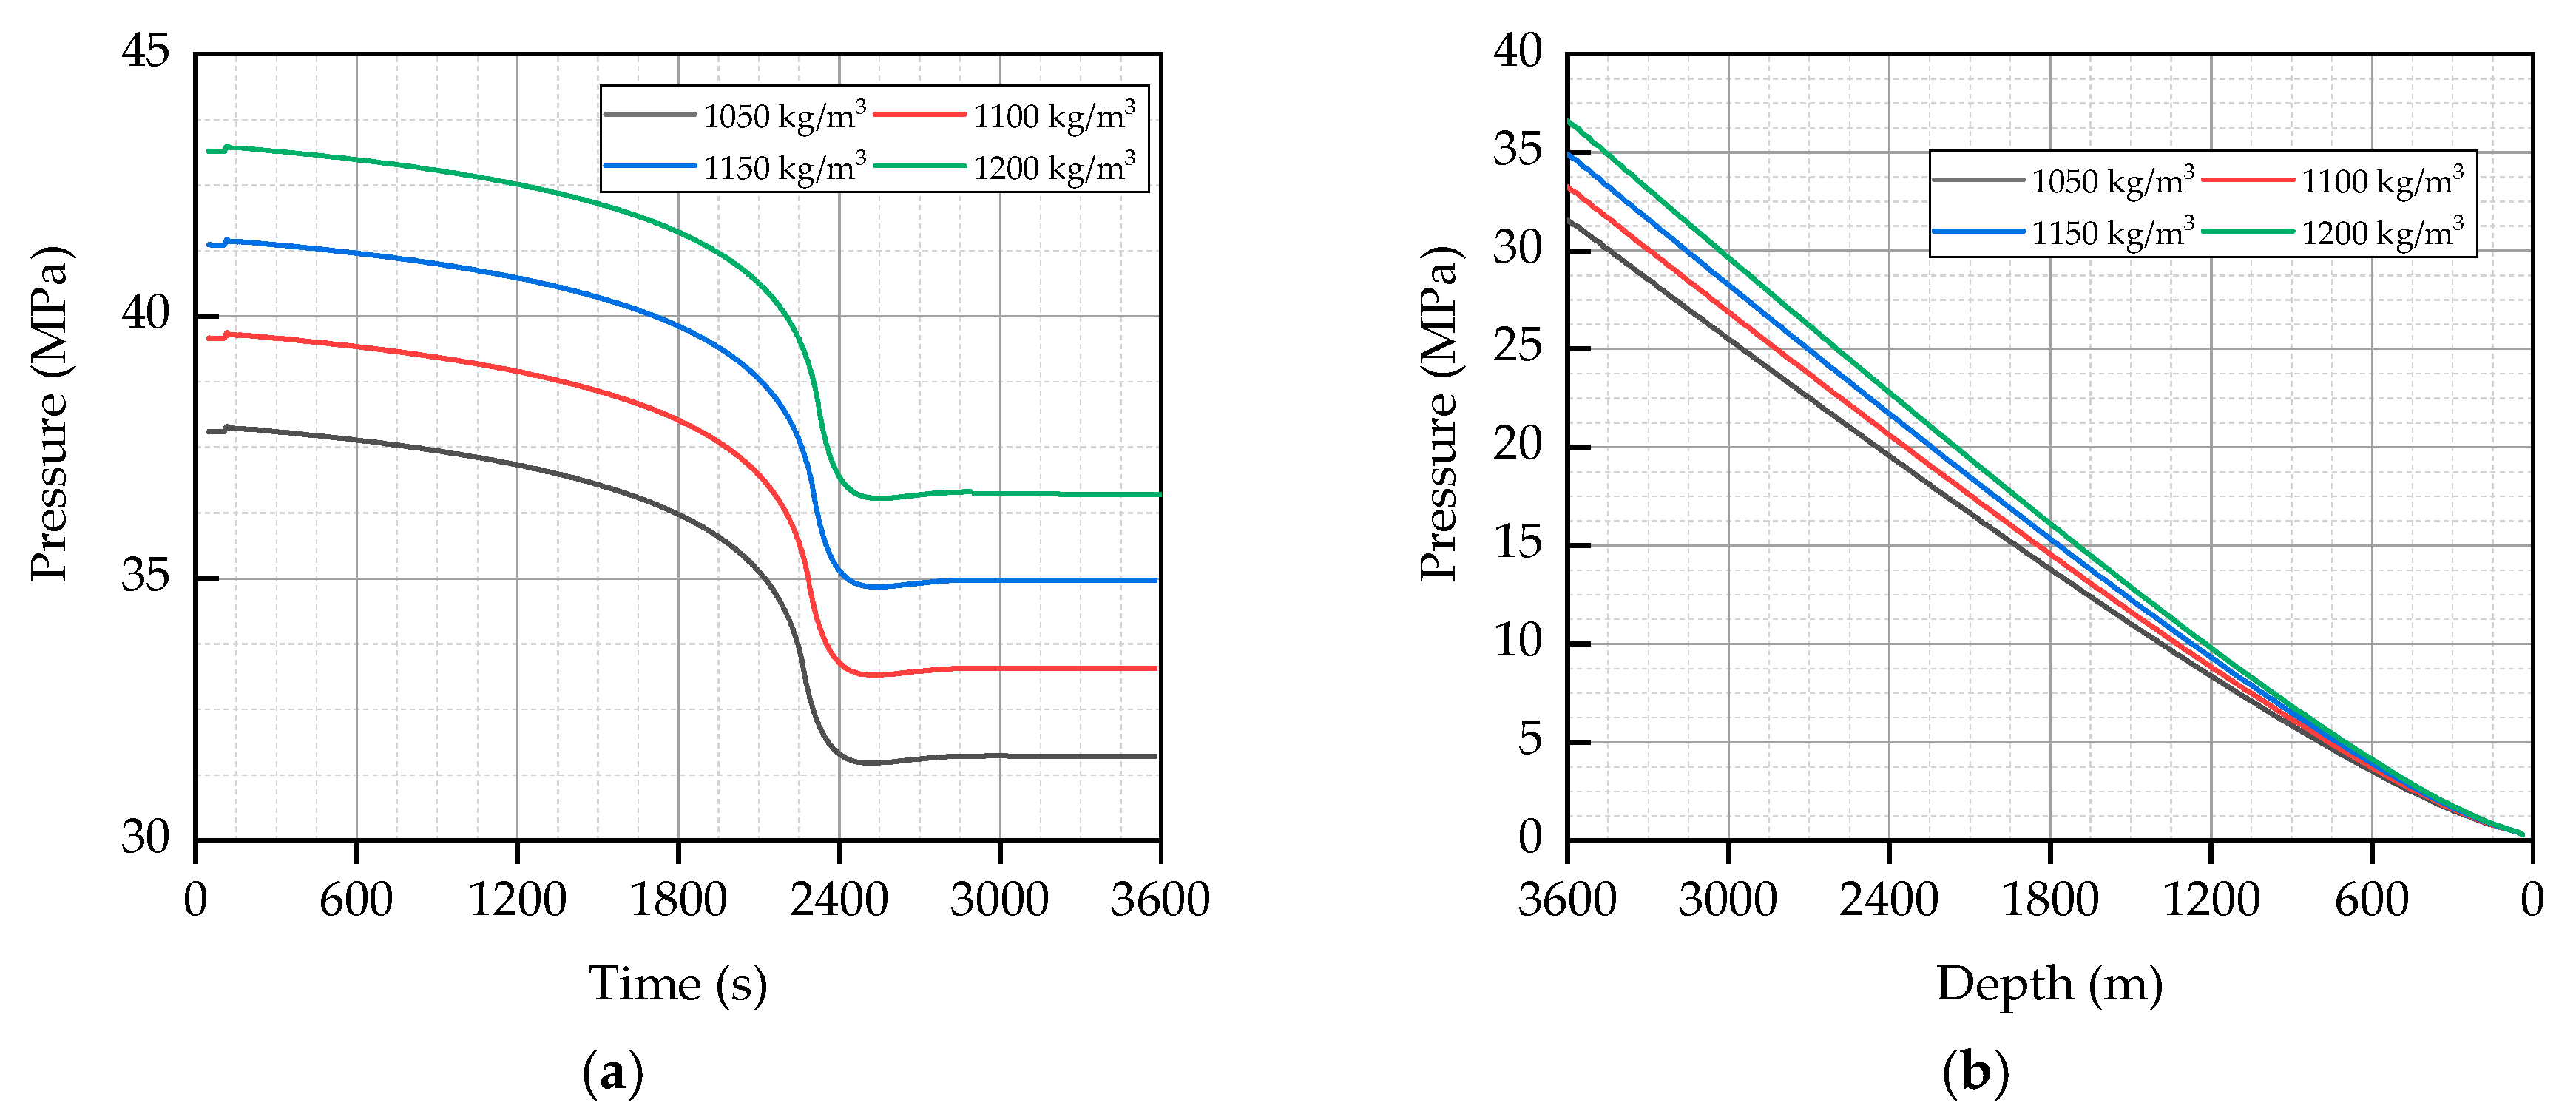
Even a slight decline in the density of drilling fluid will cause a sharp drop in the downhole pressure. As shown in Figure 18, the downhole pressure difference is about 3.4 MPa when the difference in drilling fluid density is 0.1 kg/m3. A commonly-seen practice for controlling the downhole pressure is to change the density of the drilling fluid. However, as it takes time for the drilling fluid to reach the downhole from the wellhead, the downhole pressure is incapable of being adjusted promptly, which means that the possibility of various dangerous incidents occurring remains possible. Therefore, a combined approach taken while drilling with backpressure and displacement would be more effective and reasonable to prevent the occurrence of incidents.
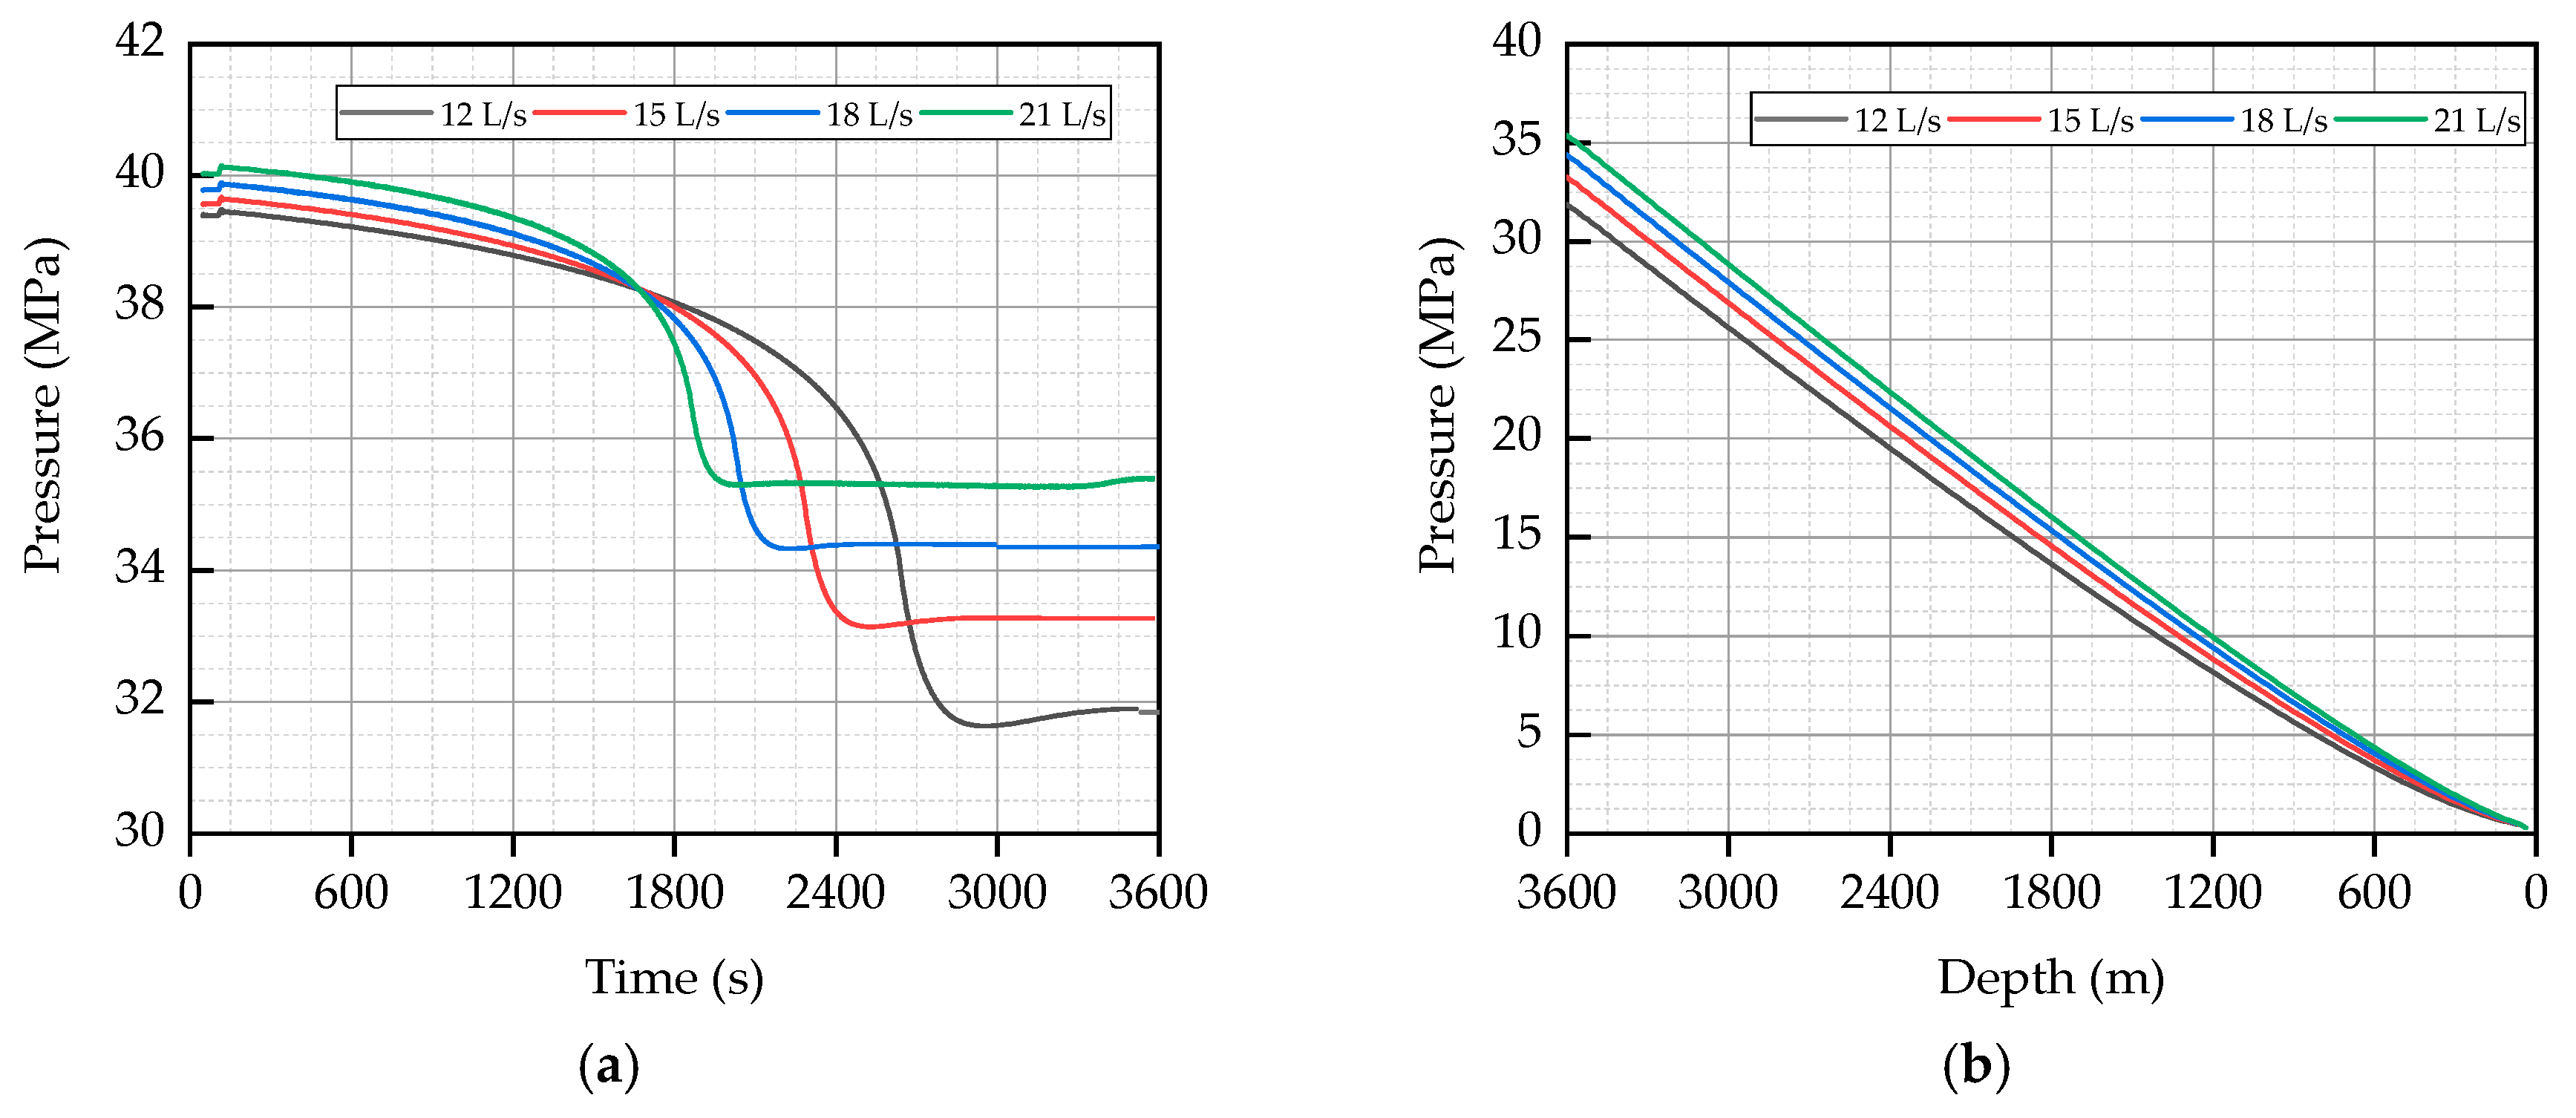
Over the course of drilling, displacement has a substantial impact on the downhole pressure. As indicated by Figure 19, a lower displacement leads to a lower downhole pressure, which will decline at a faster pace over time. Therefore, as far as the drilling facilities allow, an increase in the displacement will cause a significant rise in the downhole pressure.
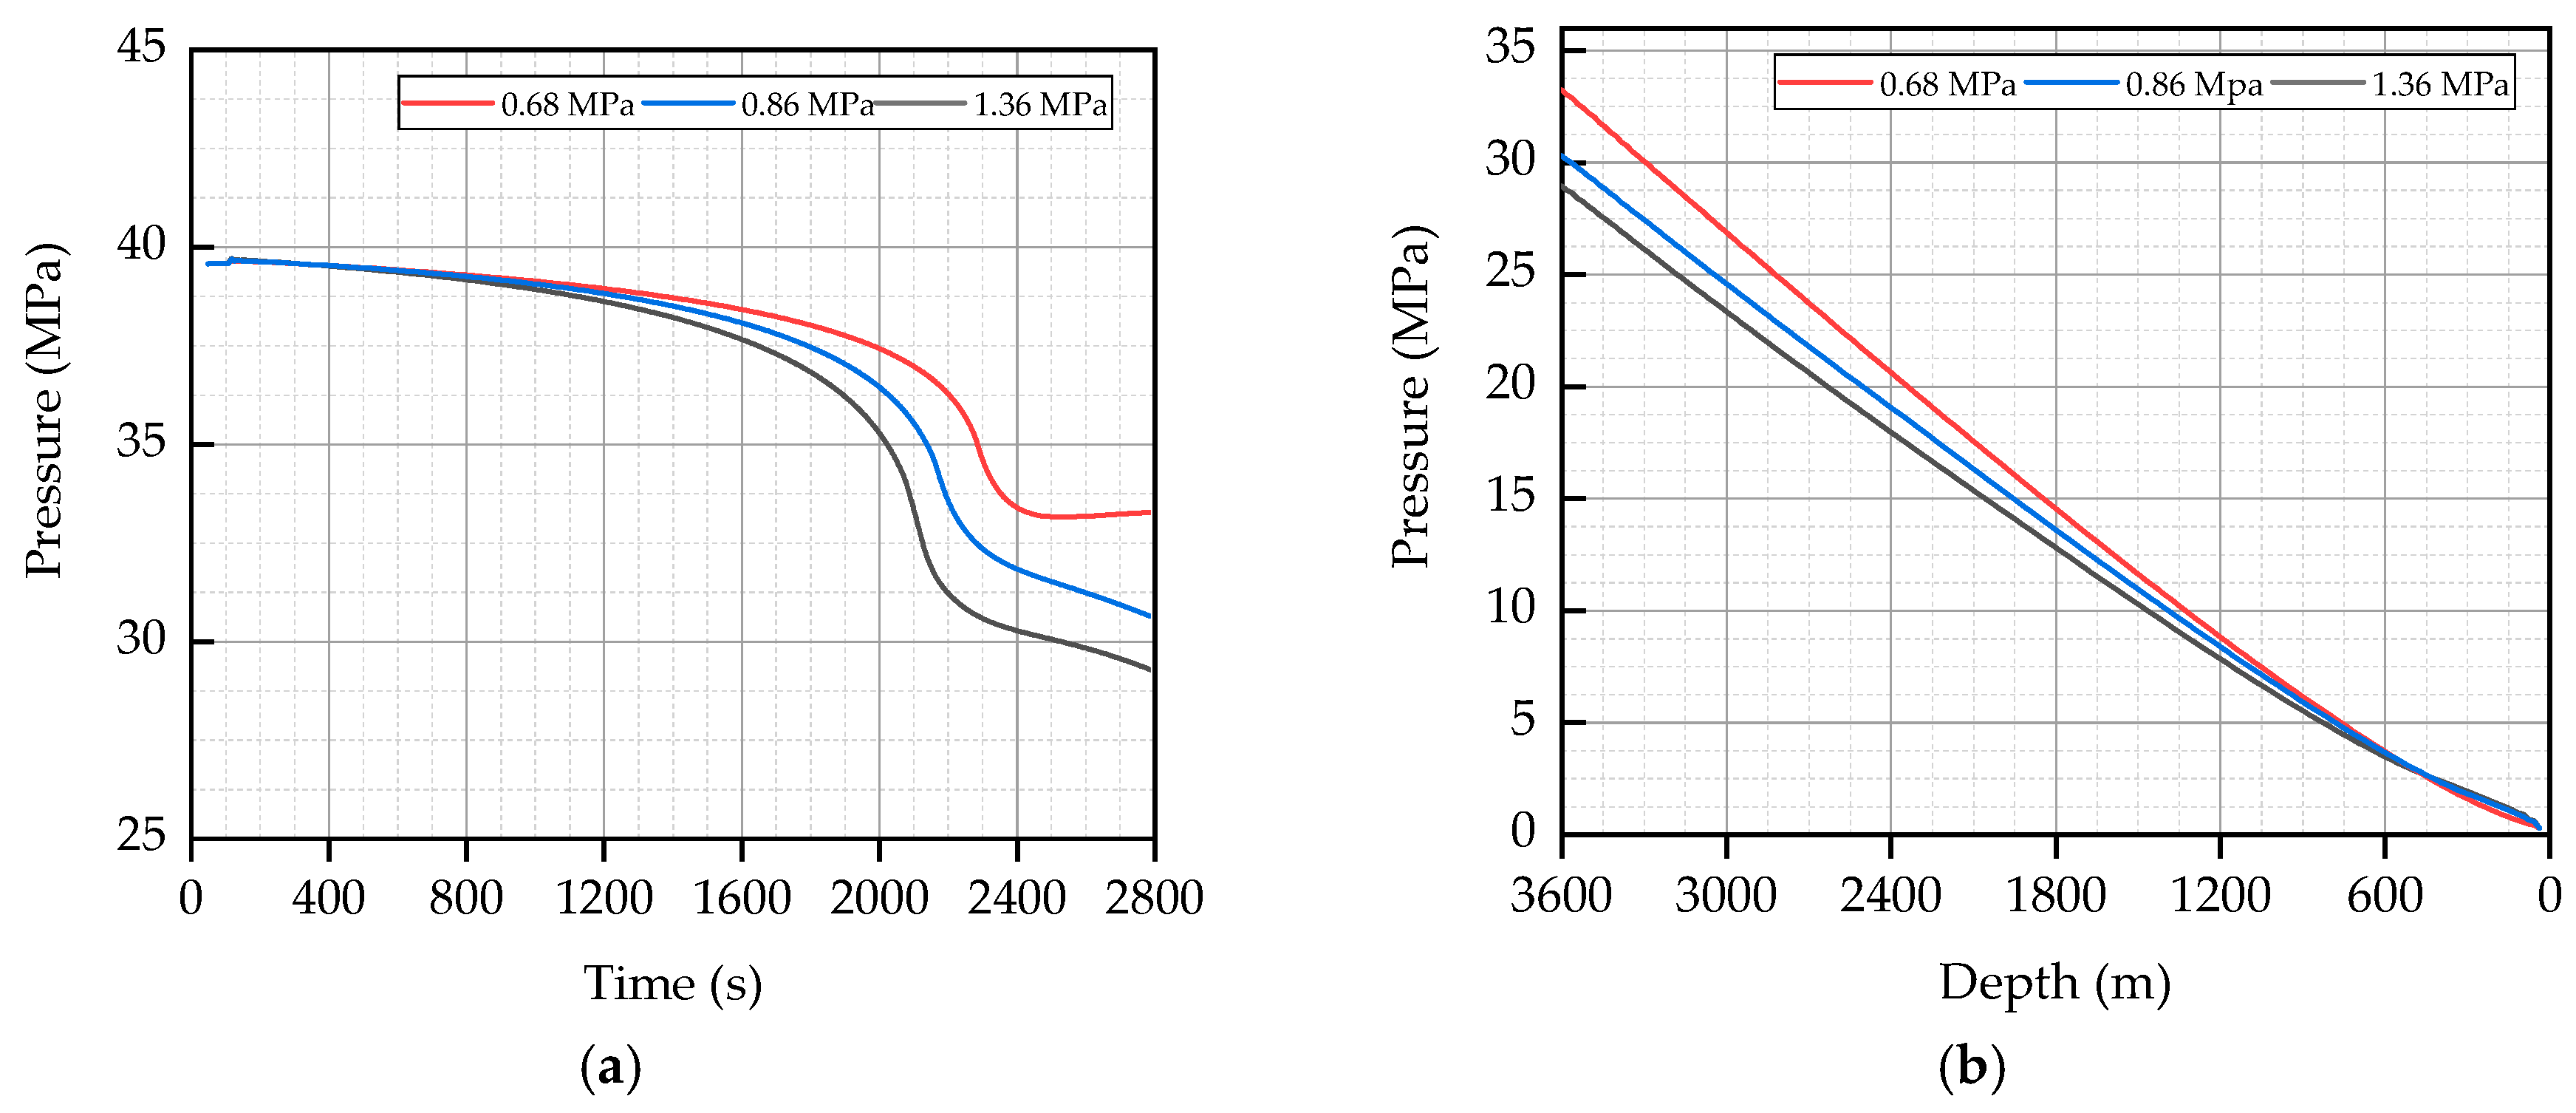
In actual conditions, the pressure difference between the reservoir and the downhole will constantly change, and the invasion amount of gas will also vary synchronously. As shown in Figure 20, a higher initial pressure difference causes a more significant variation in the downhole pressure. Transient gas–liquid two-phase flow is always present in the wellbore, and there is no stable stage. The downhole pressure drop can be divided into two stages: the accelerated stage while gas is in the annulus; and the steady descent stage after the gas reaches the wellhead.

6. Conclusions

In this paper, an MPD wellbore transient flow dynamic model was developed based on the compressible gas–fluid two-phase flow with the drift flux model. The most critical findings are summarized below:
(1)
In laboratory experiments, the flow state is mainly divided into three stages: the liquid phase flow stage (0–25 s), the transient gas–liquid two-phase flow stage (25–32 s), and the stable flow stage (32–60 s). The simulated data are in good agreement with the experimental results, and the error range is within ±10%.
(2)
The pressure shows a gradual decline, which is followed by a sharp fall, before an incremental increase again. The drop in pressure is due to the original fluid being dispelled with the ingress of gas. As the gas moves upwards, the pressure it is subjected to decreases, which causes the gas to expand further. As a result, more fluid is dispelled, and the drop in pressure occurs faster. Up to the point when the gas reaches the wellhead, the downhole pressure is at its minimum.
(3)
The adjustment of wellhead back pressure is mainly realized by throttle valve. The higher the wellhead back pressure is, the smaller the downhole pressure will be. When the gas–liquid two-phase flow in the wellbore reaches an equilibrium state, the downhole pressure will decrease less with the increase of drilling fluid displacement, and the time of gas reaching the wellhead will be earlier.
(4)
The downhole pressure can be controlled by changing the density of drilling fluid. However, the adjustment of drilling fluid density has a serious lag. Considering the variation of gas invasion caused by reservoir pressure difference, there will be no stable gas–liquid two-phase flow equilibrium.
Further work needs to be done to couple the proposed method with deformation near the well at a small scale.

Author Contributions

Conceptualization, Y.M. and Q.F.; methodology, Q.F. and C.X.; validation, Q.F.; formal analysis, N.W.; investigation, Q.F.; resources, G.L.; data curation, Q.F.; writing—original draft preparation, Q.F.; writing—review and editing, N.W.; supervision, G.L.; project administration, Y.M.

Funding

This research was funded by the National Key Research and Development Program of China, Grant No. 2016ZX05021-004.

Acknowledgments

We would like to acknowledge the financial support from the National Key Research and Development Program of China, Grant No. 2016ZX05021-004.

Conflicts of Interest

The authors declare no conflict of interest.

References

  1. Feng, Y.; Li, G.; Meng, Y.; Guo, B. A novel approach to investigating transport of lost circulation materials in rough fracture. Energies 2018, 11, 2572. [Google Scholar] [CrossRef]
  2. Vega, M.P.; de Moraes Oliveira, G.F.; Fernandes, L.D.; Martins, A.L. Monitoring and control strategies to manage pressure fluctuations during oil well drilling. J. Pet. Sci. Eng. 2018, 166, 337–349. [Google Scholar] [CrossRef]
  3. Zhou, J.; Gravdal, J.E.; Strand, P.; Hovland, S. Automated kick control procedure for an influx in managed pressure drilling operations. Model. Identif. Control 2016, 37, 31–40. [Google Scholar] [CrossRef]
  4. Siddiqi, F.A.; Riskiawan, A.; Al-Yami, A.; Elmarsafawi, Y.; Jain, B.; Louati, I.; Martanto, R.; Taoutaou, S. Successful managed pressure cementing with hydraulic simulations verification in a narrow pore-frac pressure window using managed pressure drilling in Saudi Arabia. In Proceedings of the SPE Annual Technical Conference and Exhibition, Dubai, UAE, 26–28 September 2016. [Google Scholar]
  5. Nana, D.; Buyers, G.; Burton, D.; Gomes, J.; Pulpan, E.; Tickoo, A.; Meyer, A.W.; Munozrivera, M.; Silko, N.; Demidov, D. Successful application of self-degradable lost circulation control pill in managed pressure drilling for a deepwater well. In Proceedings of the IADC/SPE Asia Pacific Drilling Technology Conference, Singapore, 22–24 August 2016. [Google Scholar]
  6. Samuel, R.; Lovorn, R. Elastic Pipe Control and Compensation for Managed Pressure Drilling Under Sea Wave Heave Conditions. In Proceedings of the SPE/IADC Drilling Conference and Exhibition, London, UK, 17–19 March 2015. [Google Scholar]
  7. Khabibullin, T.; Falcone, G.; Teodoriu, C. Drilling through gas-hydrate sediments: Managing wellbore stability risks. SPE Drill. Complet. 2011, 26, 287–294. [Google Scholar] [CrossRef]
  8. Motghare, P.D.; Musale, A. Unconventional Hydrocarbons: Gas Hydrates—Drilling Challenges and Suitable Technology. In Proceedings of the SPE Oil and Gas India Conference and Exhibition, Mumbai, India, 4–6 April 2017. [Google Scholar]
  9. Rommetveit, R.; Davidson, I.; Svendsen, M. Real time engineering-based simulation training addresses risk in managed pressure drilling. In Proceedings of the SPE/IADC Drilling Conference and Exhibition, The Hague, The Netherlands, 14–16 March 2017. [Google Scholar]
  10. Linga, G.; Flåtten, T. A hierarchy of non-equilibrium two-phase flow models. ESAIM Proc. Surv. 2019, 66, 109–143. [Google Scholar] [CrossRef] [Green Version]
  11. Aarsnes, U.J.F.; Flåtten, T.; Aamo, O.M. Review of two-phase flow models for control and estimation. Annu. Rev. Control 2016, 42, 50–62. [Google Scholar] [CrossRef]
  12. Allaire, G.; Clerc, S.; Kokh, S. A Five-Equation Model for the Simulation of Interfaces between Compressible Fluids. J. Comput. Phys. 2002, 181, 577–661. [Google Scholar] [CrossRef]
  13. Ansari, M.R.; Daramizadeh, A. Slug type hydrodynamic instability analysis using a five equations hyperbolic two-pressure, two-fluid model. Ocean Eng 2012, 52, 1–12. [Google Scholar] [CrossRef]
  14. Morin, A.; Flåtten, T.; Munkejord, S.T. A Roe scheme for a compressible six-equation two-fluid model. Int. J. Numer. Methods Fluids 2013, 72, 478–504. [Google Scholar] [CrossRef]
  15. Morin, A.; Flåtten, T. A two-fluid four-equation model with instantaneous thermodynamical equilibrium. ESAIM M2AN 2016, 50, 1167–1192. [Google Scholar] [CrossRef]
  16. Zuber, N.; Findlay, J.A. Average volumetric concentration in two-phase flow systems. J. Heat Transf. 1965, 87, 453–468. [Google Scholar] [CrossRef]
  17. Ishii, M. One-Dimensional Drift-Flux Model and Constitutive Equations for Relative Motion between Phases in Various Two-Phase Flow Regimes; Argonne National Lab.: Lemont, IL, USA, 1977.
  18. Avelar, C.S.; Ribeiro, P.R.; Sepehrnoori, K. Deepwater gas kick simulation. J. Pet. Sci. Eng. 2009, 67, 13–22. [Google Scholar] [CrossRef]
  19. Vajargah, A.K.; van Oort, E. Early kick detection and well control decision-making for managed pressure drilling automation. J. Nat. Gas Sci. Eng. 2015, 27, 354–366. [Google Scholar] [CrossRef]
  20. de Carvalho, M.A.D.; de Moraes Oliveira, G.F.; Fernandes, L.D.; Martins, A.L.; Vega, M.P. Two-phase flow model validation during conventional/Pressurized Mud Cap Drilling (PMCD) scenarios. J. Pet. Sci. Eng. 2019, 172, 314–326. [Google Scholar] [CrossRef]
  21. Aarsnes, U.J.F.; Ambrus, A.; Di Meglio, F.; Karimi Vajargah, A.; Morten Aamo, O.; van Oort, E. A simplified two-phase flow model using a quasi-equilibrium momentum balance. Int. J. Multiph. Flow 2016, 83, 77–85. [Google Scholar] [CrossRef]
  22. Aarsnes, U.J.F.; Di Meglio, F.; Aamo, O.M.; Kaasa, G. Fit-for-purpose modeling for automation of underbalanced drilling operations. In Proceedings of the SPE/IADC Managed Pressure Drilling & Underbalanced Operations Conference & Exhibition, Madrid, Spain, 8–9 April 2014. [Google Scholar]
  23. Landet, I.S.; Mahdianfar, H.; Pavlov, A.; Aamo, O.M. Modeling for MPD operations with experimental validation. In Proceedings of the IADC/SPE Drilling Conference and Exhibition, San Diego, CA, USA, 6–8 March 2012. [Google Scholar]
  24. Hauge, E.; Aamo, O.M.; Godhavn, J.M.; Nygaard, G. A novel model-based scheme for kick and loss mitigation during drilling. J. Process Control 2013, 23, 463–472. [Google Scholar] [CrossRef]
  25. Saurel, R.; Abgrall, R. A multiphase Godunov method for compressible multifluid and multiphase flows. J. Comput. Phys. 1999, 150, 425–467. [Google Scholar] [CrossRef]
  26. Wei, N.; Xu, C.; Meng, Y.; Li, G.; Ma, X.; Liu, A. Numerical simulation of gas-liquid two-phase flow in wellbore based on drift flux model. Appl. Math. Comput. 2018, 338, 175–191. [Google Scholar] [CrossRef]
  27. Wang, N.; Sun, B.; Wang, Z.; Wang, J.; Yang, C. Numerical simulation of two phase flow in wellbores by means of drift flux model and pressure based method. J. Nat. Gas Sci. Eng. 2016, 36, 811–823. [Google Scholar] [CrossRef]
  28. Evje, S.; Fjelde, K.K. Hybrid Flux-Splitting Schemes for a Two-Phase Flow Model. J. Comput. Phys. 2002, 175, 674–701. [Google Scholar] [CrossRef]
  29. Evje, S.; Fjelde, K.K. On a rough AUSM scheme for a one-dimensional two-phase model. Comput. Fluids 2003, 32, 1497–1530. [Google Scholar] [CrossRef]
  30. Udegbunam, J.E.; Fjelde, K.K.; Evje, S.; Nygaard, G. On the advection-upstream-splitting-method hybrid scheme: A simple transient-flow model for managed-pressure-drilling and underbalanced drilling applications. SPE Drill. Complet. 2015, 30, 98–109. [Google Scholar] [CrossRef]
  31. Niu, Y.Y. Advection upwinding splitting method to solve a compressible two-fluid model. Int. J. Numer. Methods Fluids 2001, 36, 351–371. [Google Scholar] [CrossRef]
  32. Paillère, H.; Corre, C.; Cascales, J.R.G. On the extension of the AUSM+ scheme to compressible two-fluid models. Comput. Fluids 2003, 32, 891–916. [Google Scholar] [CrossRef]
  33. Evje, S.; Flåtten, T. Hybrid flux-splitting schemes for a common two-fluid model. J. Comput. Phys. 2003, 192, 175–210. [Google Scholar] [CrossRef]
  34. Udegbunam, J.E.; Fjelde, K.K.; Sui, D. Numerical integration of the AUSMV scheme with a dynamic wellbore temperature model. In Proceedings of the ASME 2018 37th International Conference on Ocean, Offshore and Arctic Engineering, Madrid, Spain, 17–22 June 2018. [Google Scholar]
  35. Meng, Y.; Xu, C.; Wei, N.; Li, G.; Li, H.; Duan, M. Numerical simulation and experiment of the annular pressure variation caused by gas kick/injection in wells. J. Nat. Gas Sci. Eng. 2015, 22, 646–655. [Google Scholar] [CrossRef]
  36. Shi, H.; Holmes, J.A.; Durlofsky, L.J.; Aziz, K.; Diaz, L.R.; Alkaya, B.; Oddie, G. Drift-flux modeling of multiphase flow in wellbores. In Proceedings of the SPE Annual Technical Conference and Exhibition, Denver, CO, USA, 5–8 October 2003. [Google Scholar]
  37. Lage, A.C.V.M.; Fjelde, K.K.; Time, R.W. Underbalanced Drilling Dynamics: Two-Phase Flow Modeling and Experiments. SPE J. 2003, 8, 61–70. [Google Scholar] [CrossRef]
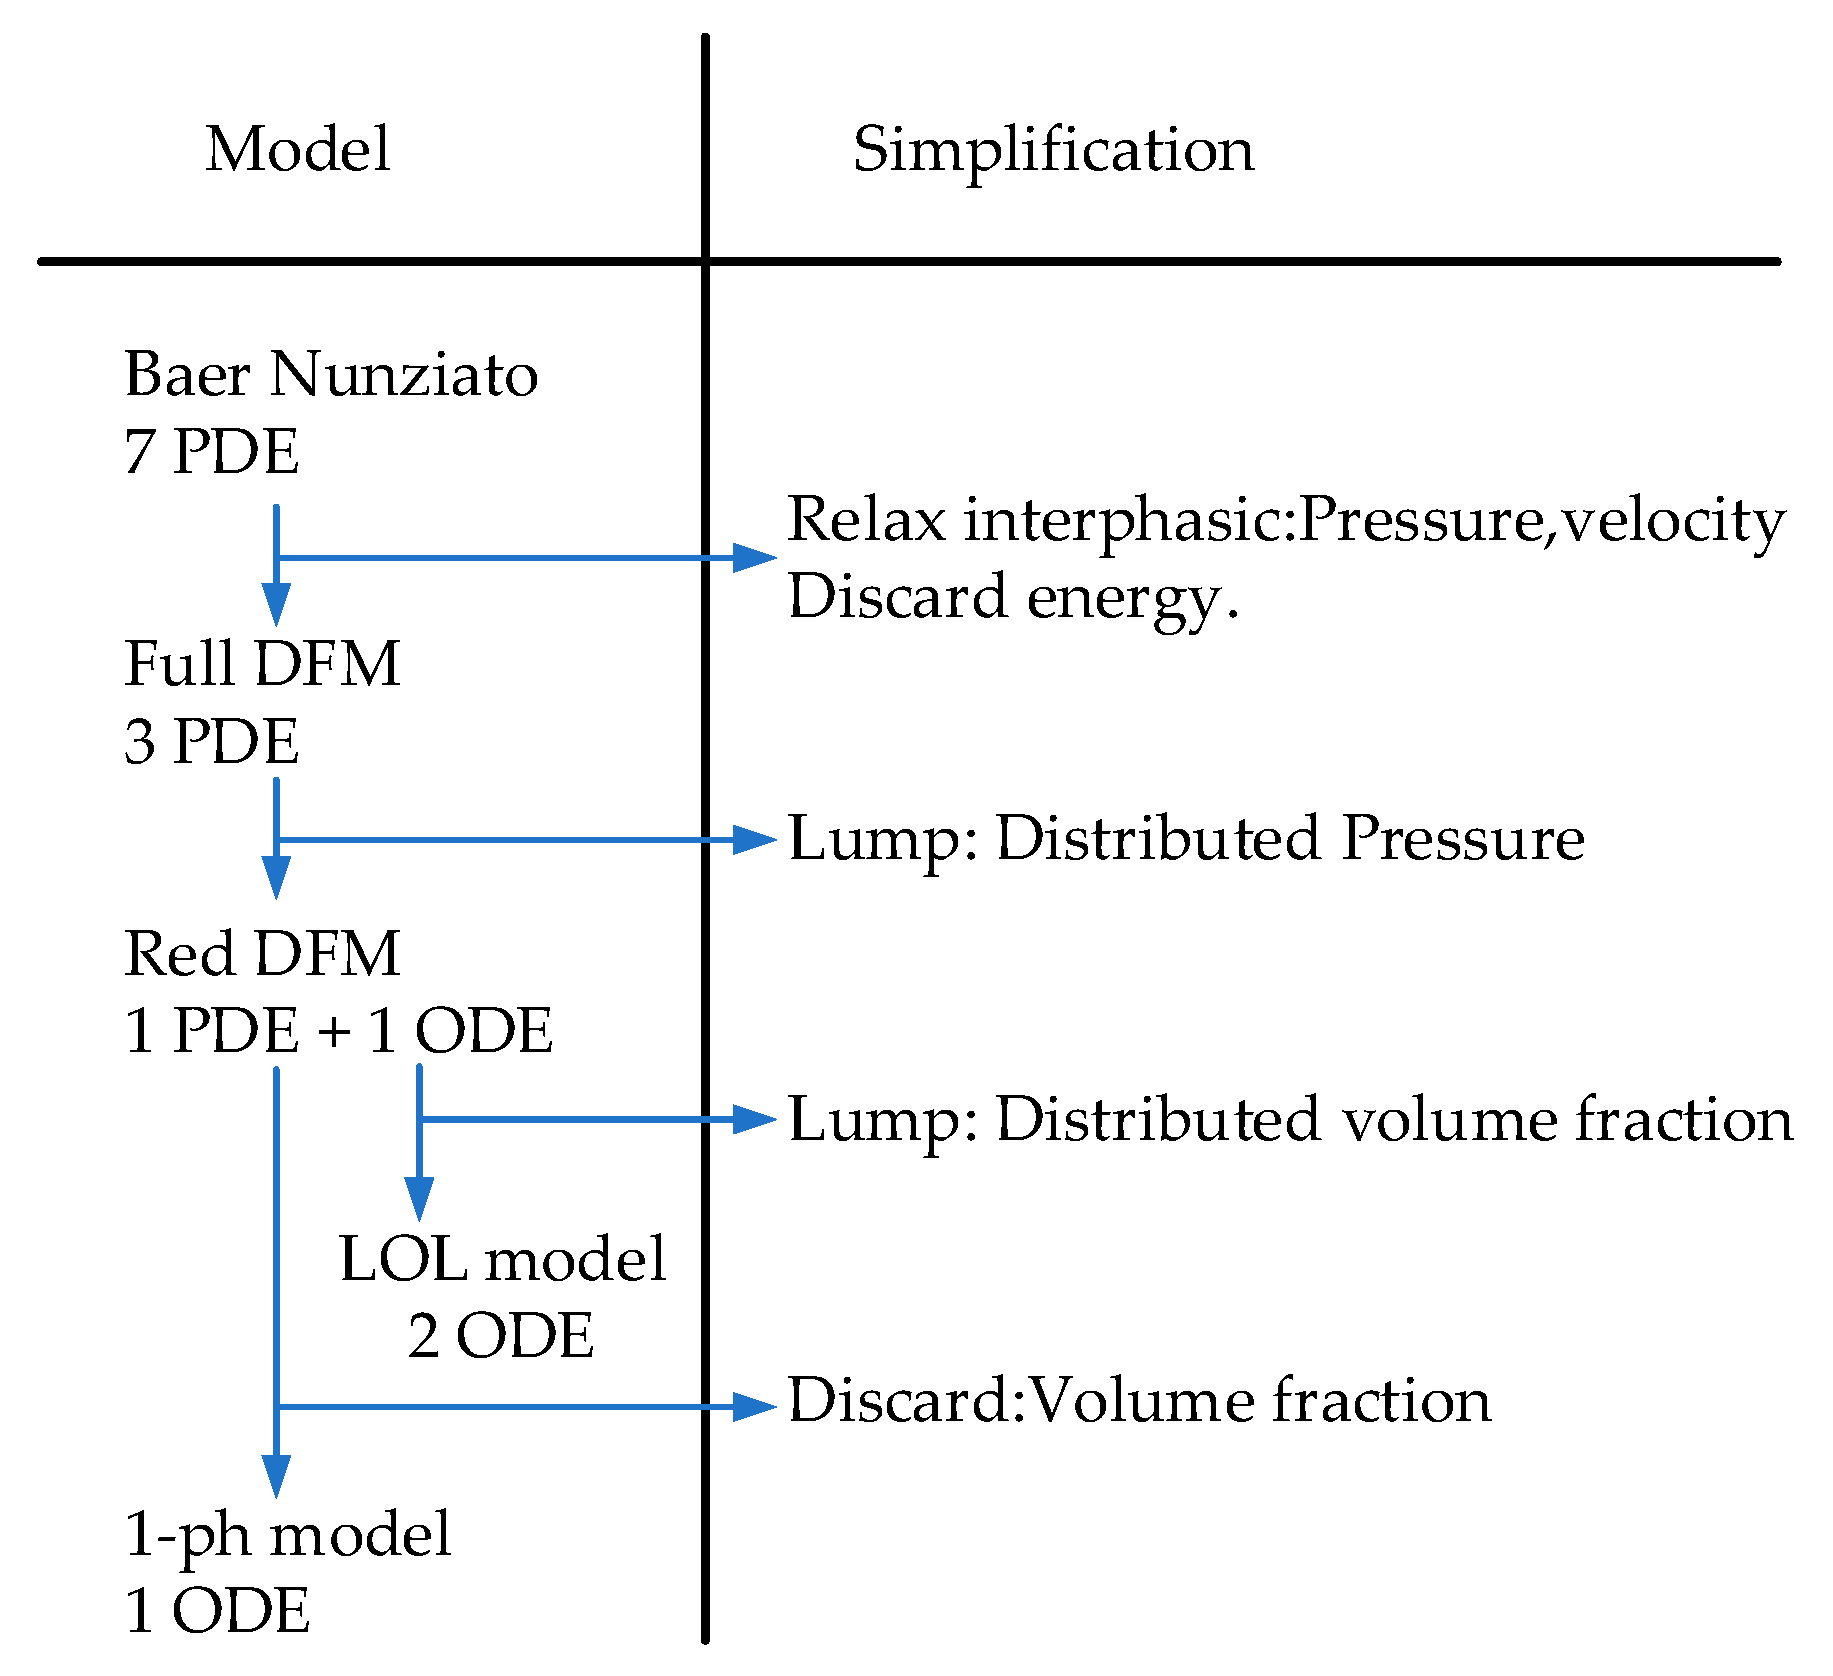
Figure 1. Relation between the models [11]. PDE: partial differential equation; DFM: drift flow model; and ODE: ordinary differential equation.
Energies 12 03930 g001
Figure 2. The typical hydraulic cycle of managed pressure drilling (MPD). BHA: bottom hole assembly.
Energies 12 03930 g002
Figure 3. The main calculation workflow. AUSM: advection upwind splitting method.
Energies 12 03930 g003
Figure 4. Schematic diagram of experimental equipment.
Energies 12 03930 g004
Figure 5. Air supply unit.
Energies 12 03930 g005
Figure 6. Liquid circulation system.
Energies 12 03930 g006
Figure 7. Pressure gauge.
Energies 12 03930 g007
Figure 8. Flow meter.
Energies 12 03930 g008
Figure 9. Experimental test.
Energies 12 03930 g009
Figure 10. Bottom hole pressure vs. time.
Energies 12 03930 g010
Figure 11. Gas mass flow rate vs. time [37].
Energies 12 03930 g011
Figure 12. Bottom hole pressure vs. time (605 m).
Energies 12 03930 g012
Figure 13. Variation in annular pressure at different: (a) times; and (b) depths.
Energies 12 03930 g013
Figure 14. Variation of gas holdup at different: (a) times; and (b) depths.
Energies 12 03930 g014
Figure 15. Variation of the gas mass flow at different: (a) times; and (b) depths.
Energies 12 03930 g015
Figure 16. Variation of liquid mass flow at different: (a) times; and (b) depths.
Energies 12 03930 g016
Figure 17. Variation in the bottom hole pressure under different back pressures at different: (a) times; and (b) depths.
Energies 12 03930 g017
Figure 18. Variation in the bottom hole pressure at different liquid densities at different: (a) times; and (b) depths.
Energies 12 03930 g018
Figure 19. Variation in the bottom hole pressure at different liquid flow rates at different: (a) times; and (b) depths.
Energies 12 03930 g019
Figure 20. Variation in the bottom hole pressure at different pressure differences at different: (a) times; and (b) depths.
Energies 12 03930 g020
Table 1. Geometric parameters.
Well Depth (m)Outer Tubing Diameter (m)Casing Diameter (m)
0–5000.0890.2523
500–28000.0890.15708
2800–36000.1270.1469
Table 2. Calculation parameters.
ParameterUnitValueParameterUnitValue
Liquid densitykg/m31100Surface temperatureK293.15
Back pressurePa101325Temperature gradientK/(100 m)2.2
Liquid viscosityPa·s0.02Surface tensionN/m0.0761
Gas viscosityPa·s0.0000015Sound velocity in liquidm/s1200