Article

Energy Performance of an Encapsulated Phase Change Material PV/T System

1
School of Mechanical Engineering, Southwest Jiaotong University, Chengdu 610030, China
2
Sichuan Institute of Building Research, Chengdu 610030, China
*
Author to whom correspondence should be addressed.
Energies 2019, 12(20), 3929; https://doi.org/10.3390/en12203929
Submission received: 29 August 2019 / Revised: 11 October 2019 / Accepted: 14 October 2019 / Published: 16 October 2019
(This article belongs to the Special Issue Building Renewable Energy and Thermal Energy Storage System 2019)

Abstract

:
This study aimed to investigate the performance of a novel encapsulated phase change material (PCM) photovoltaic/thermal (PV/T) system. A PCM, which has a high latent heat capacity, can absorb energy from a PV cell and reduce the operating temperature, improving both the electrical and thermal efficiencies of the panel. In this study, a computer model based on a PCM PV/T panel is developed, and its accuracy is verified using experimental data. The effect of the phase change temperature on the performance of the panel was analyzed by numerical simulation. When the phase change temperature was 30.1 °C, the system exhibited a maximum electrical efficiency of 8.2% and a thermal efficiency of 71.8%. When the phase change temperature was 20.24 °C, the system had a maximum exergy efficiency of 33.7%. In general, the temperature of the PCM integrated into the PV/T system should not be too high.

1. Introduction

With the rapid social and economic development, the consumption of energy is increasing worldwide. Solar energy has huge potential as a clean energy source. Photovoltaic (PV) technology uses PV cells to convert sunlight into electricity. However, if the temperature of a PV cell increases by 1 °C, the electrical efficiency will decrease by 0.45% [1]. To achieve a higher electrical efficiency, PV panels need to be cooled down using some devices [2]. To this end, a photovoltaic/thermal (PV/T) technology has been developed to generate electricity, while storing the thermal energy, thus, improving the solar energy capture.
Based on the type of cooling liquid used, a PV/T panel can be classified into three types: air-cooled, liquid-cooled, and refrigerant-cooled types. Many researchers have evaluated the performance of these panels using experimental and theoretical methods. Slimani [3] presented a PV/T solar collector embedded in an indirect solar dryer system. The calculation results showed that the hybrid PV/T collector provides a more suitable air temperature for drying agricultural products. Sun [4] built a PV/T hot water system to study the connection modes of modules. The result showed that compared with parallel connection, electric power for series connection decreases by 2.0%, thermal energy increases by 11.4%, and total energy increases by 5.4%. Su [5] compared four configurations of a PV/T collector with dual channels, in which water and air were used as working fluids. This work provided guidance for selecting a suitable working fluid depending on different needs. Water is a good working fluid for PV/T systems. owing to its high heat conductivity and high specific heat capacity.
To increase the efficiency of a PV/T system, a phase change material (PCM) was incorporated into the system to limit the temperature of PV cells by absorbing heat via a phase change [6]. Yang [7] experimentally investigated the use of a PCM layer in a PV/T-PCM module under solar radiation. The addition of the PCM layer was found to be quite effective in enhancing the solar thermal and power performances. Navarro [8] tested a PCM PV/T collector under outdoor conditions and demonstrated that the PCM layer could achieve approximately 20% energy savings compared with the PV/T collector without a PCM layer. Serale [9] developed a physical–mathematical model for a solar collector with a slurry PCM; this helped increase the latent heat of the heat carrier fluid. The simulation results showed that the PCM slurry can improve the efficiency of the system by approximately 20–40%. PCM PV/T systems are often used in buildings, providing benefits such as electricity generation and thermal management [10]. Lin [11] compared three types of buildings using a PV/T collector only, using a PCM only, and without using PV/T collectors or PCM. The results showed that the two methods could effectively improve the indoor thermal performance of the house. Malvi [12] theoretically investigated a PV/T-PCM system and showed that the electrical efficiency of the PV/T panel increases with the decrease in the thermal efficiency. When the difference in the temperature at the inlet and outlet of the module is approximately 20 °C, the electrical efficiency can be increased by 9% using a suitable PCM. Browne [13] experimentally compared and analyzed the thermal collecting capacity of a PV/T-PCM and PV/T systems. The temperature of water at the outlet of the PV/T-PCM panel was found to be higher than that of the PV/T panel by 6 °C. Qiu [14] theoretically studied the performance of a PV/T system comprising a phase change microcapsule suspension as the working fluid. The results showed that when the fluid state is turbulent, the overall efficiency can be improved. When the suspension concentration is 5% and the Reynolds number is 3350, the overall efficiency of the PV/T panel reached its peak point. Based on a numerical simulation, Qiu [15] carried out an experiment on a novel PV/T panel to analyze its performance in terms of the solar radiation, Reynolds number, and suspension concentration. Yin [16] combined a PV/T panel and a PCM storage unit to provide hot water for a building. The surplus energy was stored in the PCM storage unit, which provided continues hot water.
Studies on systems comprising PCM and PV panels are plenty; researchers have often selected different PCM applications, different structures, and operating parameters. As an important factor influencing the system, the phase change temperature directly affects the temperature of a PV panel, thus influencing the system efficiency. However, in existing research, only a single PCM has been used for applications, and few materials with different phase change temperatures have been studied for comparison. To understand the effect of the phase change temperature on a PV/T-PCM system, five materials with different phase change temperatures (20.24, 30.1, 41.72, 53.95, and 61.99 °C) were selected in this study.
To identify the characteristics of the system, its energy performance was theoretically investigated. The research results reported in this paper are expected to help accelerate the deployment of PV/T-PCM technologies, thereby contributing to global energy savings and reduction in the use of fossil fuels.

2. System Description

As shown in Figure 1 and Figure 2, the PV/T-PCM system comprises five parts: (1) a PV/T-PCM model, (2) a storage tank, (3) a water pump, (4) a flow meter, and (5) a maximum power point tracking controller. When the system is working, a part of the solar energy is converted into electricity. The rest is transferred in the form of thermal energy, which can be divided into three parts: (1) one that is taken away by the circulating water, which is stored in the storage tank, (2) one that is absorbed by the PCM, which can store the thermal energy in the form of latent heat, and (3) one that is released to the surroundings. The PCM absorbs the surplus energy that cannot be taken away by the circulating water and keeps the PV/T system operating at a low temperature, resulting in higher electrical and thermal efficiencies.
As shown in Figure 2, this experiment was carried out in a laboratory under a controlled indoor environment with a radiation of 800 W/m2 and water flow rate of 0.15 m3/h. During the test, the temperatures of the PV/T panel, surrounding, PCM, water at the inlet and outlet of the panel, and water in the tank were measured and collected. The solar radiation and flowrate of the circulating water were recorded. These data provide a basis for the comparison between the experimental and simulation results.
The measured parameters used to evaluate the PV/T and PV/T-PCM systems included temperature, solar irradiance, water flow rate, electrical power, voltage, and current. Table 1 details the main parameter measurement configuration of the experimental system.

3. Simulation Models of the PV/T-PCM System

Simulation models of all the components of the PV/T-PCM system were developed, including a solar radiation model, a PV/T-PCM panel model, and a storage tank model.
When the system is working, it is influenced by many different factors; however, it is difficult to cover all of them in the models. Therefore, the following assumptions were made:
  • Owning to the high-quality insulation at the back of the PV/T panel and on the surface of storage tank and surrounding condition (wind speed is 0), the heat loss to the surroundings is ignored.
  • The temperature gradient of the glass and PV cell in the thickness direction is ignored.
  • When the circulating water enters the tank, it is mixed fully with the water in the tank, and there is no temperature stratification in the water tank.
  • The water is a single-phase liquid and cannot be compressed.
  • The viscous dissipation during the flow of the PCM fluid is ignored.

3.1. Solar Radiation Model

The total solar radiation comprises solar direct radiation and scattered radiation. The sunlight angle of direct radiation is steady, whereas that of the scattered radiation varies with time.

3.1.1. Simulation Model of Sunlight Incidence

The sunlight incidence is the angle between the sun’s rays and the normal to the inclined surface. According to Duffie [17], it has a certain functional relationship with other angles, as expressed in Equations (1) and (2):
c o s   θ T = s i n δ   s i n φ   c o s β s i n δ c o s φ s i n β c o s γ + c o s δ   c o s φ   c o s β   c o s ω   + c o s δ   s i n φ   s i n β c o s γ c o s ω + c o s δ   s i n β   s i n γ   s i n ω
c o s θ T   = c o s θ z   c o s β + s i n θ z   s i n β   c o s γ s γ  
Here, θ T is the sunlight incidence; δ is the solar declination angle;   β is the inclined plane inclination angle; γ is the inclined plane azimuth angle; ω is the time angle; θ z is the solar zenith angle; and γ s is the solar azimuth angle.
When β = 0 ° , from Equations (1) and (2), it can be found that:
c o s   θ h   = c o s φ c o s δ c o s ω   + s i n φ s i n δ  

3.1.2. Solar Direct Radiation

The solar radiation with the installed angle β can be given as:
G b t = G b h c o s   θ T   c o s   θ h  
where G b h is the direct radiation value on the horizontal surface (W/m2); and G b t is the direct radiation value on the inclined surface (W/m2).

3.1.3. Scattered Radiation

The Perez model [18] is used for calculating the diffuse solar radiation on an inclined surface, as follows:
G d t = G d h 1 F 1 β 2   + F 1 0 ,   c o s   θ T     c o s   85 , c o s   θ h  
where G d h is the scattered radiation on a horizontal plane (W/m2); G d t is the scattered radiation on an inclined surface (W/m2).

3.1.4. Ground Reflected Radiation

The ground feflected rdiation ( G g r t ) can be expressed as:
G g r t = G b h + G d h ζ 1 c o s   θ T   2
where ζ is the ground reflectivity [17]. The value for ordinary ground is 0.2, whereas it is 0.7 when the ground is covered with snow.

3.1.5. Total Solar Radiation

The total solar radiation can be expressed as:
G t t = G b t + G d t + G g r t
where G t t is the total solar radiation on an inclined surface (W/m2).

3.2. Simulation Model of the PV/T-PCM Panel

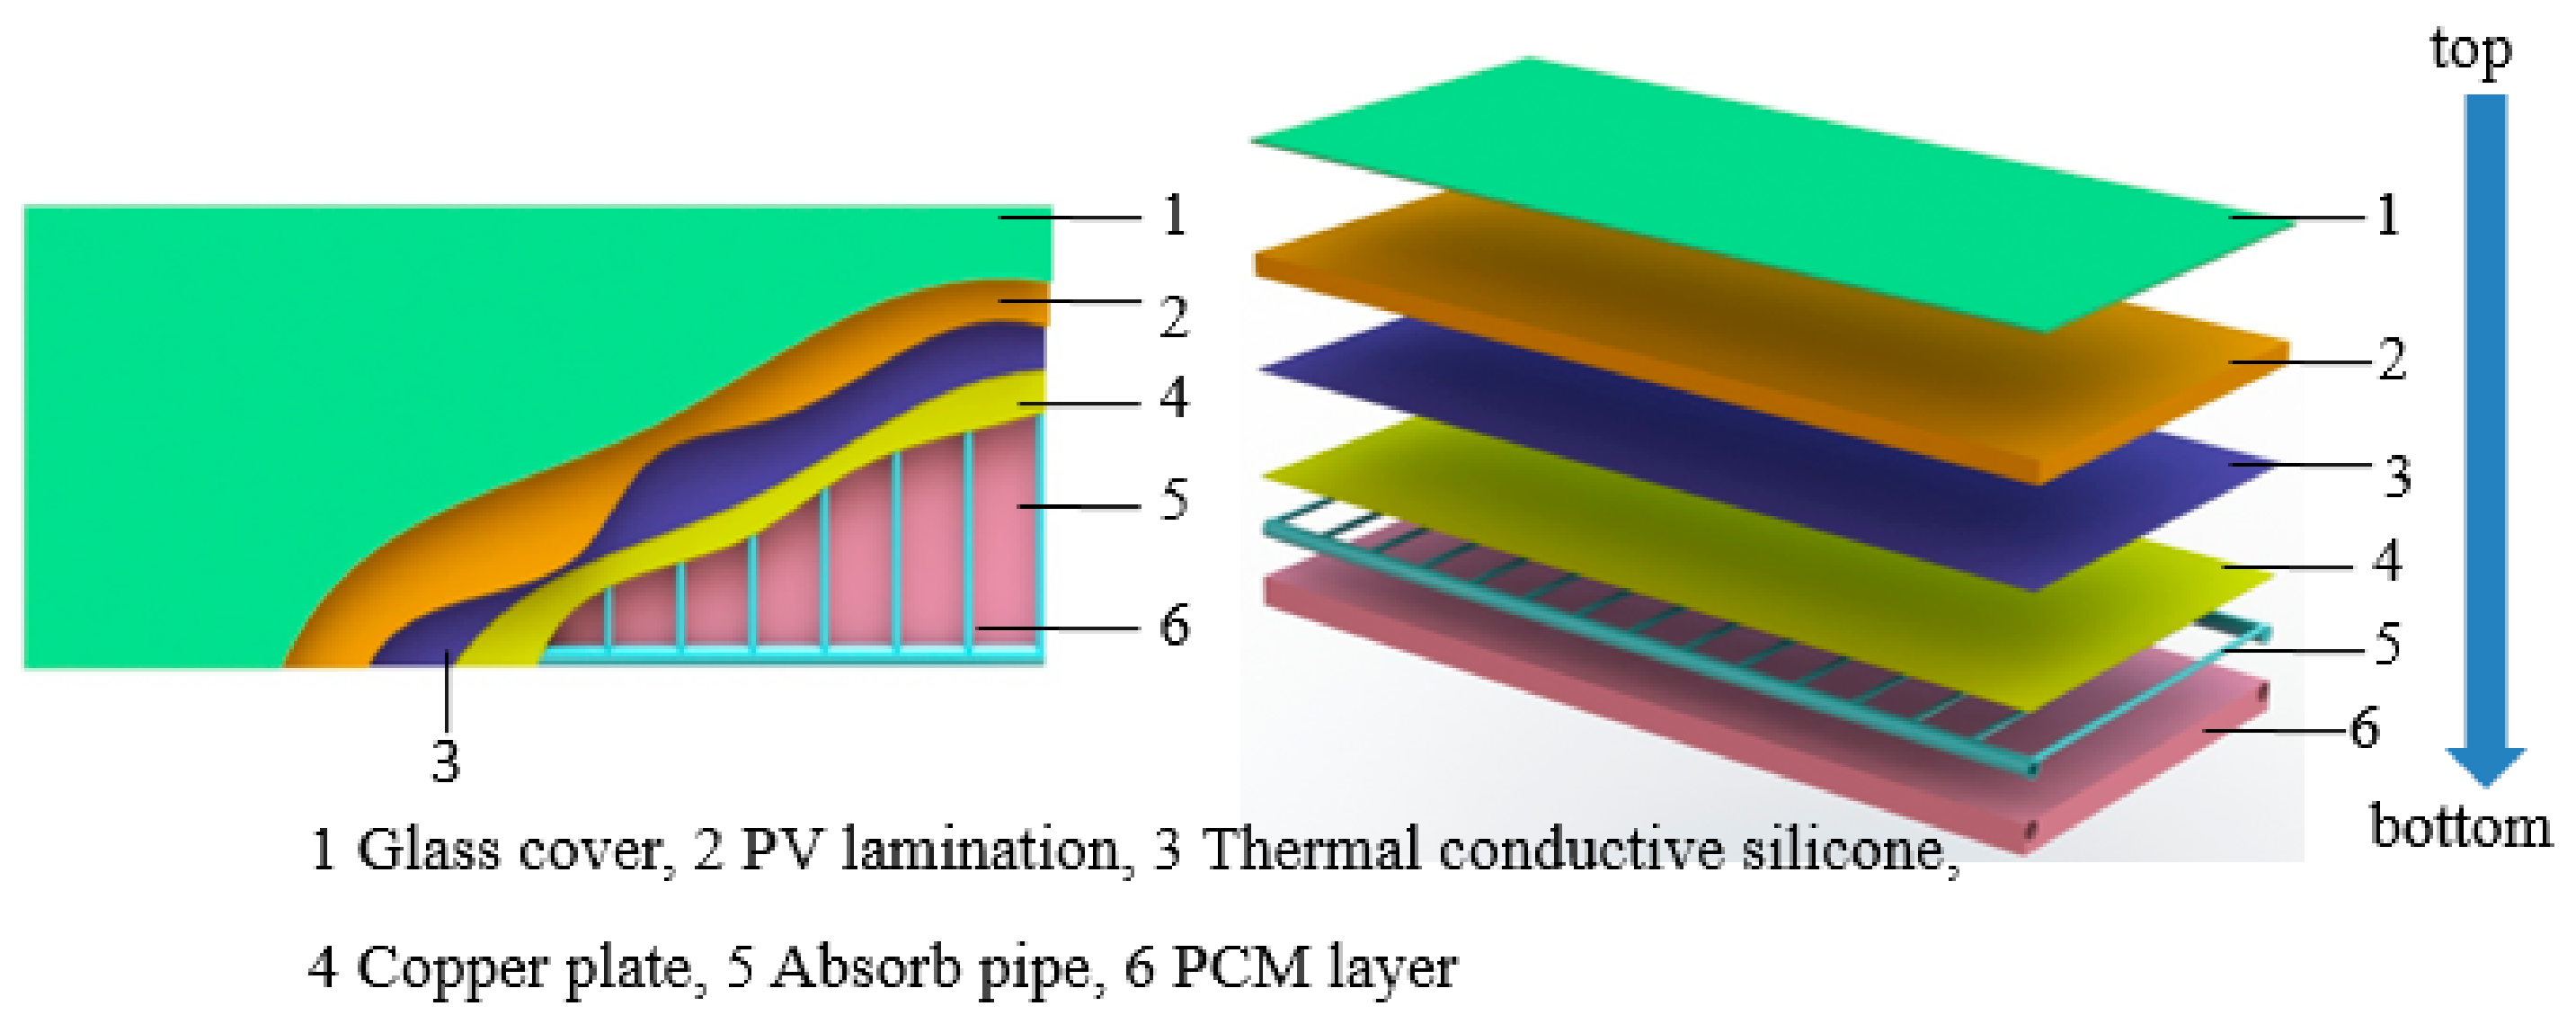
As shown in Figure 3, the components of the PV/T-PCM panel, from top to bottom, are (1) a glass cover; (2) a PV cell layer; (3) a thermally conductive silicone grease layer; (4) an absorber; (5) a heat exchanger tube; and (6) a PCM layer. All the tubes are connected in parallel. The gap between the tubes is 80 mm, and the inside and outside diameters of the tube are 8 and 10 mm, respectively.

3.2.1. Simulation Model of the Glass Cover

The simulation model of the glass cover is the same as that used by Chow [19]. The equation can be given as:
ρ g C g l g T g t = G g + h o T o a T g + h g s T s T g + h r , p g + h c , p g T P T g
Here, ρ g , C g l g , and T g are the density (kg/m3), thermal capacity (kJ/(kg·K), thickness (m), and temperature (K) of the glass cover, respectively; G g is the solar energy absorbed by the glass cover (W); h o and h c , p g are the heat transfer rates between the glass cover and the surroundings and between the glass cover and the PV cell layer, respectively (W/(m2·K)); h g s and h r , p g are the radiation heat transfer rates between the glass cover and the sky and between the glass cover and the PV cell, respectively (W/(m2·K)); and T o a , T s , T g and T P are the ambient temperature, sky temperature, glass cover and PV cell temperature (K), respectively.
The equation for the solar energy absorbed by the glass cover can be expressed as:
G g = α b g G b t + α d g G d t + α g r g G g r t
where α b g , α d g , and α g r g are the absorption factors of the glass cover to solar direct radiation, scattered radiation, and earth surface reflection, respectively.
The heat transfer rate between the glass cover and the surroundings is affected by the wind speed and direction [20]. The relevant equations are as follows:
h o = 16.2 ν o 0.45
ν o = 0.68 ν r 0.5   ( 20 ° φ 160 ° )
ν o = 1.57 ν r 0.027   ( φ 20 °   o r   φ 160 ° )
where ν r is the wind speed (m/s); and φ is the incidence angle (°).
According to the Stefan–Boltzmann law, the radiation heat transfer rate between the glass cover and the sky can be expressed as:
h g s = σ ε g T s + T g T s 2 + T g 2
where σ is the Stefan–Boltzmann constant, which is 5.6697 × 10⁻⁸ (W/(m2·K4)); ε g is the emissivity of the glass cover. The sky temperature is simply the ambient temperature [15].
The radiation heat transfer rate between the glass cover and the PV cell can be expressed as:
h r , p g = σ T s + T g T S 2 + T g 2 ζ 1 ε p + ζ 1 ε g 1 + 1 ζ 1 ε T P T + 1 ζ 1 ε g 1
where ε p is the emissivity of the PV cell; ε T P T is the emissivity of the Tedlar-Polyester-Tellar (TPT); and ζ is the PV cell cover factor.
An air gap is designed between the glass cover and the PV cell, and the natural convection heat transfer rate can be given as [17]:
h c , p g = N u λ a l a
N u = 1 + 1.44 1 1708 R a   c o s   c o s   β   + 1 1708   s i n   s i n   1.8 β   1.6 R a   c o s   c o s   β   + R a   c o s   c o s   β   5830 1 3 1 +
R e = g B a l a 3 ν a k a T P T g
where N u is the Prandtl number of air between the glass cover and the absorber; + indicates a positive value; λ a is the thermal conductivity of air (W/(m·K)); l a is the thickness of the air gap (m); R e is the Rayleigh number; g is the acceleration due to gravity (m/s2); B a is the air expansion coefficient (1/K); ν a is the kinematic viscosity of air (m2/s); and k a is the air diffusivity (m2/s).

3.2.2. Simulation Model of a PV Cell Layer

To simplify the heat transfer process, the effects of TPT and Ethylene-vinyl acetate (EVA) are ignored. The equation for the PV cell can be given as:
ρ p C p l p T p t = λ p 2 T p x 2 d x + λ p 2 T p y 2 d y + 1 η p v G p + h c , p g + h r , p g T g T p + T c T p R s i
where l p is the thickness of the PV layer (m); ρ p is the density (kg/m3); C p is the specific heat capacity (J/(kg·K));   λ p is the thermal conductivity of the PV cell (W/(m·K)); R s i is the thermal resistance of the thermally conductive silicon grease (m2·K/W); and G p is the solar energy absorbed by the PV cell (W/m2).
The relationship between the temperature of the PV cell and the electrical efficiency is as follows [21]:
η p v = η r 1 0.0045 T p 298.15
where η r is the electrical efficiency of the PV under standard condition (16%); T p is the reference operating temperature (298.15 K).
The equation for the solar energy absorbed by the PV cell can be given as:
G p = α p τ b g G b t + τ d g G d t + τ g r g G g r t
where α p is the absorption factor of the PV cell to solar direct radiation; τ b g , τ d g and τ g r g are the transmissivities of the glass cover to direct and scattered radiations and earth surface reflection, respectively.

3.2.3. Simulation Model of the PCM

The temperature method and enthalpy-porous medium method models were selected to analyze the heat transfer process of the energy in the phase change region. For the former model, the temperature was set as the unique variable, and the equations were solved for the solid phase and liquid phase regions. For the latter, both the temperature and enthalpy were set as the variables. An equation relating the temperature and enthalpy was derived based on liquid fraction, and then, a continuity equation was derived to describe the variation process in the entire region. Compared with the temperature method model, the enthalpy-porous medium method model has been more applied widely, as it ignores the solid-liquid partitioning and moving boundary [22].
To analyze the convective heat transfer process in the liquid PCM, the Boussinesq assumption is introduced to simplify the relationship between the temperature and the density of the PCM.
ρ g p c m = ρ p c m 1 B p c m T p c m T r e f
where ρ g p c m is the density of the PCM in the volume force source term at momentum of gravity direction (kg/m3); ρ p c m is the density of the PCM (kg/m3); B p c m is the thermal expansion coefficient (1/K); T p c m   is the temperature of the PCM (°C); and   T r e f is the reference temperature (°C).
Based on the assumption, a three-dimensional transient equation is developed, relative to the phase change layer. It can be expressed as:
· u = 0
where u is the speed vector (m/s).
The momentum equation can be given as follows.
ρ u t + ρ · u u = P + μ 2 u + ρ g 1 α T T r e f + S
where t is the time (s);   P is the pressure (Pa); μ is the dynamic viscosity ((N·S/m2); and S is the source item.
The energy equation can be given as follows:
t ρ H + · ρ u H = · λ T
H = h s + Δ H
where λ is the thermal conductivity (W/(m·k)); H is the total enthalpy of the PCM (kJ/kg). It is composed of sensible heat   h s and latent heat Δ H , expressed as follows:
h s = h s r e f + T r e f T C P p c m d T
Δ H = ϖ L
β = 0 ,                                           i f       T   T s o 1 ,                                     i f       T m T     T T s o T m T s o ,                               i f       T s o < T < T m  
where h s r e f is the reference enthalpy (kJ/kg); C P p c m is the specific heat of the PCM (kJ/(kg·K)); ϖ is the liquid phase rate; L is the standard latent heat (kJ/kg); and T s o and T m are the solidification and melting temperatures (°C), respectively.
The source item S in Equation (23) can be expressed as follows:
S = A m u s h u 1 ϖ 2 ϖ 3 + χ
where A m u s h is the constant for the solid–liquid fuzzy region, which can be set to 105; χ is an auxiliary value, which prevents the denominator from turning to 0.

3.3. Simulation Model of the Storage Tank

The energy difference between the inlet and outlet of the tank was assumed to be equal to the energy variation of the water in the tank, and during this process, the variations in the specific heat and density of the water due to temperature variation were ignored. The equation is as follows:
ρ r w p C r w p = ρ w C w
The equation for the tank can be given as:
M w C w T w t = π d c p 2 4 V w ρ w C w T r w p T w
where M w is the quality of the water in the tank (kg); C w and C r w p are the specific heats of water (kJ/(kg·K)); T w is the water temperature in the tank (K); d c p is the inside dimeter of the pipe (m); V w is the flow rate of the water (m/s); ρ r w p and ρ w are the densities of water (kg/m3); and T r w p is the water temperature at the outlet of the PV/T panel (K).

4. Method and Process of Solving the Simulation Model

The dynamic mathematical model of the PV/T-PCM system is composed of Equations (8), (18), and (31). These equations can be solved using the finite difference method, and the discrete formulae can be given as follows:
T t i , j , k = T i , j k + 1 T i , j k Δ t
2 T x 2 i , j , k = T i 1 , j k 2 T i , j k + T i + 1 , j k Δ x 2
2 T y 2 i , j , k = T i , j 1 k 2 T i , j k + T i , j + 1 k Δ y 2
where k is the time step; and i and j are the distance steps in the x and y directions, respectively.
The temperature of the glass cover can be obtained as follows:
T g m , n k + 1 = G g + h o T o a T g m , n k + σ ε g T s 4 T g m , n k 4 + h r , p g k + h c , p g k T p i , j k T g m , n k Δ t ρ g C g l g + T g m , n k
The temperature of the PV cell can be obtained as follows.
T p i , j k + 1 = λ p Δ t ρ p C p l p T p i 1 , j k 2 T p i , j k + T p i + 1 , j k Δ x + T p i , j 1 k 2 T p i , j k + T p i , j + 1 k Δ y + Δ t G P ρ p C p l p 1 η r 1 0.0045 T p i , j k 298.15 + Δ t ρ p C p l p h c , p g + h r , p g T g m , n k T p i , j k + T c k T p i , j k R s i + T p i , j k
where T g m , n k + 1 is the temperature of a unit whose coordinate is (m, n) at time k + 1; and T p i , j k + 1 is the temperature of a unit whose coordinate is (i, j) at time k + 1. At the beginning, m = i and n = j, and T c k can be obtained from Fluent.
For the equation of the water tank, assuming that T w = T i n , T r w p = T o u t , Equation (31) can be simplified as:
M w C w T i n t = π d c p 2 4 V w ρ C w   T o u t   T i n
T i n t = π d c p 2 4 M w C w V w   ρ C w T o u t   T i n
According to the backward difference format:
T i n t k = T i n k + 1 T i n k Δ t
π d c p 2 4 M w C w V w   ρ w C w = A
T i n t = A T o u t   T i n
T i n k + 1 = Δ t A T o u t k + T i n k 1 Δ t A
where T i n k and T i n k + 1 are the water temperatures at the outlet of the tank at time k and k + 1, respectively; these are also the temperatures at the inlet of the PV/T-PCM panel at time k and k + 1; and T o u t k is the water temperature at the inlet of the tank at time k; this is also the temperature at the outlet of the PV/T-PCM panel at time k.
The simulation models of the components of the PV/T-PCM panel were developed based on the software ICEM. The models include 15 pieces of a heat exchange pipe (size: 1200 × 80 × 42 mm) connected in parallel. The simulation models are composed of a PV cell, a thermal grease layer, an absorber, a heat exchange pipe, and a PCM layer. The heat transfer process in the PCM layer is very complex, and to achieve an accurate result, the grid refinement was carried out within this part. Similarly, the contact region between the heat exchange pipe and the PCM was also handled using the same method, owning to its high temperature gradient.
FLUENT14.0 [23] was used to solve the equation of the PV/T-PCM panel, and the Quasi-k-ε two-equation model was introduced to analyze the flow process of the liquid in the panel. Table 2 lists the parameters of the components. The information of the PCM was measured experimentally, and the others were from the supplier.
At the beginning, the temperatures of the cooling liquid, PV cell, glass cover, and PCM layer are set to T 0 , as follows:
T i n = T P = T G = T C = T 0   t = 0

5. Experimental Verification of the Simulation Model

5.1. Error Analysis

The relative error (RE) and mean error (MRE) between the experimental and simulation results were used to verify the accuracy of the simulation model:
R E = X e x p X s i m X e x p × 100 %
M R E = i = 1 i = N X e x p X s i m i = 1 i = N X e x p X e x p × 100 %
where X e x p and X s i m are the experimental and simulated values, respectively (°C).

5.2. Simulation Model Verification

A typical day’s weather data (15 October 2016) were used as input parameters to verify the accuracy of the simulation model, which includes the solar radiation (800 W/m2), ambient temperature (28.0 °C), and flowrate of the cooling liquid (0.15 m3/h).
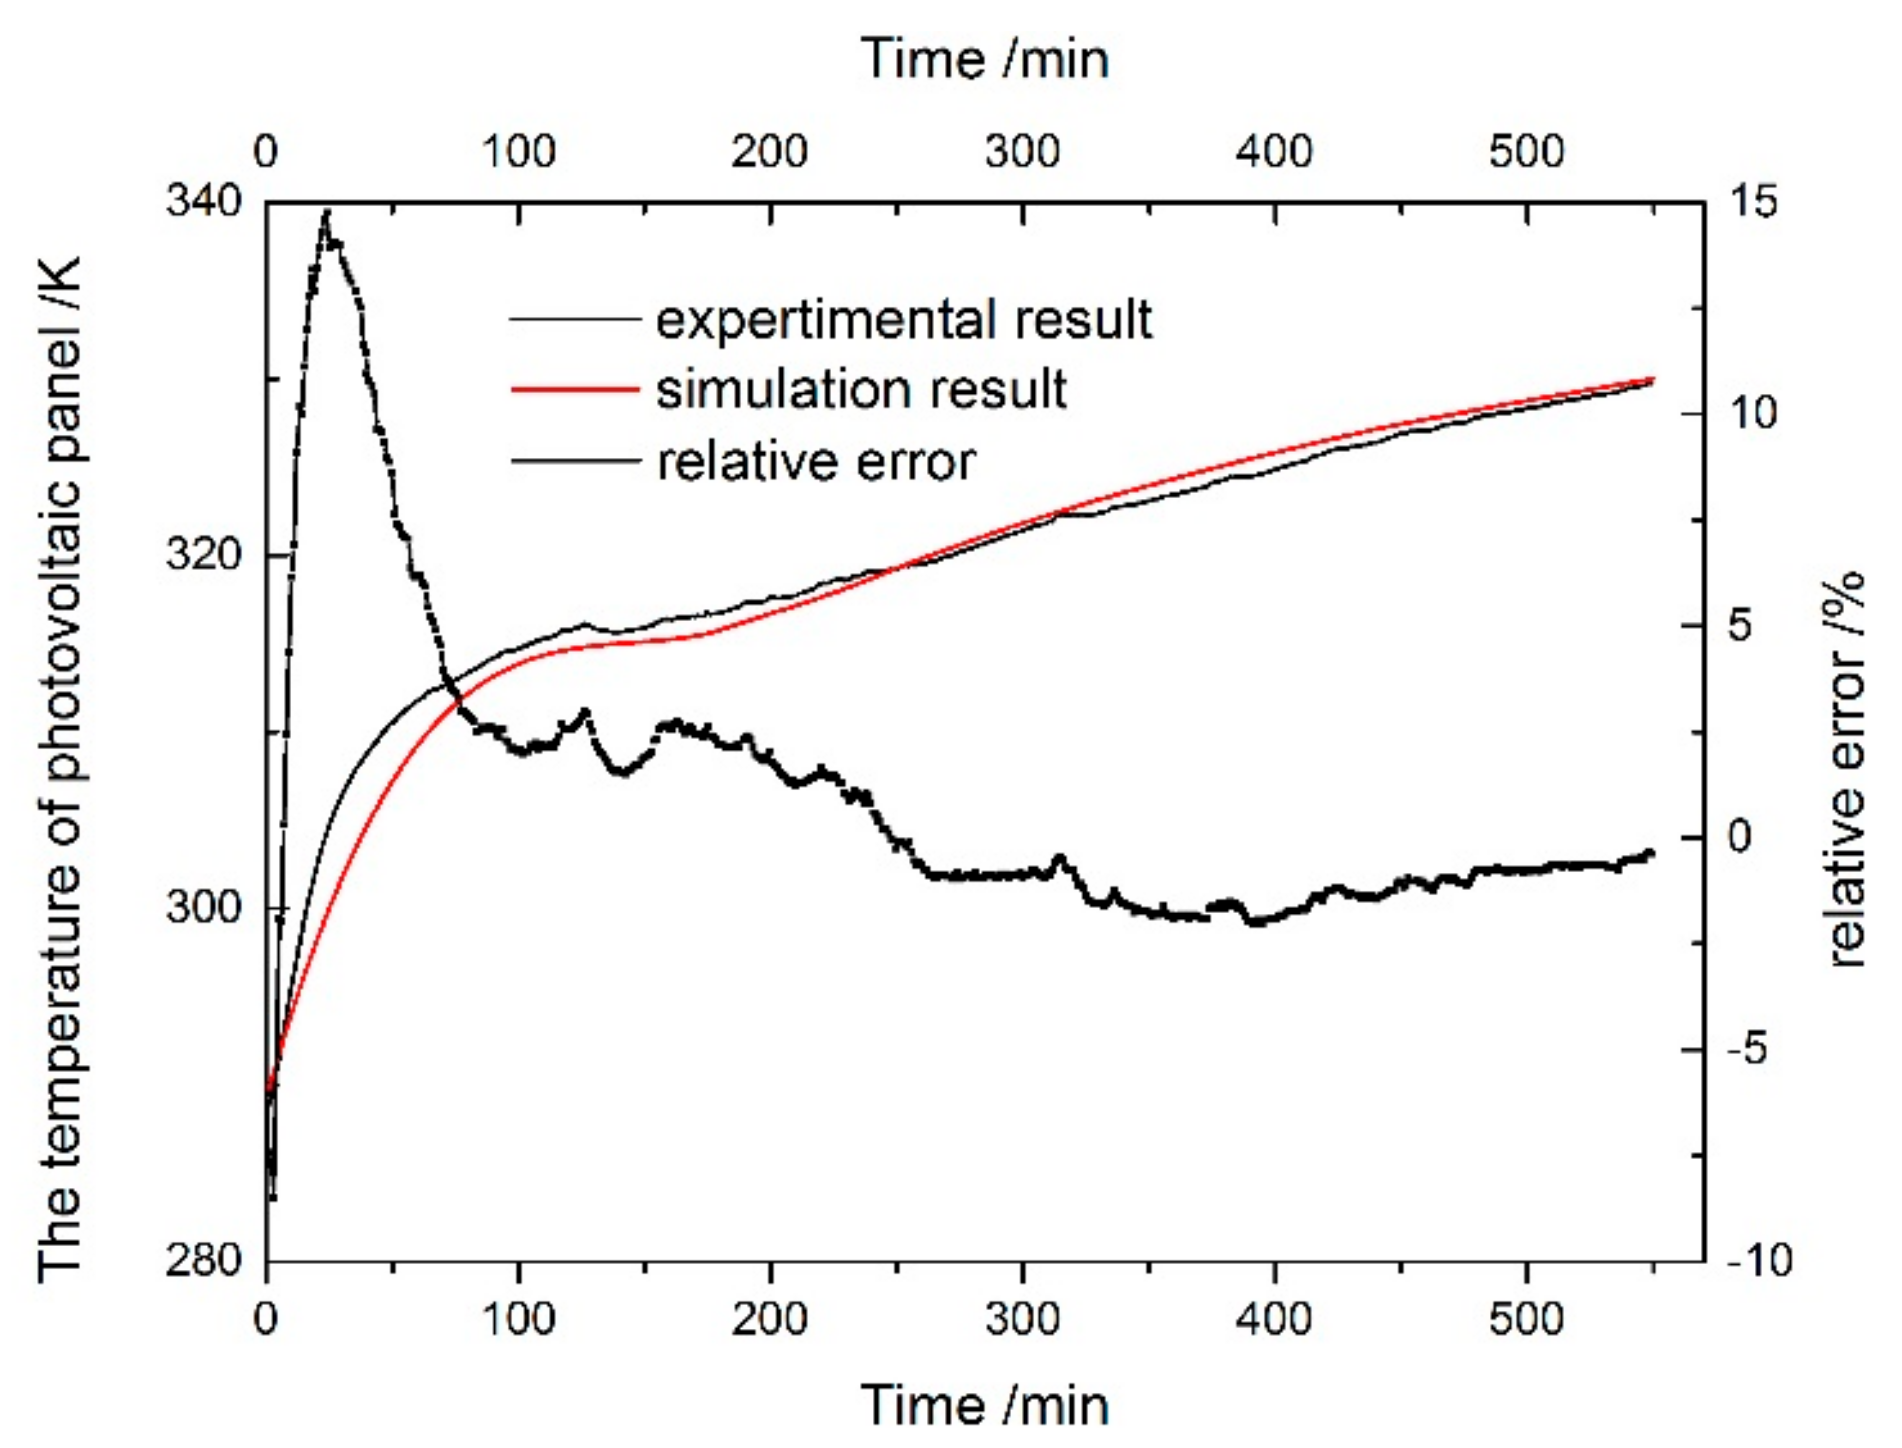
Figure 4 shows the experimental and simulation results of the temperature of the PV cell. In the first 60 min, the relative error ranges from −7.0 to 5.4%. It then begins to decease quickly and eventually stabilizes in an acceptable range (−1.0 to 5.4%). The mean error for the whole day is 2.1%, indicating a good agreement between the two errors.
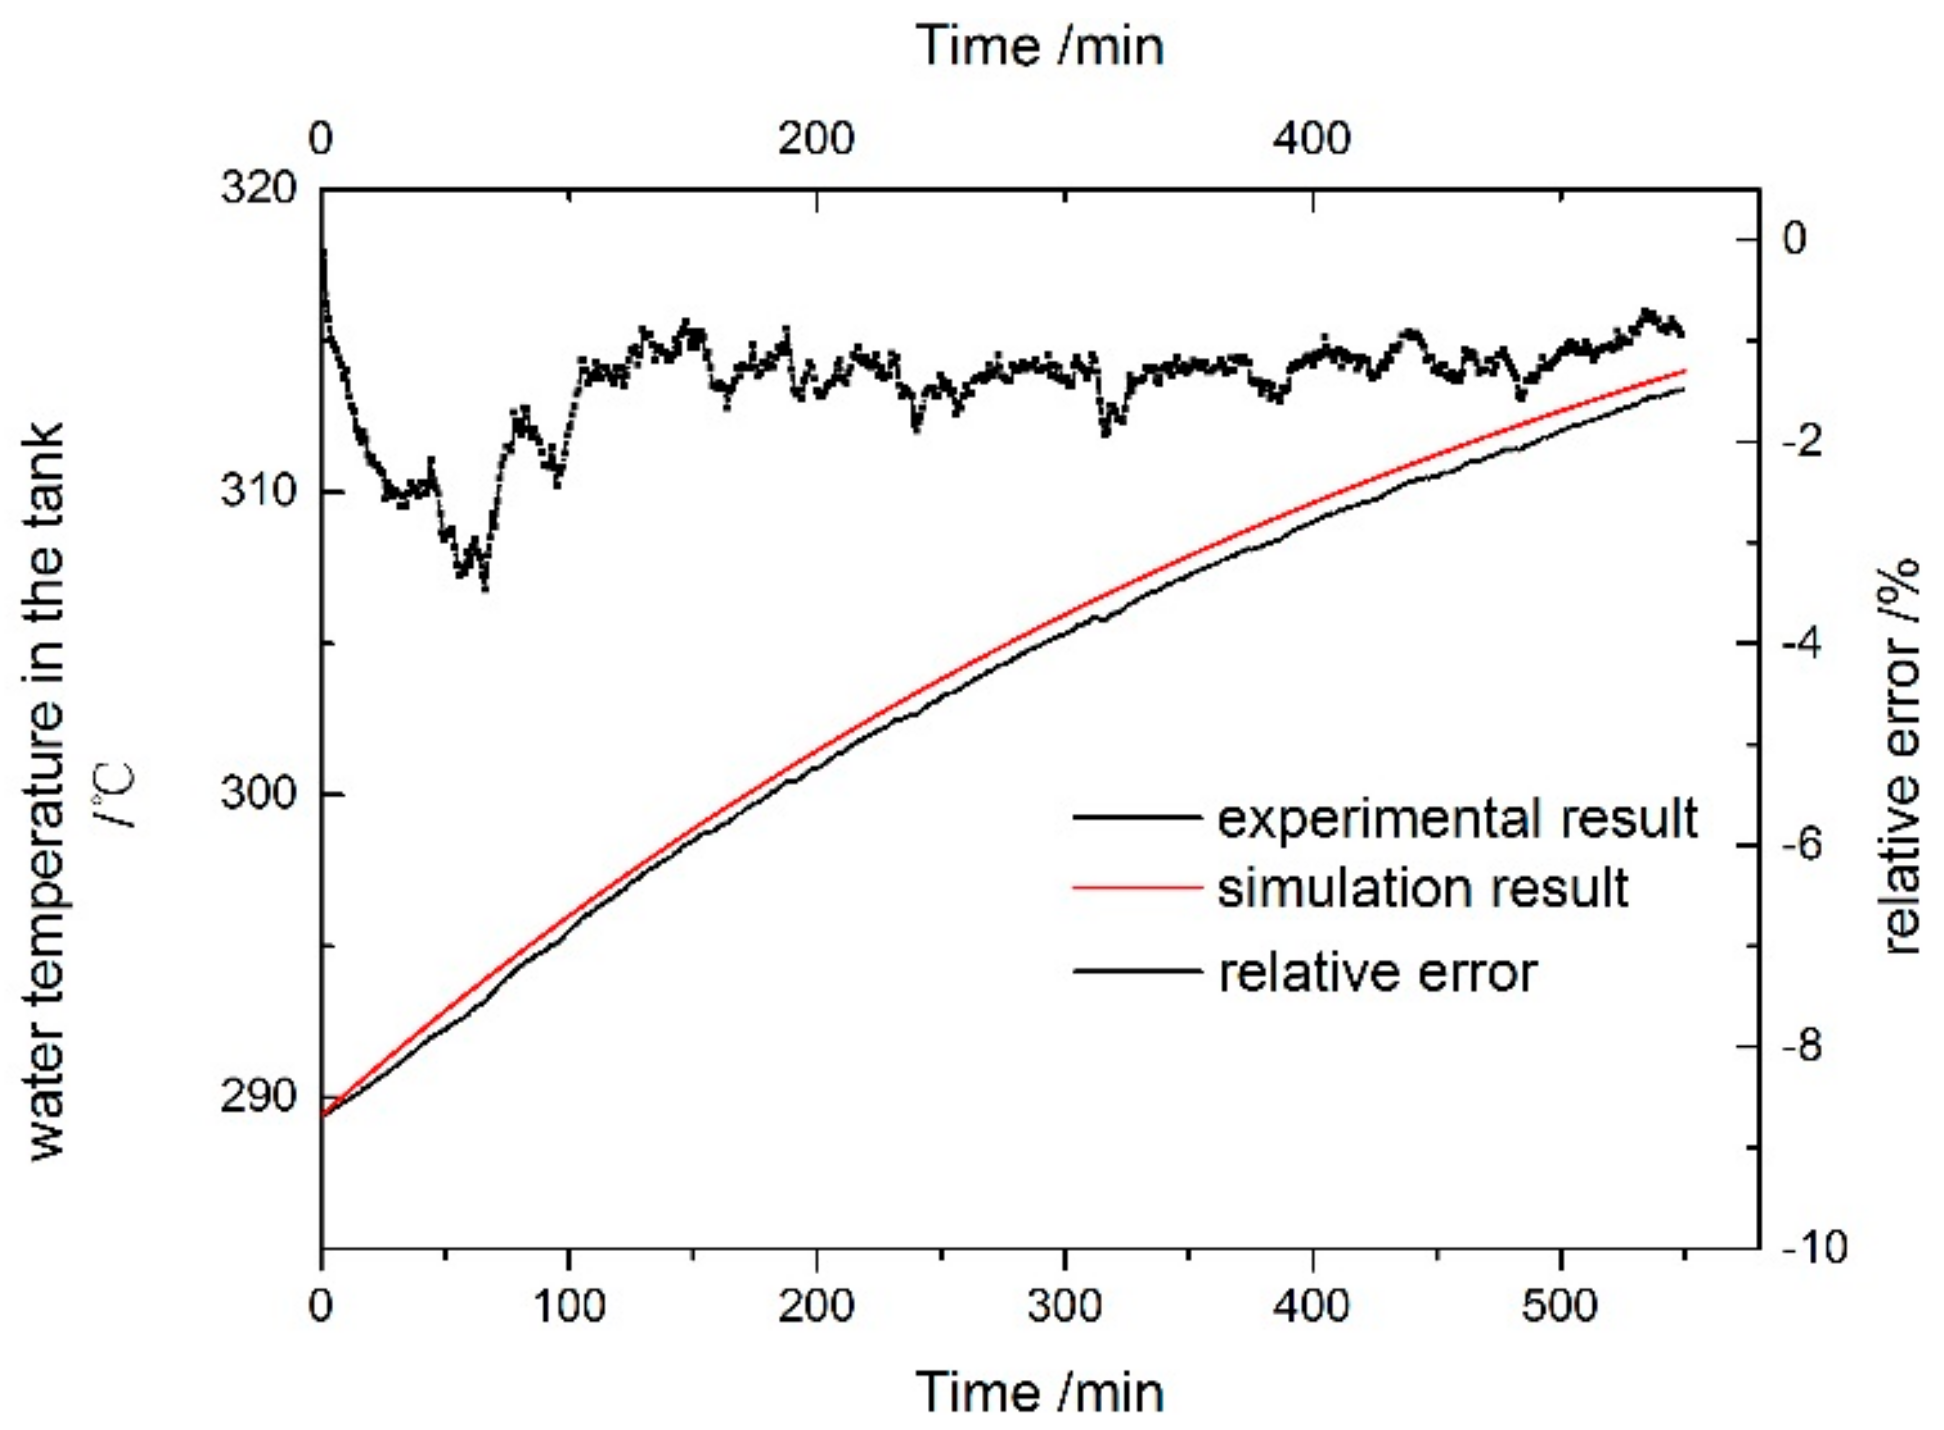
Figure 5 shows the experimental and simulated water temperatures in the tank. They show a good agreement. During the test, the relative error ranges from −0.1 to 3.4%, and the mean error is 4.7%. The simulated value is higher than the experimental value by 0.1 to 0.4 °C. This is because of the heat loss from the heat exchange pipe and water tank during the experiment.

6. Impact of Phase Change Temperature on the Performance of the System

6.1. Impact of Phase Change Temperature on the Operating Temperature of the Components

Table 3 lists the several different types of PCMs used in this system.
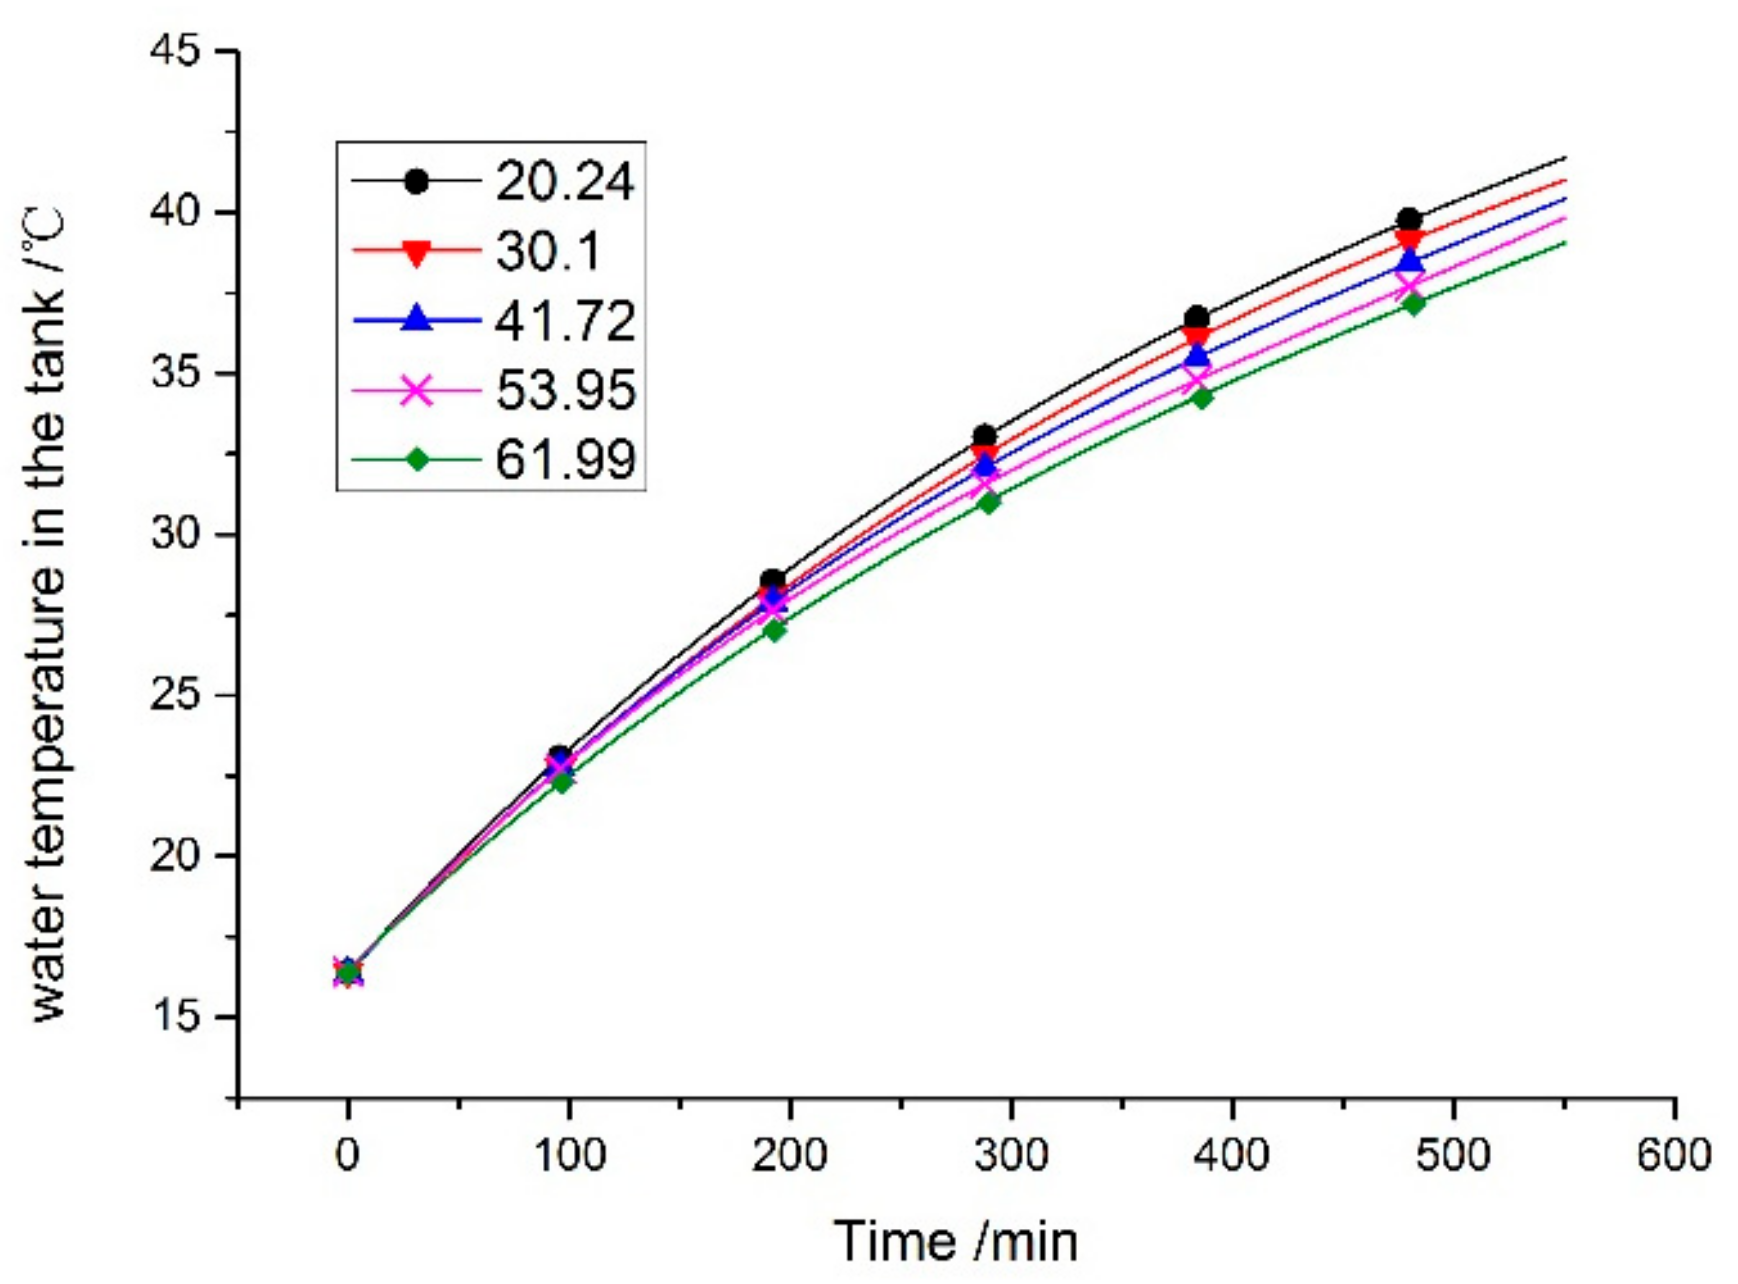
Figure 6 shows the variation in the water temperature in the tank with the variation in the phase change temperature of the PCM. The change in the final temperature of the water is very little, i.e., from 41.7 to 39.8 °C, when the phase change temperature increases from 20.2 to 62.0 °C.
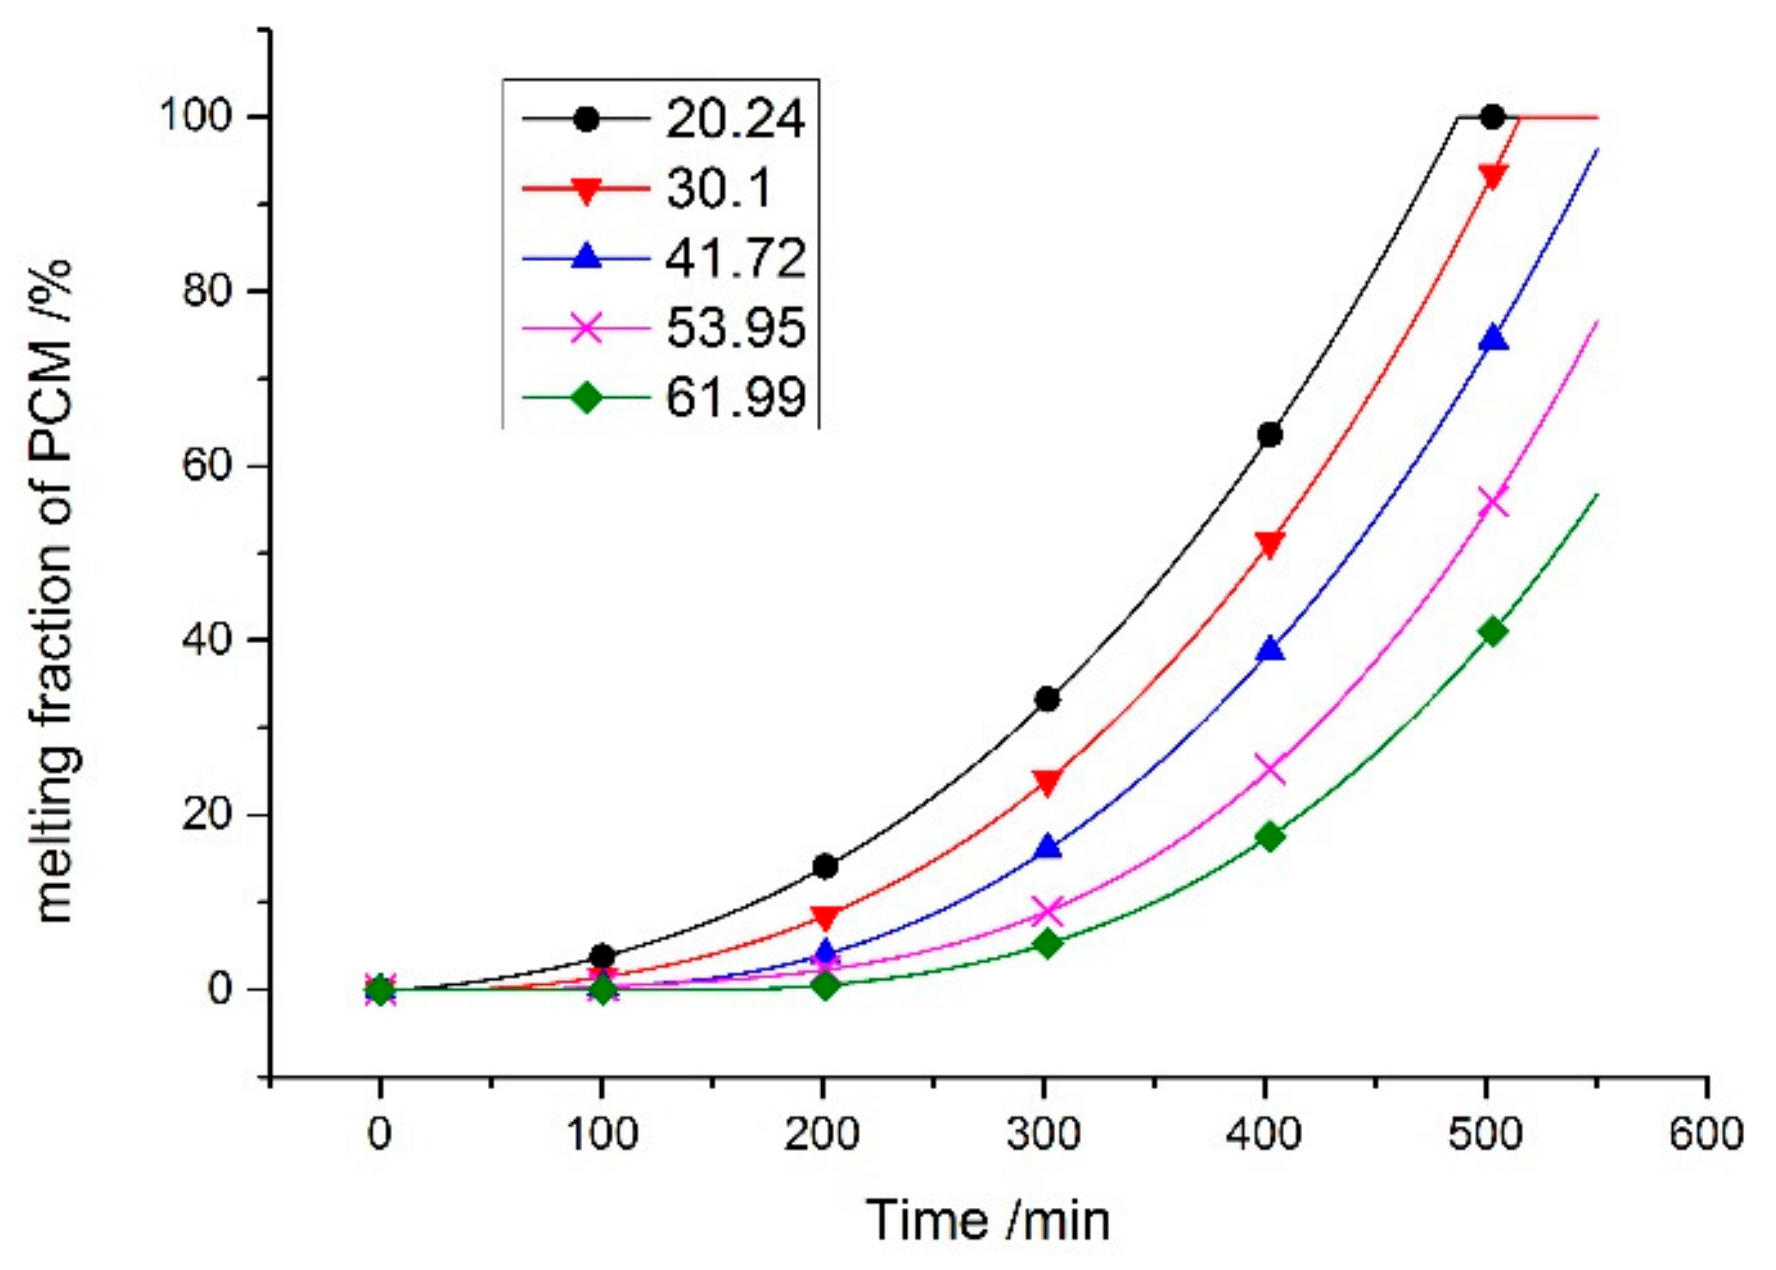
Figure 7 shows the melting rate of the PCM is influenced by the phase change temperature. When the phase change temperature is 20.2 °C, the PCM completely becomes liquid as four-fifths of the testing time passed. When the phase change temperature is 62.0 °C, only half of the PCM melts when the test ends. This is because when the temperature of the PCM is lower than the phase change temperature, it absorbs energy through sensible heat, whereas when it reaches the phase change temperature, it begins to absorb energy through latent heat. A lower phase change temperature can make the phase change to occur earlier, i.e., the lower the phase change temperature, the higher the melting rate.
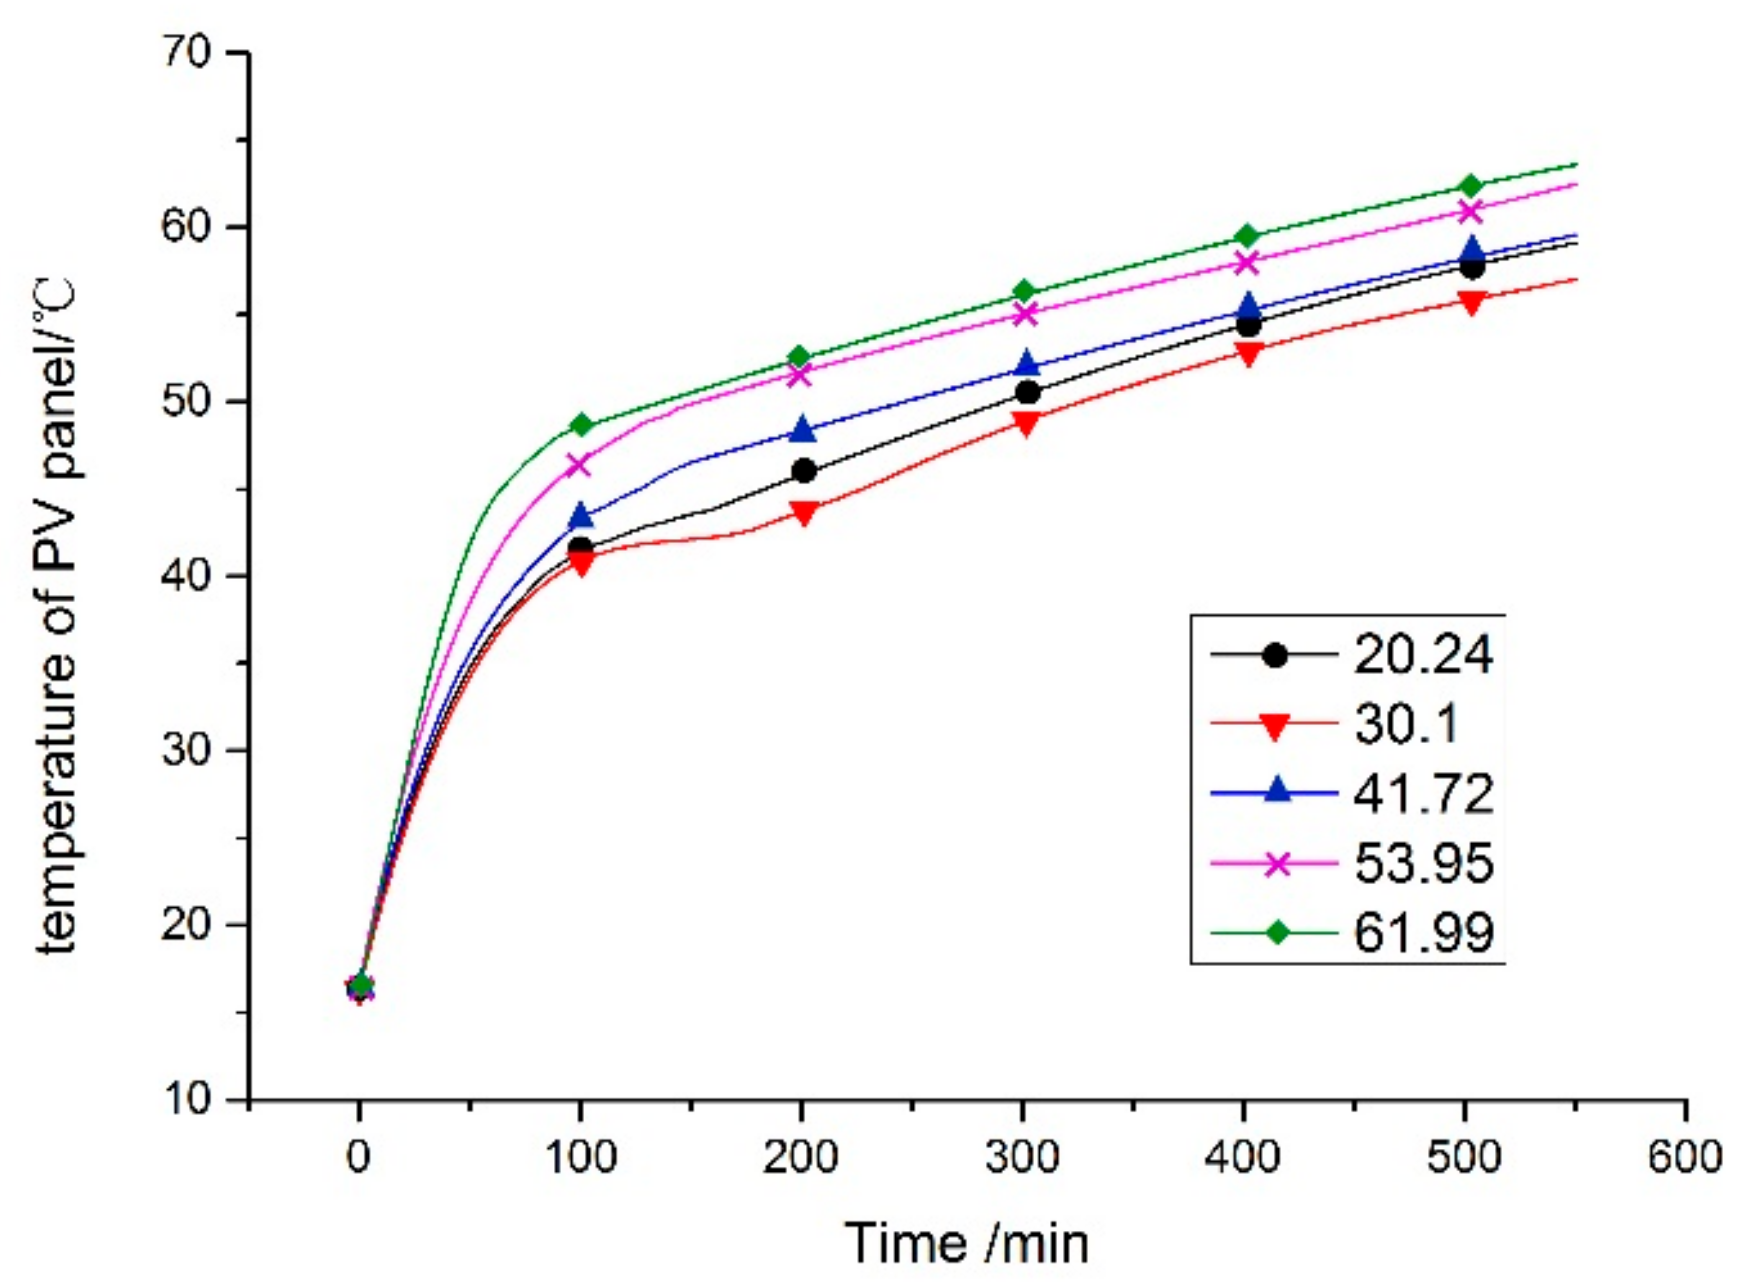
The PCM can effectively decrease the temperature of the PV cell, particularly when the temperature reaches the phase change temperature. As shown in Figure 8, the temperature of the PV cell increases with the increase in the phase change temperature. At the end of the test, the temperatures of the PV cell are 59, 57, 59.6, 62.42, and 63.6 °C, corresponding to phase change temperatures of 20.2, 30.1, 41.7, 54.0, and 62.0 °C, respectively. A comparison of the variation trends of two PCMs with phase change temperatures of 20.2 and 30.1 °C shows that they exhibit a similar performance in the first 100 min of the test. Subsequently, the temperature of the latter begins to increase gradually and to a lesser extent than that of the former, indicating that the latter outperforms the former under the same test conditions.

6.2. Impact of Phase Change Temperature on the Efficiency of System

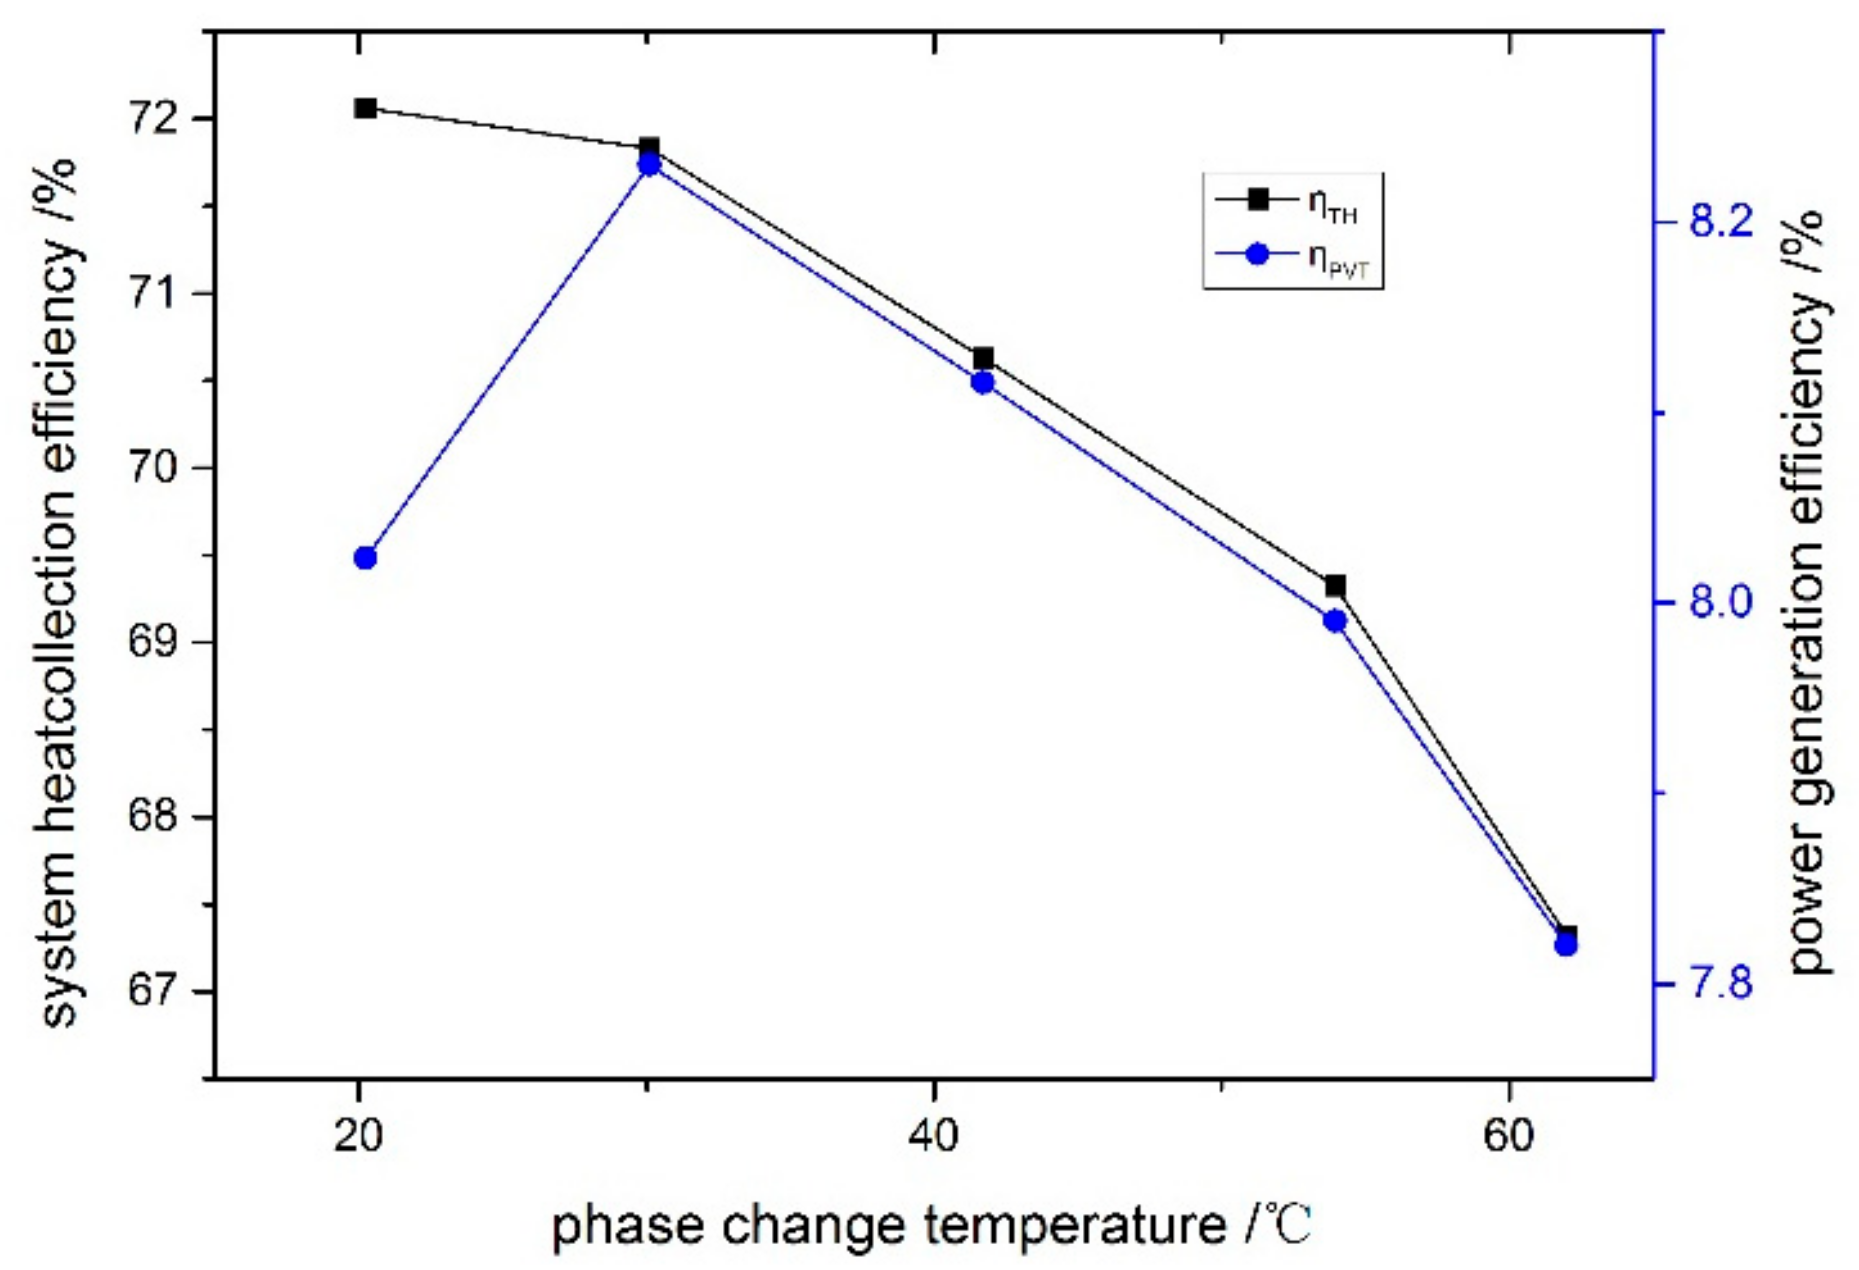
The electrical efficiency of the PV/T panel is influenced by its operating temperature. Comparing the electrical efficiency of the system using PCMs with phase change temperatures of 20.2 and 30.1 °C, the latter one has a better performance, with a lower operating temperature when it reaches 30 °C. As shown in Figure 9, the system that uses a PCM with a phase change temperature of 30.1 °C has the maximum electrical efficiency (8.2%), and at the same time, the thermal efficiency can reach 71.8%.
Figure 10 shows the relationship between the overall efficiency and the phase change temperature of the PCM. The system with a phase change temperature of 30.1 °C has the maximum overall efficiency, whereas it has maximum exergy efficiency when using a PCM with a phase change temperature of 20.2 °C. This is because thermal energy is a low-grade energy with a low exergy, whereas electricity is a high-grade energy with a high exergy. If maximizing the electrical efficiency is the main objective of the system, it is reasonable to convert thermal energy into electricity. If the exergy is the main objective, it is not acceptable to convert thermal energy into electricity.

7. Conclusions

This study investigated a novel PV/T-PCM system using theoretical and experimental methods. A simulation model of the system was developed, including models for the solar radiation, glass cover, PV cell, absorber, PCM, and storage tank. Considering the effect of density variation due to the phase change, the Boussinesq assumption was introduced into the simulation model. The accuracy of the simulation model was verified under a typical testing condition (solar radiation: 800 W/m2, flowrate: 0.15 m3/h, ambient temperature: 28.0 °C). The following are the results:
  • The experimental and simulation temperatures of the PV cell showed a good agreement, and the final temperature was approximately 57.0 °C.
  • The relative error of the water temperature in the tank ranged from −0.1 to 3.4%, and the mean error is 4.7%. This is due to the heat loss in the practical test. The comparison results indicated that the simulation model of the system is reasonable and can be used to predict and optimize the performance of the system.
  • If the overall efficiency is set as the main objective, the system with a phase change temperature of 30.1 °C exhibits the maximum value (electrical efficiency: 8.2%, thermal efficiency: 71.8%). If the exergy efficiency is set as the main objective, the system with a phase change temperature of 20.2 °C exhibits the maximum value.
This paper provides guidance for the material selection of PCM in PV/T-PCM system. According to the experimental and simulated result, it is found that PCM can enhance the performance of PV/T system effectively, and it has a huge application potential to achieve the objective of developing renewable energy, energy saving, and emission reduction that is supported and encouraged by the government.

Author Contributions

Conceptualization, X.Y.; Data curation, Y.Y.; Investigation, X.Y. and J.Z.; Methodology, Y.Y.; Resources, X.Y.; Supervision, Y.Y.; Writing–Original Draft, X.Y.; Writing–Review & Editing, X.Y., J.Z. and Y.Y.

Funding

This research received no external funding

Conflicts of Interest

The authors declare no conflict of interest.

Nomenclature

A m u s h Constant for the solid–liquid fuzzy region
B Expansion coefficient, 1/K
C Thermal capacity, kJ/(kg·K)
G Solar ridation, W/m2
G b h Direct radiation value on the horizontal surface, W/m2
G b t Direct radiation value on the inclined surface, W/m2
G d h Scattered radiation on a horizontal plane, W/m2
G g r t Ground feflected rdiation, W/m2
G t t Total solar radiation on an inclined surface, W/m2
g Acceleration due to gravity, m/s2
H Total enthalpy of the PCM, kJ/kg
Δ H Latent heat, kJ/kg
h Heat transfer rate, W/m2/K
h s Sensible heat, kJ/kg
k Diffusivity, m2/s
L Standard latent heat, kJ/kg
l Thickness, m
M Mass flow rate, kg/s
N u Prandtl number
P Pressure, Pa
R e Rayleigh number
R s i Thermal resistance of the thermally conductive silicon grease, m2·K/W
S Source item
T Temperature, K
t Time, s
u Speed vector, m/s
V Flow rate, m/s
Greek Symbols
α Absorption factor,
β Inclined plane inclination angle,
γ Inclined plane azimuth angle,
γ s Solar azimuth angle,
δ Solar declination angle,
ε Emissivity of the glass cover
ζ Ground reflectivity
η Efficiency
θ T Sunlight incidence,
θ z Solar zenith angle,
λ Thermal conductivity, W/(m·K)
μ Dynamic viscosity, N·S/m2
ν Wind speed, m/s
ϖ Liquid phase rate
ρ Density, kg/m3
σ Stefan–Boltzmann constant
τ Transmissivity
φ Incidence angle,
χ Auxiliary value
ω Time angle,
Subscripts
a Air gap
b g Glass cover to solar direct radiation
c , p g Glass cover and the PV cell (heat transfer rate)
d g Glass cover to scattered radiation
e x p Epermental
g Glass cover
g s Glass cover and sky
g p c m Volume force source term at momentum of gravity direction
g r g Glass cover to earth surface reflection
i n Inlet
m Melting
o Glass cover and the surroundings
o a Ambient temperature
o u t Outlet
p PV cell
p c m Phase change material
r , p g Glass cover and the PV cell (radiation heat transfer rate)
r e f Reference
s Sky temperature
s i m Simulated
s o Solidification
T P T Tedlar-Polyester-Tellar
w Water

References

  1. Skoplaki, E.; Palyvos, J. Operating temperature of photovoltaic modules: A survey of pertinent correlations. Renew. Energy 2009, 34, 23–29. [Google Scholar] [CrossRef]
  2. Chow, T. A review on photovoltaic/thermal hybrid solar technology. Appl. Energy 2010, 87, 365–379. [Google Scholar] [CrossRef]
  3. Slimani, M.E.A.; Amirat, M.; Bahria, S.; Kurucz, I.; Aouli, M.; Sellami, R. Study and modeling of energy performance of a hybrid photovoltaic/thermal solar collector: Configuration suitable for an indirect solar dryer. Energy Convers. Manag. 2016, 125, 209–221. [Google Scholar] [CrossRef]
  4. Sun, L.; Li, M.; Yuan, Y.; Cao, X.; Lei, B.; Yu, N. Effect of tilt angle and connection mode of PVT modules on the energy efficiency of a hot water system for high-rise residential buildings. Renew. Energy 2016, 93, 291–301. [Google Scholar] [CrossRef]
  5. Su, D.; Jia, Y.; Huang, X.; Alva, G.; Tang, Y.; Fang, G. Dynamic performance analysis of photovoltaic–thermal solar collector with dual channels for different fluids. Energy Convers. Manag. 2016, 120, 13–24. [Google Scholar] [CrossRef]
  6. Hasan, A.; McCormack, S.; Huang, M.J.; Norton, B. Evaluation of phase change materials for thermal regulation enhancement of building integrated photovoltaics. Sol. Energy 2010, 84, 1601–1612. [Google Scholar] [CrossRef] [Green Version]
  7. Yang, X.; Sun, L.; Yuan, Y.; Zhao, X.; Cao, X. Experimental investigation on performance comparison of PV/T-PCM system and PV/T system. Renew. Energy 2018, 119, 152–159. [Google Scholar] [CrossRef]
  8. Navarro, L.; De Gracia, A.; Castell, A.; Cabeza, L.F. Experimental study of an active slab with PCM coupled to a solar air collector for heating purposes. Energy Build. 2016, 128, 12–21. [Google Scholar] [CrossRef] [Green Version]
  9. Serale, G.; Baronetto, S.; Goia, F.; Perino, M. Characterization and Energy Performance of a Slurry PCM-based Solar Thermal Collector: A Numerical Analysis. Energy Procedia 2014, 48, 223–232. [Google Scholar] [CrossRef] [Green Version]
  10. Sharma, S.; Tahir, A.; Reddy, K.; Mallick, T.K. Performance enhancement of a Building-Integrated Concentrating Photovoltaic system using phase change material. Sol. Energy Mater. Sol. Cells 2016, 149, 29–39. [Google Scholar] [CrossRef] [Green Version]
  11. Lin, W.; Ma, Z.; Cooper, P.; Sohel, M.I.; Yang, L. Thermal performance investigation and optimization of buildings with integrated phase change materials and solar photovoltaic thermal collectors. Energy Build. 2016, 116, 562–573. [Google Scholar] [CrossRef]
  12. Malvi, C.; Dixon-Hardy, D.; Crook, R. Energy balance model of combined photovoltaic solar-thermal system incorporating phase change material. Sol. Energy 2011, 85, 1440–1446. [Google Scholar] [CrossRef]
  13. Browne, M.C.; Lawlor, K.; Kelly, A.; Norton, B.; Mc Cormack, S.J. Indoor Characterisation of a Photovoltaic/Thermal Phase Change Material System. Energy Procedia 2015, 70, 163–171. [Google Scholar] [CrossRef]
  14. Qiu, Z.; Zhao, X.; Li, P.; Zhang, X.; Ali, S.; Tan, J. Theoretical investigation of the energy performance of a novel MPCM (Microencapsulated Phase Change Material) slurry based PV/T module. Energy 2015, 87, 686–698. [Google Scholar] [CrossRef]
  15. Qiu, Z.; Ma, X.; Zhao, X.; Li, P.; Ali, S. Experimental investigation of the energy performance of a novel Micro-encapsulated Phase Change Material (MPCM) slurry based PV/T system. Appl. Energy 2016, 165, 260–271. [Google Scholar] [CrossRef]
  16. Yin, H.; Yang, D.; Kelly, G.; Garant, J. Design and performance of a novel building integrated PV/thermal system for energy efficiency of buildings. Sol. Energy 2013, 87, 184–195. [Google Scholar] [CrossRef]
  17. Duffie, J.A.; Beckman, W.A. Solar Engineering of Thermal Processes, 3rd ed.; John Wiley & Sons: Hoboken, NJ, USA, 2006. [Google Scholar]
  18. Perez, R.; Ineichen, P.; Seals, R. Modeling daylight availability and irradiance components from direct and global irradiance. Sol. Energy 1990, 44, 271–289. [Google Scholar] [CrossRef] [Green Version]
  19. Chow, T. Performance analysis of photovoltaic-thermal collector by explicit dynamic model. Sol. Energy 2003, 75, 143–152. [Google Scholar] [CrossRef]
  20. Sharma, A.; Tyagi, V.; Chen, C.; Buddhi, D. Review on thermal energy storage with phase change materials and applications. Renew. Sustain. Energy Rev. 2009, 13, 318–345. [Google Scholar] [CrossRef]
  21. Huang, B.-J.; Lin, T.; Hung, W.; Sun, F. Performance evaluation of solar photovoltaic/thermal systems. Sol. Energy 2001, 70, 443–448. [Google Scholar] [CrossRef]
  22. Loveday, D.; Taki, A. Convective heat transfer coefficients at a plane surface on a full-scale building facade. Int. J. Heat Mass Transf. 1996, 39, 1729–1742. [Google Scholar] [CrossRef]
  23. ANSYS. Ansys Fluent 14.0, Theory Guide; ANSYS Inc.: Canonsburg, PA, USA, 2013. [Google Scholar]
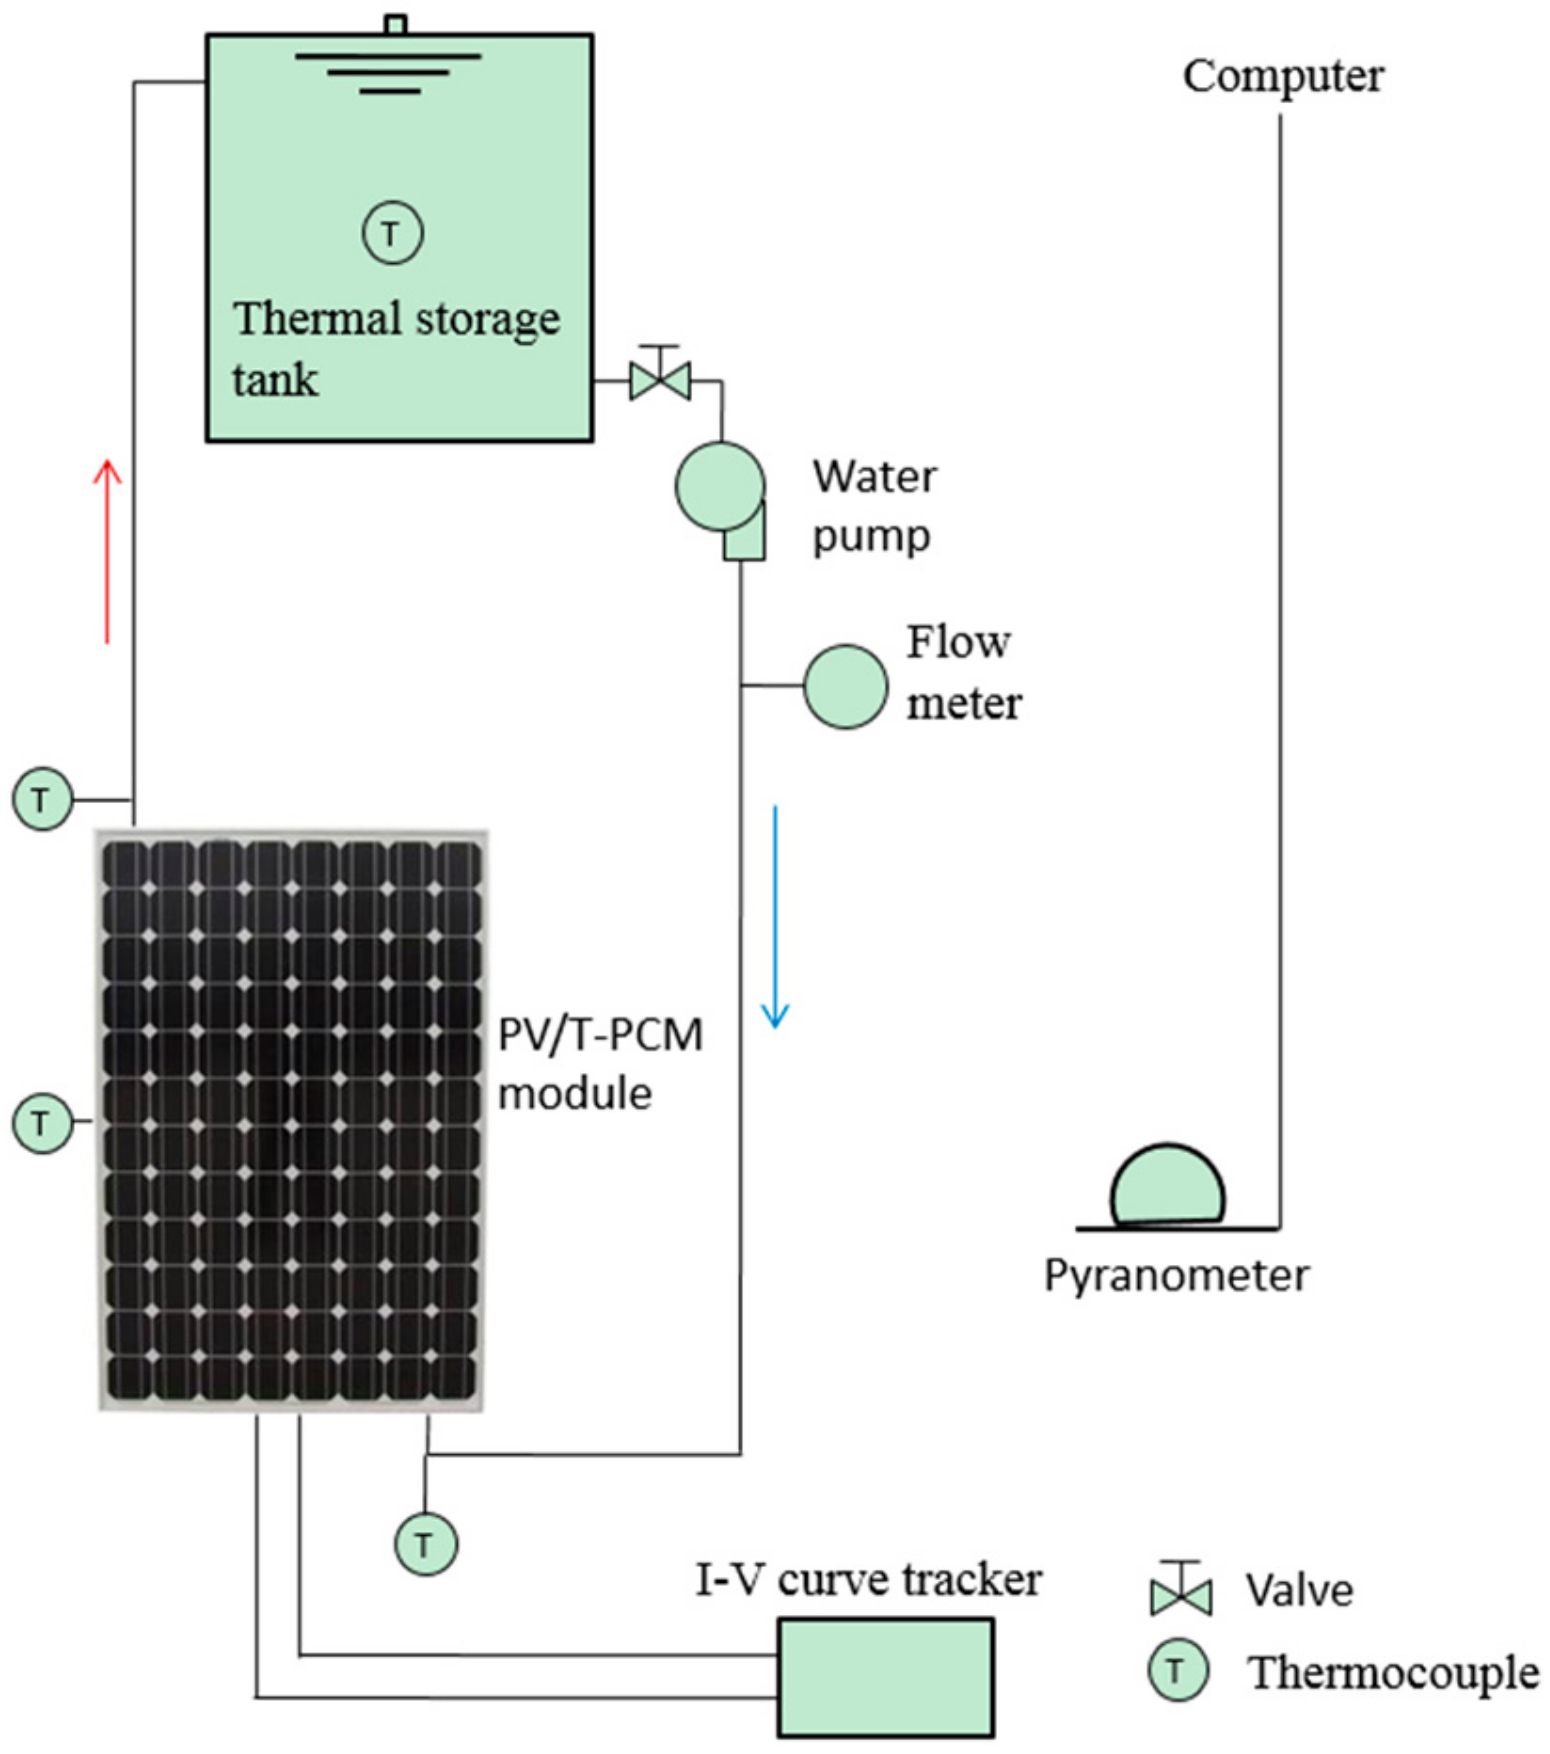
Figure 1. Schematic of a photovoltaic/thermal (PV/T)-phase change material (PCM) system.
Energies 12 03929 g001
Figure 2. PV/T-PCM system setup.
Energies 12 03929 g002
Figure 3. Schematic of a PV/T-PCM panel.
Energies 12 03929 g003
Figure 4. Temperature comparison of photovoltaic panel.
Energies 12 03929 g004
Figure 5. Temperature comparison of water tank.
Energies 12 03929 g005
Figure 6. Curve of average water temperature in the water tank with time for different PCMs.
Energies 12 03929 g006
Figure 7. Curve of melting fraction of phase change layer with time under different PCMs.
Energies 12 03929 g007
Figure 8. Temperature curve of PV panel with time under different PCMs.
Energies 12 03929 g008
Figure 9. Curve of system heat collection efficiency and power generation efficiency with phase transition temperature.
Energies 12 03929 g009
Figure 10. System PV photothermal comprehensive performance efficiency and exergy efficiency with phase transition temperature.
Energies 12 03929 g010
Table 1. Main parameter measurement configuration of the experimental system.
ParameterMeasurement EquipmentMeasurement Point
Temperature K-type thermocouples; measuring range: −200–1300 °C, accuracy: ±0.2 °CPCM layer at the back of the PV lamination (the middle and bottom of the layer)
Thermal storage tanks
(Dimensions: 0.5 × 0.5 × 0.5)
Flow rateLWGY-4 turbine flowmeter; measuring range: 0.04–0.25 m3/hInlet of the module
Data loggerAgilent 34980A terminal module (Agilent Technologies)Data recorded by computing unit
Electrical output Qunling PV-8010; voltage measuring range: 10–1000 V; current measuring range: 0.1–12 A; measurement error ≤1%Module power output
Solar irradiance Delta-T SPN1 pyranometer; measuring range: 0~2000 W/m2; total radiation and scattering accuracy: 8% ± 10 W/m2In parallel with modules
Table 2. Property parameters of materials.
Material Density   ρ   k g / m 3 Specific   Heat   c p J / ( kg · ° ) Thermal   Conductivity   k W · m 1 · K 1 Viscosity   μ k g · m 1 · s 1
PV cell2330700100--
Thermal Grease17307001.3--
Absorber8500400100--
Heat exchange pipe8500400100--
PCM87817000.1530.007
Water998.241820.60.001003
Table 3. Thermal properties of CA-MA, CA, MA-PA-SA, PA-SA, and PA.
Fatty Acid Phase Change MaterialPhase Change Temperature (°C)Latent Heat (kJ/kg)
CA-MA20.24136.7
CA30.1163
MA-PA-SA41.72159.6
PA-SA53.95177.7
PA61.99186