Article

The Cooling Effect of Large-Scale Urban Parks on Surrounding Area Thermal Comfort

1
Escuela Técnica Superior de Arquitectura, Universidad Politécnica de Madrid-UPM, 28040 Madrid, Spain
2
School of Engineering and Built Environment, Griffith University, Gold Coast 4222, Australia
3
Institute of Automation, Kalman Kando Faculty of Electrical Engineering, Obuda University, 1034 Budapest, Hungary
4
Faculty of Health, The Queensland University of Technology, Brisbane, QLD 4059, Australia
5
School of Built the Environment, Oxford Brookes University, Oxford OX30BP, UK
6
Department of Mathematics and Informatics, J. Selye University, 94501 Komarno, Slovakia
*
Author to whom correspondence should be addressed.
Energies 2019, 12(20), 3904; https://doi.org/10.3390/en12203904
Submission received: 1 September 2019 / Revised: 13 October 2019 / Accepted: 14 October 2019 / Published: 15 October 2019
(This article belongs to the Special Issue Urban Heat Island Mitigation Technologies)

Abstract

:
This empirical study investigates large urban park cooling effects on the thermal comfort of occupants in the vicinity of the main central park, located in Madrid, Spain. Data were gathered during hot summer days, using mobile observations and a questionnaire. The results showed that the cooling effect of this urban park of 125 ha area at a distance of 150 m could reduce air temperatures by an average of 0.63 °C and 1.28 °C for distances of 380 m and 665 meters from the park. Moreover, the degree of the physiological equivalent temperature (PET) index at a distance of 150 meters from the park is on average 2 °C PET and 2.3 °C PET less compared to distances of 380 m and 665 m, respectively. Considering the distance from the park, the correlation between occupant perceived thermal comfort (PTC) and PET is inverse. That is, augmenting the distance from the park increases PET, while the extent of PTC reduces accordingly. The correlation between these two factors at the nearest and furthest distances from the park is meaningful (p-value < 0.05). The results also showed that large-scale urban parks generally play a significant part in creating a cognitive state of high-perceived thermal comfort spaces for residents.

Graphical Abstract

1. Introduction

Due to climate change and the growing urbanization, the heat in cities is rising rapidly [1,2]. Today, heat has adversely affected urban life across the world [3], including urban areas of the Mediterranean climate [4,5]. The increase in temperature in urban areas, especially densely populated areas has given rise to the phenomenon of urban heat islands (UHI) [6,7], which can threaten the health and comfort of citizens [8,9]. The green urban spaces have been researched by numerous studies as an adaptive strategy to reduce the effect of urban heat and improve the health of citizens, by considering thermal comfort [10,11] as well as their socio-economic role [12]. Various studies have been conducted on the effects of various types of green infrastructures aiming at reducing urban heat and thermal discomfort [13,14], which include different scales and forms such as small local parks [15], large urban parks [16], urban gardens [17], green roofs [18,19], green walls [20,21] and street trees [22,23]. This study emphasizes the cooling effect of large urban parks.
The studies conducted on large urban parks have shown that such parks have a significant effect on air temperature reduction and UHI [24,25,26], which is especially noticeable during the summer [27,28]. However, it is noteworthy that the temperature drop does not only take place within the park but also surrounding areas [29]. The cooling effect of urban parks, referred to as a park cooling island (PCI) [30], is known to affect the surrounding environment depending on the area of the green space and quality of green coverage [31,32]. Two relevant indices to measure the cooling effect of urban parks are the cooling effect distance (CED) and cooling effect intensity (CEI) [33], which have been extensively used in various scales and climates [34,35,36].
Studies on the cooling effect of urban parks in different regions have shown that large scale urban parks with areas over 10 ha can have an average of 1 to 2 °C effect on surrounding areas that are an average of 350 meters away [33]. In general, air temperature reductions in urban parks are typically up to 0.5–4 °C and may even cause up to 5–7 °C reduction [37]. Despite the cooling effect of urban parks on their surroundings, such an outcome is not merely dependent on the traits of the green space [38]. The morphology of the surrounding area of parks, the sky view factor (SVF), the spatial configuration of the location, and the covered area, also affect the perception of the cooling effect of urban parks and thermal comfort [37,39].
Numerous studies have been carried out on the cooling effect of urban parks. However, research pertaining to the extent of this effect on thermal comfort perception from psychological and physical perspectives is limited. This gap necessitates examining the cooling effect of urban parks on the aforementioned parameters at different intervals from the park to determine factors that may be applied in sustainable urban development.

2. Park Cooling Effect and Thermal Comfort Perception

A set of thermal indices was investigated in two experimental (effective temp (ET), resultant temp (RT), humid operative temp (HOP), operative temp (OP) and wind chill index (WCI)) and analytical (index of thermal stress (ITS), heat stress index (HIS), effective temp (ET*), stand. effective temp (SET*), out. stand. eff. temp (OUT_SET), predicted mean vote (PMV), perceived temp (PT) and physiological equivalent temperature (PET)) groups [40,41,42,43]. The basis of these analytical indices was the energy balance (produced and wasted human energy). The main issue of thermal indices pertains to the average thermal comfort assessment and climate conditions of each area [44]. The result of various studies on validating other indices shows that examples such as SET and PET have a high correlation (89%) with thermal comfort in open spaces [45]. Most studies in recent years have utilized SET, PMV and PET to predict comfort levels in open spaces [46,47,48].
PET enables the comparison of the full effect of thermal conditions about the outside environment with individual experience [49,50]. PET is one of the recommended indices in urban and regional urban planning around the world, used to predict thermal changes of urban or regional clusters [51]. This index has shown a significant correlation to thermal comfort in various climatic conditions in open urban spaces as validation [52]. One of the prominent influencing factors on PET condition is the Tmrt (mean radiant temperature) climate variable. The indices mentioned above provide a single image of a set of individual and climate variables and enable the comparison of comfort conditions in various environments (due to global factors) [53].
In studies conducted to investigate the thermal comfort of urban parks, the PET index is commonly used. In a study conducted on a warm sunny day in Beijing, China (21 August, 2 pm) [54], it was shown that the effect of the Yuan Dynasty Relics green space with 102 ha area, in close approximately to the area of Retiro Park, reduces the PET by an average of 2 °C and a maximum of 15.6 °C. Another study conducted at Zhongshan Park in Shanghai city center with an area of 21.42 ha, showed that the PCI led to thermal comfort during Shanghai’s winter as well as summer and had a PET of 15–29 °C [55]. Additionally, a study conducted at the Central Park of Cairo with an area of approximately 26.01 ha [56] showed that parks had a significant effect in enhancing thermal comfort during summer, which, based on this effect, entailed a PET value of 22–30 °C throughout the day.
While the cooling effect of urban parks has generally been recognized as a strategy for mitigating urban heat and providing thermal comfort [57,58], the extent of perceived thermal comfort stemming from the cooling effect of urban parks is difficult to predict, necessitating investigations of people’s attitudinal and bodily experiences concerning physical thermal conditions at various intervals in the surrounding areas of these parks [59,60]. The degree of perceived thermal comfort by an occupant, which is caused by the cooling effect of urban parks, is dependent on factors such as individual behavioral and psychological traits, in addition to distance and cooling effect intensity [61,62,63]. Individual demographic traits include age, gender, and physical characteristics such as height and weight of occupants [64,65]. Psychological traits include the individual’s experience of being in the environment and their thermal expectations and tolerance [66,67]. Behavioral aspects include the extent of being covered (in terms of clothes) and the type of activities conducted by the individual [68].
A common method to determine the extent of thermal comfort experienced by occupants is the use of surveys [69]. Essentially, by using such survey methods as open, semi-open, or multiple-choice questions [70], individuals can be asked about their thermal comfort experiences [71]. In order to measure the human thermal comfort perception level, cognitive mapping can be utilized in combination with questionnaires. Employing this method and asking residents to identify places where they feel more comfortable from a thermal point of view provided a more comprehensible image of the residents’ thermal comfort level for understanding [72,73]. In recent years, utilizing questionnaires and asking direct questions about the perceived comfort of citizens alongside micro-climatic perceptions have yielded valuable results [74].
Many studies have been conducted on the cooling effect of urban parks, particularly their CEI and CED effects. However, less research has been carried out on the thermal comfort of this effect at different distances from the park. Additionally, few studies on the cooling effect of urban parks on thermal comfort have mainly investigated through physiological indices. As both psychological and physical perspectives together provide the complete concept of thermal comfort, it, therefore, necessitates examining the extent of thermal comfort created by urban green spaces from either perspective.
The purpose of this study is to investigate the cooling effect of the large urban park and its effect on the thermal comfort of occupants in the areas around the park. This study focuses on the perceived thermal comfort (PTC) and physiological equivalent temperature (PET) of locations, at a defined distance from the park and similar in terms of urban aspects and influential factors such as floor coverings, enclosures, street canyon and vegetation, whilst responding to the following research questions:
  • What is the extent of the large urban park cooling effect on thermal comfort based on PET?
  • What is the extent of the large urban park cooling effect on occupants’ PTC?
  • What is the relationship between the measured PTC and the measured occupant PET?

3. Materials and Methods

3.1. Location and Selection of the Sites

This research was located in Madrid (40°25′08″ N; 3°41′31″ O), the capital of Spain with a population of 3,223,334 and population density of 5265.91 /km², and a hot-summer Mediterranean climate (Csa) according to the Köppen classification [75]. The average annual temperature in downtown Madrid is 19.9 °C during the day and 10.1 °C at night. The warmest month of the year is July, with an average temperature of 32.1 °C during the day. Then August, June and September are the hottest months with average daily temperatures of 31.3 °C, 38.2 °C and 26.4 °C, respectively [76]. Retiro Park has an area of approximately 125 ha. It is the largest and oldest park in the center of Madrid with rich plant diversity. One of the prominent issues of this study was the method of selecting distances from Retiro Park. Although studies have not been conducted on the average cooling effect of Retiro Park, an updated UHI map of Madrid was presented in 2015 by Núñez Peiró et al. [77], where the effect of Retiro Park was made evident based on the temperature color spectrum. Essentially, the UHI map of Madrid from 26 July 2015 represents the effect of Retiro Park in counteracting to the effect of UHI in the northern, eastern and southern areas of the park [78].
In order to accurately assess the cooling effect of Retiro Park on its surrounding areas, it was necessary to select places on a micro-scale with common features that are located at various distances from the park. The northern area of Retiro Park, due to its well-organized form, has more regular urban-type compared to other areas (east and south). Based on the temperature zones of the updated thermal map of Madrid’s urban heat islands in 2015 [79], three street crossings (intersections) located in the Salamanca and Recoletos neighborhoods in the north of Retiro Park along the Lagasca Street, were chosen. These sites were located at 150 meters, 380 meters and 665 meters from the park at Lagasca intersection with the Conde de Aranda, Jorge Juan and Hermosilla streets, giving zones of different temperature ranges (yellow, orange and red; Figure 1). These types of selected local intersections represent most of Retiro Park’s northern area intersections (Figure 2). Based on this map [77,79], each of the three intersections A, B and C had a temperature difference of about 0.8 °C.
All three assessed intersections were selected based on a common geometric configuration. The considered geometric configuration included an enclosure, sky view factor (SVF), and street height and width (Figure 3, Table 1). The considered material structure included the ground surface coverage material, pavement material and building facade material, which were similar in all three regions; the ground surface material in all three regions was asphalt; the pavement material was gray tiles and the building material is mostly red-colored bricks and bright cement (Figure 3). The presence of green spaces in the street canyon was highly significant in terms of micro-climatic issues [80]. In this regard, vegetation was also considered as well as the aforementioned parameters (Table 1), so the selected regions were also similar in terms of this parameter (Figure 3).
There were two priorities in selecting the intersections. Firstly, the points were selected according to Madrid’s UHI map (Figure 1) where the distances were of different temperature ranges, and secondly, locations were selected that shared the greatest similarity in terms of physical and structural traits. In this vein, three sites A, B and C were selected to extract data, in accordance with the goals of this study.

3.2. Microclimate Parameter Measurements

Micro-climatic measurements were conducted during six days in hot summer, on 22 June, 10 and 24 of July, 10 and 24 August and 10 September 2018. Data extraction started from 22 June and was spaced at roughly every two weeks, targeting sunny and calm days (no clouds) up to the end of summer (10 September). Ta and relative humidity (RH) were collected during the six days, were measured by mobile microclimate stations (HOBO MX2301A Temperature/RH Data Logger, manufactured by Onset Computer Corporation, MA, USA) with precision Ta; ± 0.2 °C and RH; ± 2.5% between 10:40 and 12:10 CEST (Central European Summer Time). The data was collected at one-minute intervals, and the weather data collection duration at each location was 10 minutes (Table 2).
The devices were placed 1.5 meters from the ground and covered by a radiation shield. The wind speed (WS) was determined by a Proster Digital Anemometer MS6252a placed at the same distance. The type of ground coverings, walls and types of and distance to vegetation that affect the temperature conditions were checked according to field studies; high-resolution images were taken by a Canon Eos 600D, 5184 pixels × 3456 pixels digital camera. Arial images were taken from Google Earth, 2018–2019. Fisheye images were taken at three intersections using a fisheye (Sigma 8 mm circular) lens. Additionally, the weather data of Retiro Park were collected via the AEMET (Agencia Estatal de Meteorologia) fixed station [76] located inside the park. These parameters were previously identified to show the effect of urban parks on thermal comfort [54].

3.3. The Questionnaire Survey

A random semi-structured survey was conducted on 145 pedestrians (nA: 49, nB: 45 and nC: 51) at intersections where microclimatic data were collected (workplace and residential). The interviewees comprised different gender and age groups (with the exception of children), and were active at different levels. Table 3 shows detailed information on the number and characteristics of individuals, on different days and intersections.
Data extraction from the surveys took place during the period of determining micro-climatic parameters at three intersections A, B and C (more and less than 10 minutes). Questions were divided into three sections.
The second section comprised four questions about the degree of thermal comfort perception during the interview. The questions were short and designed as five options (very high = 5 to very low = 1). Research questions concerning the level of individual thermal comfort included: (Q1) How much thermal comfort do you feel? (not too hot, not too cold); (Q2) How warm do you feel? (Q3) What is the extent of thermal comfort perceived through Retiro Park? (Q4) How much heat can you tolerate in this location?
The third section included open personal questions such as gender, height, weight, level of activity and type of clothing.
Essentially, the questionnaire questions were designed so that in a short period (10 minutes), pedestrians in the neighborhood of different age and gender groups could be interviewed to extract information about their level of perceived thermal comfort (Figure 4). The total score from the questions is presented as an indicator of the perceived thermal comfort (PTC). However, the inquiry of PTC was ambiguous for occupants, so this question was addressed by asking how comfortable do you feel in terms of temperature (not too hot not too cold)? For the second inquiry, the question that was also directly asked was how much heat do you feel? Therefore, data relevant to this question was considered in reverse form to determine the perceived thermal comfort index (very high = 1 to very low = 5). It should be noted that in order to accurately derive the research data, prior to the start of summer on 22 May, 18 experimental micro-climatic data and questionnaires (six questionnaires at each intersection) were compiled (10 minutes at each intersection) in order to address the issues and queries of questionnaire gaps and to identify bio-climatic notions amidst the main questionnaire compilation stage.

3.4. Analyzing the Thermal Comfort Parameters

3.4.1. Physiological Parameters

In order to analyze thermal comfort and derive PET, the relevant parameters should be calculated. The calculation of parameters for PET assessment includes clo, level of activity, SVF and Tmrt. In this study, Ray Man 1.2 [81,82] software was used to derive SVF, Tmrt and PET. The calculation of clo, which pertains to the extent of being covered for an individual, was based on its computational indices [83]. Given that each clothing item has its own index, the clo for each person was based on the collected data. The greatest extent of clothing coverage for participants was a T-shirt with trousers (34%), shirt with trousers (25.4%) and the least was shorts with a t-shirt (22.6%), which were of 61 clo, 65 clo and 40 clo, respectively. Determination of activity levels was based on individual activity in the environment. Every activity had an indicator, walking 115 W/m2, sitting 60 W/m2, standing 70 W/m2, and fast walking 220 W/m2 [84] (Table 4).
SVF calculation was conducted by importing fisheye images in the RayMan software, and 3D simulation of spatial geometry and environment vegetation in the Obstacle section of the software. The SVF index is one of the effective parameters in deriving the thermal comfort of the environment [85].
The PET index was considered a vital indicator in studying thermal comfort and has been used in numerous studies as a reliable indicator in deriving the thermal comfort of the external environment [46]. Tmrt and PET were derived based on extracted micro-climatic data (Table 5), and SVF data derived via the Ray Man software (Table 1).

3.4.2. Psychological Parameters

SPSS software was utilized, according to the statistical data obtained from the questionnaire to examine the significance of the data in three selected intersections, and also to examine the significance of the relationships between various indices with PTC [86,87]. In order to examine cognitive maps more accurately, AramMMA software was used [88]. In this program, all the cognitive maps were overlapped, and then according to the color spectrum, it determined which locations had the most point of reference (Figure 5). Each color represents the number of pointing a location (for example red means one time or purple means 12 times). In order to convert the qualitative data of cognitive maps into quantitative data, inside the AramMMA software, the Retiro area was rated, so that 100 percent of the score was dedicated to the maps that noted parks, while zero percent was considered for those that did not mention to the park. By using the cognitive map analyses, the importance of park cooling effect on resident psychological thermal comfort in different parts of the Retiro Park was represented.

4. Results

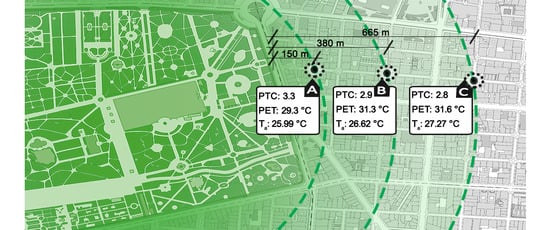
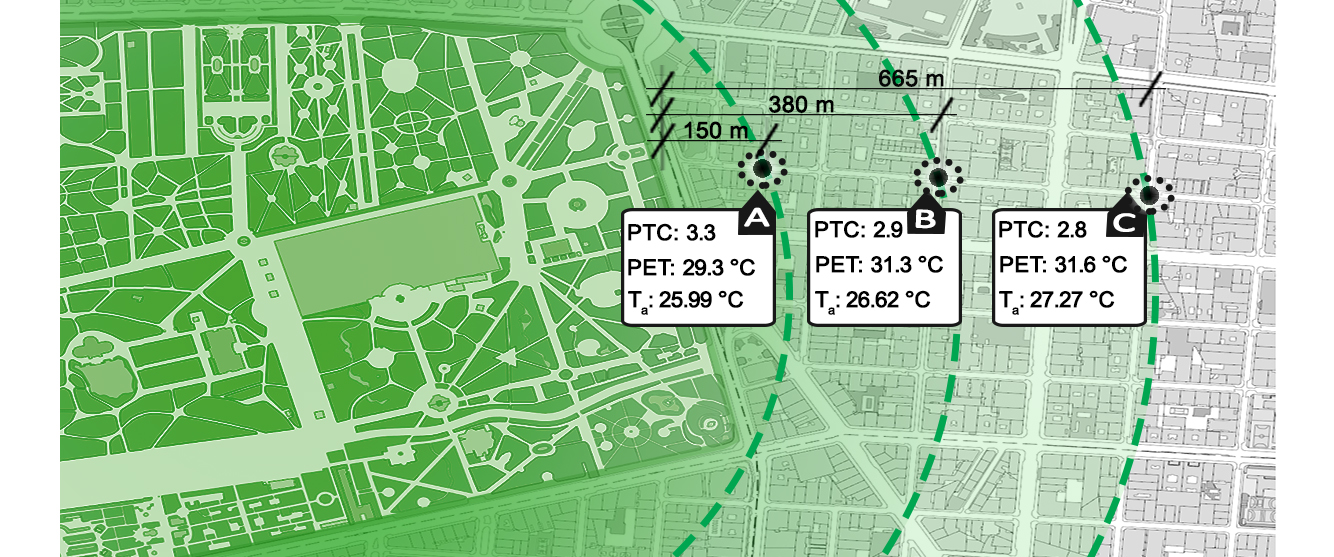
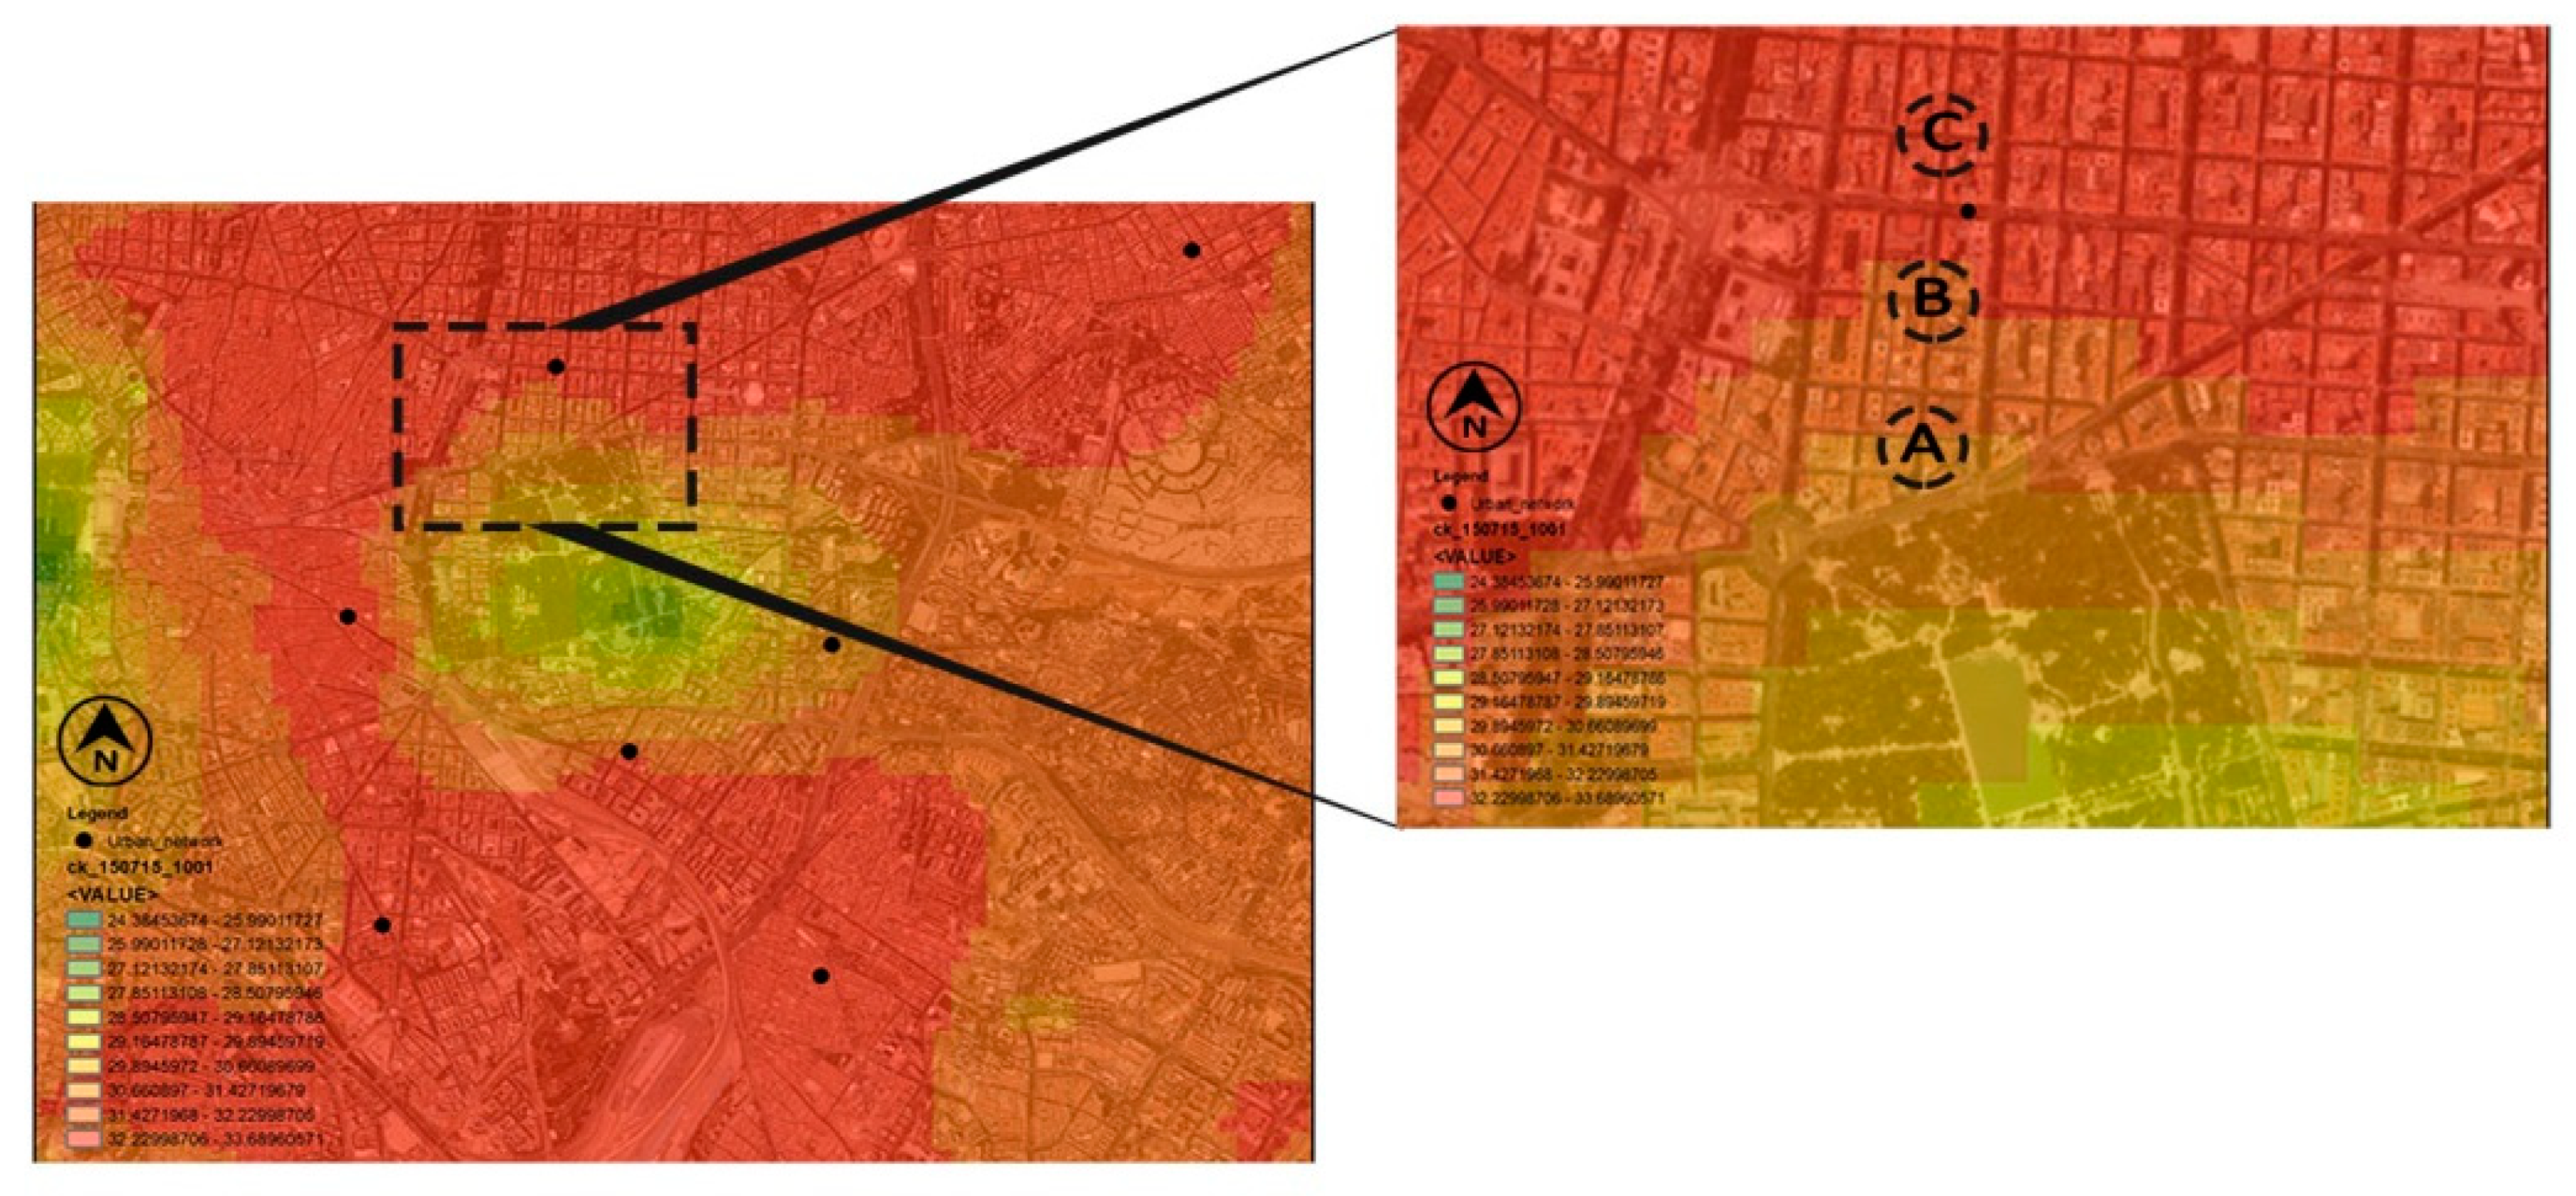
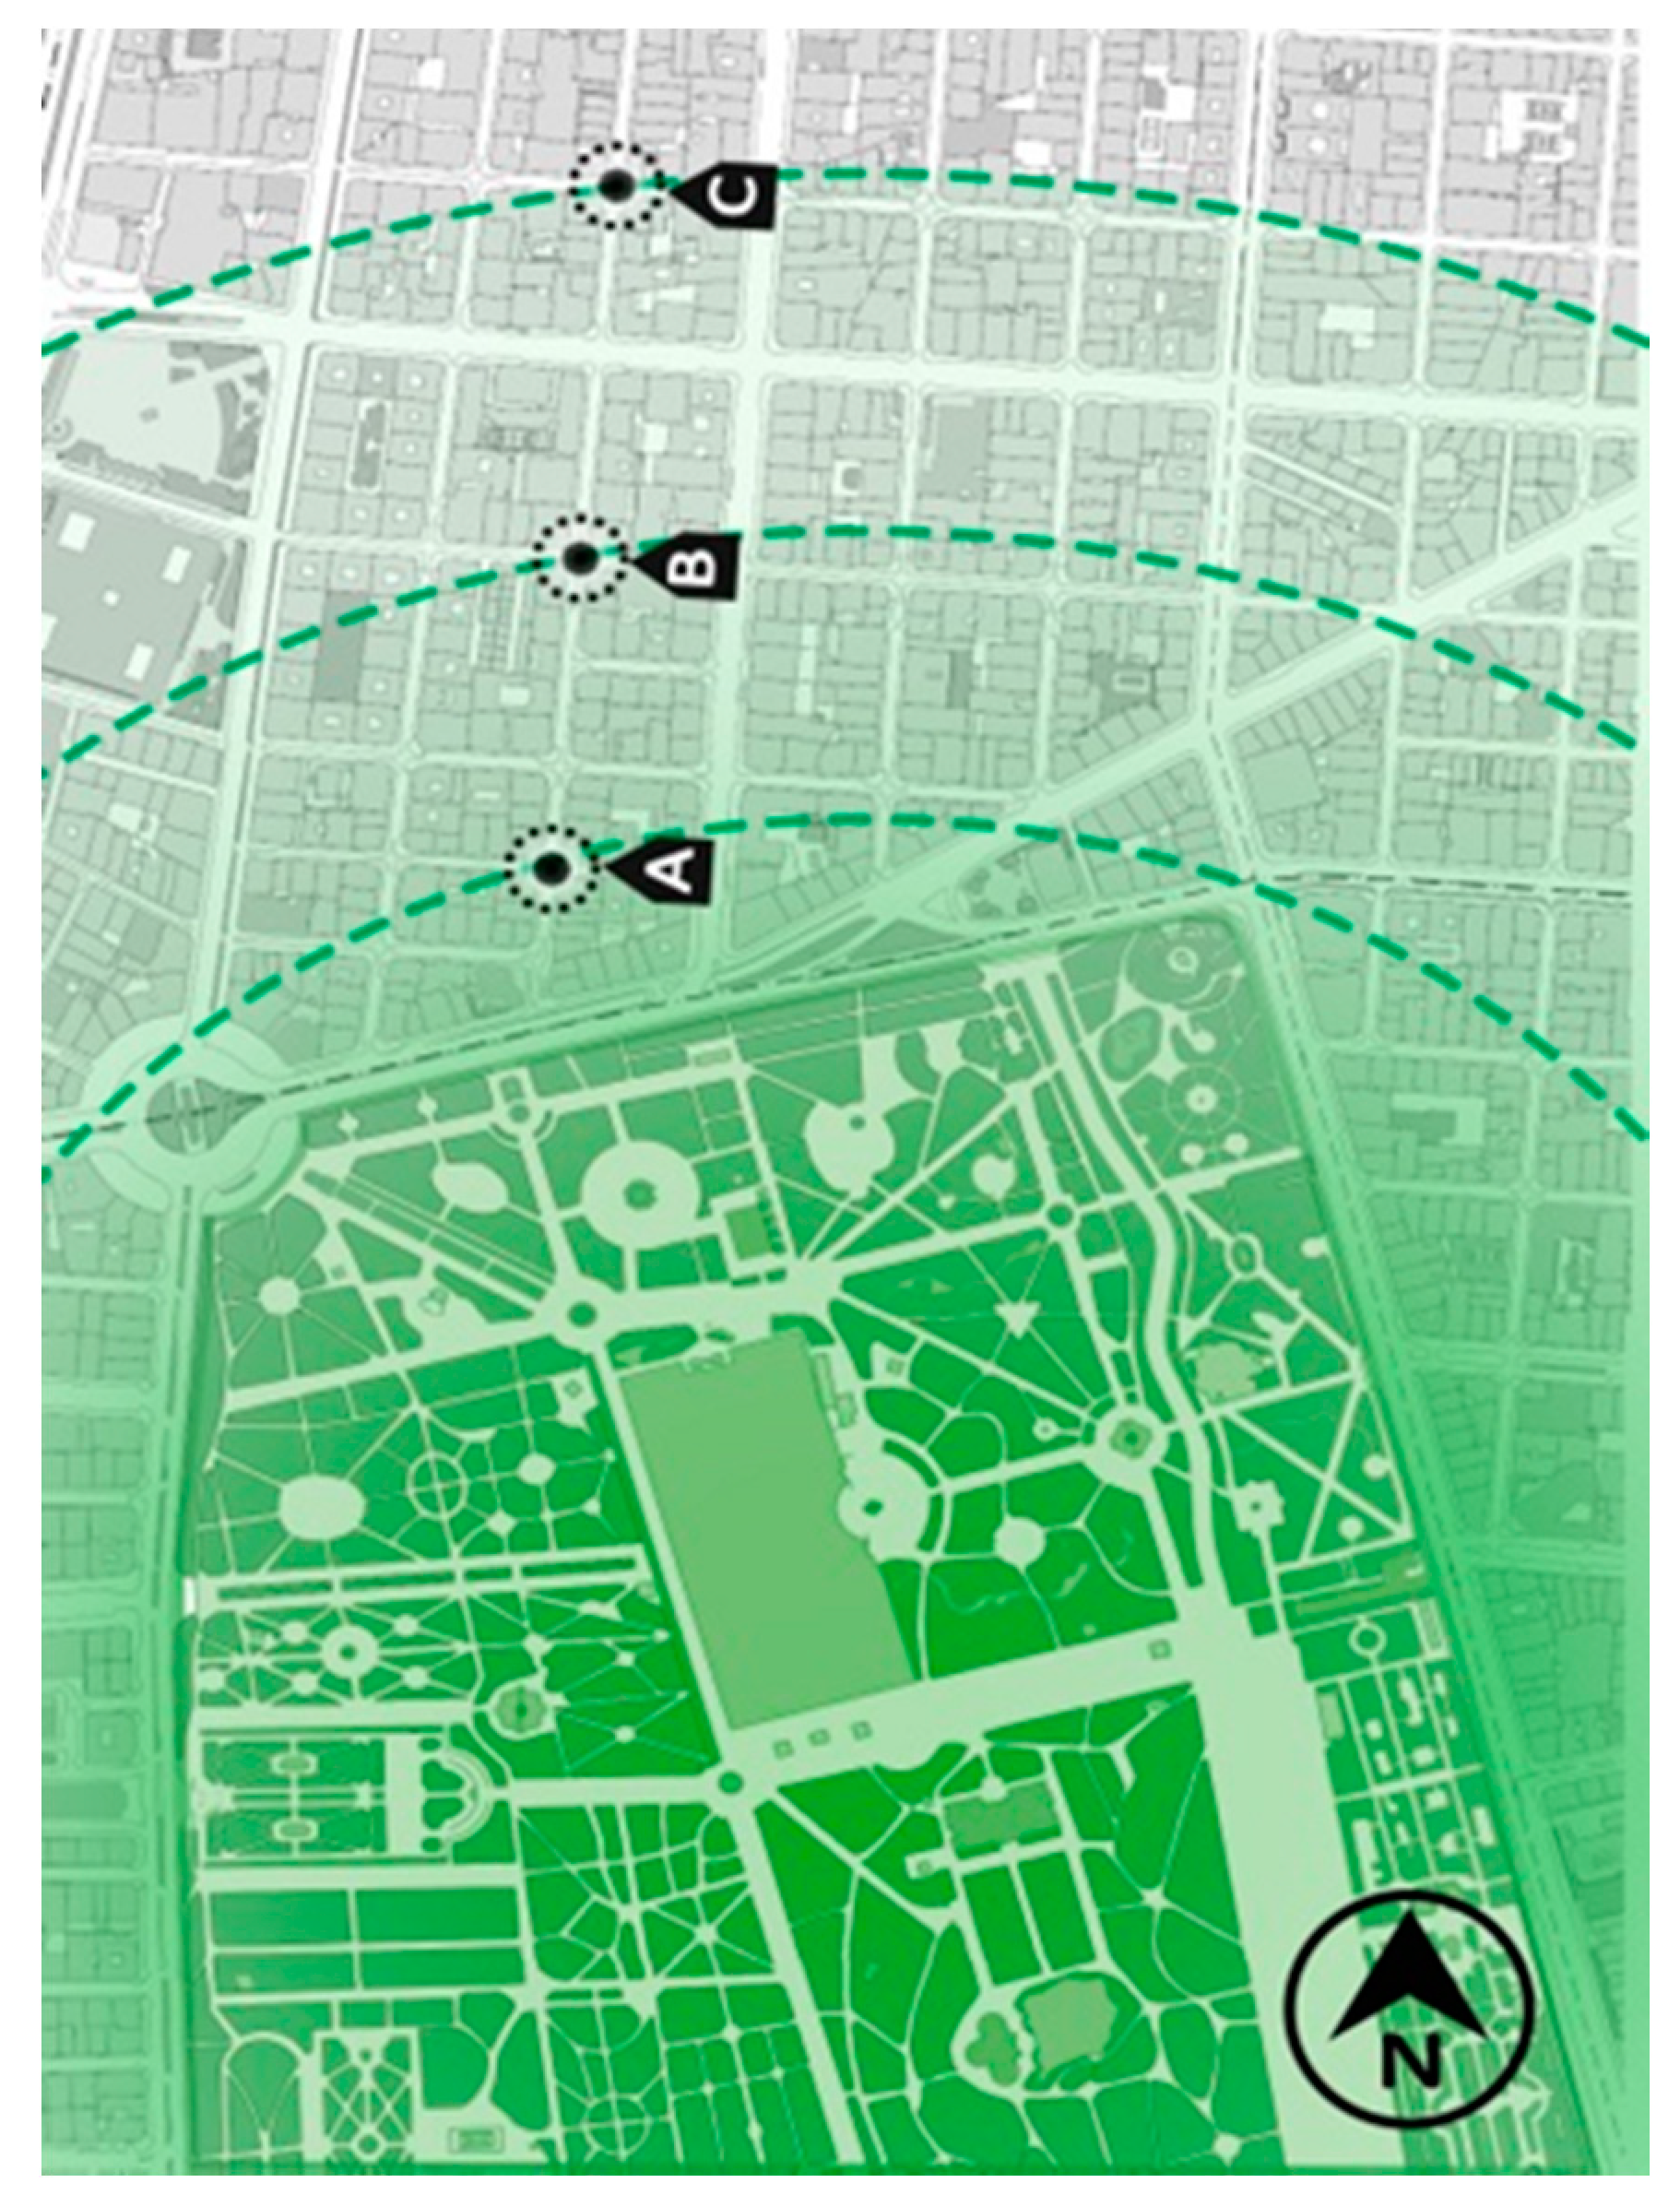
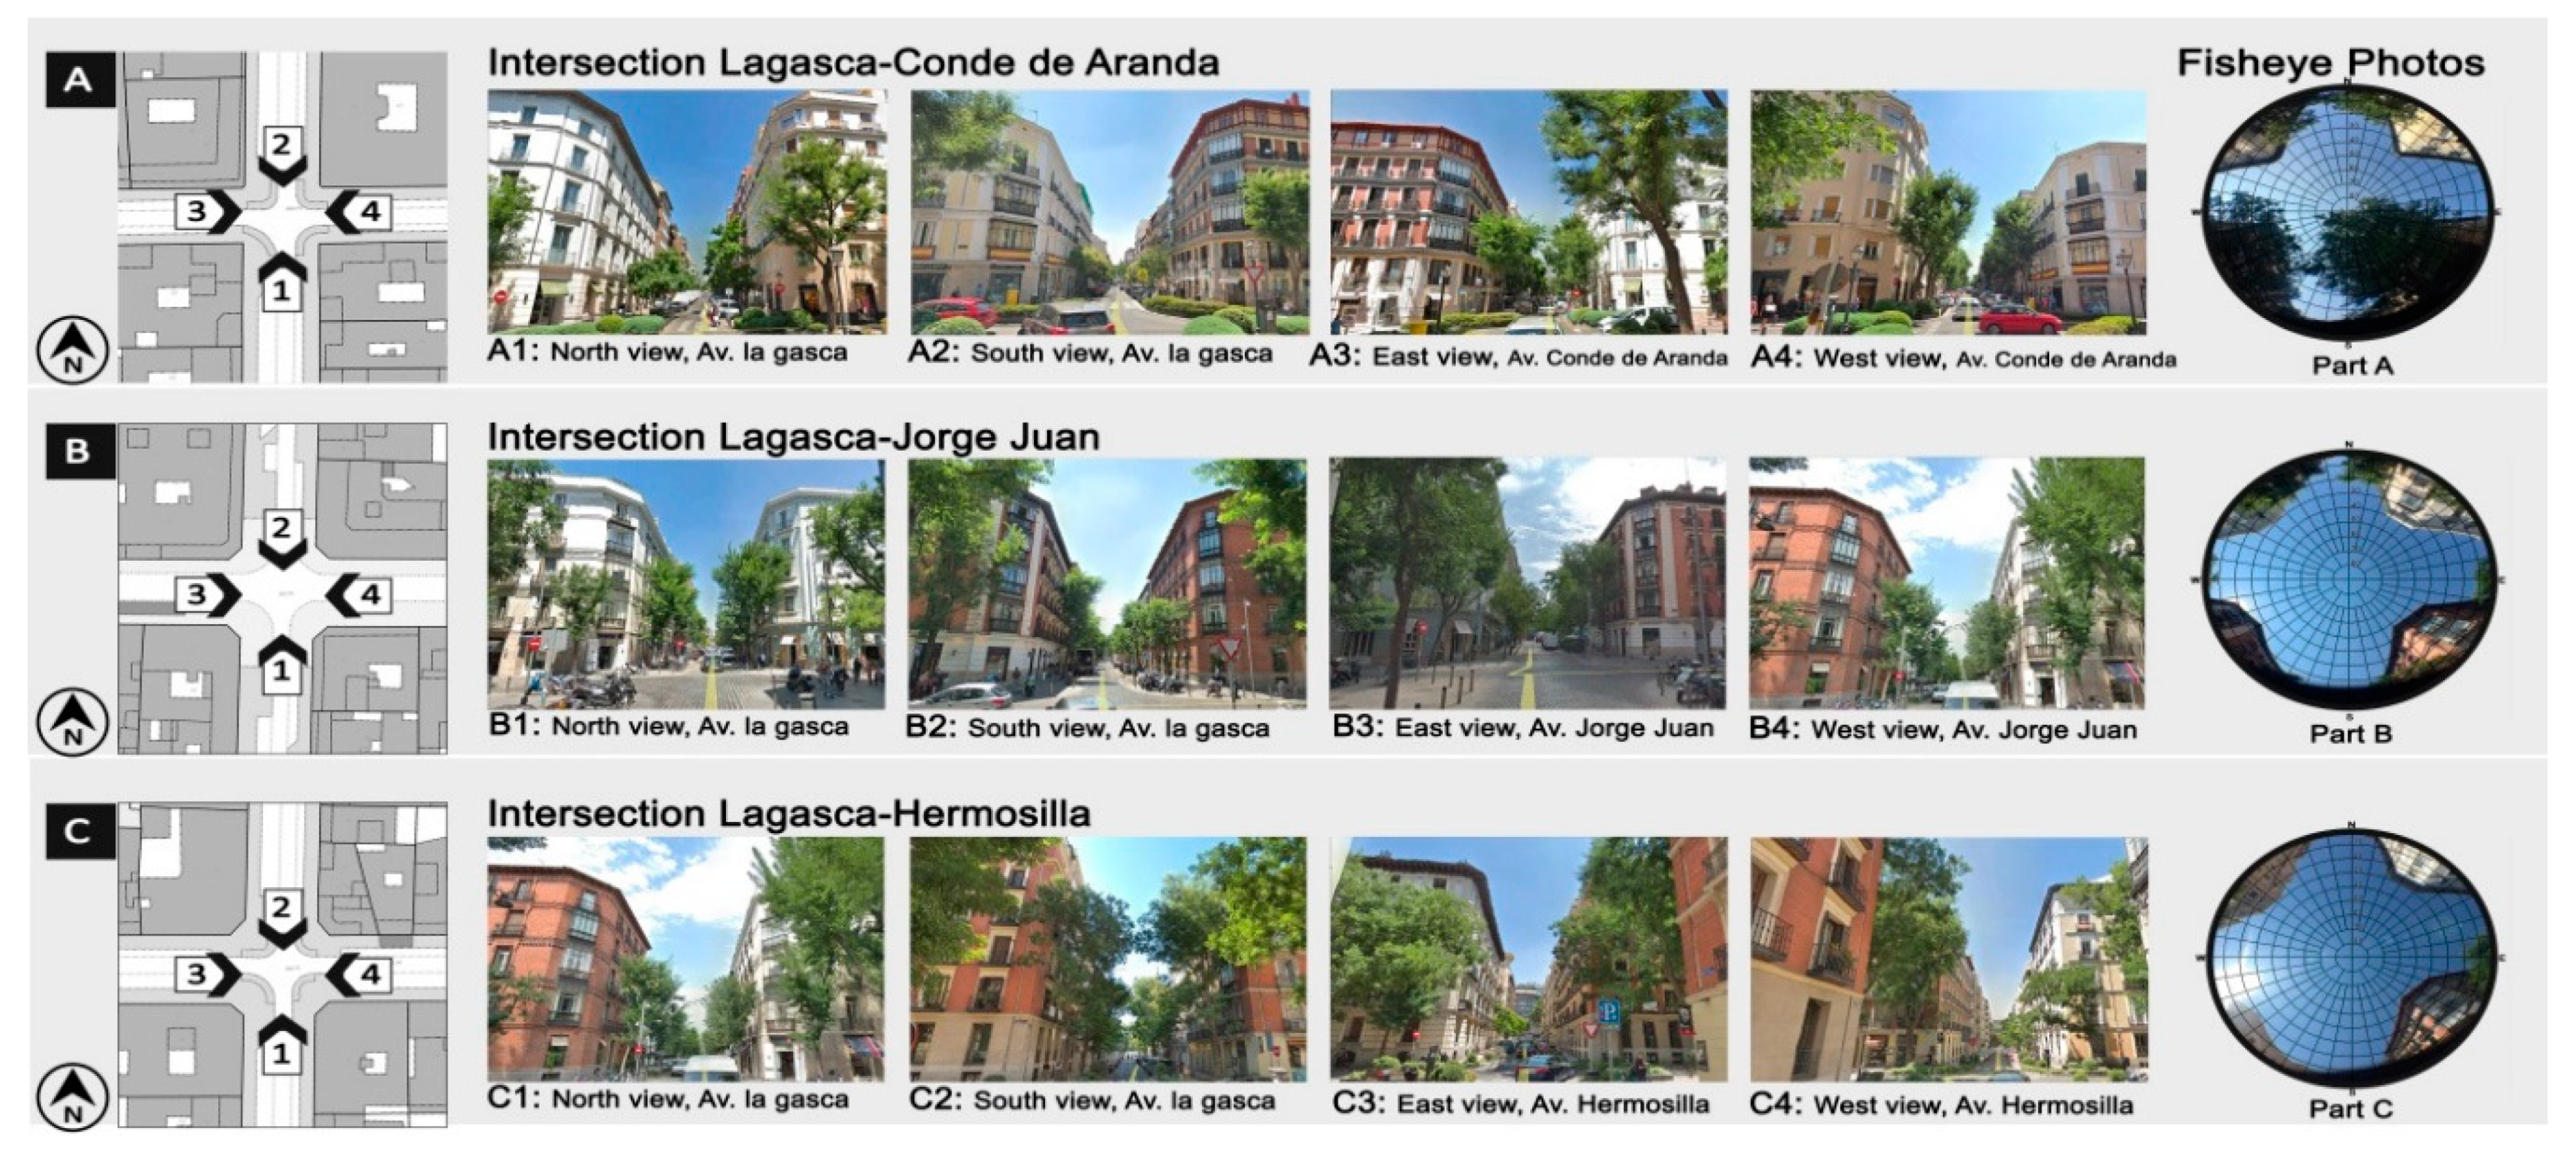
Data was gathered during six days in hot summer, on 22 June, 10 and 24 July, 10 and 24 August and 10 September at three different intersections at different distances from the northern area of Retiro Park (Table 2). The selected data collection time interval was generally between 10:40 and 12:10 CEST (the exact time of each intersection is given in Table 2). This time was chosen since it was between the maximum and minimum temperatures in the park, so the temperature data extracted at points A, B and C were close to the average park temperature (mid-temperature taken by the AEMET weather station [76] on the data extraction days;
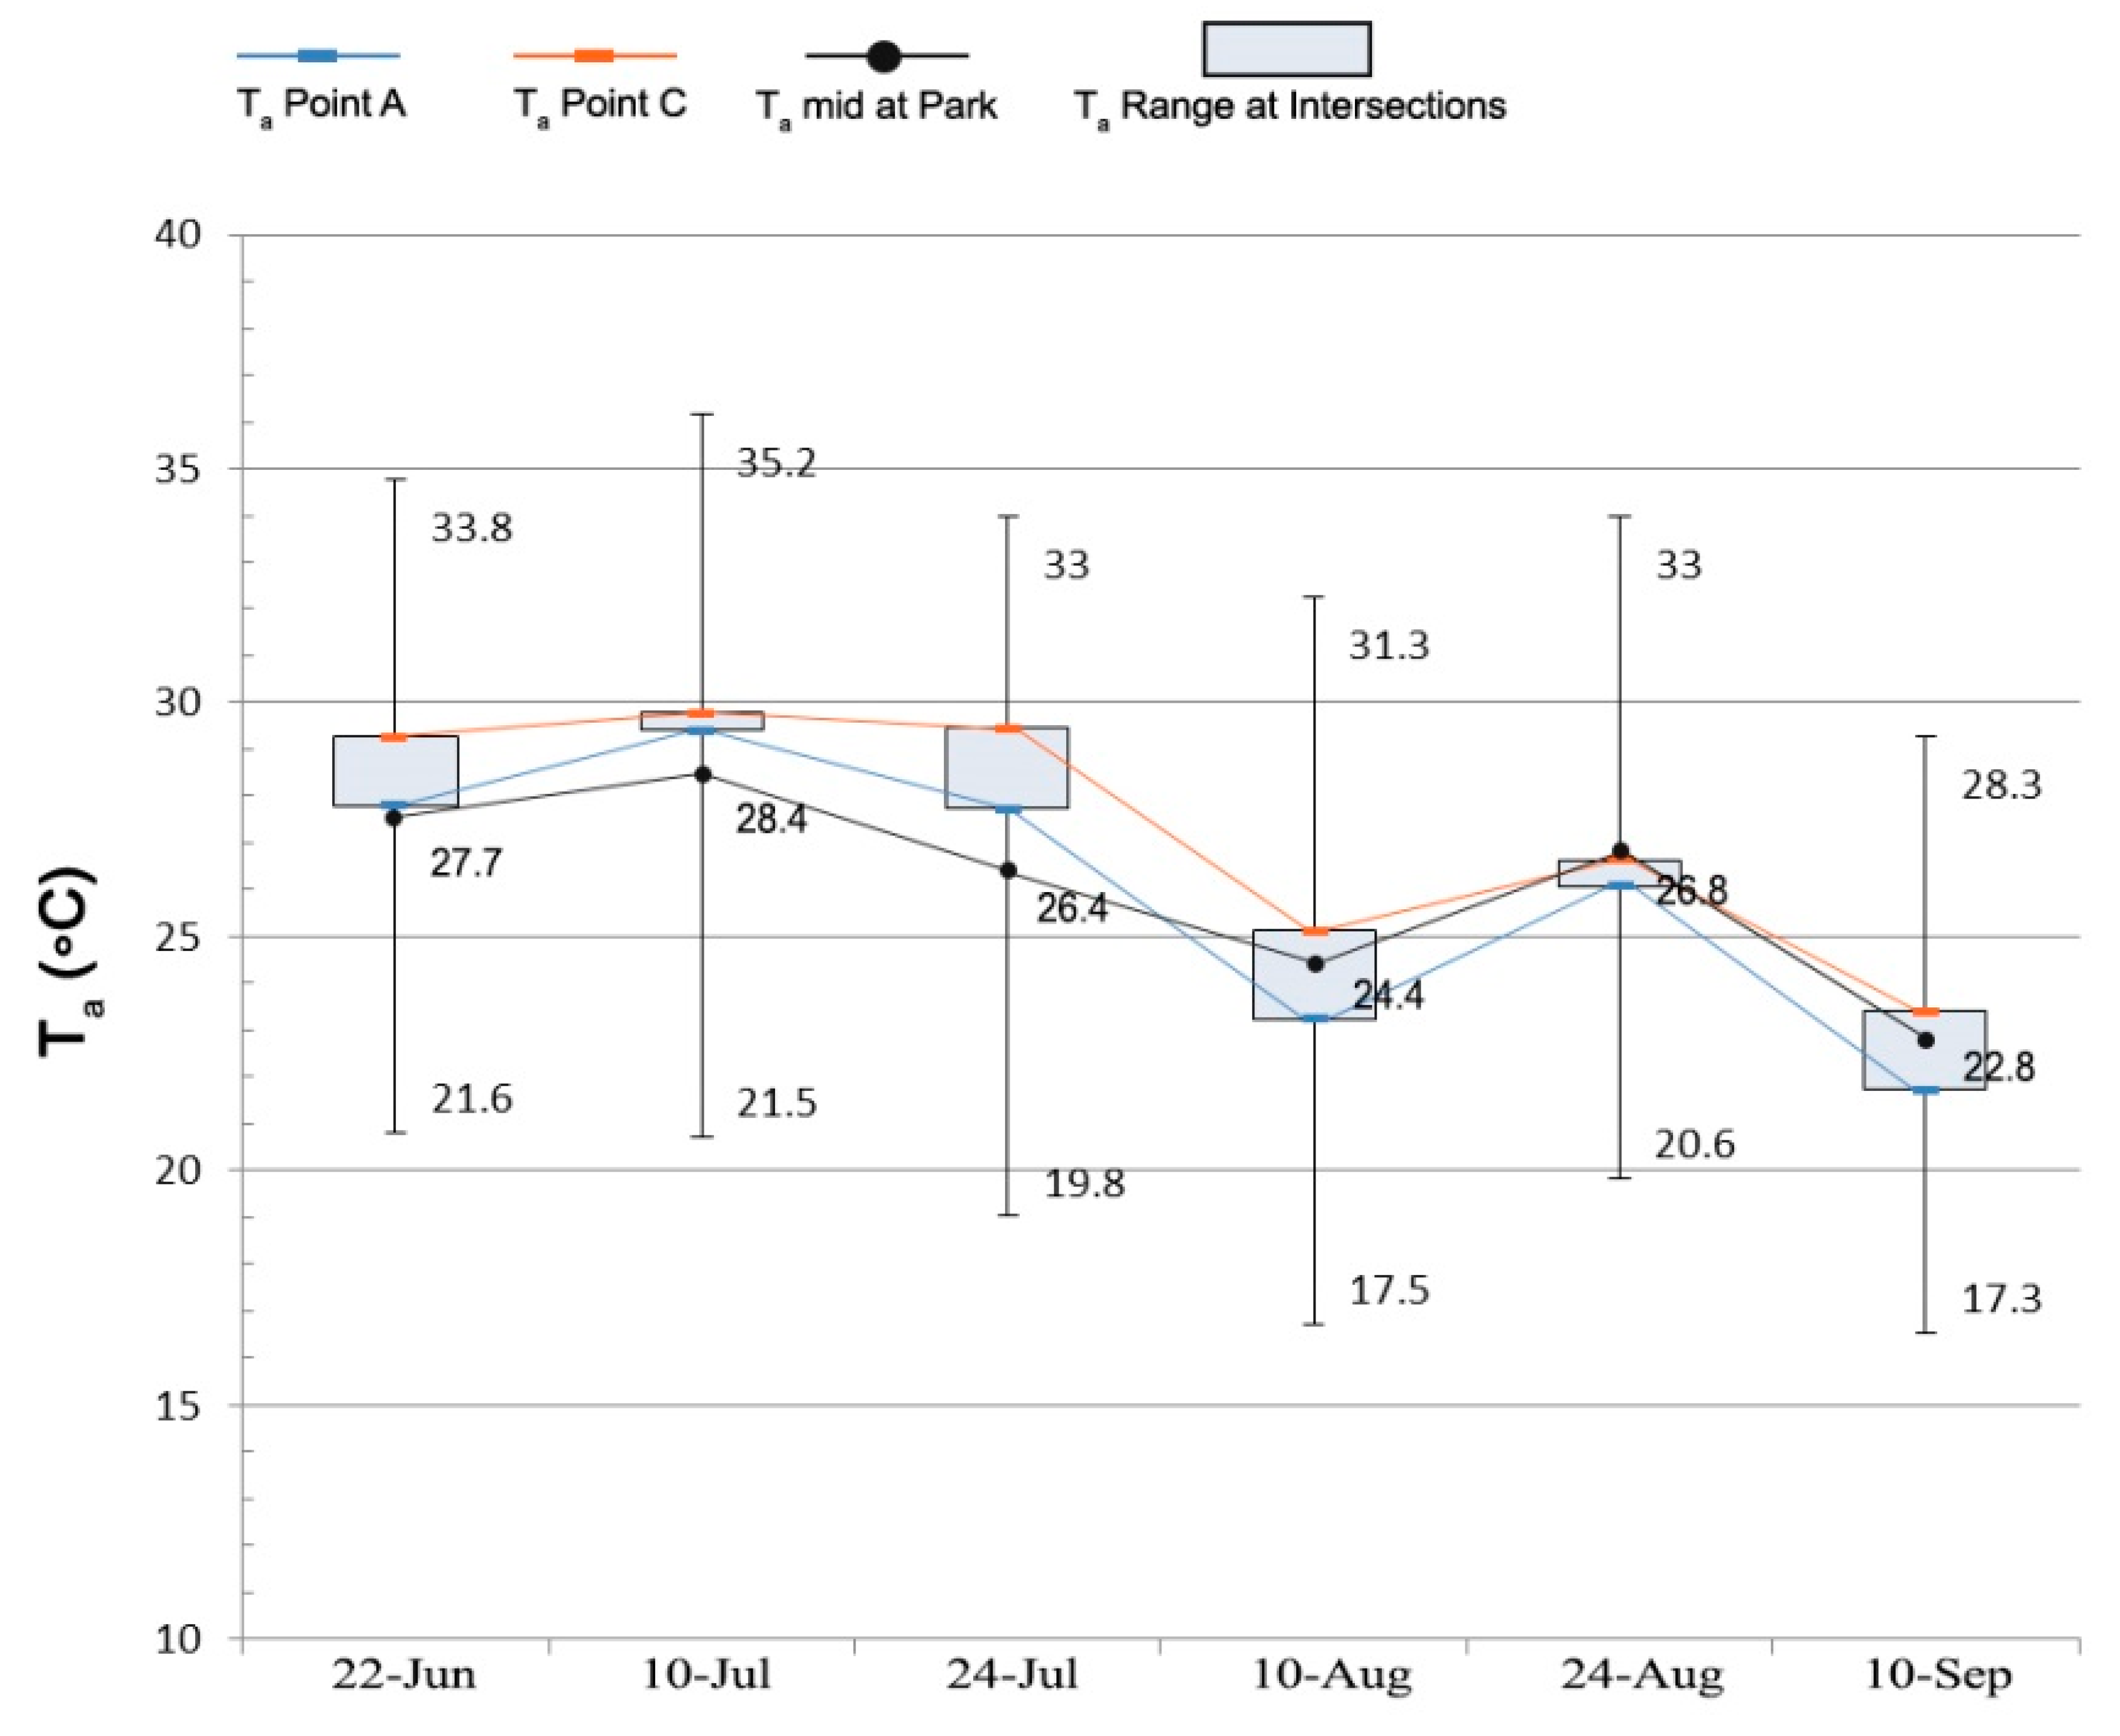
 Table 6). Based on Figure 6, the temperature range for points A, B and C (gray rectangle) was between the maximum and minimum extracted park temperature (linear range). It is noteworthy that among the three areas, the average temperature of point A was closer to the average temperature of the park (mid-temperature; Table 6) compared to the other points. AEMET data showed that the lowest and highest temperatures pertaining to the data extraction days in the Retiro Park were related to the 4:50–6:00 and 13:40–14:40 CEST timeframes.
Gray rectangles: Temperature range at three intersections (bottom side: Ta A, top Side: Ta C).
Linear range: The temperature range of the park is based on AEMET (bottom line: Ta mid of park, top line: Ta Max of the park.
The mean Ta for points A, B and C are 25.99 °C, 26.62 °C and 27.27 °C, respectively. The Ta difference over the measurement days between distance of 150 m (A) and 380 m (B) from the park was about 0.63 °C, between B and C (distance of 665 m) was about 0.65 °C and for the difference between A and C, the temperature difference was about 1.28 °C. According to the results, as the distance from the park increases, the temperature and its difference with areas closer to the park will be greater.

4.1. Assessment of the Park’s Cooling Effecting on Thermal Comfort Indices

In this section, PET data and questionnaire results were used to assess the cooling effect of Retiro Park on thermal comfort. PET data are derived based on the indices standard and the perceived thermal effect is obtained based on the average questionnaire and cognitive maps data. By using both these data, the extent of thermal comfort originating from the Retiro Park cooling effect at distances A, B and C could be deduced as physiological and psychological points of view.

4.1.1. Comparison of the Park Cooling Effect Significance on PET at Different Distances from the Park

In a more accurate analysis using SPSS software, a one-way ANOVA was used to analyze the relationship between distances A, B and C from the park and the relevant PET differences. Upon every variance analysis and in the case of significant mean difference (the significant level of a p-value less than 0.05), Tukey test, which is a series of post-hoc tests, were used to accurately determine which of the average of a variable has a significant difference [89]. Essentially, by using this test, the thermal comfort relationship was deduced based on the PET index, which was obtained using the Ray Man software on distances A, B and C.
The results of the ANOVA test (Table 7) show that concerning the PET index, there was a lower significant error rate (0.05) and 95% confidence level of a significant difference between average PET data in each of the A, B and C points (p-value = 0.029). Therefore, Tukey’s post-hoc tests were used to determine whether there is a significant difference between each of the A, B and C intersections.
The results of this studied grouping test are presented in Table 8. According to this table, it can be stated that there was a significant relationship between the mean PET index at points A and C but the mean PET index between point B with points A and C did not entail a significant difference. The mean PET for A, B and C was 29.3 °C, 31.3 °C and 31.6 °C, respectively. Essentially, it can be stated that the PET index difference among intersections A and C was explicit and significant (p-value = 0.036). The mean of this index in A had a difference of 2.3 °C with C, while the difference between A with B was about 2 °C, which was not considered significant in terms of the Tukey test (p-value = 0.09).

4.1.2. Comparison of the Significance of the Questionnaire Dataset PTC at Different Distances from the Park

In order to compare the significance of the PTC at different distances from the park, the mean dataset extracted from the questionnaire for each section was derived as the PTC. The questions answered by citizens via the questionnaire were about how they felt about the ambient temperature and the effect of Retiro Park on such feelings in the form of four questions (Table 3).
Based on the results of the ANOVA statistical test (Table 9) and a lower significance error level (p-value < 0.05), there was 95% confidence pertaining to a significant difference between mean thermal comfort index (PTC) in each of the A, B and C regions (p-value = 0.032). Thus, Tukey’s post-hoc test was used to determine the significant difference between each of the intersections.
Since the rating of questions was from very low to very high in the form of numbers 1 to 5, Table 10 shows that the average of the total questions during the 6 days for A, B and C was approximately 3.3., 2.9 and 2.8, such that area A was of the highest share indicating more thermal comfort experienced by people in this area. In interpreting the table above, it can be stated that there was a significant difference between the mean PTC index at points A and C (p-value < 0.05), but the mean PTC at point B with points A and C had no significant difference. Based on this relationship, it is also clear that with an increase in distance from the green area, the perceived comfort experienced by citizens was reduced; thus there was an inverse correlation between increased distance and PTC.

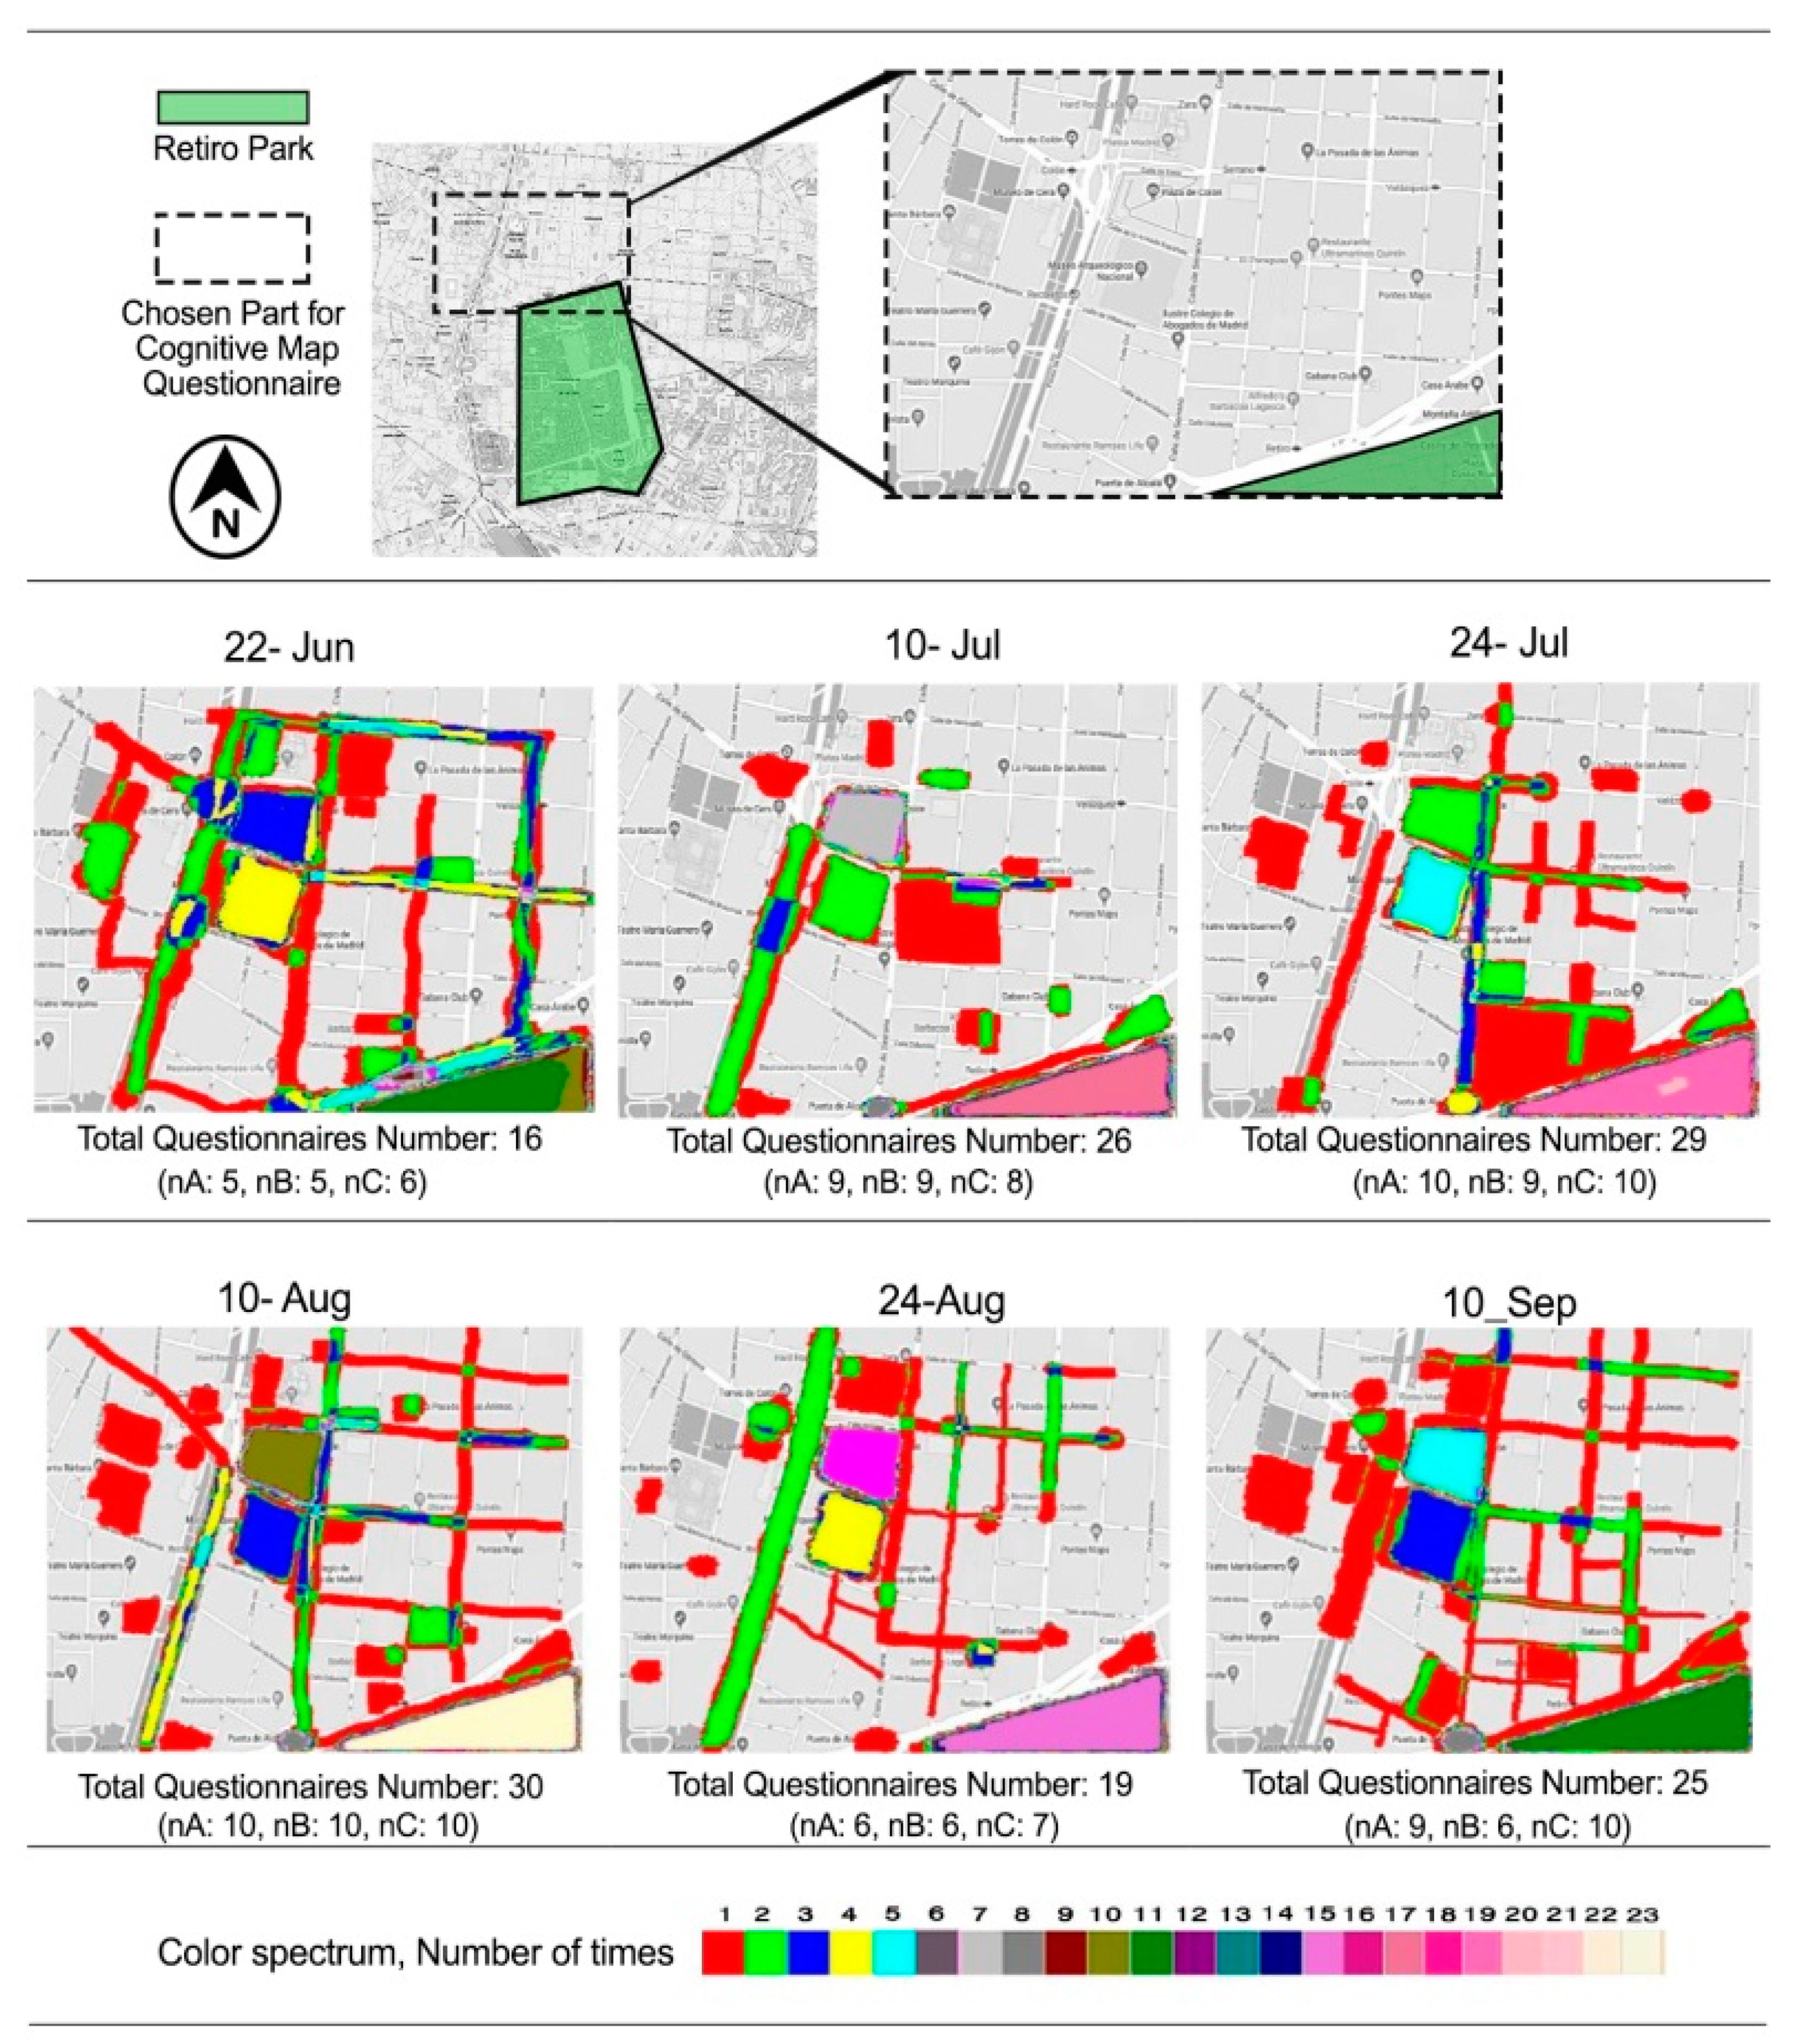
4.1.3. Comparing the Cognitive Maps Significance at Different Distances from the Park

The meaningfulness of the cognitive maps data with the distance from the park was evaluated using the ANOVA test. The analysis of this section was performed by using a AramMMA software for analyzing cognitive maps. In this analysis, the maps pointing to the Retiro park were distinguished from maps that did not mention the park. In fact, 100 percent of the score was dedicated to the maps noting parks, while zero percent was considered for those that did not mention to the park. The result of the ANOVA test (Table 11) illustrated that there was an acceptable agreement (95%) between the correlation of cognitive maps and the distance from the park (p-value < 0.05).
Owing to the agreement, in each of the A, B and C regions the Tukey test was used separately, and the results were as follows. As illustrated (Table 12), 87.7%, 60% and 50.9% of the respondents in the A, B and C areas, respectively, referred to the park. As expected, the highest level of cognitive mapping from the park is in the vicinity of the park area (150 to 380 meters). Nevertheless, in the C region, with 665 meters distance from the park, more than half of the respondents claimed that the site was comfortable thermally thus preferring to spend more time there. The difference between A and C was also meaningful (p-value = 0.000). The good agreement of this relationship depicts the impact of the Retiro park (as a place with a high level of thermal comfort) on the resident’s mental images and psychological dimensions.

4.1.4. Comparison of the Significance of the Questionnaire Dataset PTC with PET

For a closer assessment of the effect of Retiro Park on thermal comfort, the PET index and PTC by citizens were compared on the basis of the total data extracted from the questionnaire. Mainly, this PET analysis, which is a standard index for perceived thermal comfort, was compared with the personal opinion of people about their perceptions concerning the thermal comfort of the environment. SPSS software was used to assess the correlation test as well as other statistical tests.
Based on the results of the Pearson correlation test (Table 13), the relationship between the PET index with thermal comfort in the selected points of A and C was significant (p-value < 0.05) and was of inverse correlation (−0.404 and −0.379). Due to the medium correlation coefficient (medium = −0.3 to −0.5) [90,91,92], the relationship between the PET index and the PTC in area A (p-value = 0.004) was more significant that of area C (p-value = 0.006). Moreover, the significance of PET index relationship with perceived thermal comfort in area B (p-value = 0.061) was not accepted (p-value > 0.05).

4.2. Relations Between Thermal Comfort Indices (Physiological and Psychological)

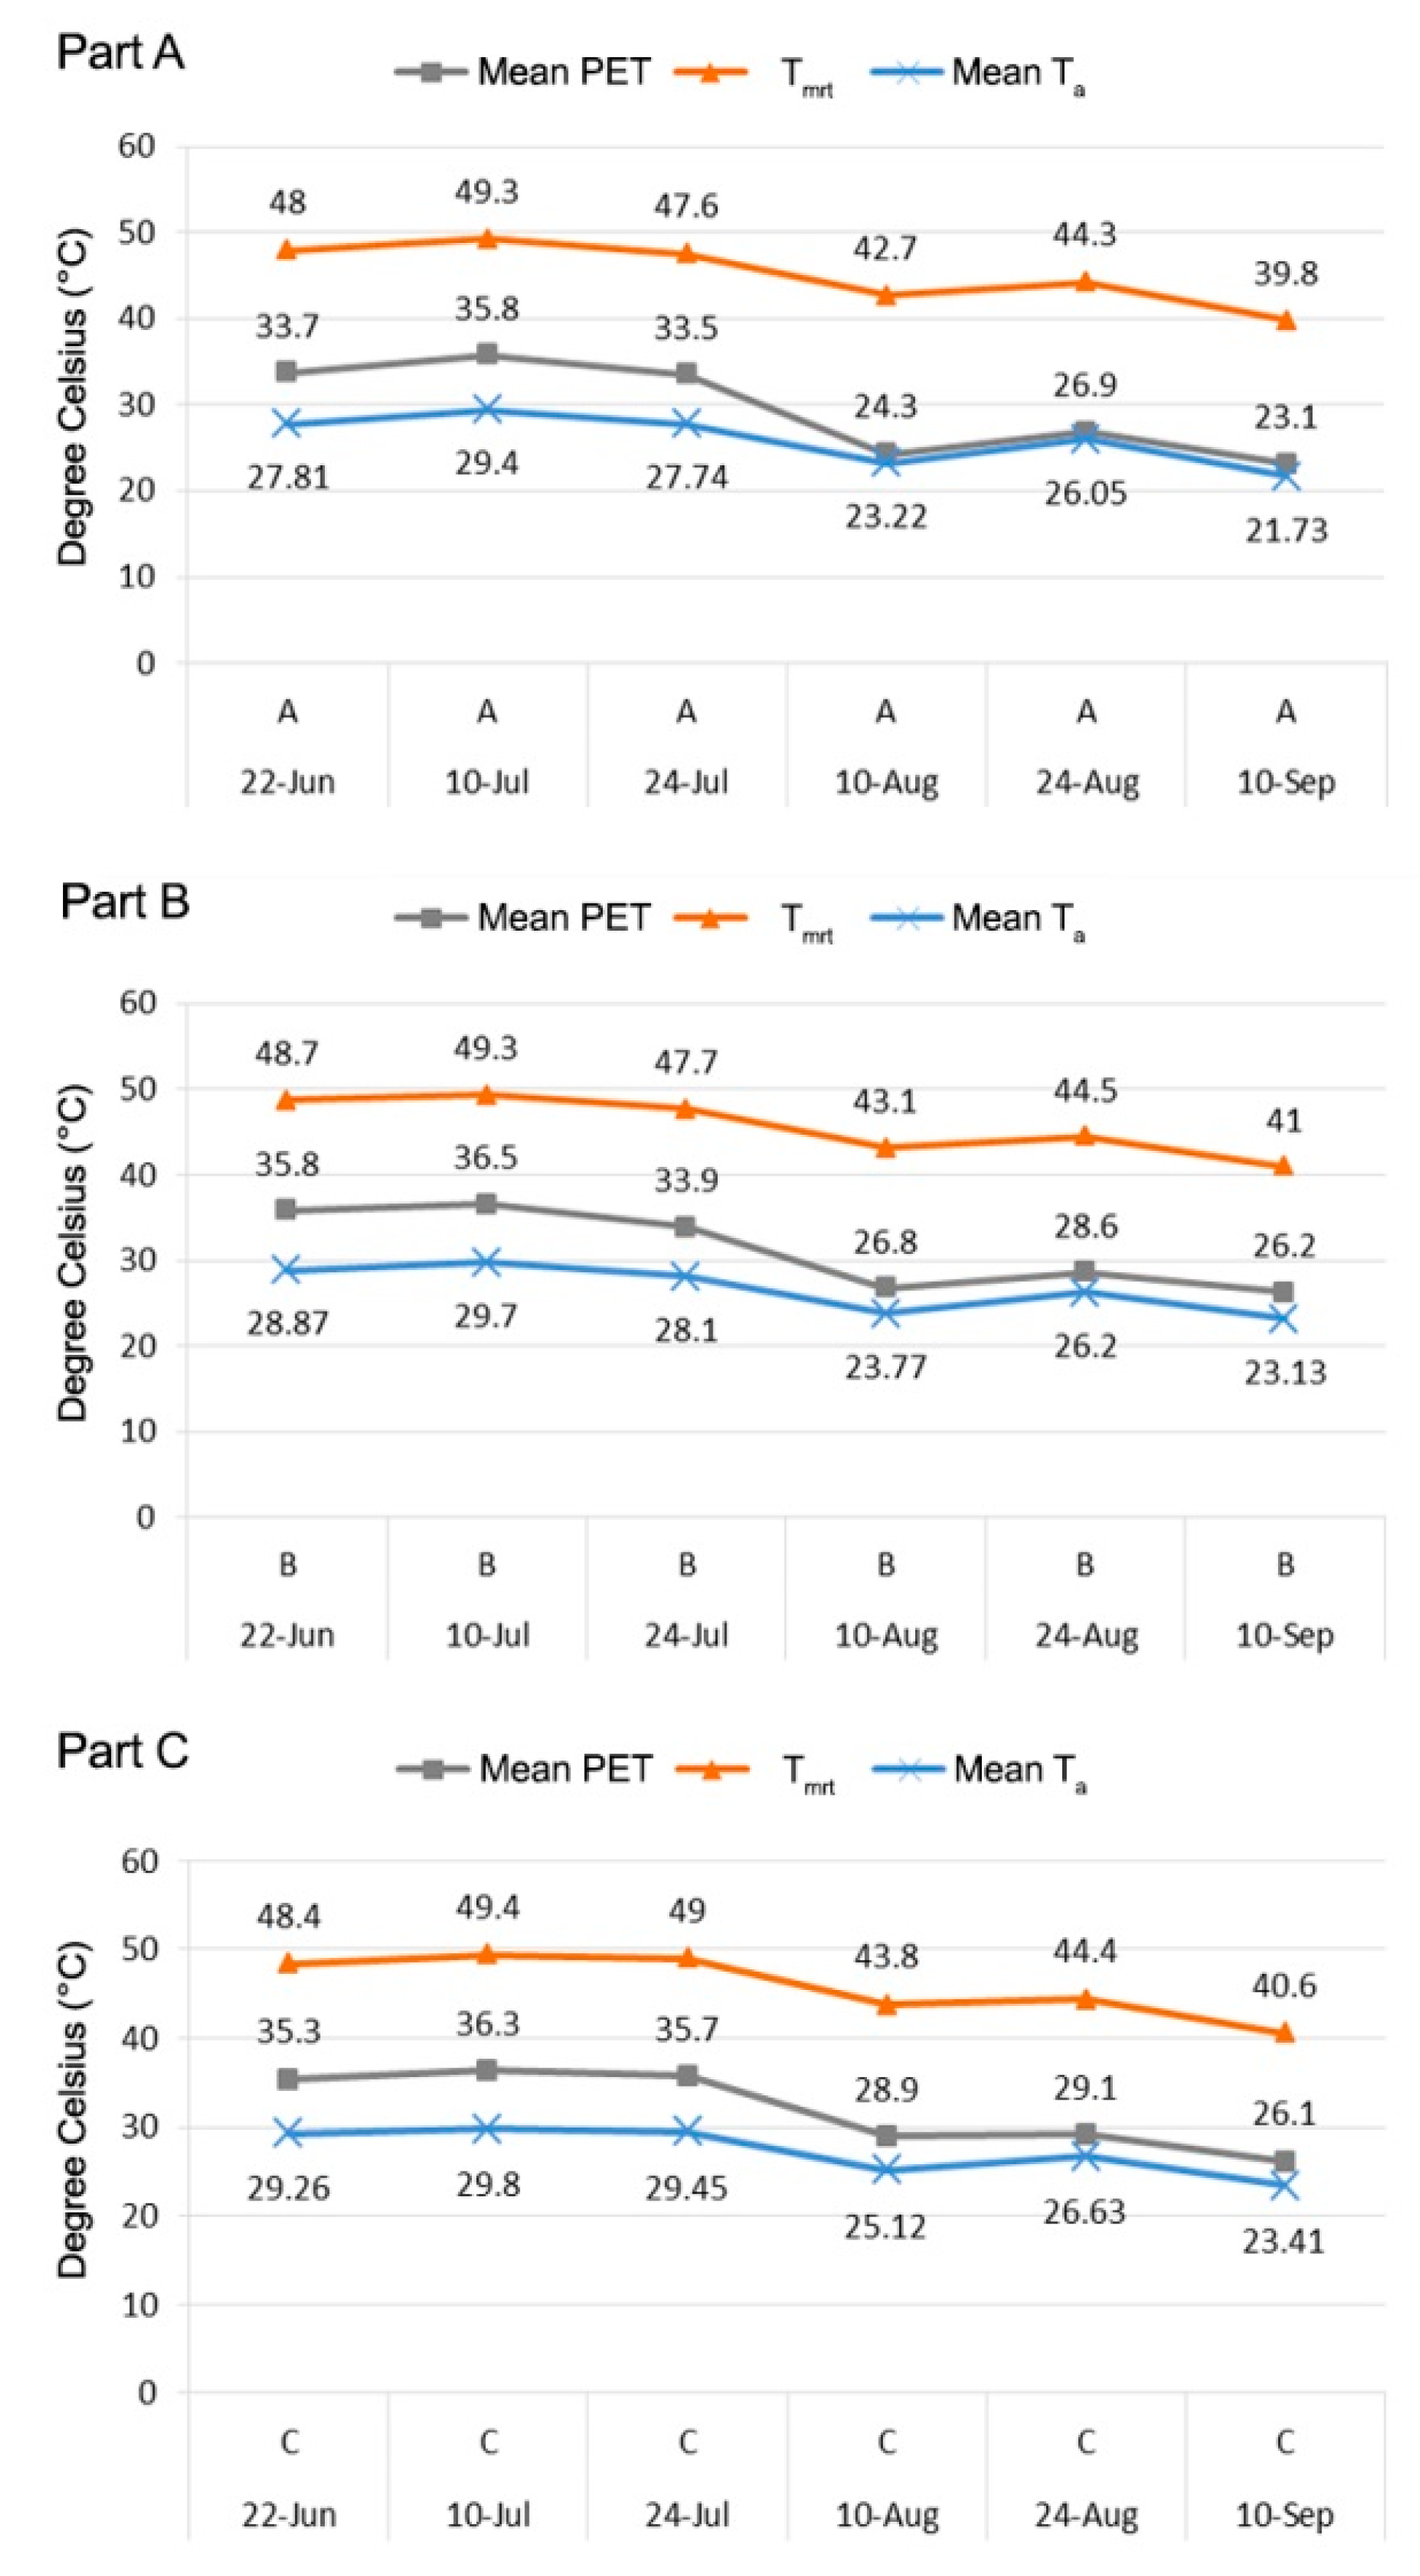
Regarding the results, by increasing the distance from the park at intersections B and C, despite physical and structural similarities to the intersection the A, there was an increase in air temperature (Ta), and consequently, the extent of PET and Tmrt also changed accordingly.
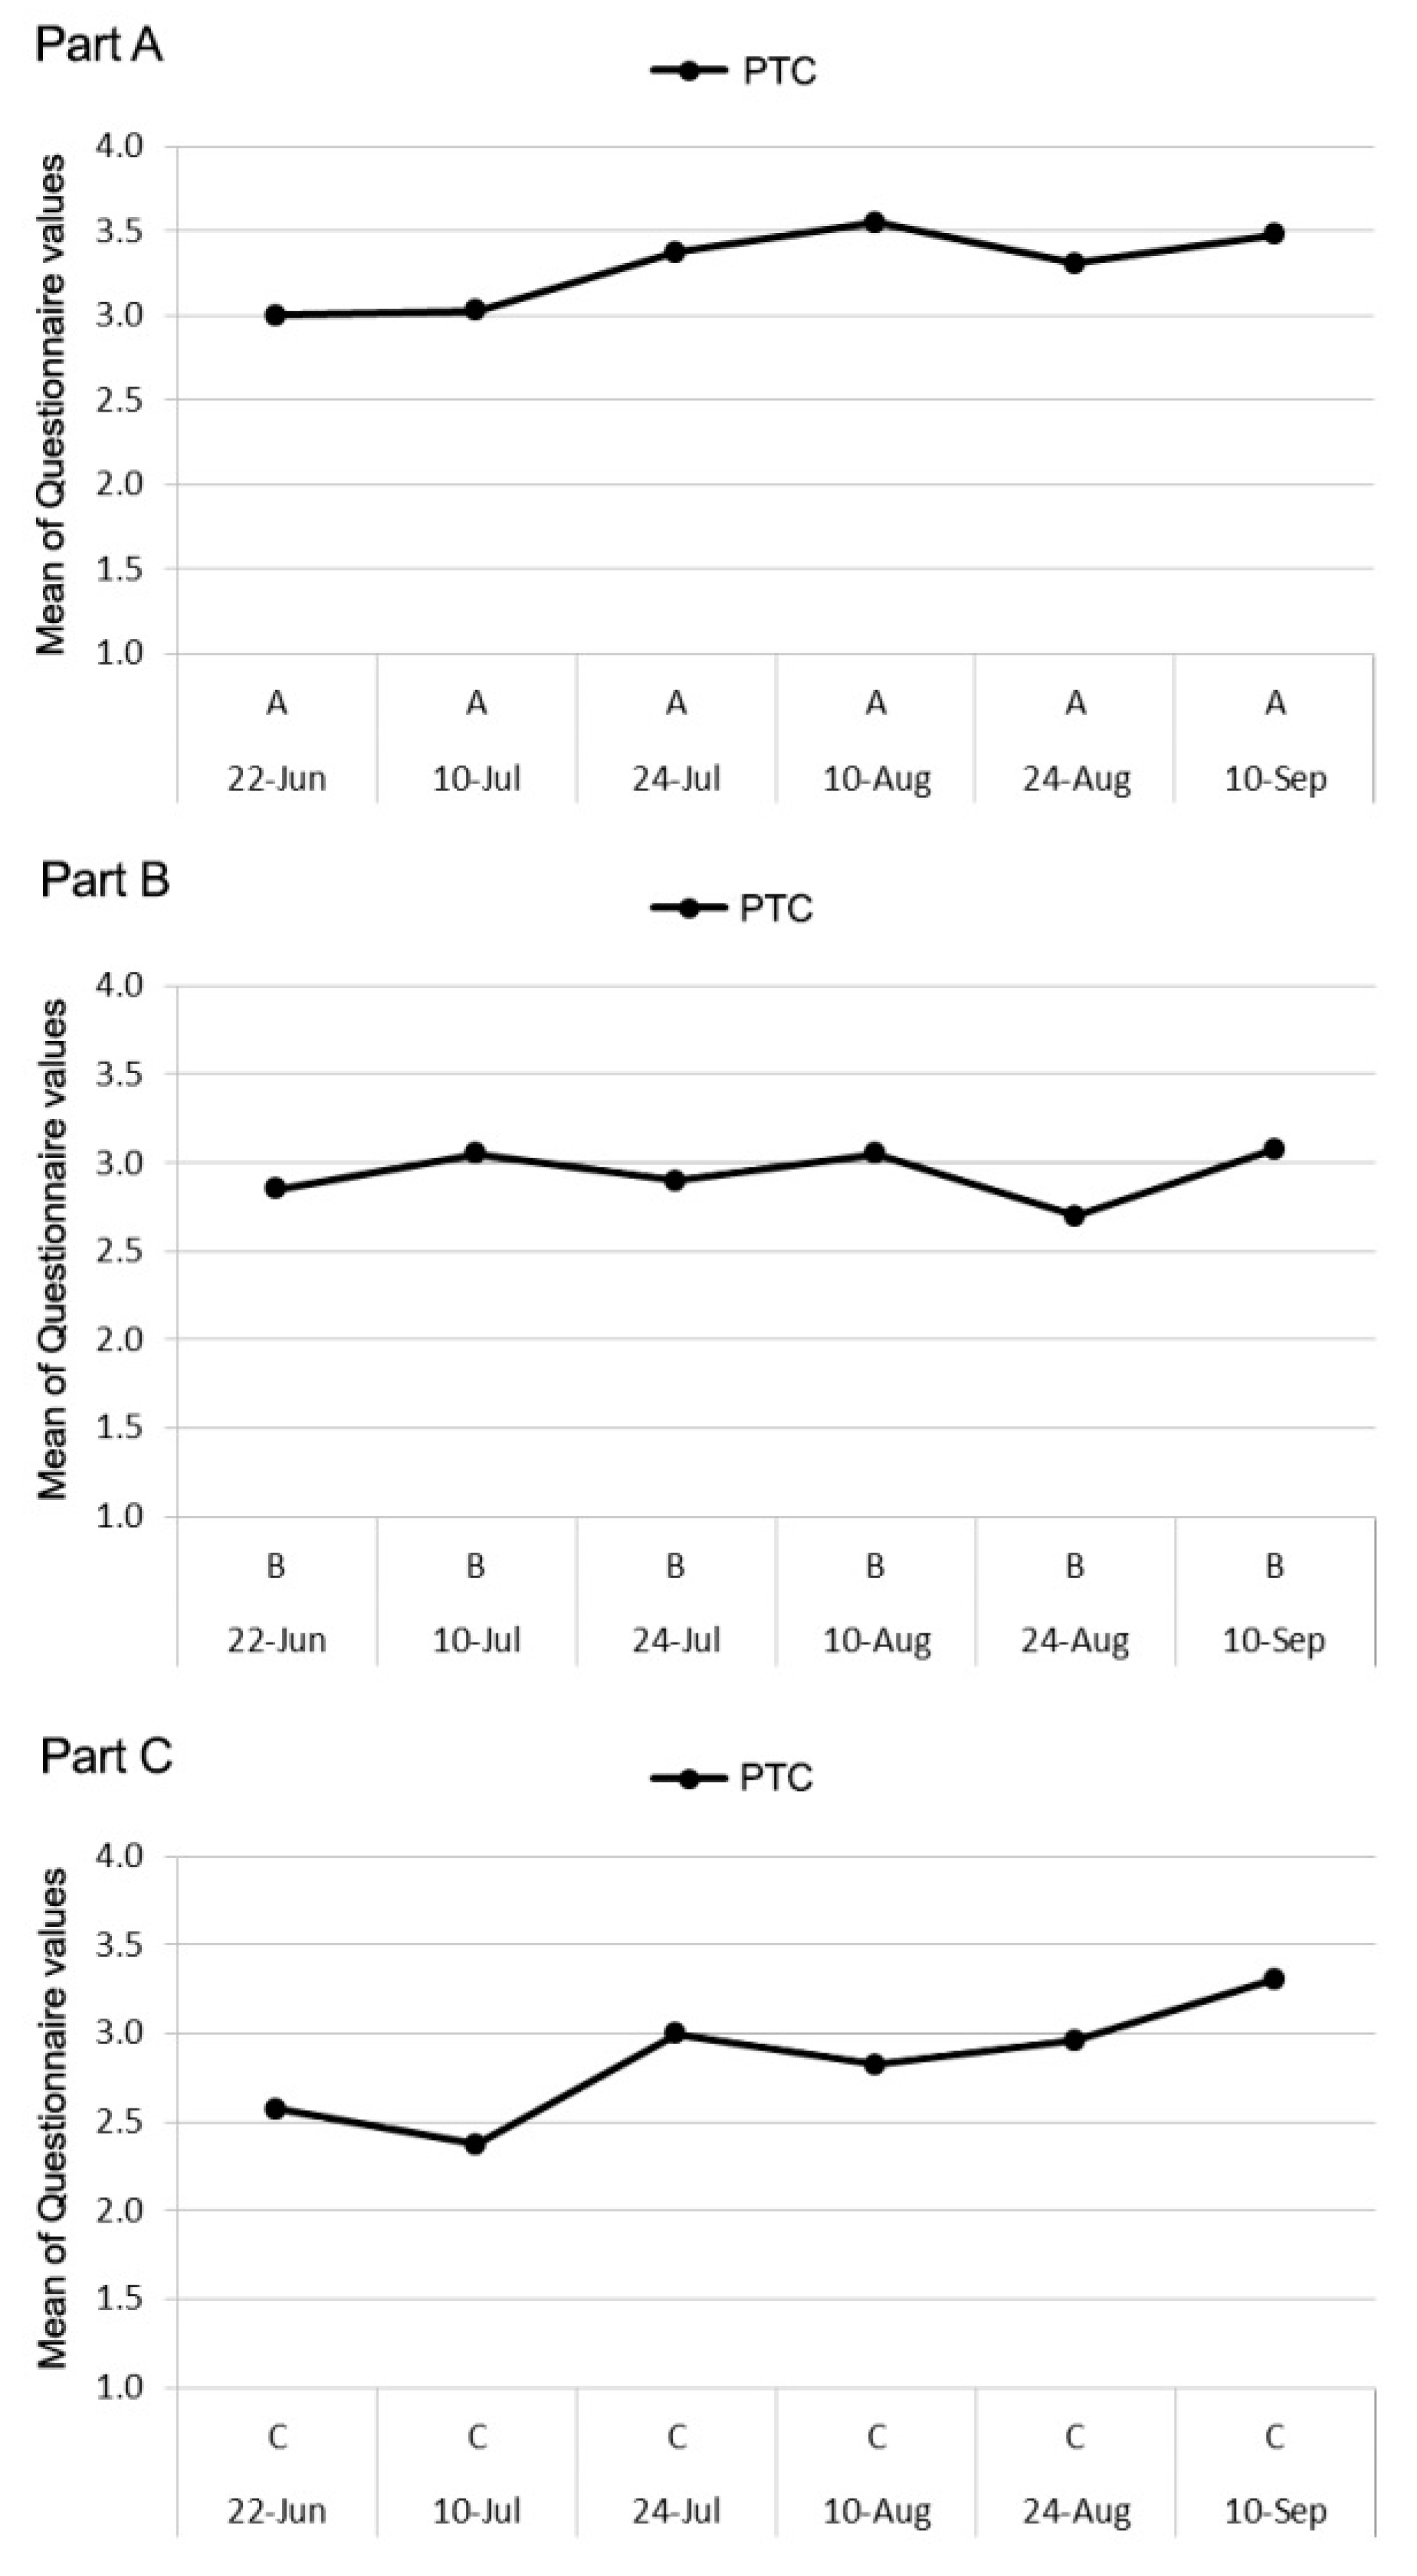
The data pertaining to the perceived thermal comfort (PTC) acquired from the questionnaire was rated from 1 to 5 (1 = very low to 5 = very high) and at points A, B and C during six days were on average approximately 3.3, 2.9 and 2.8, respectively (Table 10). At point A, residents experienced higher thermal comfort compared to the other points. Essentially, the level of PTC at this location was medium to high according to citizens’ opinions (medium = 3), whereas for B and C, the average perceived thermal comfort for the data extraction days was lower than medium. Furthermore, the results show that the extent of PTC at intersection A was more significant in all the days (Figure 7). It is noteworthy that based on statistical data, the perceived thermal comfort was correlated to PET and was of inverse correlation, such that its graph behavior was inversely correlated with the PET graph (Figure 7 and Figure 8). For example, on 10th August, where the PET value was at a minimum at point A (PET 24.3 °C), the relevant perceived thermal comfort was at a maximum (3.6) or on 10th July, at point C, the PET was 36.3 °C, which was higher compared to other points and days which was inversed in the perceived thermal comfort graph and the least value of this index was at point C with a value of 2.4. In addition to the similar behaviors of PET, Tmrt, Ta and PTC parameters at each intersection during the six days of assessment (Figure 7 and Figure 8), the credibility of the data and calculations conducted in this study were approved.
Based on the results, it can be said that Retiro Park played an essential role in providing thermal comfort to the citizens during the summer days in downtown Madrid, which was physically and psychologically debatable. As mentioned, Madrid has a Mediterranean climate that is characterized by hot summers. Studies in the Mediterranean climate have shown how urban green spaces can reduce the impact of urban heat [93,94]. A study carried out in Greece, Athens [95], found that the urban park on the western margin of Athens during the hot summer days could reduce daytime air temperature between 0.2 °C and 2.6 °C. In a similar study conducted in Lisbon, another Mediterranean city during the six days of summer 2007 and 2008 [96], the results showed that a 0.24 ha urban park was able to reduce the air temperature inside the park to 6.9 °C compared to its surrounding air temperatures. These studies and the studies mentioned in the first part of the article indicate that large-scale parks affect their surroundings through cooling down their environment. This is significant for Retiro Park due to its variety of vegetation and vegetation density compared to previous studies. The cooling effect of the park can cool over a distance of 350 m in its northern part, with a dense and regular texture, between 0.06 and 1.28 °C compared to the 655 m range near Heat Island.
As noted earlier, little is known about the cooling effect of urban parks on thermal comfort, and most of the studies have focused on the CED and CEI levels. However, in the Mediterranean areas, a study was carried out in Israel investigating the thermal comfort of urban parks using the PET index.
In this study conducted by Cohen, Potchter and Matzarakis [97], a total of 10 urban parks of various areas (0.2 to 0.36 ha) were assessed in Tel Aviv. Although the investigated parks were smaller in terms of area compared to Retiro Park, the results illustrated that parks with richer vegetation density had greater cooling effects and thermal comfort, and could reduce temperatures by up to 3.8 °C whilst bringing PET to 18 °C during hot summer.
This study proved how important this is in areas with hot summers. However, in this study and other studies on the thermal comfort of large urban parks, less attention was paid to the thermal comfort from a psychological point of view. In this study, in addition to assessing CED and CEI of a park and thermal comfort from the physiological point of view (PET), mental thermal comfort through questionnaires (PTC) and cognitive maps were also investigated. Based on the results, the significance of both PTC and PET indices was confirmed. The two indices were inversely correlated, and when the cooling effect was reduced by the distance from the park, the PET rate increased and the PTC level decreased, which indicates the impact of the cooling effect of the large urban park on the thermal comfort from both psychological and physical perspectives.
In this regard, the role of large urban parks was tangible in providing thermal comfort for citizens and it is necessary to pay more attention to various levels of urban planning and sustainable development.

5. Conclusions

This study examined the potential of large urban parks in providing thermal comfort for citizens living within the park perimeter. The results extracted amidst six hot summer days in Madrid show that large urban parks exhibit a cooling effect. Considering the significance of the mean Ta difference between the distance of 150 m and 665 m from the park (p-value < 0/05), as well as the lower temperature of about 1.28 °C pertaining to the distance closest to the park compared to distances further away from the park (under equal conditions), in addition to the insignificant mean Ta difference at the distance of 380 m compared to 150 m and 665 m (p-value > 0/05), we found that the cooling effect of the large urban park at distances close to the park (under 380 meters) had a significant role in temperature reduction.
Accordingly, the level of PET would increase as the distance from the park increased, and residents would perceive less thermal comfort compared to distances closer to the park. The degree of PET index at a distance of 150 meters from the park was on average 2 °C PET and 2.3 °C PET less compared to distances of 380 meters and 665 meters respectively. The PTC of citizens was acquired based on the average obtained data from the questionnaire, which showed that people in the vicinity of the park experienced more thermal comfort. For the other two regions of the park, which were more distant, less thermal comfort was experienced (less than average).
The results of the cognitive maps analyses demonstrated that large parks played a significant role in thermal comfort improvement affecting people’s mental map. For people, such parks are a space where they feel more comfortable, thereby spending more time to enjoy the desirable temperature. Although the resultant mental maps were closer to residents in the vicinity of parks, the results demonstrated that at long distances to the park (665 meters) those locations still had a psychological dimension in offering thermal comfort (more than 50%).
PET and PTC as the main variables of this research were inversely correlated such that when the distance from the park was increased, the PET was increased and thermal comfort was decreased. The correlation between the two indices was significant in the nearest and furthest distance from the park (p-value < 0.05) and the highest correlation coefficient of the two indices pertains to the distance closest to the park (150 meters). Essentially, this indicates the high level of perceived thermal comfort from the citizens’ point of view as well as the PET compared to distant locations.
As a result, the cooling effect of a large urban park was a suitable solution to improve people’s thermal comfort (as physiological and psychological perspectives) either within the park area or in the vicinity of the park. The results of this study clarified that in areas close to the park, such an effect on thermal comfort is more perceptible. Thus, in order to enhance the cooling effect of large urban parks, it is necessary to implement urban design and planning solutions (qualitative and quantitative) to provide more favorable conditions for the lives of citizens.

Author Contributions

Conceptualization, F.A. and E.H.G.; methodology, F.A. and E.S; software, F.A., A.M. and S.S.; validation, F.A., E.S. and E.H.G.; formal analysis, F.A. and A.S.; investigation, F.A.; data curation, A.M. and S.S.; writing—original draft preparation, F.A. and E.S; writing—review and editing, E.H.G., A.M. and A.R.V.K.; visualization, F.A. and A.R.V.K.; supervision, E.H.G and A.R.V.K.

Funding

This publication was supported by the project: “Support of research and development activities of the J. Selye University in the field of Digital Slovakia and creative industry” of the Research & Innovation Operational Programme (ITMS code: NFP313010T504) co-funded by the European Regional Development Fund. Further, the research has been co-funded by the European Regional Development Fund.

Conflicts of Interest

The authors declare no conflict of interest.

References

  1. Dimoudi, A.; Kantzioura, A.; Zoras, S.; Pallas, C.; Kosmopoulos, P. Investigation of urban microclimate parameters in an urban center. Energy Build. 2013, 64, 1–9. [Google Scholar] [CrossRef]
  2. Ninikas, K.; Hytiris, N.; Emmanuel, R.; Aaen, B. The Performance of an ASHP System Using Waste Air to Recover Heat Energy in a Subway System. Clean Technol. 2019, 1, 154–163. [Google Scholar] [CrossRef] [Green Version]
  3. IPCC. Meeting Report of the Intergovernmental Panel on Climate Change Expert Meeting on Mitigation, Sustainability and Climate Stabilization Scenarios; Shukla, R.P., Skea, J., van Diemen, R., Calvin, K., Christophersen, Ø., Creutzig, F., Fuglestvedt, J., Huntley, E., Lecocq, F., Pathak, M., et al., Eds.; IPCC Working Group III Technical Support Unit, Imperial College London: London, UK, 2017. [Google Scholar]
  4. Sobrino, J.A.; Oltra-Carrió, R.; Sòria, G.; Jiménez-Muñoz, J.C.; Franch, B.; Hidalgo, V.; Mattar, C.; Julien, Y.; Cuenca, J.; Paganini, M.; et al. Evaluation of the surface urban heat island effect in the city of Madrid by thermal remote sensing. Int. J. Remote Sens. 2012, 34, 3177–3192. [Google Scholar] [CrossRef]
  5. Sánchez-Guevara Sánchez, C.; Núñez Peiró, M.; Neila González, F.J. Urban Heat Island and Vulnerable Population. The Case of Madrid. In Sustainable Development and Renovation in Architecture, Urbanism and Engineering; Springer International Publishing: Cham, Switzerland, 2017; pp. 3–13. [Google Scholar] [Green Version]
  6. Taha, H. Characterization of Urban Heat and Exacerbation: Development of a Heat Island Index for California. Climate 2017, 5, 59. [Google Scholar] [CrossRef]
  7. Oke, T.R. The energetic basis of the urban heat island. Q. J. R. Meteorol. Soc. 1982, 108, 1–24. [Google Scholar] [CrossRef]
  8. Leal Filho, W.; Echevarria Icaza, L.; Neht, A.; Klavins, M.; Morgan, E.A. Coping with the impacts of urban heat islands. A literature based study on understanding urban heat vulnerability and the need for resilience in cities in a global climate change context. J. Clean. Prod. 2018, 171, 1140–1149. [Google Scholar] [CrossRef] [Green Version]
  9. Khanian, M.; Serpoush, B.; Gheitarani, N. Balance between place attachment and migration based on subjective adaptive capacity in response to climate change: The case of Famenin County in Western Iran. Clim. Dev. 2019, 11, 69–82. [Google Scholar] [CrossRef]
  10. Ling, T.-Y.; Chiang, Y.-C. Well-being, health and urban coherence-advancing vertical greening approach toward resilience: A design practice consideration. J. Clean. Prod. 2018, 182, 187–197. [Google Scholar] [CrossRef]
  11. Singh, R.B.; Grover, A.; Zhan, J. Inter-Seasonal Variations of Surface Temperature in the Urbanized Environment of Delhi Using Landsat Thermal Data. Energies 2014, 7, 1811–1828. [Google Scholar] [CrossRef] [Green Version]
  12. Aram, F.; Solgi, E.; Holden, G. The role of green spaces in increasing social interactions in neighborhoods with periodic markets. Habitat Int. 2019, 84, 24–32. [Google Scholar] [CrossRef]
  13. Demuzere, M.; Orru, K.; Heidrich, O.; Olazabal, E.; Geneletti, D.; Orru, H.; Bhave, A.G.; Mittal, N.; Feliu, E.; Faehnle, M. Mitigating and adapting to climate change: Multi-functional and multi-scale assessment of green urban infrastructure. J. Environ. Manag. 2014, 146, 107–115. [Google Scholar] [CrossRef]
  14. Zölch, T.; Maderspacher, J.; Wamsler, C.; Pauleit, S. Using green infrastructure for urban climate-proofing: An evaluation of heat mitigation measures at the micro-scale. Urban For. Urban Green. 2016, 20, 305–316. [Google Scholar] [CrossRef]
  15. Park, J.; Kim, J.-H.; Lee, D.K.; Park, C.Y.; Jeong, S.G. The influence of small green space type and structure at the street level on urban heat island mitigation. Urban For. Urban Green. 2017, 21, 203–212. [Google Scholar] [CrossRef]
  16. Buyadi, S.N.A.; Mohd, W.M.N.W.; Misni, A. Green Spaces Growth Impact on the Urban Microclimate. Procedia Soc. Behav. Sci. 2013, 105, 547–557. [Google Scholar] [CrossRef] [Green Version]
  17. Lottrup, L.; Grahn, P.; Stigsdotter, U.K. Workplace greenery and perceived level of stress: Benefits of access to a green outdoor environment at the workplace. Landsc. Urban Plan. 2013, 110, 5–11. [Google Scholar] [CrossRef]
  18. Imran, H.M.; Kala, J.; Ng, A.W.M.; Muthukumaran, S. Effectiveness of green and cool roofs in mitigating urban heat island effects during a heatwave event in the city of Melbourne in southeast Australia. J. Clean. Prod. 2018, 197, 393–405. [Google Scholar] [CrossRef]
  19. Peng, L.L.; Jim, C.Y. Green-Roof Effects on Neighborhood Microclimate and Human Thermal Sensation. Energies 2013, 6, 598–618. [Google Scholar] [CrossRef] [Green Version]
  20. Tan, C.L.; Wong, N.H.; Jusuf, S.K. Effects of vertical greenery on mean radiant temperature in the tropical urban environment. Landsc. Urban Plan. 2014, 127, 52–64. [Google Scholar] [CrossRef]
  21. Li, J.; Zheng, B.; Shen, W.; Xiang, Y.; Chen, X.; Qi, Z. Cooling and Energy-Saving Performance of Different Green Wall Design: A Simulation Study of a Block. Energies 2019, 12, 2912. [Google Scholar] [CrossRef]
  22. Kong, L.; Lau, K.K.-L.; Yuan, C.; Chen, Y.; Xu, Y.; Ren, C.; Ng, E. Regulation of outdoor thermal comfort by trees in Hong Kong. Sustain. Cities Soc. 2017, 31, 12–25. [Google Scholar] [CrossRef]
  23. Lin, Y.-H.; Tsai, K.-T. Screening of Tree Species for Improving Outdoor Human Thermal Comfort in a Taiwanese City. Sustainability 2017, 9, 340. [Google Scholar] [CrossRef]
  24. Wong, N.H.; Yu, C. Study of green areas and urban heat island in a tropical city. Habitat Int. 2005, 29, 547–558. [Google Scholar] [CrossRef]
  25. Sugawara, H.; Shimizu, S.; Takahashi, H.; Hagiwara, S.; Narita, K.; Mikami, T.; Hirano, T. Thermal Influence of a Large Green Space on a Hot Urban Environment. J. Environ. Qual. 2016, 45, 125–133. [Google Scholar] [CrossRef]
  26. Yang, C.; He, X.; Yu, L.; Yang, J.; Yan, F.; Bu, K.; Chang, L.; Zhang, S. The Cooling Effect of Urban Parks and Its Monthly Variations in a Snow Climate City. Remote Sens. 2017, 9, 1066. [Google Scholar] [CrossRef]
  27. Qiu, G.Y.; Zou, Z.; Li, X.; Li, H.; Guo, Q.; Yan, C.; Tan, S. Experimental studies on the effects of green space and evapotranspiration on urban heat island in a subtropical megacity in China. Habitat Int. 2017, 68, 30–42. [Google Scholar] [CrossRef]
  28. Lai, D.; Liu, W.; Gan, T.; Liu, K.; Chen, Q. A review of mitigating strategies to improve the thermal environment and thermal comfort in urban outdoor spaces. Sci. Total Environ. 2019. [Google Scholar] [CrossRef]
  29. Cao, X.; Onishi, A.; Chen, J.; Imura, H. Quantifying the cool island intensity of urban parks using ASTER and IKONOS data. Landsc. Urban Plan. 2010, 96, 224–231. [Google Scholar] [CrossRef]
  30. Vidrih, B.; Medved, S. Multiparametric model of urban park cooling island. Urban For. Urban Green. 2013, 12, 220–229. [Google Scholar] [CrossRef]
  31. Jamei, E.; Rajagopalan, P.; Seyedmahmoudian, M.; Jamei, Y. Review on the impact of urban geometry and pedestrian level greening on outdoor thermal comfort. Renew. Sustain. Energy Rev. 2016, 54, 1002–1017. [Google Scholar] [CrossRef]
  32. Xu, L.; You, H.; Li, D.; Yu, K. Urban green spaces, their spatial pattern, and ecosystem service value: The case of Beijing. Habitat Int. 2016, 56, 84–95. [Google Scholar] [CrossRef]
  33. Aram, F.; Higueras García, E.; Solgi, E.; Mansournia, S. Urban green space cooling effect in cities. Heliyon 2019, 5. [Google Scholar] [CrossRef] [PubMed]
  34. Feyisa, G.L.; Dons, K.; Meilby, H. Efficiency of parks in mitigating urban heat island effect: An example from Addis Ababa. Landsc. Urban Plan. 2014, 123, 87–95. [Google Scholar] [CrossRef]
  35. Lu, J.; Li, Q.; Zeng, L.; Chen, J.; Liu, G.; Li, Y.; Li, W.; Huang, K. A micro-climatic study on cooling effect of an urban park in a hot and humid climate. Sustain. Cities Soc. 2017, 32, 513–522. [Google Scholar] [CrossRef]
  36. Anjos, M.; Lopes, A. Urban Heat Island and Park Cool Island Intensities in the Coastal City of Aracaju, North-Eastern Brazil. Sustainability 2017, 9, 1379. [Google Scholar] [CrossRef]
  37. Yan, H.; Wu, F.; Dong, L. Influence of a large urban park on the local urban thermal environment. Sci. Total Environ. 2018, 622–623, 882–891. [Google Scholar] [CrossRef]
  38. Aflaki, A.; Mirnezhad, M.; Ghaffarianhoseini, A.; Ghaffarianhoseini, A.; Omrany, H.; Wang, Z.-H.; Akbari, H. Urban heat island mitigation strategies: A state-of-the-art review on Kuala Lumpur, Singapore and Hong Kong. Cities 2017, 62, 131–145. [Google Scholar] [CrossRef] [Green Version]
  39. Lin, P.; Gou, Z.; Lau, S.S.-Y.; Qin, H. The Impact of Urban Design Descriptors on Outdoor Thermal Environment: A Literature Review. Energies 2017, 10, 2151. [Google Scholar] [CrossRef]
  40. ASHRAE Standard 55. Thermal Environmental Conditions for Human Occupancy; ASHRAE: Atlanta, GA, USA, 2010. [Google Scholar]
  41. Coccolo, S.; Kämpf, J.; Scartezzini, J.-L.; Pearlmutter, D. Outdoor human comfort and thermal stress: A comprehensive review on models and standards. Urban Clim. 2016, 18, 33–57. [Google Scholar] [CrossRef]
  42. Fanger, P.O. Thermal Comfort: Analysis and Applications in Environmental Engineering; Danish Technical Press: Copenhagen, Denmark, 1970. [Google Scholar]
  43. Walls, W.; Parker, N.; Walliss, J. Designing with thermal comfort Indices in Outdoor Sites. Paper presented at the Living and Learning: Research for a Better Built Environment: 49th International Conference of the Architectural Science Association 2015; The Architectural Science Association and The University of Melbourne: Melbourne, Australia, 2015. [Google Scholar]
  44. Bruse, M. Analysing human outdoor thermal comfort and open space usage with the multi-agent system BOTworld. In Proceedings of the 7th International Conference on Urban Climate, Yokohama, Japan, 29 June–3 July 2009. [Google Scholar]
  45. Monteiro, L.A.; Alucci, M.P. Thermal Comfort Index for the Assessment of Outdoor spaces in Subtropical Climates. In Proceedings of the 7th International Conference on Urban Climate, Yokohama, Japan, 29 June–3 July 2009. [Google Scholar]
  46. Potchter, O.; Cohen, P.; Lin, T.P.; Matzarakis, A. Outdoor human thermal perception in various climates: A comprehensive review of approaches, methods and quantification. Sci. Total Environ. 2018, 631–632, 390–406. [Google Scholar] [CrossRef]
  47. Honjo, T. Thermal Comfort in Outdoor Environment. Glob. Environ. Res. 2009, 13, 43–47. [Google Scholar] [CrossRef]
  48. Roshan, G.; Saleh Almomenin, H.; da Silveira Hirashima, S.Q.; Attia, S. Estimate of outdoor thermal comfort zones for different climatic regions of Iran. Urban Clim. 2019, 27, 8–23. [Google Scholar] [CrossRef]
  49. Lin, T.-P.; Matzarakis, A.; Hwang, R.-L. Shading effect on long-term outdoor thermal comfort. Build. Environ. 2010, 45, 213–221. [Google Scholar] [CrossRef]
  50. Santos Nouri, A.; Charalampopoulos, I.; Matzarakis, A. Beyond Singular Climatic Variables—Identifying the Dynamics of Wholesome Thermo-Physiological Factors for Existing/Future Human Thermal Comfort during Hot Dry Mediterranean Summers. Int. J. Environ. Res. Public Health 2018, 15, 2362. [Google Scholar] [CrossRef] [PubMed]
  51. Chen, L.; Ng, E. Outdoor thermal comfort and outdoor activities: A review of research in the past decade. Cities 2012, 29, 118–125. [Google Scholar] [CrossRef]
  52. Tseliou, A.; Tsiros, I.X.; Lykoudis, S.; Nikolopoulou, M. An evaluation of three biometeorological indices for human thermal comfort in urban outdoor areas under real climatic conditions. Build. Environ. 2010, 45, 1346–1352. [Google Scholar] [CrossRef]
  53. Thorsson, S.; Lindberg, F.; Eliasson, I.; Holmer, B. Different methods for estimating the mean radiant temperature in an outdoor urban setting. Int. J. Climatol. 2007, 27, 1983–1993. [Google Scholar] [CrossRef]
  54. Sun, S.; Xu, X.; Lao, Z.; Liu, W.; Li, Z.; Higueras García, E.; He, L.; Zhu, J. Evaluating the impact of urban green space and landscape design parameters on thermal comfort in hot summer by numerical simulation. Build. Environ. 2017, 123, 277–288. [Google Scholar] [CrossRef]
  55. Chen, L.; Wen, Y.; Zhang, L.; Xiang, W.-N. Studies of thermal comfort and space use in an urban park square in cool and cold seasons in Shanghai. Build. Environ. 2015, 94, 644–653. [Google Scholar] [CrossRef]
  56. Mahmoud, A.H.A. Analysis of the microclimatic and human comfort conditions in an urban park in hot and arid regions. Build. Environ. 2011, 46, 2641–2656. [Google Scholar] [CrossRef]
  57. Bartesaghi Koc, C.; Osmond, P.; Peters, A. Evaluating the cooling effects of green infrastructure: A systematic review of methods, indicators and data sources. Sol. Energy 2018, 166, 486–508. [Google Scholar] [CrossRef]
  58. Taleghani, M. Outdoor thermal comfort by different heat mitigation strategies—A review. Renew. Sustain. Energy Rev. 2018, 81, 2011–2018. [Google Scholar] [CrossRef]
  59. Lenzholzer, S.; Klemm, W.; Vasilikou, C. Qualitative methods to explore thermo-spatial perception in outdoor urban spaces. Urban Clim. 2018, 23, 231–249. [Google Scholar] [CrossRef] [Green Version]
  60. Nikolopoulou, M.; Baker, N.; Steemers, K. Thermal comfort in outdoor urban spaces: Understanding the human parameter. Sol. Energy 2001, 70, 227–235. [Google Scholar] [CrossRef]
  61. Klemm, W.; Heusinkveld, B.G.; Lenzholzer, S.; Jacobs, M.H.; Van Hove, B. Psychological and physical impact of urban green spaces on outdoor thermal comfort during summertime in The Netherlands. Build. Environ. 2015, 83, 120–128. [Google Scholar] [CrossRef]
  62. Knez, I.; Thorsson, S. Influences of culture and environmental attitude on thermal, emotional and perceptual evaluations of a public square. Int. J. Biometeorol. 2006, 50, 258–268. [Google Scholar] [CrossRef]
  63. Nagashima, K.; Tokizawa, K.; Marui, S. Thermal comfort. Handb. Clin. Neurol. 2018, 156, 249–260. [Google Scholar] [CrossRef]
  64. Thorsson, S.; Lindqvist, M.; Lindqvist, S. Thermal bioclimatic conditions and patterns of behaviour in an urban park in Goteborg, Sweden. Int. J. Biometeorol. 2004, 48, 149–156. [Google Scholar] [CrossRef]
  65. Pezzoli, A.; Cristofori, E.; Gozzini, B.; Marchisio, M.; Padoan, J. Analysis of the thermal comfort in cycling athletes. Procedia Eng. 2012, 34, 433–438. [Google Scholar] [CrossRef] [Green Version]
  66. Nasir, R.A.; Ahmad, S.S.; Ahmed, A.Z. Psychological Adaptation of Outdoor Thermal Comfort in Shaded Green Spaces in Malaysia. Procedia Soc. Behav. Sci. 2012, 68, 865–878. [Google Scholar] [CrossRef] [Green Version]
  67. Lin, T.-P. Thermal perception, adaptation and attendance in a public square in hot and humid regions. Build. Environ. 2009, 44, 2017–2026. [Google Scholar] [CrossRef]
  68. Nikolopoulou, M.; Lykoudis, S. Thermal comfort in outdoor urban spaces: Analysis across different European countries. Build. Environ. 2006, 41, 1455–1470. [Google Scholar] [CrossRef] [Green Version]
  69. Ng, E.; Cheng, V. Urban human thermal comfort in hot and humid Hong Kong. Energy Build. 2012, 55, 51–65. [Google Scholar] [CrossRef]
  70. Li, K.; Zhang, Y.; Zhao, L. Outdoor thermal comfort and activities in the urban residential community in a humid subtropical area of China. Energy Build. 2016, 133, 498–511. [Google Scholar] [CrossRef]
  71. Yang, B.; Olofsson, T.; Nair, G.; Kabanshi, A. Outdoor thermal comfort under subarctic climate of north Sweden – A pilot study in Umeå. Sustain. Cities Soc. 2017, 28, 387–397. [Google Scholar] [CrossRef]
  72. Klemm, W.; Heusinkveld, B.G.; Lenzholzer, S.; van Hove, B. Street greenery and its physical and psychological impact on thermal comfort. Landsc. Urban Plan. 2015, 138, 87–98. [Google Scholar] [CrossRef]
  73. Lenzholzer, S. Microclimate perception analysis through cognitive mapping. In Proceedings of the PLEA 2008—25th Conference on Passive and Low Energy Architecture, Dublin, Ireland, 22–24 October 2008. [Google Scholar]
  74. Xu, X.; Sun, S.; Liu, W.; García, E.H.; He, L.; Cai, Q.; Xu, S.; Wang, J.; Zhu, J. The cooling and energy saving effect of landscape design parameters of urban park in summer: A case of Beijing, China. Energy Build. 2017, 149, 91–100. [Google Scholar] [CrossRef]
  75. Kottek, M.; Grieser, J.; Beck, C.; Rudolf, B.; Rubel, F. World Map of the Köppen-Geiger climate classification updated. Meteorol. Z. 2006, 15, 259–263. [Google Scholar] [CrossRef]
  76. AEMET. Agencia Estatal de Meteorología. 2018. Available online: http://www.aemet.es/es/portada (accessed on 11 October 2018).
  77. Núñez Peiró, M.; Sánchez-Guevara Sánchez, C.; Neila González, F.J. Update of the Urban Heat Island of Madrid and Its Influence on the Building’s Energy Simulation. In Sustainable Development and Renovation in Architecture, Urbanism and Engineering; Springer International Publishing: Cham, Switzerland, 2017; pp. 339–350. [Google Scholar]
  78. Román, E.; Gómez, G.; de Luxán, M. Urban Heat Island of Madrid and Its Influence over Urban Thermal Comfort. In Sustainable Development and Renovation in Architecture, Urbanism and Engineering; Springer International Publishing: Cham, Switzerland, 2017; pp. 415–425. [Google Scholar] [Green Version]
  79. ABIO. Arquitectura Bioclimática en un Entorno Sostenible (Research Group Was Officially Recognized by the Universidad Politécnica de Madrid). 2018. Available online: http://abio-upm.org/ (accessed on 17 May 2018).
  80. Morakinyo, T.E.; Kong, L.; Lau, K.K.-L.; Yuan, C.; Ng, E. A study on the impact of shadow-cast and tree species on in-canyon and neighborhood’s thermal comfort. Build. Environ. 2017, 115, 1–17. [Google Scholar] [CrossRef]
  81. Fröhlich, D.; Gangwisch, M.; Matzarakis, A. Effect of radiation and wind on thermal comfort in urban environments—Application of the RayMan and SkyHelios model. Urban Clim. 2019, 27, 1–7. [Google Scholar] [CrossRef]
  82. Matzarakis, A.; Rutz, F.; Mayer, H. Modelling radiation fluxes in simple and complex environments—Application of the RayMan model. Int. J. Biometeorol. 2007, 51, 323–334. [Google Scholar] [CrossRef]
  83. Auliciems, A.; Szokolay, S.V. Thermal Comfort, 2nd ed.; Szokolay, S.V., Ed.; PLEA in Association with Dept. of Architecture, University of Queensland: Brisbane, QLD, Australia, 2007. [Google Scholar]
  84. ASHRAE Standard 55. Thermal Environmental Conditions for Human Occupancy; ASHRAE: Atlanta, GA, USA, 2013. [Google Scholar]
  85. Matzarakis, A.; Rutz, F.; Mayer, H. Modelling radiation fluxes in simple and complex environments: Basics of the RayMan model. Int. J. Biometeorol. 2010, 54, 131–139. [Google Scholar] [CrossRef] [PubMed]
  86. Maria Raquel, C.d.S.; Montalto, F.A.; Palmer, M.I. Potential climate change impacts on green infrastructure vegetation. Urban For. Urban Green. 2016, 20, 128–139. [Google Scholar] [CrossRef]
  87. Yen, Y.; Wang, Z.; Shi, Y.; Xu, F.; Soeung, B.; Sohail, M.T.; Rubakula, G.; Juma, S.A. The predictors of the behavioral intention to the use of urban green spaces: The perspectives of young residents in Phnom Penh, Cambodia. Habitat Int. 2017, 64, 98–108. [Google Scholar] [CrossRef]
  88. Aram, F.; Solgi, E.; Higueras García, E.; Mohammadzadeh, S.; Mosavi, A.; Shamshirband, S. Design and Validation of a Computational Program for Analysing Mental Maps: Aram Mental Map Analyzer. Sustainability 2019, 11, 3790. [Google Scholar] [CrossRef]
  89. Barnett, V.; Neter, J.; Wasserman, W. Applied Linear Statistical Models. J. R. Stat. Soc. Ser. A (Gen.) 2006, 138, 258. [Google Scholar] [CrossRef]
  90. Lawrence, I.; Lin, K. A concordance correlation coefficient to evaluate reproducibility. Biometrics 1989, 255–268. [Google Scholar]
  91. Akoglu, H. User’s guide to correlation coefficients. Turkish Journal of Emergency Medicine. Emerg. Med. Assoc. Turk. 2018. [Google Scholar] [CrossRef]
  92. Pereira, P.F.; Ramos, N.M.M. Occupant behaviour motivations in the residential context – An investigation of variation patterns and seasonality effect. Build. Environ. 2019, 148, 535–546. [Google Scholar] [CrossRef]
  93. Santos Nouri, A.; Fröhlich, D.; Matos Silva, M.; Matzarakis, A. The Impact of Tipuana tipu Species on Local Human Thermal Comfort Thresholds in Different Urban Canyon Cases in Mediterranean Climates: Lisbon, Portugal. Atmosphere 2018, 9, 12. [Google Scholar] [CrossRef]
  94. Laureti, F.; Martinelli, L.; Battisti, A. Assessment and Mitigation Strategies to Counteract Overheating in Urban Historical Areas in Rome. Climate 2018, 6, 18. [Google Scholar] [CrossRef]
  95. Skoulika, F.; Santamouris, M.; Kolokotsa, D.; Boemi, N. On the thermal characteristics and the mitigation potential of a medium size urban park in Athens, Greece. Landsc. Urban Plan. 2014, 123, 73–86. [Google Scholar] [CrossRef]
  96. Oliveira, S.; Andrade, H.; Vaz, T. The cooling effect of green spaces as a contribution to the mitigation of urban heat: A case study in Lisbon. Build. Environ. 2011, 46, 2186–2194. [Google Scholar] [CrossRef]
  97. Cohen, P.; Potchter, O.; Matzarakis, A. Daily and seasonal climatic conditions of green urban open spaces in the Mediterranean climate and their impact on human comfort. Build. Environ. 2012, 51, 285–295. [Google Scholar] [CrossRef]
Figure 1. Madrid’s urban heat island (UHI) map on 26 July 2015 [77,79] and the selected northern region of the Retiro Park. Intersection A is in the yellow zone, intersection B is in the orange zone and intersection C is in the red zone, close to one of the UHIs of Madrid.
Energies 12 03904 g001
Figure 2. The northern region map of Retiro Park and the location of the selected sites. Point A is located 150 meters away from the park; point B is located 380 meters away from the park and point C is located 665 m away from the park.
Energies 12 03904 g002
Figure 3. Street view of the three intersections (AC) as well as fisheye shots.
Energies 12 03904 g003
Figure 4. The average frequency of questionnaire data (Questions 1–4) at three intersections. Intersection A is gray, intersection B is orange and intersection C is blue.
Energies 12 03904 g004
Figure 5. Cognitive map analyses using the AramMMA software [88] during six hot summer days of 2018.
Energies 12 03904 g005
Figure 6. The diagram shows the temperature range of the three intersections A, B and C measured and the temperature range of Rétiro Park during the six days of hot summer 2018 in Madrid.
Energies 12 03904 g006
Figure 7. The average data for questionnaire data titled PTC at each three intersections A, B and C during six days.
Energies 12 03904 g007
Figure 8. The relationship among mean PET (gray), mean Ta (blue) and Tmrt (orange), at each three intersections A, B and C during six days.
Energies 12 03904 g008
Table 1. The geometric configuration of the intersections and street trees properties in three investigated intersections.
PartStreet CanyonsStreet Trees
Width N_S (M)Width W_E (M)H/W Ratio N_S (–)H/W Ratio W_E (–)SVF aNumber of treesMean Tree Height (m)Mean Crown Diameter (m)Crown Shape b
A15121.231.540.172612.745Cone
B15151.281.330.23012.346Cone
C15151.21.230.22512.665Cone
a. Calculated by Ray Man 1.2. b. Crown Shape Classification by Park et al. [15].
Table 2. Intersection mean values for air temperature (Ta), relative humidity (RH) and wind speed (WS) on all measurement days (10:40–12:10 CEST).
DatePartTimeMean Ta, °CMean RH %Mean WS, m/s
22 JuneC10:40–10:5029.2629.11.43
B11:00–11:1028.8729.271.15
A11:30–11:4027.8132.040.80
10 JulyC11:15–11:2529.833.961.43
B11:42–11:5229.722.11.16
A12:00–12:1029.429.711.36
24 JulyC10:40–10:5029.4521.711.36
B11:10–11:2028.130.251.43
A11:30–11:4027.7430.561.43
10 AugustC10:40–10:5025.1218.161.43
B11:00–11:1023.7741.051.72
A11:20–11:3023.2243.452.47
24 AugustC10:50–11:0026.6338.812.35
B11:15–11:2526.238.131.13
A11:35–11:4526.05371.29
10 SeptemberC10:45–10:5523.4156.711.5
B11:15–11:2523.1352.451.36
A11:35–11:4521.7351.151.91
Table 3. The proportional percentages questionnaire data in the three investigated intersections on all the measured days.
VariableCategoriesPercentage (%)
ABC
Age13–212.02.211.8
22–3026.520.013.7
31–4540.826.731.4
46–6016.324.429.4
61–8514.326.713.7
GenderMen67.373.351
Women32.726.749
Q1Very low (1)000
Low (2)10.26.79.8
Medium (3) 28.657.843.1
High (4)42.931.135.3
Very high (5)18.44.411.8
Q2Very low (5)5.94.40
Low (4)23.531.118.4
Medium (3) 33.326.722.4
High (2)27.528.938.8
Very high (1)9.88.920.4
Q3Very low (1)4.12.213.7
Low (2)8.220.025.5
Medium (3)28.631.127.5
High (4)42.931.125.5
Very high (5)16.315.67.8
Q4Very low (1)2.003.9
Low (2)10.215.625.5
Medium (3) 30.660.035.3
High (4)42.913.323.5
Very high (5)2.003.9
Table 4. Clothing and activity level of responders in the three investigated intersections.
VariablePercentage (%)
Hot Summer Days
22 June10 July24 July10 August24 August10 September
A1A2A3A1A2A3A1A2A3A1A2A3A1A2A3A1A2A3
_Clothing
Shirt and Normal Pants - 65 clo404033.344.433.3253033.3100200016.628.522.25030
Tshirt and normal pants - 61 clo202033.322.222.237.53044.45030405033.316.657.133.333.350
shirt and Shorts - 45 clo00011.10010001010016.616.6011.1010
Tshirt and Shorts (or skirt) - 40 clo402016.611.133.302022.2205010405033.314.3016.710
Dress - 35 clo00011.111.112.51001010100000000
Suiet - 90 clo0016.60012.5001001010016.6011.100
Others02000012.5000100000022.200
_Activity
Wlking - 115 W/m2601066.655.577.8504044.4603050805066.657.155.583.340
Standing - 70 W/m220016.644.422.212.55044.42040301016.633.314.311.116.720
Sitting - 60 W/m220016.60037.51002030201033.3028.533.3040
Jogging - 220 W/m2000000011.1000000 000
Table 5. Values of the Tmrt (°C) and average values for physiological equivalent temperature (PET; °C) in part A, B and C.
DatePartMean PET, °CTmrt, °C
22 JuneC35.348.4
B35.848.7
A33.748
10 JulyC36.349.4
B36.549.3
A35.849.3
24 JulyC35.749
B33.947.7
A33.547.6
10 AugustC28.943.8
B26.843.1
A24.342.7
24 AugustC29.144.4
B28.644.5
A26.944.3
10 SeptemberC26.140.6
B26.241
A23.139.8
Table 6. Mean values for air temperature (Ta), in the three intersection (10:40–12:10 CET) and values for air temperature (Ta), relative humidity (RH) and wind velocity (W) in the Retiro Park on all the measurement days.
DateTa a (°C)Retiro Park b Ta (°C)Time of Ta in Retiro Park bHR % Park bWind in Park b
Part APart BPart CMinMidMaxMinMax
22 June 201827.8128.8729.2621.627.733.804:5014:4022.951.7
10 July 201829.429.729.821.528.435.206:0013:5022.952.2
24 July 201827.7428.129.4519.826.433.005:0013:5022.941.9
10 August 201823.2223.7725.1217.524.431.305:4013:4036.82.2
24 August 201826.0526.226.6320.626.833.005:3014:2019.251.4
10 September 201821.7323.1323.4117.322.828.305:2013:4533.551.9
a. Field measurement, b. AEMET data.
Table 7. ANOVA PET analyses in the three investigated selected points.
Sum of SquaresdfMean SquareFp-Value
Between Groups151.731275.8653.6450.029
Within Groups2955.70814220.815
Total3107.439144
Table 8. Tukey PET analyses in the three investigated intersections (A, B and C).
(I) Part(J) PartMean Difference (I–J)Std. Errorp-Value95% Confidence IntervalPartNSubset for alpha = 0.05
Lower BoundUpper Bound12
AB–1.996240.941990.090−4.22740.2349A4929.3327
C–2.28303 *0.912650.036−4.4447−0.1214B4531.328931.3289
BA1.996240.941990.090−0.23494.2274C51 31.6157
C–0.286800.933110.949−2.49691.9233Sig. 0.0840.949
CA2.28303*0.912650.0360.12144.4447
B0.286800.933110.949−1.92332.4969
*. The mean difference is significant at the 0.05 level.
Table 9. ANOVA perceived thermal comfort (PTC) analyses in the three investigated selected points.
Sum of SquaresdfMean SquareFp-Value
Between Groups2.31821.1593.5170.032
Within Groups46.8091420.330
Total49.128144
Table 10. Tukey PTC analyses in the three investigated intersections (A, B and C).
(I) Part(J) PartMean Difference (I–J)Std. Errorp-Value95% Confidence IntervalPartNSubset for alpha = 0.05
Lower BoundUpper Bound12
AB0.354170.142700.062−0.01650.7248C512.8417
C0.45000 *0.142700.0170.07930.8207B452.93752.9375
BA−0.354170.142700.062−0.72480.0165A49 3.2917
C0.095830.142700.783−0.27480.4665Sig. 0.7830.062
CA−0.45000*0.142700.017−0.8207−0.0793
B−0.095830.142700.783−0.46650.2748
*. The mean difference is significant at the 0.05 level.
Table 11. ANOVA cognitive maps analyses in the three investigated selected points.
Sum of SquaresdfMean SquareFp-Value
Between Groups36,309.751218,154.8768.9480.000
Within Groups288,104.0421422028.902
Total324,413.793144
Table 12. Tukey cognitive maps analyses in the three investigated intersections (A, B and C).
(I) Part(J) PartMean Difference (I–J)Std. Errorp-Value95% Confidence IntervalPartNSubset for alpha = 0.05
Lower BoundUpper Bound12
AB27.75510 *9.300150.0095.727349.7829C5150.9804
C36.77471 *9.010470.00015.433058.1164B4560.0000
BA−27.75510 *9.300150.009−49.7829−5.7273A49 87.7551
C9.019619.212440.591−12.800530.8397Sig. 0.5891.000
CA−36.77471 *9.010470.000−58.1164−15.4330
B−9.019619.212440.591−30.839712.8005
*. The mean difference is significant at the 0.05 level.
Table 13. Pearson correlation analyses between PET and PTC.
PartPET
APTCPearson Correlation−0.404 *
p-value (2-tailed)0.004
N49
BPTCPearson Correlation−0.281
p-value (2-tailed)0.061
N45
CPTCPearson Correlation−0.379 *
p-value (2-tailed)0.006
N51
*. The mean difference is significant at the 0.05 level.

