Interior Insulation of Masonry Walls—Selected Problems in the Design


Abstract
:1. Introduction
- Disturbances in the distribution of the temperature field on the partition, often referred to as thermal anomalies or thermal bridges. They are not only an area of an increased heat loss, but also a zone of an increased risk of mold growth. For selected nodes in the building, the values of the linear thermal transmittance coefficient were analyzed and the risk of mold development was estimated using the value of the fRsi factor.
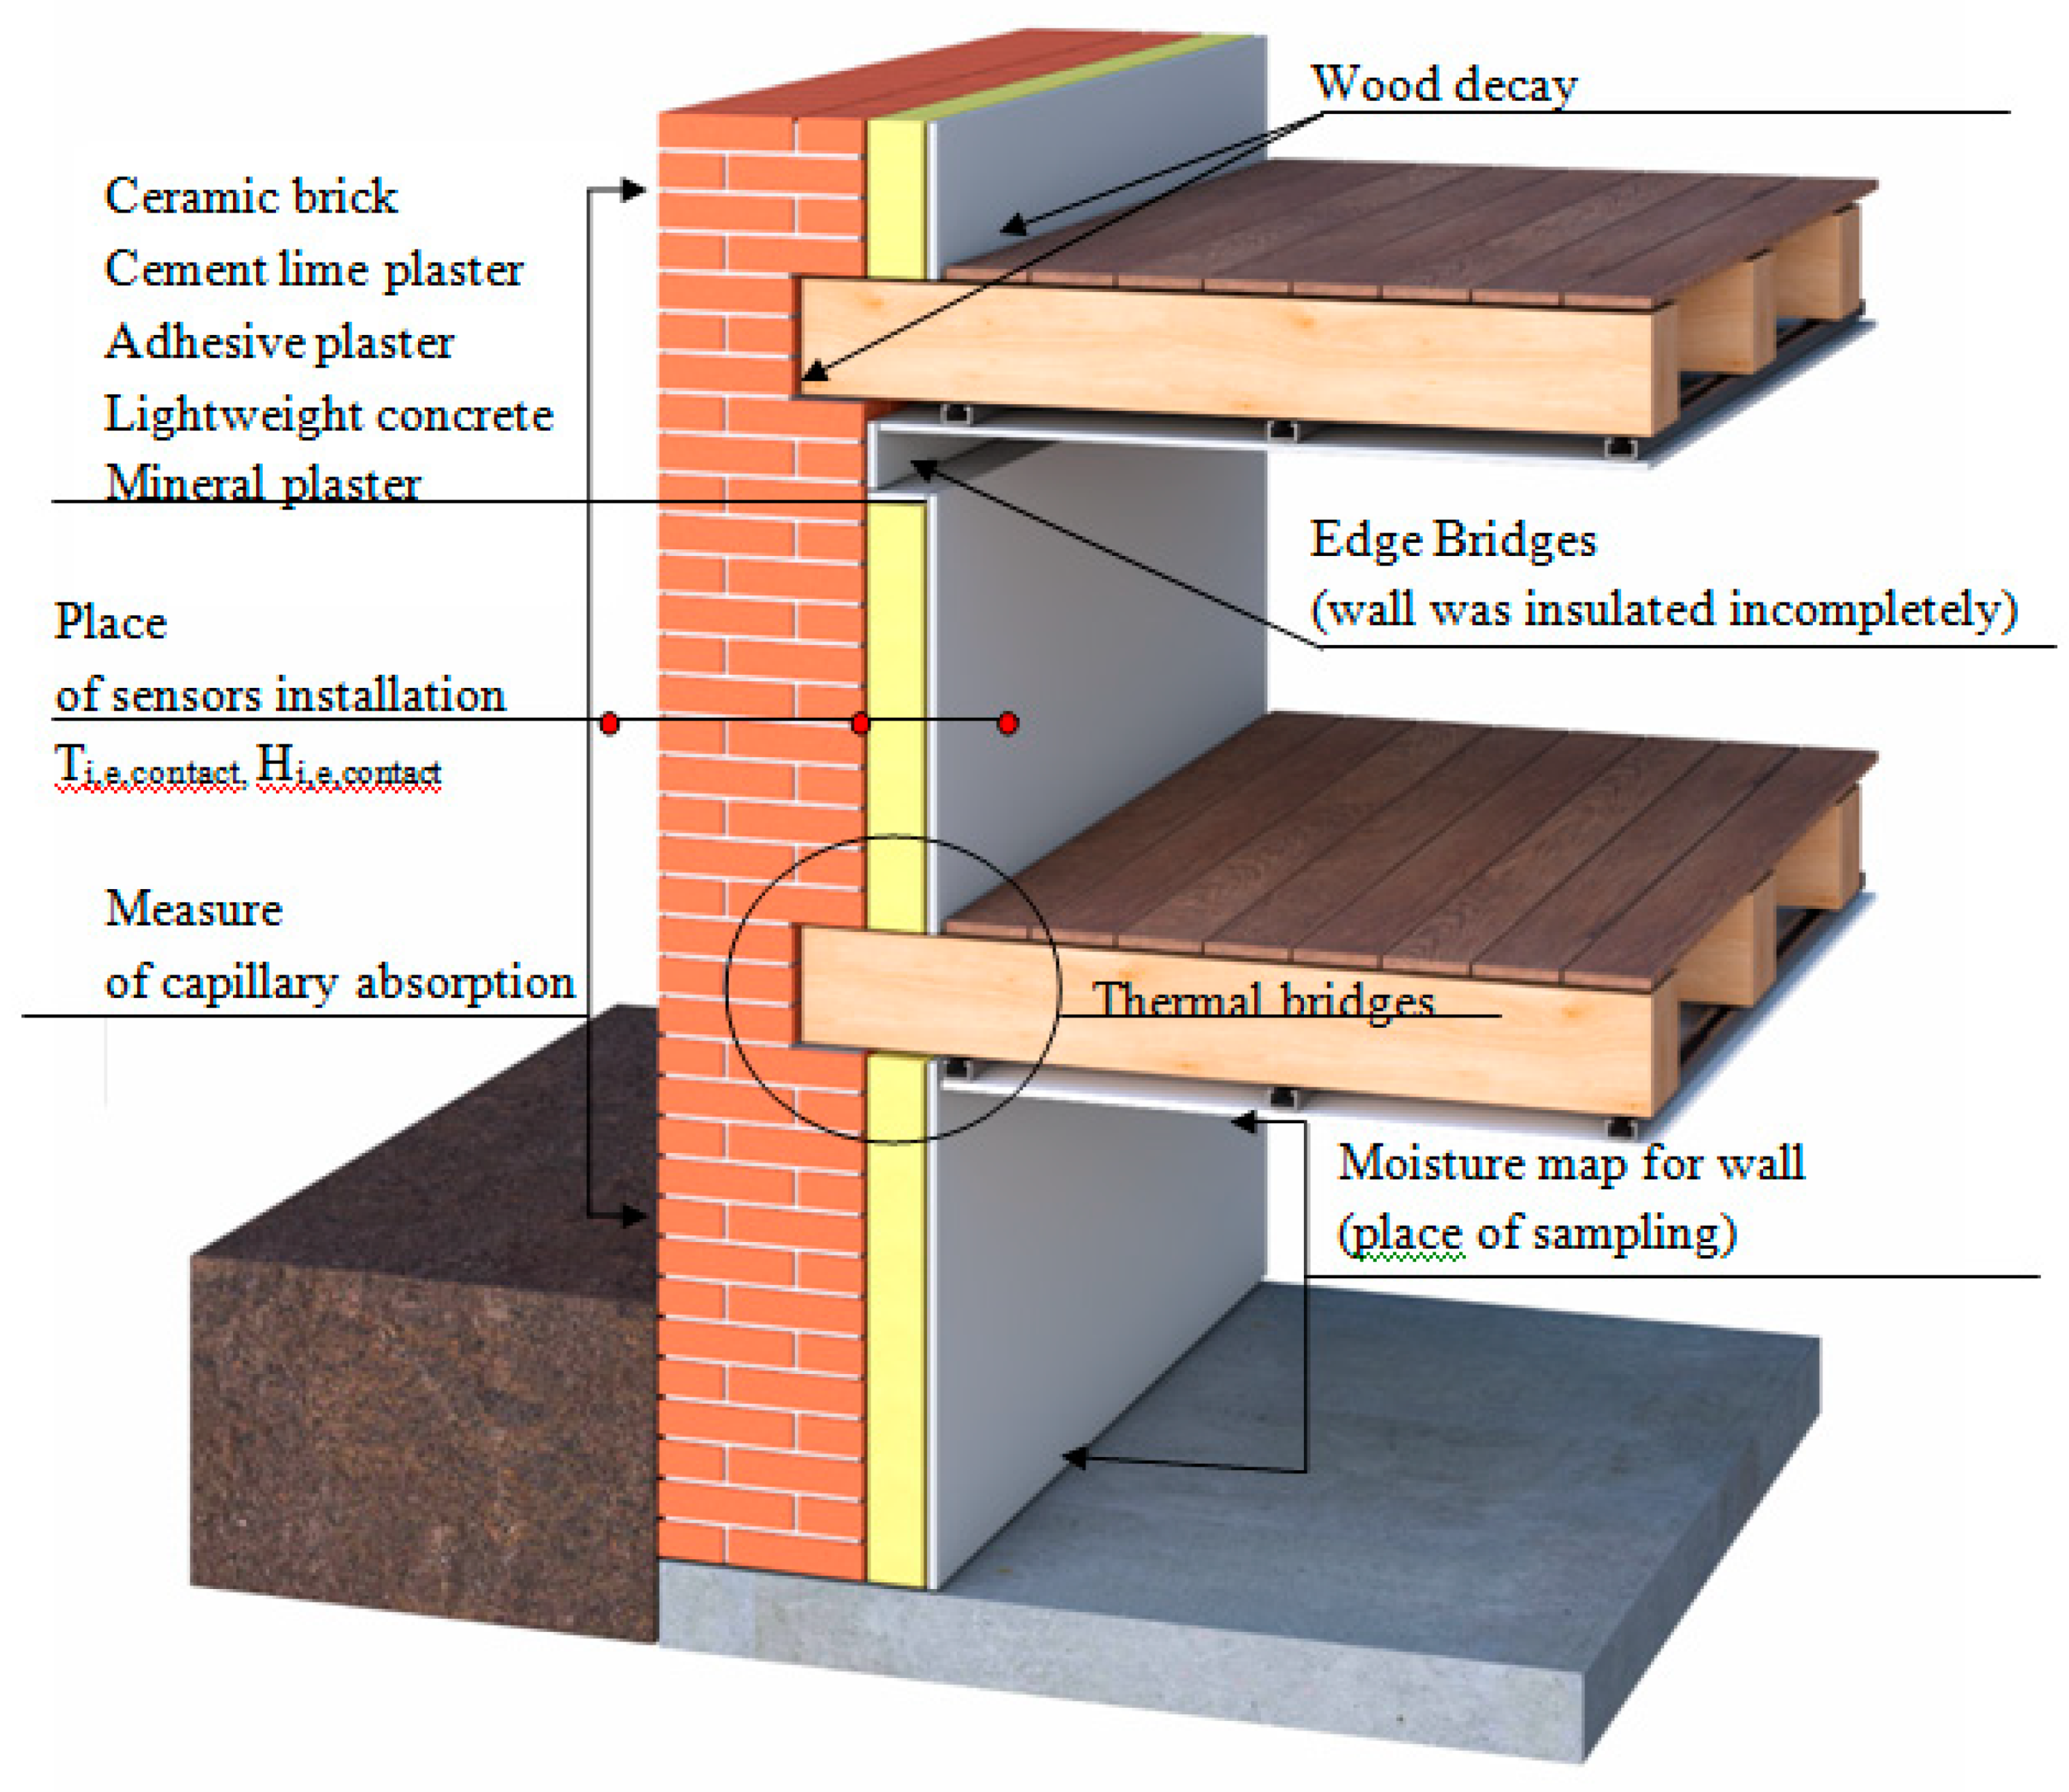
- Defects related to a fragmentary thermal insulation of partitions. On the basis of a thermovision photo of the wall insulated from the inside and the numerical model made for it, the distribution of the temperature field on the partition was depicted. The author payed attention to the so called edge bridges (the name proposed by the author), which cause significant disturbances in the temperature distribution, and are caused by a partial insulation that is the result of, for example, the lack of access or existing buildings and installations.
- The lack of a detailed analysis of wall systems in terms of their construction and technical condition; knowledge of the wall system construction is necessary in the correct analysis and numerical modelling of hygrothermal phenomena. Due to the historical character of most buildings as well as the material and structural solutions used in the partitions, it is necessary to make a diagnosis based on open pitches and basic examination (described in the text).
- Wood decay; the author pays special attention to wood decay, e.g., wooden beams in ceilings. Wood degradation can be caused by fungi, bacteria and insects. Wood may be attacked by bacteria when very low oxygen levels occur. But it may take even over 100 years for wood to decompose in anaerobic conditions. Fungus is the most common cause of wood decay because it can break down cellulose and lignin, while bacteria can not destroy lignin. The decay of wood occurs at a mass moisture content above 20% and at a temperature of 0 °C to 45 °C. Mycelium growth does not necessarily have to be in the same place as a moist area, for example Serpula lacrymans can grow out of moisture in the basement, but destroy wood on the second floor.
- The selection of inappropriate calculation methods; in engineering applications, the Glaser method (norm EN ISO 13788:2013) is most commonly used. However, it does not capture a number of phenomena. For this reason, author use the WUFI 2D program for modelling. It works on the basis of a system of non-linear partial differential equations describing non-stationary coupled transport of heat and moisture in building materials. In addition, modelling results have been compared with in-situ measurement results to indicate possible differences and their causes.
2. Materials and Methods
2.1. Methodology of Insulation Design from the Inside
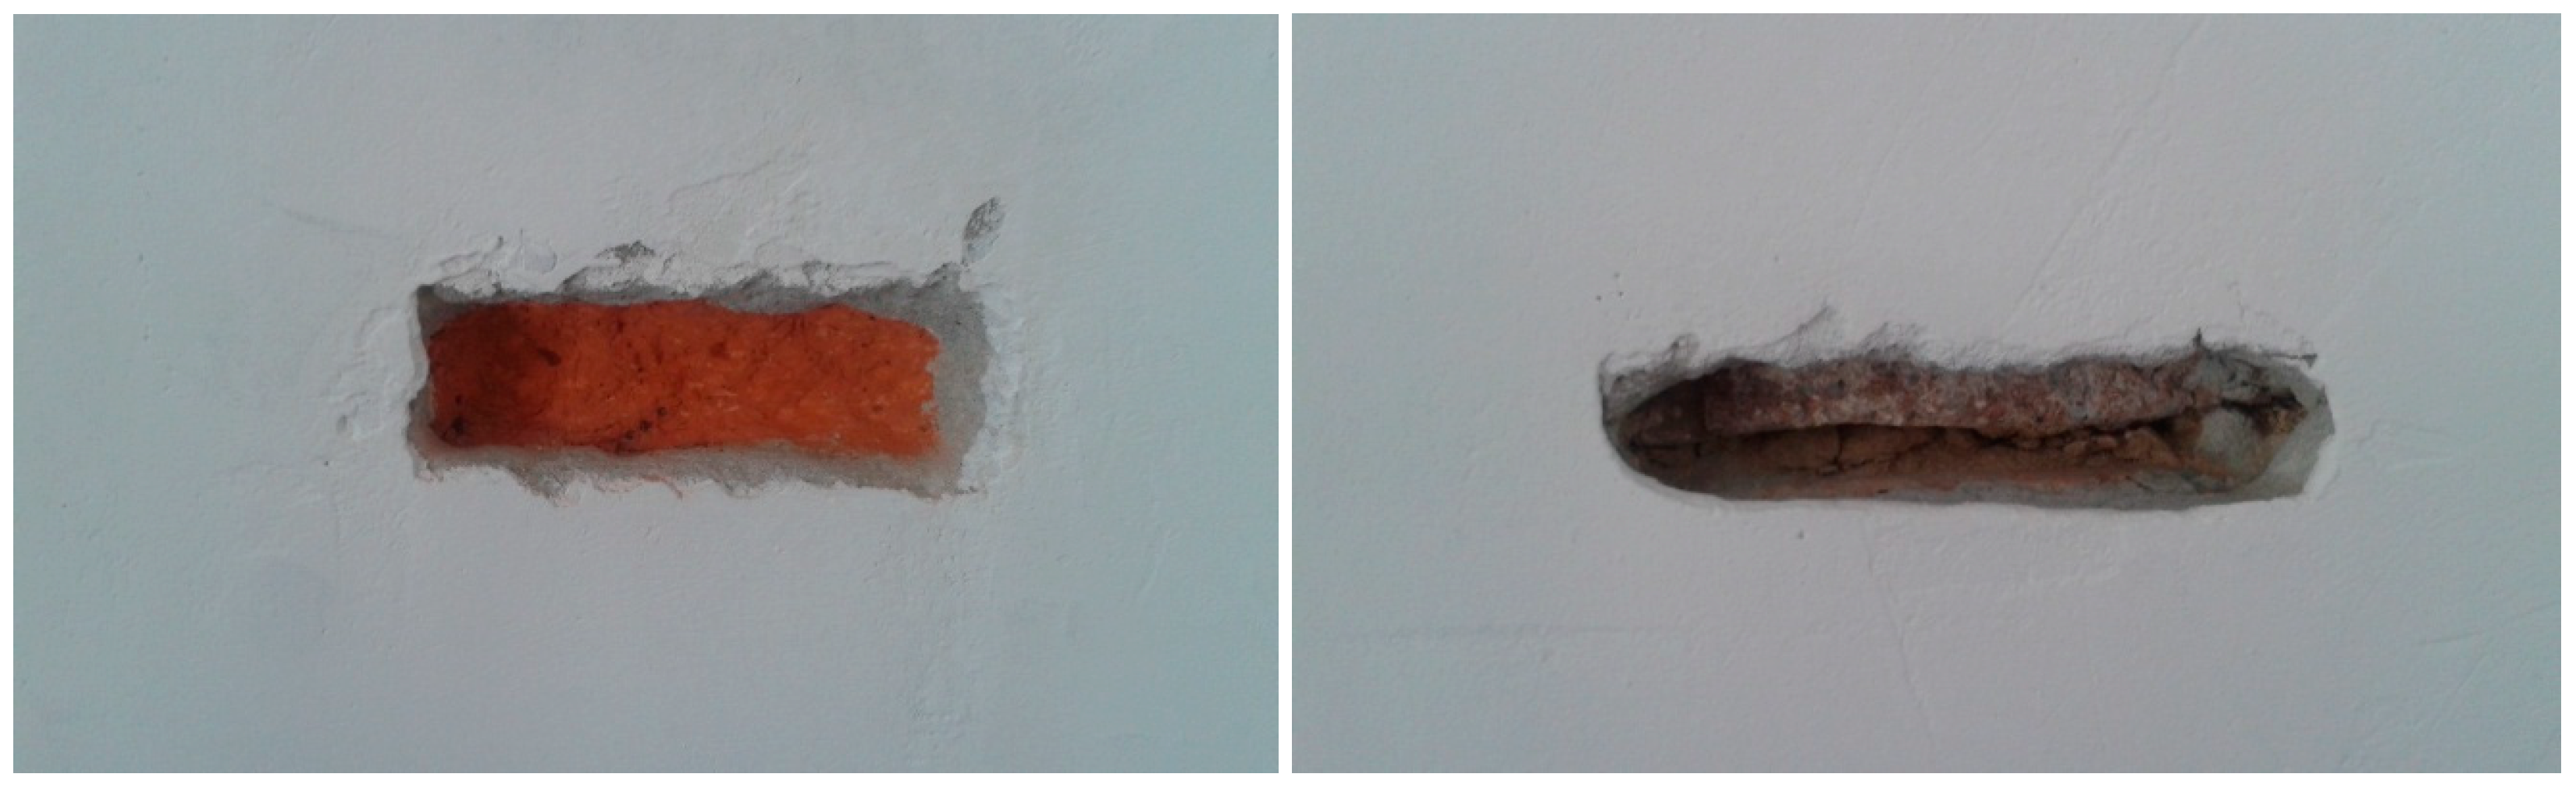
- Identifying the material structure of the envelope, including opencast works, measuring the thickness of existing layers (Figure 2).
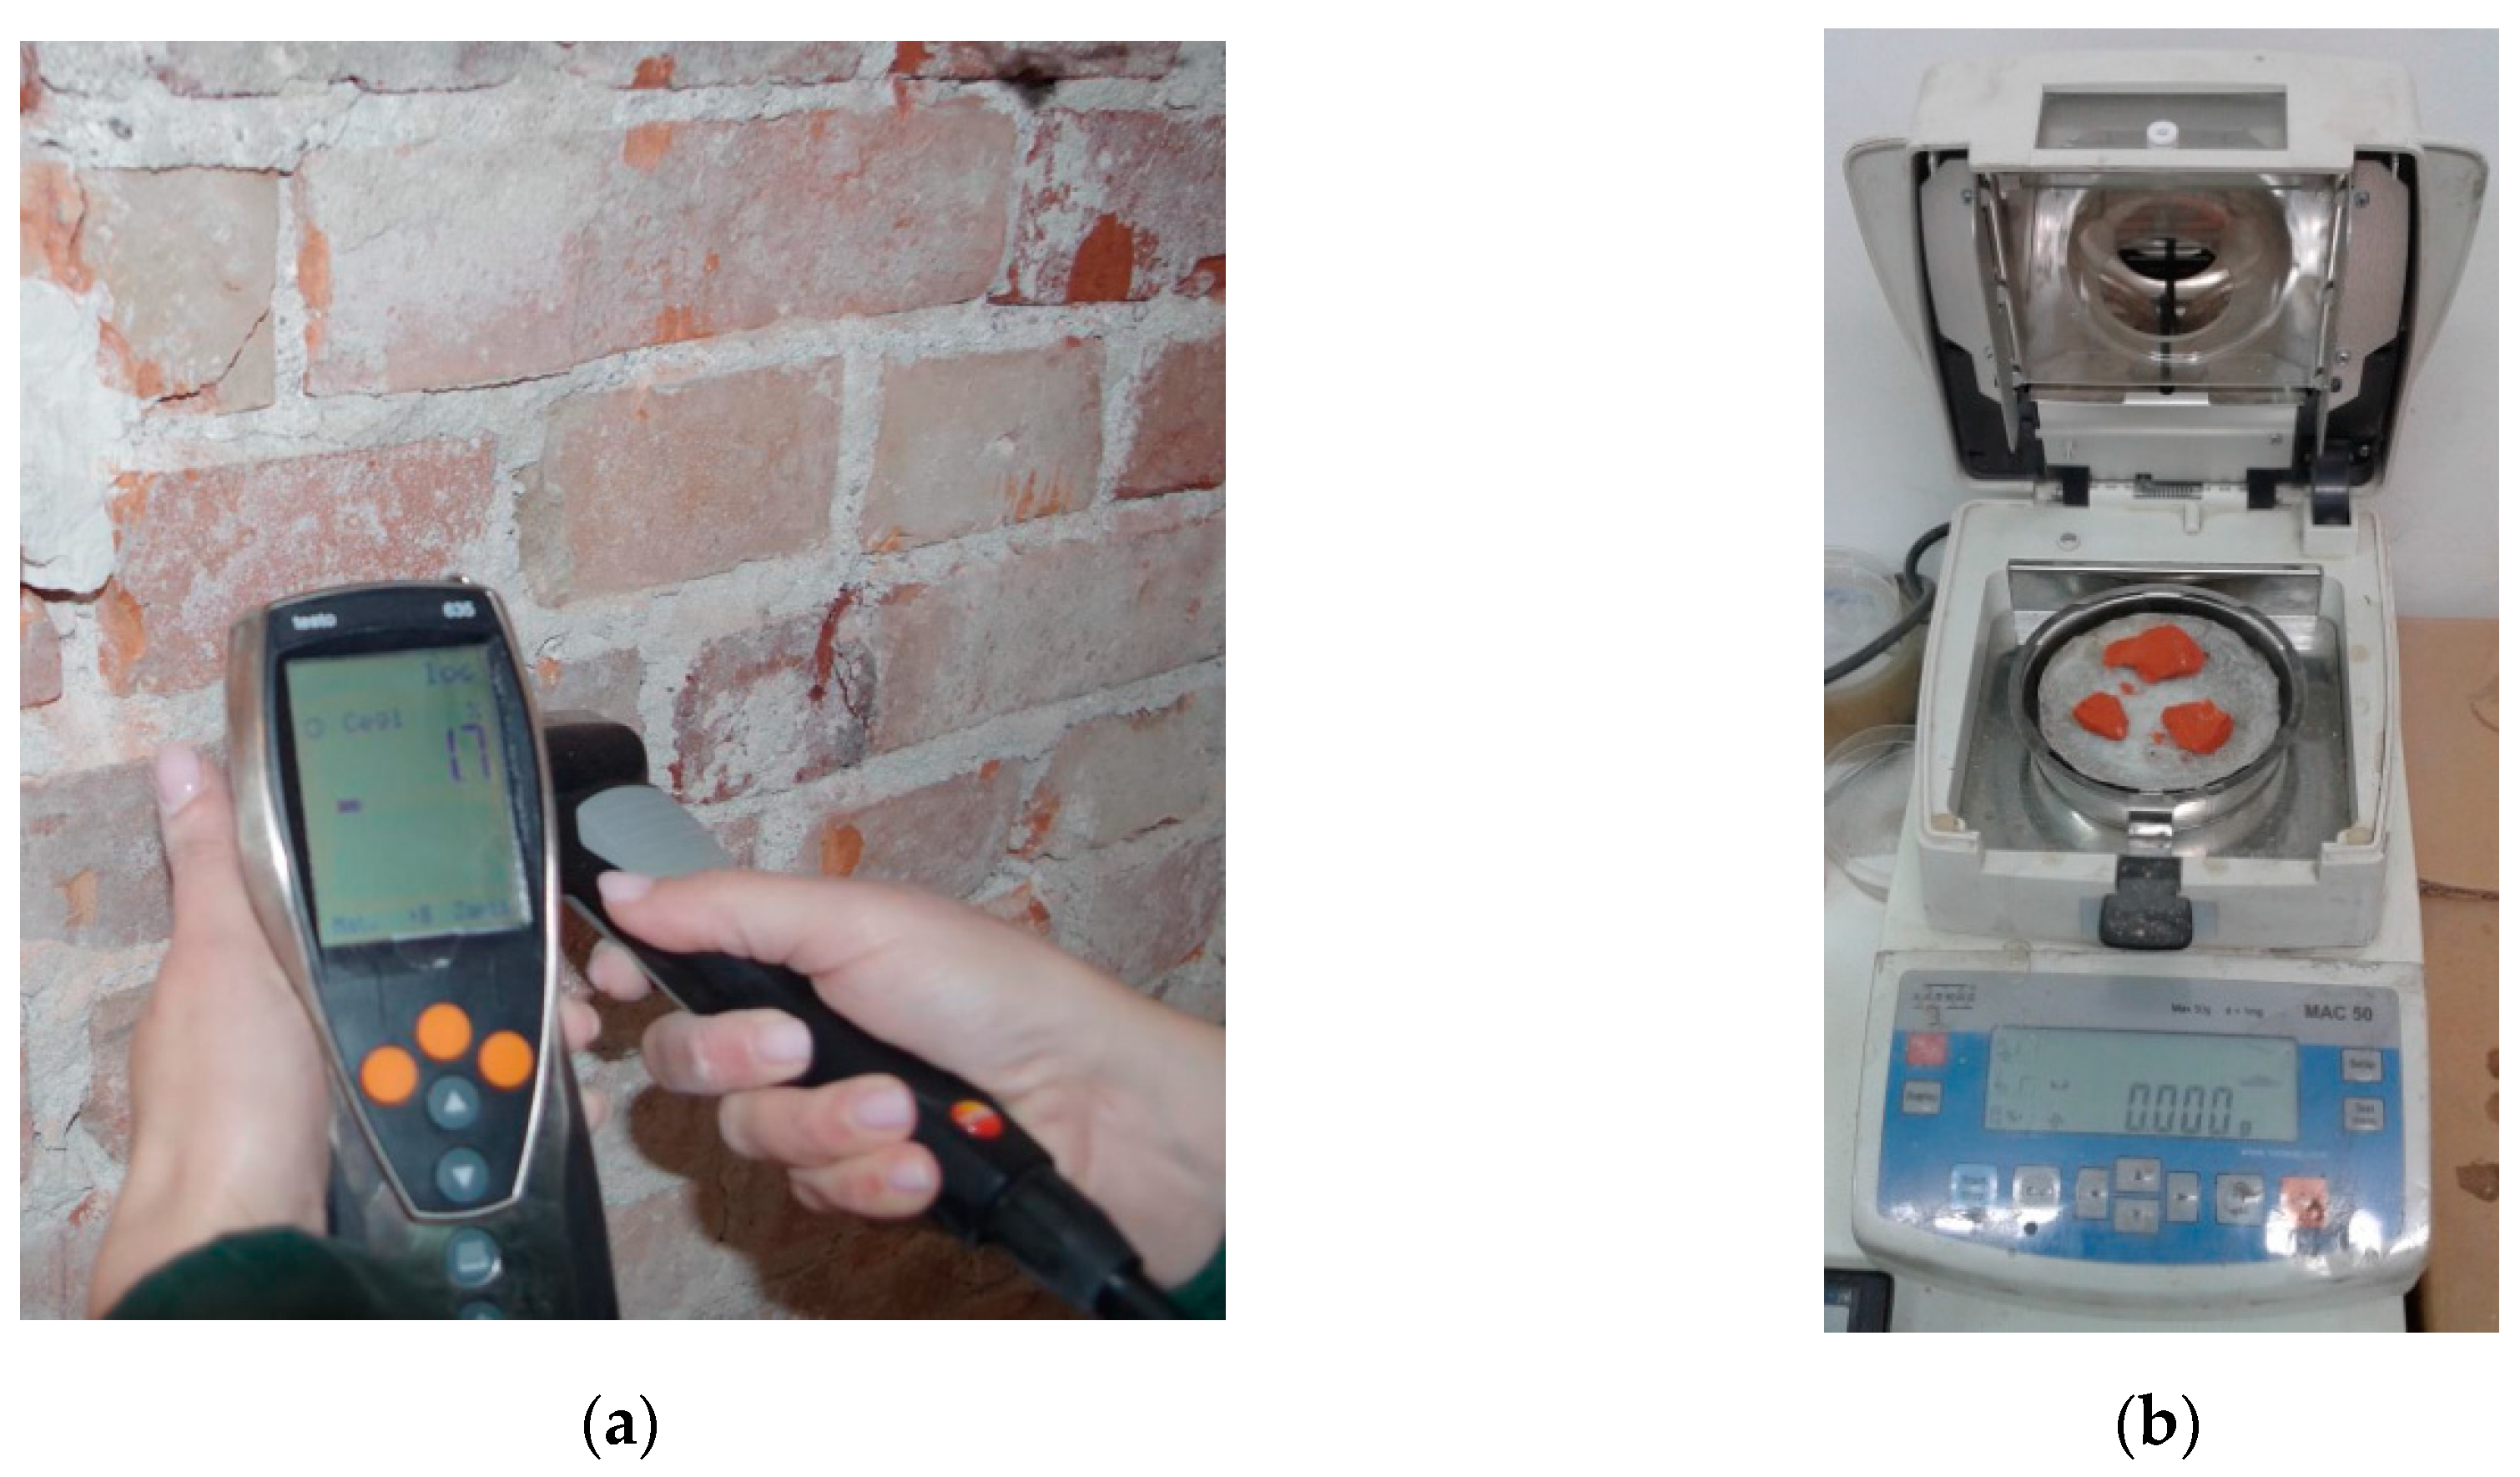
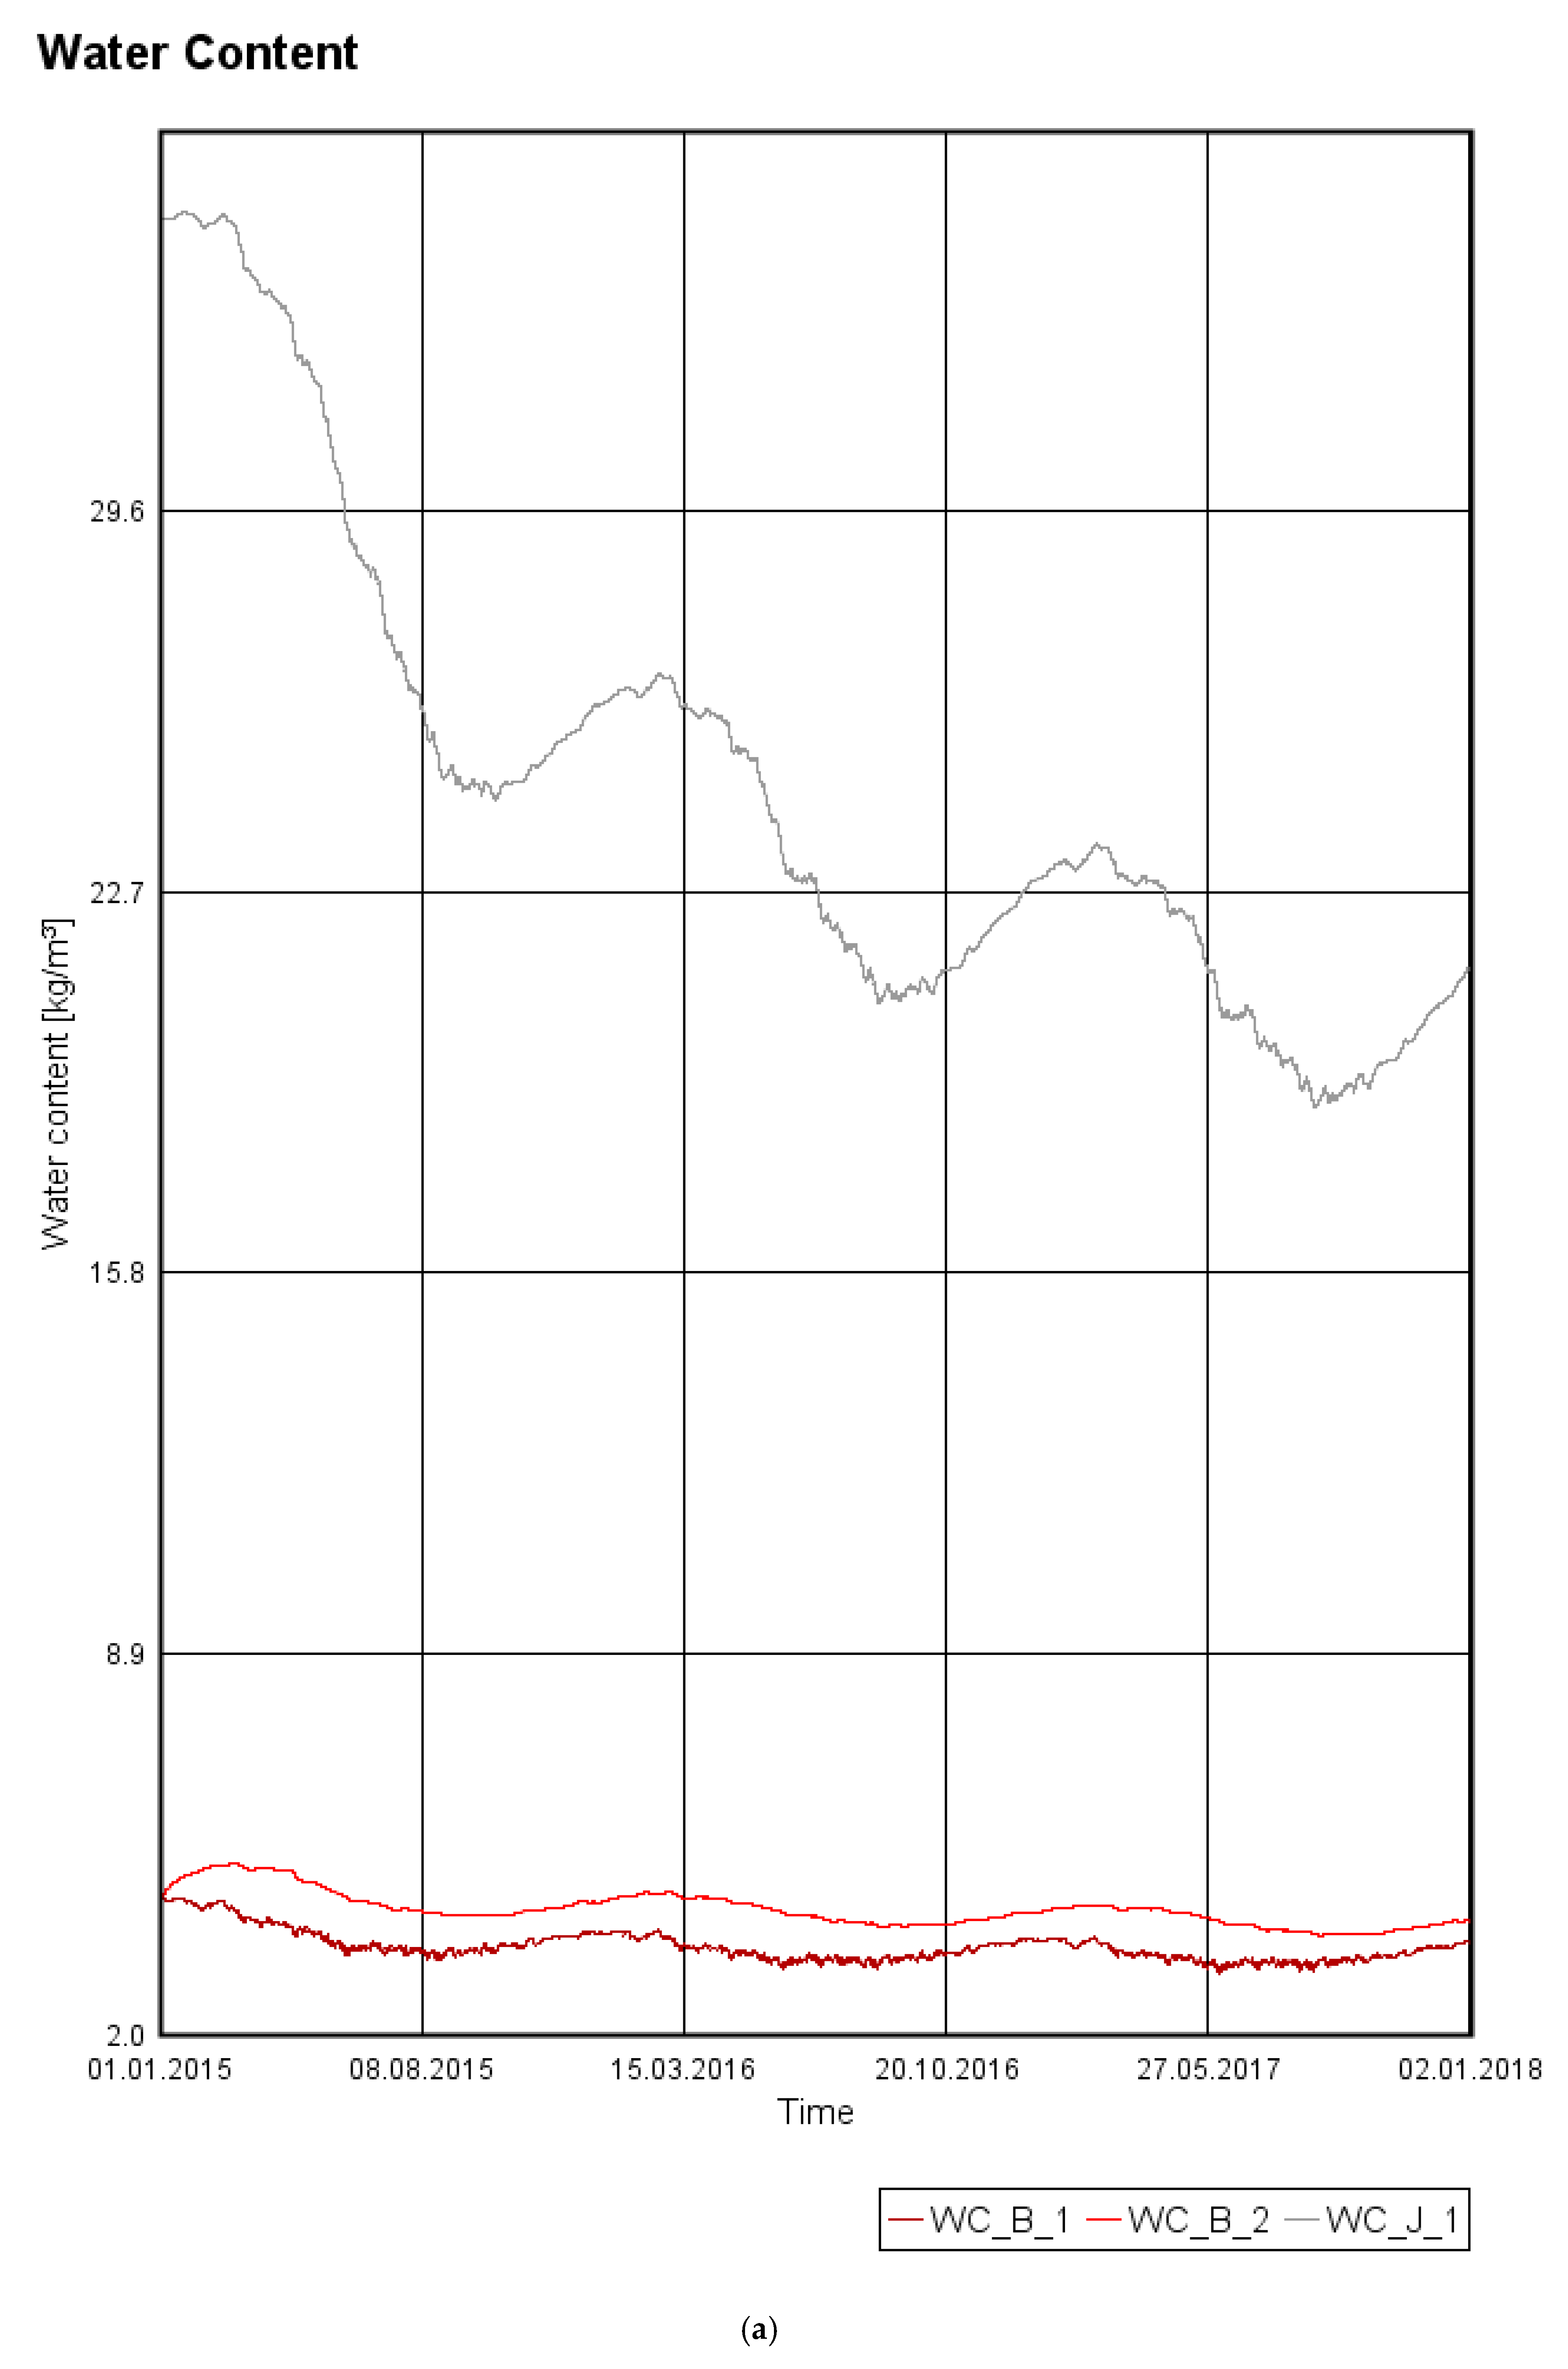
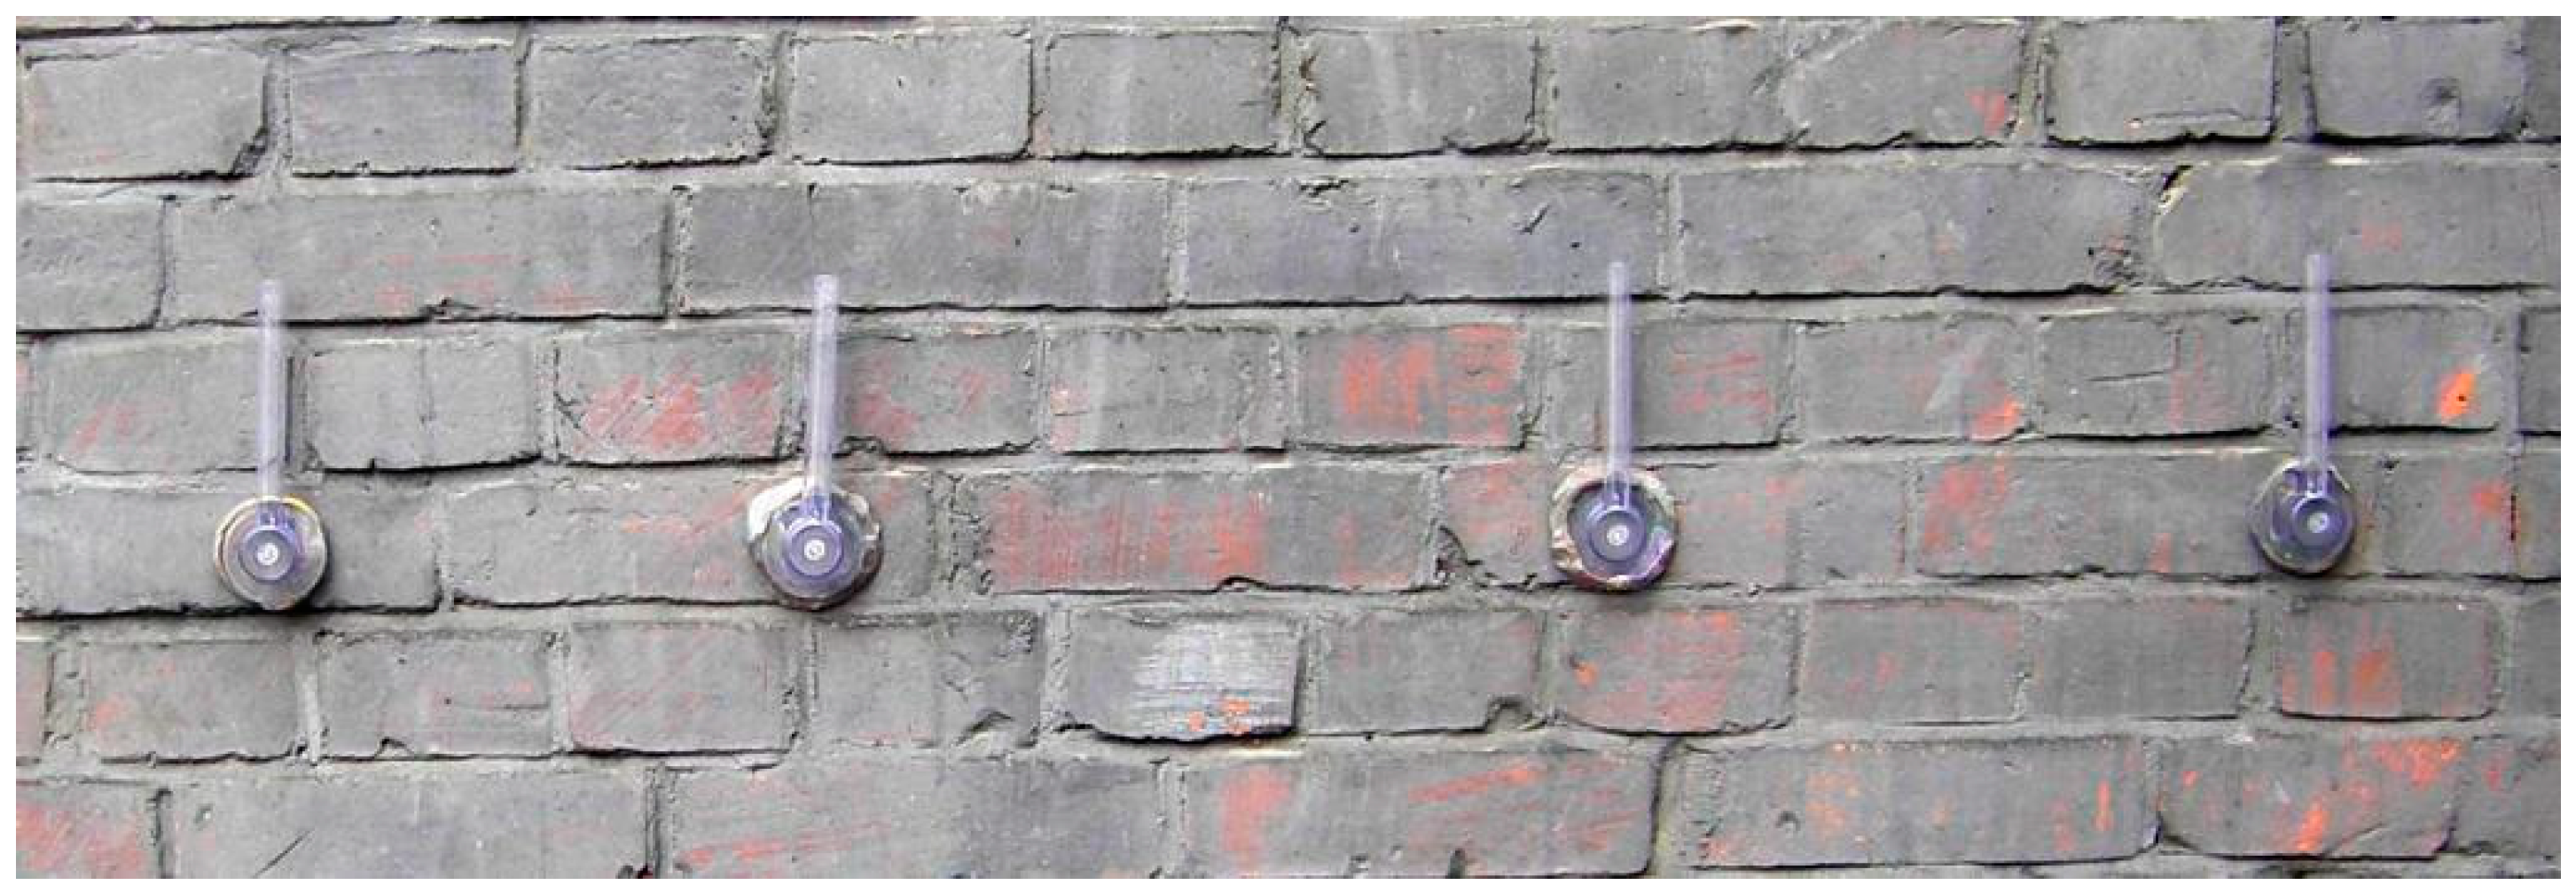
- Measurement of surface moisture, using non-invasive methods, and in the case of ceramic walls of the thickness above 51 cm—measuring water content by sampling the opencast (Figure 3).
- Determining capillary absorption of the masonry wall (which allows us to determine the effect of rain on the outer shell of the wall) (Figure 4):
- ○
- For substrates characterized by low capillary activity, for which: w = 0.5 (kg/m2h0.5) can be insulated with a material that allows it to achieve thermal resistance at the level of ΔR = 2 [(m2K)/W] with sd equal to 4 m. Partitions with capillary activity above 1.0 (kg/m2h0.5) can be insulated with material allowing to obtain thermal resistance ΔR = 2.5 [(m2K)/W].
- Defining the material type of wall layers and selecting most suitable physical properties with the use of available data.
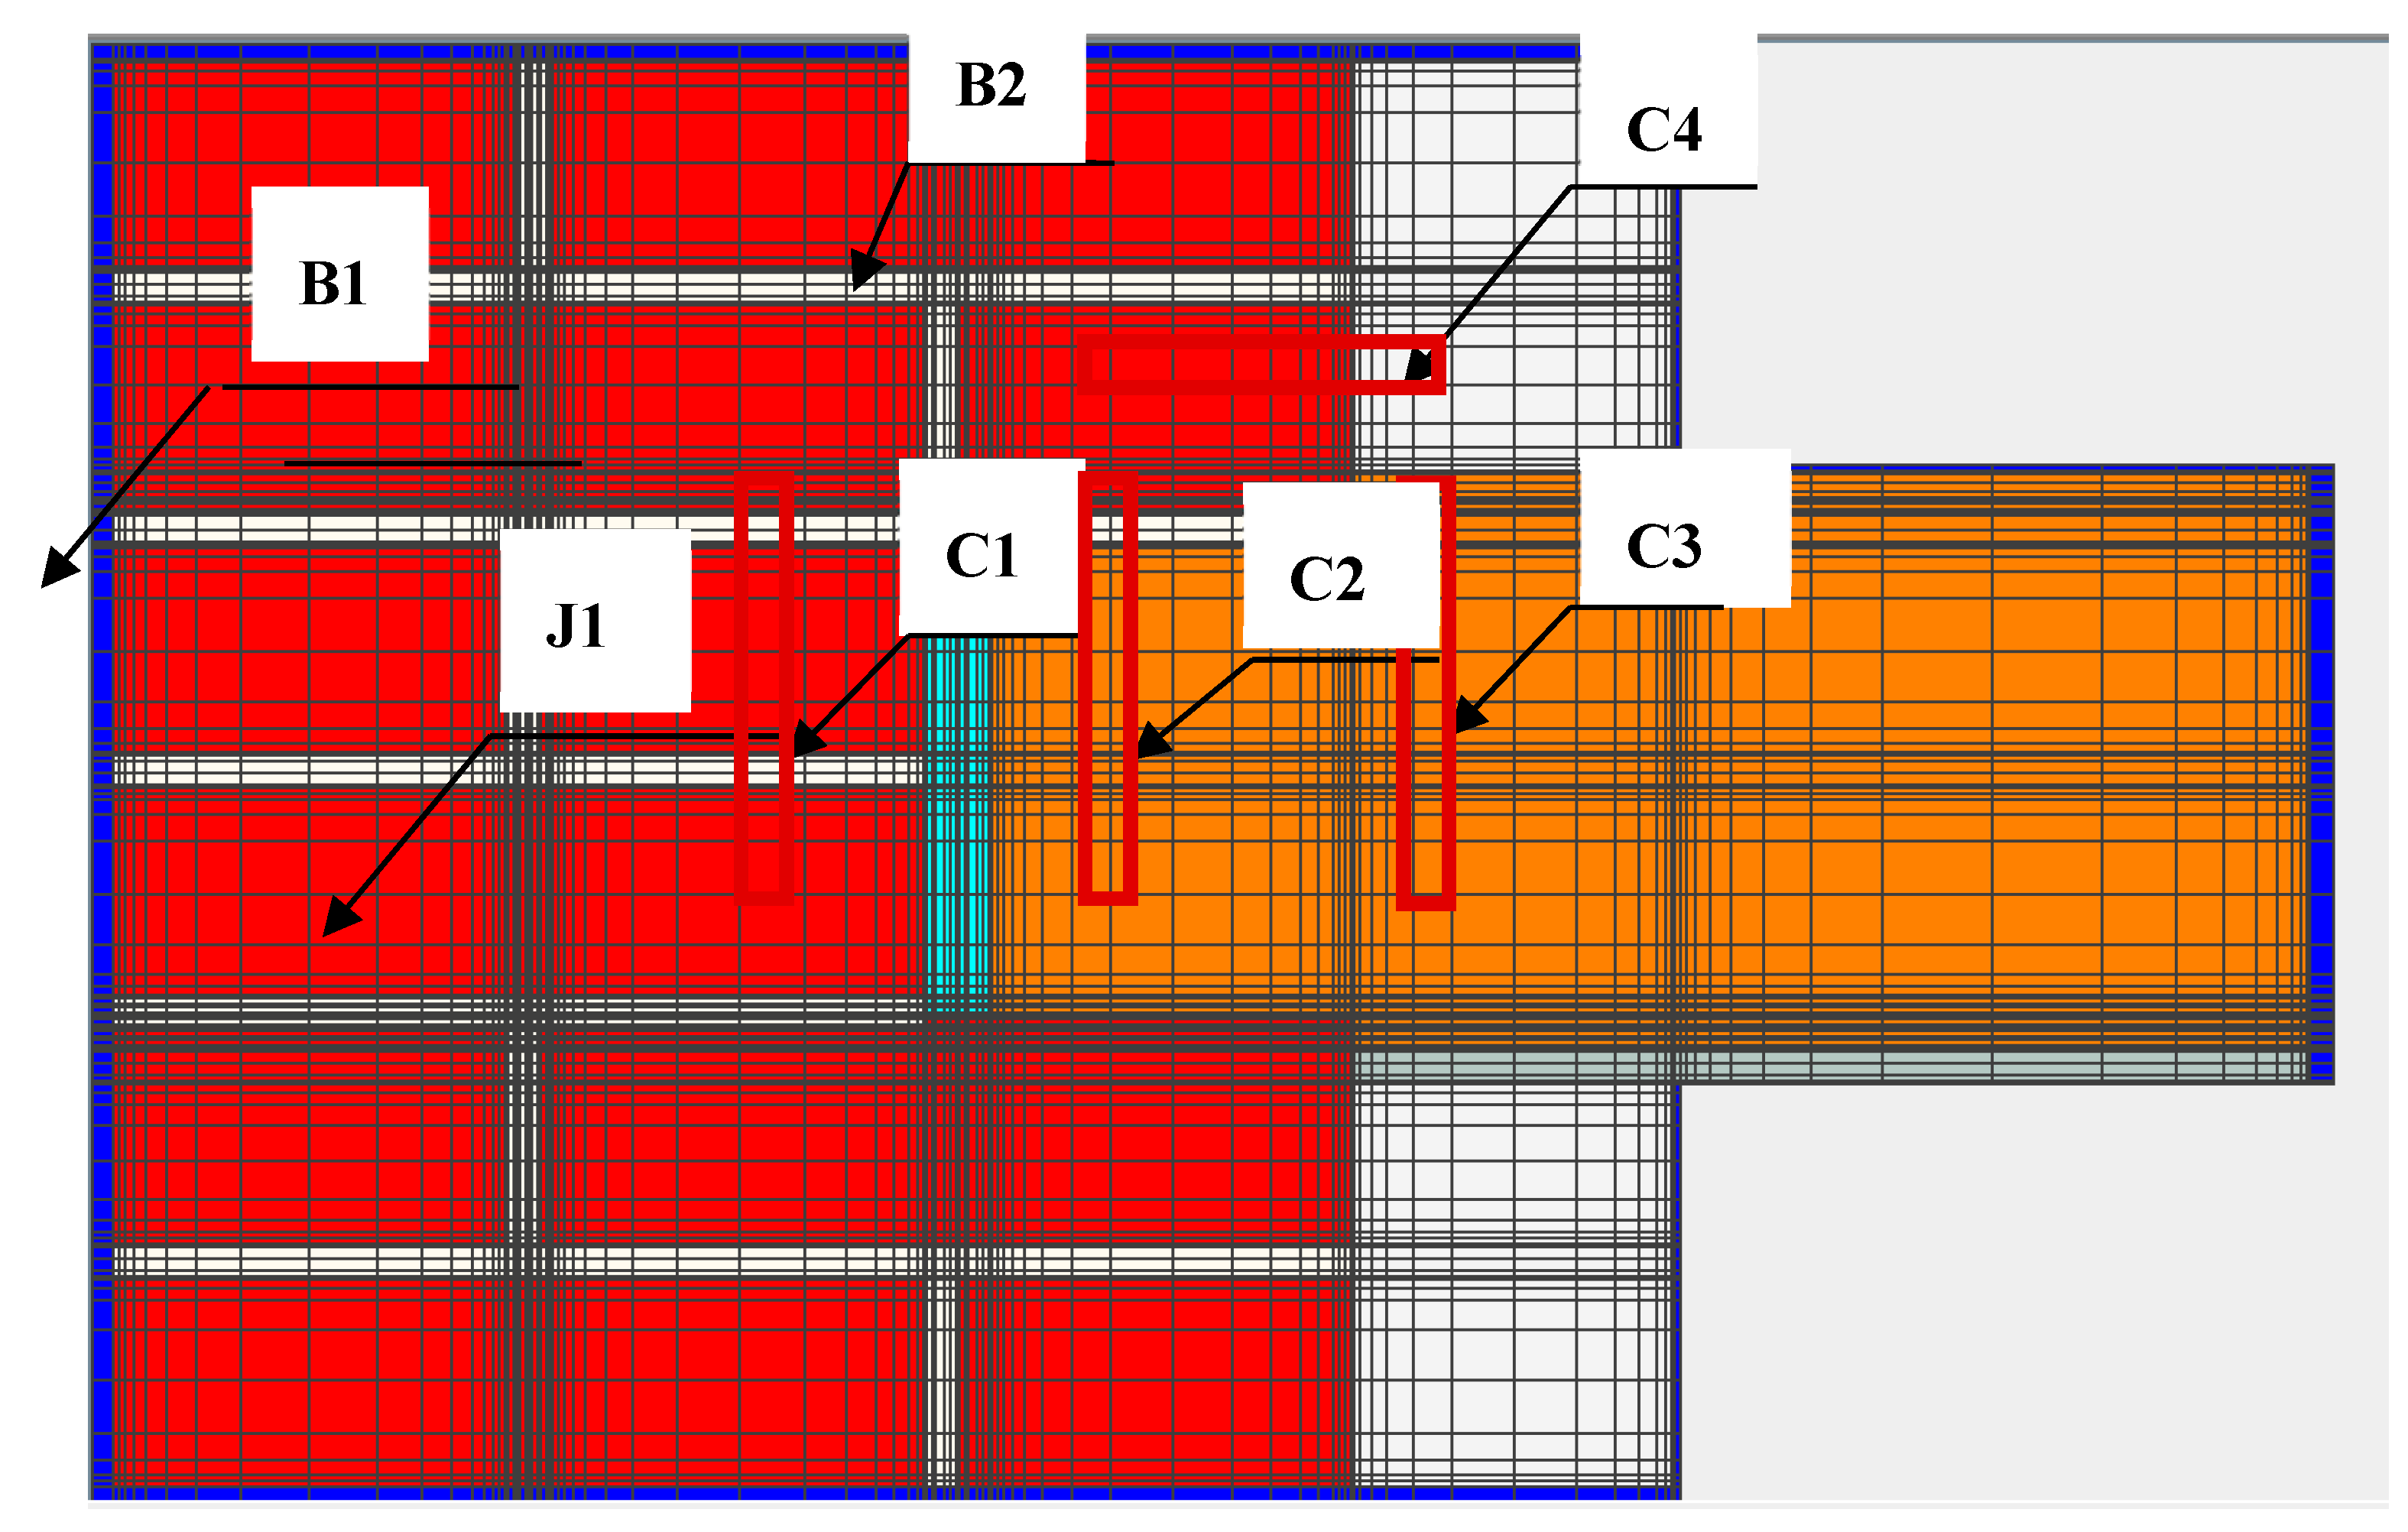
- Inventory of sensitive places—linear thermal bridges (Figures 8–14).
- Selection of material and insulation technology in line with the following principles:
- ○
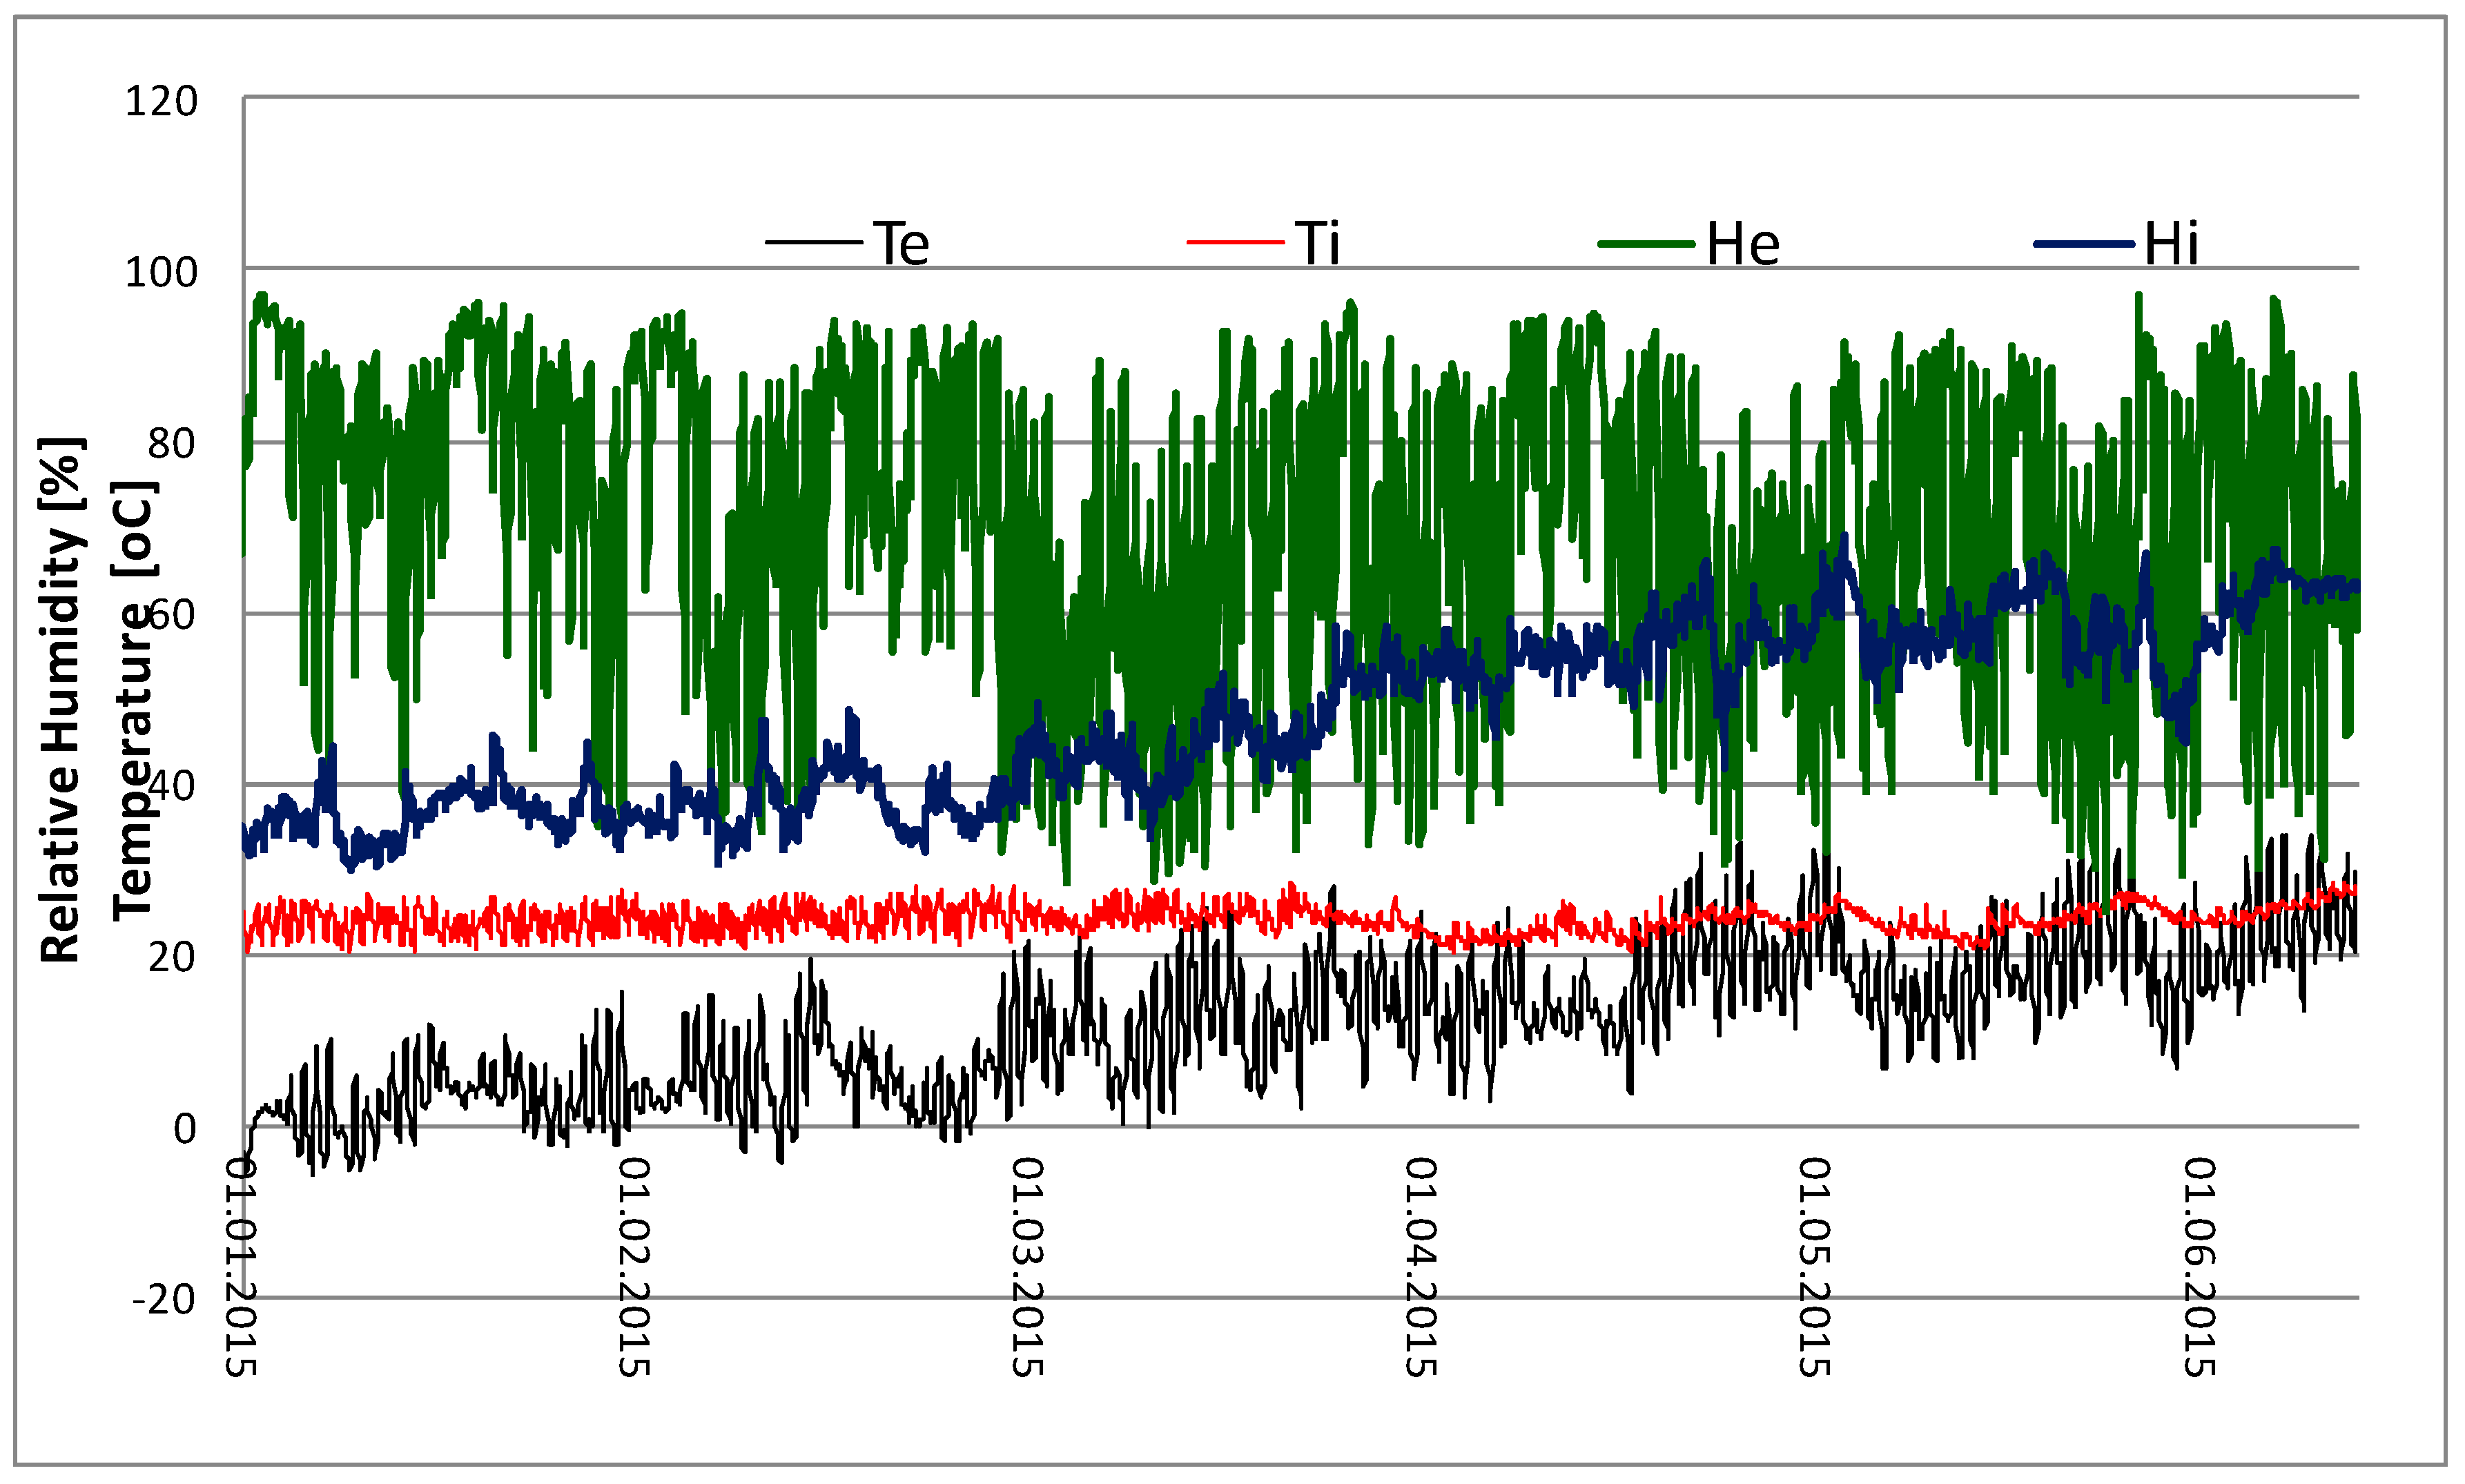
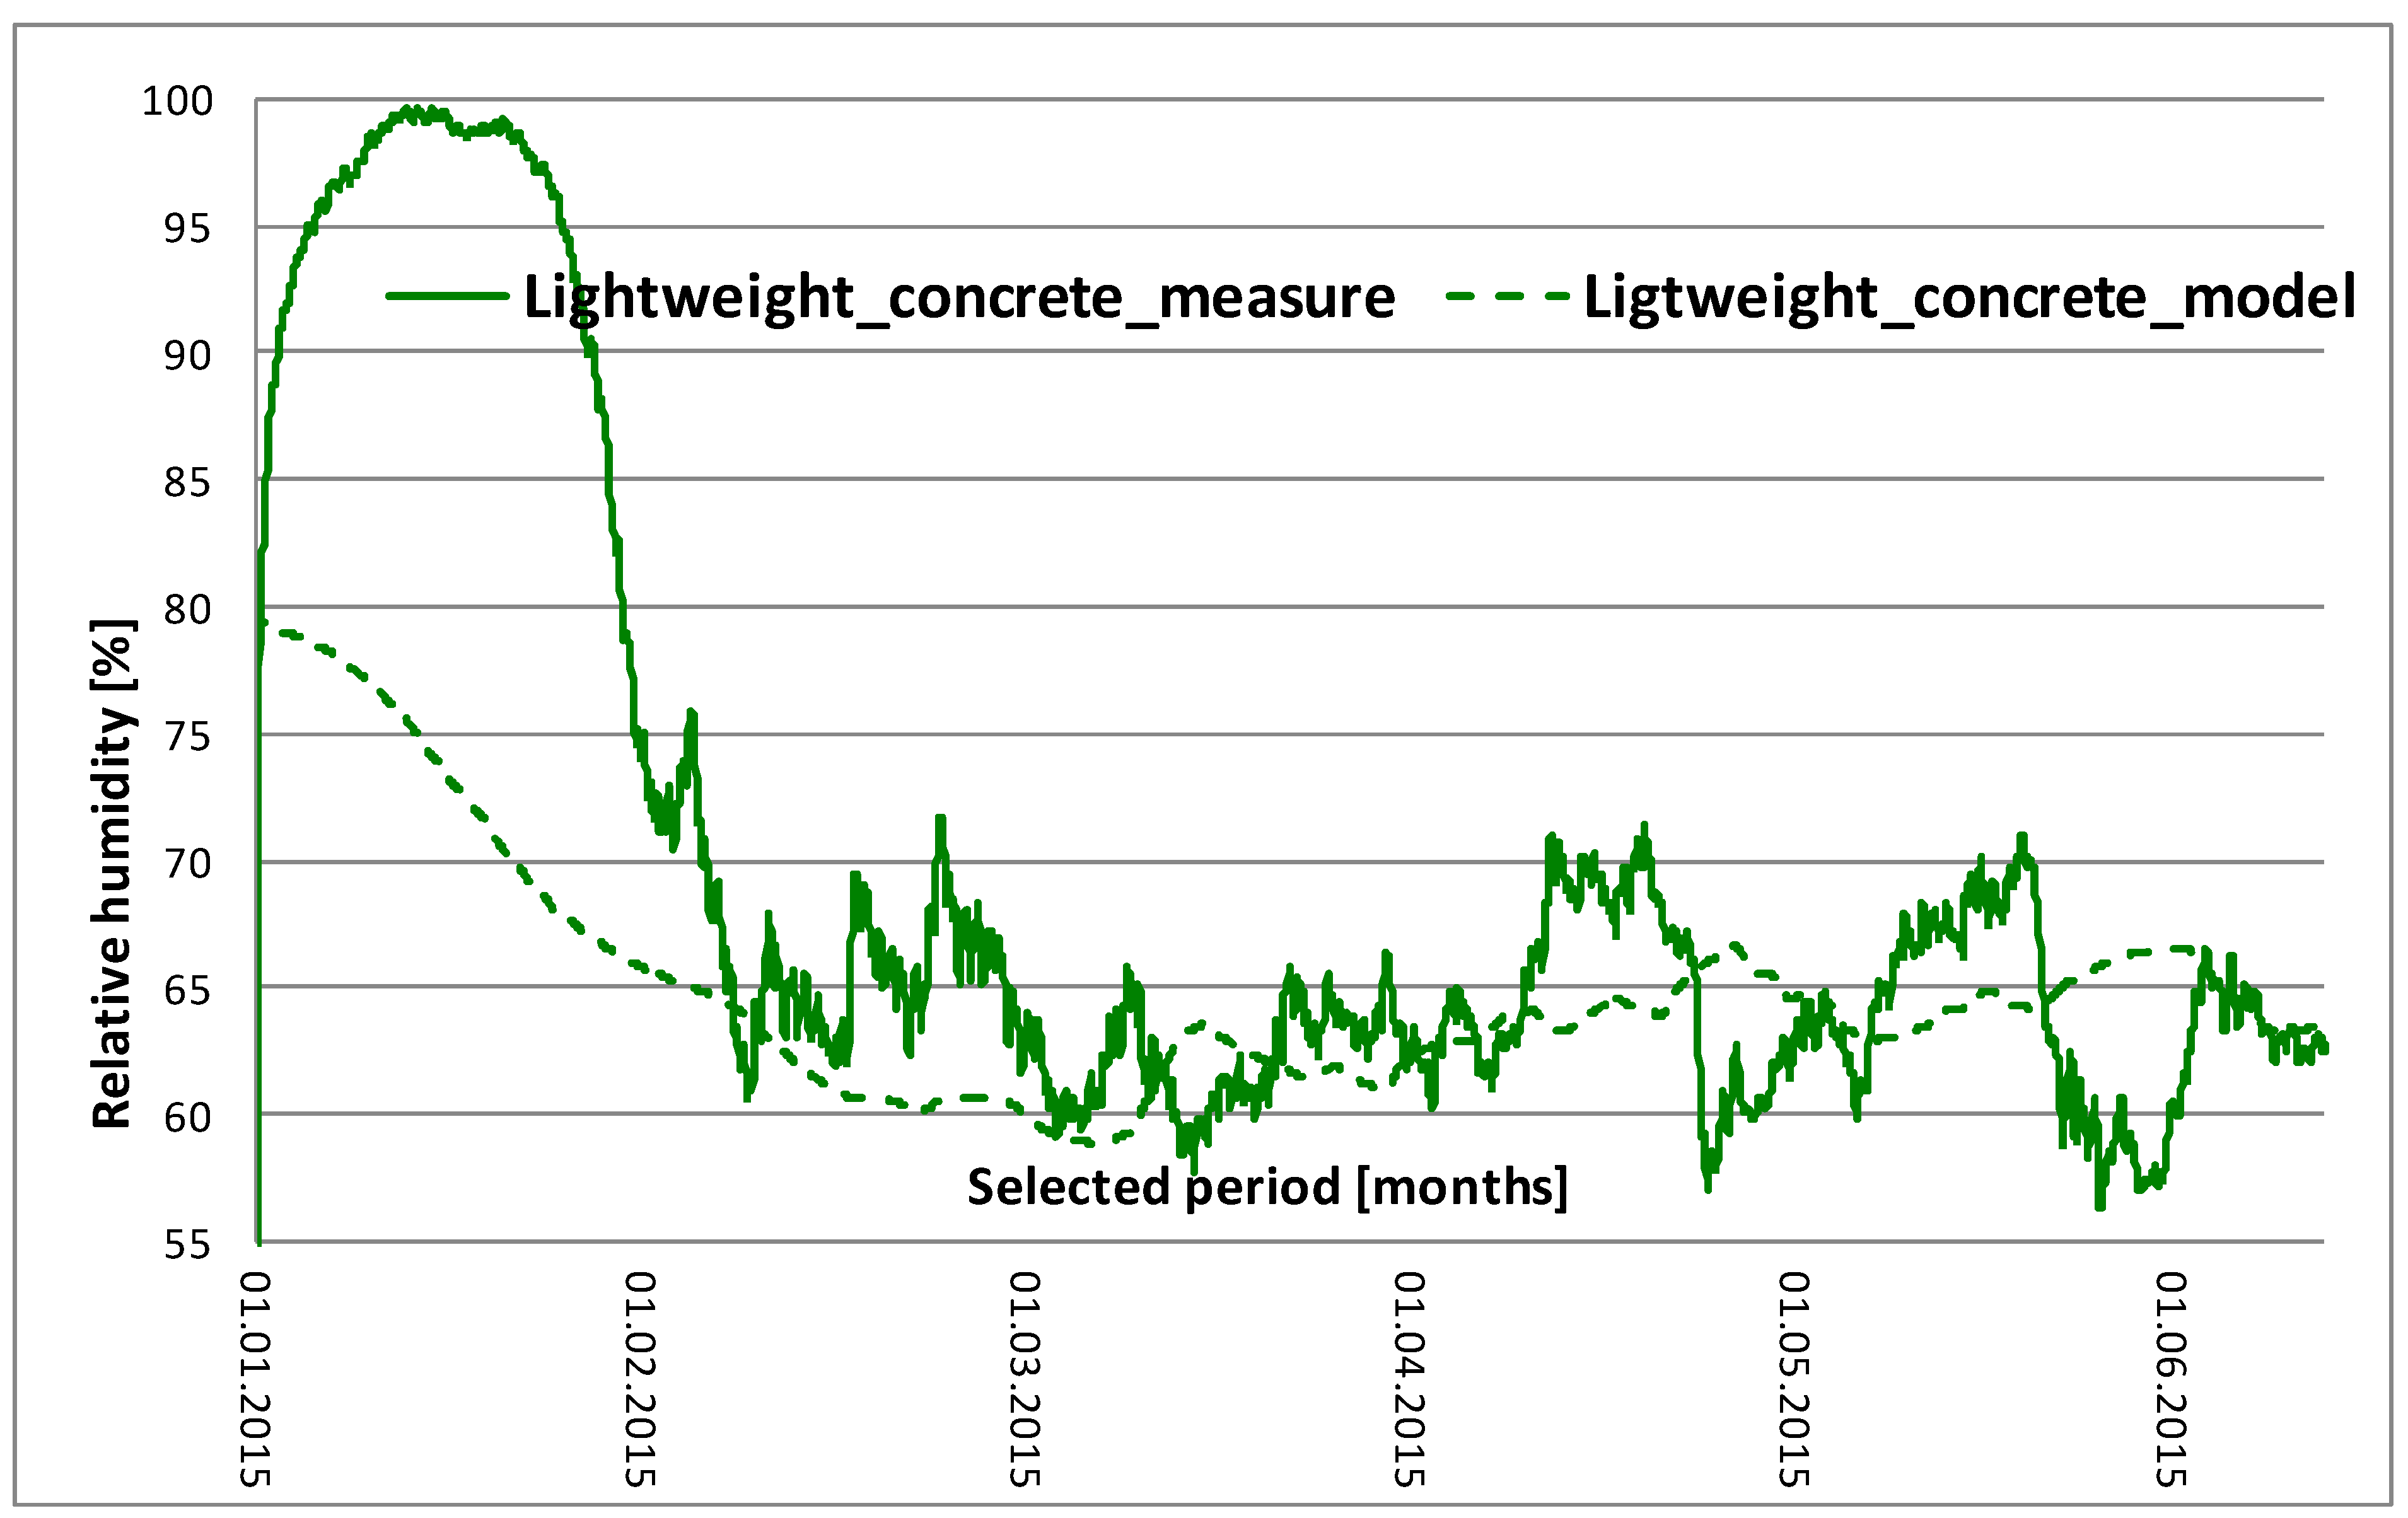
- It is essential to carry out calculations in the 2D simulation programs, allowing for real parameters of local climate and indoor environment (relative humidity, temperature, Figure 5). The calculations must demonstrate that there is no water increment in the insulated wall and in the adjacent junctions of wooden structural elements.
- ○
- It is recommended to calculate the temperature at the contact place between the layers: Existing wall—thermal insulation material, allowing for two-dimensional heat flow (Figures 7 and 8).
- ○
- It is recommended for walls erected from ceramic bricks—without distinction as to the type of brick wall—as well as for concrete walls to select the thickness of the insulation material to ensure that after the insulation works the value of thermal resistance is within the range of 0.5–3.0 [(m2K)/W] (depending on the obtained earlier results of in-situ studies—see point 3.1),
- ○
- The following values are recommended for the newly designed insulation layers, depending on the relative humidity of air in the room: sd > 1500 m for the rooms having raised humidity RH > 0.65; sd < 0.5 m for the rooms having the humidity RH < 0.65 [24].
2.2. Test Stand
2.3. Numerical Nodeling
- dH/dϑ—heat storage capacity of the moist building material [J/m3K],
- dw/dφ—moisture storage capacity of the building material [kg/m3],
- λ—thermal conductivity of the moist building material [W/mK],
- Dφ—liquid conduction coefficient of the building material [kg/ms],
- δp—water vapour permeability of the building material [kg/msPa],
- hv—evaporation enthalpy of the water [J/kg],
- psat—water vapour saturation pressure [Pa],
- ϑ—temperature [°C],
- φ—relative humidity [-].
3. Results and Discussion
In Situ Research and Modelling
- Linear thermal coupling coefficient L2D [W/(mK)],
- Linear thermal transmittance, defining additional heat losses effected by the presence of linear thermal bridges [W/(mK)],where:
- L2D—thermal coupling coefficient obtained from the calculations involving two-dimensional heat flow of the component separating the two investigated environments [W/(mK)],
- Uj—thermal transmittance of the one-dimensional j-th component separating the two investigated environments [W/(m2K)],
- lj—length applicable for Uj [m],
- N—number of one-dimensional components.
- Temperature factor, defined on the basis of the minimum temperature on the envelope surface at the place of thermal bridge fRsi [29]:where:
- θsi—calculated temperature of the internal surface at the critical place,
- Ti—temperature of indoor air,
- Te—temperature of outdoor air,
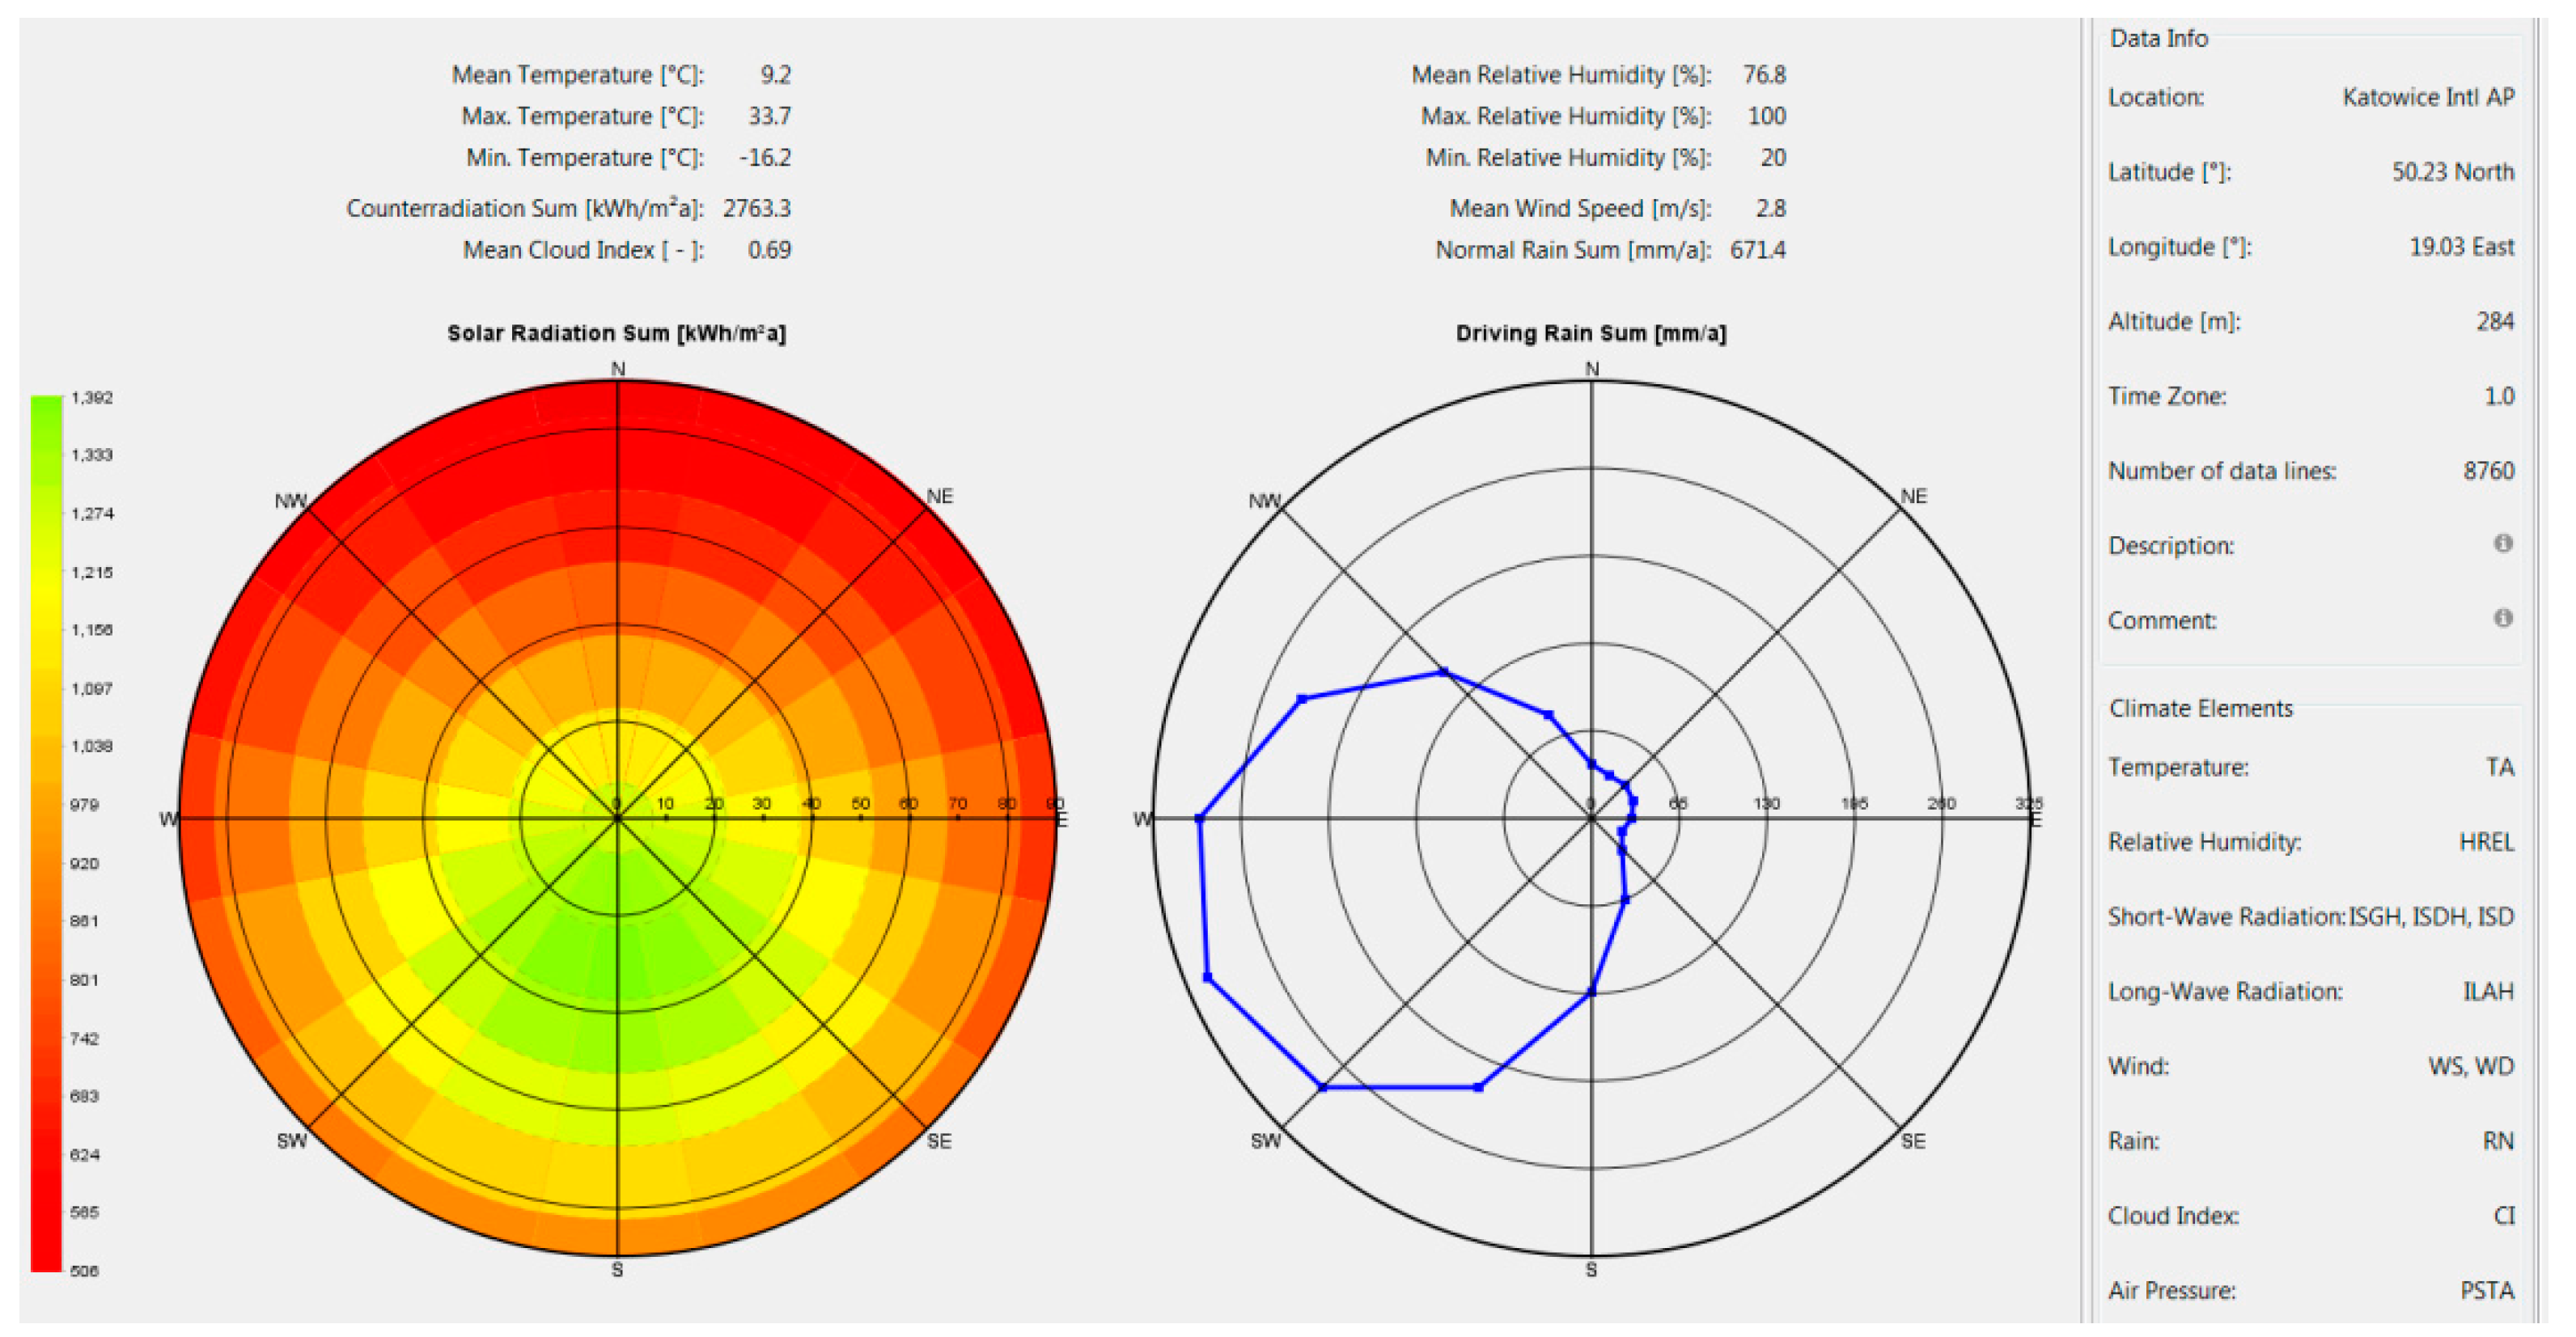
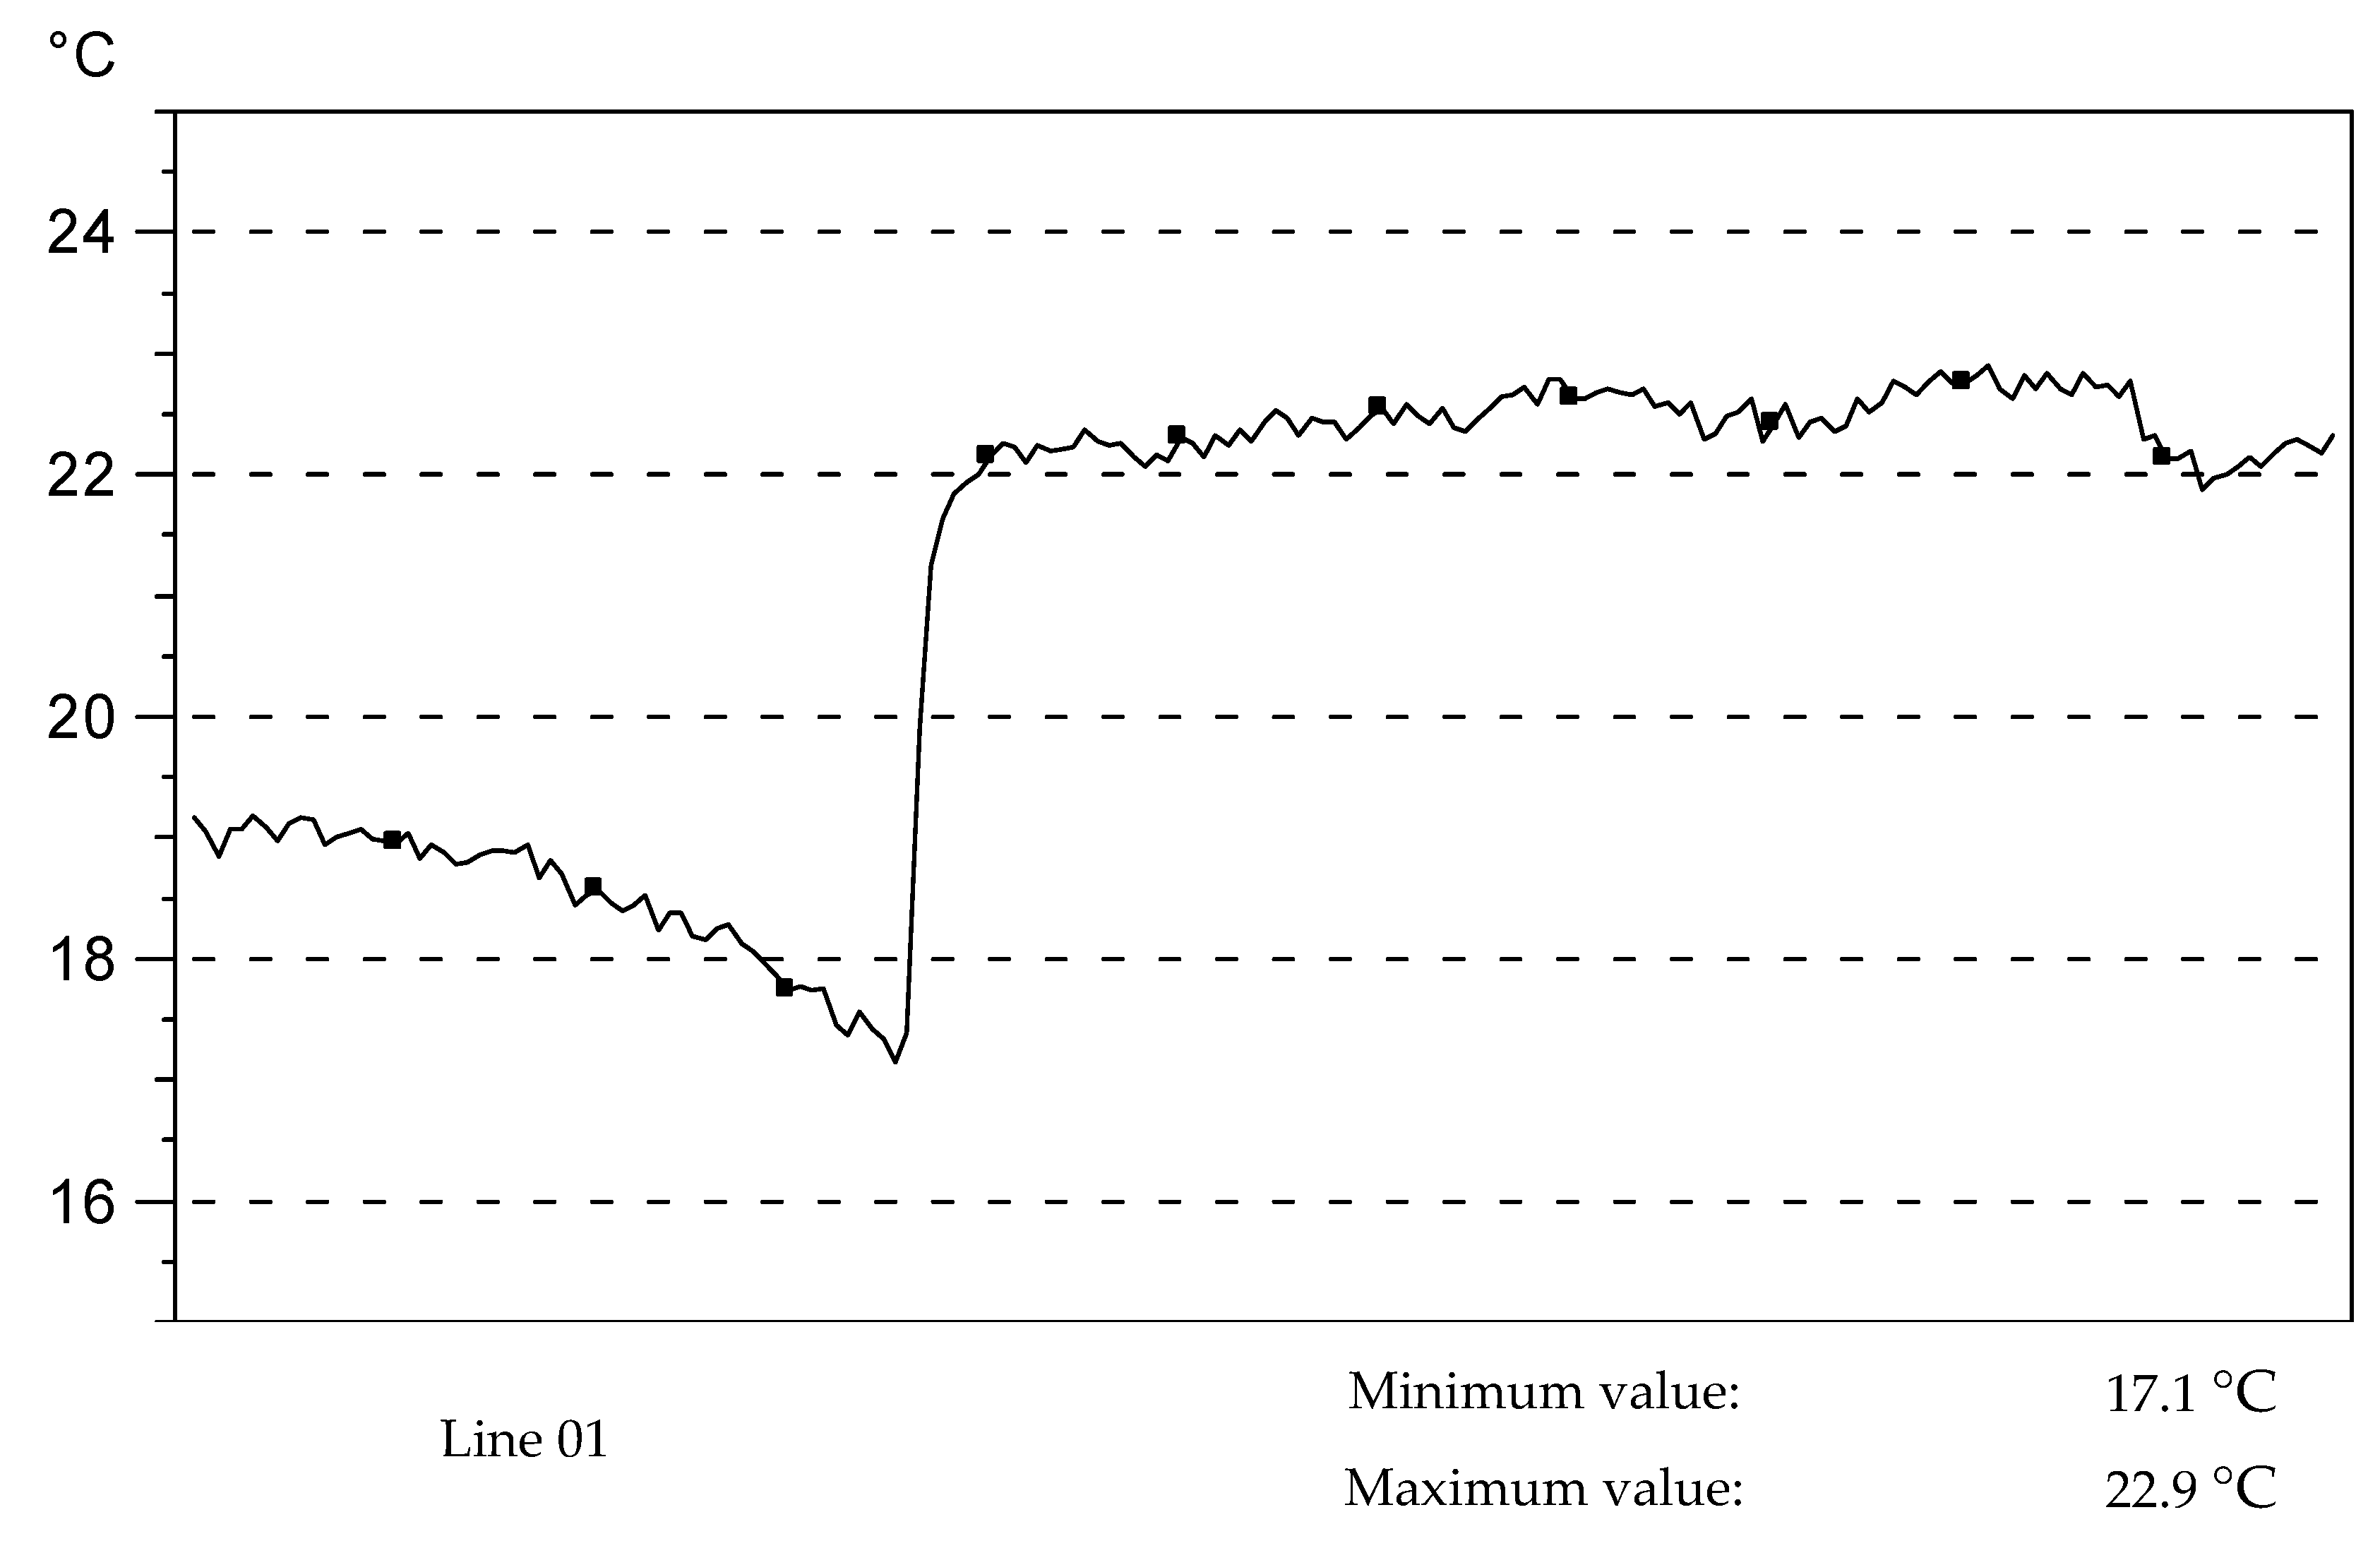
- The following qualities were accepted as boundary conditions: Temperature of outdoor air te: –20 °C, temperature of indoor air ti: +20 °C, thermal surface coefficients he = 25 [W/(m2 K)], hi = 7.69 [W/(m2 K)], for calculations fRsi hi = 4 [W/m2 K] was assumed.
- Temperature measurements ranged from: –20 °C to 1200 °C,
- Camera angle of view: (IR Resolutions) 250 × 190,
- Thermal resolving power (at 30 °C): 0.05 K,
- Spatial resolution capacity: 1.36 mRad,
- Spectral range of sensitivity: 7.5—13 µm,
- Number of points on the line: Approximately 175.
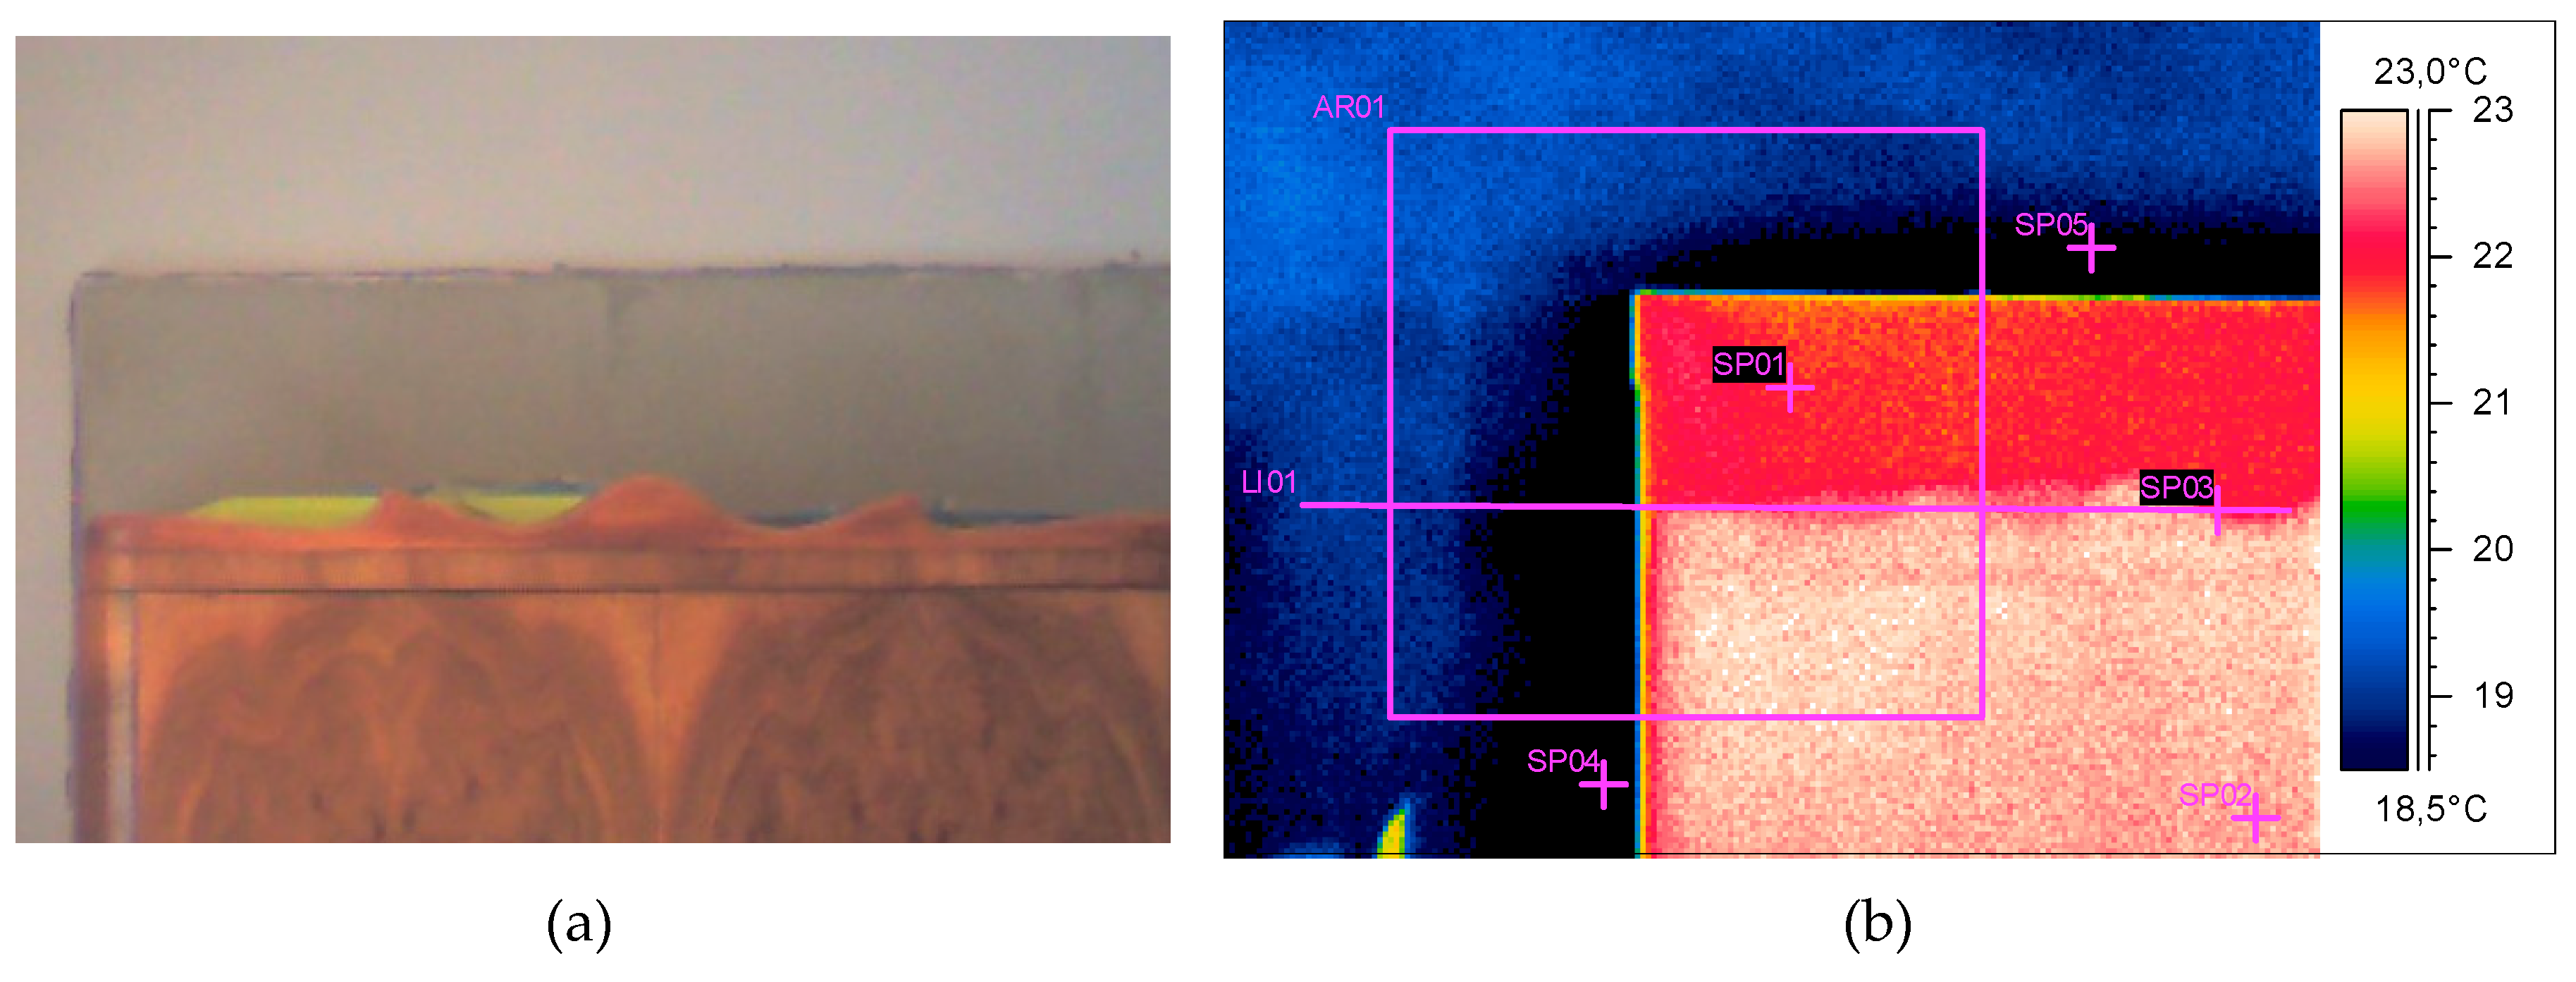
- During the tests, both the outside air temperature and the temperature inside the building were measured before and in the course of the tests.
- Measurement performed: December 19, 2016:
- ○
- Outside ambient temperature, te: 5.5 °C–5.0 °C,
- ○
- The temperature inside the building, ti: 20.0 °C–22.0 °C,
- Thermovision measurements were made at a temperature difference, Δt = 14.5–17.0 °C.
4. Conclusions
Funding
Conflicts of Interest
References
- DIRECTIVE (EU) 2018/844 OF THE EUROPEAN PARLIAMENT AND OF THE COUNCILof 30 May 2018 amending Directive 2010/31/EU on the energy performance of buildings and Directive 2012/27/EU on energy efficiency (Text with EEA relevance). Available online: https://eur-lex.europa.eu (accessed on 15 July 2019).
- DIRECTIVE 2012/27/EU OF THE EUROPEAN PARLIAMENT AND OF THE COUNCI of 25 October 2012 on energy efficiency, amending Directives 2009/125/EC and 2010/30/EU and repealing Directives 2004/8/EC and 2006/32/EC (Text with EEA relevance). Available online: https://eur-lex.europa.eu (accessed on 15 July 2019).
- Fedorczak-Cisak, M.; Furtak, M.; Gintowt, J. Thermal and Vibration Comfort Analysis of a Nearly Zero-Energy Building in Poland. Sustainability 2018, 10, 3774. [Google Scholar] [CrossRef]
- Firląg, S.; Piasecki, M. NZEB Renovation Definition in a Heating Dominated Climate: Case Study of Poland. Appl. Sci. 2018, 8, 1605. [Google Scholar] [CrossRef]
- Papadopoulos, A.M.; Avgelis, A.; Karamanos, A. Composite insulating materials as a tool for the reduction of cooling loads. In Proceedings of the International Conference “Passive and Low Energy Cooling for the Built Environment”, Santorini, Greece, 19–21 May 2005. [Google Scholar]
- Hens, H. Performance prediction for masonry walls with inside insulation using calculation procedures and laboratory testing. J. Therm. Envel. Build. Sci. 1998, 22, 32–48. [Google Scholar] [CrossRef]
- Wilkinson, J.; De Rose, D.; Sullivan, B.; Strauben, J.F. Measuring the impact of interior insulation on solid masonry walls in a cold climate. J. Build. Enclos. Design. 2009, Summer. 11–17. [Google Scholar]
- Stopp, H.; Strangeld, P.; Fechner, H.; Häupl, P. The Hygrothermal Performance of External Walls with Inside Insulation, Buildings VIII/Wall Performance—Practices. pp. 1–13. Available online: http://web.ornl.gov/sci/buildings/2016/2001%20B8%20papers/023_Stopp.pdf (accessed on 30 March 2016).
- Straube, J.F.; Schumacher, C.J. Interior insulation retrofits of load-bearing masonry walls in cold climates. J. Green Build. 2007, 2, 42–50. [Google Scholar] [CrossRef]
- Schöberl, H.; Hofer, R.; Lang, C.H. Handbuch thermische Gebäudesanierung Optimale Ausführungsvarianten erstellt im Rahmen des Projekts: REBE”-Regionale Zusammenarbeit und Wissenstransfer Im Bereich Bioenergie und Energieeffizienz; Landesinnung Bau Niederösterreich: Wien, Austria, 2012. [Google Scholar]
- Straube, J.F.; Ueno, K.; Schumacher, C.J. Building Science Corporation; Measure Guideline: Internal Insulation of Masonry Walls; Department of Energy: Somerville, USA, 2012. [Google Scholar]
- Fechner, H.; Häupl, P.; Stopp, H.; Strangfeld, P. Measurements and numerical simulation of the heat and moisture transfer in envelope parts of buildings. In Proceedings of the International Conference on Thermophysical Properties of Materials, Nanyang Technological University, Singapore, 1999. [Google Scholar]
- Hamid, A.A.; Wallentén, P. Hygrothermal assessment of internally added thermal insulation on external brick walls in Swedish multifamily buildings. Build. Environ. 2017, 123, 351–362. [Google Scholar] [CrossRef]
- Vereecken, E.; Roels, S. A comparison of the hygric performance of interior insulation systems: A hot box–cold box experiment. Energy Build. 2014, 80, 37–44. [Google Scholar] [CrossRef]
- Pavlík, Z.; Cerny, R. Experimental assessment of hygrothermal performance of an interior thermal insulation system using a laboratory technique simulating on-site conditions. Energy Build. 2008, 40, 673–678. [Google Scholar] [CrossRef]
- Walker, R.; Pavia, S. Thermal performance of a selection of insulation materials suitable for historic buildings. Build. Environ. 2015, 94, 155–165. [Google Scholar] [CrossRef]
- Zhao, J.; Grunewald, J.; Ruisinger, U.; Feng, S. Evaluation of capillary-active mineral insulation systems for interior retrofit solution. Build. Environ. 2017, 115, 215–227. [Google Scholar] [CrossRef]
- Gonçalves, M.D. Insulating solid masonry walls. In Proceedings of the Ninth Conference on Building Science and Technology. Ontario Building Envelope Council, Vancouver, BC, Canada, 2003; pp. 171–181. Available online: https://www.cebq.org/documents/Insulatingsolidmasonrywalls-BEF_000.pdf (accessed on 15 July 2019).
- Harrestrup, M.; Svendsen, S. Internal insulation applied in heritage multi-storey buildings with wooden beams embedded in solid masonry brick façades. Build. Environ. 2016, 99, 59–72. [Google Scholar] [CrossRef]
- Üllar, A.; Kalamees, T. Avoiding mould growth in an interiorly insulated log wall. Build. Environ. 2016, 105, 104–115. [Google Scholar]
- Vereecken, E.; Van Gelder, L.; Janssen, H.; Roels, S. Interior insulation for wall retrofitting—A probabilistic analysis of energy savings and hygrothermal risks. Energy Build. 2015, 89, 231–244. [Google Scholar] [CrossRef]
- Arbeiter, K. Innendaemmung; Wyd. Rudolf Mueller: Koeln, Germany, 2014. [Google Scholar]
- Orlik-Kożdoń, B.; Steidl, T. Impact of internal insulation on the hygrothermal performance of brick wall. J. Build. Phys. 2016, 11, 120–134. [Google Scholar] [CrossRef]
- DIN 4108-3:2018-10 Wärmeschutz und Energie-Einsparung in Gebäuden—Teil 3: Klimabedingter Feuchteschutz - Anforderungen, Berechnungsverfahren und Hinweise für Planung und Ausführung.
- Rokiel, M. Hydroizolacje w Budownictwie; Dom Wydawniczy MEDIUM: Warsaw, Poland, 2009. [Google Scholar]
- Karsten, R. Bauchemie: Fur Stadium und Praxis; C.F. Müller Verlag: Heidelberg, Germany, 1992. [Google Scholar]
- Künzel, H.M. Simultaneous Heat and Moisture Transport. In Building Components. One-and Two-Dimensional Calculation Using Simple Parameters; Fraunhofer IRB Verlag: Suttgart, Germany, 1995. [Google Scholar]
- WTA-Merkblatt 6-1-01/D: Leitfaden für hygrothermische Simulationsberechnung.
- WTA-Merkblatt 6-2-01/D: Simulation wärme- und feuchtetechnischer Prozesse. Mai. 2002.
- WTA-Merkblatt 6-5-12/D: Innendammung nach WTA-II: Nachweis von Innendämmungen mittels numerischer Berechnungsverfahren. 2012.
- Trochonowicz, M.; Witek, B.; Chwiej, M. Analiza wpływu wilgotności i temperatury powietrza na wartość współczynnika przewodności cieplnej materiałów termoizolacyjnych stosowanych wewnątrz pomieszczeń. Budownictwo i Architektura 2013, 12, 165–176. [Google Scholar]
- ISO 10211:2017. Thermal bridges in building construction-Heat flows and surface temperatures-Detailed calculations. Available online: https://www.iso.org/standard/65710.html (accessed on 15 July 2019).
- ISO 13788:2012. Hygrothermal performance of building components and building elements—Internal surface temperature to avoid critical surface humidity and interstitial condensation—Calculation methods. Available online: https://www.iso.org/standard/51615.html (accessed on 15 July 2019).
- Rozporządzenie Ministra Infrastruktury z dn. dnia 12 kwietnia 2002 r. w sprawie warunków technicznych jakim powinny odpowiadać budynki i ich usytuowanie (Dz. U. nr 75. poz. 690). z późniejszymi zmianami. Available online: http://prawo.sejm.gov.pl/isap.nsf/DocDetails.xsp?id=WDU20020750690 (accessed on 15 July 2019).
- Wójcik, R. Docieplanie Budynków od Wewnątrz; MEDIUM: Warsaw, Poland, 2017. [Google Scholar]
- Orlik-Kożdoń, B.; Steidl, T. Effect of the air channels in thermal insulating material on its thermal resistance. J. Build. Phys. 2016, 39, 461–470. [Google Scholar] [CrossRef]
- Orlik-Kożdoń, B.; Belok, J. Experimental and numerical study on the effective thermal conductivity of channel thermal insulation plate. Int. J. Heat Mass Transf. 2017, 106, 1097–1106. [Google Scholar] [CrossRef]
- Orlik-Kożdoń, B. Assessment of the application efficiency of recycling materials in thermal insulations. Constr. Build. Mater. 2017, 156, 476–485. [Google Scholar] [CrossRef]


| Bulk Density [kg/m3] | Porosity [m3/m3] | Heat Capacity [J/kgK] | Thermal Conductivity [W/mK] | Diffusion Resistance [-] |
|---|---|---|---|---|
| 115.0 | 0.96 | 850 | 0.04 | 4 |
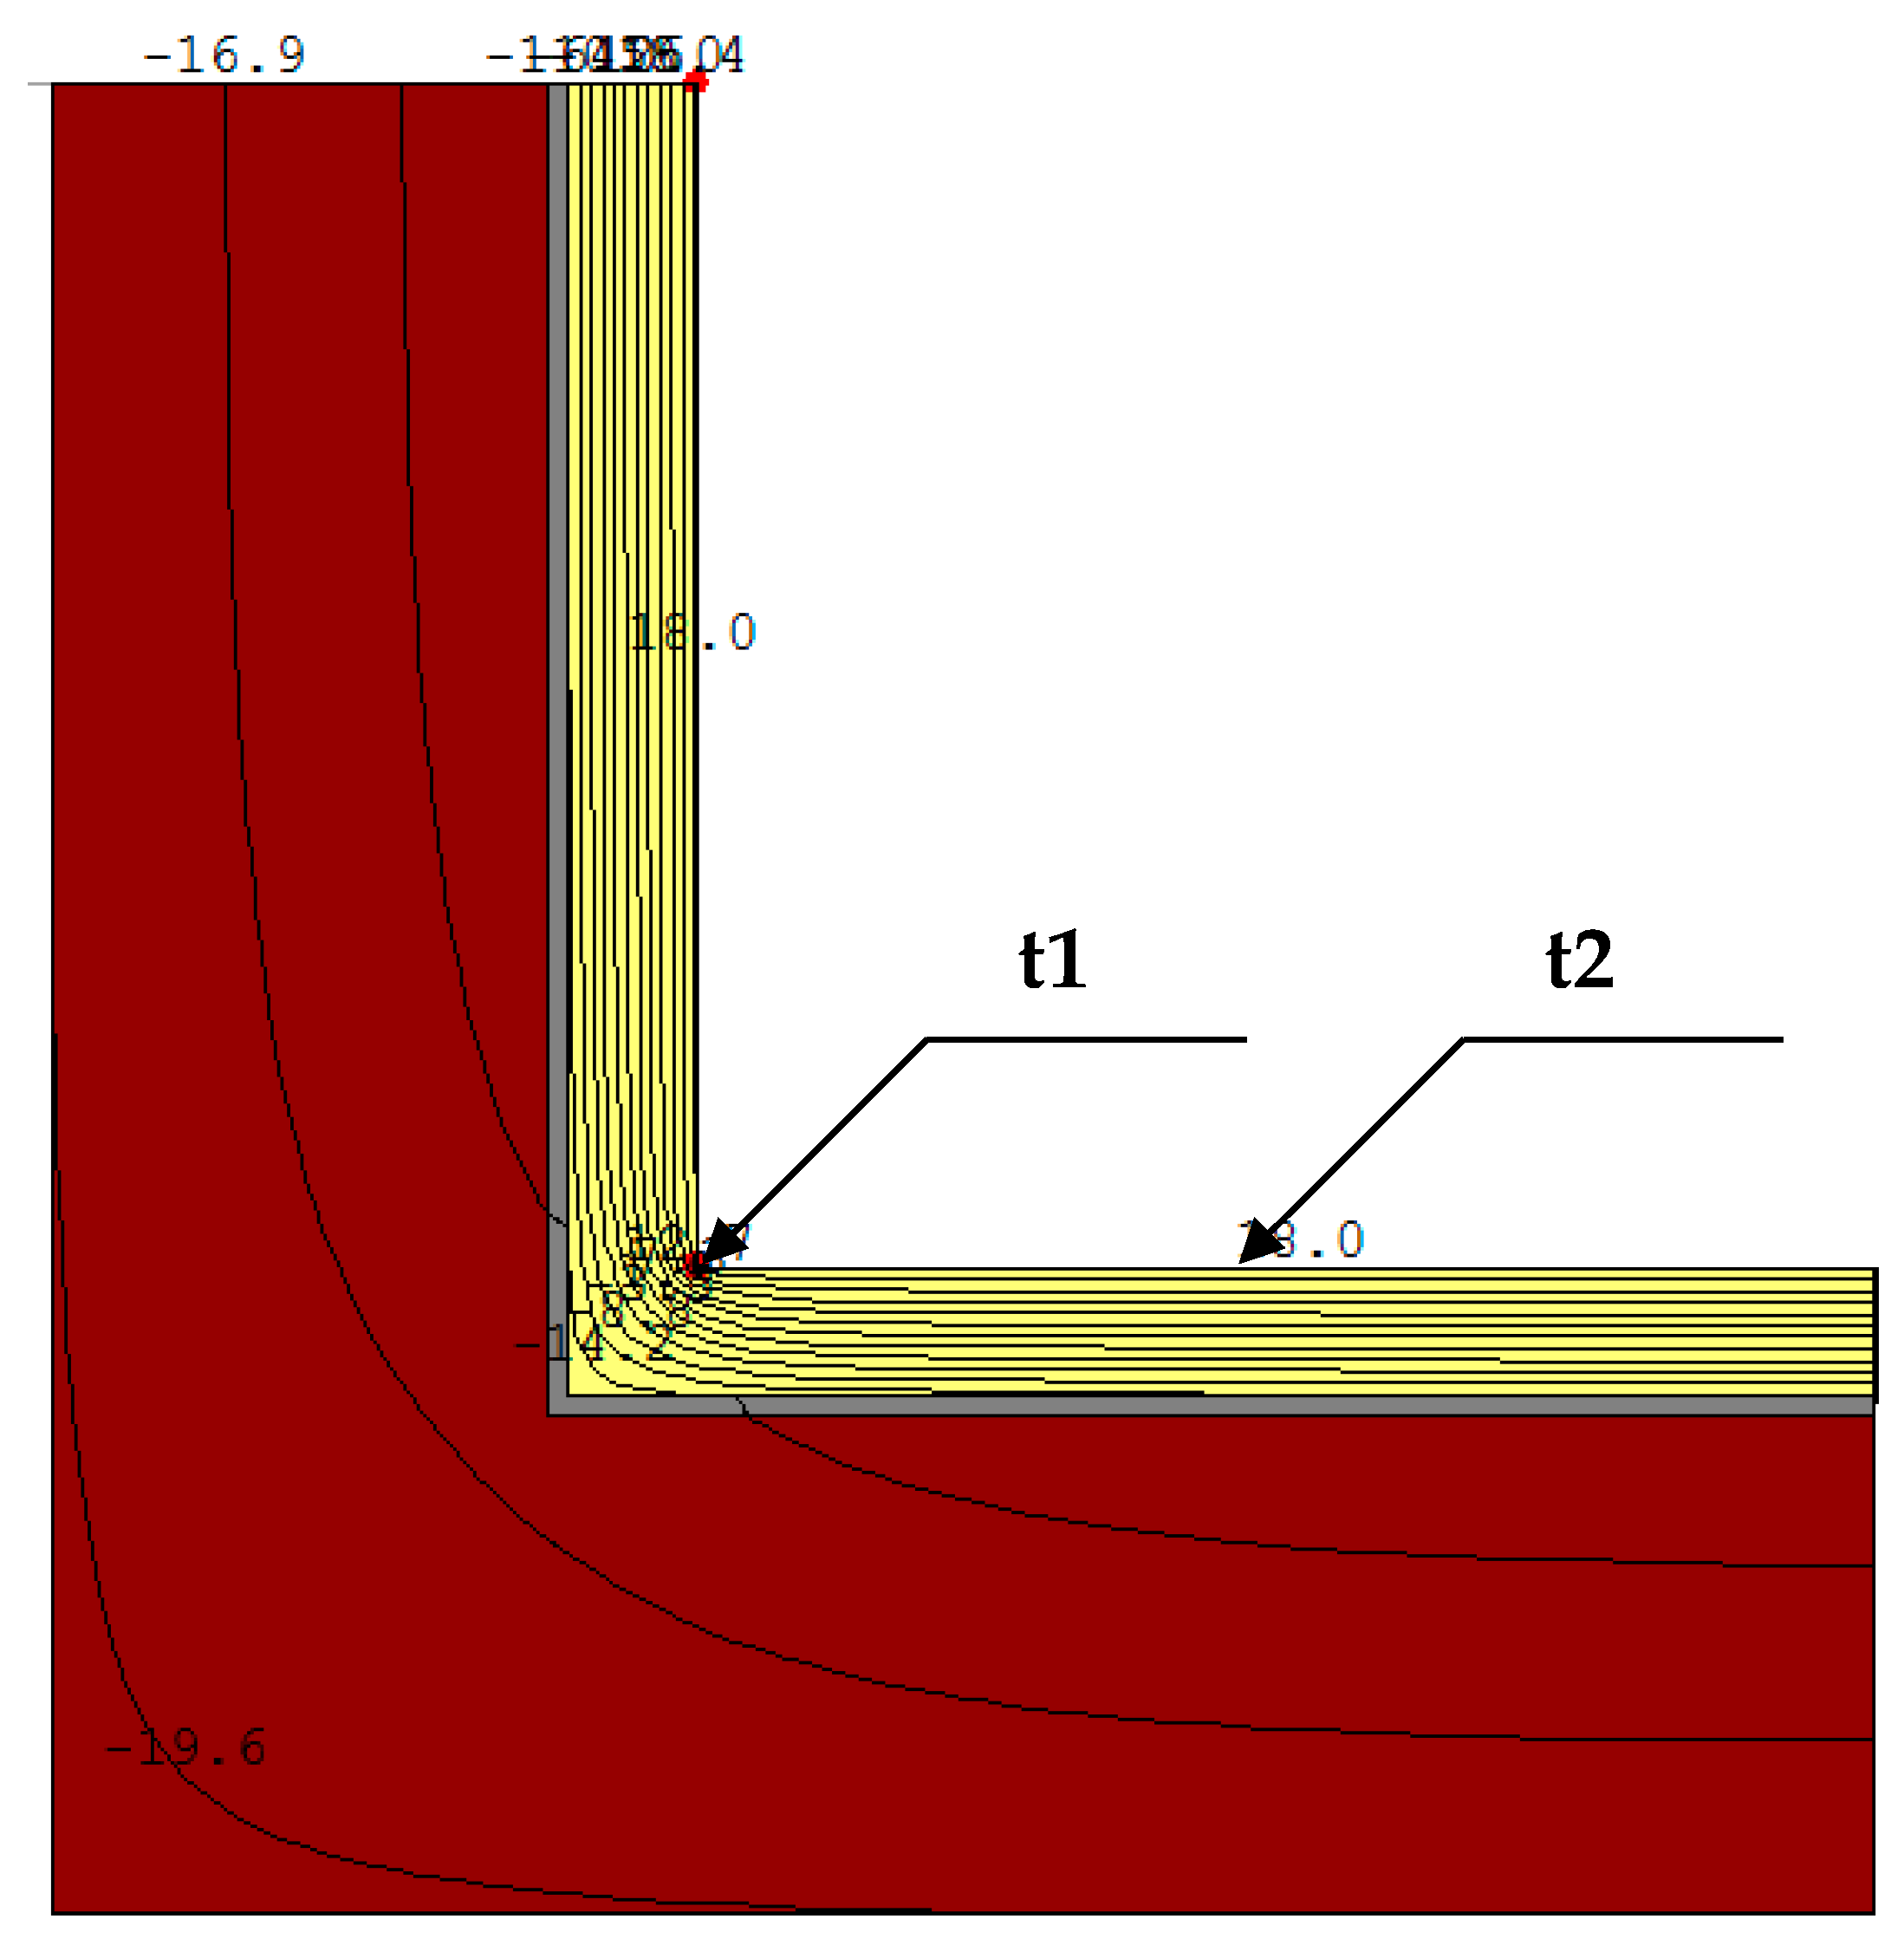
| Variant | θi [°C] | fRsi [-] | U1D [W/(m2K)] | L2D [W/mK] | ψi [W/mK] | ||
|---|---|---|---|---|---|---|---|
| Rsi = 7.69 | Rsi = 4 | ||||||
| A | t1 | 15.6 | 12.9 | 0.82 | 0.29 | 0.58 | 0.060 |
| t2 | 18.4 | 16.9 | 0.92 | ||||
| B | t1 | 17.4 | 17.2 | 0.88 | 0.29 | 0.010 | |
| t2 | 19.5 | 18.9 | 0.97 | ||||
| t3 | 16.9 | 16.8 | 0.92 | ||||
| C | t1 | 18.9 | 17.1 | 0.93 | 0.22 | 0.011 | |
| t2 | 14.9 | 13.9 | 0.85 | ||||
| t3 | 13.2 | 12.2 | 0.81 | ||||
| T [°C] | SPO1 | SPO2 | SPO3 | SPO4 | SPO5 |
| 22.0 | 22.7 | 22.1 | 16.7 | 18.1 |
| No | Material/Layer | R.H. [–] | µ [–] | λ [W/mK] | ρ [kg/m3] |
|---|---|---|---|---|---|
| 1 | Cement plaster | 0.8 | 25 | 1.2 | 2000 |
| 2 | Solid brick; historical | 0.8 | 15 | 0.60 | 1800 |
| 4 | Gypsum fiberboard | 0.8 | 16 | 0.32 | 1153 |
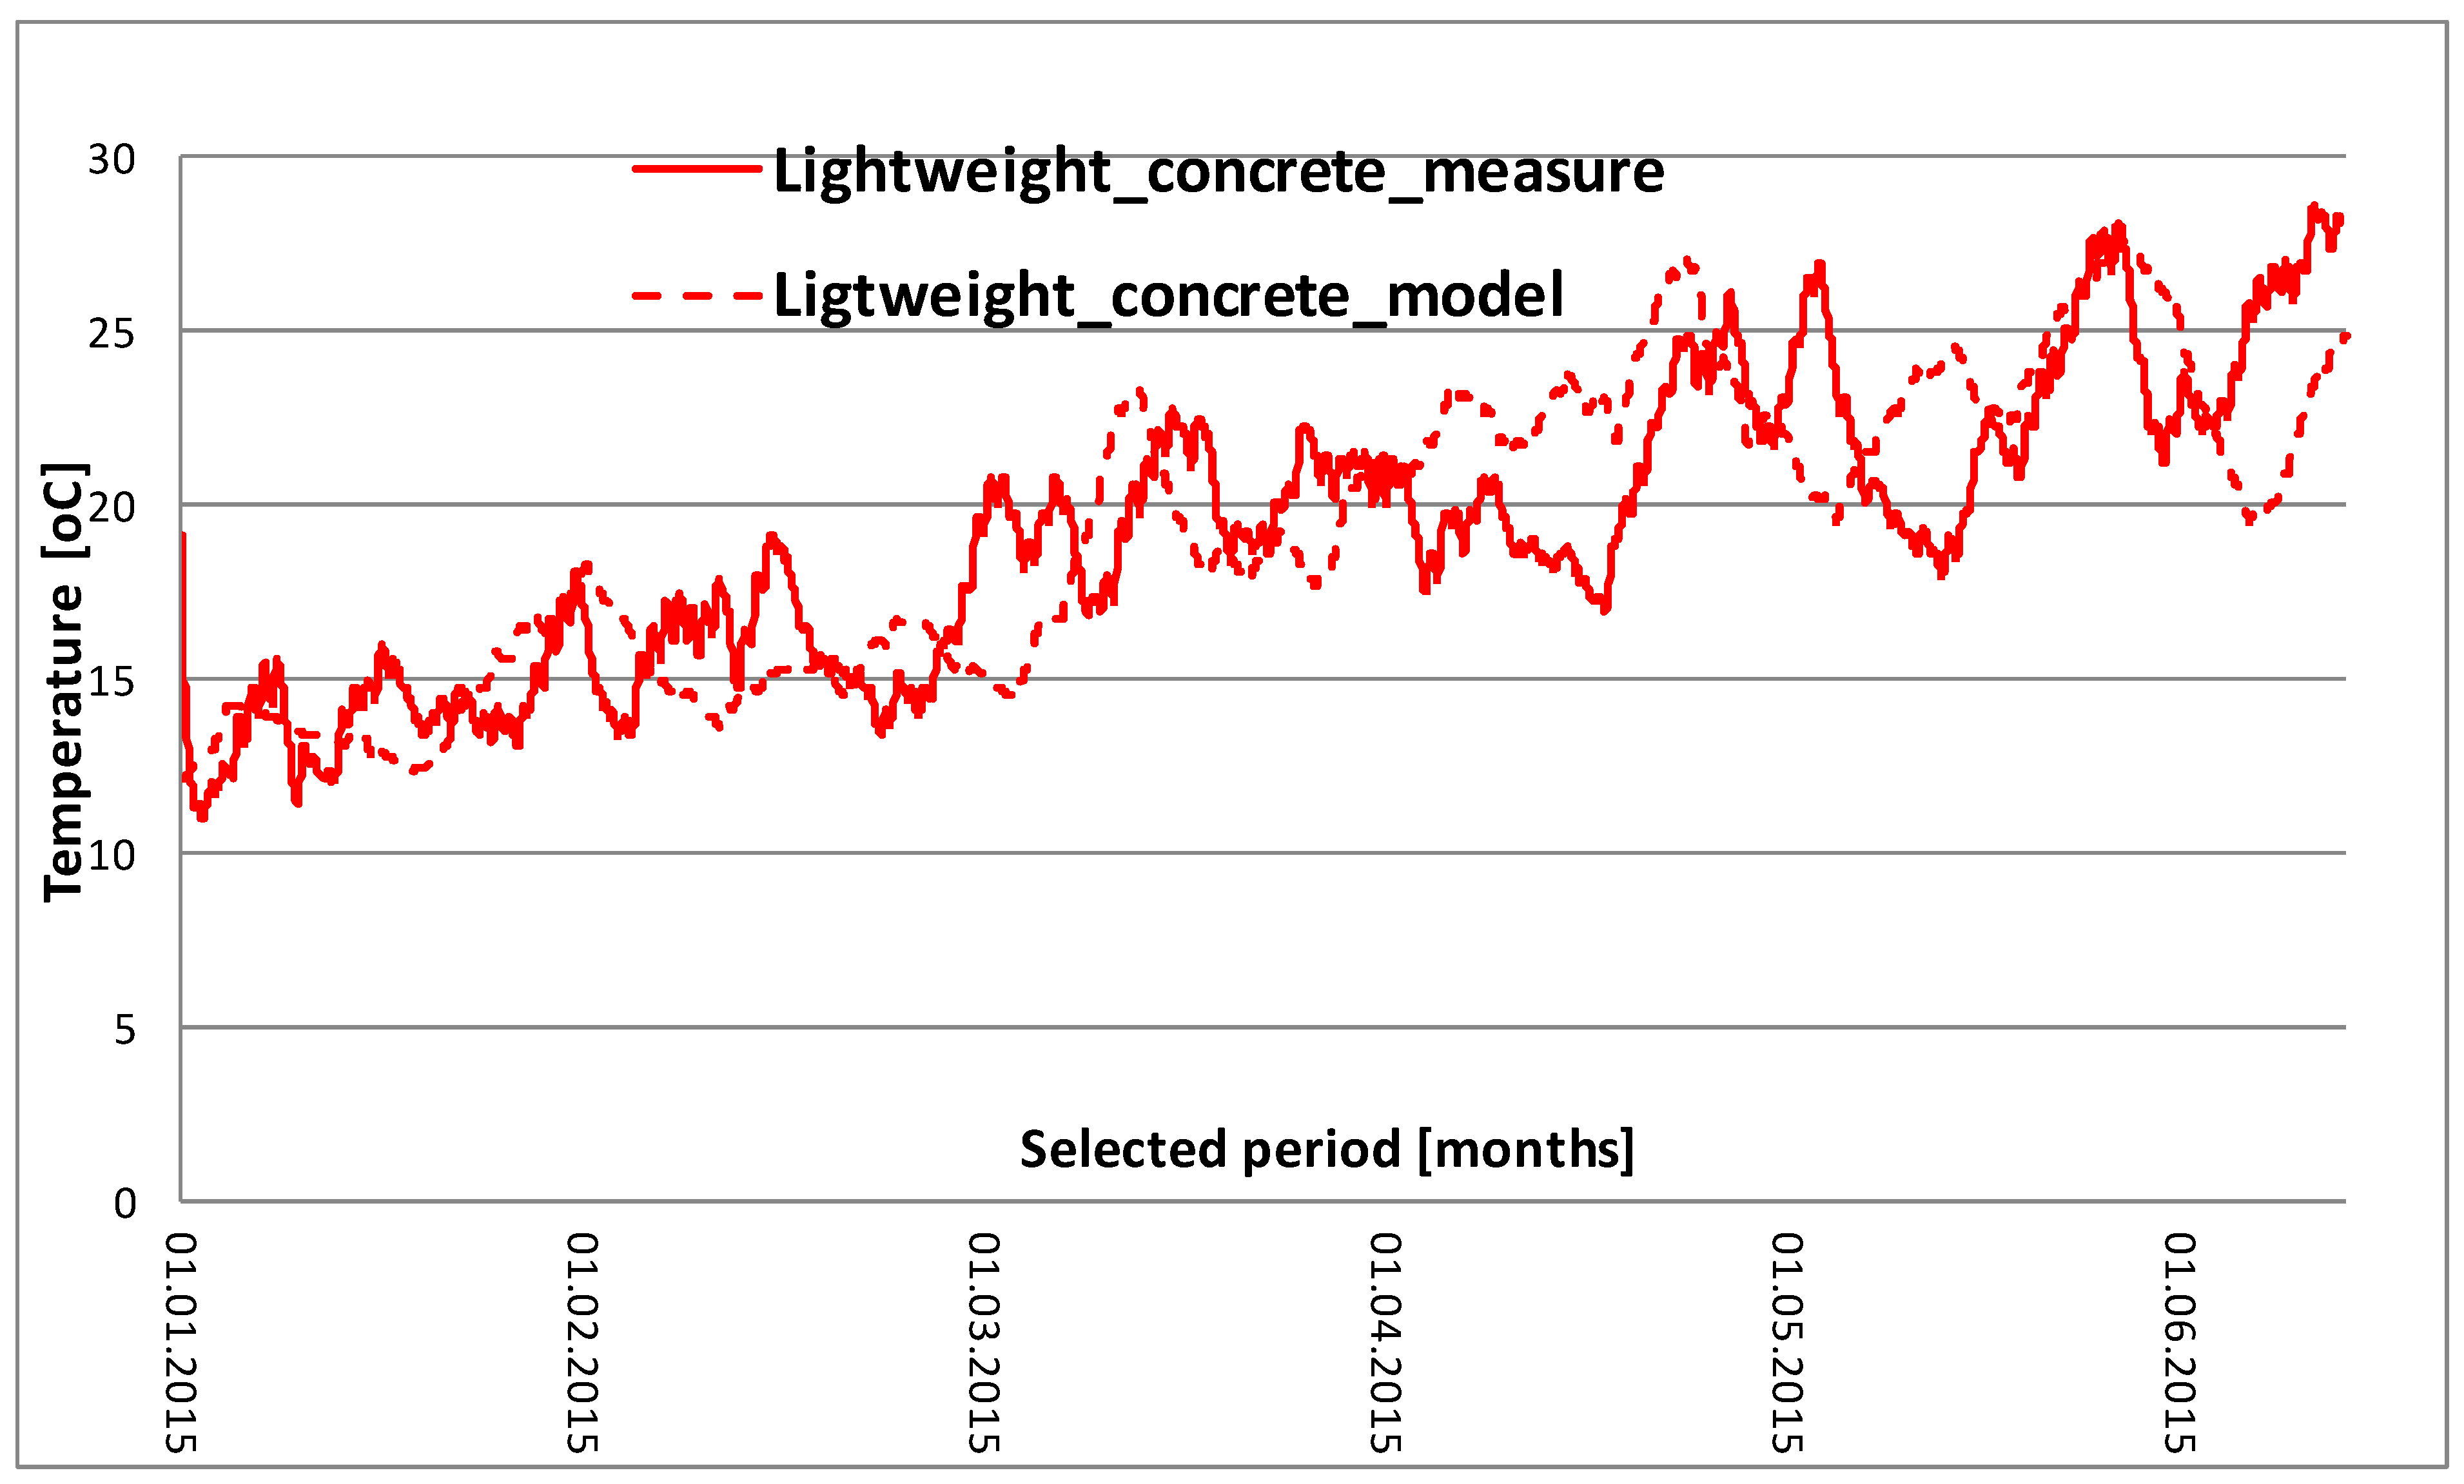
| 5 | Lightweight concrete (λ—0.042. ρ—115 kg/m3) | 0.8 | 4 | 0.04 | 115 |
| 6 | Wood | 0.8 | 200 | 0.13 | 650 |
© 2019 by the author. Licensee MDPI, Basel, Switzerland. This article is an open access article distributed under the terms and conditions of the Creative Commons Attribution (CC BY) license (http://creativecommons.org/licenses/by/4.0/).
Share and Cite
Orlik-Kożdoń, B. Interior Insulation of Masonry Walls—Selected Problems in the Design. Energies 2019, 12, 3895. https://doi.org/10.3390/en12203895
Orlik-Kożdoń B. Interior Insulation of Masonry Walls—Selected Problems in the Design. Energies. 2019; 12(20):3895. https://doi.org/10.3390/en12203895
Chicago/Turabian StyleOrlik-Kożdoń, Bożena. 2019. "Interior Insulation of Masonry Walls—Selected Problems in the Design" Energies 12, no. 20: 3895. https://doi.org/10.3390/en12203895
APA StyleOrlik-Kożdoń, B. (2019). Interior Insulation of Masonry Walls—Selected Problems in the Design. Energies, 12(20), 3895. https://doi.org/10.3390/en12203895