1. Introduction
As more large scale photovoltaic power plants (LS-PVPPs) are being installed, the electrical system can face some challenges related to four key areas: (i) active power control, (ii) reactive power control, (iii) voltage support and (iv) frequency support [
1]. Thus, many countries have updated their grid codes to permit a smooth interaction between these power plants with the transmission system. For instance, Puerto Rico requires that these PVPPs behaves similar to conventional power plants despite the intermittent conditions [
2]. Considering these changes on the grid codes there are two key aspects necessary to approach: active and reactive power control.
According to the grid codes presented by Puerto Rico, Romania, South Africa and Germany, the active power management for LS-PVPPs should consider: power curtailment, ramp rate control and active power reserves (
Figure 1) [
2,
3,
4,
5]. Power curtailment, also called as absolute control or limiting control, addresses the reduction of the possible active power that the power plant can generate during the day depending on the grid requirements [
6]. This requirement prevents overloading at peak generation hours of PVPPs (around midday) or also when the demand is lower than the possible generated active power from the PVPP. However, due to the intermittency of the solar source, ramp rate control is also necessary to be addressed [
7]. The aim of these ramp rates is to smooth the change from low to high solar irradiance and vicevesa, so the change does not affect the voltage or the frequency. As more LS-PVPPs are being introduced at the transmission system, the participation on frequency regulation is a new challenge. Thus, power reserve are already being considered in some of the grid codes. The power reserve is the reduction of the output power during some hours of the day. This reduction can oscillate between 10 to 20% of the maximum possible that the PVPP can generate [
1,
8].
There are two main techniques used to manage the active power: (i) incorporate energy storage, and (ii) new control strategies of the PV generator [
1]. In the literature, the main topology proposed is the use of the energy storage together with the PV inverter that are distributed along the PVPP [
9,
10,
11]. For instance, the study developed by Muller et al, proposes the use of ultracapacitors together with a central inverter to manage the power transients due to the variability of solar irradiance. In this study, the output power fluctuations are reduced and it helps to comply the grid code limits [
9]. Commonly, the management of the active power relays on the charge of the battery during high solar irradiance and the discharge in high peak demand [
12]. This type of control smooths the output power of the single PV generator during the day [
11,
13,
14,
15,
16,
17,
18,
19]. However, the incorporation of energy storage increases the cost of installation and operation of the LS-PVPP [
20]. An alternative solution is the improvement of the control by considering the characteristics of the PV generator. Commonly, the active power is managed by the maximum power point tracker (MPPT) which is part of the overall control of the PV inverter. However, the MPPT cannot withstand the power curtailment, the power reserve or the ramp rates. Therefore, this tracker should not only consider the maximum power point but also the reference of active power given by the transmission system operator (TSO). Some studies propose this method for multistring topologies (two stage inverters) used in small applications [
8,
21,
22]. However, these studies have not been applied for central inverters that are commonly used in LS-PVPPs [
23].
In the case of reactive power, the new grid codes require that the LS-PVPP injects or absorbs reactive power according to a predefined relationship between the active and the reactive power (power factor (
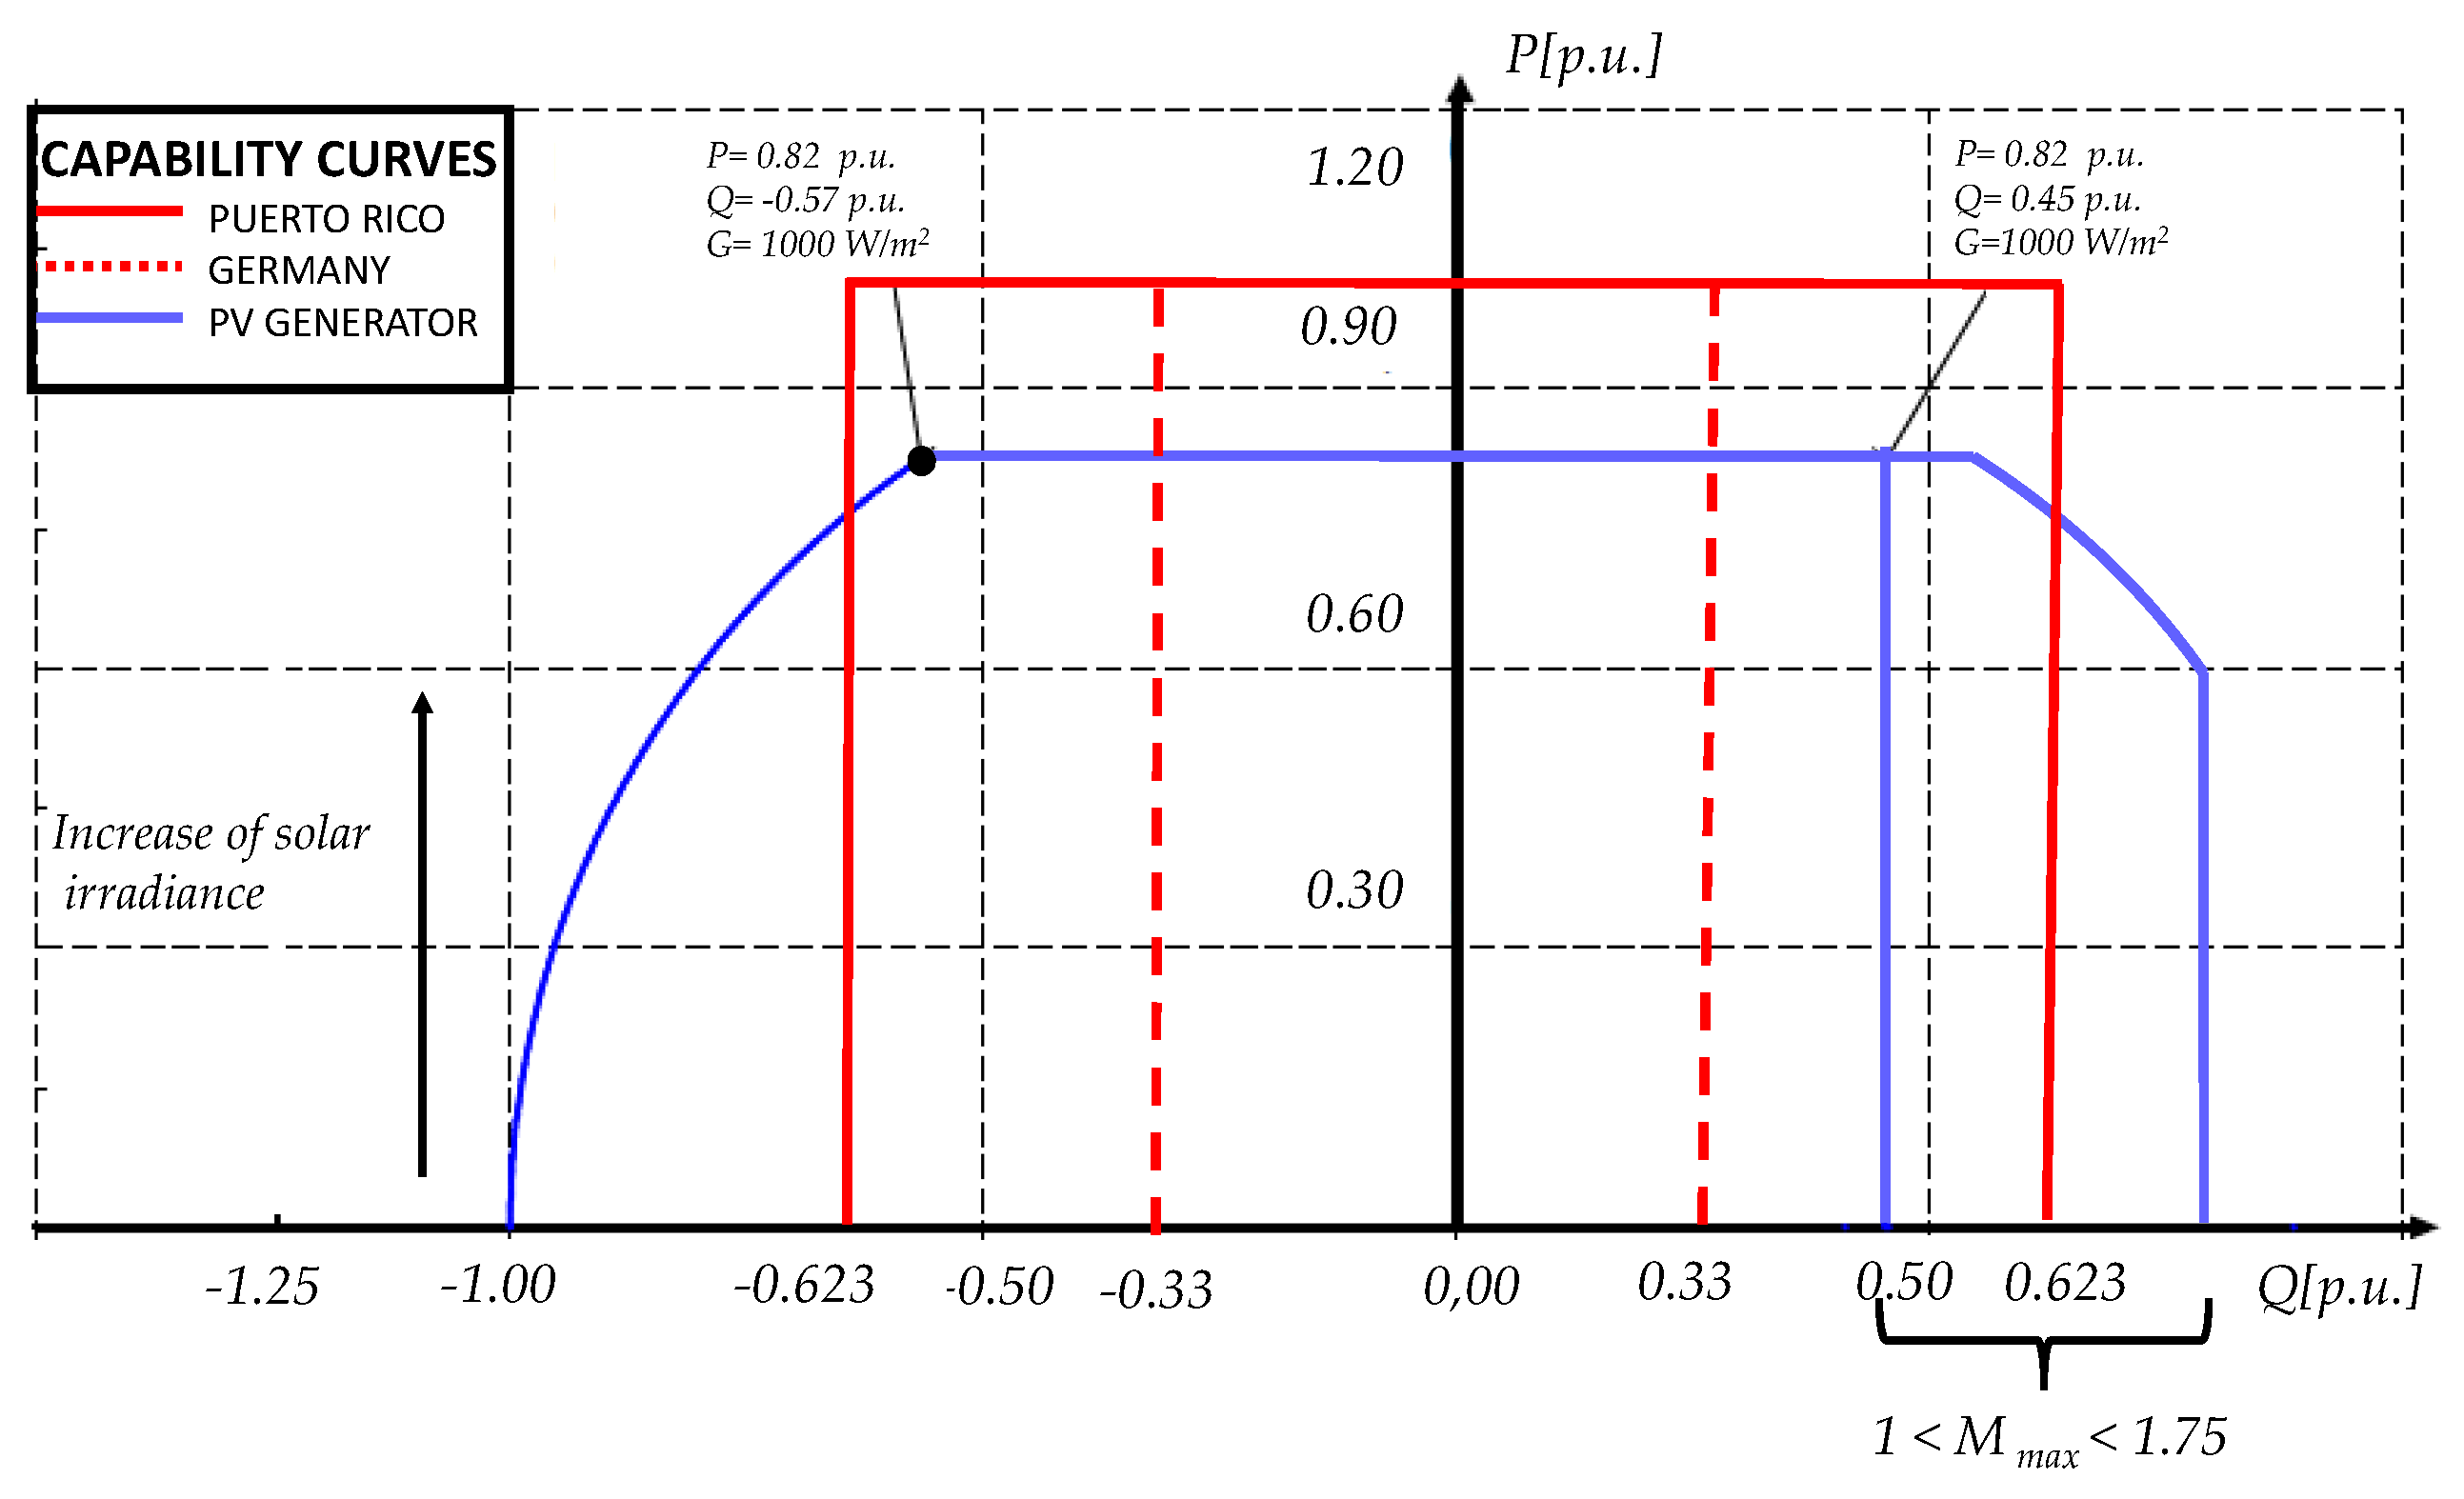
)) or an specific value of reactive power. The grid codes presented by China, Germany, South Africa, Romania, and Puerto Rico requires that the LS-PVPP works under an specific capability curve (
Figure 2). From this curve, it can be seen that Puerto Rico has the strictest requirement (
p.u). Meanwhile, China, Germany, Romania and South Africa require a maximum reactive power close to
p.u. To comply these grid codes, commonly STATCOMs or capacitors are added at the point of common coupling (PCC), as it is explained in [
24]. However, limited research has been developed regarding the reactive power control of PV generators in LS-PVPPs without using extra equipment. For instance, Rakibuzzaman et al. [
25] explain the control of reactive power and how the capability curve could influence in the response, but, the variation of ambient conditions is not considered on this approach. Additionally, R. Varma et al. and L. Luo are working on the control of LS-PVPPs as STATCOM to support the grid when power oscillation occurs [
26,
27]. However, it considers the remaining inverter capacity and depends on the solar irradiance behavior. From a general point of view without any specific source of energy, new types of reactive power control for grid tied inverters have been presented in [
28,
29]. These studies do not take into account the variation of solar irradiance during the day or the corresponding capability curves of the PV generator. It is worth to point out that the control of reactive power in a LS-PVPP has not commonly been developed considering the capability curves. There are four main parameters that characterize these curves: (i) modulation index, (ii) dc voltage, (iii) solar irradiance, and (iv) ambient temperature, as it is explained in [
30,
31]. From this research, it can be understood that the variation of the dc voltage and the modulation index can help to have the complete curve despite the variation of ambient conditions. Although, this can reduce the active power generated by the PV generator.
Thus, the objective of this paper is to propose a control of active and reactive power for a PV generator applied in LS-PVPPs for grid code compliance. In this paper, the PV generator has a three phase central inverter (one stage of inversion). To control the active power, two main targets are accomplished: (i) Power curtailment, and (ii) Power reserves, by using an adaptation of the Maximum Power Point Tracker (MPPT). For the reactive power control, two considerations are addressed: (i) preference of active over reactive power and (ii) preference of reactive over active power. For this control, the instant capability curves are considered by the adjustment of the dc voltage and the modulation index depending on the solar irradiance and temperature that affects to the production of active power. To validate this study, a LS-PVPP is modeled and simulated in DIgSILENT PowerFactory
under different ambient conditions. The paper is structured as follows:
Section 2 explains the configuration and the control structure of a PVPP. The active power control is explained in
Section 3, meanwhile the reactive power control is detailed in
Section 4. Then, the simulations and the results are presented in
Section 5. Finally, the discussion and the conclusions are in
Section 6 and
Section 7 respectively.
2. Configuration and Control Structure
In a LS-PVPP, tens to hundreds of PV generators are interconnected through a collection grid in order to increase the power. ABB, SMA, Danfoss, and First Solar have described some topologies for this distribution as radial, ring and star [
23]. The main difference among them is the reliability and the cost [
32]. In the current paper, radial configuration is considered as it is the most used topology. In the case of the PV generator, the configuration can be central, string or multistring. The most used configuration is the central one where the PV array is interconnected to a single stage inverter [
33,
34]. Then, the inverter is connected with a three winding transformer (
Figure 3).
As many PV generators are interconnected in a LS-PVPP, a central controller is necessary. Additionally, each PV generator has to perform its local control. Thus, a hierarchical control architecture is considered, as it is illustrated in (
Figure 4), where the first stage is the transmission system operator (TSO) who sends the requirements, then the second stage is the power plant control (PPC) and the third stage is the PV generator’s local control.
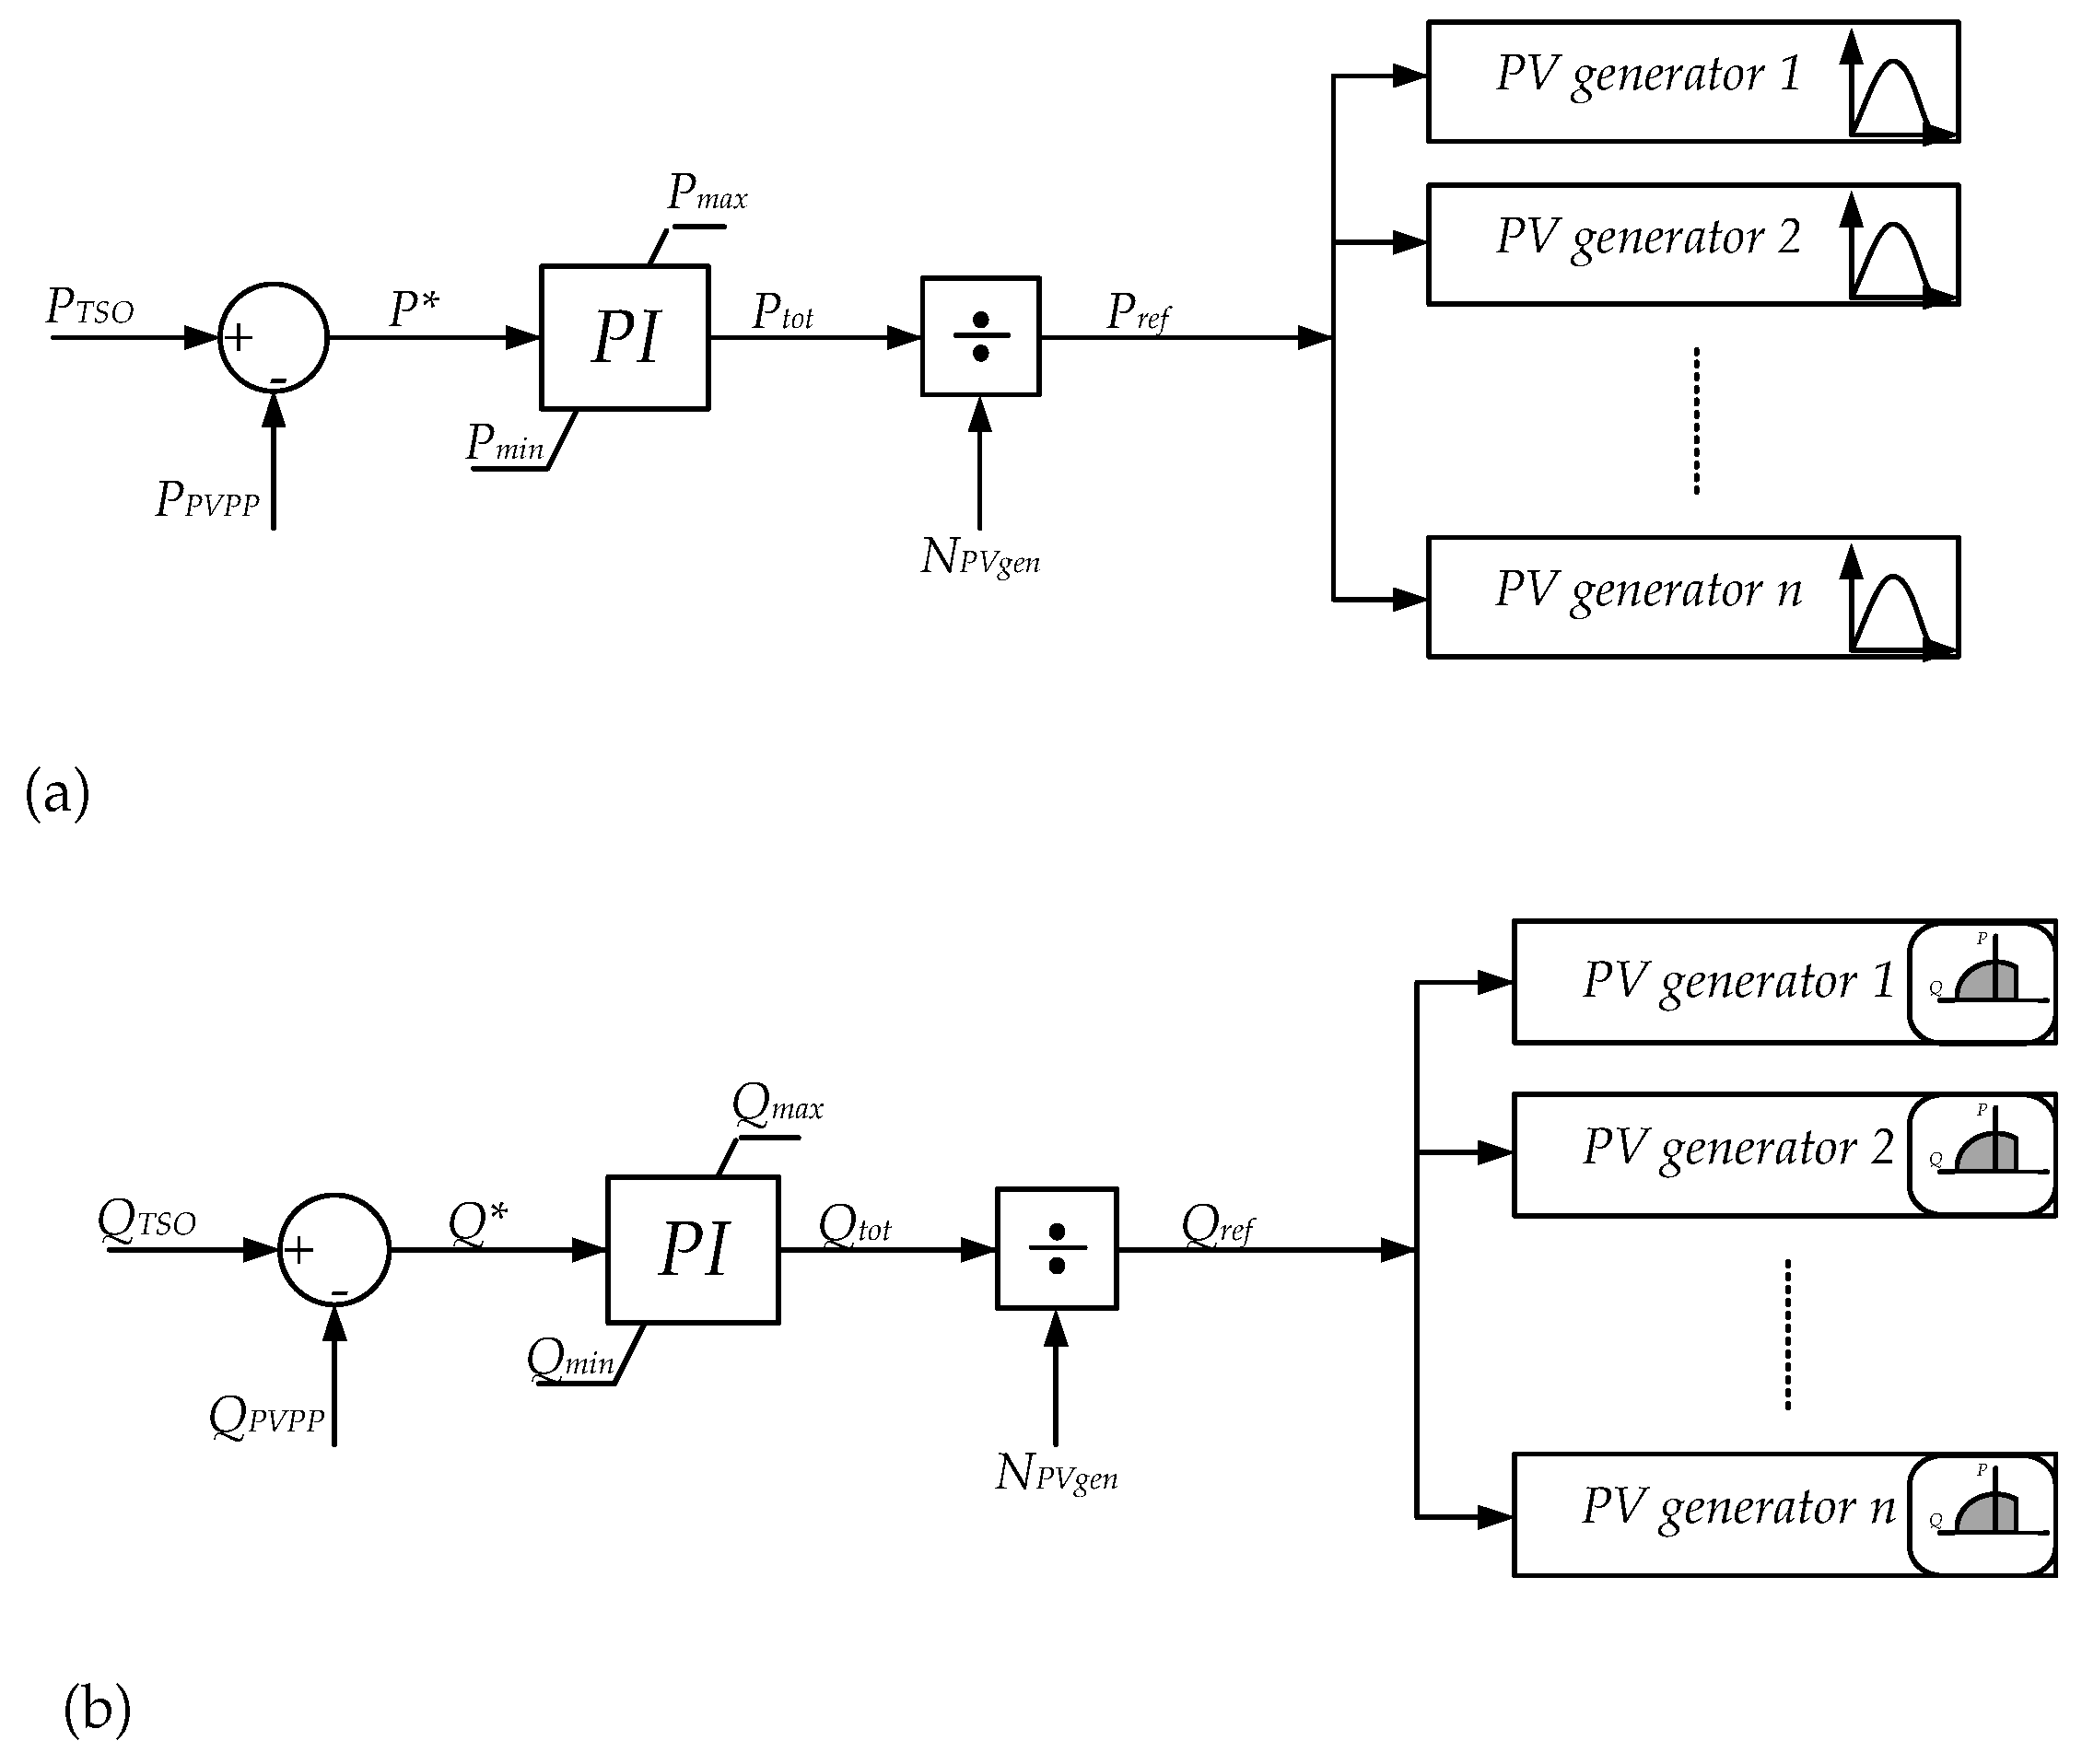
The control of the LS-PVPP is focused in two main tasks: (i) apply grid support actions, for example in case of disturbances, and (ii) coordinate the control of active and reactive power according to TSO’s requirements [
11,
24]. For the second task, the PPC uses a Proportional-Integral (PI) controller to reduce the error between the reference given by the TSO and the power available in the grid. Then, the total active or reactive power calculated by the controller is divided by the total number of PV generators in the LS-PVPP and this is the reference value under which the PV generators should respond (
Figure 5) [
24,
32]. After these references are calculated, the PV generator develops its corresponding control according to grid code requirements and the behavior of the internal grid to keep ac voltage and frequency constant.
A general control structure of a PV generator is illustrated in
Figure 6. The PV generator has three main tasks: (i) MPPT, (ii) the inverter control, and (iii) the control of active and reactive power. For the first task, the MPPT, the aim is to look for the
at each solar irradiance and temperature according to the P-V curves characteristics. To address this, algorithms as perturb and observe, hill climbing, incremental conductance as the more known and others as fuzzy control and swarm optimization have been developed [
35,
36].
The second task, it is the one in charge of the general inverter control to interconnect the PV generator with the internal grid of the PVPP. This control performs the grid synchronization, the voltage modulation, the dc voltage regulation and the current loop. The third task, it is in charge of the delivering of the power demanded by the PPC. This control should consider the PQ capability curves of the PV generator analysed in [
30] and the variation of ambient conditions as solar irradiance and ambient temperature.
4. Reactive Power Control
The P-Q curves of a PV generator depends not only on the variation of solar irradiance or temperature but also on the dc voltage applied at the terminals of the PV arrar or the modulation index as part of the internal inverter control. In
Figure 14 can be seen the variation of these parameters and how they affect to the P-Q curve.
These curves obeys to the following expressions:
Taking into account this P-Q curve, this section presents a novel control to provide reactive power depending on the grid code requirements. In this case, the reactive power control is set as a priority (
Figure 15). This control reads the reference of reactive power given by the plant operator. If the reactive power control is not a priority, the control is developed with a conventional reactive power regulation. But if the reactive power is set as a priority, then the PV generator has to calculate the maximum possible reactive power (
) by taking into account the capability curves studied in [
30] and the variation of ambient conditions.
The performance of the control will vary depending if it is absorbing or injecting reactive power.
4.1. Absorption of Reactive Power
For the absorption of reactive power, the area of operation is in the fourth quadrant of the PQ capability curve. The maximum limitation of the reactive power varies according to:
where, the
is the maximum active power that the PV generator can supply at that instant. For a given reference of absorbed reactive power
, the control evaluates if this is higher than the
at each instant. If it is higher, then the PV generator has to reduce the injection of active power by the variation of dc voltage. So, the PV generator is not working any longer at MPP instead will be working in other point of operation of active power. The RPPT control should again track the reference of active power calculated due to reactive power reference. Every time the solar irradiance changes, the control has to track the reactive power point by the variation of active power. This control will be called as the reactive power point tracker (QPPT).
This behavior is illustrated in
Figure 16, where the first point is for a given solar irradiance (A). At this point, the active power that the PV generator can supply is
. On this instant, a reference of reactive power is given to the generator’s control. However, with this power the
is lower than the reference. Thus, a new reference of active power is calculated (
). To achieve this point, the dc voltage has to change from
to
so the PV generator starts to work at point B. Then, the generator can supply the value of reactive power equal to the reference (point 3). In the case the solar irradiance changes a new PV curve is generated (blue line), because of the dc voltage value, the new active power is
and the PV generator starts to work in point C (PV curve) and 4 (PQ curve). As the RPPT control has to follow the reference of reactive power, then the dc voltage reduces to reach the reference (Point D and point 3).
4.2. Injection of Reactive Power
For the injection of reactive power, the area of operation is in the first quadrant of the PQ capability curve. The maximum limitation of the reactive power varies according to:
where, the modulation index (
M) varies between 0 and 1. The maximum possible reactive power for a given solar irradiance, temperature and
is when
M is equal to 1. In order to increase this value of reactive power, the modulation index can be higher than 1 but it can cause the increment of harmonics [
37].
In the case, the PPC asks a reference higher than
, the control should manage in one hand the dc voltage to reduce the active power and on the other hand the modulation index. This behavior is illustrated in
Figure 17, where the first point is for a given solar irradiance (A). At this point, the active power that the PV generator can supply is
. In this instant, a reference of reactive power is given to the generator’s control. However, with this power the
is lower than the reference. Thus, a new point of operation is calculated. First, the maximum modulation index varies to a higher value in order to increase the operation area. So, the maximum possible reactive power that the PV generator can inject increases. Then, to reach this point of operation at the specific reference of reactive power, the generated active power is reduced (
). To achieve this point the dc voltage has to change from
to
and the PV generator starts to work at point B. The corresponding algorithm that follows the logic illustrated in
Figure 18.
The control of active and reactive power is tested for different scenarios. These tests and the performance of the control are explained in the following section.
5. Simulation and Results
A LS-PVPP of 24 MW is designed and modeled in DIgSILENT PowerFactory
and has the configuration presented in
Figure 19. For the current study the results for a single PV generator are presented. The main characteristics of the PV generator are summarized in
Table 1. The design of this power plant was developed according to the solar irradiance and temperature data taken from Urcuqui-Ecuador in 2014. Besides, the inverter has been oversized 20% of the maximum active power capacity of the PV array. Each PV generator has a nominal power capacity of 0.6 MVA.
Two cases studies are considered: (i) testing the active power control (case study A) and (ii) testing the reactive power control (case study B). For each type of control, the PPC is the one that sends the references of active or reactive power to the local controller. For these tests, three days are chosen with different solar irradiance and an ambient temperature around 10 °C to 25 °C (
Figure 20).
5.1. Case Study A
For this case study, three different active power values are set as references during the day:
Set a power reserve of 20% of the maximum power capacity from 6:00 to 10:00 and from 15:00 to 18:00.
Set a power curtailment of 50% of the maximum capacity from 10:00 to 15:00.
Deactivate the power curtailment to reach the maximum power point during 10 min (11:25 to 11:35).
The test is developed for day one and two, and the results are illustrated in
Figure 21. For any of the days tested, the control of active power makes possible to keep the power reserve equal to 20% of the maximum power capacity for active power higher than 0.20 p.u. When the generated active power is lower than 0.2 p.u, the power reserve is not reached and instead is equal to the maximum possible.
However, in the case of power curtailment, there are some differences between the first and the second day. In day 1, the active power reference is reached easily with the control due to the sufficient solar irradiance. On day 2, however, the new reference of power is only reached during ten minutes in the morning and eighty minutes in the afternoon. This behavior is because of the drastic changes of solar irradiance during the day.
The deactivation of the power curtailment in order to get the maximum power during ten minutes is successful in day 1 and day 2. It is important to notice that due to the MPPT control, the ramp rate to get the maximum power is 0.05 MW/min on day 1 and 0.026 MW/min on day 2.
5.2. Case Study B
In this case study, the reactive power control is tested considering the solar irradiance of day 3. To understand the performance of this control, some tests are developed: (a) active power priority and (b) reactive power priority.
5.2.1. Active Power Priority
In this case, the normal MPPT control is used during the day as it is illustrated in
Figure 22. Taking into account this control, the maximum reactive power that the PV generator can absorb is illustrated in
Figure 23 together with the operational area. It can be seen, that the maximum reactive power that the PV generator can absorb is variable in the time as it is not a priority. The reactive power varies from 0.6 pu to 1 p.u depending on the time of the day.
In the case that a reference of absorbed reactive power is required (
p.u) by the PV generator and the MPPT is still used, the response of it is illustrated in
Figure 24 together with the operational area. With these conditions, the PV generator can follow the reactive power reference between some hours (06:00 to 08:00 and 15:00 to 18:00). However, when the active power exceeds a certain value, the PV generator cannot follow the reference of reactive power.
For a
p.u, the PV generator can inject the reactive power depending on the voltage limitation and the modulation index. A modulation index of 1 and 1.75 is tested and illustrated in
Figure 25 and
Figure 26 respectively together with their operation area. When the modulation index is 1, the reactive power is equal to 0.45 p.u for any solar irradiance. Meanwhile, when the modulation index is 1.75, the reference of reactive power is reached from 07:00 to 10:00 and from 13:30 to 18:00. However, from 10:00 to 13:00, the reference of reactive power is not reached. Instead, the maximum possible reactive power is injected, which depends on the solar irradiance. The curve that limits its behavior from 10:00 to 13:00 is the current curve, for the rest of the day it is the voltage curve.
5.2.2. Reactive Power Priority
To test this control, two references of reactive power are simulated: (i)
p.u and (ii)
p.u For the first reference (absorption of reactive power), the results of active and reactive power are illustrated in
Figure 27 with the corresponding capability curve. In this case, the PV generator absorbs a value of reactive power equal to its reference almost all the time. Due to the changes of irradiance and the response time of the control, there are specific times where there is an error around 0.05 p.u. Because of the control and the ambient conditions, the active power is limited to 0.6 p.u between the hours 08:00 to 13:00.
For the second reference (injection of reactive power), two different modulation index are tested: (i)
and (ii)
(
Figure 28 and
Figure 29). When
, the reactive power cannot reach the reference of reactive power and stays at the maximum value (0.45 p.u). In the case
, the PV generator injects a reactive power equal to the reference during all the time by the reduction of active power from 09:00 to 13:30.
6. Discussion
From the controller presented in this paper and from the obtained results, some important issues are necessary to be addressed:
6.1. Active Power Control
The control of active power in a suboptimal point (lower than the MPP) can be developed with a RPPT control. The PV generator can supply power according to an active power reference. The response, however, depends as well on the solar irradiance fluctuations during the day. For instance, on the second day, between 14:00 to 15:00 quick solar irradiance variations are presented and the control tries to respect the 20% of power reserve but the control does not follow this reference.
6.2. Reactive Power Control
For the injection or absorption of reactive power, the response also depends on the solar irradiance when the active power generation is a priority. It can be stated that with a maximum active power, there will be a maximum reactive power that can be injected or absorbed depending on the capability curves. Because of this, if a reference of reactive power is set and at the same time the active power control is a priority, the reference will be reached only if it is lower than the maximum reactive power point possible at that instant. In the case that the reactive power is a priority and there is high solar irradiance, the reference of reactive power can be reached only if the active power point changes to other point of operation lower than the MPP.
It is important to notice that for injection of reactive power, the variation of this value does not present large fluctuation as it depends on the changes of dc voltage together with the modulation index. If the maximum modulation remains fix, then the reactive power that the PV generator can inject also remains close to a fix value. However, this value could be lower than the reference set by the control. Therefore, a change of modulation index helps to achieve the reference of reactive power asked by the PPC.
6.3. Compliance of Grid Codes
Considering the response of the PV generator for the different scenarios for reactive power, it can be analised if the requirements of the grid codes can be achieved under different scenarios.
Figure 30 illustrates the capability curve given by the PV generator together with the capability curve required by Puerto Rico and Germany for steady state conditions.
When QPPT is utilized, the PV generator can inject or absorb reactive power according to the requirements but the active power generated could be lower than the MPP. For absorbed reactive power, if the reference is 0.623 p.u, then the new reference of active power should be 0.78 p.u. For the injection of reactive power, the modulation index has to be higher than 1 to comply this reference.
However, when the reactive power is not set as a priority then the requirements asked by the grid code of Puerto Rico cannot be accomplished for higher solar irradiance and maximum modulation index of 1. So, new equipment should be installed in order to give reactive power support as STATCOM, capacitor banks, FACTS. However, for the case of Germany, at any irradiance the PV generator can supply or inject the reference of reactive power as it is lower than 0.57 p.u without making any change on the operation of active power or the modulation index.
Additionally, it can be seen that for an active power generated lower than 0.78 p.u (corresponding to G = 900 W/m), the PV generator can absorb or inject reactive power higher than the limitations imposed by the grid codes without reducing the generated active power. Thus, it is necessary that the Grid codes will consider the effect of the PV generator performance at different solar irradiance, temperature, dc voltage and modulation index in order to set higher limitations and improve the performance of the LS-PVPP.
7. Conclusions
This paper has presented the control of active and reactive power for a PV generator considering its capability curves variation applied in a large scale photovoltaic power plant. For this purpose, the current paper has presented the general configuration and control structure used commonly in a LS-PVPP. Then the active power control for a PV generator has been presented considering active power curtailment and active power reserves. Additionally, the control of reactive power was also studied under two different considerations: active power priority or reactive power priority taking into account the corresponding capability curves. Finally, DIgSILENT PowerFactory was used to simulate the control proposed under different conditions. From the control developed and the simulation some conclusions are presented.
The quick variation of solar irradiance affects not only to the active power response but also to the reactive power. When the solar irradiance is high, then the reactive power capability is reduced. Besides, this could disrupt the plant with quick variations of reactive power, this can be reduced with an appropriate control of the reactive power.
The modulation index and the dc voltage value play an important role on the point of operation of the PV generator when reactive power is injected. For an appropriate control the maximum modulation index can vary between 1 to 1.75 to comply grid code requirements.
The capability curves play an important role in the control of the PV generator when active and reactive power control are considered. These curves should be taken into account for each solar irradiance, ambient temperature, dc voltage and modulation index. The reactive power reference can be achieved by the consideration of these capability curves together with the control.
Considering the grid code requirements regarding the management of active power, it can be stated that working with RPPT for a given reference helps to comply the basic requirements as power reserves and power curtailment. However, a deeper study on ramp rate control must be developed considering variable solar irradiance. In the case of reactive power, grid codes should also consider the behavior of the PV generator according to ambient conditions in order to set the limitations.


 ,
, 


