1. Introduction
Nowadays, the world faces serious challenges, such as global warming, air pollution, and shortage of natural resources, that must be addressed in order to ensure sustainable development of the human race. Since renewable energy sources do not pollute the atmosphere, nor do they depend on the availability of fossil fuels, their usage may help to alleviate (or even eliminate) these problems. Within the last 10 years, the worldwide renewable capacity grew from 1.061 TW to 2.179 TW [
1]. According to the projections made by the International Energy Agency (IEA), renewable power will amount to 40% of the total energy production by 2040 [
2]. Nonetheless, in order to achieve the renewable energy goals successfully, many serious problems must be resolved in the near future. Due to the unpredictable and variable nature of renewables, integration of the high shares of renewable power will require having a great deal of flexibility from the energy systems.
The balance between supply and demand in the grid is traditionally achieved by adjusting the power output of conventional generating capacity or by regulating the power consumption on the demand side. The demand side regulation, or demand response (DR), can be obtained through establishment of economic incentives and installment of proper infrastructure [
3]. Nowadays, various types of DR programs are utilized by independent system operators (ISOs) to offer incentives stimulating reduction in electricity consumption during contingency periods or when electricity prices are high. In this regard, the utilization of DR programs can benefit both the electricity consumers and ISOs.
Proper introduction of renewable power and DR into the energy market and grid system infrastructure demands revision of traditional operational approaches with considerable emphasis on reliability and adequacy [
4]. Conventional adequacy assessment methods used by the grid system operators can be divided into deterministic and probabilistic approaches. The deterministic approach sets the power system reliability criteria such that the system is capable of withstanding a single contingency (N-1) or a k number of contingencies happening at the same time (N-k). Purely deterministic security criteria do not consider random processes taking place during the grid operation. Implementation of deterministic security criteria is relatively simple and straightforward; thus, it is quite popular among ISOs all over the world [
5]. As opposed to deterministic criteria, the probabilistic security criteria are more complex, requiring thorough statistical data, such as availability of power generating units and transmission lines, load and renewable forecast errors, etc. The advantage of probabilistic security criteria in comparison to deterministic criteria lies in its ability to quantify the likelihood and significance of existing uncertainties relative to the adequacy of a power system [
6].
The probabilistic power system adequacy assessment is gaining more attention with the growth of renewable generation. Various adequacy assessment studies that take into account renewable power have been presented in the last few years [
7,
8,
9,
10,
11,
12,
13]. Most of these studies consider random events either by imposing an upper bound to reliability indices determining the loss of load or loss of energy expectation, or by adding a financial penalty into the cost function. For example, reference [
9] proposes a hybrid reliability criterion by setting an upper limit to the loss of load probability (LOLP) and expected load not served (ELNS). The authors calculate LOLP and ELNS by considering only the single- and double-outage events. Although setting a target value to risk indices can lead to reduction in computational intensity [
10], models with bounded reliability metrics may fail to find a globally optimal solution. References [
11] and [
12] propose methodologies, where estimation of spinning reserve requirements is conducted using cost–benefit analysis. The methodologies find the optimal spinning reserve requirements by minimizing the total system costs, i.e., the unit operating expenses and the cost of load curtailment. However, both studies model the energy systems as an isolated entity; thus, cannot be applied to the multi-area power grids. A similar approach based on the cost–benefit analysis has been proposed in [
13]. The methodology considers uncertainties due to the load and wind forecast errors and employs the equivalent assisting unit method to account for inter-zonal power flows, yet this approach considers only the wind power as a source of renewable energy. In reference [
14], the authors propose a method to calculate the spinning reserves in systems with renewable energy sources. The computational efficiency of the method is achieved by application of the cross entropy (CE) concept. The main idea of CE is to modify the outage replacement rates (ORR) of the system components based on their importance in terms of the system reliability. The uncertainty associated with renewable generation is taken into account by a multi-state short-term Markov model and a capacity factor. The Markov model captures random outages of renewable generators, whereas the capacity factor captures intermittency of a primary energy source. The method mainly focuses on reliability aspects rather than spinning reserve optimization. Reference [
15] presents a method for quantification of spinning reserves in interconnected power systems based on the cost–benefit analysis. The proposed methodology utilizes the radial-equivalent-independent approach to reduce the total number of buses in the grid system. The optimization of spinning reserve requirements is conducted using either security constrained unit commitment (SCUC) or security constrained economic dispatch (SCED). Although the proposed methodology introduces an effective way to quantify the spinning reserves in large interconnected systems, it lacks the ability to account for renewable and load forecast errors. Reference [
16] proposes a methodology for energy and spinning reserve market clearing (ESRMC) involving conventional units and wind power generators. The multi-objective optimization problem is solved by a genetic algorithm with the goal to minimize the total system operating cost and risk level. The methodology uses parametric assumptions to model the uncertainties associated with load and wind power, yet it is unclear how these uncertainties were incorporated into the optimization problem. Reference [
17] proposes a model for co-optimized energy and spinning reserve market, including the provision of demand response from industrial and commercial customers. The proposed model utilizes a standard unit commitment to optimize the energy generation schedules, but the reserve allocation is carried out based on the deterministic security criterion equal to 10% of the net demand.
The models described above provide a more adequate estimation of operating reserve requirements compared to deterministic reliability and adequacy assessment methods. However, due to the emergence of new technologies and market mechanisms, there is a need for development of reserve estimation approaches capable of considering these novelties.
Although DR services are relatively new in the electric power industry, substantial research works have been carried out to incorporate DR into different market structures. Reference [
18] describes the demand response reserve project (DRRP) developed by the New England independent system operator (ISO-NE). The goal of the DRRP is to integrate DR into the ancillary service market by providing operating reserve and forward reserve services. However, this study does not explain how the system reliability is evaluated by the ISO-NE during the implementation of the DRRP. In reference [
19], a methodology for enhancing the spinning reserve capacity by application of the direct load control (DLC) program is proposed. The DLC is a load control mechanism where the contracted customers are disconnected from the grid by the grid utility in contingency period. The methodology has been tested on the IEEE-14 bus system to find out how implementation of the DLC program affected the amount of energy not supplied. However, the study examines only 3 out of 10 possible contingency scenarios and neglects simultaneous contingencies. The DLC participation scenarios were set to be equal to 15%, 30%, and 50%. Reference [
20] present a probabilistic model considering provision of DR reserves in the ancillary service demand response (ASDR) market. The proposed model considers only uncertainties due to failure of conventional capacity, transmission line outages, and load forecast error, and neglects the uncertainty caused by renewable generation. The optimization of SCUC problem is accomplished in two stages using the mixed-integer linear program (MILP). The model was tested separately on the IEEE one-area reliability test system (RTS) and on the customized six-bus grid system, yet both systems were assumed to have no interconnection between each other, or any other system whatsoever. A similar approach has been presented in reference [
21]; however, this model neglects to consider the uncertainty due to load forecast error, and the contingencies are presented only in terms of random outages of generating units. Reference [
22] presents a security-constrained joint forward energy and ancillary service market clearing mechanism, which incorporates DR reserves; the method utilizes SCUC formulation developed in their previous studies [
23,
24]. In this SCUC formulation, the reliability criteria require procurement of spinning reserves provided by conventional capacity and demand side reserves to withstand a pre-determined contingency. The method is applicable to isolated systems and does not consider uncertainties due to load and renewable forecast errors. In [
25], the authors introduce a complete DR model in which demand side flexibility is exploited in energy and reserve markets. The DR model is integrated into the spinning reserve estimation model described in reference [
12]. The optimal spinning reserve, including DR reserve, is determined using a two-stage SCUC in which the market clearing of energy production and reserve service is done simultaneously. However, the methodology neglects multiple-order contingencies in order to reduce computational complexity. Reference [
26] presents a DR model integrated in conventional SCUC with deterministic security criteria, yet the model assumes constant demand elasticity and linear correlation between electricity price and demand. The model is tested on the IEEE one-area RTS to determine reduction in total system costs. In reference [
27], the authors incorporate incentive-based and time-based DR programs into a stochastic optimization scheduling model, considering only generating unit failure as stochastic input. In this study, the electricity demand and prices are modeled in the same fashion as it was performed in reference [
26] (i.e., inelastic demand and linear price-demand correlation). Reference [
28] proposes a model incorporating the incentive-based DR program with the dynamic economic dispatch (DED) problem. The study develops non-linear models of responsive load for the incentive-based DR programs. The combined DED and DR model is solved by the application of the random drift particle swarm optimization (DPSO) algorithm. However, the study utilized conventional N-1 security criterion to determine spinning reserve requirements. Reference [
29] proposed a reliability assessment based on the truncated state space (TSS) method combined with demand response. The truncation of the state space is done to reduce the computational complexity of the problem and is defined as elimination of system states with low probability. The model analyzes the power systems at generation and transmission levels and was implemented on the IEEE one-area RTS. Although the objective of this approach was to evaluate reliability of the large and complex power grids in a fast and efficient manner, it can only be applied to isolated systems due to the lack of the ways to account for interconnection power flows.
The main contribution of this study is to present a day-ahead spinning reserve estimation model for interconnected power systems based on a two-stage probabilistic SCUC. The model takes into consideration risks associated with capacity deficit due to random generator outage and renewable forecast error, spinning reserve provided by conventional generators (CG), as well as up-spinning reserve provided by demand response providers (DRPs) and interconnected capacity. Renewable power production is modeled using parametric univariate and bivariate models. The provision of spinning reserve and DR reserve is carried out by ISO through ancillary service markets. The influence of interconnected capacity on the adequacy of the test system is accounted for via the equivalent assisting unit approach.
The rest of this paper is organized as follows:
Section 2 describes the proposed market structure and characterizes the key components of the model.
Section 3 describes the case study implemented on the IEEE two-area RTS, as well as presenting the numerical results and discussion.
Section 4 presents the conclusion based on the results of this study.
2. Model Description
2.1. Market Structure
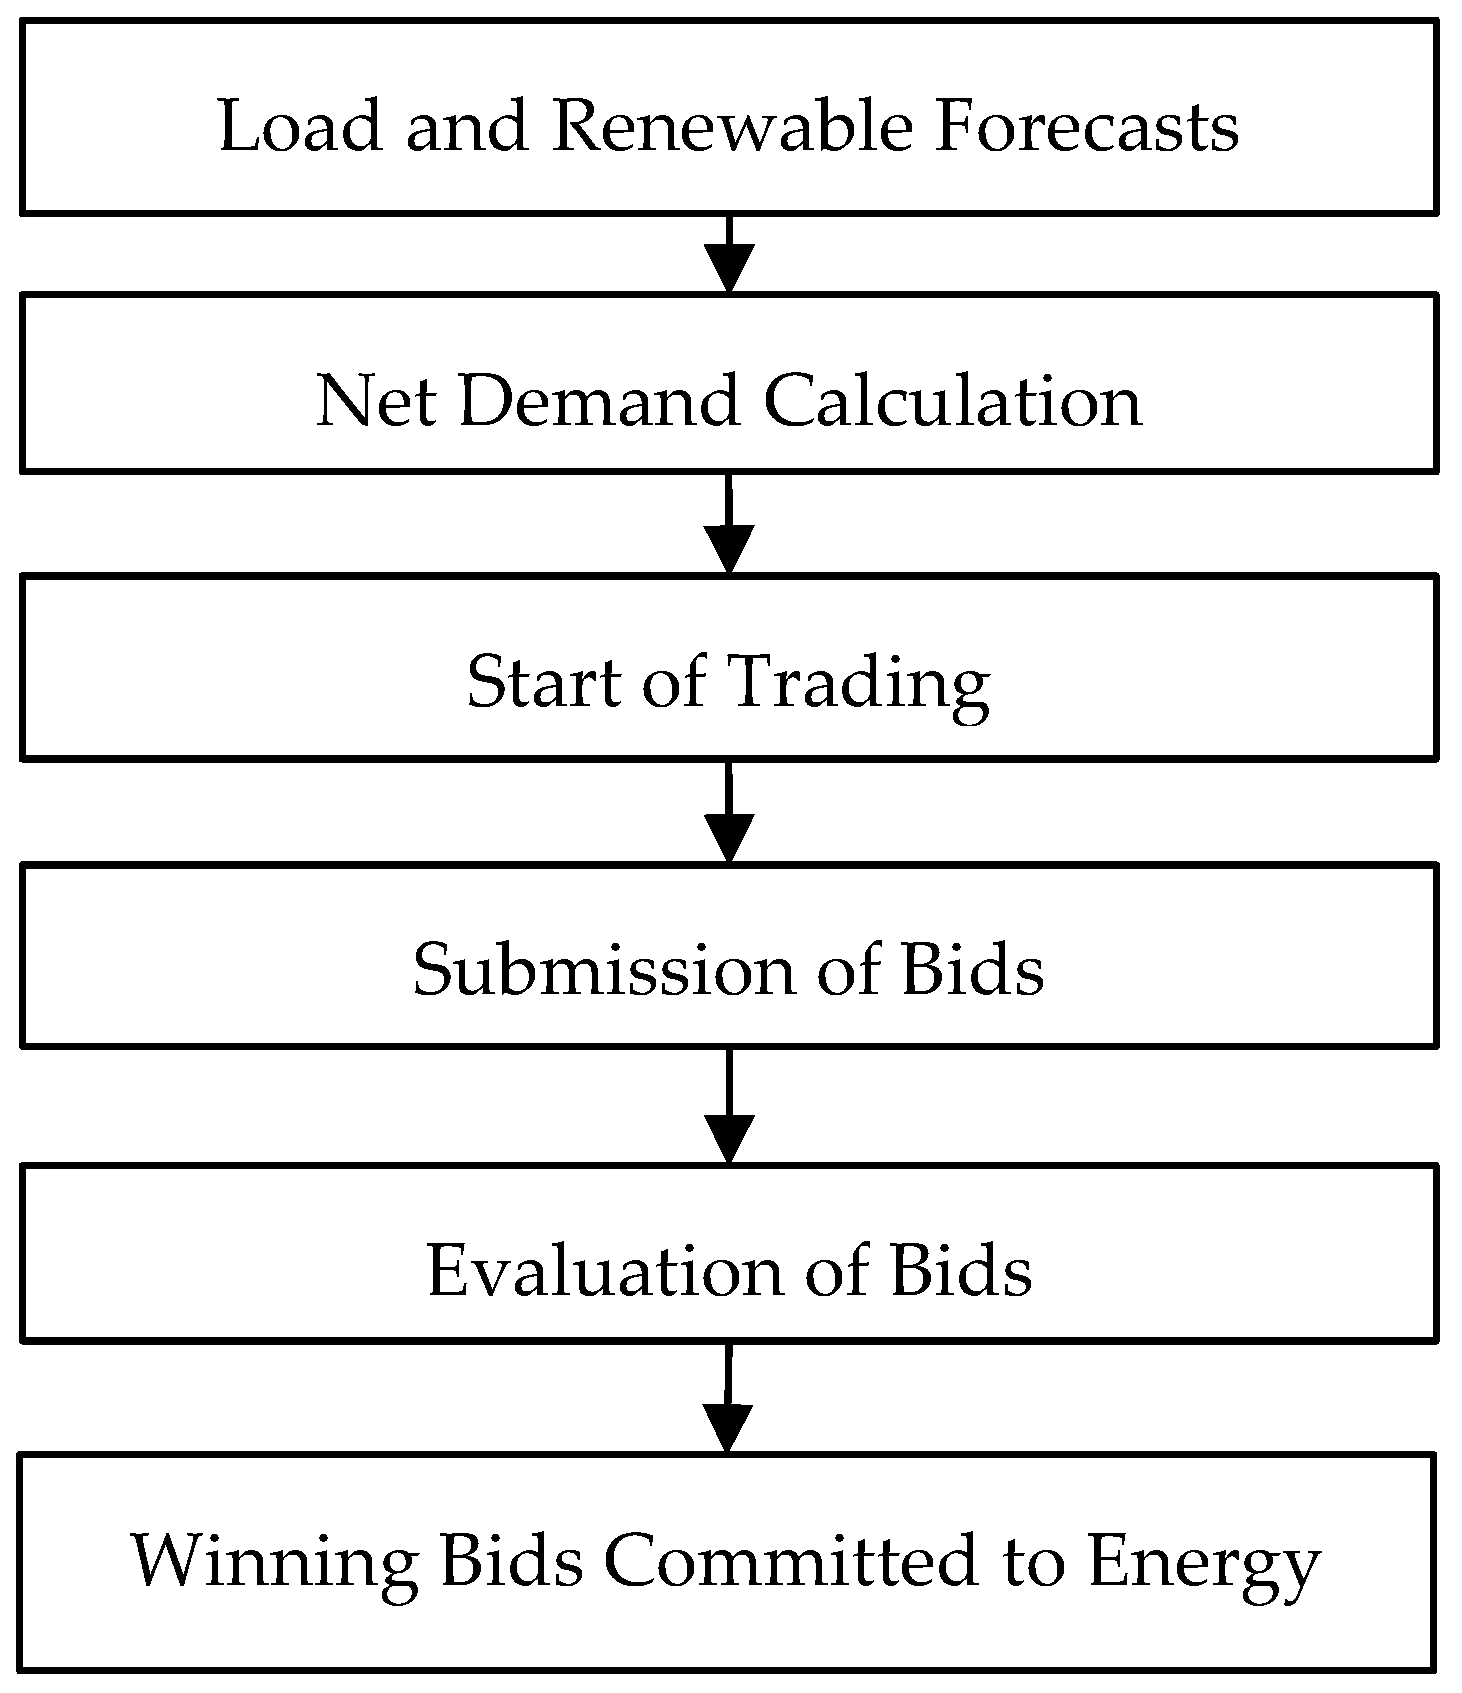
The procurement of energy and ancillary services from the market participants is executed by ISO on a day-ahead basis. The flowchart of the multi-period market clearing process is depicted in
Figure 1.
The entire process begins with submission of the day-ahead generation forecasts by renewable energy producers (REP) and load forecasts by electricity distribution companies (DisCo), and wholesale industrial consumers (WIC) to ISO. In this market model, we assume that REPs are not involved in competitive bidding; instead, to enhance their deployment, renewables are supported by incentives, such as priority dispatch and feed-in tariffs.
At the second stage, ISO initiates trading by submitting the aggregated net demand to the trading platform. The market structure considered in our model includes energy and ancillary service procurement. During the third stage, the market participants submit their offers. The proposed model takes into consideration inter-zonal power trading; therefore, interconnected conventional generators (ICG) can also participate in the ancillary service market. According to the proposed market structure, conventional generators (CG) can bid in energy and ancillary service markets, while DRPs and ICGs can only provide up-spinning reserve. It is important to note that, although, the market designs with both inter-zonal energy and reserve trading is more common, the proposed model focuses only on inter-zonal spinning reserve procurement, since the described market structure is based on the energy market of Kazakhstan with minor modifications applied to the optimization of the energy and ancillary service market. In Kazakhstan, the electricity demand is fully covered by domestic power generating units, whereas the cross-zonal capacity is used for balancing, and for the short- and mid-term reserve purposes.
At the fourth stage of the market clearing process, the winning bids are committed for energy production and ancillary services using two-stage stochastic SCUC. In this model, the energy production and ancillary service are considered as competitive commodities; therefore, the market clearing of these commodities is exercised simultaneously. The main objective of unit commitment and economic dispatch optimization is to minimize the system operating costs.
2.2. Generation System
In this study, the generation system is modeled using the capacity outage probability table (COPT). COPT is created using the Markovian representation of the generation system states. In a two-state Markov process, a power generating unit can be either up and generating the required amount of power, or down due to a technical issue.
The probability of capacity deficit due to the unit failure, also known as the outage replacement rate, is dependent on the rate at which a unit transitions from operating state to a failure state and the rate at which the unit is repaired or replaced. Assuming the exponential distribution of the time to failure of each unit and neglecting the repair process, the probability of finding unit
i on outage is given by [
5]:
where
is the failure rate of unit
i and
T is the lead time. Note that throughout this paper, indices
i,
j, and
k refer to the intra-zonal conventional units, inter-zonal conventional units, and DRPs, respectively. Indices
m,
s, and
t refer to the generation system states, net demand scenarios, and the time-periods of the scheduling horizon. Finally, capital
P represents the power output of conventional and renewable energy producers, whereas the lowercase
p refers to probability.
The calculation of generation system states is carried out using the recursive technique described in reference [
5] and includes information on available capacity and corresponding probabilities of the system states. The recursive equation is given by reference [
5]:
where
and
are, respectively, the cumulative probabilities of generation system state
m before and after unit
i is added, and
Pi is the installed capacity of unit
i. Note that the total number of possible system states is equal to 2
n, where n is the total number of units included in the generation system (i.e., the maximum value of
i).
2.3. Net Demand
Alongside the generator failure, the uncertainty due to load and renewable forecast error may significantly affect the reliability of a grid system [
30,
31]. In this study, only wind and solar photovoltaic power is considered as renewable energy. The incentives aimed to enhance the deployment of renewable energy sources described in the previous section, as well as the uncorrelated nature of load and renewable forecast errors, allow one to consider renewable energy as negative load [
9]; therefore, for any given time-period
t, the net demand is given by:
where
,
, and
are the system load, wind, and solar energy production at time-period
t, respectively.
2.3.1. Load Forecast Error
Load forecasting has been evolving since the outset of electricity, and to this day, great abundance of sophisticated techniques has been developed for accurate prediction of the consumer load. For this reason, as well as the repeating nature of the load, it is reasonable to assume that the standard deviation of the forecast error equates to a portion of the actual load [
9]:
where
and
are the standard deviation of the load forecast error and forecasted load at time
t, respectively, and
Y is the function depending on the accuracy of the forecasting framework.
2.3.2. Wind Power Output
A relatively straightforward and effective way to model renewable power output is to utilize a parametric probability density function (PDF) of choice. To date, a large number of studies have been conducted to determine the PDFs that provide for accurate renewable power generation prediction models. The variety of distributions used to model wind and solar forecast error range from normal distribution [
9,
10,
11], the Weibull distribution [
32,
33,
34,
35,
36], mixed distribution based on Laplace and normal distributions [
37], the Beta distribution [
38], the hyperbolic distribution [
39], and the Levy α-stable distribution [
40].
Commonly, wind speed and wind forecast error are modeled using Weibull and normal distributions, respectively, described by marginal (univariate) probability density functions. In our work, we perform an analysis using a traditional approach, which utilizes a Weibull distribution, and for the first time in the power system reliability assessment, bivariate probability density function, which represents joint distribution of wind speed and direction.
Univariate Wind Prediction Model
The univariate parametric wind speed PDF is given by the following equation [
41]:
where
v is the actual wind velocity, and
γ and
k are the scale and shape factors of the PDF. The calculation of wind turbine power output should be accomplished based on the wind turbine power curve provided by the manufacturer. In this study, the wind turbine power output calculation is conducted using the following relation [
42]:
where
Pr is the maximum power output of a wind turbine rated at wind velocity
vr,
vmin, and
vmax are the cut-in and cut-off wind velocities, respectively. Finally,
is the non-linear part of the power curve, representing the power output at wind velocity
v. In this study, we utilize the power coefficient-based model given by reference [
42]:
where
ρair is the air density, considered constant (1.225 kg/m
3),
Awt is the wind turbine rotor swept area, and
Ceq is the dimensionless power coefficient equivalent, assumed to be equal to 0.4 [
41].
Bivariate Wind Prediction Model
The univariate wind prediction model lacks the ability to consider other parameters that may have a significant impact on the prediction results. This issue can be addressed through utilization of the bivariate models consisting of a mixture of two marginal probability distributions of the parameters of interest. Reference [
43] suggests that bivariate models show superior results as compared to the univariate counterparts in terms of goodness-of-fit criteria. In this study, we propose a bivariate model that considers the wind speed and wind direction through utilization of the Johnson–Wehrly bivariate PDF with a mixture of two Weibull distribution functions. The Johnson–Wehrly bivariate PDF is expressed as follows:
where
V and
θ are the random variables representing wind speed and direction, respectively, and
ψ is the random variable representing the relationship structure between
V and
θ, which is given by the following expression:
where the terms
,
, and
are, respectively, the cumulative distribution functions of
V,
θ, and
ψ.
Equation (7) for the bivariate case becomes:
It should be noted that in this study, the wind velocity is expressed in m/s, while wind direction is expressed in terms of the following cardinal directions: North (N), South (S), East (E), West (W), Northeast (NE), Northwest (NW), Southeast (SE), and Southwest (SW).
2.3.3. Solar Power Output
The rate at which a PV module generates electricity is affected by the intensity of the solar radiation, PV module temperature, and technical characteristics of the module [
44]. Similar to wind power production, solar generation can be modeled using a parametric probability density function. In this study, we employ the Beta distribution that has recently been utilized by other research groups [
32,
33]. The Beta PDF for this case is given by the following expression [
32]:
where
represents the probability density function of solar irradiance and Γ represents the following Gamma function [
33]:
where
ρ is an integration variable.
The shape parameters of the Beta distribution are denoted by
α and
β and are given by the following formulas [
32]:
where
µ and
σ are the mean and standard deviation of solar irradiance. Given the solar irradiance, total area of PV modules—
Apv, the PV module conversion efficiency—
ηpv, the maximum power point tracking efficiency—
ηmppt, and the solar irradiance angel—
θs, the total power output of a PV farm can be calculated as follows [
45]:
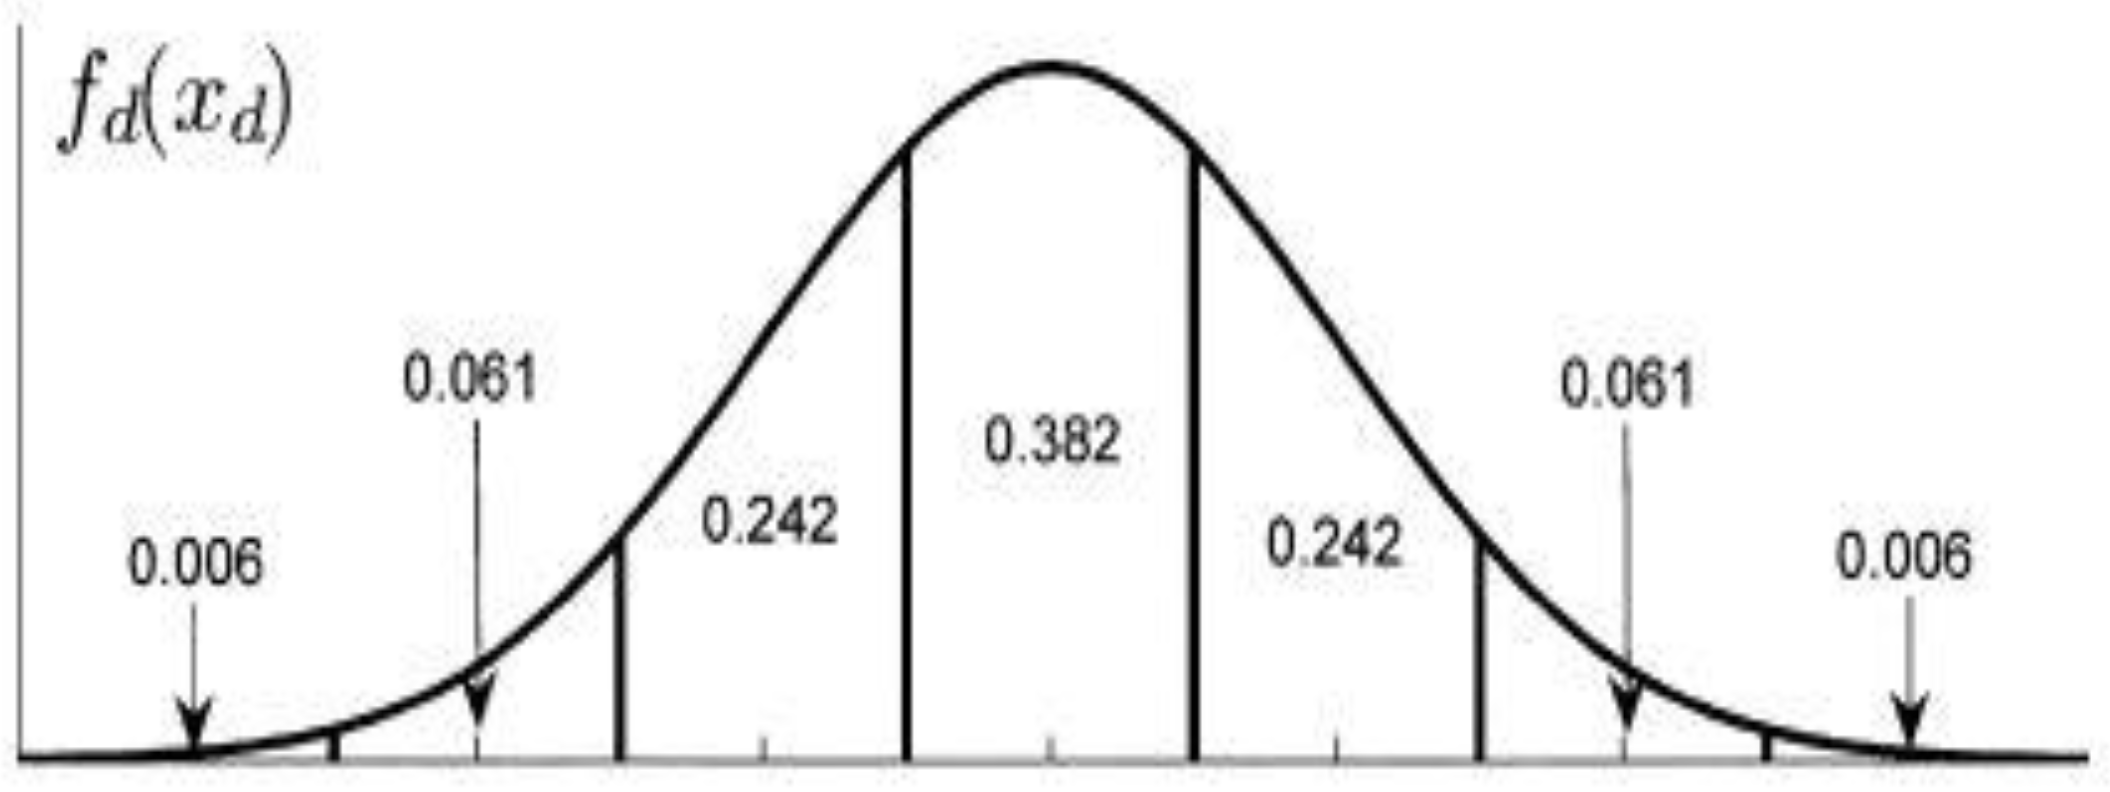
The resulting net demand dataset must be discretized into an odd number of equal intervals for further calculations. The discretization is performed by dividing the net demand probability distribution into equal intervals as indicated in
Figure 2. These intervals are considered as scenarios with individual probabilities corresponding to the mid-point of each interval.
Further calculations are required to determine the level of reliability of the grid system. The reliability metric used in this study, the expected energy not supplied (EENS), represents the amount of unsupplied energy for a given time-period, and is given by the following expression:
where
I,
M, and
S are the total number of conventional units, generation system states, and net demand scenarios, respectively.
is the power that is available to the system from a conventional unit
i during time-period
t at system state
m, and
qs, and
qm are the probability of net demand and generation system availability scenarios, respectively. It is worth noting that although variable
highly depends on the level of capacity forced out of service, the probability of this outage may have an even stronger impact on the loss of energy expectation. For instance, a simultaneous failure of two or more units may cause a significant disruption of the electricity supply. However, the likelihood of this event is very low; thus, the overall loss of energy expectation would be lower as compared to a single-unit outage event.
2.4. Interconnected Capacity and Transmission Lines
Nowadays, it is quite rare to see a power system operating in island mode (i.e., in complete isolation from neighboring power systems), since grid interconnection greatly improves reliability and adequacy of interconnected systems. Interconnection can help to keep the balance between generation and load during peak load hours more efficiently, utilize generation capacity in a cost-effective manner, and reduce capacity reserve requirements [
46].
This study uses the equivalent assisting unit approach described in references [
5] and [
11] to account for interconnected power flows. The maximum power assistance that can be provided by the interconnected system is the minimum of free inter-zonal capacity and the tie-line capacity [
47]:
where
is the installed capacity of interconnected unit
j, and
and
are the capacity committed for energy generation and spinning reserve service provided by inter-zonal unit
j at time-period
t, respectively.
is the maximum transmission capacity of transmission line
l. Finally,
J and
L are the total number of interconnected reserve units and transmission lines.
The maximum capacity assistance level is utilized to create a capacity model in the same way as it was described in the previous subsection. The resulting COPT is regarded as an equivalent multi-stage generating unit, which can be integrated in an existing capacity model of an assisted system.
A similar approach is employed to generate the transmission system model, where all possible scenarios are determined given the availability rate of each transmission line. The combined generation–transmission system model represents the table with state probabilities and corresponding available capacities.
2.5. Demand Response
Along with interconnected capacity, electricity consumers can significantly improve a system’s ability to withstand sudden capacity outages by participating in DR programs. Various types of DR programs allowing consumer participation in electricity markets as a service provider have been developed by ISOs. The complete description of the most common DR program types can be found in reference [
48]. The main goal of the DR program employed by the proposed model is to provide up-spinning reserve service in the ancillary service market. In the proposed market structure, the DRPs serve as aggregators of DR offers provided by retail customers. A bid submitted by the DRP includes the energy and capacity costs of reserve, as well as the minimum and maximum load reduction duration. The energy cost of reserve is paid to the DRP only in cases of actual reserve deployment, whereas the capacity cost is covered in any circumstance. The capacity cost of reserve can be submitted in the form of a price–quantity pair, which denotes the amount of remuneration for reduction of certain amounts of load. For instance, the pair 15
$/MW–10 MW implies that the DRP requires 15
$/MW for reducing its load by up to 10 MW [
48].
Note that the amount of DR reserve offered by the DRP must exceed the minimum amount specified by ISO. In the ancillary service market, DRPs can be treated in the same way as conventional generators, thus the DRP price–quantity functions are given by the following expressions [
20]:
where
is the amount of demand response provided by the
kth DRP at time-period
t,
is the minimum amount of demand response provided by the
kth DRP,
utk is the binary indicator of the
kth DRP’s status at time-period
t (0—not providing DR, 1—providing DR),
is the
kth DRP’s
nth segment of the piecewise linear cost function, and
unk is the binary indicator of the
kth DRP’s status during
nth segment of the piecewise linear cost function (0—not providing DR, 1—providing DR).
is the cost of DR provided by the
kth DRP at time-period
t.
is the minimum price provided by the
kth DRP,
is the price provided by the
kth DRP during
nth segment of the piecewise linear cost function, and
is the
nth segment of the piecewise linear cost function provided by the
kth DRP.
2.6. Stochastic SCUC
2.6.1. Objective Function
As it was noted previously, the unit commitment problem of this model is expressed as a two-stage stochastic MILP. The first-stage calculations are performed for the most favorable scenario, which is called the base case. The base case denotes the generation system state when all units are available for energy production, resulting in the most efficient unit commitment. The objective of the first stage is to find the unit commitment configuration resulting in the lowest system operating cost, where the system operating cost is given by [
46]:
where
λti,n is the slope of the
nth segment of the
ith unit’s piecewise linear cost function at time-period
t,
is the
ith unit’s
nth segment power production (MW) during time-period
t,
is the
ith unit’s minimum operating cost at time-period
t,
is the binary indicator of the
ith unit’s status at time-period
t (0—not operating, 1—operating),
is the
ith unit’s start-up cost during time-period
t,
is the
ith unit’s cost for provision of up-spinning reserve during time-period
t,
is the amount of up-spinning reserve provided by the
ith unit (MW) during time-period
t,
is the
ith unit’s cost for provision of down-spinning reserve during time-period
t,
is the amount of down-spinning reserve provided by the
ith unit (MW) during time-period
t,
is the cost of power generated by the
jth interconnected unit during time-period
t, and
is the amount of reserve provided by the
jth interconnected unit during time-period
t. The variable
is given by:
where
is the deployed spinning reserve from the
nth block of energy offer by the
ith unit in the
mth scenario during time-period
t,
is the deployed up-spinning reserve from the
nth block of energy offer provided by the
jth inter-zonal unit in the
mth scenario during time-period
t,
is the deployed spinning reserve from the
nth block of energy offer by the
kth DRP in the
mth scenario during time-period
t,
VOLL is the value of lost load—the predefined constant that indicates the per MWh cost of interruption of electricity supply—and
is the amount of energy curtailed due to shortage of power generating capacity in the
mth scenario during time-period
t. The objective of the second stage is to find the most optimal reserve schedule by comparing different scenarios.
2.6.2. First-Stage Constraints
The objective function (21) must be minimized by enforcing the set of constraints presented by Equations (23)–(33). The first-stage constraints are given by the Equations (23)–(27).
The balance between power production and load is specified by the following equation:
Power generating units are subject to the operating constraints, such as ramping rate, maximum and minimum operating capacity, and minimum up and down time.
Additional unit operating constraints that should be specified separately are given by Equations (24) and (25):
where
and
are the installed capacity and the minimum power output of an
ith unit.
As it was noted above, this model assumes that the interconnected capacity and DRPs provide only up-spinning reserve; thus, their operating constraints are given by:
where
is the maximum curtailment level of the
kth demand response provider.
2.6.3. Second-Stage Constraints
The second-stage scenarios are generated using the Monte-Carlo method; the constraints associated with the second-stage scenarios are presented below. For all time periods and scenarios, the power balance equation is given by:
where
and
are the deployed up and down spinning reserves by the
ith unit in the
mth scenario during time-period
t, respectively.
The maximum involuntary load curtailment for each DRP is specified by the following equation:
Inequalities (30) and (31) specify the limits that are enforced to deployed spinning reserves:
Deployed interconnected capacity and DRP reserve constraints are specified by inequalities (32) and (33):
This formulation of reliability criteria allows for the ability to find the optimal spinning reserve requirement by balancing the spinning reserve operating costs and socioeconomic costs associated with load curtailment. On one hand, the reduced spinning reserve requirement may have negative effects on the adequacy of a power system; on the other hand, this reduction may be reasonable if the risk associated with capacity deficit is insignificant, or the social value of the curtailed load is very low.
4. Conclusions
A probabilistic model for estimation of spinning reserves in interconnected systems with demand side reserve provision was discussed in this work. The proposed model accounts for random outages of conventional units as well as uncertainties caused by the load, solar, and wind forecast errors. Random unavailability of generating capacity was modeled as a two-state Markov process. The load, wind, and solar forecast errors were modeled using normal, Weibull, and Beta distributions. In cases of wind power production, two prediction models (namely univariate and bivariate) were considered. Additionally, the model considered the interconnected capacity through utilization of the equivalent assisting multi-state unit approach. In this study, interconnected capacity and DRPs were assumed to provide only up-spinning reserve service. The model was developed according to the specific market structure in which the intra-zonal conventional units participate in the energy and ancillary service markets, whereas the inter-zonal capacity and DRPs participate only in the ancillary service market. The two-stage unit commitment problem was formulated such that MILP could be applied to conduct the optimization. In this formulation, the optimal unit commitment for energy production was determined in the first stage, while quantification of spinning reserves was conducted in the second stage of the program by recursion through the most probable scenarios. Furthermore, to minimize the cost function, the cost of reserve along with the cost of possible load shedding were taken as objectives and the spinning reserve optimization was conducted.
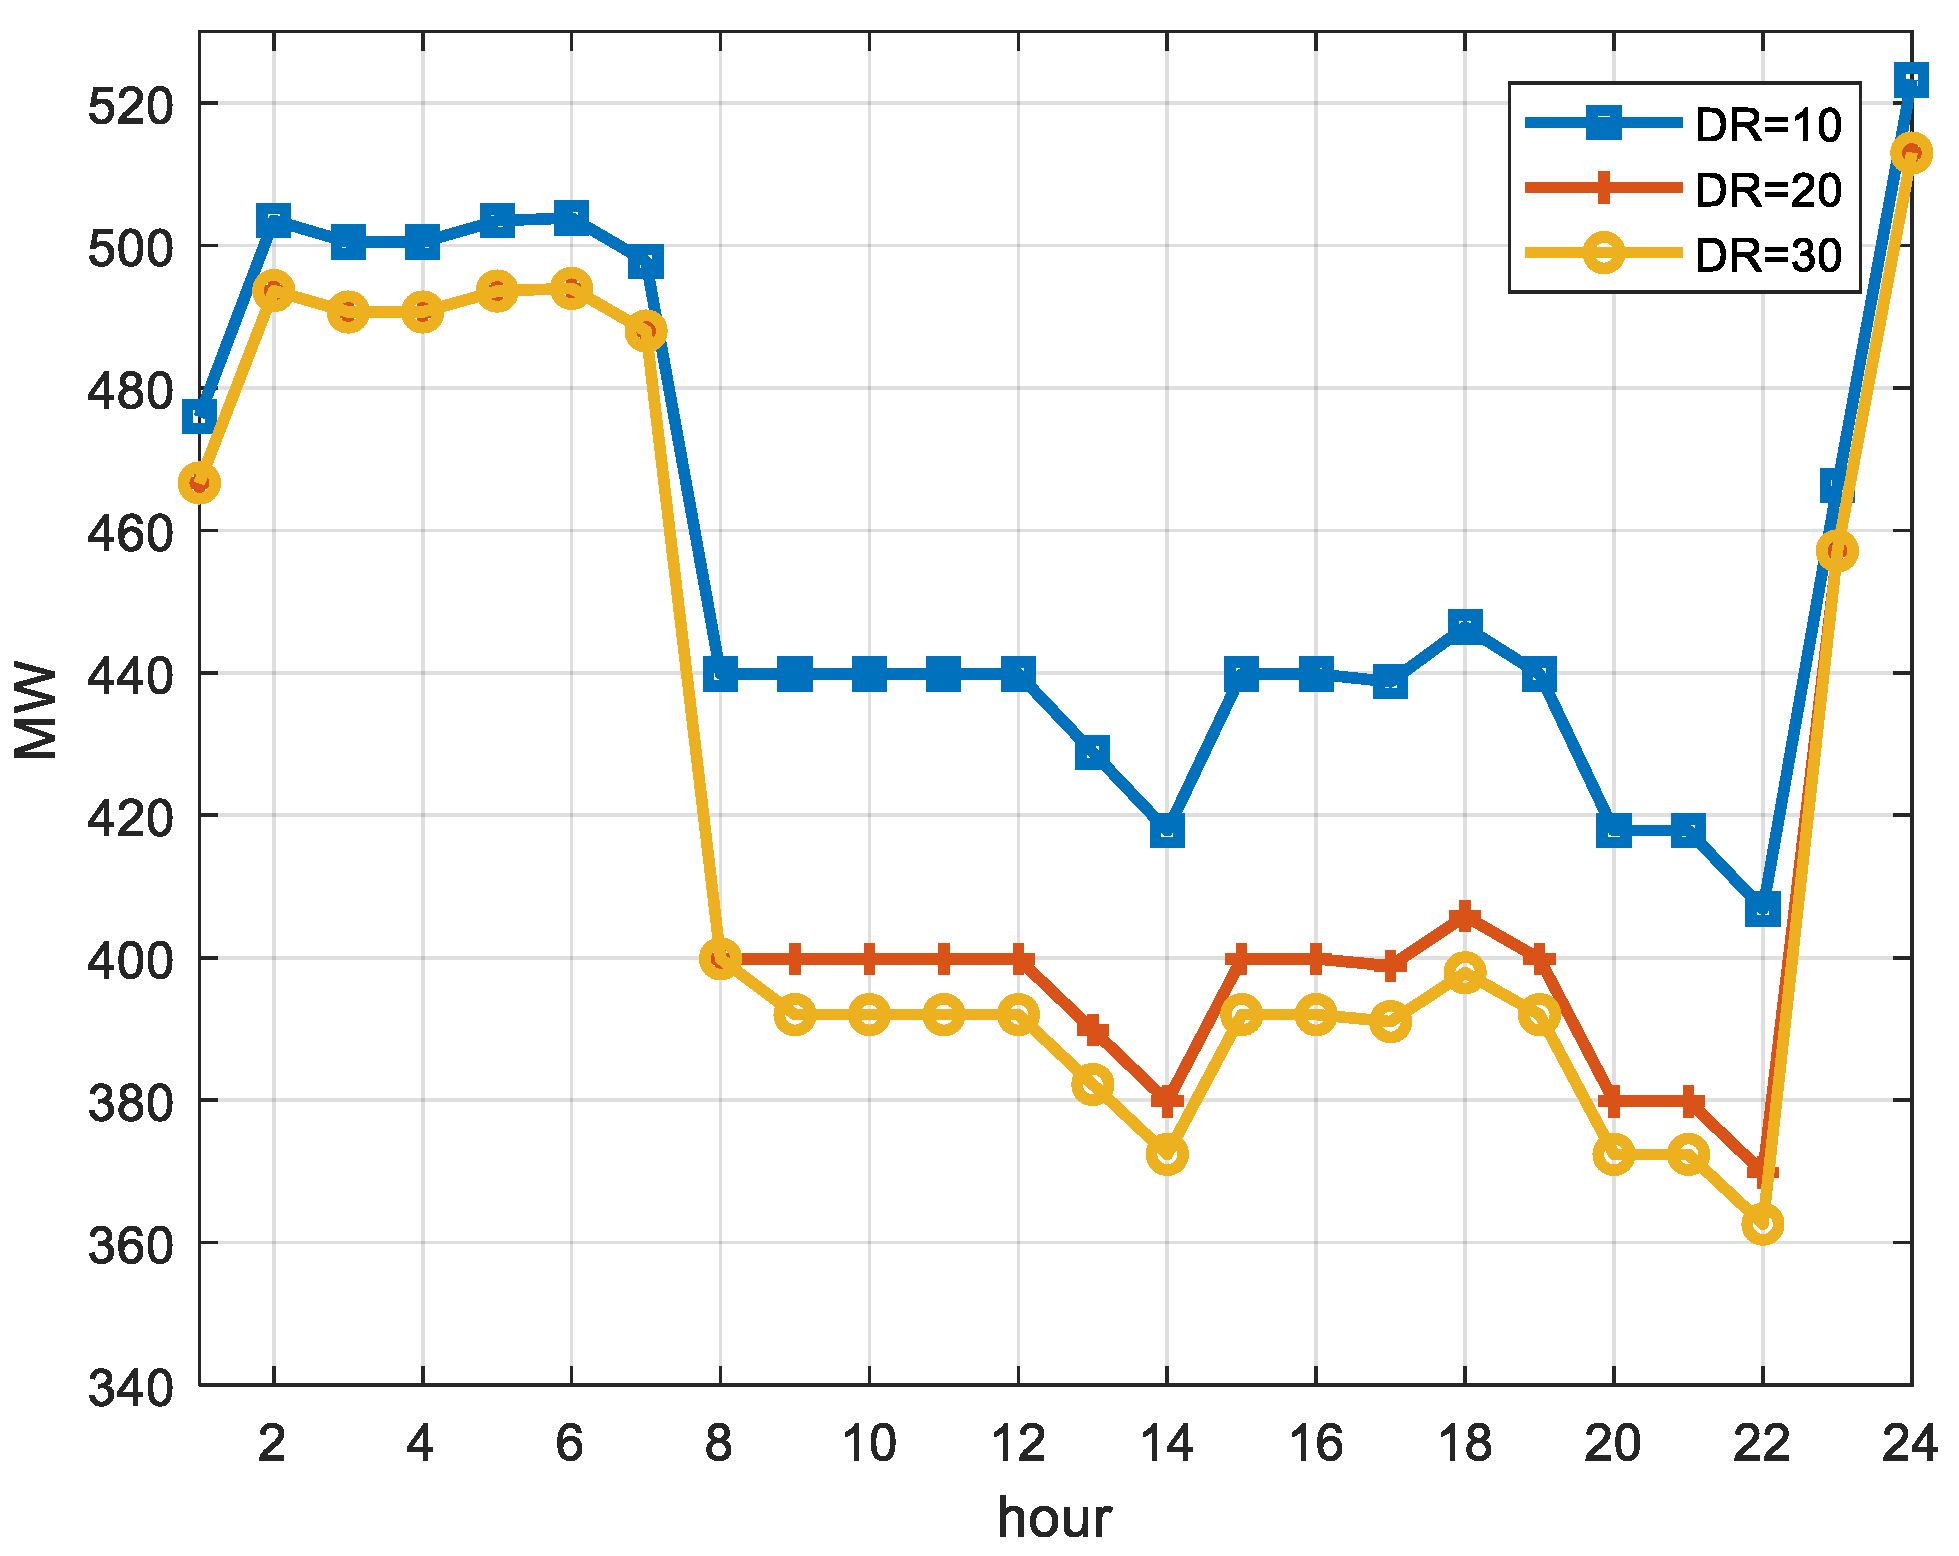
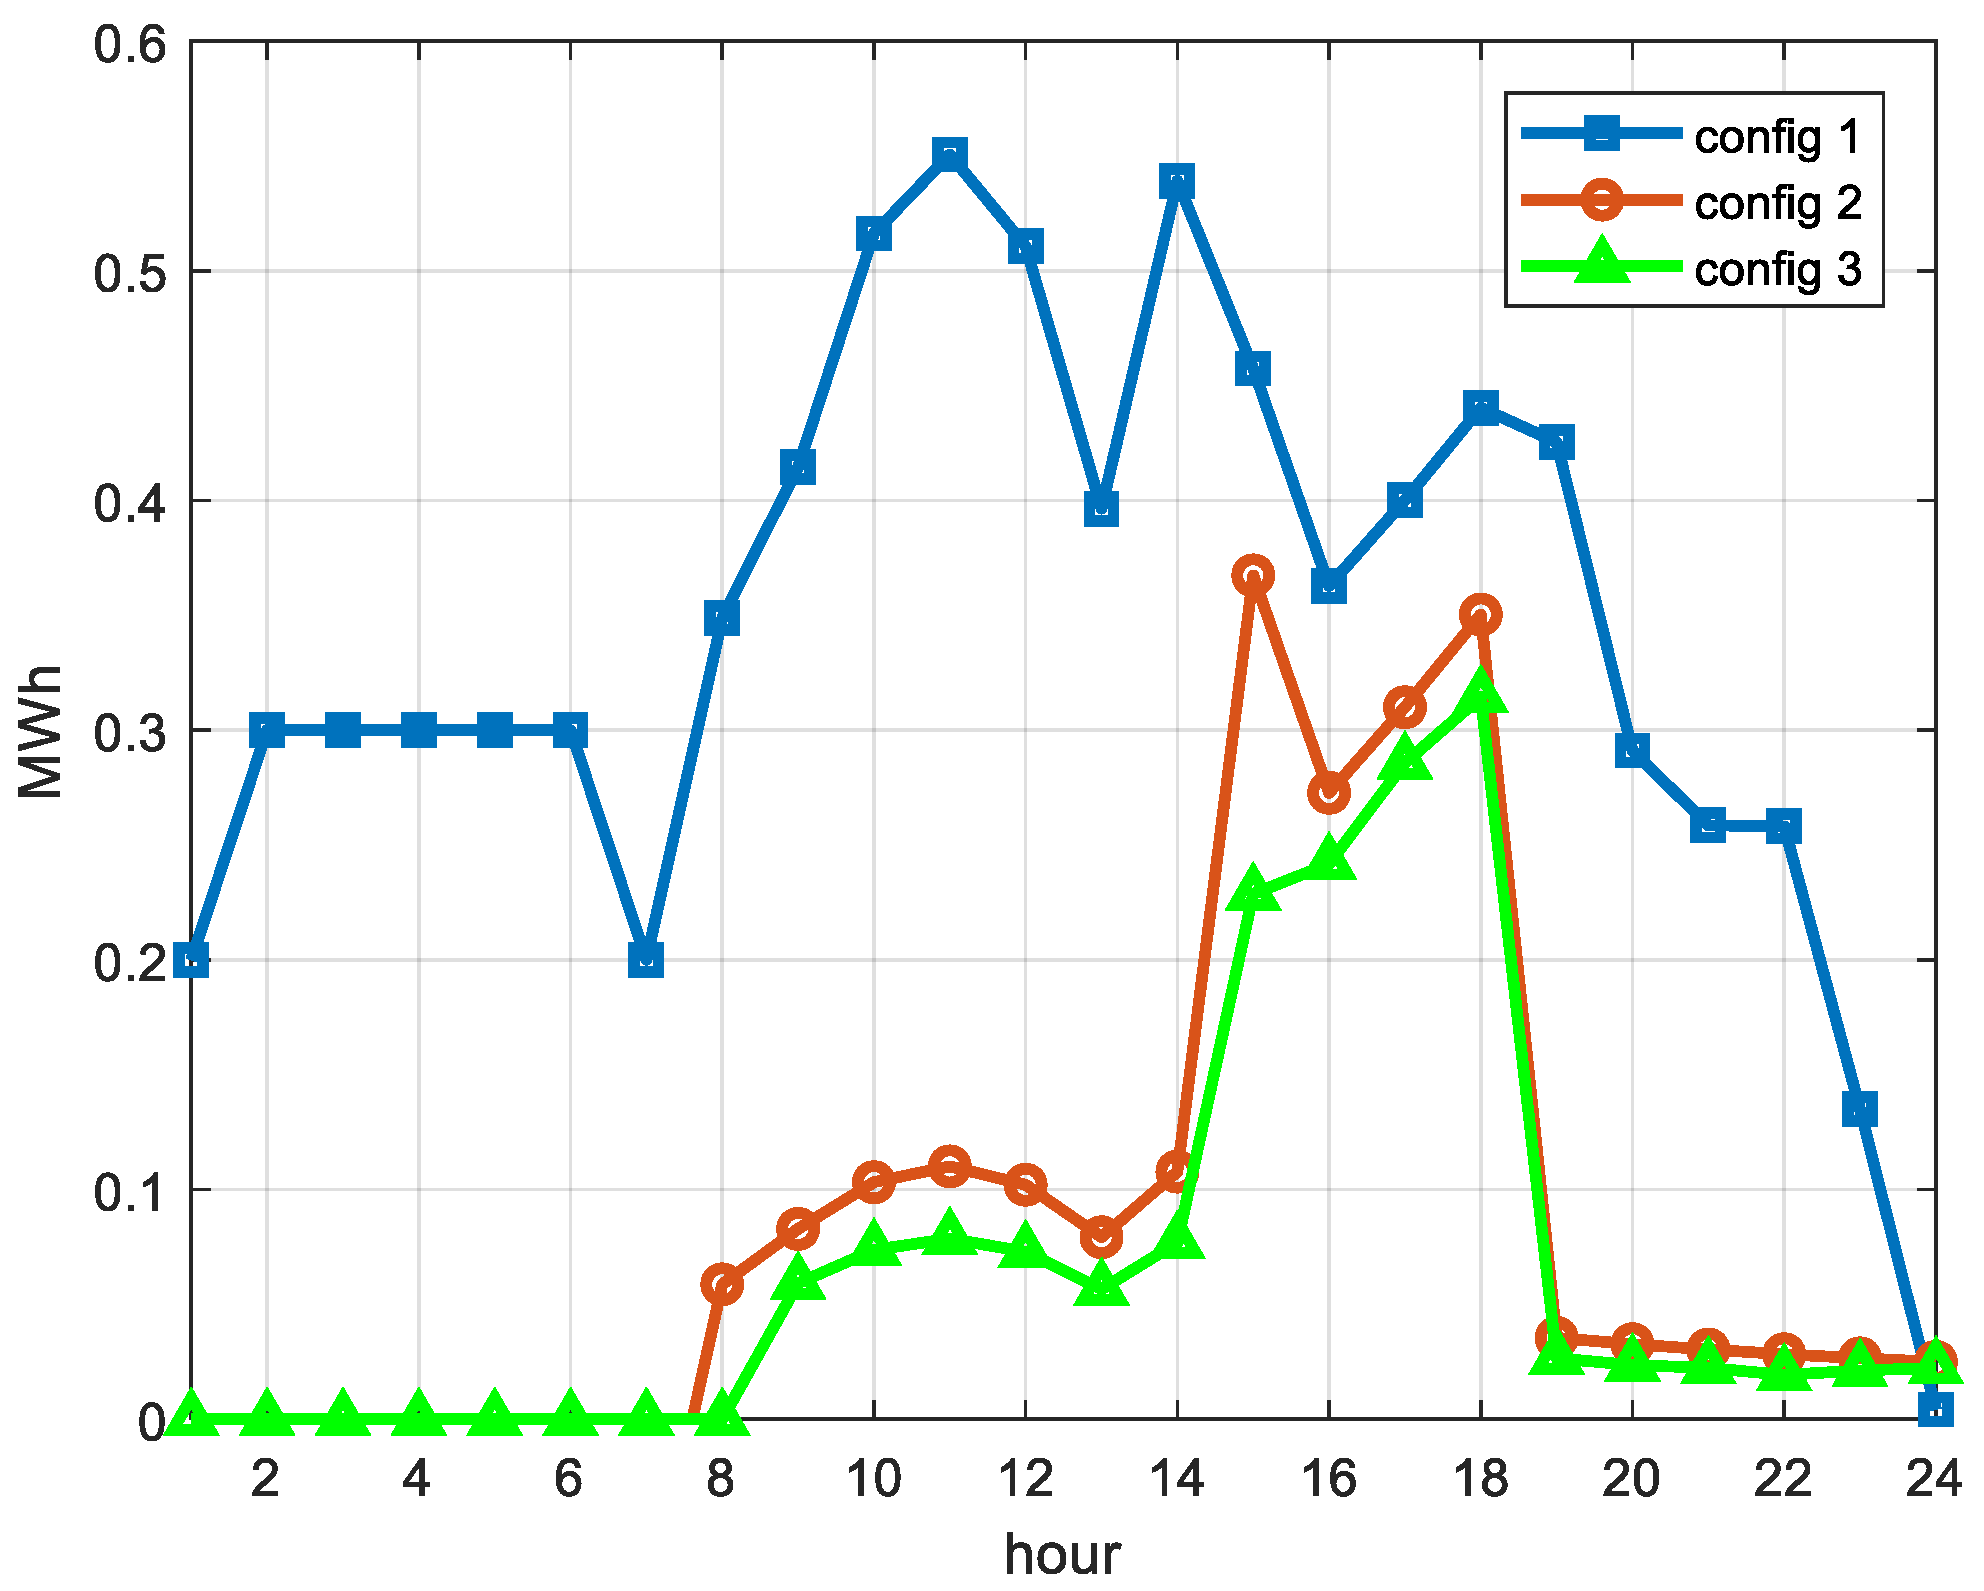
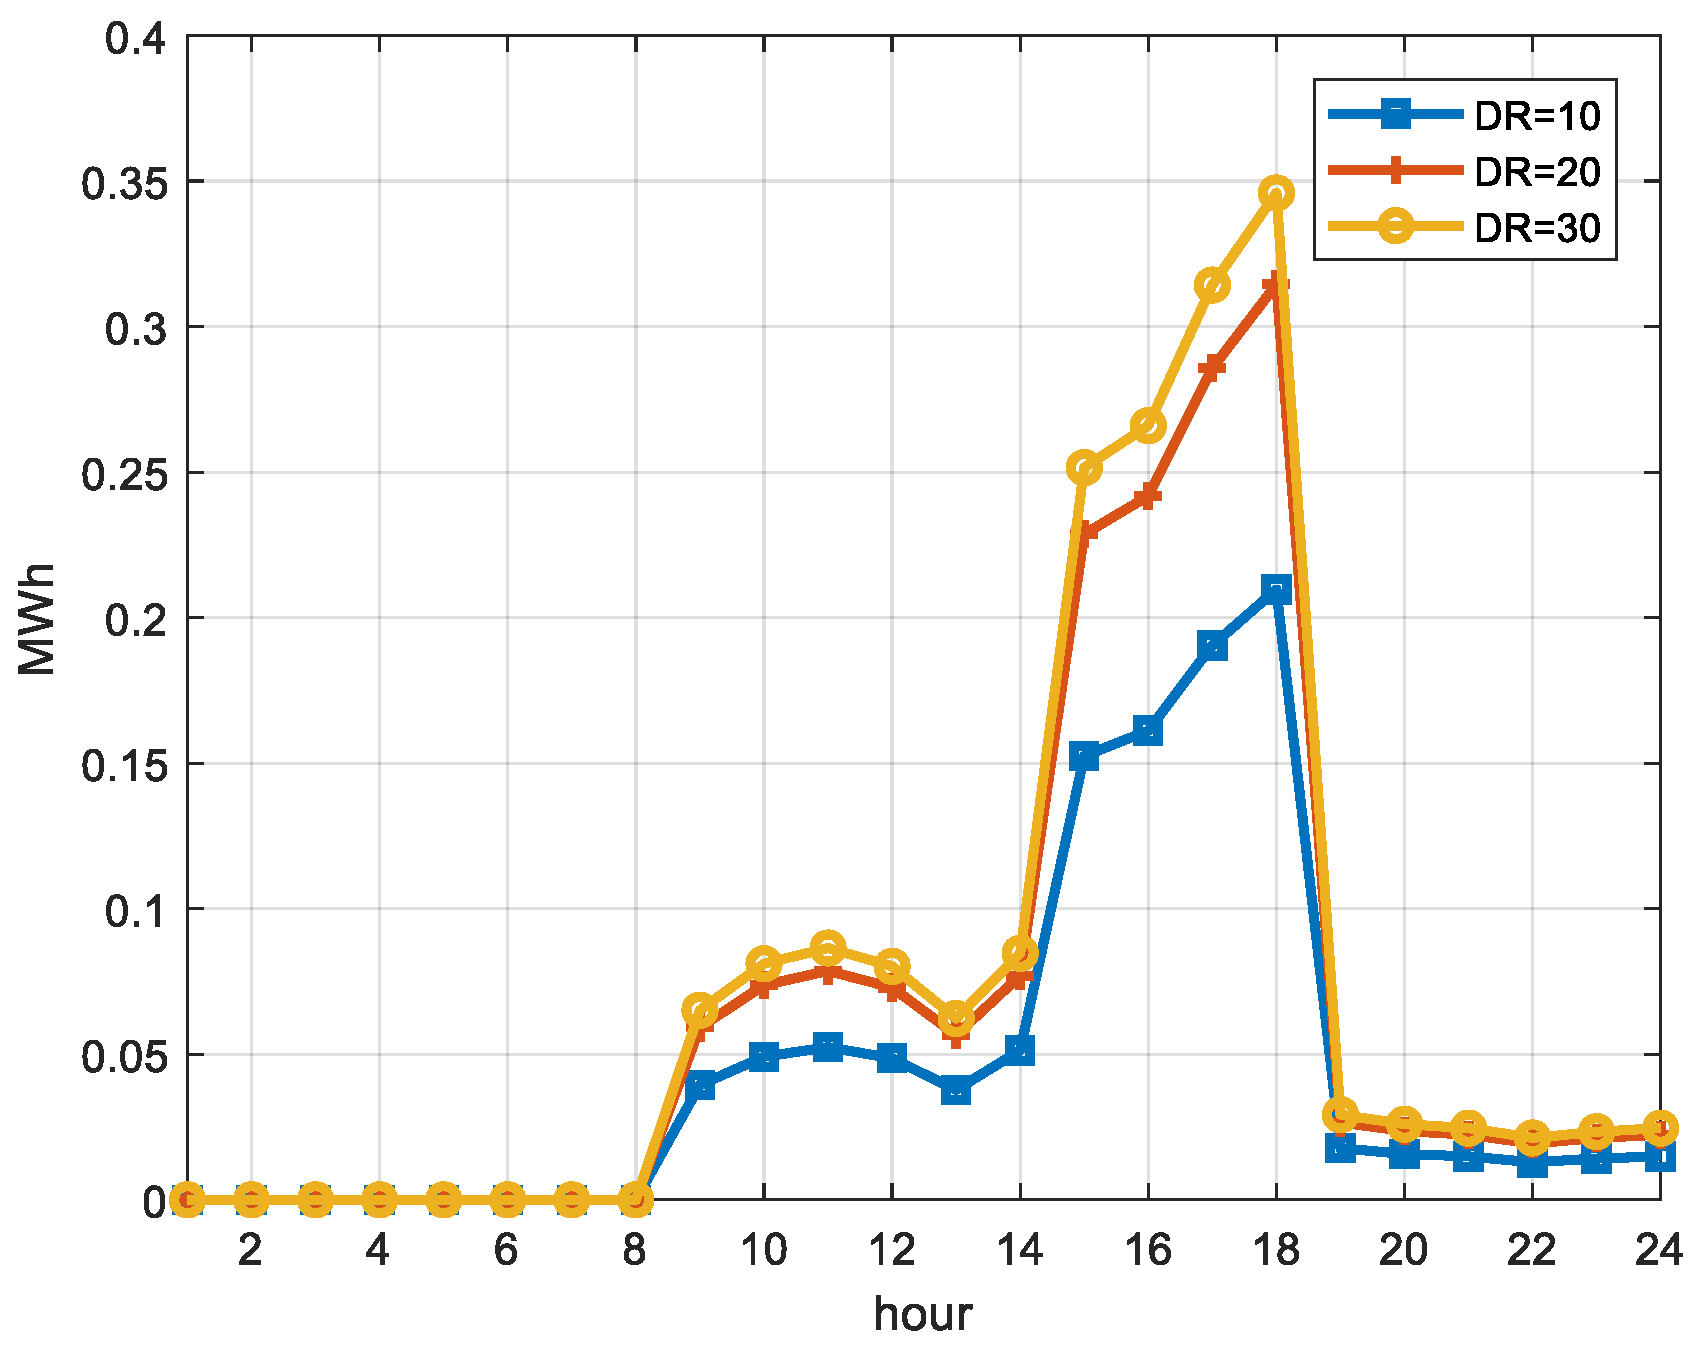
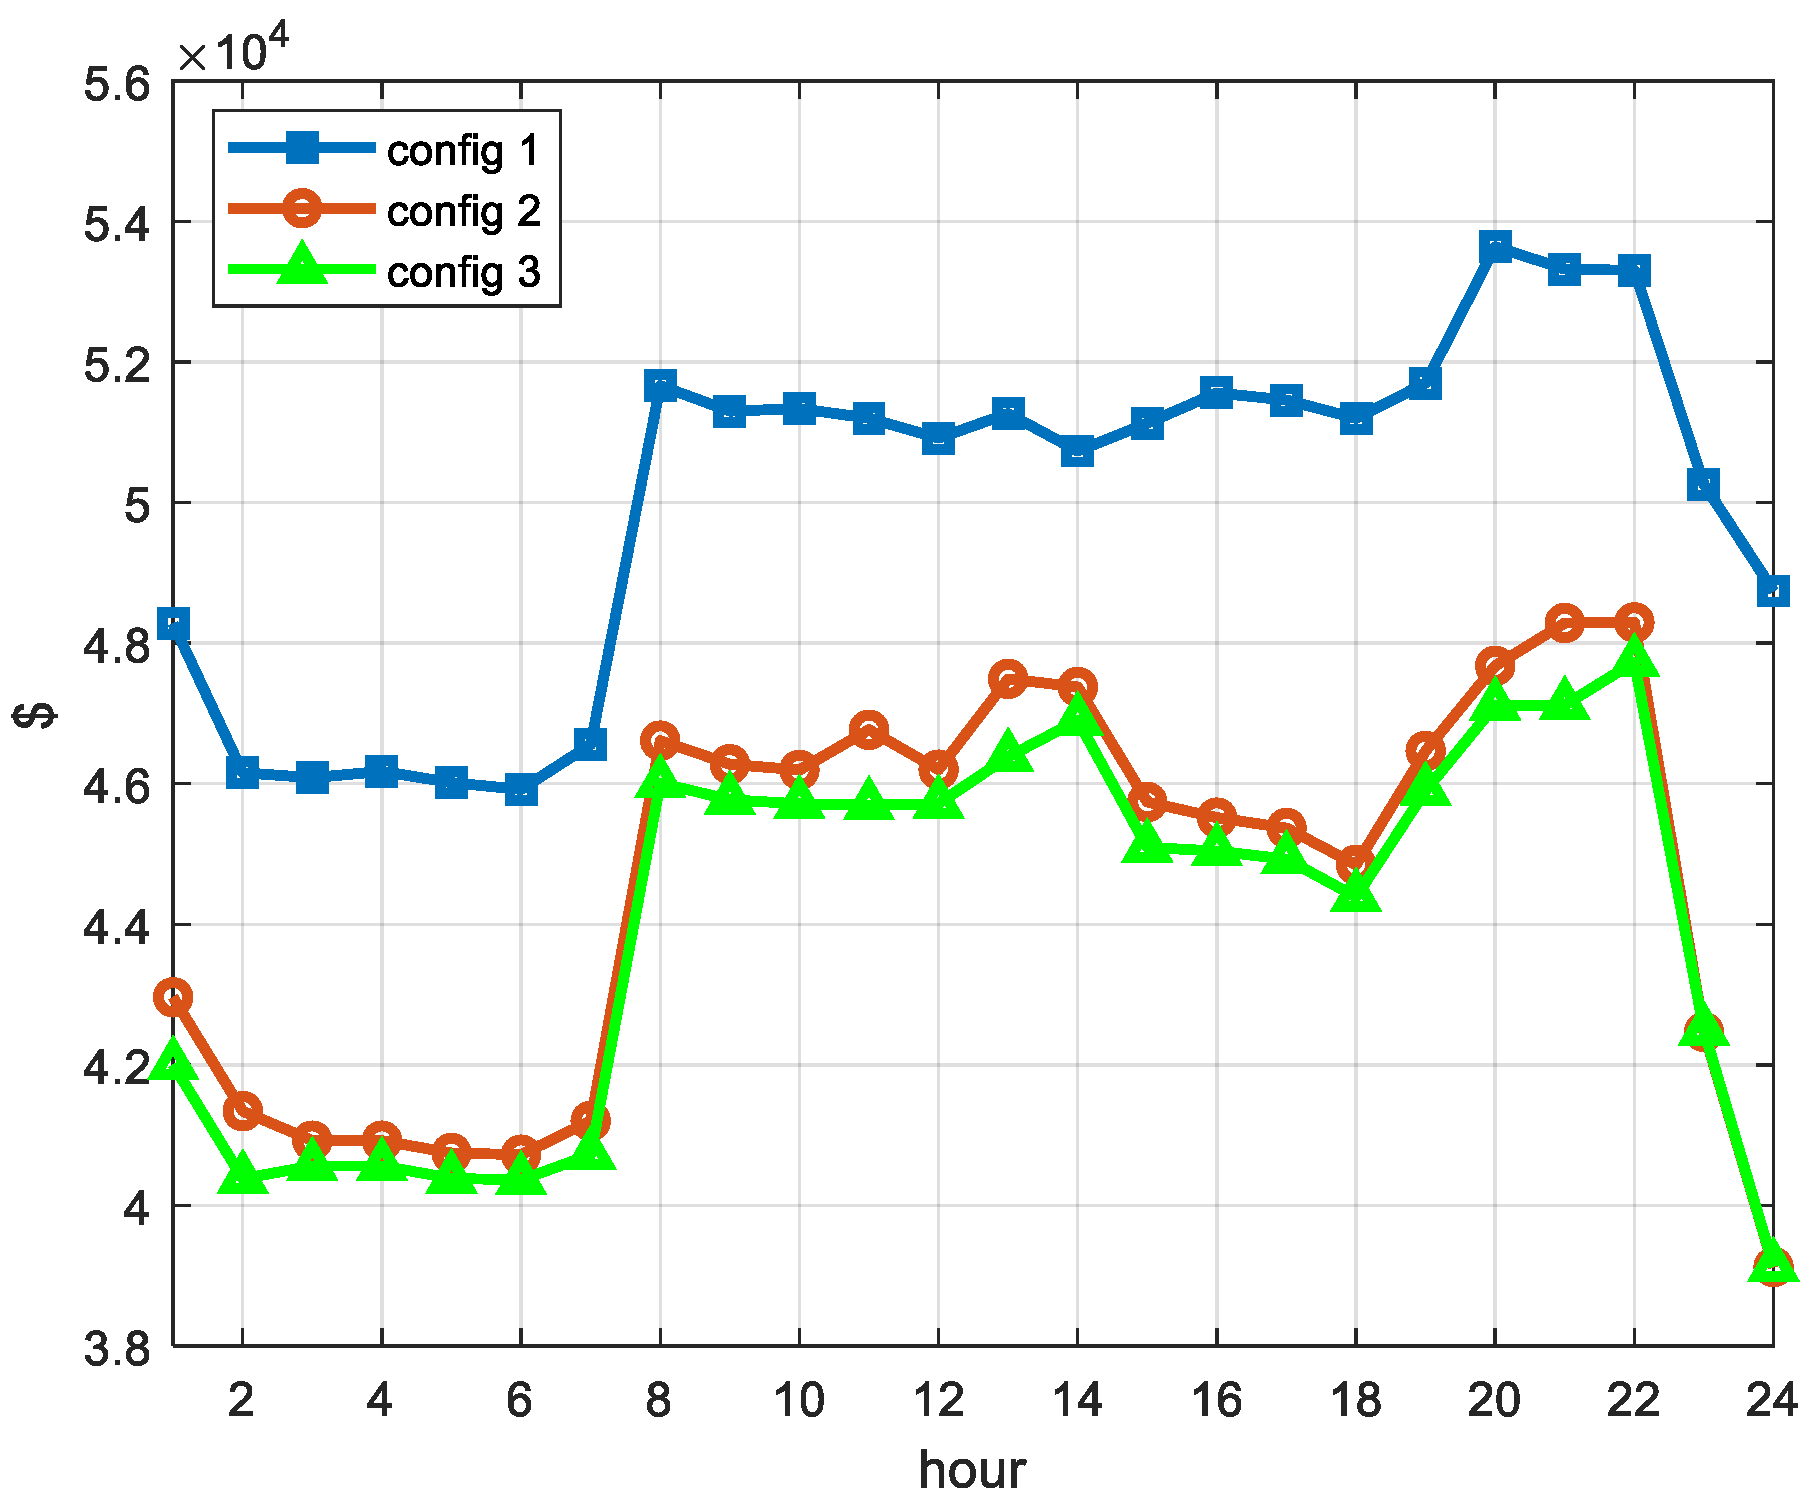
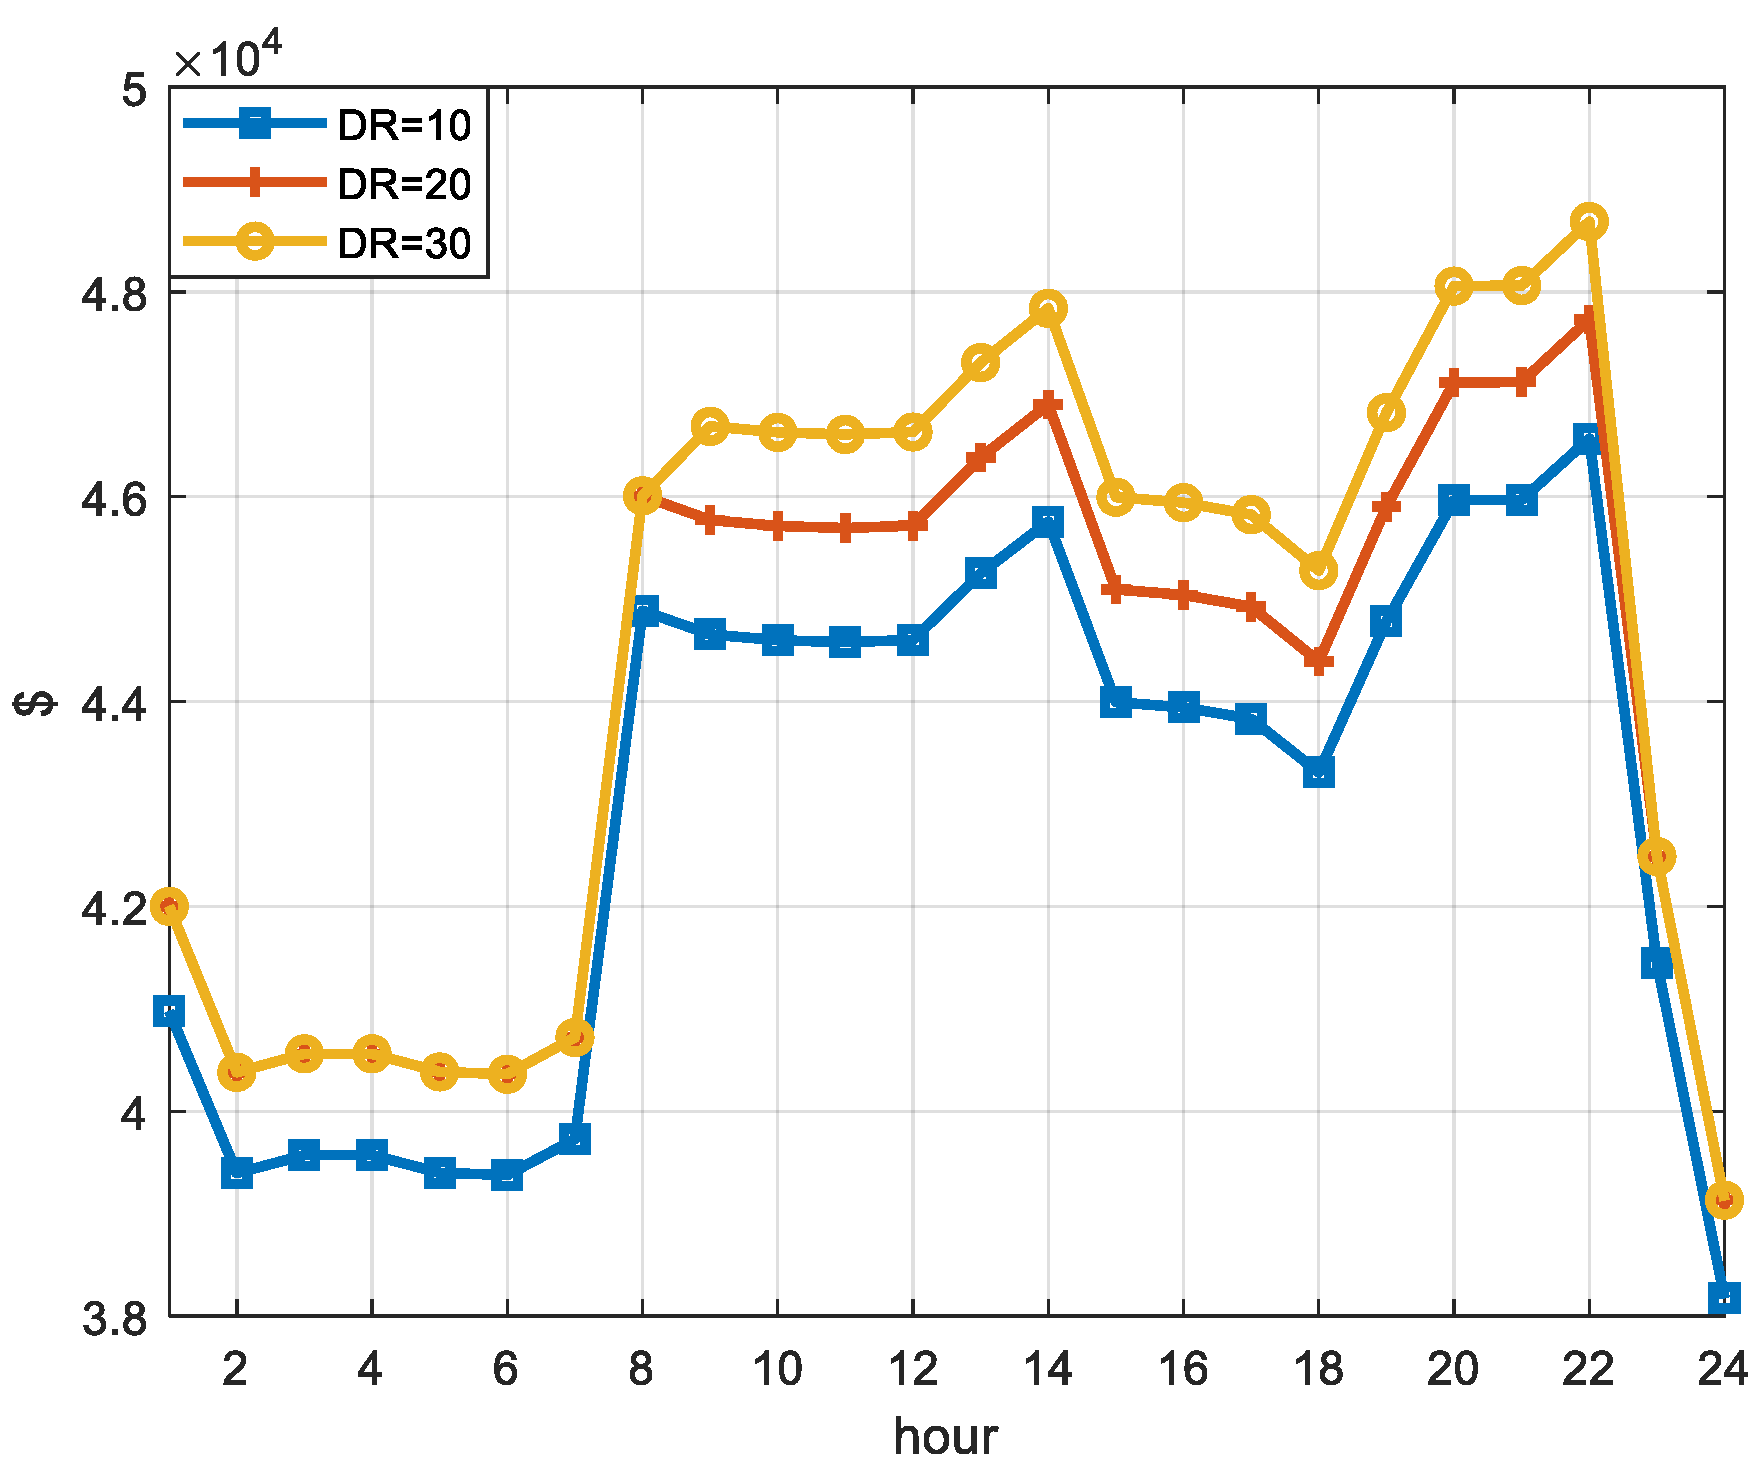
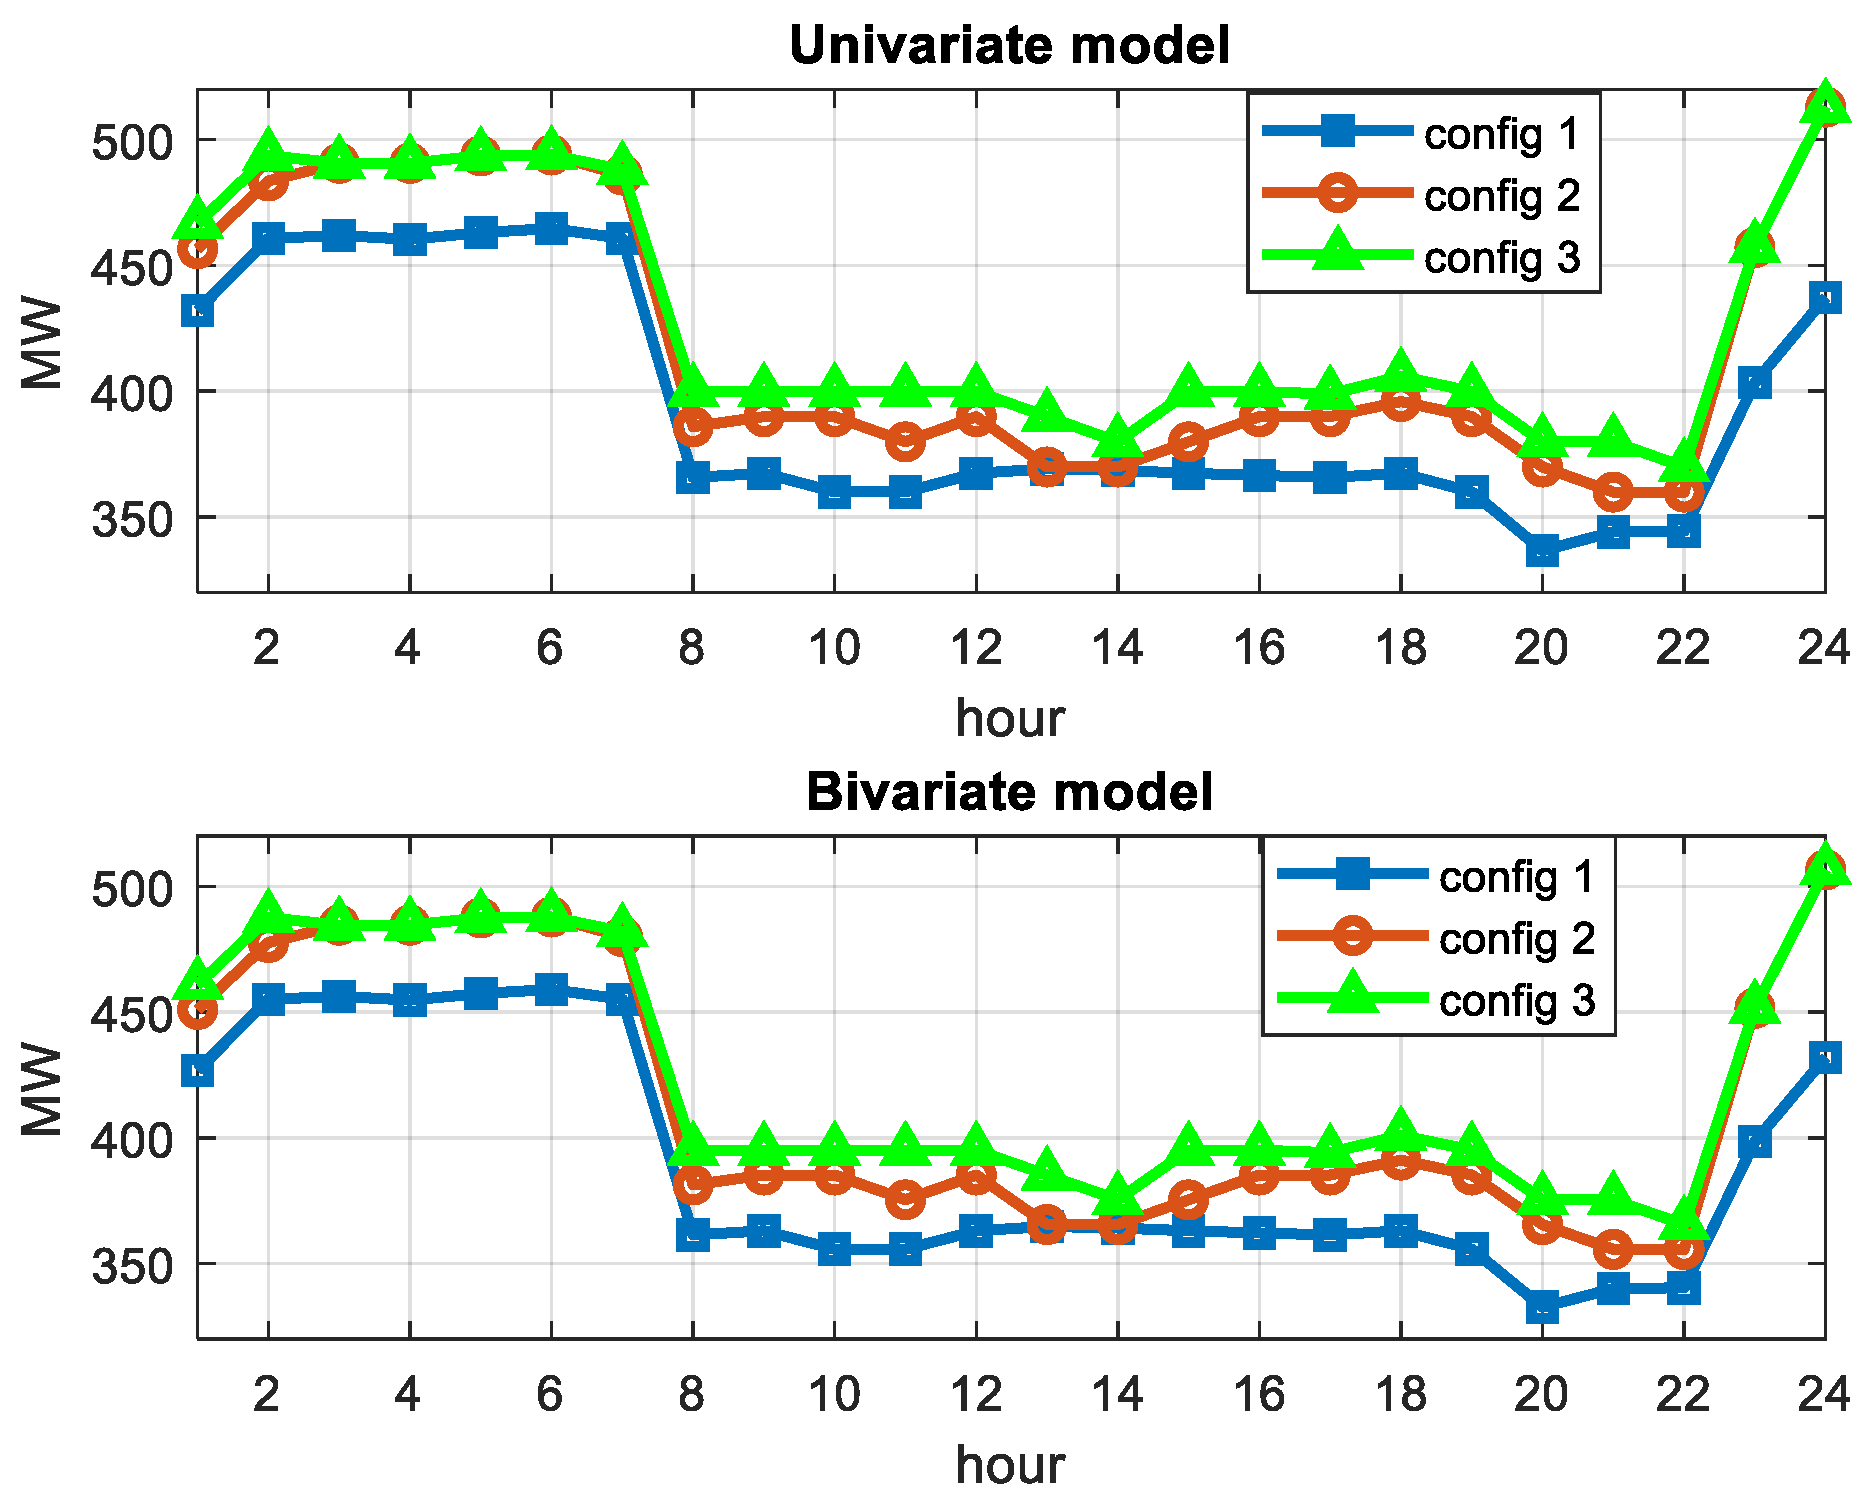
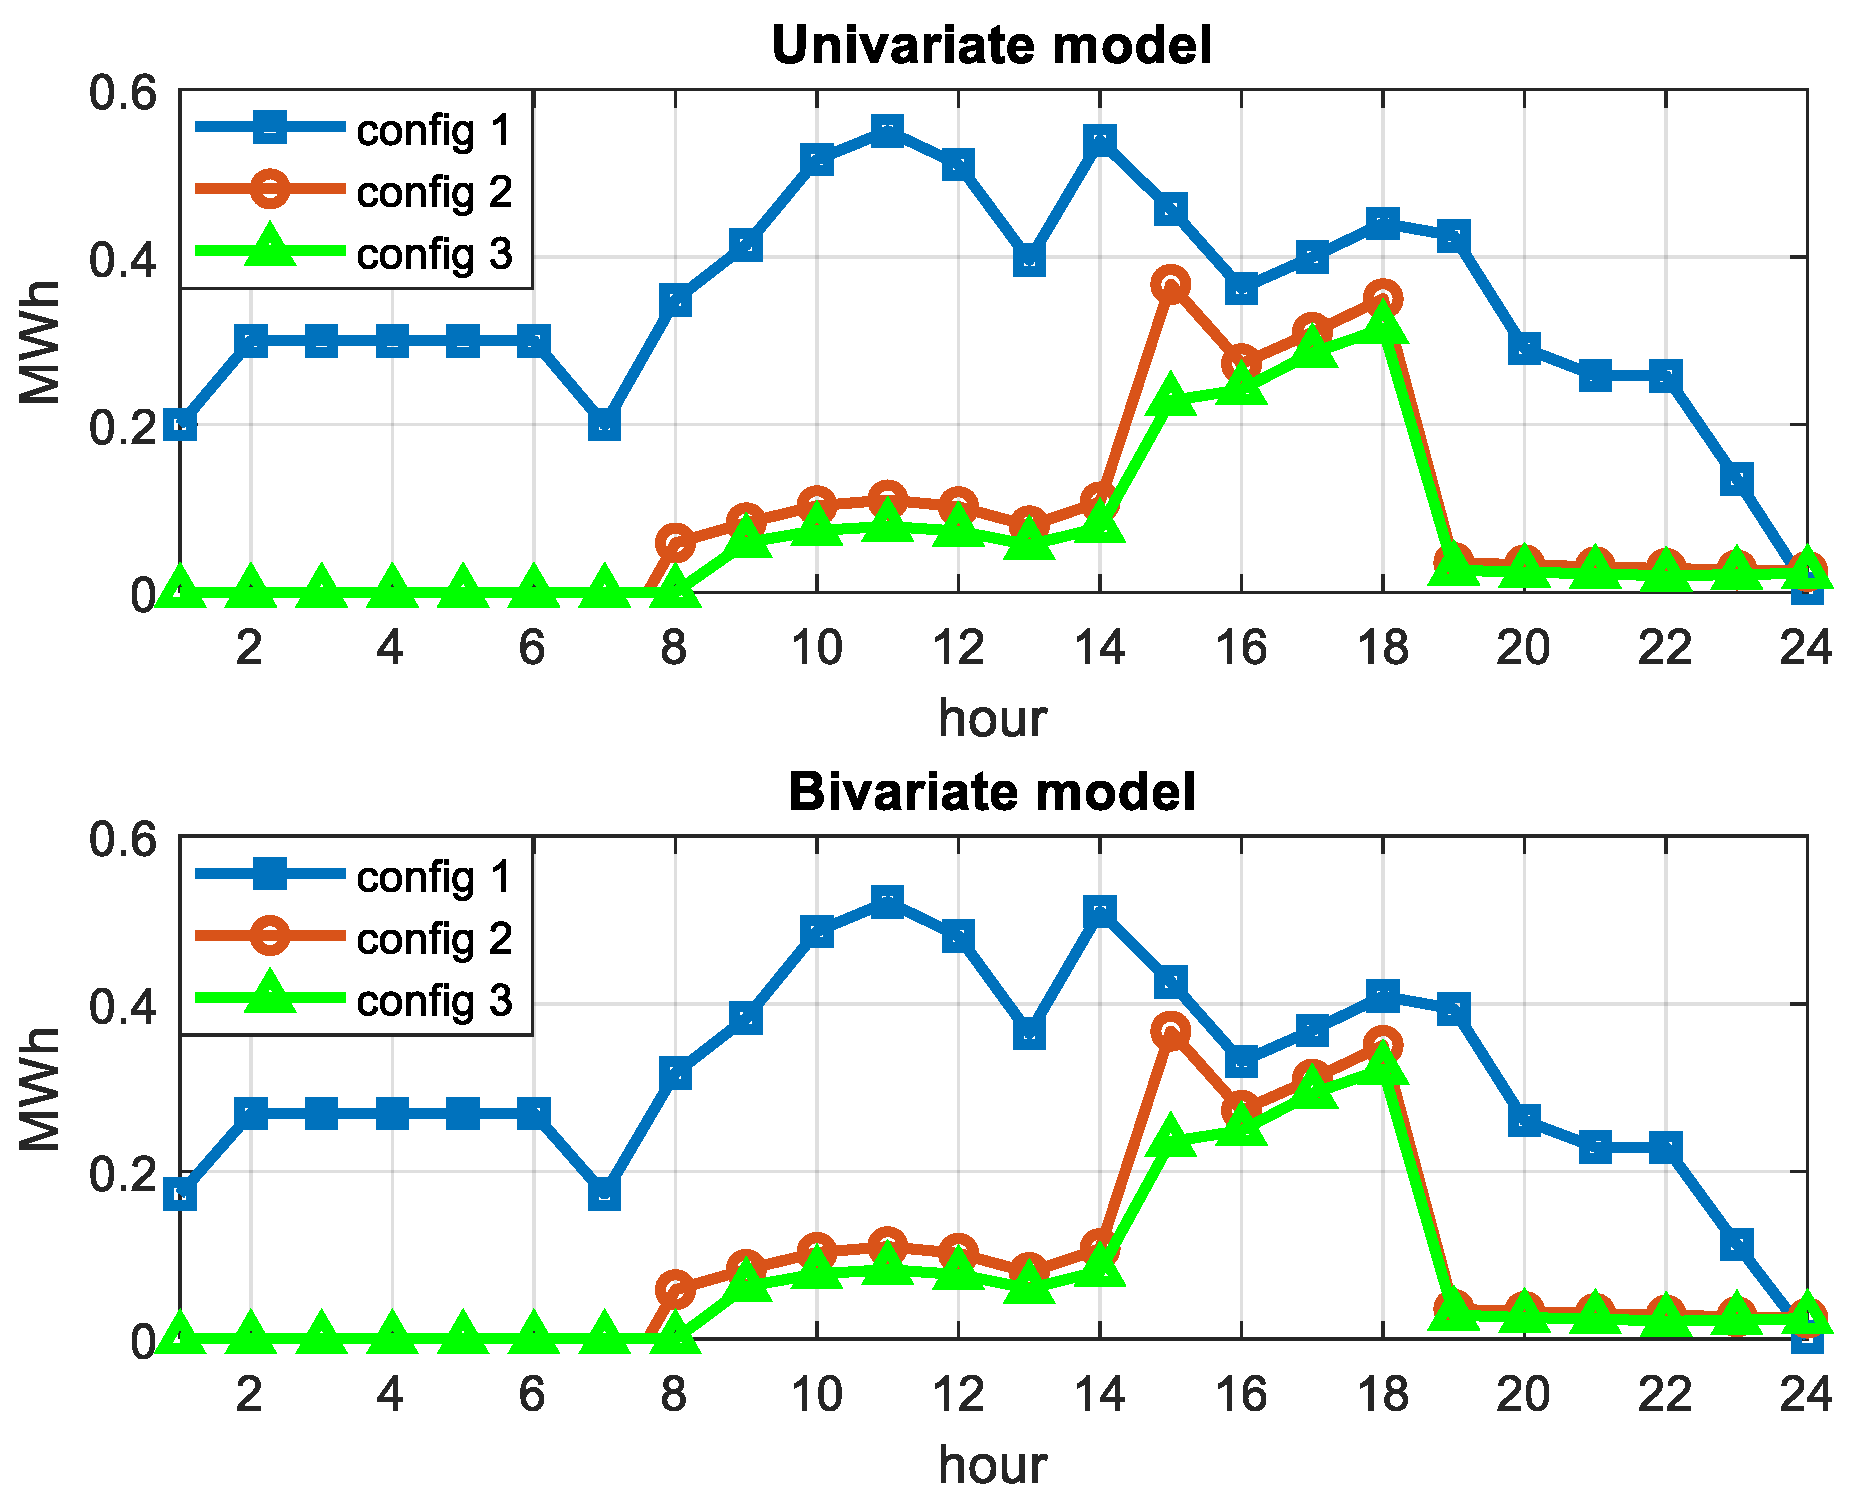
The proposed model was evaluated on the modified version of IEEE two-area RTS. The goal of the case study was to determine how the adequacy and economic performance of Area A system would be affected by participation of inter-zonal capacity and DRPs in the ancillary service market. In addition, the case study aimed at evaluation of the influence of the bivariate wind prediction model on the overall reliability of the test system. Among three considered system configurations, the configuration with inter-zonal capacity and DR has shown the best results with desirable reliability and system costs. According to the analysis, based on the given cost of DR, the presence of DRPs did not affect the reserve requirements during off-peak hours because of their inability to compete with low-cost conventional units. However, during peak-time, DR positively affected the system reliability by reducing the loss of load expectation. Further analysis showed that reduction of DR marginal costs positively affected DRPs ability to compete with conventional units, resulting in inclusion of DR reserves in the off-peak reserve schedule. Finally, the analysis showed that the bivariate wind prediction model reduces the overall reserve requirements and EENS in all three configurations by reducing uncertainty associated with wind forecasting.
This model has demonstrated that diversity in spinning reserve capacity positively affects not only reliability of energy systems, but also the overall social welfare. Future work will focus on extending this model to the multi-connected energy systems with distributed renewable energy sources, as well as on reduction of the uncertainty related to the consumer behavior by implementation of Bayesian network theory.
