Article

Chemical and Mineralogical Composition of Soot and Ash from the Combustion of Peat Briquettes in Household Boilers

Centre ENET—Energy Units for Utilization of Non-Traditional, VŠB—Technical University of Ostrava, 17. Listopadu 15/2172, 708 00 Ostrava-Poruba, Czech Republic
*
Author to whom correspondence should be addressed.
Energies 2019, 12(19), 3784; https://doi.org/10.3390/en12193784
Submission received: 5 September 2019 / Revised: 30 September 2019 / Accepted: 4 October 2019 / Published: 5 October 2019

Abstract

:
Soot and ash as residues from the combustion of peat briquettes were analysed by chemical and mineralogical methods. The study aimed to characterize combustion in domestic boilers of two different emission classes. Ten samples of soot deposited in exhausting ways of boilers were obtained (five of each emission class). The analyses of organic substances in soot were performed using a combination of the methods for the determination of elemental and organic forms of carbon with analytical pyrolysis. Pyrolysis gas chromatography with mass spectrometric detection (Py-GC/MS) allowed the identification of organic compounds belonging to twenty different groups. The major and minor elements in peat briquettes, char and soot, were determined by X-ray fluorescence spectroscopy. The identification of grains and the chemical character of soot was performed using a scanning electron microscope with energy dispersive X-ray spectrometry. The mineral phases in ash were determined by X-ray diffraction. The behaviour of the inorganic elements in combustion products (ash and soot) was studied by means of an enrichment factor. The analytical results are used for characterizing the technological conditions of combustion. The soot deposits from the more advanced boilers with increased combustion temperature contain more organic compounds which indicate the highly carbonized cellulose (benzofurans and dibenzofurans). The increased combustion temperature is indicated by increased concentrations of heterocyclic and aliphatic nitrogen compounds, while the total concentrations of nitrogen in soot from boilers of both types are comparable.

1. Introduction

Peat is formed by the heterogeneous plant material that is decomposed under anaerobic conditions due to the processes in the water-saturated zone flooded permanently or periodically. In addition to its use for energetic purposes, peat is used as a component of substrates in horticulture or as an organic fertilizer in agriculture. It is applied in balneology for peat baths and wraps [1], and as the sorbent [2].
Peat bogs are widespread covering approximately 2–3% of the total land surface of the Earth. The majority of peat bogs occurs at the Northern Hemisphere in the mid/high-latitudes, although they exist in other parts of the world [3]. There are 4 million km2 of peatland in 180 countries in total [4]. From the European Soil Database (v. 1), it follows that peatland in Europe covers an area of 0.3 million km2 [5]. For this estimate, peatland was specified as a peat bog with the concentration of organic matter ˃25% (expressed as a loss on ignition) and with depth ˃30 cm. The peat resources of Europe are located mainly in Scandinavia – one third in Finland and a quarter in Sweden. Other significant sources are in Poland, Norway, Estonia, Latvia, Ireland, Germany, the United Kingdom, the Netherlands, and France. In 2012, the Harmonized World Soil Database v. 1.2 (HWSD) was created where the area of peatland was derived from the area distribution of histosols [6]. The area of peatland reaches 0.59 million km2 in Europe [7]. Based on the results summarised in PEATMAP, an estimated area of peatland in Asia forms 38.4% of global peatland cover. North American peatlands cover 31.6%, followed by Europe at 12.5%, South America at 11.5%, Africa at 4.4%, Australasia and Oceania at 1.6% [8].
Concerning geological reserves, Russia’s peat reserves are 186,027 mil tons [9]. They are among the largest in the world and form up to 60% [10]. An essential contribution to the world’s reserves is Ukraine which has 2,165 mil tons [9], and Belarus has 4,000 mil tons [11]. The countries with the substantial peat reserves include Indonesia (16%), the United States of America (7%), Canada and Finland (both 7%), and a lower quantity of deposits is situated in central Africa. The peat deposits of Indonesia are located on the islands of Sumatra–35%, Kalimantan–32%, Papua–30% and Sulawesi–3% [12].
While peat represents a valuable raw material, it causes difficult environmental problems related to the smouldering of peat bogs. Peat fires appear to be a global threat with considerable atmospheric, climatic, economic, social, ecological, and health impacts [13]. From the point of view of the fuel consumption, the fires and smouldering of peat represent the largest fires on Earth. They have been reported in six continents and cause the haze episodes in the atmosphere [14]. The major contributor to the haze problem in the countries of South-East Asia is wildland peat fires in Sumatra and Kalimantan, Indonesia [15]. The smouldering fires of peat release annually a significantly large amount of deposited carbon that is equivalent approximately to 15% of anthropogenic carbon emissions [16]. The emissions of CO2 and CH4 from the fires of peat bogs are so high, that can change the role of peat bogs as a significant sink of carbon [17] to the considerable emission source of global heating gases [18]. The reported emission factors (EF) of PM2.5 from peat fire range from 6 g/kg [19] to 44 g/kg [20]. They are influenced by variable carbon concentrations in peat from different climate zones (tropical peat, average carbon content of 56.0%, boreal and temperate peat 44.2%). Based on laboratory experiments with smouldering of peat, the authors of [14] reported the value 23.12 g/kg for EF PM2.5 [14]. PM particles released during smouldering of peat also contain other pollutants: metals Zn > Fe > Cr > Pb > Cu > Ni > Cd and ions: NO3 > SO42– > Na+ > Cl > Ca2+ > K+ > F > Mg2+ [21].
Peat is considered to be a fuel with the lowest degree of coalification. Peat is generally regarded as a low-quality fuel source because of its high content of water in addition to lower fuel efficiency. Peat can be regarded as a slowly renewable biomass and carbon-neutral fuel [22]. However, according to the IPCC definitions, peat cannot be categorized as a biofuel or biomass fuel despite its plant origin due to its extremely slow regeneration rate [23]. This categorization brought pressure on decreasing the utilization of peat as fuel, even in countries where it forms the essential source of energy.
The energy utilization of peat relates to its occurrences, which is widespread mainly in South Asia (Indonesia and Malaysia). At the present time, peat resources cover less than 0.1% of the energy consumption in Russia [24]. In Europe, peat is utilized for energy production in Sweden, Finland, Ireland and Baltic countries (Latvia, Estonia and Lithuania). In 2016, peat generated nearly 8% of Ireland’s electricity [25], and one million people use energy peat for home heating. By using peat in Finland, approximately 5–6% of the total energy requirement is met. The share of peat in Finland’s primary energy mix has been gradually declining and today amounts to approximately 4% only [23]. Sweden uses fuel peat for approximately 6% of its electricity and satisfies approximately 2% of the total required heat energy [26]. In Estonia, peat makes up to 5% of the total resources in the total energy balance, thus, it is an essential resource of ensuring energy security and supply reliability [27]. The Czech Republic imports the peat briquettes mostly from Ukraine for domestic heating.
The largest part of the total resources of peat in Ukraine is formed by the peat deposits of the lowland type (96%). The following peat areas can be distinguished in Ukraine: Polissya, Malopolissya, Forest-Steppe, Steppe, and the Carpathians. The conditions for peat formations were the most favourable during the post-glacial period in Polissya. The exploited and potential resources of peat in this region (Volyn, Rivne and Zhytomyr administrative regions) form approximately one-half of the peat reserves of Ukraine. The deposits of peat exploited for energetic purposes include Irvantsivske, Hnyluske and Smolyn (Chernigiv District), Irdyn (Cherkasy District) and the peat deposit Viliya in Rokytnovsky, District of Rivne Region (Rivne Energy Alliance). The Ministry of Energy and Coal Industry of Ukraine directs the exploitation and production of briquettes at the deposit of Smolyn, Company Ukrtorf. Peat from Ukraine is currently exported mostly to Russia, Germany, Turkey, and Italy. The second significant importer of peat briquettes to the Czech Republic is Belarus from the deposits of Zelenoborskoye, Minsk Region and Vitebskoye, Vitebsk Region [11]. The imported briquettes from Ukraine and Belarus are characterized by the low content of ash of up to 10%. The concentrations of the major elements C, H, N, S and O are similar, and the differences can be found in the concentrations of organic compounds in the relationship with the conditions of peat origin [13].
Peat briquettes have slow regular burning with a long time of smouldering and burning (up to 7 h). They are suitable for heating during both the night and day. Peat briquettes are manufactured from peat of selected quality by pressing under high pressure without any binders. They are suitable for all types of boilers, stoves and fireplaces designed for solid fuels. A drawback of the combustion of peat briquettes in domestic stoves is the high emission factor PM2.5 (210 mg/MJ) that is higher than the emission factor for coal (189 mg/MJ) and more than two times higher (95 mg/MJ) in comparison with the combustion of wood [28] and also produces high emissions of NOx. The linear relationship was found for the concentration of nitrogen in the fuel and emissions of NOx during combustion of wood and coal in the domestic heating [28].
Peat originated from various plant materials and its organic composition for different European and other world localities were described by Dehmer [29]. The presence and concentrations of organic compounds in peat and consequently, the peat quality depend on many various factors, such as the morphology of landscape, plant species and the environmental factors [30]. Organic mass is produced with plant tissues at varying stages of decomposition, according to which peat can be classified as fibric, hemic, or sapric [31]. The authors of [32] studied various chemical compounds in peat from southern Poland. From these reasons, differences exist in the organic composition of the combustion side products. The differences caused by the organic composition of the input material can be successfully identified using elemental analysis (identification and quantification of H, C, O and their ratios) and Py-GC/MS analysis [33].
Peat fuel has an energy-content similar to lignite coal [34]. Peat contains more than 85% of organic matter (OM) by dry mass that is made of plant tissues at varying stages of decomposition, with major organic compound classes being cellulose, hemicellulose, lignin, cutin, humic acids and fulvic acids [35]. Other plant decomposition products can also be present: saccharides, proteins, terpenes, alkaloids. The presence of organic compounds in peat is determined by the character of the original plant material. The non-complete combustion of peat contributes to the increase in emissions of CO, NO2, SO2 and O3 [21].
The chemical compounds released during tropical peat fires were identified by Roulston [36]. Levoglucosan, mannosan, syringaldehyde, vanillin, syringic acid, vanillic acid, and n-alkanes are conventional tracers for biomass burning. The specific ratios of these compounds were suggested as indicators of peatland fire emissions in the ambient air impacted by peat smoke [37].
The organic compounds contained in combustion products of peat briquettes (deposits in exhaust ways) from household boilers are not known. Some organic compounds are bound in the deposits, and they are not further transported in the form of gaseous emissions. The origin of organic compounds during the combustion of peat briquettes is influenced by the conditions of combustion, the type of combustion equipment and its emission class. The contribution of this work consists in the identification of the differences in the composition and concentrations of organic compounds in the deposits from exhaust ways for boilers of emission classes 2 and 3 (EC2 and EC3).
The main new contribution of this work is an identification of the organic composition of soot from the deposition on the inner parts of a boiler. The data on the organic composition of soot from boilers of different emission classes obtained by the combustion of unusual fuels as peat briquettes are not known. This work proves that the analysis of organic compounds in the deposits of soot makes it possible to verify the technological improvements of boilers.

2. Materials and Methods

The peat briquettes imported into the Czech Republic from Ukraine were bought from the seller of solid fuels. The peat briquettes were of prismatic shape with a size of 165 × 65 × 35 mm. The briquettes were burned in boilers of emission classes 2 and 3 with manual loading within five days. Ten samples were obtained altogether. From this number, one sample from boiler EC3 was anomalous (122) and based on a T-test, it was excluded from the set. The amounts of burned fuel and produced soot were determined by weighing. The deposits were sampled from the inner part of the boiler (walls, segment ribs) when each combustion experiment was completed. The duration of the combustion was recorded. During the combustion, the temperature reached 600 °C to 800 °C. The weight of the sampled deposits and experimental conditions are listed in Table 1.

2.1. Chemical and Mineralogical Methods

Pyrolysis gas chromatography with mass spectrometry (Py-GC/MS) was used to identify the organic compounds present in the soot [38]. The analytical equipment was formed by Pyroprobe 5200, CDS Analytical Inc. and gas chromatograph 7890 A Agilent.
The ASTM D 3172-76, Standard Practice for Proximate Analysis of Coal and Coke, was used for the proximate analysis of peat briquettes with the utilization of LECO analyser TGA 701. The ultimate analysis of peat was determined using an elemental analyser, FlashSmart CHNS/O (Thermo Fischer Scientific) in accordance with the standard ASTM D 3176-84, Standard Practice for Ultimate Analysis of Coal and Coke. The unburned carbon and soot in ash was determined according to ASTM D6316‒17, Standard Test Method for Determination of Total, Combustible and Carbonate Carbon in Solid Residues from Coal and Coke. The content of organic carbon (OC) and elemental carbon (EC) in the sediment samples (soot) was determined by the thermal/optical reflectance (TOR) method with the IMPROVE temperature protocol by the Sunset Laboratory (USA) OC/EC analyser. A solid sample (approximately 4 mg) was mixed with deionized water. The suspended particles were captured on a quartz fibre filter. Following this, the sample was dried in an oven at 36 °C for 24 h. Subsequently, the contents of OC, EC and ash in soot were determined. The conversion of the OC values to organic matter (OM) was performed in this work using multiplication of OC by factor 1.4 [39].
The major and minor elements in peat briquettes, char, and soot were determined according to ASTM D4326–13, Standard Test Method for Major and Minor Elements in Coal and Coke Ash by X-Ray Fluorescence, with Innov-X Delta – Professional Environmental Handheld XRF Analyser, Olympus. The certified Reference Material BRC-038 fly ash from pulverized coal (Institute for Reference Materials and Measurements European Commission) was utilized.
The identification of grains and the chemical character of soot was performed using auto-emission scanning electron microscope FEI Quanta-650 FEG manufactured by FEI Co. It is equipped with an energy dispersive X-ray spectrometric analyser (EDX)-EDAX Galaxy. The standardless analyses were only performed using the corrections for concentrations of the light elements based on a set of standard materials. The mineralogical phase analyses of peat briquettes and ash samples were performed by X-ray diffraction (Diffractometer Bruker Advance D8).

2.2. Leachability

The aqueous extract (1:10) from both the ash and soot was prepared according to EN 12457-4:2002, Characterization of Waste. The standard methods were used to determine the electrical conductivity: ASTM D1125-14, Standard Test Methods for Electrical Conductivity and Resistivity of Water. The water-soluble ions were determined by ion chromatography according to ISO 14911:1998, Water Quality. Determination of Dissolved Li+, Na+, NH4+, K+, Mn2+, Ca2+, Mg2+, Sr2+, Ba2+ Using Ion Chromatography and ASTM D 4327, Standard Test Method for Anions in Water by Suppressed Ion Chromatography. The water extract was analysed by ion chromatography with the instrument 850 Professional IC (Metrohm). The spectrophotometric methods were used to determine the concentrations of nitrates (ISO 7890–3:1988) and ammonia ions (ISO 7150-1).

3. Results and Discussion

3.1. The Conditions of the Combustion of Peat Briquettes

Table 1 presents the conditions of the combustion of peat briquettes. The boxplots (Figure 1) characterize the amounts of soot produced by the combustion of 1 kg of fuel. The amount of soot trapped in the boiler EC3 is higher than that of EC2. A statistically significant relationship was found between the amount of soot produced by 1 kg of fuel and the speed of burning (r = 0.65) at the significance level of 0.025 (Figure 2). The amount of trapped soot is lower with a higher speed of burning. However, the concentration of organic compounds trapped in soot and determined by the method of Py-GC/MS are relatively lower due to the unfinished non-complete decomposition of fuel. In contrast, a decrease of concentrations of organic compounds in emissions PM10 during the increased speed of burning was reported by the authors of [40], who explained this by the more pronounced partitioning of organic compounds into the vapour phase due to the increased temperatures of the flue gases. The optimal burning speed for a wood stove is considered to be 1.5–3 kg/h [40,41]. In this work, the burning speed in boiler EC3 was comparable, while boiler EC2 was higher than this optimal value (Table 1). Ten samples were obtained in total. From this number, one sample from boiler EC3 was anomalous (122), and it was excluded from the set based on a two-sample t-test analysis (OriginPro 2019).
The statistically significant relationship (r = 0.85) at the significance level of 0.05 was found between the amount of soot released from 1 kg of fuel and the concentration of trapped organic compounds. The lowest concentrations of the sum of organic compounds and organic carbon were determined for the highest amount of produced soot per kilogram of fuel. The correlation coefficient had a value r = 0.80 with the critical value fulfilled at the significance level of 0.01.
The comparison of the parameters obtained by proximate and ultimate analysis for peat briquettes and wood is presented in Table 2. Peat briquettes contain, in comparison with wood, approximately 10–20 times more nitrogen, sulphur and ash. The content of volatile combustibles (VM) is lower by 10–15%. The mineralogical composition of peat briquettes confirmed that the major mineral of ash is quartz and admixtures in trace amounts are formed by clay minerals (illite and kaolinite). Sulphur does not form any mineral but is contained in the organic matrix together with nitrogen.

3.2. Product of the Combustion

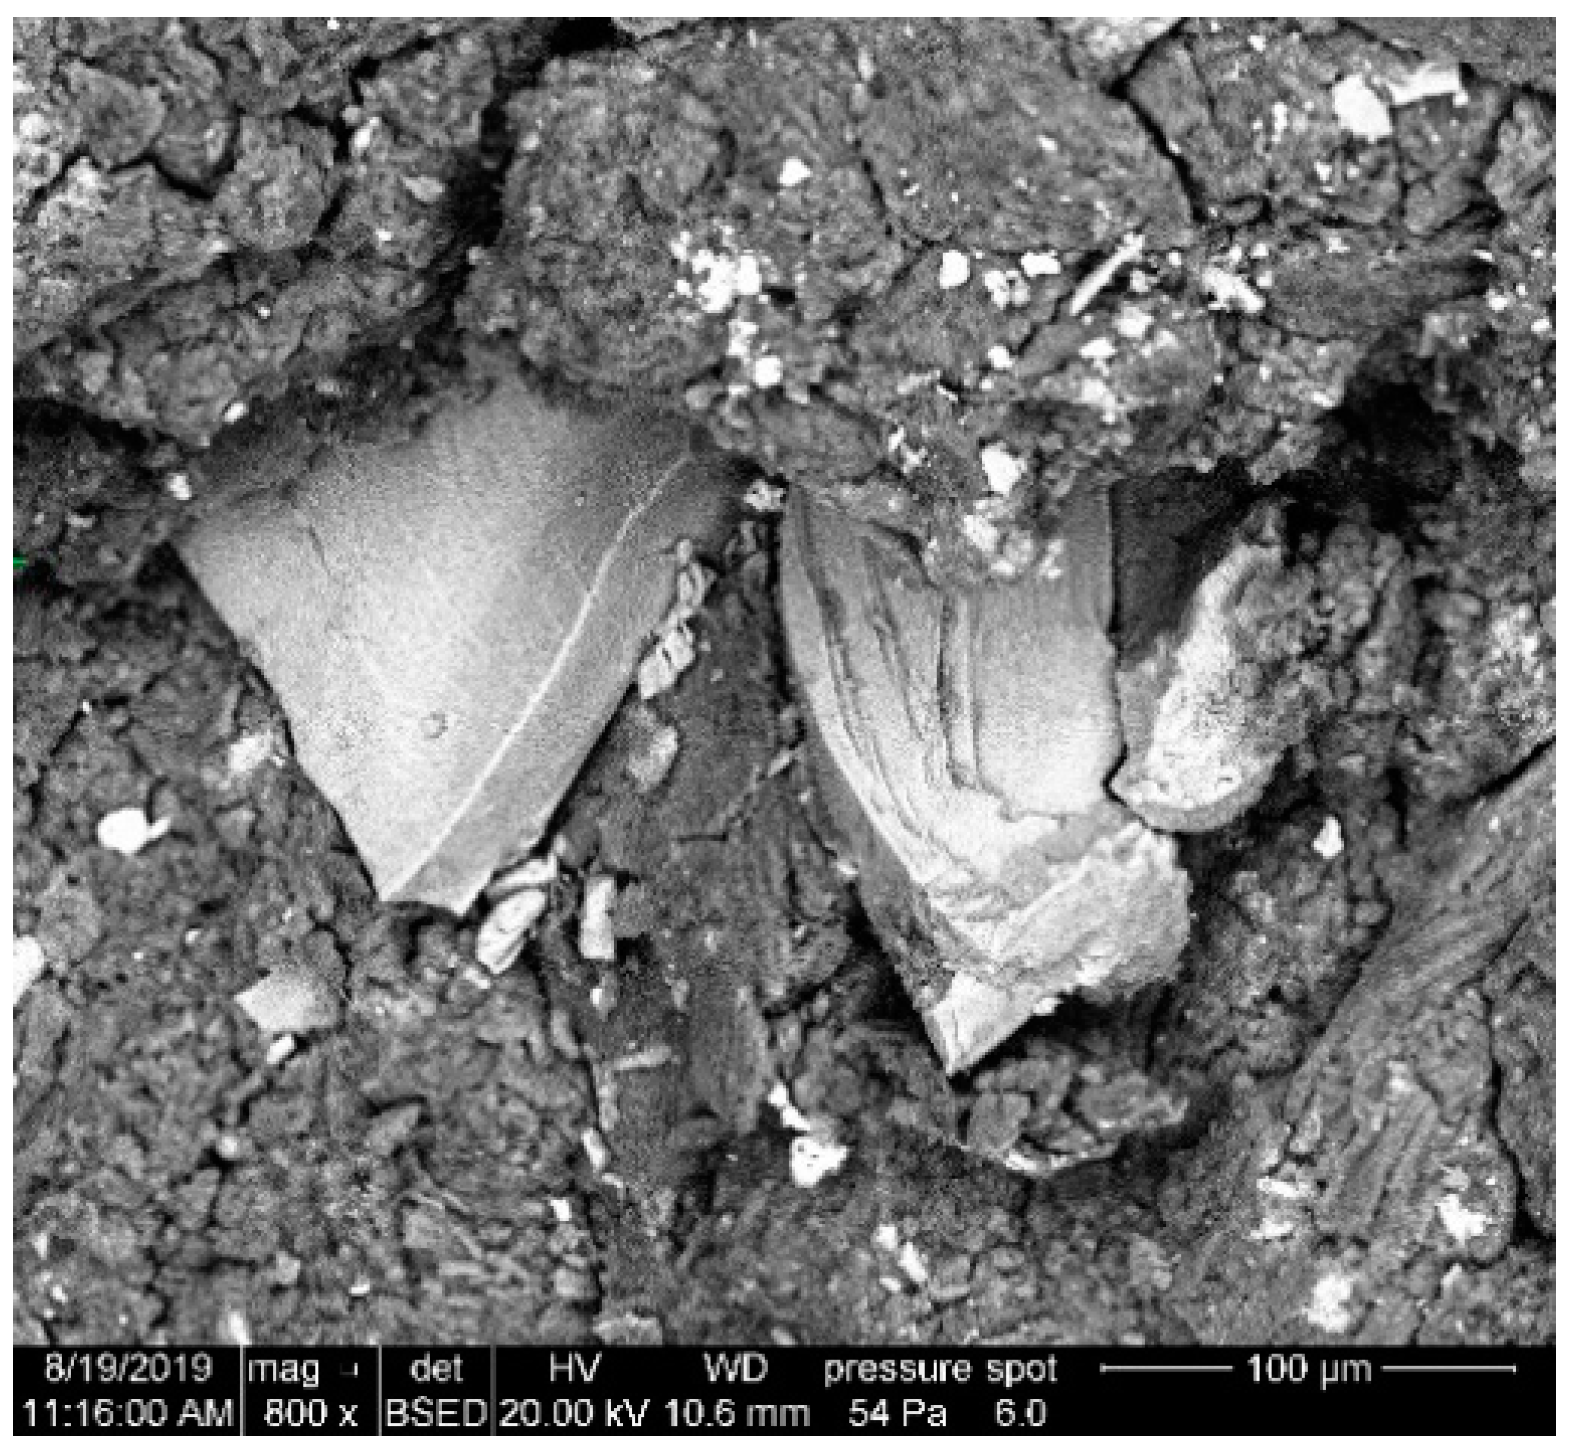
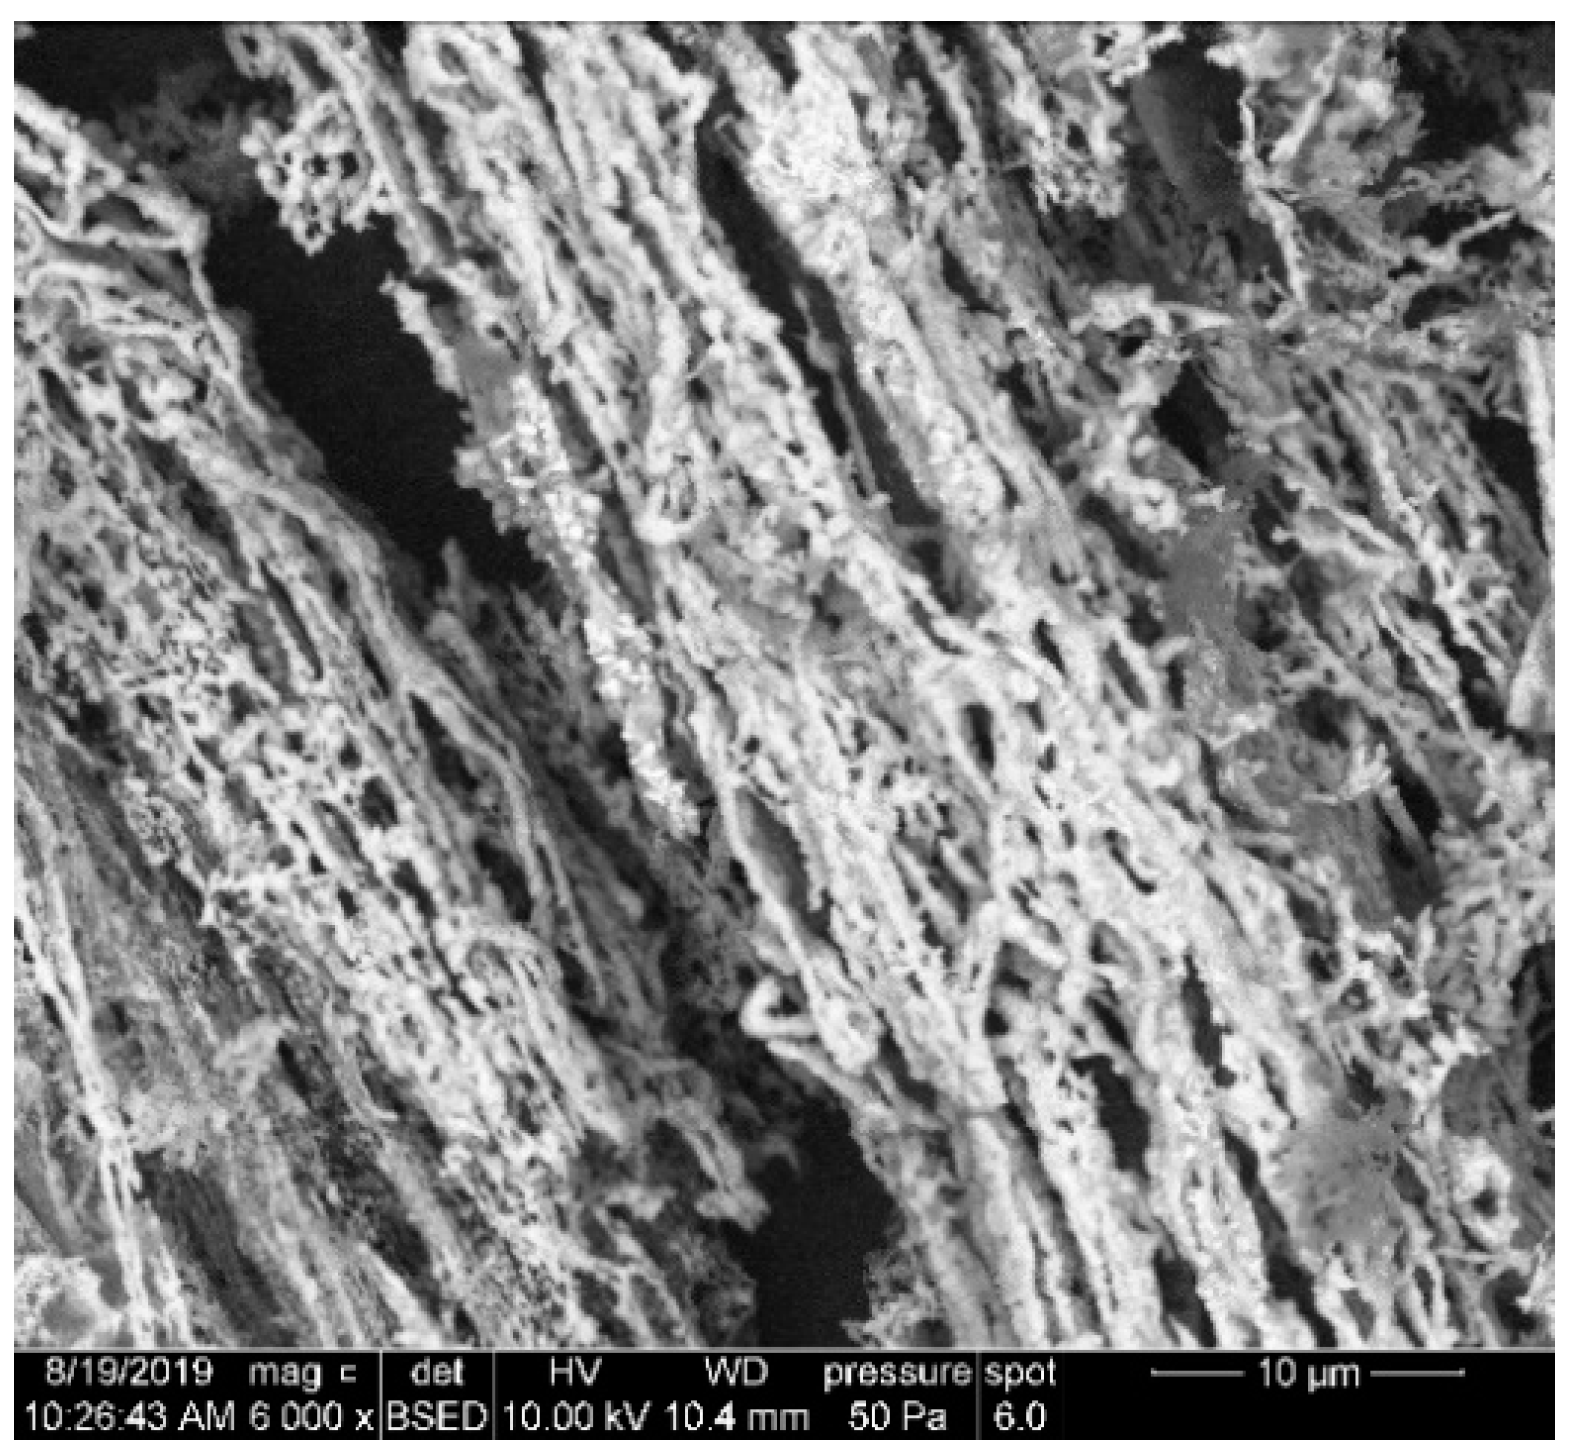
The peat ash contains minerals of silicon, aluminium, calcium, and iron. Its composition depends on the locality of the origin [4]. The peat briquettes used in this study contain significantly higher concentrations of Ca (3.8%) than peat from other localities (Table 3). The sample of peat briquettes does not contain any Ca-bearing mineral and ash is formed mainly by quartz (Figure 3). The mineralogical composition of the crystalline phase of ash from the combustion of peat briquettes (Figure 4) was formed, besides quartz (31%), mainly by minerals containing calcium: calcite CaCO3 (12%), anhydrite CaSO4 (9%), brownmillerite Ca2(Al,Fe)2O5 (22%), tricalcium silicate Ca3O5Si (11%), gehlenite Ca2Al(AlSiO7) (11%) and in minor concentrations, minerals containing Fe‒magnetite Fe3O4 (4%).
The behaviour of the inorganic elements in combustion products (ash and soot) was studied by means of the enrichment factor (EF) calculated either as a ratio of the concentrations of the element in ash and peat briquette or as a ratio of the concentrations of soot/peat briquette [42]. The enrichment of the element can also be calculated using normalization, employing a stable element, e.g., Al [43]. The relative enrichment (RE) was introduced by Meij [44] and was applied by the authors of [45]. It is defined as:
RE = ( c o n c e n t r a t i o n   i n   a s h c o n c e n t r a t i o n   i n   c o a l ) × ( a s h   c o n t e n t   i n   c o a l 100 )
A comparison of the chemical composition of peat from the data in the literature is presented in Table 3. Calcium, Fe and Si from the major elements have the highest concentrations in peat briquettes. Zn has the highest concentration from trace elements (27 mg/kg d.m.). However, the concentration of Zn was lower than the published data for the UK, Norway, Germany, Estonia and Russia. In the Czech Republic, the prevailing kind of fuel in domestic boilers is still coal. From Table 3, it follows that the concentrations of the trace elements in peat briquettes are lower than those in lignite. Some authors reported the higher concentrations of trace elements: Heavy metals as a consequence of sorption and the sedimentation processes in territories intensively influenced by industrial activity (metallurgy, power stations, etc.). In the industrial region of Upper Silesia in southern Poland, in the area influenced by metallurgy, the concentrations in an upper layer of peat bog reached for Zn 494 mg/kg, Pb 238 mg/kg and Cd 16 mg/kg [46]. Even a higher maximum concentration of 2256 mg/kg was determined for lead in peats of the Hartz region in Germany [47]. The concentrations of trace elements (As, Cd, Pb, Ti and Zn) in peat used as fuel are especially important because their emissions are linearly dependent on their initial concentrations. During combustion, approximately 60% of Pb and 40% of Zn is released [48].
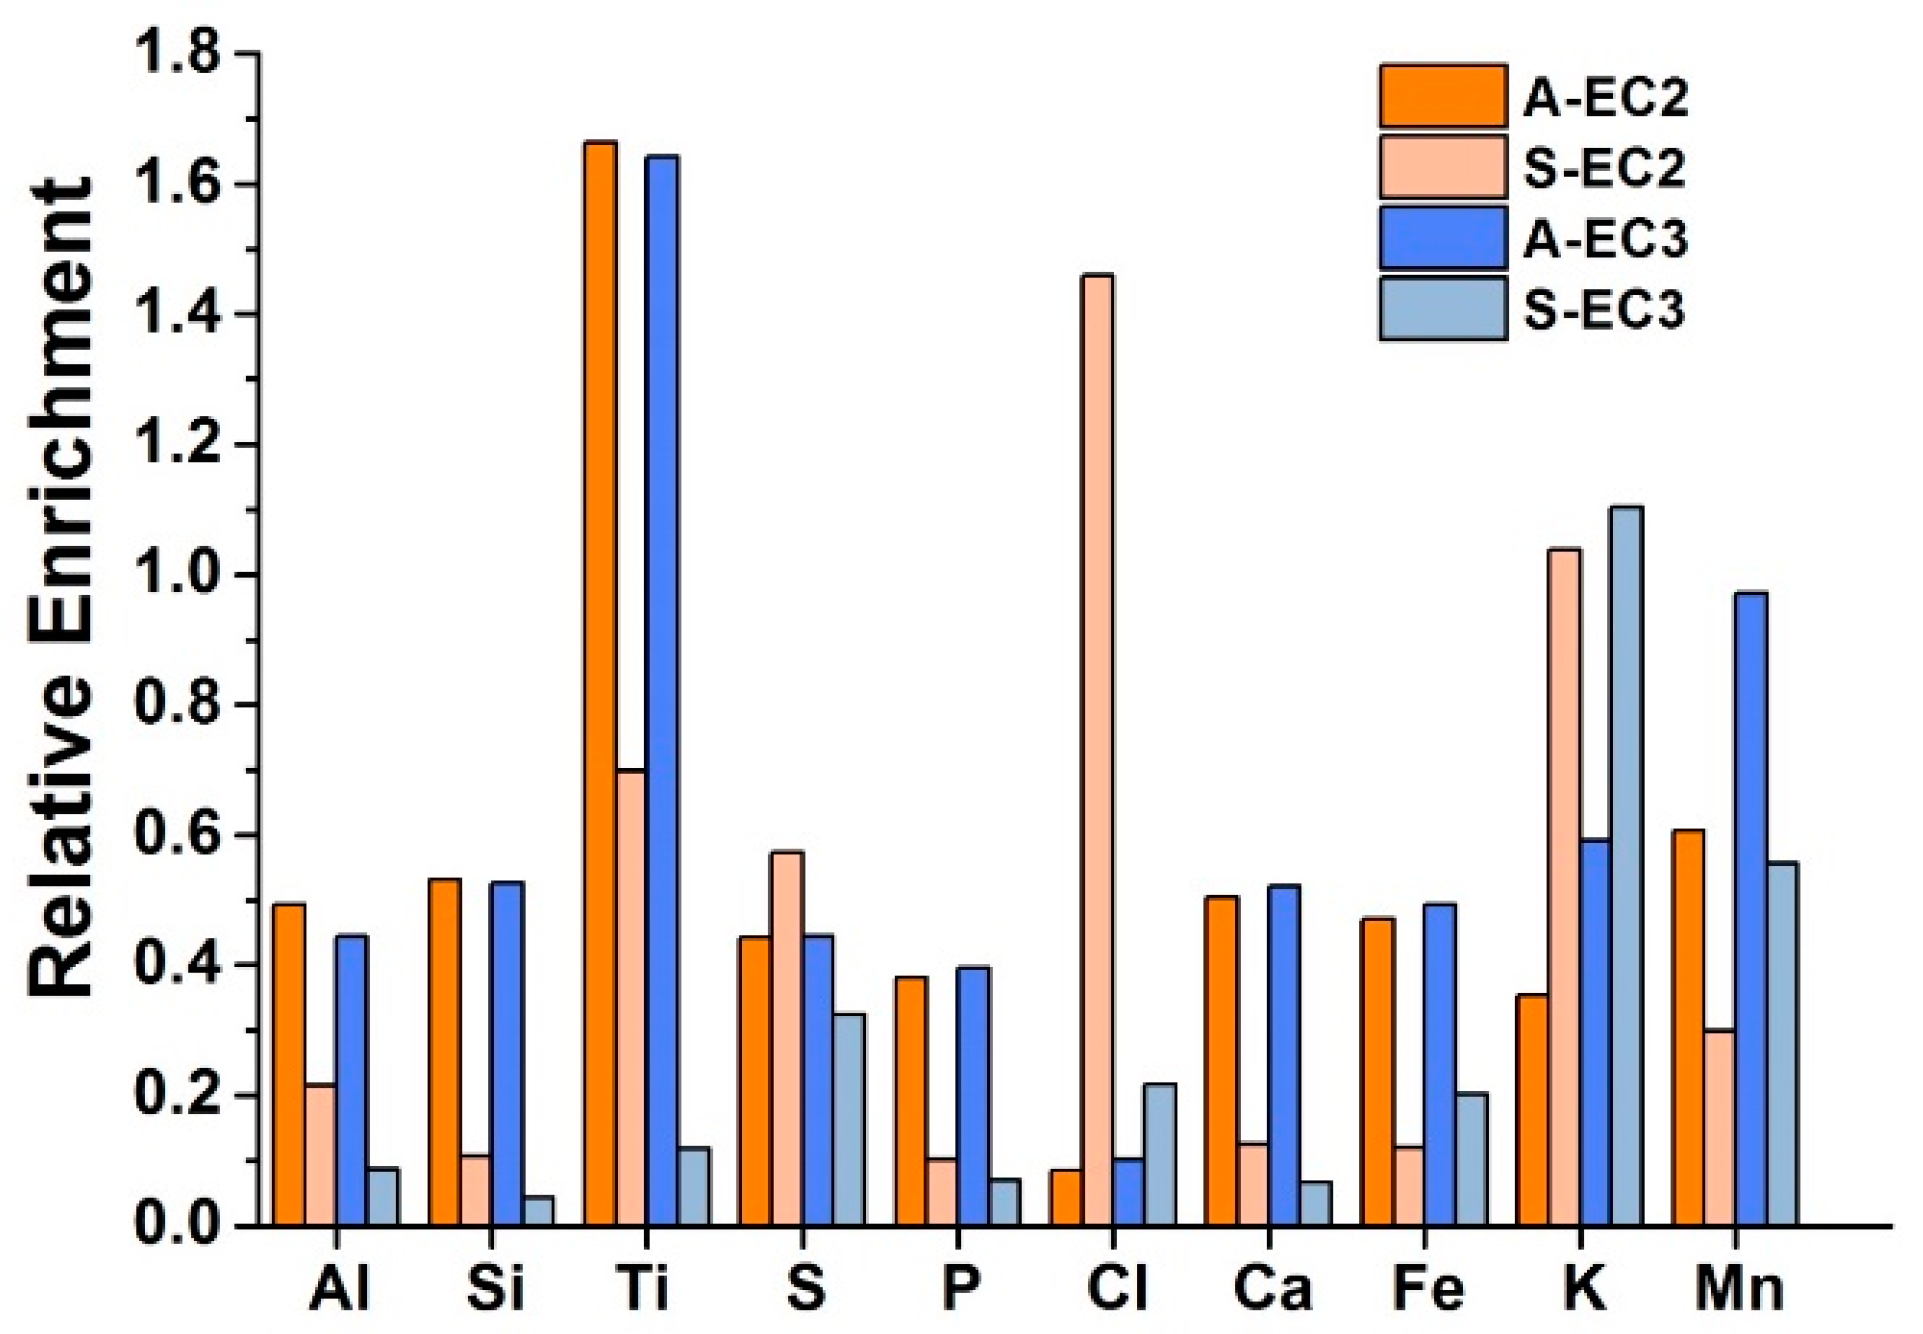
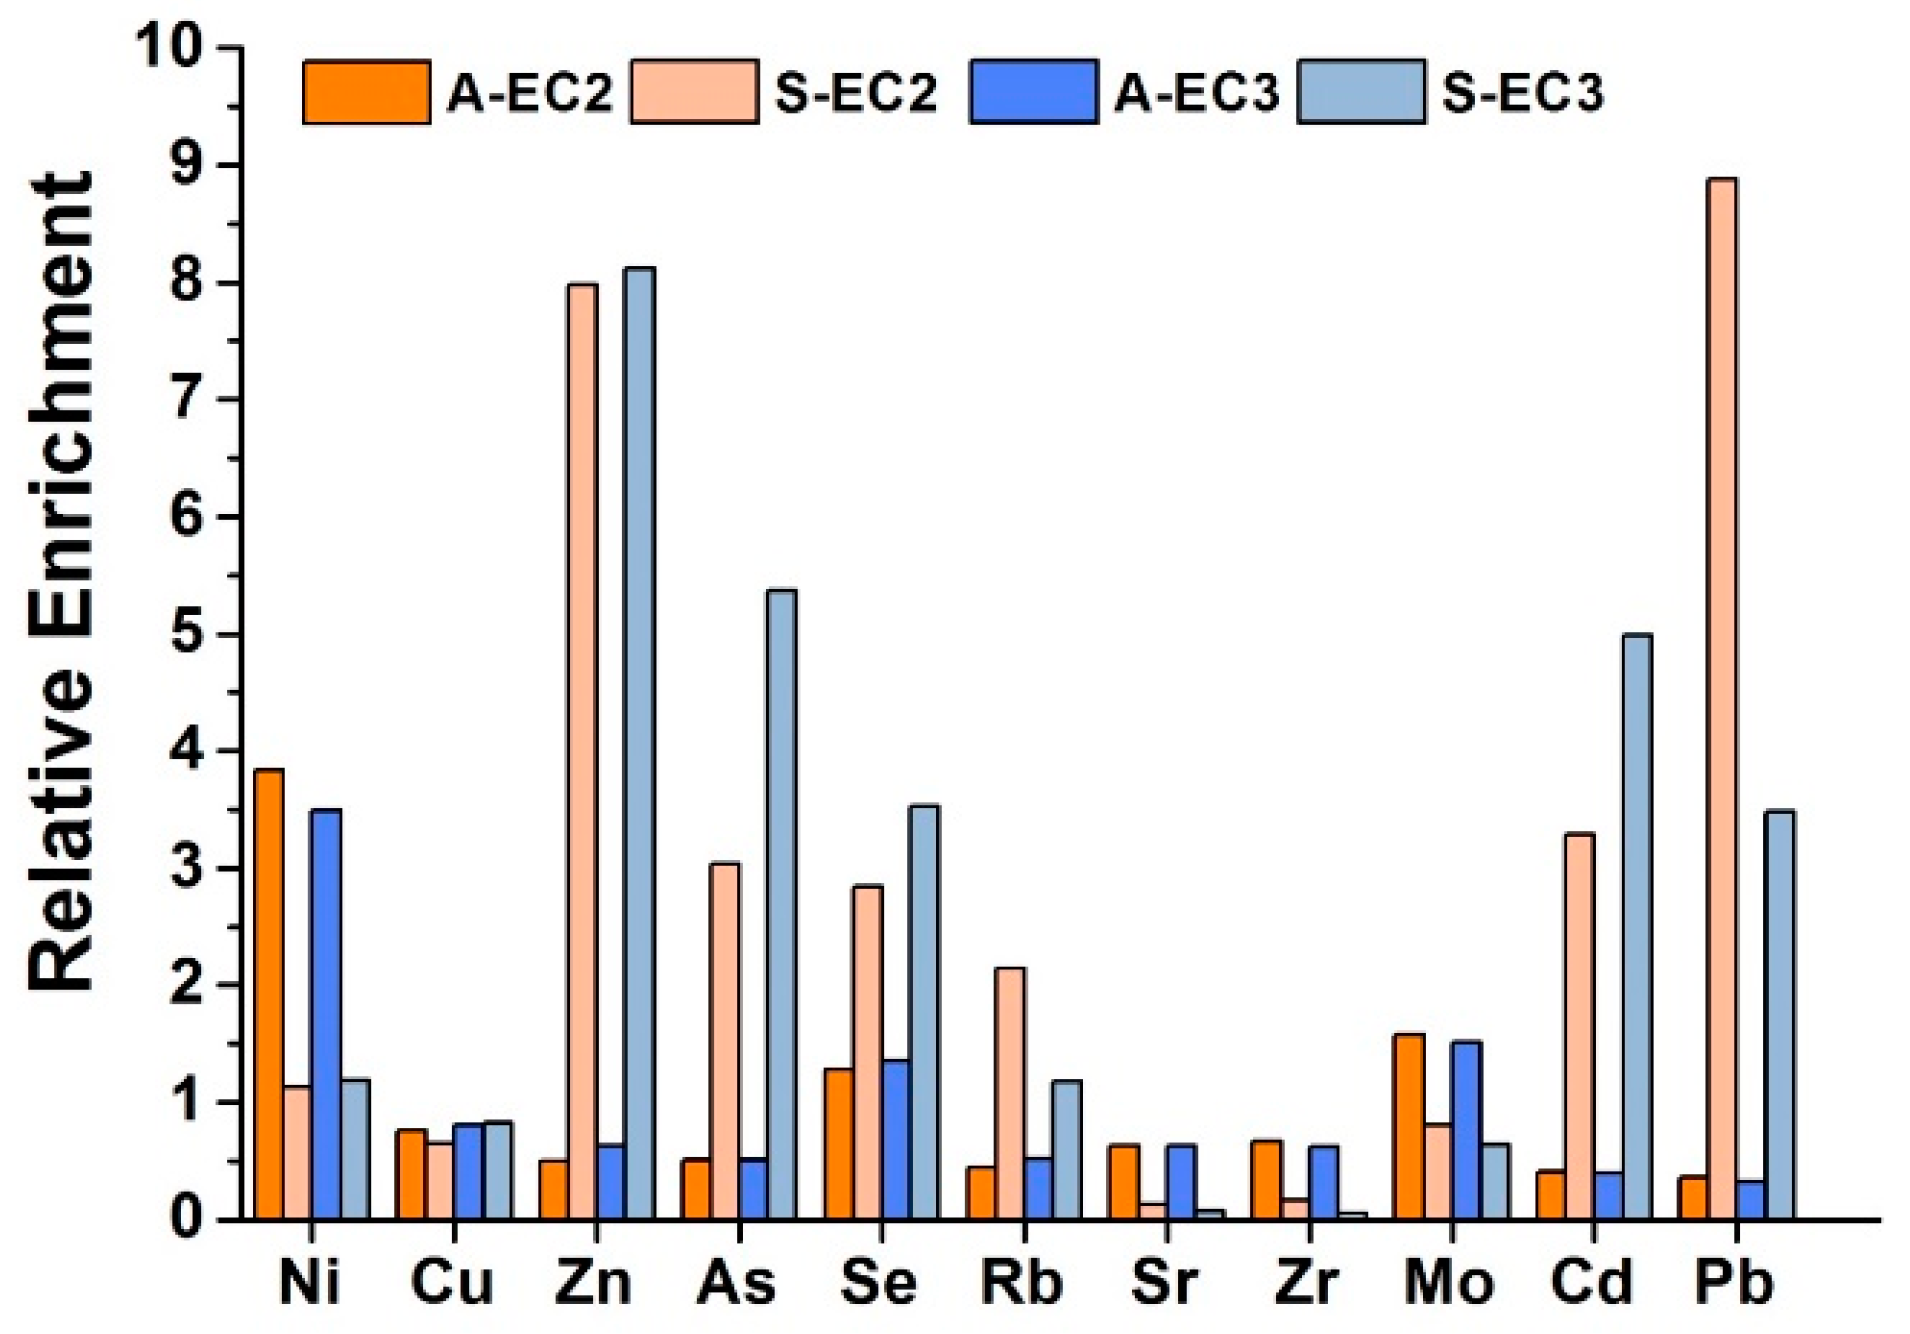
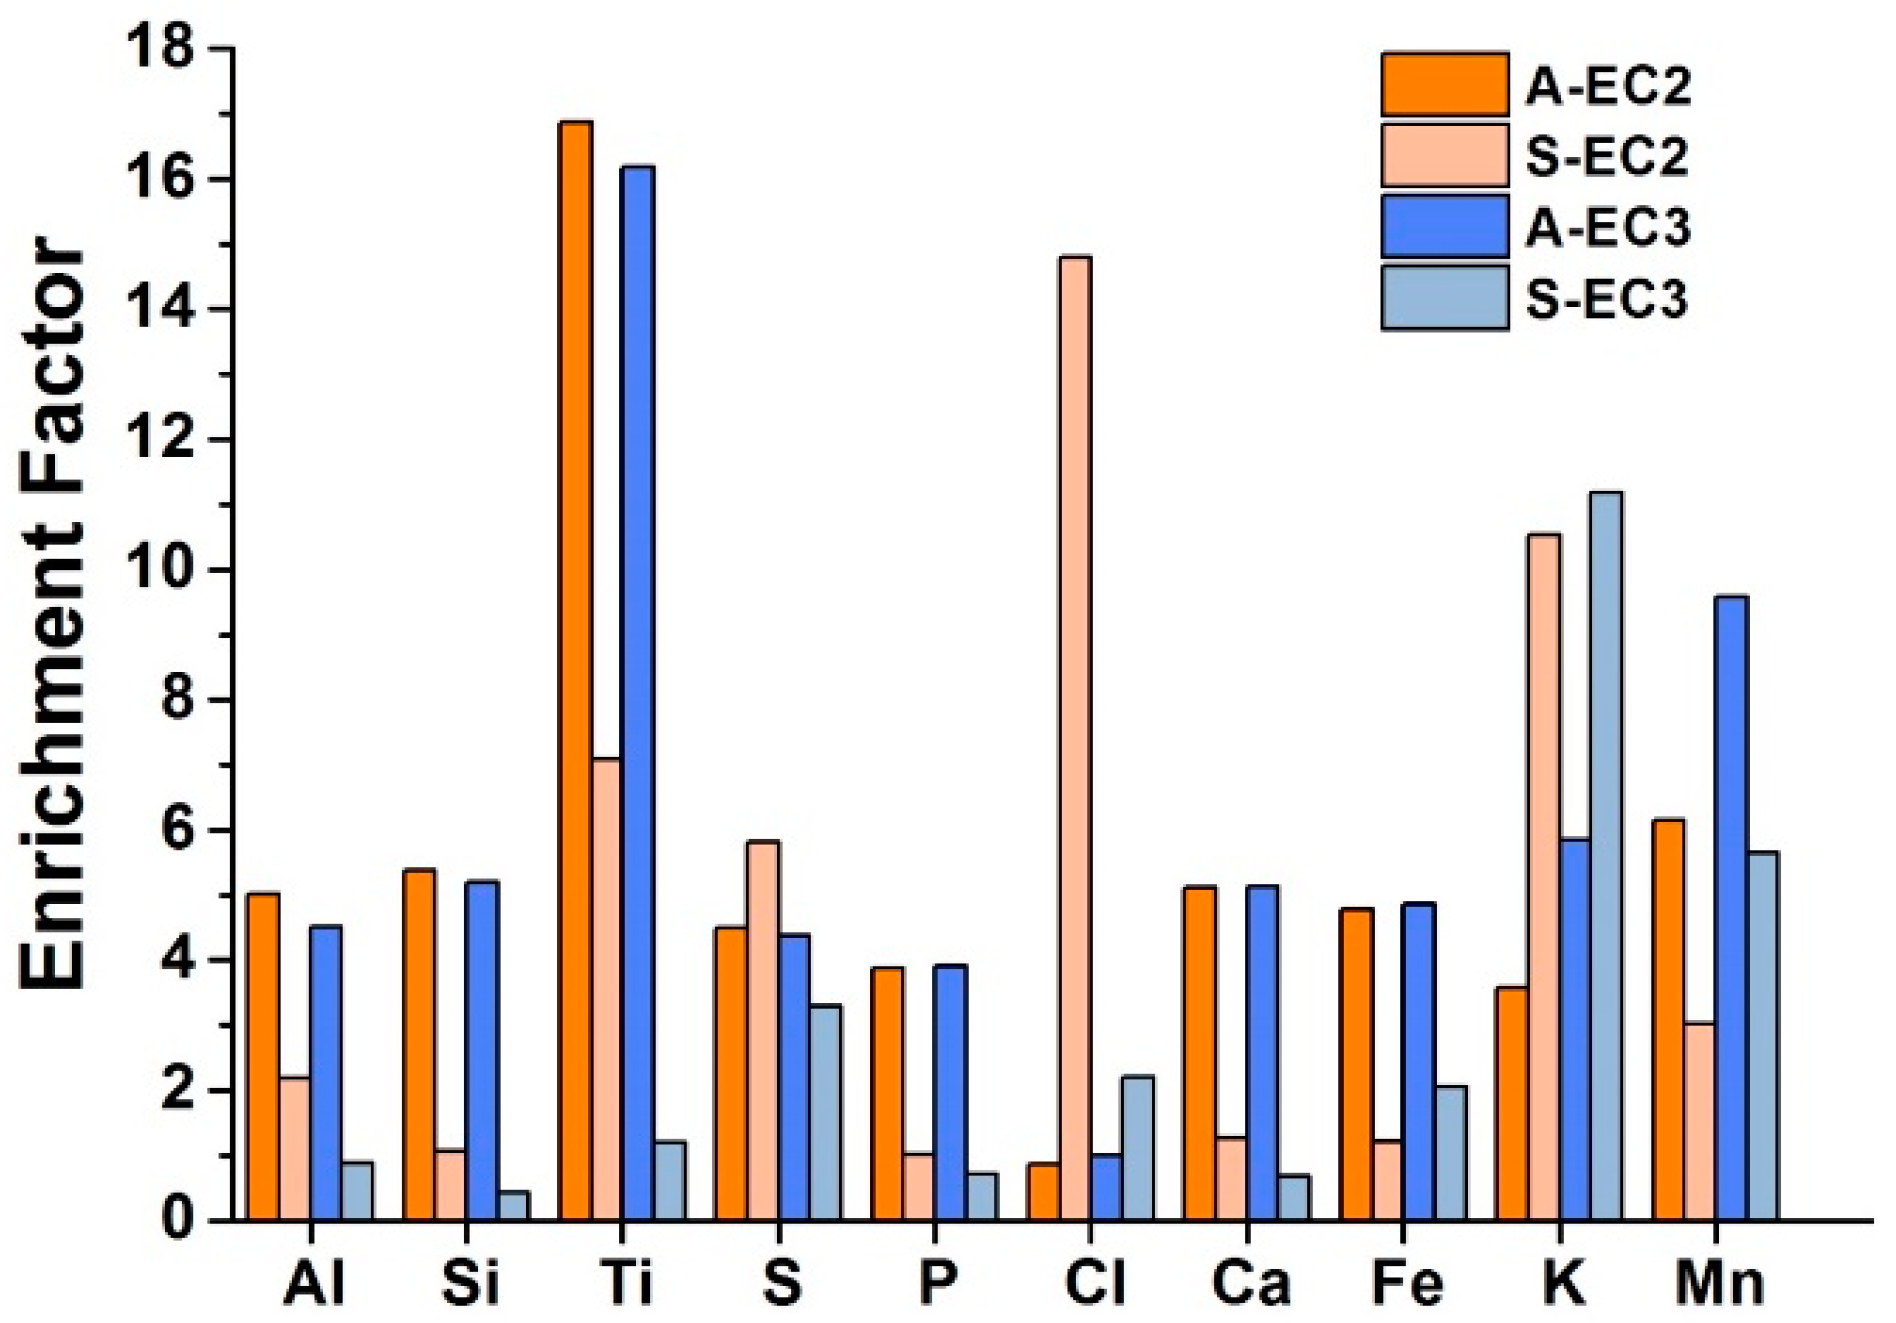
The highest value of RE was calculated for Ti. The major elements (Al, Si, Ti, P, Ca, Fe and Mn) have increased values of RE for ash (Figure 5). Potassium has higher enrichment in the soot of both types of boilers, while chlorides have higher enrichment only in soot from boilers of EC2. The enrichment of elements in the boilers of emission classes 2 and 3 is comparable, except Mn that has higher enrichment in soot from EC3. The behaviour of trace elements varies further. Ni and Mo have the higher value of RE for ash, Cu has no differences in RE, and other environmentally significant elements (Zn, As, Se, Cd and Pb) have the highest values of RE for soot. For U, As, Se and Cd, the higher values of RE were found in the boilers of emission class EC3, while for Pb the higher values were found in emission class EC2 (Figure 6).
The enrichment factor (EF) provides similar information on the behaviour of the major elements. The highest values of EF were found for Ti in ash (16), potassium in soot (approximately 10), and chlorides in soot from the boiler of emission class EC2 (approximately 15). For trace elements, the highest values of EF were determined for Zn from the boilers of both types (70–80) and for Pb (90), in the soot from the boiler of emission class EC2 (Figure 7 and Figure 8). The increased concentrations and therefore increased values of EF for Zn, Pb and partially As, in soot are influenced by adsorption of these elements on elemental carbon (EC). The highest statistically significant relationships were determined for Zn (r = 0.81), Pb (r = 0.65) and As (r = 0.56). A statistically significant relationship was not found for Cu and Cd. The concentration of Cd has a high correlation with the amount of caught soot (r = 0.65). The volatile behaviour of Hg, As, Cd and Pb during the combustion of coal in an electrical furnace was reported by the authors of [49] who determined that the temperature ˃ 400 °C caused the volatilization of approximately 20% of As, at ˃ 900 °C it was up to 72%. For Cd, it made 15.5% and 33%, respectively. The lowest volatilization was found for Pb‒4% and 10%, respectively [49].
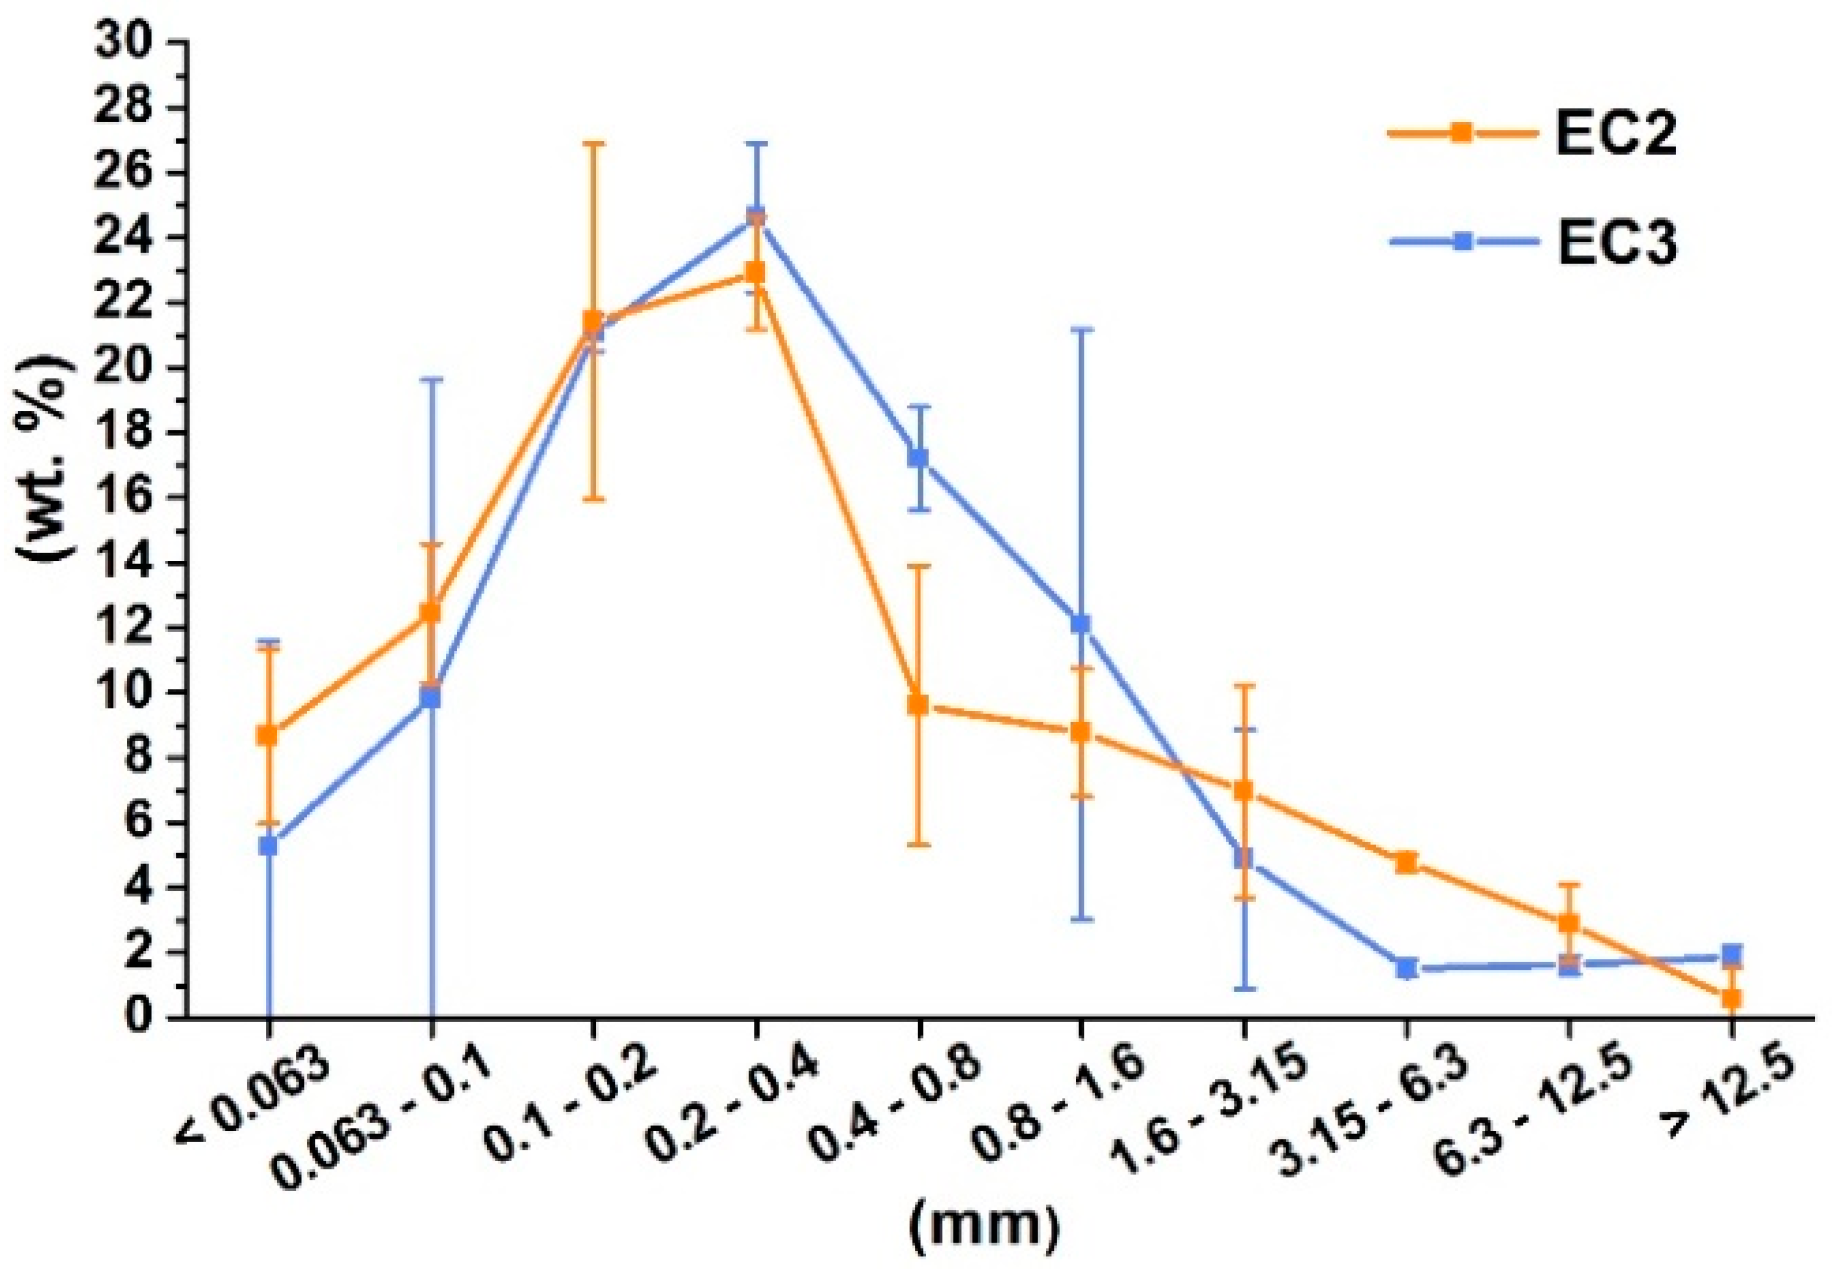
The concentrations of the elements in ash from the combustion of peat are influenced by particle size. Most of the major elements (Ca, Fe, Al, Ti and Si) and Ni from trace elements have the regularly distributed concentrations in particle size class 0.063–1.6 mm. A sharp decrease occurs for coarse particles from the size of 1.6 mm (Figure 9). Other trace elements (As, Cu, Mn, Pb and Zn) and sulphur from major elements have a monotonous decrease of concentrations in the dependence on increasing particle size (Figure 10). Statistically significant relationships between the concentrations of trace elements and sulphur were not found. Statistically significant relationships were only determined for the dependence of Fe with Cu and Ni concentrations (r = 0.66, at the level of significance of 0.05). The particle size distribution of ash from the combustion in the boilers of emission classes EC2 and EC3 is illustrated in Figure 11. The highest value was found for particle size class 0.2‒0.4 mm for both compared boilers. The ash from the boiler EC2 had recovery of approximately 5% for coarse-grained particles, 1.6‒6.3 mm that is higher than boiler EC3.
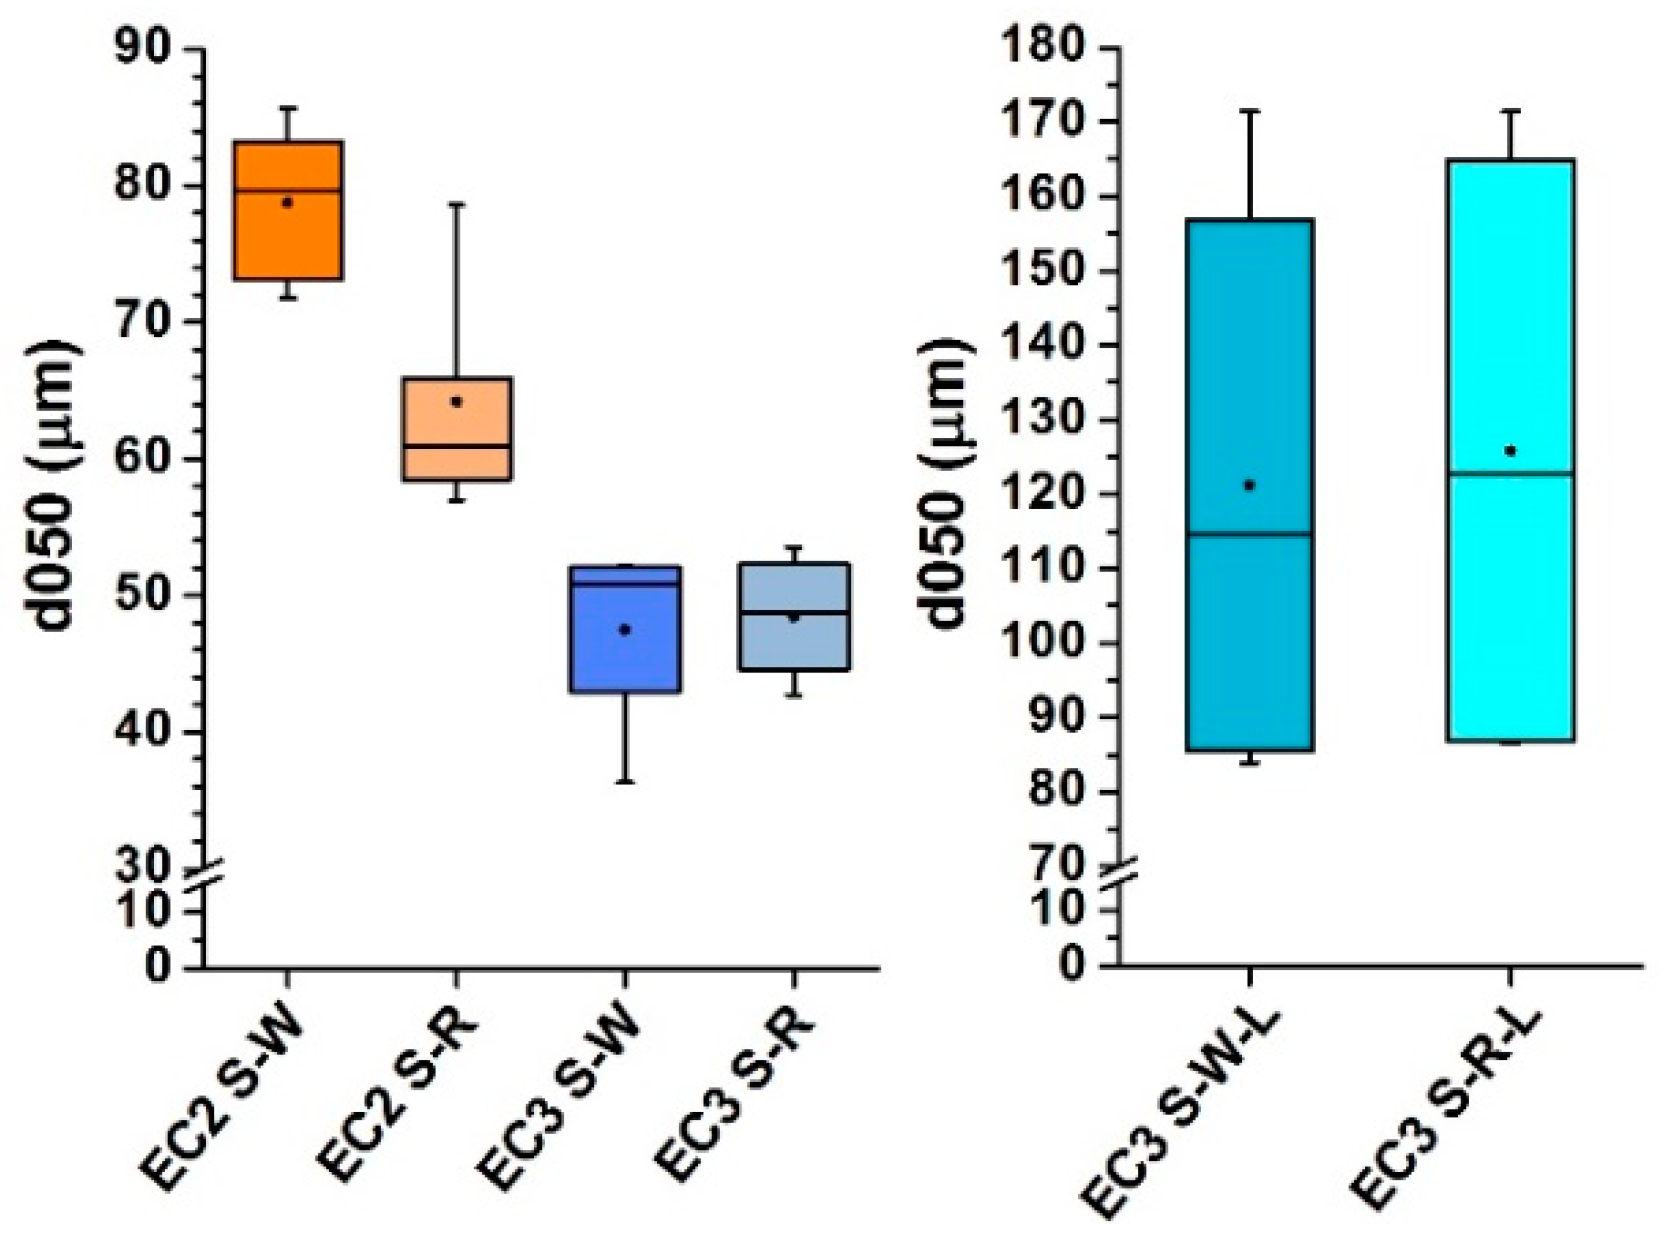
An analysis of the particle size distribution of soot showed that the mean value of particle size in the boiler EC2 was higher than boiler EC3 for the combustion lasting from 8 to 11 h. The particles from the walls and ribs of boiler EC2 have a different size. The particles of soot from the walls (median 80 µm) from boiler EC2 are larger than the particles trapped on the ribs (median 61 µm). A considerable difference in particle size was identified in boiler EC3 for a prolonged period of the combustion (22 h) when the median of the particle size reached 122 µm (Figure 12). For samples burned during a period lasting from 8 to 11 h, it was possible to prove the statistically significant relationship between the average particle size and the amount of deposited soot (r = 0.82, level of significance 0.5).
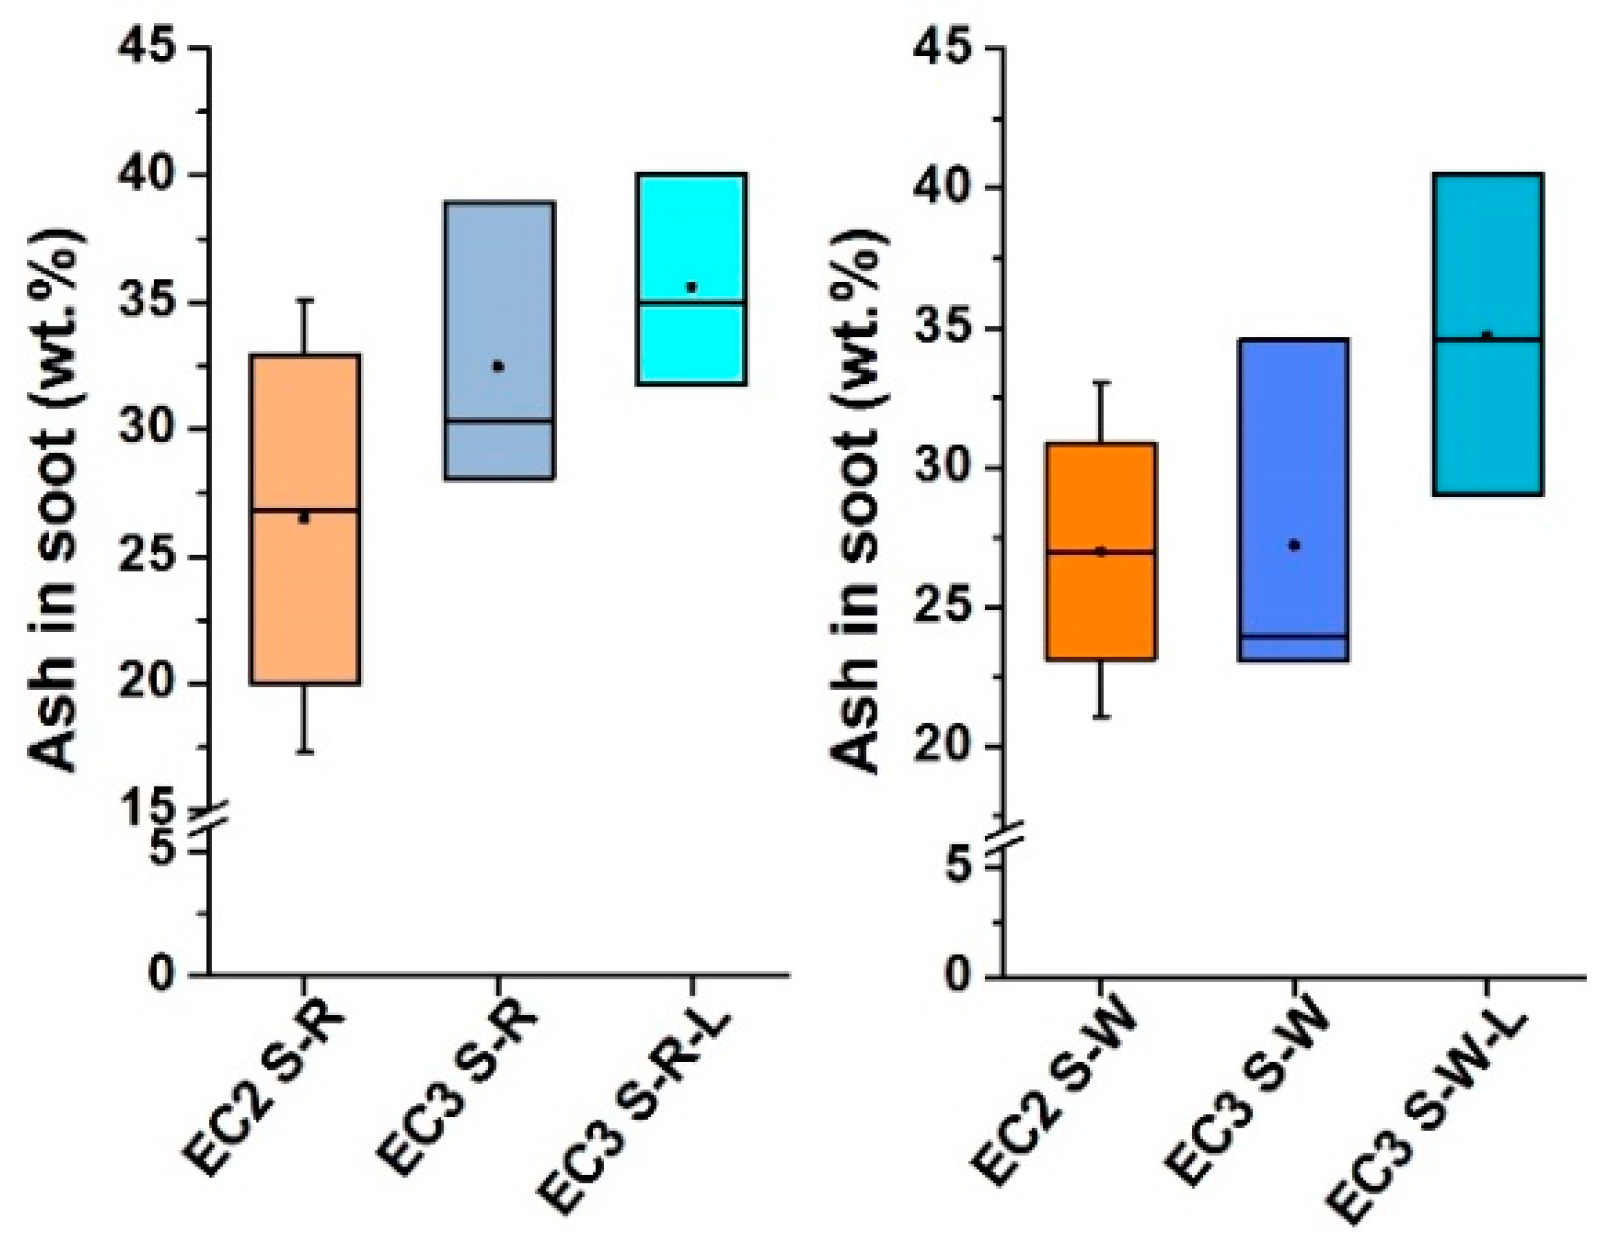
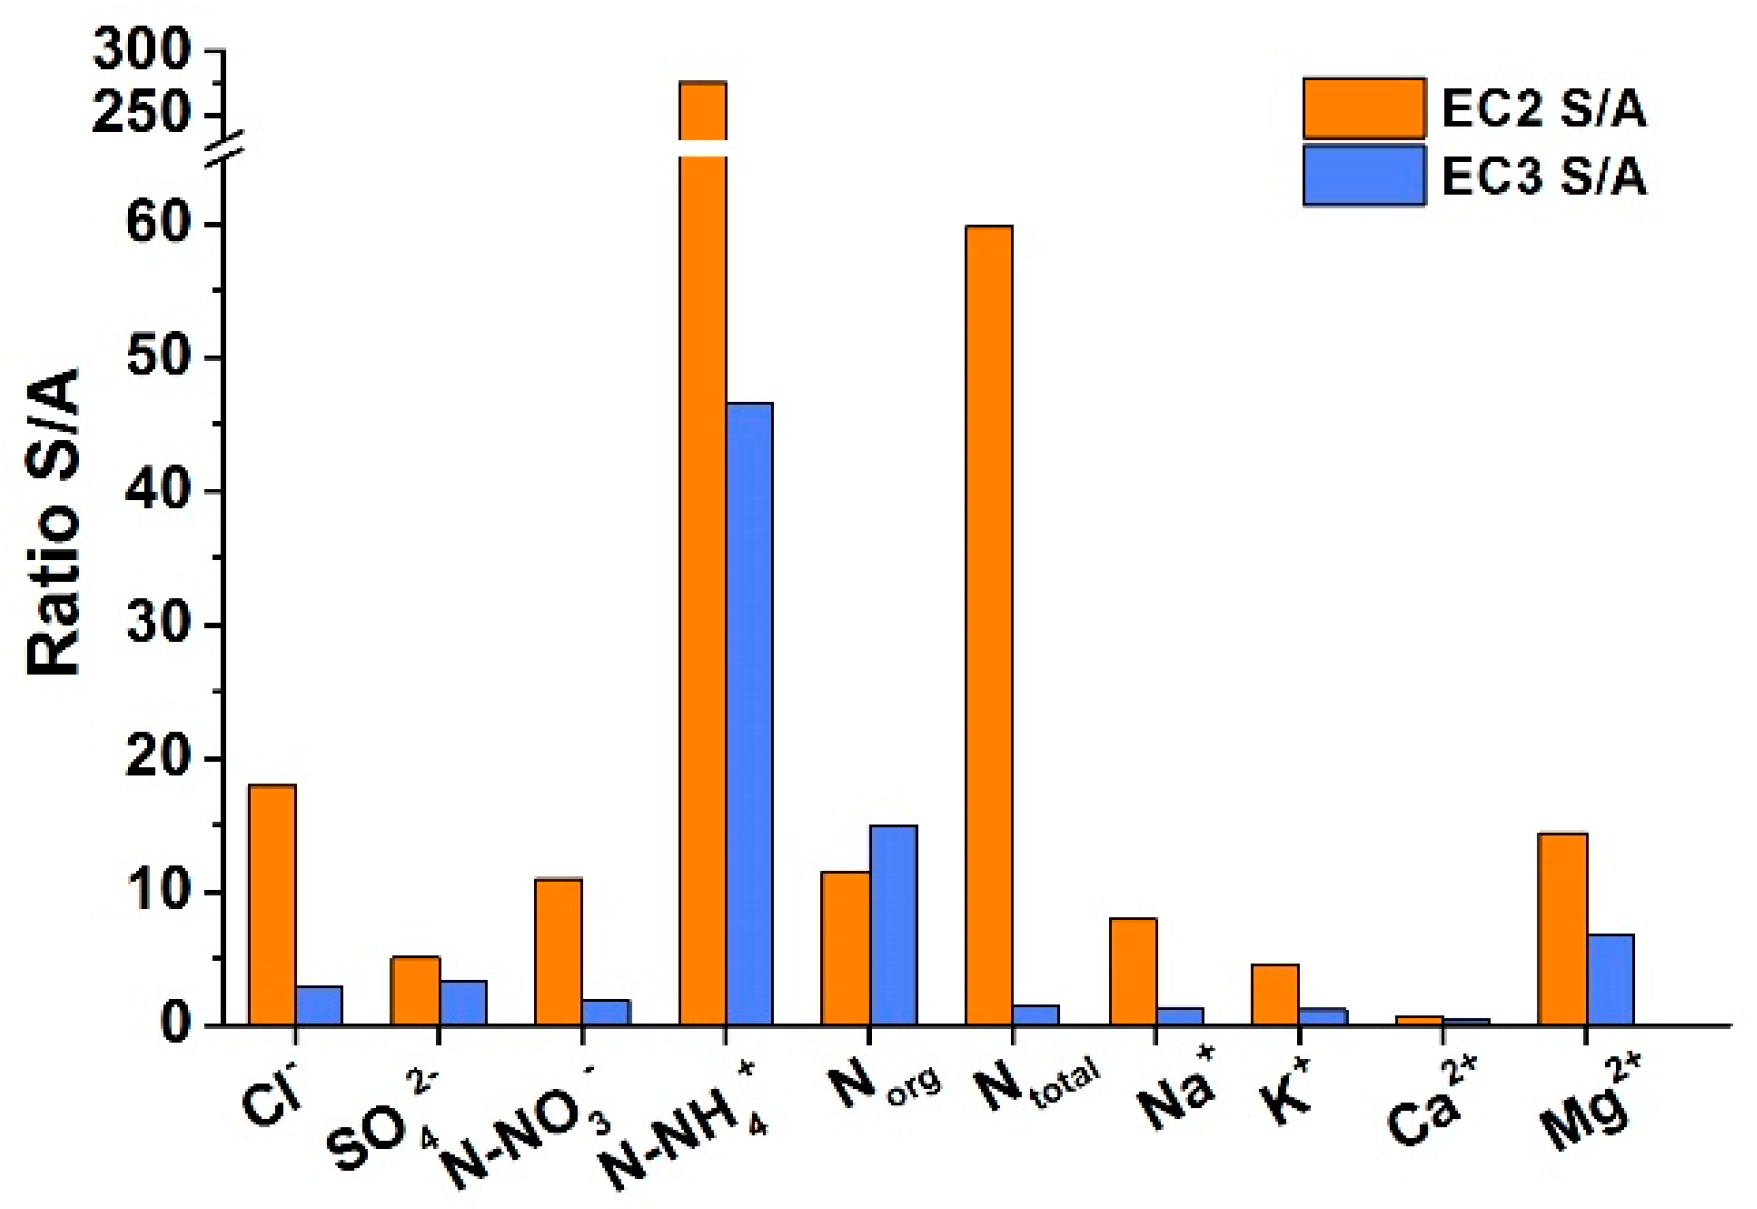
The variable particle size in soot can be influenced by the chemical and mineralogical composition of particles and their ability of aggregation due to the effect of salts (chlorides). A difference in the ash content in soot obtained from the walls and ribs during the combustion of peat briquettes in both boilers EC2 and EC3 is negligible. The content of ash in soot obtained from boiler EC3 is slightly higher than boiler EC2 (Figure 13). The highest content of ash in soot was obtained from boiler EC3 with the long-lasting combustion (22 h). The soot from the combustion of peat briquettes in boiler EC2 contains higher concentrations of water-soluble ions (expressed by electrical conductivity). The most critical difference in the leached amounts of ions was found for soot from boiler EC2. The leached amount of chlorides was from 7–10 times higher than for soot from boiler EC3. A slightly higher amount (approximately 1.5x) was leached for sulphates (Table 4). The concentrations of chlorides in soot are influenced by the temperature during the combustion. Low (327–527 °C) and medium temperatures (627–827 °C) facilitate the trapping of chlorides in soot, most often in the form of KCl [53].
Sodium also has approximately seven times higher leachability for soot from boiler EC2 than EC3 (Figure 14). The highest differences in leachability of soot from boilers EC2 and EC3 were found for total nitrogen. The concentrations of total nitrogen in the dry matter of soot from boilers EC2 and EC3 are comparable‒3.65 ± 0.86% and 3.81 ± 0.45% (Table 2). From a comparison of concentrations of total nitrogen in peat briquettes and soot, it follows that soot has only very low enrichment by nitrogen (1.12‒1.22). The increased concentrations of C and N in soot from the combustion of peat briquettes in comparison with input fuel are the result of the formation of high energy C–N bonds [54].
The soot from boilers EC2 and EC3 differs by the concentrations of total water-soluble nitrogen (EC2 6.05% and EC3 1.82% from total nitrogen determined in the dry matter of soot) and also by the dominant form of occurrence of nitrogen. Ammonia ions prevail in the boiler of EC2 (70–92%) from total leachable nitrogen, while in EC3 organic nitrogen prevails (60–62%) in comparison with ammonia nitrogen. Altogether, 45 compounds containing heterocyclic nitrogen were identified in soot. The identified compounds in soot include heterocyclic compounds of nitrogen derived from the degradation of plant proteins and peptides based on indole, pyrrole, pyridine, pyrazine, pyridazine, pyrimidine, indole, pyrrolidine and their alkylated derivatives. Aliphatic nitrogen is represented in soot in 12 compounds of nitrile (propannitrile, fumaronitrile, benzonitrile, acetonitrile, 2-pentennitrile, 4-pyridinecarbonitrile, 2-methylbenzonitrile, 3-methylbenzonitrile, 2-naphthalencarbonitrile, 2-methylenebutanenitrile, 1H-pyrrole-3,4-di-carbonitrile and 1-cyclopentene-1-carbonitrile). The soot from the combustion of peat briquettes also contains amino acids (alanine, glycine, leucine, serine and cysteine). The nitrogen-containing compounds (amine-N, pyrrole-N, pyridine-N and nitrile-N) are subjected to second cracking during the combustion and transformed into HCN and NH3 [55]. The increased heating rate and shortened residence time cause a decrease in the emissions of NH3 and HCN and an increase in the concentrations of nitrogen-containing compounds in soot [56]. The significant portion of fuel-bound N is retained in the soot when combustion time is short, and temperature ranges between 650 °C and 850 °C [57].
The highest differences in leachability from soot and ash from boiler EC2 was determined for chlorides, sodium, sulphates and magnesium. Water-soluble calcium is represented in soot in low concentrations, while higher amounts are present in ash. The soot and ash from boiler EC3 have significantly lower differences in leachability of water-soluble ions. Chlorides, sodium and partly sulphates are trapped more effectively by soot in boiler EC2 than EC3.

3.3. Identification of Organic Compounds in Soot

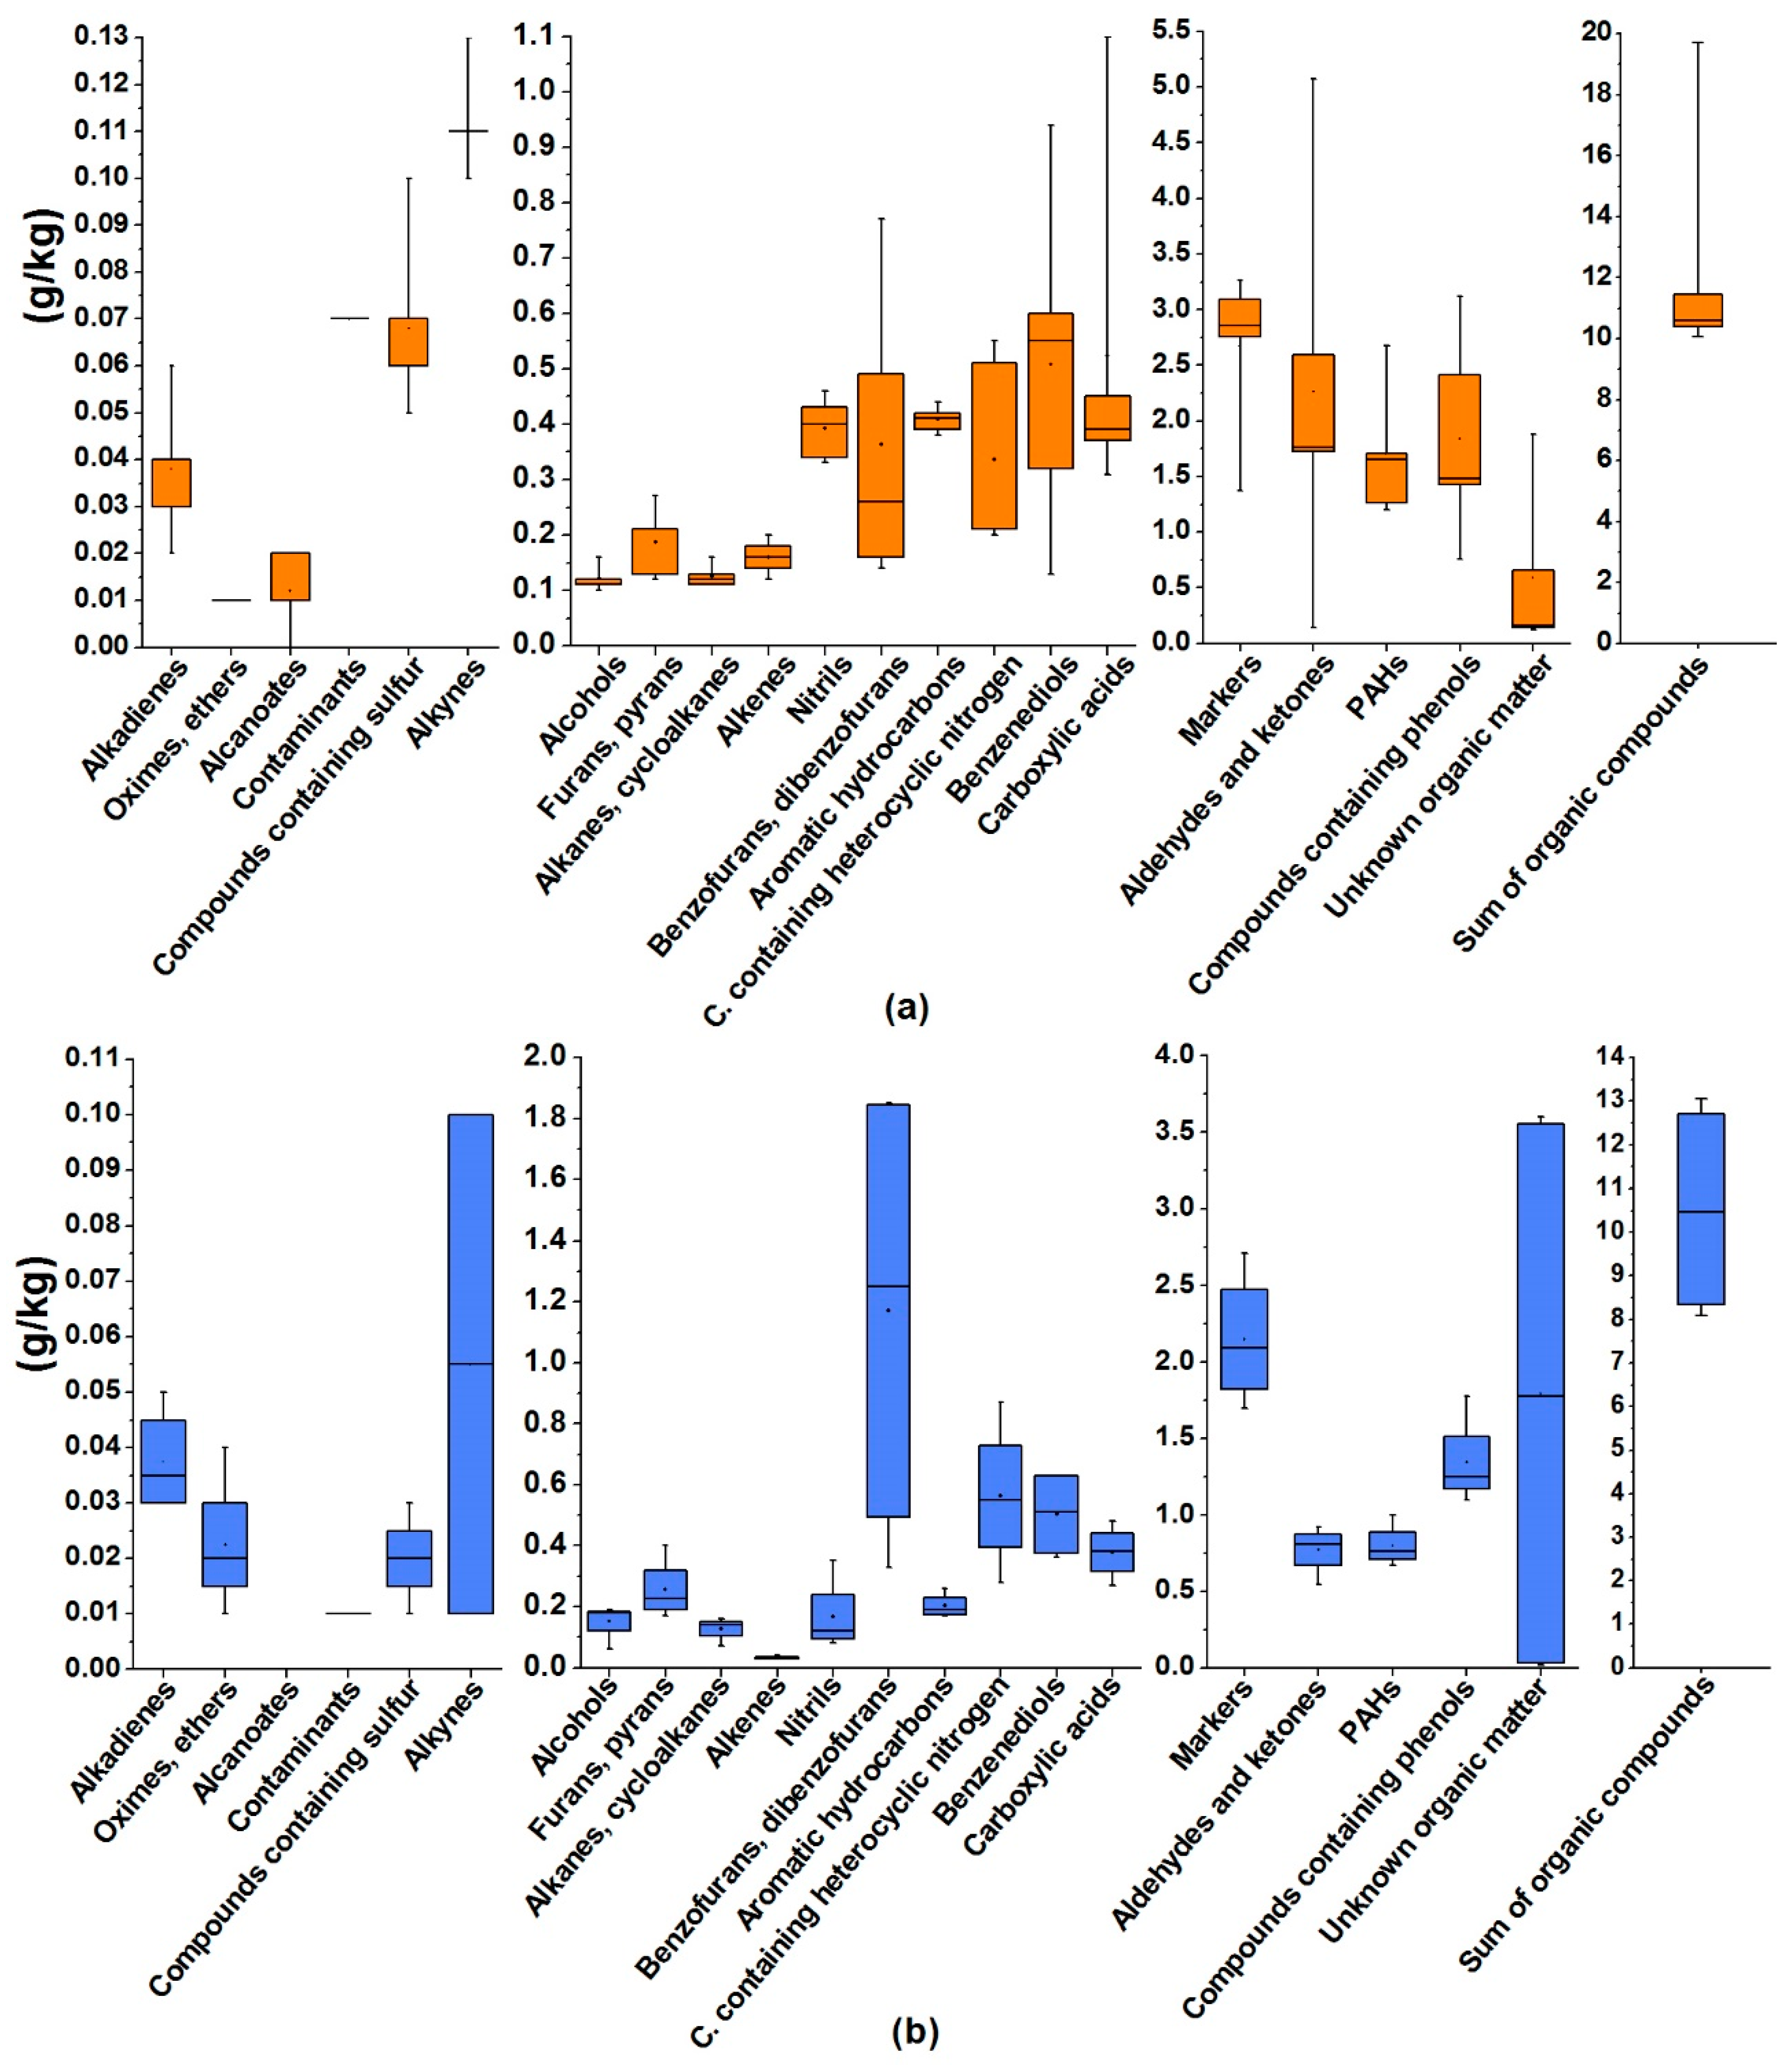
Pyrolysates from the deposits sampled inside both boilers contain groups of organic compounds (Figure 15). The organic compounds in the deposits originate from thermal decomposition of the main fuel components, the diagenetic components in peat and reactions during the combustion.
European peats have a different composition according to the character of the original plant material. The essential plants participating in the origin of peat are peat moss (Sphagnum) and lichens. The main compound characteristic for lichens which are typical for European peats (northern, central and western Europe) is 3-methoxy-5-methyl phenol. Peat moss can be identified in peat and consequently in combustion side products by the presence of 4-isopropenyl phenol. However, moss species other than Sphagnum can also participate in peat origin that is typical for Spanish peats. These peats and products of their combustion can be identified utilizing chemical compounds, like 4-(2-phenylethenyl)phenol, 2,3-dihydro-2-methyl-4-phenylbenzofuran. The species of moss contain n-methyl ketones which are biomarkers that originated by the oxidation of n-alkanes [58]. The highest concentration has C19 n-methyl ketone. Peats formed from vascular plants as well as combustion products of these peats are characteristic of the presence of methyl esters of ferulic acid [59]. Heaths are characteristic of the presence of triterpenoids (m/z 218, 203 and 189). Similarly, it is possible to distinguish peats (and consequently their combustion products) composed by deciduous and coniferous trees from other types of peats utilizing ratios of unimodal alkanes. Peats that originated from coniferous or deciduous trees (wood and bark) have the higher value of the ratio Σ2/Σ1 (4.2–1.8) than peats formed from peat moss, other moss species, lichens or monocotyledonous plants.
The soot from boiler EC2 compared with soot from boiler EC3 has higher average concentrations of organic compounds except for benzofurans, dibenzofurans, furans, pyrans, compounds containing heterocyclic nitrogen, oximes and ethers.
The higher concentrations of phenols and benzenediols in soot indicate the lower thermal degradation of lignin and tannins contained in peat briquettes. Phenol, alkylated phenols, methoxy phenols, catechol (1,2-benzenediol), its isomers (resorcinol, hydroquinone) and alkylated benzenediols are the main components of lignin and tannin [60]. Lignin decomposes over a broad range of temperatures 150–900 °C [61]. The average concentrations of phenols and benzenediols formed during thermal degradation of lignin and tannins in soot from the combustion of peat briquettes in boiler EC2 are 0.51 g/kg and 1.84 g/kg respectively. The average concentrations of phenols and benzenediols in soot from the combustion of peat briquettes in boiler EC3 are 0.50 g/kg and 1.34 g/kg respectively. The average concentrations of ketones and aldehydes in deposits from boiler EC2 are higher (2.26 ± 1.81 g/kg) than the deposits from boiler EC3 (0.77 ± 0.16 g/kg). Aldehydes and ketones form, on average, 16.5% of deposits in boiler EC2 and in boiler EC3, 7.51% of the chemical composition of the deposit. In total, 40 compounds of aldehydes and ketones were identified in the deposits. The presence of these compounds results from the non-complete decomposition of cellulose, hemicellulose and lignin in peat [62].
Carboxylic acids originate from thermal degradation of waxes and lipids, which, together with terpenes and alkaloids, are resistant to the process of peat development. These organic compounds accumulate in peat during genesis in a non-altered form. They can be released into the environment by the combustion of peat. The average concentration of carboxylic acid reaches 3.92% in soot from boiler EC2, and it is comparable with the concentration determined for soot from boiler EC3 (3.91%). The dominant acids are hexadecanoic acid, octadecanoic acid, nonadecanoic acid and phenol acids (ferulic acid, coumaric acid, homovanillic acid and α-methyl cinnamic acid).
Alkanes identified in soot are derived from epicuticular waxes and pollen [63]. The concentrations of alkanes in soot from EC2 (0.13 ± 0.02 g/kg) and EC3 (0.13 ± 0.04 g/kg) are comparable. Alkenes originate from the thermal degradation of alkanes and alkanols. The higher average amount of alkenes is present in soot from boilers EC2 (0.16 ± 0.03 g/kg) than in EC3 boilers (0.03 ± 0.01 g/kg).
The higher content of PAHs in soot from the combustion of peat briquettes in boiler EC2 is caused by the presence of the higher concentrations of the components derived from the degradation of tannins and lignin. It can also be the result of the existence of oxygen-deficient zones during the combustion. In the burning of solid fuels, such high-temperature oxygen-deficient zones exist in which pyrolysis reactions dominate, leading to the production of polycyclic aromatic hydrocarbons [64]. Catechol (1,2-benzenediol) and its two isomers (resorcinol and hydroquinone) are produced by pyrolytic decomposition due to its dependence on the temperature. The catechol pyrolysis products comprise of several groups of compounds [64]: bi-aryls (biphenyl), indene analogues, PAHs and their alkylated derivatives, alkylated aromatics, cyclopenta-fused PAHs, oxygenated aromatics, ethyl-substituted aromatics and oxygen-containing aromatics (benzofuran and dibenzofuran). Lignin participates in the origin of aromatic hydrocarbons, PAHs and oxygenated aromatics except for benzenediols [65]. Altogether, 48 compounds of PAHs, 50 compounds from the group of aromatic hydrocarbons, including alkylated and ethyl-substituted aromatics, and nine representatives of oxygenated aromatics were identified in soot. The deposits also contained azaarenes (quinoline, 1-methyl quinoline and 7-methyl quinoline), oxygenated PAHs (anthrone, xanthone and 9H-fluorene-9-one). The oxygenated PAHs and other species could also undergo recombination and polymerization reactions to form larger macromolecular carbonaceous material, offering an alternative pathway for soot formation from biomass [66]. The average concentration of PAHs and their derivatives for the deposits from the combustion of peat briquettes in the boilers of emission class 2 is 1.70 ± 0.59 g/kg. The average concentration of PAHs in soot from boiler EC3 is markedly lower at 0.80 ± 0.14 g/kg.
From the organic compounds containing sulphur, the following compounds were identified in the deposits: thiols (1-nonanthiol, methanthiol), thiirane, thiazole, thiophene, dithiolone, sulphide, thianthrene, thiazole, thiane and benzene compounds containing sulphur. Benzenesulfonic acid, butyl octyl ester sulphurous acid and sulfone were identified from the acids containing sulphur. The higher average concentration of compounds containing organic sulphur (0.068 ± 0.016 g/kg) was determined in soot from boiler EC2, while soot from EC3 contained 0.020 ± 0.009 g/kg. The higher concentrations of sulphur compounds in soot from boiler EC2 result from the lower temperature of the combustion, which causes the lower thermal degradation of these compounds.
Furan derivatives are typical carbohydrate-derived compounds [67]. The higher average concentration of furans and pyrans (0.25 ± 0.10 g/kg) were identified in soot from boiler EC3 compared with soot from boiler EC2 (0.19 ± 0.06 g/kg). The concentrations of benzofurans and dibenzofurans are higher in soot from boiler EC3 (1.17 ± 0.79 g/kg) than in soot from boiler EC2 (0.36 ± 0.27 g/kg). This group of chemical compounds has the highest standard relative deviation. Benzofuran and its derivatives dominate in cellulose-derived soot [62]. Dibenzofuran represents a product of thermal decomposition of the lignin/tannin-polysaccharide complex. The higher concentrations of benzofuran and dibenzofuran in soot from boiler EC3 indicate the higher combustion temperature than in boiler EC2.
The soot from boiler EC3 has a higher average concentration of compounds containing heterocyclic nitrogen (0.56 ± 0.24 g/kg) than soot from boiler EC2 (0.34 ± 0.18 g/kg). The compounds containing heterocyclic nitrogen contain significant amounts of amide nitrogen, which is partially resistant to thermal degradation [68].
The deposits from the combustion of peat briquettes contain organic compounds which indicate original biological material (markers). The organic compounds produced by thermal decomposition of proteins are present in the deposits. Amino acids are represented by sulphur proteins (cysteine, methionine), amino acids with an aliphatic side chain (alanine, glycine and leucine), amino acids with aromatic ring (tryptophane) and amino acids with a hydroxyl group at a side chain (serine). D-limonene and phytol represent the degradation products of plant pigments. Anhydrosaccharides indicate the presence of cellulose and hemicellulose. Those contained in soot are levoglucosan and mannosan. Levoglucosan is produced exclusively from cellulose combustion [69]. The average concentration of markers in soot from the boiler emission class 2 is 2.67 ± 0.75 g/kg, while soot from the boiler emission class 3 has 2.15 ± 0.43 g/kg. The higher concentrations of markers in the deposits from the boiler of emission class 2 indicate the non-complete combustion.
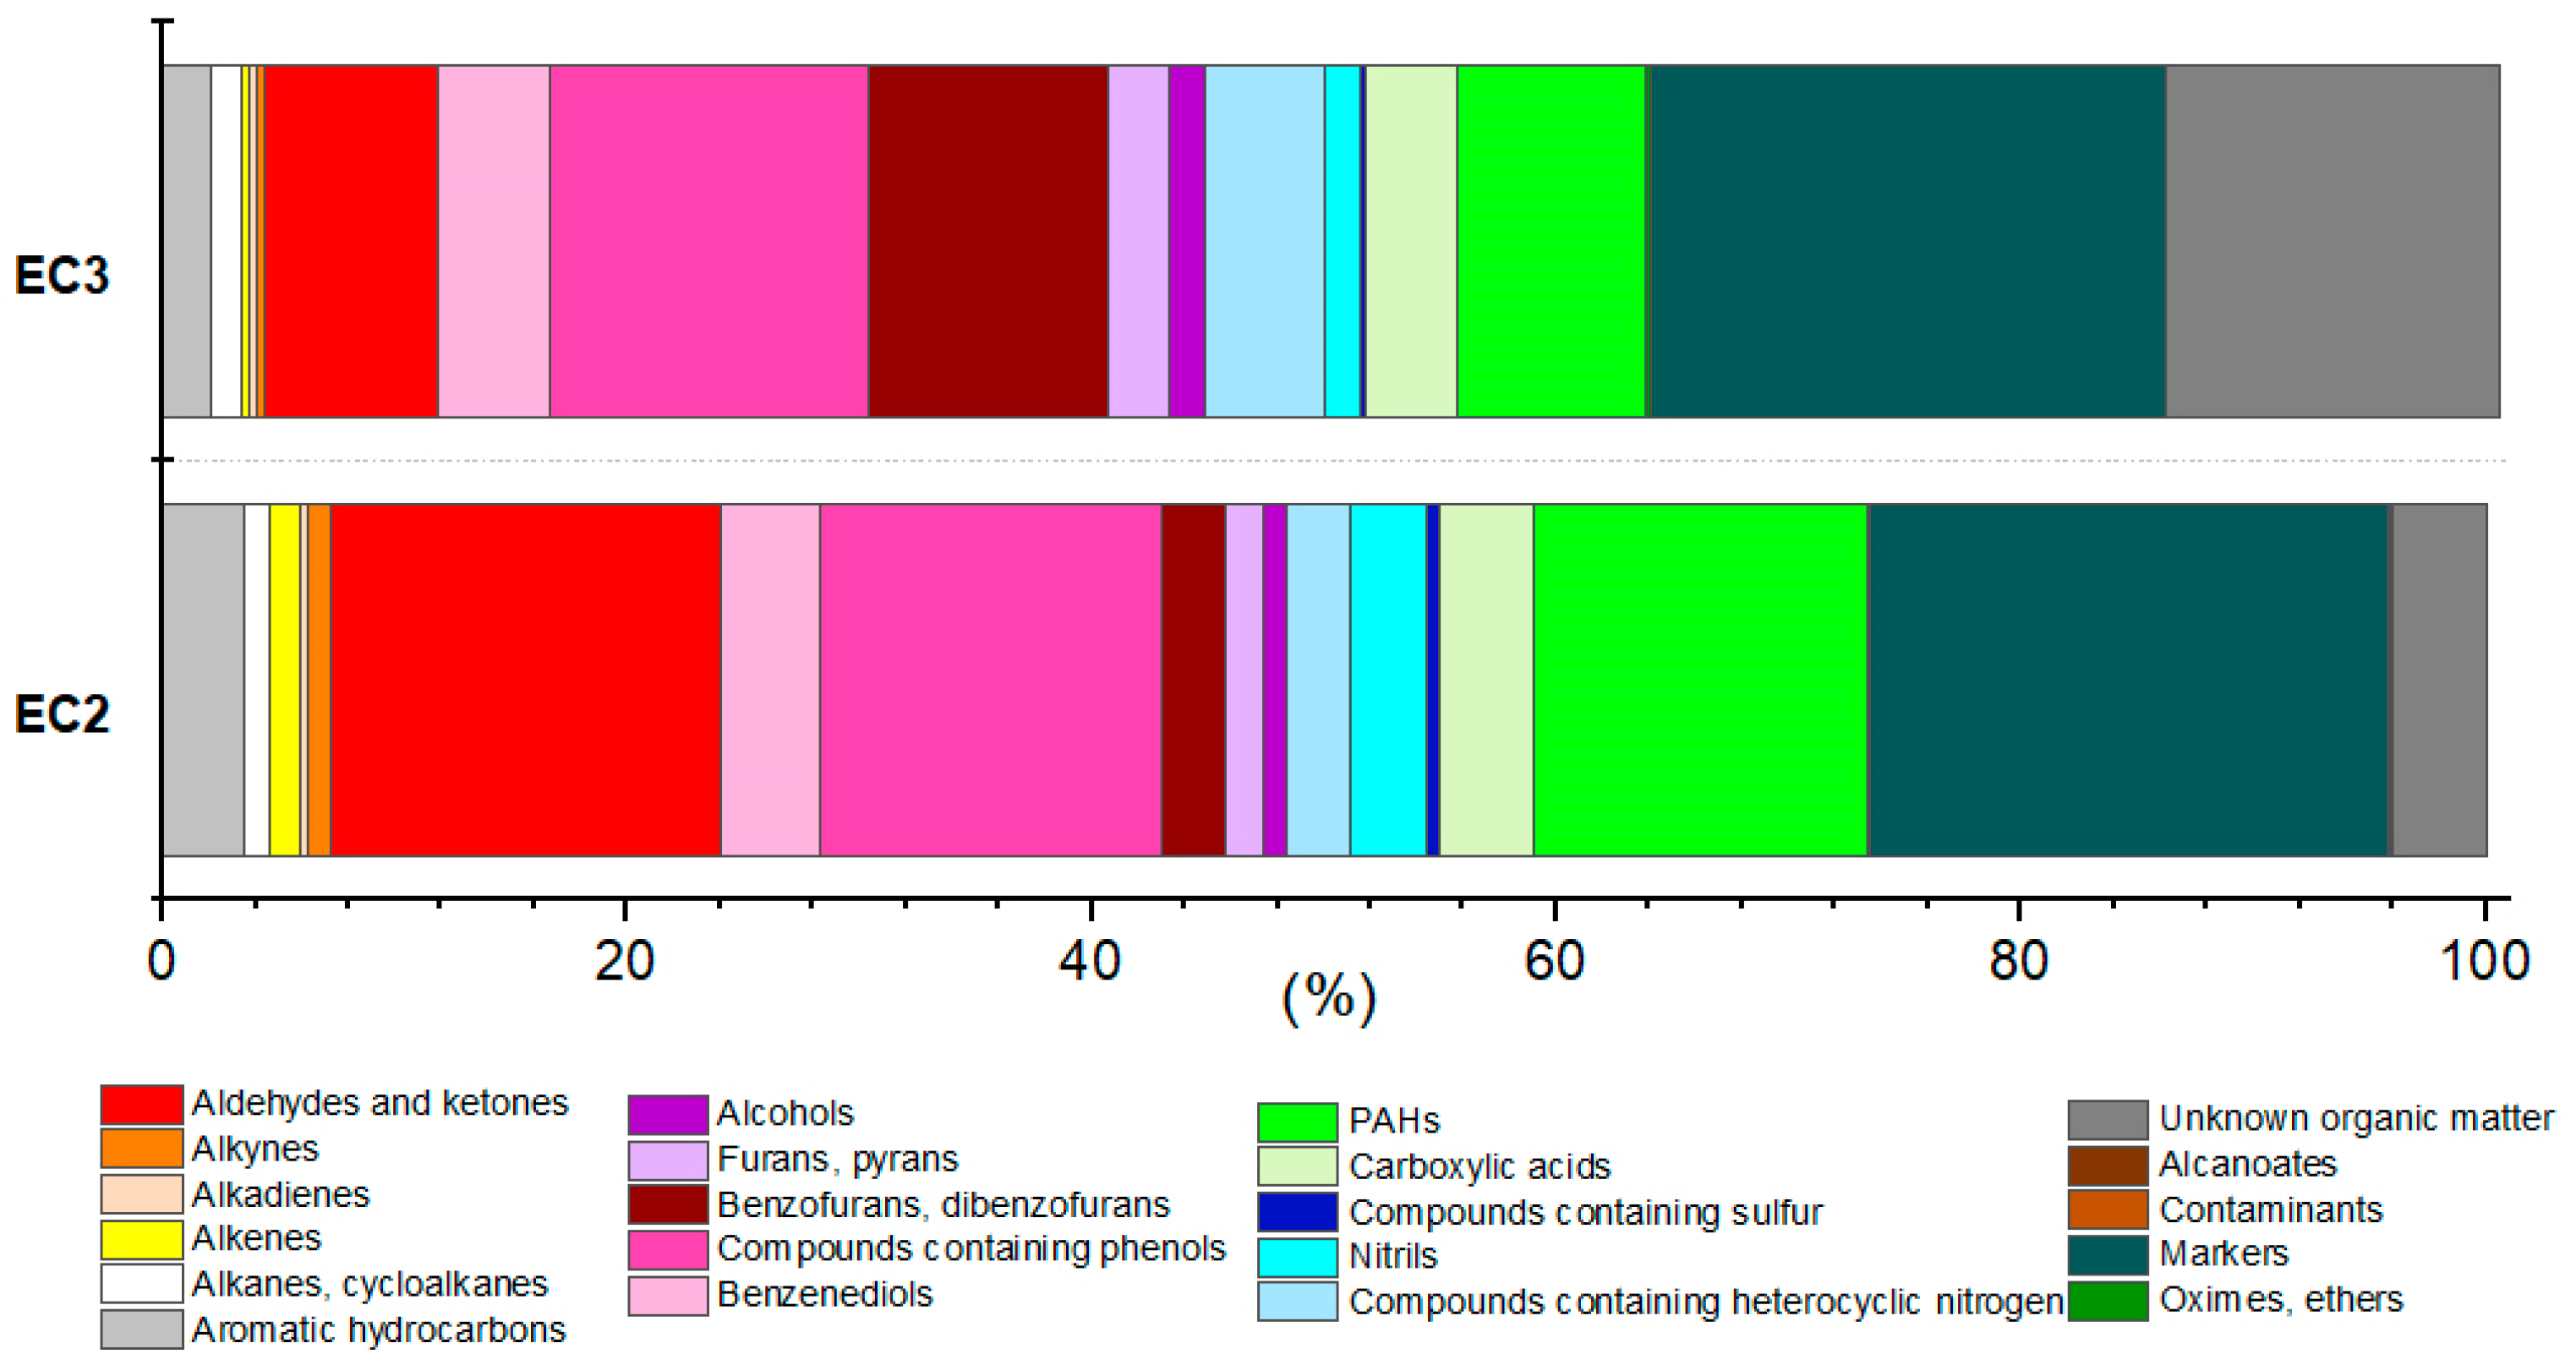
The percentages of organic compounds in soot are different for some groups of organic compounds in soot from boilers EC2 and EC3 (Figure 16). The following compounds have comparable concentrations in soot from both boilers EC2 and EC3: benzenediols; alcohols; alkanes and cycloalkanes; alkadienes. The higher percentages in soot from the boiler emission class 2 than emission class 3 were determined for compounds containing sulphur; markers; aldehydes and ketones; PAHs; aromatic hydrocarbons; alkenes; alkynes; compounds containing phenols; carboxylic acids. The higher percentages in soot from boiler EC3 than EC2 were found for compounds containing heterocyclic N; benzofurans+dibenzofurans; furans+pyrans and oximes+ethers. The soot from boiler EC3 has prevailing compounds with an aromatic structure.
The technological improvements for boilers of the emission class 3 bring higher efficiency during thermal decomposition of the fuel (peat briquettes). This is demonstrated by the concentrations of organic compounds derived from the components (lignin, cellulose) of peat briquettes in the deposits of soot/char, which are two or three times higher in boilers of the emission class 2 than in boilers of the emission class 3.
The technological improvements of boilers of emission class 3 can also be characterized chemically by a decrease of the resistant organic compounds derived from terpenes, waxes and resins that are determined in the deposits of char/soot from the combustion of peat briquettes.
The technological improvements of boilers of the emission class 3 result in increased combustion temperature that is indicated by the presence of thermally high-stable organic compounds (benzofurans, dibenzofurans) in the deposits of these boilers.
The technological improvements of boilers of the emission class 3 do not include the reduction of the amounts of deposits (char and soot). The amounts of deposits (char and soot) are in boilers of both emission classes (2 and 3) identical for the combustion of identical fuel in the same quantity and during the same period. From above, it follows that technological improvements of boilers of the emission class 3 in comparison with lower emission classes can be verified by analysis of the organic composition of the deposits.

4. Conclusions

The amounts of soot produced by combustion of 1 kg of fuel are higher for boilers of emission class 3 (0.78 ± 0.18 g/1 kg fuel) than for emission class 2 (0.58 ± 0.20 g/1 kg of fuel). The concentrations of OC in soot are comparable for both types of boilers (EC2 267.4 ± 6.6 g/kg and EC3 274.8 ± 35.2 g/kg). The differences in concentration appear for EC in soot (EC2 357.2 ± 39.9 g/kg, EC3 308.6 ± 16.9 g/kg).
The deposits from the combustion of peat briquettes in the boilers of emission class 2 contain the higher average concentrations of organic compounds derived from the degradation of the main structural components of peat - cellulose, lignin and hemicellulose. The soot from the combustion of peat briquettes in boiler EC3 has a typical occurrence of high-temperature combustion products as benzofurans+dibenzofurans and furans+pyrans that represent more intact carbohydrate structures in the lignin-cellulose complex. The highest value of the enrichment factor (EF) was determined among trace elements for Zn in the boilers of both types (from 70 to 80) and 90 for Pb in soot from the boiler of emission class EC2. The increased concentrations and therefore, the higher values of EF for Zn, Pb and partially As in soot are influenced by adsorption of these elements on elemental carbon (EC). This article represents the expansion and continuation of the conference contribution [70].

Author Contributions

Conceptualization, H.R.; methodology, K.R. and J.R.; analyses, M.K., M.Š., B.Š. and P.K.; investigation, M.K., M.Š., B.Š. and P.K.; writing—original draft preparation, J.R. and H.R.; writing—review and editing, K.R.; visualization, M.K. and B.Š.; supervision, H.R.

Funding

This study was supported by the research projects of the Ministry of Education, Youth and Sport of the Czech Republic: Research on identification of non-desirable substances and self-diagnostic systems of boilers for solid fuels in household heating CZ.02.1.01/0.0/0.0/18_069/0010049 and Research centre for low-carbon energy technologies CZ.02.1.01/0.0/0.0/16_019/0000753, Czech Republic and SP2019/35 Identification of combustion processes using composition of street dust.

Conflicts of Interest

The authors declare no conflicts of interest.

References

  1. Kowalczyk-Juśko, A.; Onuch, J.; Kościk, B.; Skowron, P.; Chołody, M.; Kosidło, A.; Rawski, J. Environmental and practical aspects of the use of peat for agriculture and energy aims. J. Ecol. Eng. 2016, 17, 138–142. [Google Scholar] [CrossRef]
  2. Kasiuliene, A.; Carabante, I.; Bhattacharya, P.; Caporale, A.G.; Adamo, P.; Kumpiene, J. Removal of metal(oid)s from contaminated water using iron-coated peat sorbent. Chemosphere 2018, 198, 290–296. [Google Scholar] [CrossRef] [PubMed]
  3. Naafs, B.D.A.; Inglis, G.N.; Blewett, J.; McClymont, E.L.; Lauretano, V.; Xie, S.; Evershed, R.P.; Pancost, R.D. The potential of biomarker proxies to trace climate, vegetation, and biogeochemical processes in peat: A review. Glob. Planetary Chang. 2019, 179, 57–79. [Google Scholar] [CrossRef]
  4. Joseph, I.V.; Roncaglia, G.; Tosheva, L.; Doyle, A.M. Waste peat ash mineralogy and transformation to microporous zeolites. Fuel Process. Technol. 2019, 194, 106124. [Google Scholar] [CrossRef]
  5. Montanarella, L.; Jones, R.J.A.; Hiederer, R. The distribution of peatland in Europe. Mires Peat 2006, 1, 1–11. [Google Scholar]
  6. Köchy, M.; Hiederer, R.; Freibauer, A. Global distribution of soil organic carbon–Part 1: Masses and frequency distributions of SOC stocks for the tropics, permafrost regions, wetlands, and the world. Soil 2015, 1, 351–365. [Google Scholar] [CrossRef]
  7. Tanneberger, F.; Moen, A.; Joosten, H.; Nilsen, N. The peatland map of Europe. Mires Peat 2017, 19, 1–17. [Google Scholar]
  8. Xu, J.; Morris, P.J.; Liu, J.; Holden, J. PEATMAP: Refining estimates of global peatland distribution based on a meta-analysis. Catena 2018, 160, 134–140. [Google Scholar] [CrossRef] [Green Version]
  9. Minayeva, T.; Sirin, A.; Bragg, O. A Quick Scan of Peatlands in Central and Eastern Europe; Wetlands International: Wageningen, The Netherlands, 2009. [Google Scholar]
  10. Volkova, I.I.; Kolesnichenko, L.G.; Kirpotin, S.N.; Pokrovsky, O.S.; Vorobyev, S.N. Peat deposits and peat-forming plants in the mires of the West Siberian northern taiga (based on studies of the Khanymei site). IOP Conf. Ser. Earth Environ. Sci. 2019, 232, 012018. [Google Scholar] [CrossRef]
  11. Gerasimov, Y. Energy Sector in Belarus: Focus on Wood and Peat Fuels; Finnish Forest Research Institute: Vantaa, Finland, 2010. [Google Scholar]
  12. Sutejo, Y.; Saggaff, A.; Rahayu, W.; Hanafiah, I. Physical and chemical characteristics of fibrous peat. In Proceedings of the 3rd International Conference on Construction and Building Engineering, Palembang, Indonesia, 14–17 August 2017; AIP Publishing: Melville, NY, USA, 2017; p. 090006. [Google Scholar]
  13. Chow, J.C.; Cao, J.; Chen, L.-W.A.; Wang, X.; Wang, Q.; Tian, J.; Ho, S.S.H.; Carlson, T.B.; Kohl, S.D.; Watson, J.G. Changes in PM2.5 Peat Combustion Source Profiles with Atmospheric Aging in an Oxidation Flow Reactor. Atmospheric Measurement Techniques Discussions, 2019; 1–44, (under review). [Google Scholar] [CrossRef]
  14. Hu, Y.; Christensen, E.; Restuccia, F.; Rein, G. Transient gas and particle emissions from smouldering combustion of peat. Proceed. Combust. Inst. 2019, 37, 4035–4042. [Google Scholar] [CrossRef]
  15. Palamba, P.; Ramadhan, M.L.; Imran, F.A.; Kosasih, E.A.; Nugroho, Y.S. Investigation of smoldering combustion propagation of dried peat. In Proceedings of the International Tropical Renewable Energy Conference, Bogor, Indonesia, 26–28 October 2016; AIP Publishing: Melville, NY, USA, 2017; p. 020017. [Google Scholar]
  16. Huang, X.; Rein, G. Upward-and-downward spread of smoldering peat fire. Proceed. Combust. Inst. 2019, 37, 4025–4033. [Google Scholar] [CrossRef]
  17. Kohlenberg, A.J.; Turetsky, M.R.; Thompson, D.K.; Branfireun, B.A.; Mitchell, C.P.J. Controls on boreal peat combustion and resulting emissions of carbon and mercury. Environ. Res. Lett. 2018, 13, 035005. [Google Scholar] [CrossRef]
  18. Turetsky, M.R.; Benscoter, B.; Page, S.; Rein, G.; van der Werf, G.R.; Watts, A. Global vulnerability of peatlands to fire and carbon loss. Nature Geosci. 2015, 8, 11–14. [Google Scholar] [CrossRef]
  19. Black, R.R.; Aurell, J.; Holder, A.; George, I.J.; Gullett, B.K.; Hays, M.D.; Geron, C.D.; Tabor, D. Characterization of gas and particle emissions from laboratory burns of peat. Atmos. Environ. 2016, 132, 49–57. [Google Scholar] [CrossRef] [Green Version]
  20. Geron, C.; Hays, M. Air emissions from organic soil burning on the coastal plain of North Carolina. Atmos. Environ. 2013, 64, 192–199. [Google Scholar] [CrossRef]
  21. Othman, M.; Latif, M.T. Dust and Gas Emissions from Small-Scale Peat Combustion. Aerosol Air Qual. Res. 2013, 13, 1045–1059. [Google Scholar] [CrossRef]
  22. Telford, P.G. Peat fuel—A sustainable bioenergy resource. In Proceedings of the International Conference on Environmental Management and Engineering, Banff, AB, Canada, 6–8 July 2009; Hamza, M.H., Ed.; ACTA Press: Calgary, AB, Canada, 2009; pp. 650–815. [Google Scholar]
  23. Lempinen, H. “Barely surviving on a pile of gold”: Arguing for the case of peat energy in 2010s Finland. Energy Policy 2019, 128, 1–7. [Google Scholar] [CrossRef]
  24. Tcvetkov, P.S. The history, present status and future prospects of the Russian fuel peat industry. Mires Peat 2017, 19, 1–12. [Google Scholar]
  25. Toner, E. Power from peat—more polluting than coal—is on its way out in Ireland. Science. 2018. Available online: https://www.sciencemag.org/news/2018/12/power-peat-more-polluting-coal-its-way-out-ireland (accessed on 4 October 2019).
  26. Werner, S. District heating and cooling in Sweden. Energy 2017, 126, 419–429. [Google Scholar] [CrossRef]
  27. Lukoševičius, V. Regarding wider usage of local fuel—Energy peat—in Lithuanian heat and electricity sector; Lithuanian Energy Consultants Association: Vilnius, Lithuania, 2014. [Google Scholar]
  28. Mitchell, E.J.S.; Lea-Langton, A.R.; Jones, J.M.; Williams, A.; Layden, P.; Johnson, R. The impact of fuel properties on the emissions from the combustion of biomass and other solid fuels in a fixed bed domestic stove. Fuel Process. Technol. 2016, 142, 115–123. [Google Scholar] [CrossRef]
  29. Dehmer, J. Petrological and organic geochemical investigation of recent peats with known environments of deposition. Int. J. Coal Geol. 1995, 28, 111–138. [Google Scholar] [CrossRef]
  30. Orru, M.; Übner, M.; Orru, H. Chemical properties of peat in three peatlands with balneological potential in Estonia. Est. J. Earth Sci. 2011, 60, 43. [Google Scholar] [CrossRef]
  31. Jayarathne, T.; Stockwell, C.E.; Gilbert, A.A.; Daugherty, K.; Cochrane, M.A.; Ryan, K.C.; Putra, E.I.; Saharjo, B.H.; Nurhayati, A.D.; Albar, I.; et al. Chemical characterization of fine particulate matter emitted by peat fires in Central Kalimantan, Indonesia, during the 2015 El Niño. Atmos. Chem. Phys. 2018, 18, 2585–2600. [Google Scholar] [CrossRef]
  32. Fabiańska, M.J.; Szymczyk, A.; Chłapik, M. Fossil fuel compounds from fly dust in recent organic matter of southern Poland peats. Geochemistry 2014, 74, 237–250. [Google Scholar] [CrossRef]
  33. Schellekens, J.; Bradley, J.A.; Kuyper, T.W.; Fraga, I.; Pontevedra-Pombal, X.; Vidal-Torrado, P.; Abbott, G.D.; Buurman, P. The use of plant-specific pyrolysis products as biomarkers in peat deposits. Quat. Sci. Rev. 2015, 123, 254–264. [Google Scholar] [CrossRef] [Green Version]
  34. Mikhailov, A.V. Coal-peat compositions for co-combustion in local boilers. J. Min. Inst. 2016, 220, 538–544. [Google Scholar]
  35. Zulkifley, M.T.M.; Ng, T.F.; Abdullah, W.H.; Raj, J.K.; Shuib, M.K.; Ghani, A.A.; Ashraf, M.A. Geochemical characteristics of a tropical lowland peat dome in the Kota Samarahan-Asajaya area, West Sarawak, Malaysia. Environ. Earth Sci. 2015, 73, 1443–1458. [Google Scholar] [CrossRef]
  36. Roulston, C.; Paton-Walsh, C.; Smith, T.E.L.; Guérette, É.-A.; Evers, S.; Yule, C.M.; Rein, G.; Van der Werf, G.R. Fine particle emissions from tropical peat fires decrease rapidly with time dince ignition. J. Geophys. Res. Atmos. 2018, 123, 5607–5617. [Google Scholar] [CrossRef]
  37. Fujii, Y.; Iriana, W.; Oda, M.; Puriwigati, A.; Tohno, S.; Lestari, P.; Mizohata, A.; Huboyo, H.S. Characteristics of carbonaceous aerosols emitted from peatland fire in Riau, Sumatra, Indonesia. Atmos. Environ. 2014, 87, 164–169. [Google Scholar] [CrossRef] [Green Version]
  38. Růžičková, J.; Kucbel, M.; Raclavská, H.; Švédová, B.; Raclavský, K.; Juchelková, D. Comparison of organic compounds in char and soot from the combustion of biomass in boilers of various emission classes. J. Environ. Manag. 2019, 236, 769–783. [Google Scholar] [CrossRef] [PubMed]
  39. Turpin, B.J.; LIM, H.-J. Species contributions to PM2.5 mass concentrations: Revisiting common assumptions for estimating organic mass. Aerosol Sci. Technol. 2001, 35, 602–610. [Google Scholar] [CrossRef]
  40. Fachinger, F.; Drewnick, F.; Gieré, R.; Borrmann, S. How the user can influence particulate emissions from residential wood and pellet stoves: Emission factors for different fuels and burning conditions. Atmos. Environ. 2017, 158, 216–226. [Google Scholar] [CrossRef]
  41. Nkosi, N.C.; Piketh, S.J.; Burger, R.P. Fine PM emission factors from residential burning of solid fuels using traditional cast-iron coal stoves. Clean Air J. 2018, 28, 35–41. [Google Scholar] [CrossRef]
  42. Raclavská, H.; Corsaro, A.; Hartmann-Koval, S.; Juchelková, D. Enrichment and distribution of 24 elements within the sub-sieve particle size distribution ranges of fly ash from wastes incinerator plants. J. Environ. Manag. 2017, 203, 1169–1177. [Google Scholar] [CrossRef] [PubMed]
  43. Esenlik, S.; Karayigit, A.I.; Bulut, Y.; Querol, X.; Alastuey, A.; Font, O. Element behaviour during combustion in coal-fired Orhaneli power plant, Bursa-Turkey. Geologica Acta 2006, 4, 439–449. [Google Scholar]
  44. Meij, R. Trace element behavior in coal-fired power plants. Fuel Process. Technol. 1994, 39, 199–217. [Google Scholar] [CrossRef]
  45. Dolníčková, D.; Drozdová, J.; Raclavský, K.; Juchelková, D. Geochemistry of trace elements in fly ashes from lignite fired power stations. Inżynieria Miner. J. Pol. Miner. Eng. Soc. 2012, 28, 59–68. [Google Scholar]
  46. Smieja-Król, B.; Fiałkiewicz-Kozieł, B.; Sikorski, J.; Palowski, B. Heavy metal behaviour in peat–A mineralogical perspective. Sci. Total Environ. 2010, 408, 5924–5931. [Google Scholar] [CrossRef]
  47. Biester, H.; Hermanns, Y.-M.; Martinez Cortizas, A. The influence of organic matter decay on the distribution of major and trace elements in ombrotrophic mires–a case study from the Harz Mountains. Geochimica et Cosmochimica Acta 2012, 84, 126–136. [Google Scholar] [CrossRef]
  48. Sippula, O.; Lamberg, H.; Leskinen, J.; Tissari, J.; Jokiniemi, J. Emissions and ash behavior in a 500 kW pellet boiler operated with various blends of woody biomass and peat. Fuel 2017, 202, 144–153. [Google Scholar] [CrossRef]
  49. Kazi, T.G.; Lashari, A.A.; Ali, J.; Baig, J.A.; Afridi, H.I. Volatilization of toxic elements from coal samples of Thar coal field, after burning at different temperature and their mobility from ash: Risk assessment. Chemosphere 2019, 217, 35–41. [Google Scholar] [CrossRef] [PubMed]
  50. Ting, G. An overview of peat related chemistry. Bachelor’s Thesis, Central University of Applied Sciences, Kokkola, Finland, April 2015. [Google Scholar]
  51. Teirumnieka, Ē.; Kļaviņš, M.; Teirumnieks, E. Major and Trace Elements in Peat from Bogs of East Latvia. In Mires Peat; Klavins, M., Ed.; University of Latvia Press: Riga, Latvia, 2010; pp. 115–123. [Google Scholar]
  52. Klavins, M.; Silamikele, I.; Nikodemus, O.; Kalnina, L.; Kuske, E.; Rodinov, V.; Purmalis, O. Peat properties, major and trace element accumulation in bog peat in Latvia. Baltica 2009, 22, 37–49. [Google Scholar]
  53. Cao, W.; Martí-Rosselló, T.; Li, J.; Lue, L. Prediction of potassium compounds released from biomass during combustion. Appl. Energy 2019, 250, 1696–1705. [Google Scholar] [CrossRef]
  54. Tripathi, M.; Sahu, J.N.; Ganesan, P. Effect of process parameters on production of biochar from biomass waste through pyrolysis: A review. Renew. Sustain. Energy Rev. 2016, 55, 467–481. [Google Scholar] [CrossRef]
  55. Liu, T.; Guo, Y.; Peng, N.; Lang, Q.; Xia, Y.; Gai, C.; Liu, Z. Nitrogen transformation among char, tar and gas during pyrolysis of sewage sludge and corresponding hydrochar. J. Anal. Appl. Pyrolysis 2017, 126, 298–306. [Google Scholar] [CrossRef]
  56. Riaza, J.; Mason, P.; Jones, J.M.; Gibbins, J.; Chalmers, H. High temperature volatile yield and nitrogen partitioning during pyrolysis of coal and biomass fuels. Fuel 2019, 248, 215–220. [Google Scholar] [CrossRef]
  57. Broer, K.M.; Brown, R.C. The role of char and tar in determining the gas-phase partitioning of nitrogen during biomass gasification. Appl. Energy 2015, 158, 474–483. [Google Scholar] [CrossRef]
  58. Jansen, B.; Nierop, K.G.J. Methyl ketones in high altitude Ecuadorian Andosols confirm excellent conservation of plant-specific n-alkane patterns. Organic Geochem. 2009, 40, 61–69. [Google Scholar] [CrossRef]
  59. Ralph, J.; Quideau, S.; Grabber, J.H.; Hatfield, R.D. Identification and synthesis of new ferulic acid dehydrodimers present in grass cell walls. J. Chem. Society Perkin Trans. 1994, 1, 3485–3498. [Google Scholar] [CrossRef]
  60. Bocchini, P.; Galletti, G.C.; Camarero, S.; Martinez, A.T. Absolute quantitation of lignin pyrolysis products using an internal standard. J. Chromatogr. A 1997, 773, 227–232. [Google Scholar] [CrossRef]
  61. Yang, H.; Yan, R.; Chen, H.; Lee, D.H.; Zheng, C. Characteristics of hemicellulose, cellulose and lignin pyrolysis. Fuel 2007, 86, 1781–1788. [Google Scholar] [CrossRef]
  62. Fabbri, D.; Torri, C.; Spokas, K.A. Analytical pyrolysis of synthetic chars derived from biomass with potential agronomic application (biochar). Relationships with impacts on microbial carbon dioxide production. J. Anal. Appl. Pyrolysis 2012, 93, 77–84. [Google Scholar] [CrossRef]
  63. Simoneit, B.R.T. Organic matter of the troposphere-V: Application of molecular marker analysis to biogenic emissions into the troposphere for source reconciliations. J. Atmos. Chem. 1989, 8, 251–275. [Google Scholar] [CrossRef]
  64. Wornat, M.J.; Ledesma, E.B.; Marsh, N.D. Polycyclic aromatic hydrocarbons from the pyrolysis of catechol (ortho-dihydroxybenzene), a model fuel representative of entities in tobacco, coal, and lignin. Fuel 2001, 80, 1711–1726. [Google Scholar] [CrossRef]
  65. Zhou, H.; Wu, C.; Onwudili, J.A.; Meng, A.; Zhang, Y.; Williams, P.T. Polycyclic Aromatic Hydrocarbon Formation from the Pyrolysis/Gasification of Lignin at Different Reaction Conditions. Energy Fuels 2014, 28, 6371–6379. [Google Scholar] [CrossRef]
  66. Fitzpatrick, E.M.; Ross, A.B.; Bates, J.; Andrews, G.; Jones, J.M.; Phylaktou, H.; Pourkashanian, M.; Williams, A. Emission of Oxygenated Species from the Combustion of Pine Wood and its Relation to Soot Formation. Process. Saf. Environ. Prot. 2007, 85, 430–440. [Google Scholar] [CrossRef]
  67. Song, J.; Peng, P. Characterisation of black carbon materials by pyrolysis–gas chromatography–mass spectrometry. J. Anal. Appl. Pyrolysis 2010, 87, 129–137. [Google Scholar] [CrossRef]
  68. Knicker, H.; Almendros, G.; González-Vila, F.J.; Martin, F.; Lüdemann, H.-D. 13C- and 15N-NMR spectroscopic examination of the transformation of organic nitrogen in plant biomass during thermal treatment. Soil Biol. Biochem. 1996, 28, 1053–1060. [Google Scholar] [CrossRef]
  69. Kuo, L.J.; Herbert, B.E.; Louchouarn, P. Can levoglucosan be used to characterize and quantify char/charcoal black carbon in environmental media? Org. Geochem. 2008, 39, 1466–1478. [Google Scholar] [CrossRef]
  70. Růžičková, J.; Kucbel, M.; Raclavská, H.; Švédová, B.; Raclavský, K.; Šafář, M. Organic compounds in char from the combustion of peat briquettes in household boilers. In Proceedings of the 2019 IEEE International Conference on Environment and Electrical Engineering and 2019 IEEE Industrial and Commercial Power Systems Europe, Genova, Italy, 11–14 June 2019; pp. 1439–1444. [Google Scholar]
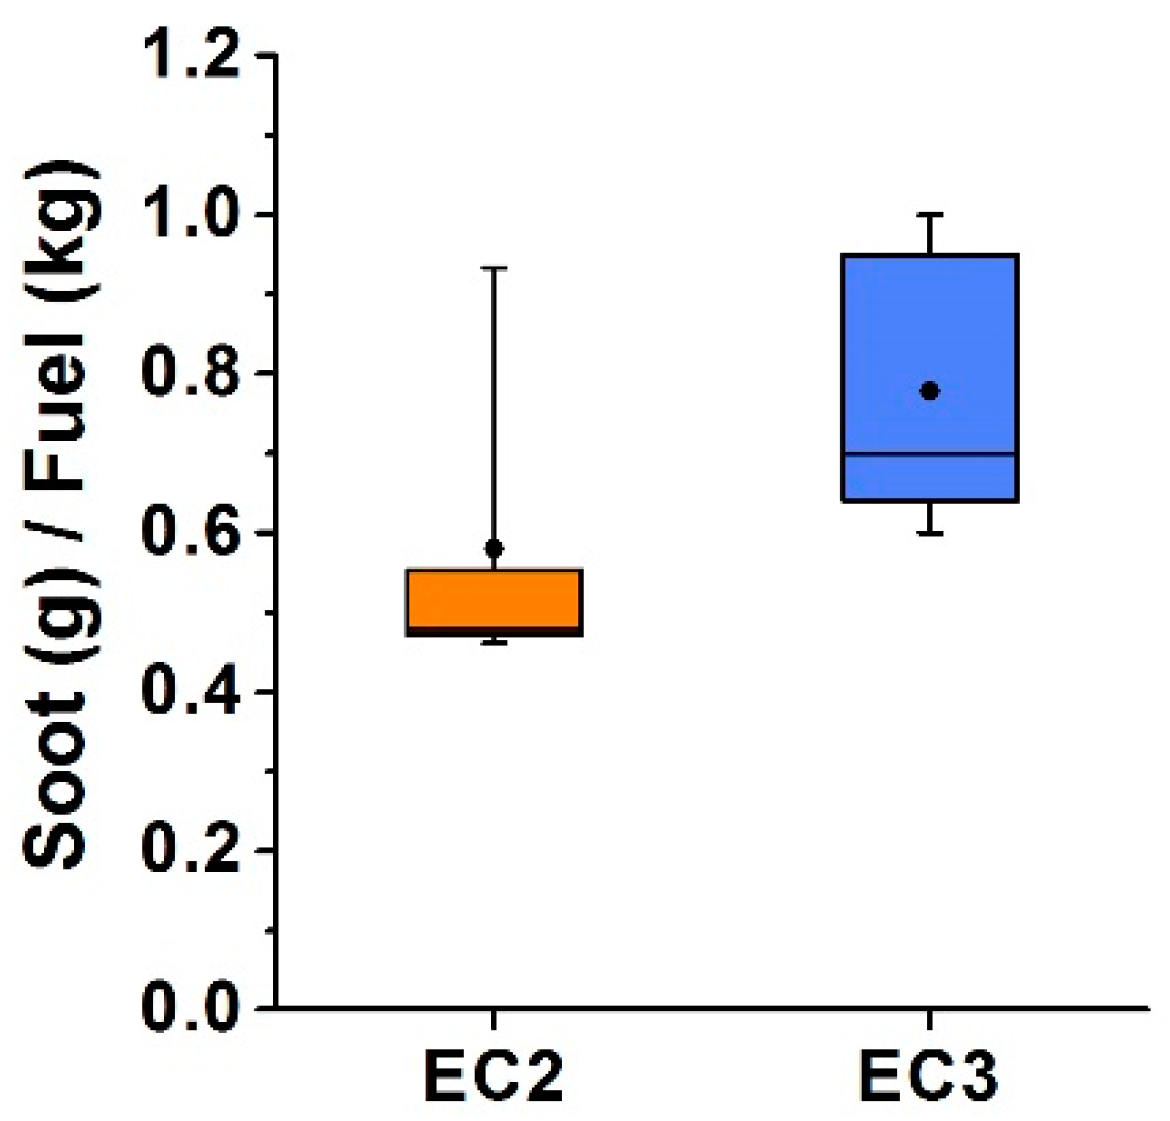
Figure 1. Boxplot‒production of soot during peat briquettes combustion in boilers of emission class 2 and 3 (EC2 and EC3).
Energies 12 03784 g001
Figure 2. Relationship between amounts of produced soot from 1 kg of peat briquettes and speed of burning.
Energies 12 03784 g002
Figure 3. Quartz particles in peat briquettes.
Energies 12 03784 g003
Figure 4. The character of char (calcified fibre) from the combustion of peat briquettes.
Energies 12 03784 g004
Figure 5. Relative enrichment for major elements in soot (S) and ash (A) from the combustion of peat briquettes in boilers EC2 and EC3.
Energies 12 03784 g005
Figure 6. Relative enrichment for trace elements in soot (S) and ash (A) from the combustion of peat briquettes in boilers EC2 and EC3.
Energies 12 03784 g006
Figure 7. Enrichment factor (EF) for major elements in soot (S) and ash (A) from the combustion of peat briquettes in boilers EC2 and EC3.
Energies 12 03784 g007
Figure 8. Enrichment factor for trace elements in soot (S) and ash (A) from the combustion of peat briquettes in boilers EC2 and EC3.
Energies 12 03784 g008
Figure 9. Dependence of concentration of Fe on particle size in ash.
Energies 12 03784 g009
Figure 10. Dependence of concentration of Pb on particle size in ash.
Energies 12 03784 g010
Figure 11. Comparison of the particle size distribution for ash particles from boilers of EC2 and EC3.
Energies 12 03784 g011
Figure 12. Mean value of particle size of soot (d050) for boilers of EC2 and EC3 for interval 8–11 h and 22 h. S-W: soot-walls; S-R: soot-ribs; L: long-lasting burning.
Energies 12 03784 g012
Figure 13. Content of ash in soot from the combustion of peat briquettes. S-W: soot-walls, S-R: soot-ribs, L: long-lasting burning.
Energies 12 03784 g013
Figure 14. The proportion of leached ions from soot (S) and fly ash (A) for boilers of emission classes EC2 and EC3.
Energies 12 03784 g014
Figure 15. Organic compounds in pyrolysates: (a) boiler EC2; (b) boiler EC3.
Energies 12 03784 g015
Figure 16. Percentages of groups of organic compounds in soot from boilers of emission class 2 and 3 (EC2 and EC3).
Energies 12 03784 g016
Table 1. The basic information on combustion conditions and concentrations of elemental carbon and organic carbon in soot.
EC2EC3
Unit112116117121123122131137138163
Weight of sootg28.022.020.020.012.028.030.024.032.038.0
Fuel consumptionkg30.039.842.441.626.040.030.040.050.040.0
Burning timehours8.008.0011.08.007.5014.011.011.028.024.0
Soot productiong/kg fuel0.930.550.470.480.460.701.000.600.640.95
Fuel/hourskg/h3.754.983.855.203.472.862.733.641.791.67
OC-sootg/kg270277265266259299309220263283
EC-sootg/kg382382370287365315321280307320
TC-sootg/kg652660635553625614630500570603
OC/EC 0.710.720.720.920.710.950.960.790.860.88
OM-sootg/kg378388371372363418432308368396
Ash in sootwt.%24.023.025.934.127.226.724.741.232.528.4
Char in ashwt.%10.68.259.458.627.7610.212.77.766.229.64
Table 2. Proximate and ultimate analysis of peat briquettes and wood.
UnitPeat BriquettesPeat Briquettes *HardwoodSoftwood
Moisturewt. %13.238–608.909.22
Calorific valueMJ/kg18.16.5–11.917.218.3
Ashwt. %13.53.0–7.01.310.55
VM60.967–7075–80
FC25.620–3020–25
C48.148–6547–5050–53
N3.200.6–3.00.120.21
S0.500.1–1.5BDLBDL
O29.226–4245.1042.70
H5.475.606.226.38
Explanations: BDL—below the detection limit, FC—Fixed carbon, VM—Volatile matter, * [27].
Table 3. Chemical composition of peat from various localities, the analysed peat briquettes and lignite from North Bohemia Mines, Chomutov, Czech Republic.
ElementUnitFinlandFinlandUKGermany *NorwayNorway-SNorway-NLatviaEstoniaEstoniaRussiaAustraliaUkraineLignite
Al%0.210.26 0.31
Ca%0.410.31 0.55–0.180.38 0.47n.d. 3.81
Fe%0.670.74 0.74–8.430.210.110.070.11n.d.0.110.170.161.95
K% 0.079 0.14 0.0065n.d. 0.098
Mg%0.090.07 0.22 0.056n.d.
Mn%0.0081 0.003–0.0340.00750.0030.0040.00140.00140.0140.068 0.031
Na% 0.11 0.069 0.011n.d.
P%0.0480.063 0.25
S%0.170.163 0.54
Si%0.020.78 0.91–2.46 1.28
N% 1.43
Asmg/kg2.9 5.5–104.40.5 1.190.89 2.46.9
Bamg/kg36.6 208
Cdmg/kg0.4 2.09 n.d.1.20.240.149.6217.4 2.72.24.46
Clmg/kg 520 175–466 486
Comg/kg1.3 0.931.161.060.140.09 n.d. 10
Crmg/kg5.6 15.98.3–36.412.50.80.91.170.39 63
Cumg/kg8.5 54.8 55.61.62.191.36102.126.34.26.416
Hgµg/kg 13.2–525
Momg/kg1.2 0.85 0.320.21 0.8
Nimg/kg3.5 10.9 4.31.42.61.380.7146.6 n.d.1.2
Pbmg/kg4.6 3587–2256n.d.23.26.94.779.622001528.61014
Semg/kg 0.37 0.16n.d. 1.18
Srmg/kg26.9 183
Timg/kg57.1 23.851–7 110
Umg/kg9.4
Thmg/kg0.6 10
Vmg/kg11.3 3.75 1.330.51 48
Znmg/kg16.75.256.278–3594819.612.310.68.5444659.611.32768
Zrmg/kg 19
References[50][48][51][47][52][51][51][52][52][51][51][51]This study[45]
* min and max concentration.
Table 4. Leachability of water-soluble ions from soot and ash (g/kg d.m.).
UnitEC2 S-WEC2 S-REC3 S-WEC3 S-REC2 AEC3 A
pH 7.91 ± 0.247.82 ± 0.127.46 ± 0.157.41 ± 0.1511.40 ± 0.2011.07 ± 0.45
ConductivityµS/cm5920 ± 6807820 ± 7983440 ± 5543300 ± 4282096 ± 2633102 ± 298
Clg/kg6.92 ± 1.149.93 ± 1.271.02 ± 0.411.08 ± 0.320.47 ± 0.370.37 ± 0.21
SO42−g/kg14.81 ± 2.3218.03 ± 3.5414.27 ± 1.9813.61 ± 2.213.23 ± 0.374.21 ± 0.07
PO43−mg/kg5.87 ± 0.0514.30 ± 1.1420.82 ± 2.286.18 ± 0.08b.d.b.d.
N-NO3mg/kg66.74 ± 11.286.41 ± 24.527.67 ± 6.426.59 ± 8.57.02 ± 1.214.66 ± 2.2
N-NH4g/kg1.49 ± 0.273.69 ± 1.240.24 ± 0.060.19 ± 0.040.0094 ± 0.0010.0045 ± 0.001
Norgg/kg0.56 ± 0.120.22 ± 0.050.44 ± 0.110.52 ± 0.150.034 ± 0.010.032 ± 0.01
Ntotalg/kg2.12 ± 0.43.99 ± 0.20.71 ± 0.20.73 ± 0.20.051 ± 0.0170.052 ± 0.014
Na+g/kg1.15 ± 0.211.08 ± 0.040.17 ± 0.050.17 ± 0.050.14 ± 0.030.13 ± 0.04
K+g/kg2.29 ± 0.224.19 ± 0.543.14 ± 0.284.32 ± 0.410.96 ± 0.523.16 ± 2.81
Ca2+g/kg1.68 ± 0.242.36 ± 0.582.51 ± 0.421.80 ± 0.213.03 ± 1.045.61 ± 2.81
Mg2+g/kg2.11 ± 0.182.22 ± 0.221.87 ± 0.141.41 ± 0.170.15 ± 0.080.24 ± 0.021