Article

Development of an Integrated Power Distribution System Laboratory Platform Using Modular Miniature Physical Elements: A Case Study of Fault Location

1
Department of Electrical Engineering, School of Automation, Wuhan University of Technology, Wuhan 430070, China
2
Department of Electrical Engineering, Wuhan Electric Power Technical College, Wuhan 430079, China
3
Department of Educational Technology, Shaoguan University, Shaoguan 512005, China
4
School of Electrical and Electronic Engineering, Huazhong University of Science and Technology, Wuhan 430074, China
*
Author to whom correspondence should be addressed.
Energies 2019, 12(19), 3780; https://doi.org/10.3390/en12193780
Submission received: 29 August 2019 / Revised: 29 September 2019 / Accepted: 1 October 2019 / Published: 5 October 2019
(This article belongs to the Special Issue Transient and Dynamic Simulations of Distribution Networks)

Abstract

:
The main shortcomings of the software-based power engineering education are a lack of physical understanding of phenomena and hands-on experience. Existing scaled-down analogous educational power system platforms cannot be widely used for experiments in universities due to the high cost, complicated operation, and huge size. An integrated power distribution system laboratory platform (PDSLP) using modular miniature physical elements is proposed in this paper. The printed circuit board (PCB) and microelectronic technology are proposed to construct each physical element. Furthermore, the constructed physical elements are used to set up an integrated PDSLP based on modular assembly technology. The size of the proposed cost-efficient PDSLP is significantly reduced, and the reliability of the proposed PDSLP can be improved greatly because the signal transmission path is shortened and a number of welding points are reduced. A PDSLP for fault location in neutral non-effectively grounded distribution systems (NGDSs) is selected as a typical experimental scenario and one scaled-down distribution network with three feeders is subsequently implemented and discussed. The measured zero-sequence currents by our proposed PDSLP when a single-phase earth fault occurred can reveal the true features of the fault-generated signals, including steady-state and transient characteristics of zero-sequence currents. They can be readily observed and used for students to design corresponding fault location algorithms. Modular renewable energy sources and other elements can be designed, implemented and integrated into the proposed platform for the laboratory education of the active distribution networks in the future.

1. Introduction

Laboratory education is an essential part of today’s university-level electric power engineering education. Various laboratory experimental platforms have been developed and widely used, with the aim to provide the students with theoretical knowledge and practical experience. Several decades ago, electrical machines and high voltage laboratories were constructed and used for teaching practical skills [1]. However, as setting up a realistic power system in the laboratory environment is very complex and costly, digital simulation software is now commonly used in the laboratory education [2,3,4]. The main shortcomings of the software-based power engineering education are that there is a lack of physical understanding of the phenomena and little hands-on experience can be provided [5]. To overcome these problems, digital–physical hybrid simulated electrical power system platforms were proposed and realized to provide hands-on experience on some specific devices [6,7,8,9,10,11], such as distribution generators [7] and protective relays [8,9,10,11]. One laboratory education tool of operation optimization in the distribution network was proposed in Reference [7], where physical distributed energy generators are integrated into the tool, while two independent distribution systems are simulated in the digital real-time simulator. To improve the educational process of the protective relay systems, power-system-relaying laboratories were developed for testing the relay operating characteristics in References [8,9,10]. Although industrial relays are used in these laboratories, pre- and post-fault signals are generated by a digital power-system simulator to test the relays. To observe the interactive behavior between relaying automation and the electrical distribution system operation, overvoltage and overcurrent protective relays were tested under a real-time environment with a constructed hardware-in-the-loop educational platform [11]. In these proposed educational platforms, the electrical power systems are still reluctantly realized by digital simulation.
To provide students with the experience of observing electrical power system phenomena intuitively, many scaled-down power systems have been proposed and implemented to set up physical contact with the electrical world in the laboratory environment [12,13,14,15,16,17,18]. References [12] and [13] show several scaled-down systems for demonstrating traditional power system operation features. In Reference [14], a particular small power system composed of four nodes is constructed to illustrate the static VAr compensator operating characteristics. In Reference [15], a particular scaled-down physical power system is designed and simulated for protective relay function demonstration and algorithm evaluation based on the structure of a 345 kV transmission system. Unlike the abovementioned scaled-down systems, power distribution system laboratory platforms (PDSLPs) are analyzed in References [16,17,18,19,20,21]. References [16,17,18,19] discuss the laboratory development of smart distribution grids consisting of various distributed generating units and/or energy storage devices. The major influence of distributed generations and storage devices exert in the operation of distribution systems is analyzed through real-time controllers and other components. Meanwhile, some other scaled-down PDSLPs used for particular experiments are introduced in References [20,21,22]. The details of the multiphase radial power flow experiment and its corresponding hardware design, as well as the embedded monitoring and control system, are presented for the power distribution system education in Reference [20]. In References [21,22], distribution automation laboratories are implemented and described in detail, and their functions mainly include fault location identification and feeder reconfiguration. In these laboratories, the focus of the education is the performance of fault location techniques under short-circuit fault with large fault current, while the single-phase earth fault location experiment in neutral non-effectively grounded distribution systems (NGDSs), which is still an attractive and challenging technology, cannot be demonstrated. In fact, further investigation shows that the single-phase earth faults are the most prevalent, accounting for about 80% of all faults [23,24,25]. Moreover, NGDSs have been widely used in Central and Eastern Europe for many decades, as well as in China [26]. Therefore, a PDSLP for fault location in NGDSs is selected as a typical experimental scenario and implemented in this paper.
A PDSLP for the fault location in NGDSs can be directly constructed by some commercial products, such as the ones from the companies Terco [27], De Lorenzo [28], and Lucas Nülle [29]. However, the nominal voltage of the commercial experimental distribution system models is usually within 120–1000 V and the capacity of the scaled-down system is from tens to hundreds of kVA normally. Such systems are expensive and bulky for some schools. In the experiments, students have to use a number of wires to establish the electrical connections between various devices by hand. This work is time-consuming and tedious, and it can pose a safety hazard. Another disadvantage of the laboratory education using these commercial platforms is the lack of awareness about the principles and the characteristics of the equivalent electric power components, as these components are packaged and the internal structure is invisible to students.
To overcome the aforementioned problems, an integrated PDSLP using modular miniature physical elements is proposed in this paper. The printed circuit board (PCB) and microelectronic technology are proposed to construct each physical element. Furthermore, the constructed physical elements are used to set up an integrated PDSLP based on modular assembly technology. The main electrical elements, such as the three-phase transmission line module, can be realized in miniaturization by electronic components and PCBs. In addition, the elements can be efficiently and reliably connected by standard pin-outs. The reliability of the proposed integrated PDSLP can be greatly improved because the signal transmission path is shortened and a number of welding points are reduced. Then a PDSLP for fault location in NGDSs is implemented and discussed to prove the high performance of the proposed laboratory scheme.
The rest of this paper is organized as follows: In Section 2, the architecture of the proposed integrated PDSLP is introduced. In 
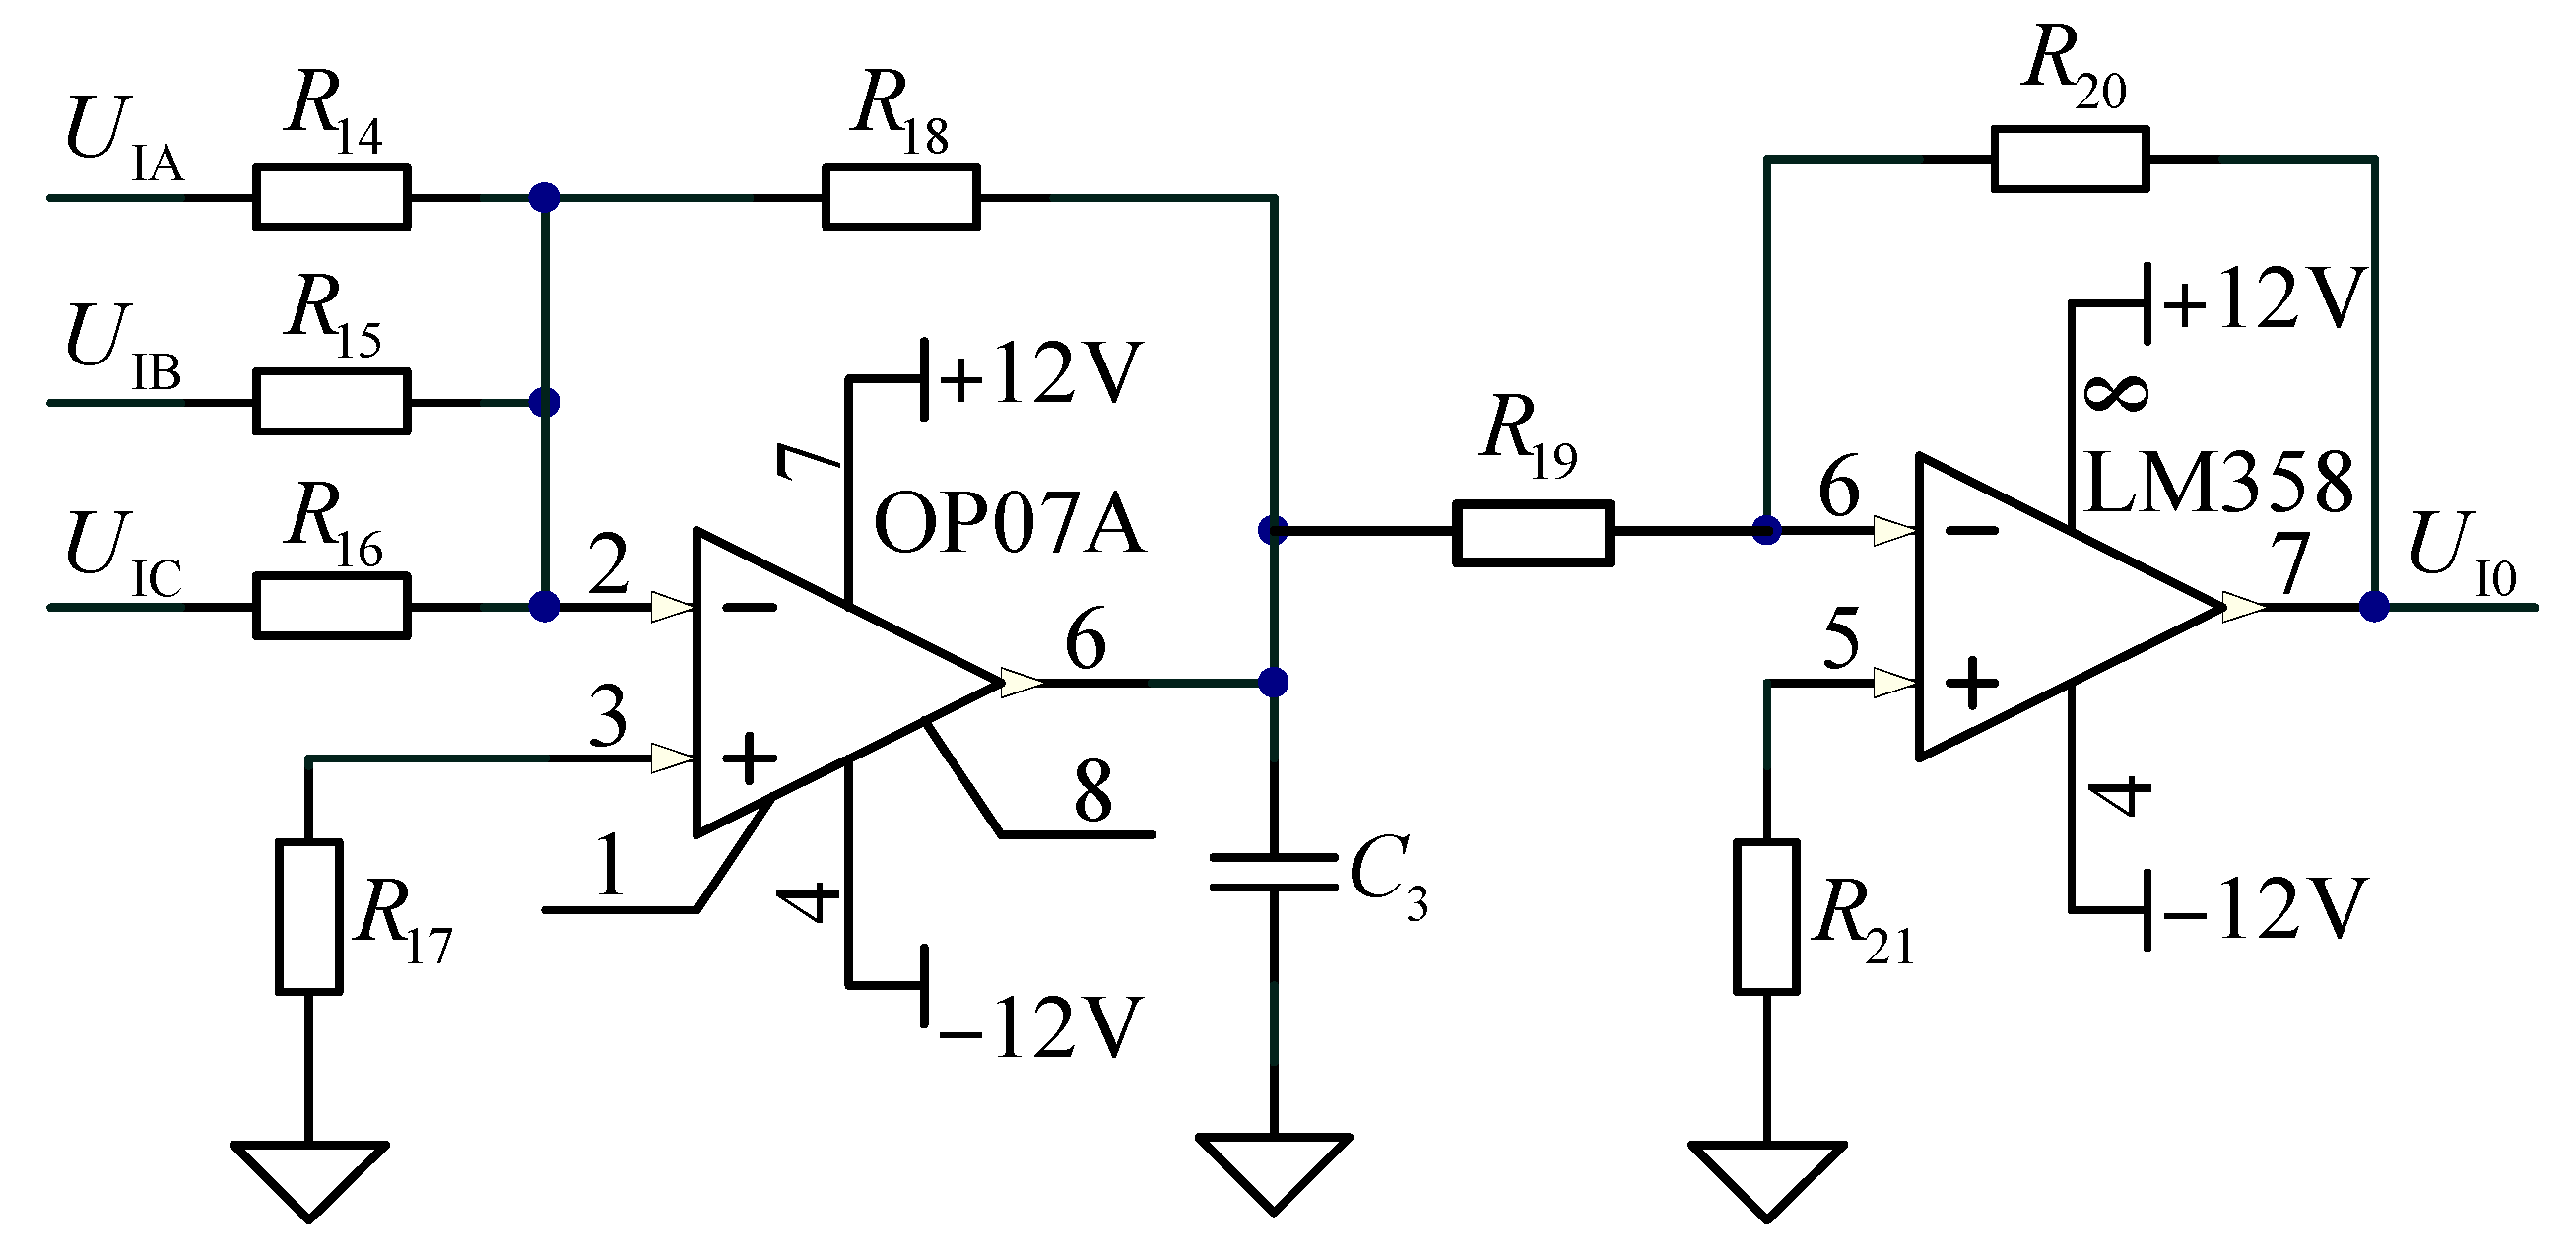
Section 3, the main modular miniature physical models used in the proposed platform are introduced, discussed, and validated, including the three-phase distribution line module, voltage/current monitoring circuit module, and short-circuit fault generator module. In Section 4, the general miniature physical elements and specialized zero-sequence current signal monitoring circuit module are designed, and then, the effectiveness of the integrated PDSLP is validated experimentally. Students’ feedbacks are presented in Section 5 to verify the positive effects of our proposed platform on power engineering education. The main findings are concluded in Section 6.

2. Architecture of the Integrated Power Distribution System Laboratory Platform

In this section, the development requirements of the proposed integrated PDSLP need to be analyzed and illustrated. In our proposed scaled-down power distribution system, the main modules to be implemented include the three-phase distribution line module, voltage/current monitoring circuit module and short-circuit fault generator module, etc. Since the distribution feeders usually include overhead lines, underground cables, and combined underground cables and overhead lines, the three-phase distribution line module can be implemented by several standardized modules. Each standardized distribution line module represents one type of distribution line with a certain length.
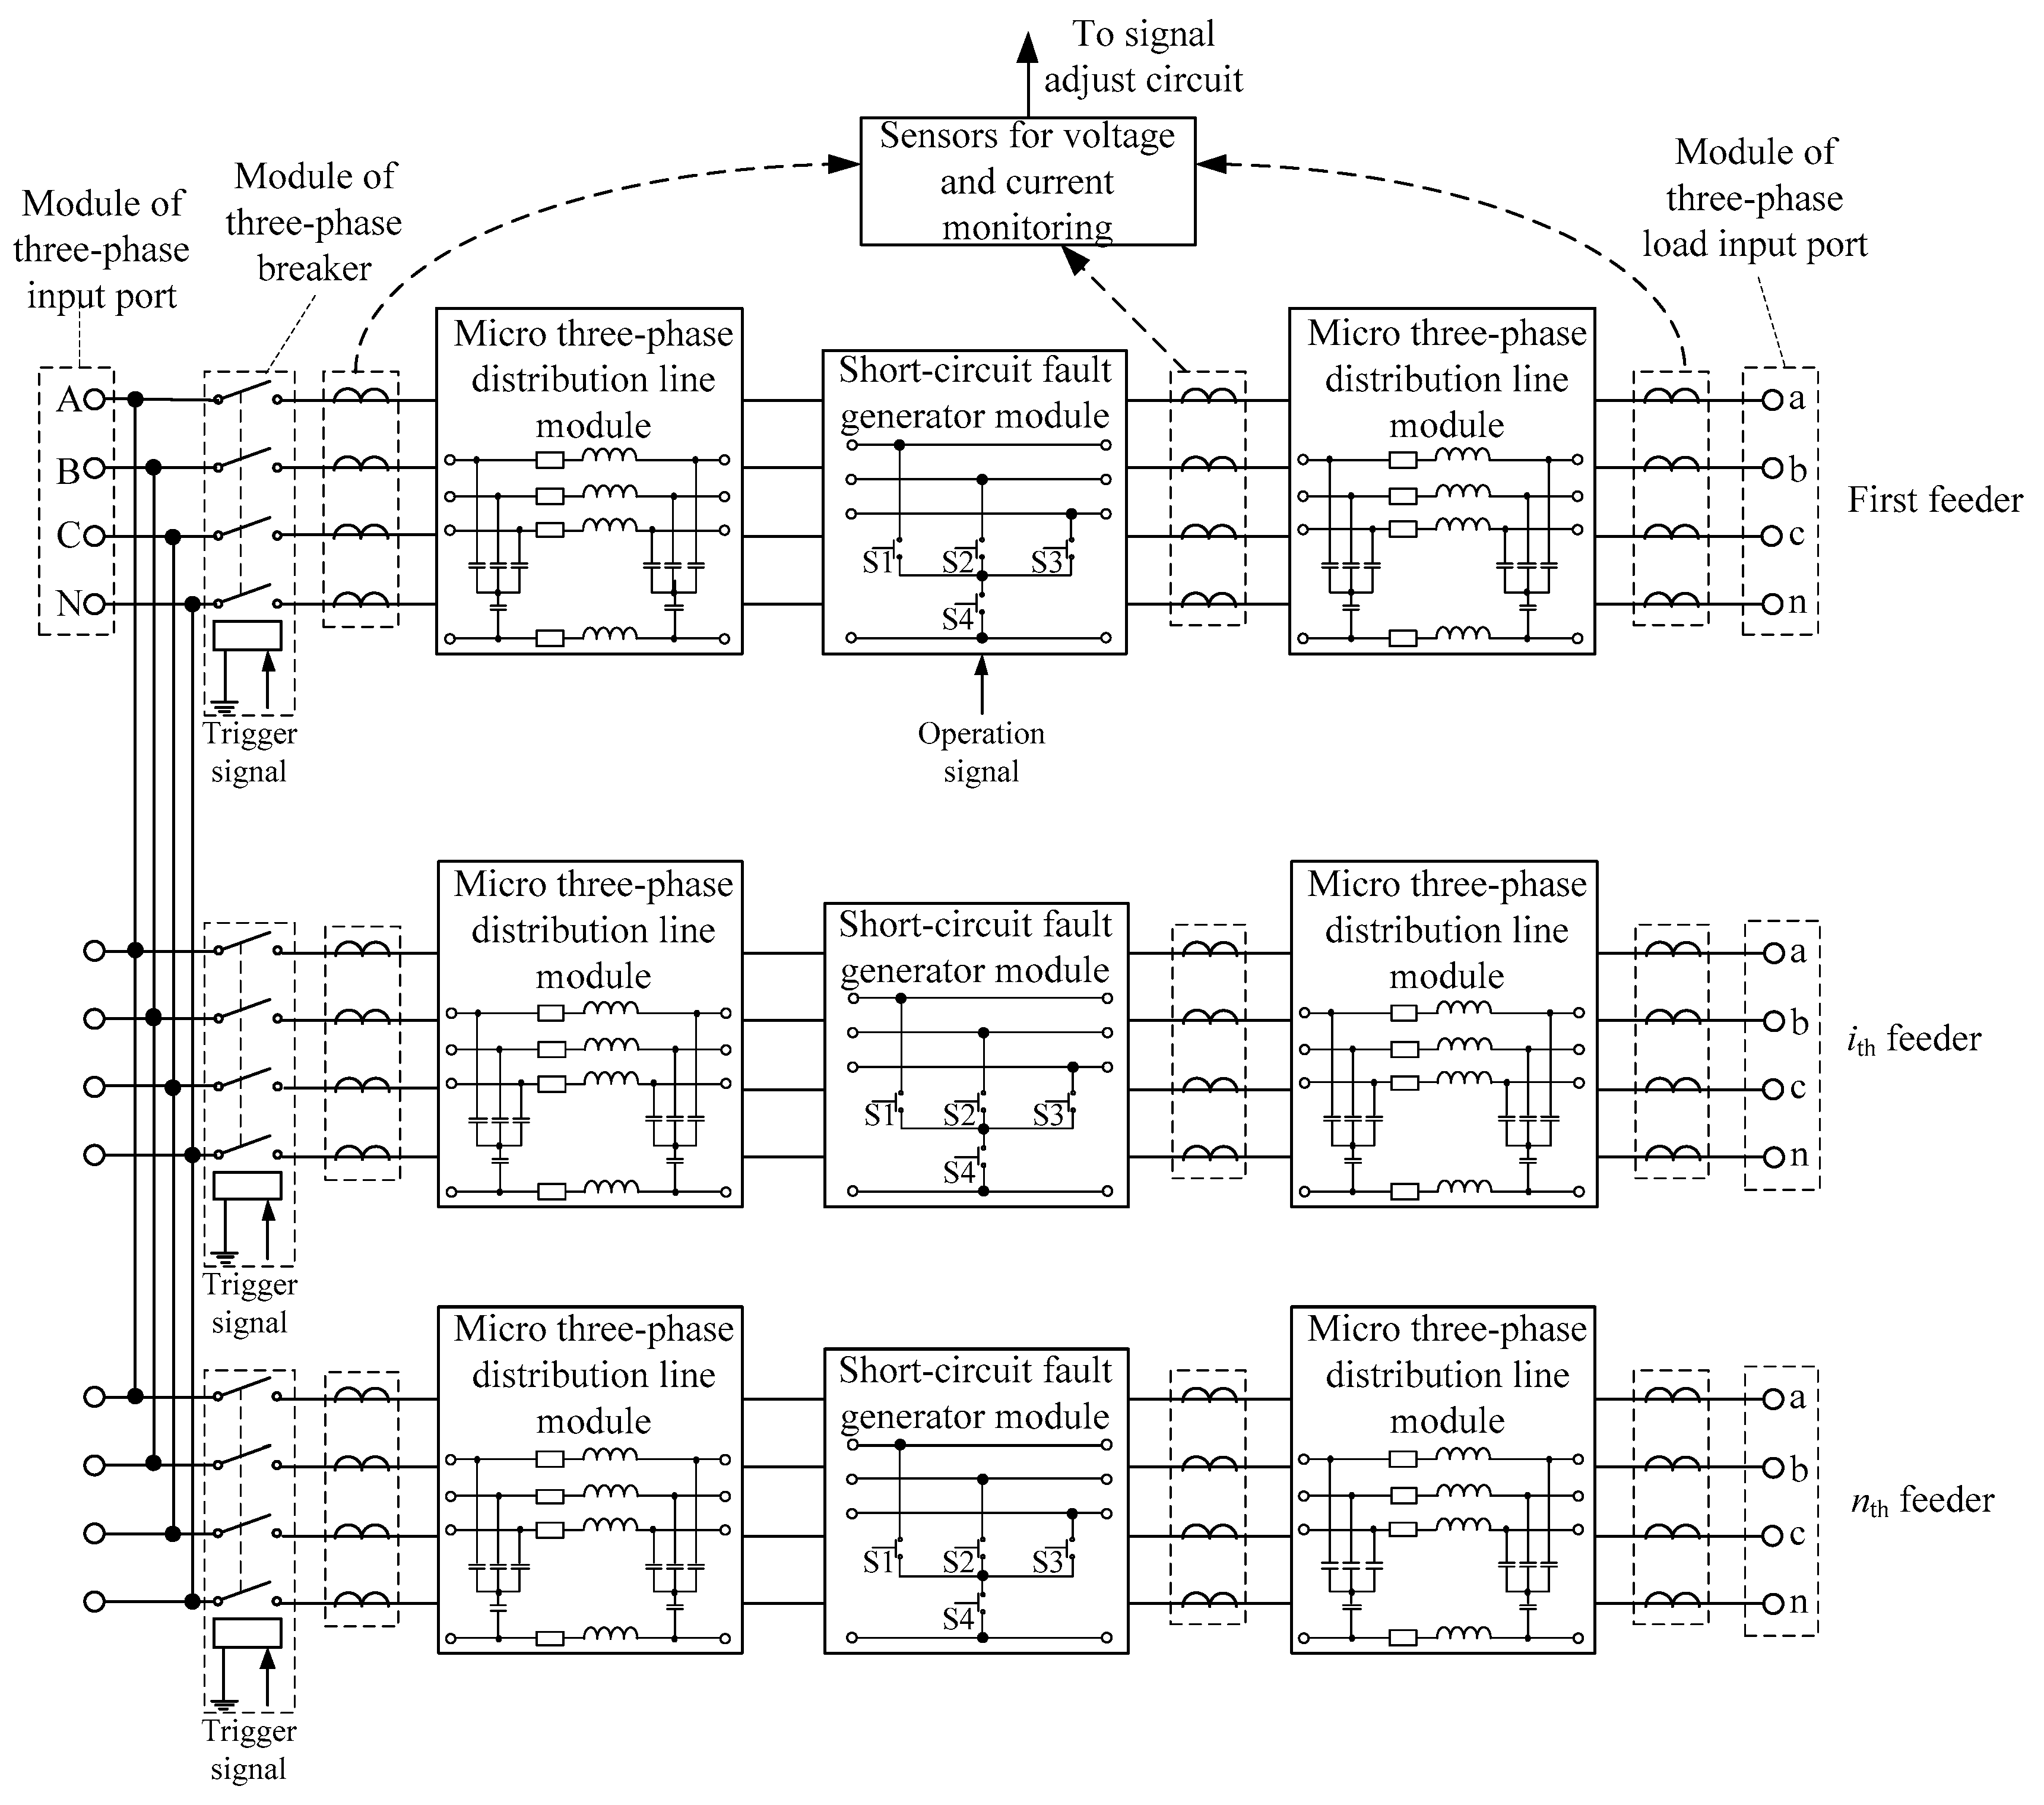
The architecture of the proposed PDSLP is shown in Figure 1. External power source, such as traditional protective relay tester with three-phase AC power output ports, is connected to the three-phase input port module, and then the following modules are connected in cascade one after another: Three-phase breaker module, voltage/current monitoring module, the first three-phase distribution line module, short-circuit fault generator module, the second three-phase distribution line module, and three-phase-load output port module. The three-phase distribution line module, short-circuit fault generator module, and voltage/current monitoring module will be introduced and discussed in Section 3.
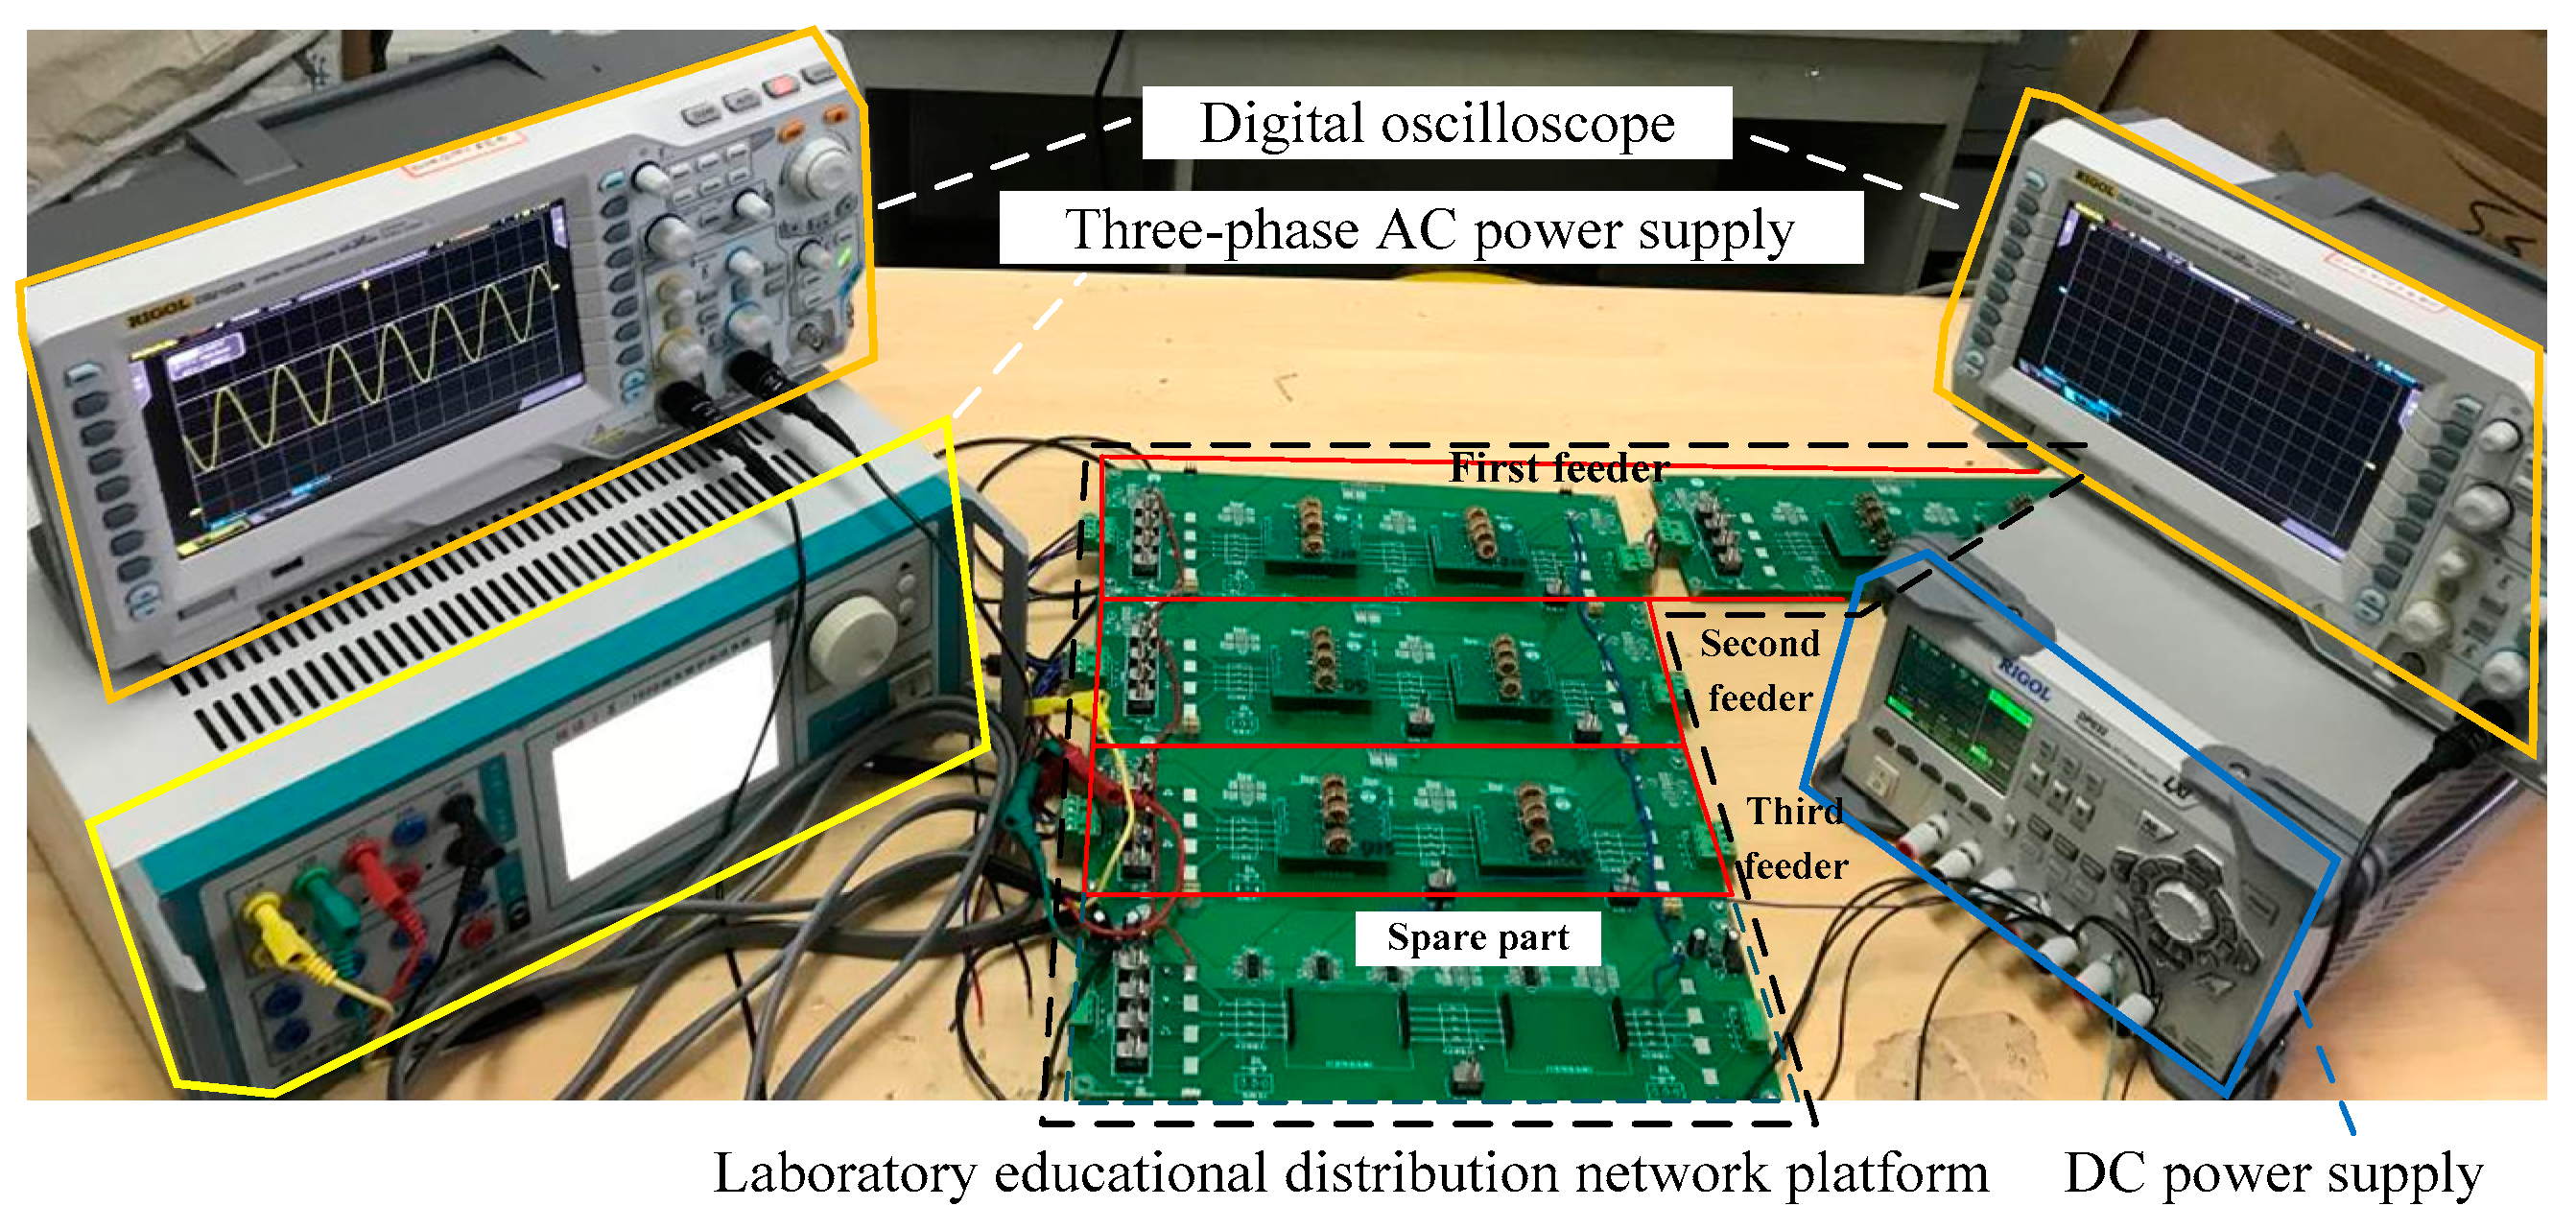
The physical models in the proposed platform are constructed by electronic components, so the PDSLP can be designed and implemented according to the PCB production process. The prototype of the proposed scaled-down PDSLP is shown in Figure 2. It is a scaled-down distribution network with three feeders, and each feeder is constructed by two three-phase distribution line modules. To eliminate the safety problem and permit the open use of the miniature PDSLP, the maximum line-to-ground voltage is limited to 35 V. The total cost of this platform is about US $1000, and the relevant equipment and its detailed cost in our proposed platform are listed in Table 1.
Since there are usually dozens of distribution lines connected to the same substation bus, we constructed twenty three-phase distribution line modules and embedded them in ten PCB motherboards (the PCB motherboard is integrated with the voltage and current monitoring circuit module, short circuit fault generator and breaker module, the module of input, and out ports). Every two distribution line modules would be embedded into one PCB motherboard. Hence the total cost of our proposed platform reached about US $1000.
The cost comparison was carried out between our proposed platform and the commercial components in the common market [27,28,29]. The detailed cost comparison is given in Table 2. Compared with the cost of the commercial devices, it can be derived the cost of the distribution line module proposed in our paper was reduced by 98.9%, and the total cost of the proposed platform was reduced by 98.6%.
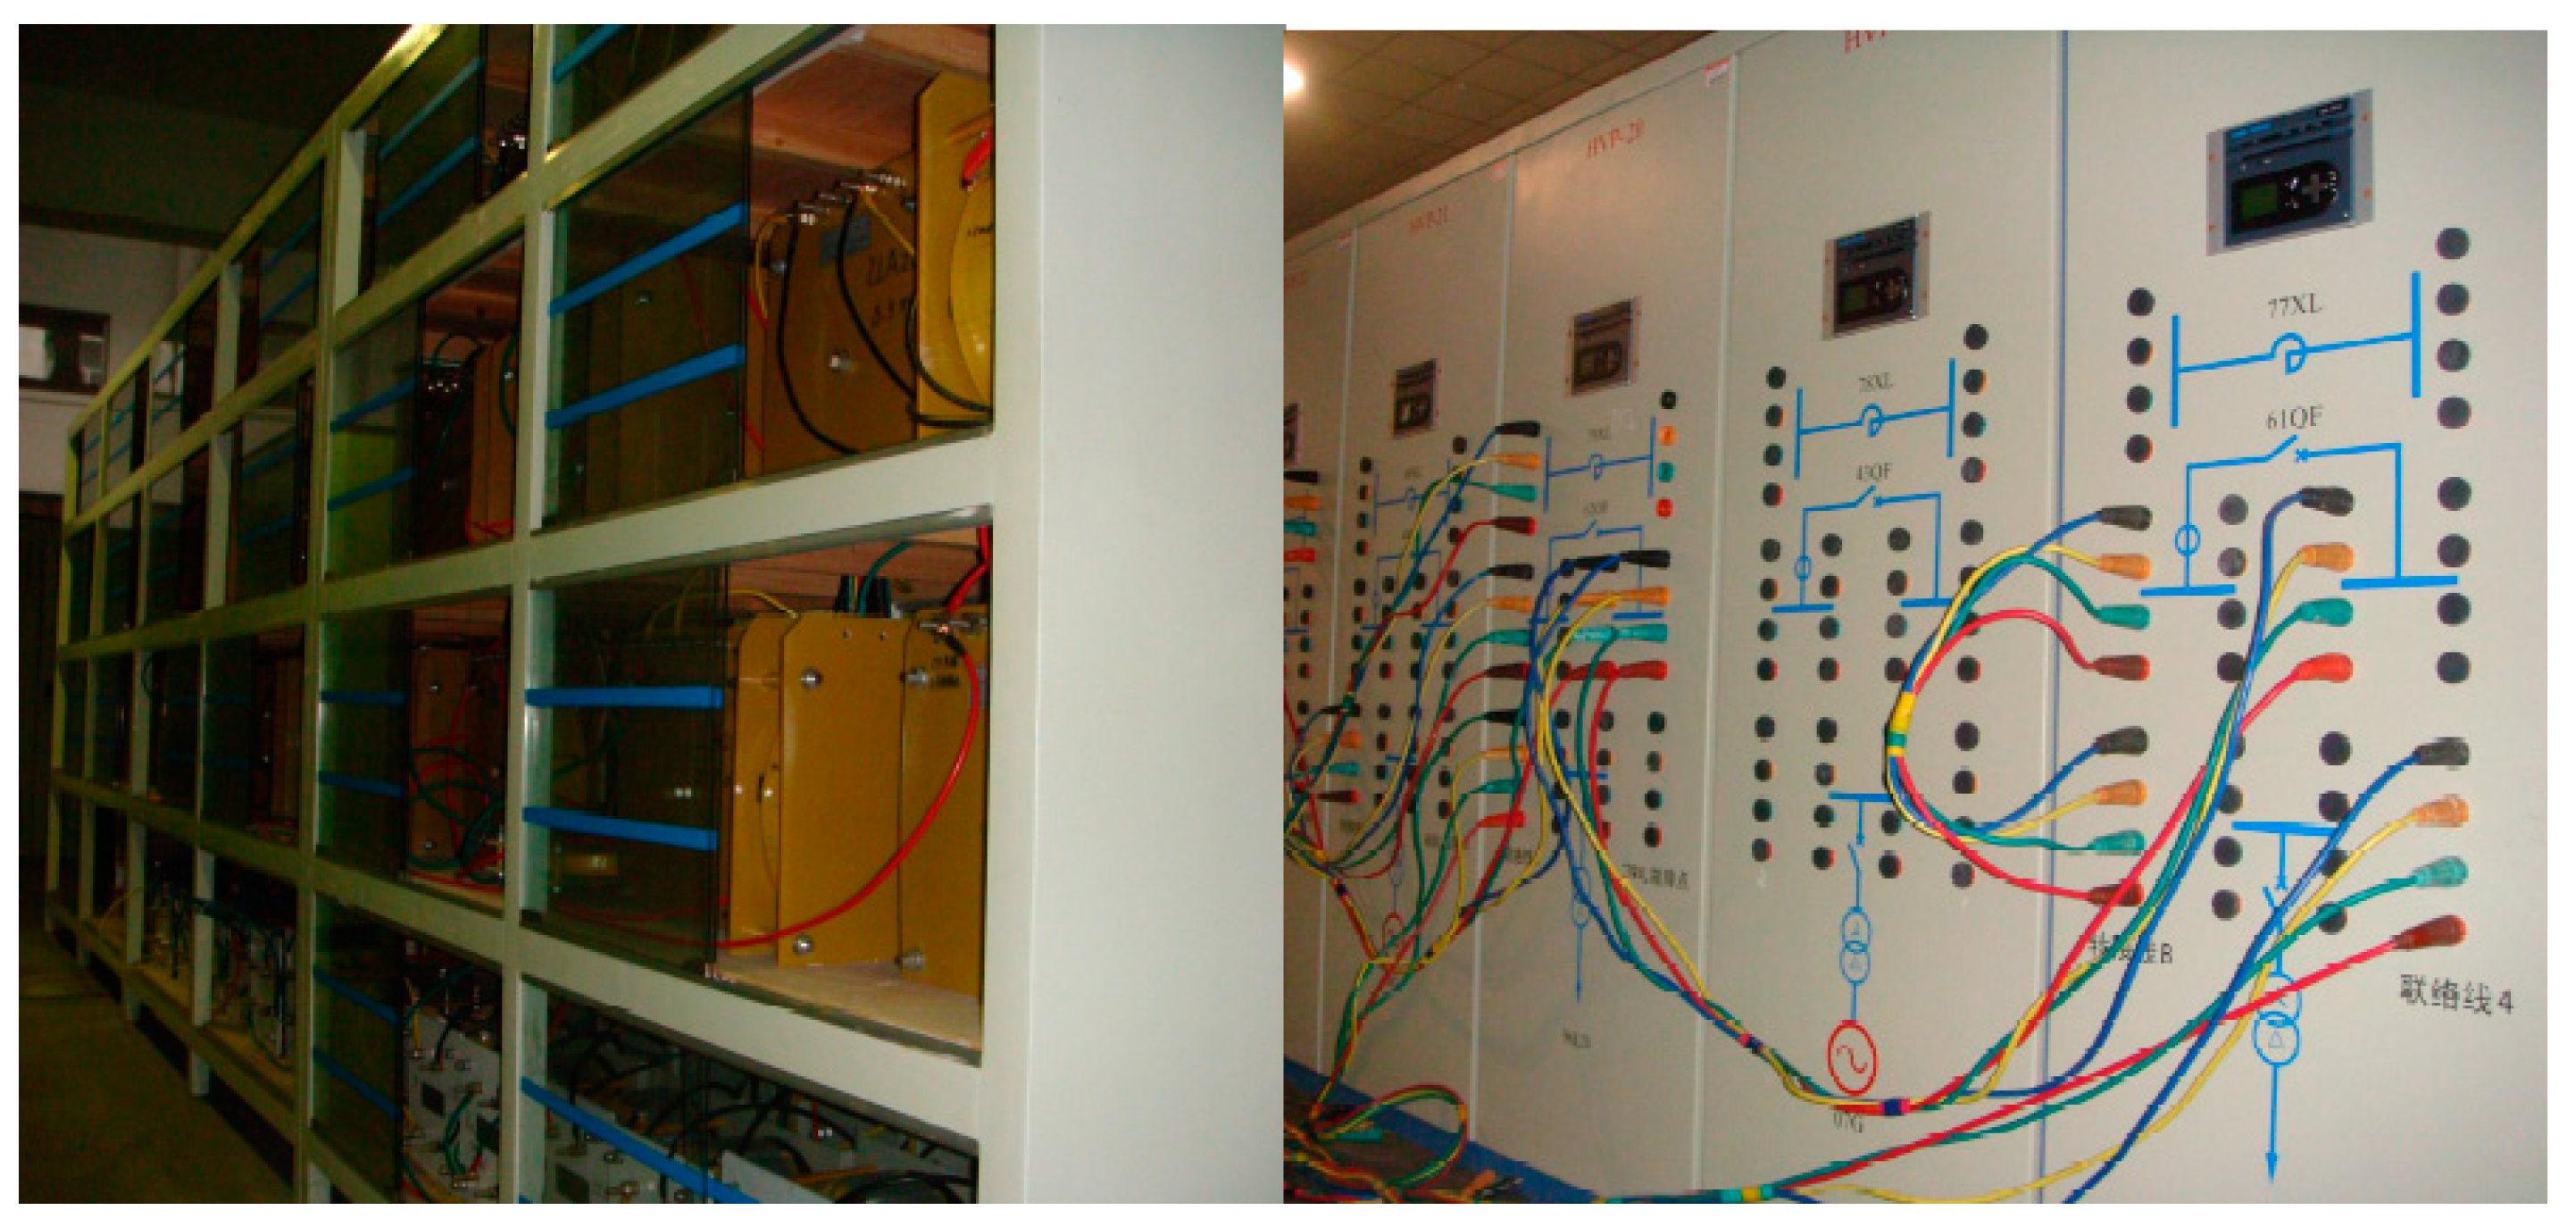
The size of the proposed platform was about 30 cm × 30 cm × 3 cm. The major devices included six PCBs of the distribution line module, three PCBs of the short-circuit fault generator module, nine PCBs of the voltage and current monitoring circuit module, one PCB of the three-phase input port module, three PCBs of the three-phase breaker module, and three PCBs of the three-phase-load output port module. For the traditional π-shape three-phase transmission line model implemented in References [30,31], the size of the one line model module was about 80 cm × 40 cm × 70 cm, which is shown in Figure 3. If six traditional transmission line model modules were used to set up one distribution network with three feeders, the total size of the platform would be larger than 480 cm × 40 cm × 70 cm. In other words, the size of the proposed miniature PDSLP in this paper was about 0.2 percent of the size of the traditional platform.

3. Description and Discussion of the Modular Miniature Physical Modules

3.1. Three-Phase Distribution Line Module

The schematic diagram of the analogue three-phase distribution line module is shown in Figure 4. The module was constructed by two eight-pin male header connectors, four resistors (R1, R 2, R 3, and R 4), four inductors (L1, L 2, L 3, and L 4), and eight capacitors (C1, C 2, C 3, C 4, C 5, C 6, C 7, and C 8).
If the length of the real distribution line is l, the parametric values of the corresponding electrical elements in the distribution line module can be calculated by [32],
R 1 = R 2 = R 3 = r + l ,
L 1 = L 2 = L 3 = L + l ,
C 1 = C 2 = C 3 = C 5 = C 6 = C 7 = C + l / 2 ,
R 4 = ( r 0 r + ) l / 3 ,
L 4 = ( L 0 L + ) l / 3 ,
C 4 = C 8 = 1.5 C + C 0 l / ( C + C 0 ) ,
where L+, r+, and C+ represent the positive-sequence self-inductance, resistance, and capacitance, respectively; and L0, r0, and C0 are the zero-sequence self-inductance, resistance, and capacitance, respectively.
Typical positive-sequence and zero-sequence parameters of overhead lines and underground cables in China are given in Table 3, and the negative-sequence parameters were approximately the same as the positive-sequence parameters. The parametric values of the electrical elements in the three-phase distribution line module could be calculated as those given in Table 4. To reduce the cost of this module, typical non-custom resistors were selected and they were connected in series to provide the calculated resistances. Similarly, typical non-custom capacitors were used and they were connected in parallel to the required capacitances.
Table 5 shows that several common commercially available resistors (the number of the cascaded components was less than 3) were connected in series to form the required resistor given in Table 4 with an acceptable error.
Similarly, Table 6 shows that several common commercially available capacitors (the number of the parallel components was less than 4) were connected in parallel to form the required capacitor with acceptable error given in Table 4. All the resistors and capacitors were integrally installed in the designed PCB by digital surface-mount technology (SMT).
Due to the high inherent resistance of regular inductors, the inductor elements of the three-phase distribution line module need to be customized, which was formed by a ferrite bead and twining varnished wires.
The constructed PCB module of the three-phase distribution line module is shown in Figure 5. The resistors and capacitors were placed on the reverse side and the customized inductors were placed on the obverse side.

3.2. Voltage and Current Monitoring Circuit Module

Due to the input limit of A/D converters and/or microprocessors, the output signals of the voltage and current transducers need to be processed so that the monitoring requirements for the signal amplification and bias circuits can be met.

3.2.1. Signal Conditioning Circuit for Voltage Transducer

The schematic diagram of the signal conditioning circuit for the voltage transducer is shown in Figure 6. In our miniature PDSLP, voltage transducer SPT204A has been selected to transmit the voltage, with 2-mA nominal input and the output currents. In Figure 6, Ui represents the input voltage, and R1 represents the current-limiting resistance. For any input voltage between 1 V to 100 V, the resistance R1 is set to 50 kΩ, so that the maximum input current can be limited to 2 mA. The values of other elements in the circuit shown in Figure 6 were set by following: R2 = 3 kΩ, C1 = 22 μF, R3 = 200 kΩ, C2 = 0.01 μF, R4 = R5 = R = 20 kΩ, R7 = 4.7 kΩ, Vref = −6.9 V, and R6 = 3.3 kΩ. The output voltage signal Uuo could be calculated by,
U uo = R 7 R ( R 2 R 1 U i + V ref ) = ( 0.0141 U i + 1.6215 ) V .

3.2.2. Signal Conditioning Circuit for Current Transducer

The signal conditioning circuit for the current transducer was similar to that for the voltage transducer, which is shown in Figure 7. In our miniature PDSLP, current transducer SCT254AK was selected. The rated output current was 2.5 mA. In Figure 7, Ii represents the input current. The parametric values of other components in the circuit shown in Figure 7 were set by following: R8 = 2.4 kΩ, R9 = 200 kΩ, R10 = R11 = 20 kΩ, R12 = 3.3 kΩ, R13 = 4.7 kΩ, C3 = 27 μF, and C4 = 0.01 μF. The output voltage signal Uio could be calculated by,
U io = R 13 R 10 ( R 8 2000 n I i + V ref ) = ( 0.282 n I i + 1.6215 ) V .

3.2.3. Experimental Test for Signal Monitoring Circuits

In order to test the performance of the designed signal conditioning circuit for the voltage transducer, the output signals of the circuit under different input signals were measured and compared with the theoretical values calculated by Equation (7). When the input voltage was zero, the calculated and the measured outputs were 1.6215 V and 1.628 V, respectively, and the error was 0.4%. When the input voltage was set as 50 × sin (314 t) V, the measured output signal is shown in Figure 8a, and the error was 0.7%.
Similar experimental tests were carried out to prove the effectiveness of the designed signal conditioning circuit for the current transducer. Experimental tests indicate that the error was 0.2% when the input signal was zero. The measured output signal is shown in Figure 8b when the input signal was set to 0.15 × sin (314 t) A, and the error was 1.1%.

3.3. Short-Circuit Fault Generator and Breaker Module

Since the voltage level and rated power of the proposed miniature PDSLP was low, the three-phase breaker module could be constructed by an isolated circuit, including a relay and corresponding drive circuit. The circuit of the breaker module installed at phase A of one feeder is shown in Figure 9.
The schematic diagram of the short-circuit fault generator module is shown in Figure 10. Either toggle switches or relay modules could be used to replace switches S1, S2, S3, and S4. All fault types can be simulated through different state combinations by the four switches.

4. Experiment for the Single-Phase Earth Fault Location

4.1. Requirements of the Experimental Platform for Fault Location

Since the equivalent zero-sequence impedance is extremely high when a single-phase earth fault occurs in NGDSs, the three-phase line-to-line voltage remains symmetrical. In this condition, the system is allowed to continue to operate within a time frame of 30 min to 2 h [33]. Hence, the reliability of the power supply can be significantly enhanced in the NGDSs. Moreover, the fault needs to be located and cleared to avoid further propagation, which can eventually lead to severe blackouts due to the persistent single-phase earth faults. As the single-phase earth fault current is small, identifying the faulted line from a large number of lines connected to the same distribution bus has become one of the biggest challenges in the above distribution systems [34,35,36].
Existing single-phase earth fault location methods are mainly developed according to the magnitude and the phase difference of the zero-sequence currents between the faulted line and sound lines. Traditional faulted line detection methods include zero-sequence-overcurrent protection, zero-sequence-current direction-based protection, etc. [37,38], and these methods have been widely used in the industry. However, the faulted line may be identified incorrectly due to the weak fault current and noise jamming. To overcome these problems, the similarity of the transient zero-sequence current waveforms between the faulted line and sound lines has been analyzed and used for the selection of the faulted line currently [39,40,41]. Regardless of which method the fault location is used, the zero-sequence currents of all lines connected to the same bus should be measured first under different single-phase earth fault conditions, such as the fault position.
Once a single-phase earth fault occurs in an NGDS, the zero-sequence currents of all feeders connected to the same substation bus are used to identify the faulted feeder. Therefore a specialized zero-sequence current signal monitoring circuit module should be implemented besides the general modules discussed in the next section.

4.2. Experimental Platform for Fault Location

4.2.1. Zero-Sequence Current Signal Monitoring Circuit

A summing amplifier is used to generate the zero-sequence current. The summing amplifier must work in the inverting mode so that low input impedance can be provided. The schematic diagram of the relevant circuit for this amplifier is shown in Figure 11, where UIA, UIB, and UIC represent the output signal of the phases A, B, and C, respectively. The parametric values of the electrical components in the circuit shown in Figure 11 were set by following: R18 = R19 = R20 = 10 kΩ, R14 = R15 = R16 = 30 kΩ, and R17 = 5.1 kΩ, R21 = 5.1 kΩ. It can be readily seen that the output voltage UI0 was (UIA + UIB + UIC)/3.
To evaluate the accuracy of the zero-sequence current signal monitoring circuit, three input signals representing phases A, B, and C were used to generate the zero-sequence signal. As shown in Figure 11, when UIA, UIB, and UIC were set to 1 V, 3 V, and 5 V, respectively, the measured output signal was 2.99 V, with an error of 0.3%. When UIA, UIB, and UIC were set as 9 × sin (314 t) V, −3 × sin (314 t) V, and 3 V, respectively. The measured output signal is shown Figure 12 and the error was 1.3%.
It can be seen that the designed signal monitoring circuits were capable of meeting the educational demand of monitoring the characteristics of zero-sequence currents of all feeders under a single-phase earth fault in one NGDS.

4.2.2. An Implemented Distribution Network Platform for the Fault Location Experiment

For demonstration purposes, the experimental platform in this paper was developed based on a typical distribution network configuration with three feeders. The first feeder consisted of 20 km of overhead lines and 3 km of underground cables, the second feeder was a 10-km underground cable line, and the third consisted of 30 km of underground cables. As the reusability of the module is important for the platform, the first feeder was realized by two 10-km overhead line modules and two 1.5-km cable modules. Similarly, the second and the third feeders were realized by two 5-km and 15-km cable modules, respectively. The parameters of the distribution lines were the same as those shown in Table 1.
The experimental platform set-up is shown in Figure 13. In the experiments, the root mean square (RMS) value of phase voltage was set to 5 V. The DC power source was used to power the signal conditioning circuit and the zero-sequence current signal monitoring circuit. Two dual-channel digital oscilloscopes were used to measure and record the experimental results.

4.3. Experimental Results for Single-Phase Earth Fault Location

In the experiments, phase voltage of the three-phase power source was set to 5 V. The zero-sequence currents of three feeders under a single-phase earth fault with different fault locations were measured and recorded, which have been shown in Figure 14, Figure 15, Figure 16, Figure 17, Figure 18 and Figure 19.
Figure 14 and Figure 15 respectively show the characteristics of the zero-sequence currents of all feeders when single-phase earth faults occur on the first feeder with different fault locations. In Figure 14, when the single-phase earth fault occurred, the zero-sequence current of the faulted feeder (the first feeder) suddenly changed and dropped from zero to the negative peak value, and then it got into the steady-state fault condition, which is shown in Figure 14a. The zero-sequence current of the sound feeder (the second feeder or the third feeder) changed at the same time but rose from zero to the positive peak value, which is shown in Figure 14b,c. The phase of the zero-sequence current of the faulted feeder (the first feeder) was opposite to that of sound feeders (the second feeder and third feeder). The RMS values of the zero-sequence currents of all feeders were closely studied and it indicated that the RMS value of the zero-sequence current of the faulted feeder equaled the sum of those of the sound feeders. The faulted line can be identified based on the characteristics of the phase and the magnitude of the recorded zero-sequence currents. Compared with the zero-sequence currents shown in Figure 14 and those shown in Figure 15, it could be derived that the magnitude of zero-sequence current almost kept the same since the single-phase earth fault occurred on the same feeder, namely the first feeder. The reason was that the zero-sequence current was mainly determined by the shunt grounded capacitance of the distribution line.
When single-phase earth faults occurred on the second feeder with different fault locations, the zero-sequence currents of all feeders were recorded and shown in Figure 16 and Figure 17. In Figure 16, the phase of the zero-sequence current of the second feeder was opposite to that of the first feeder and the third feeder, and the magnitude of the zero-sequence current of the second feeder equaled the sum of those of the sound feeders. The same conclusion could be derived from Figure 17. It is worth noting that the polarity of the zero-sequence current of each feeder at the fault time in Figure 16 was opposite to that of the corresponding feeder in Figure 17 because of the different fault inception angle.
When the single-phase earth fault occurred on the third feeder, similar conclusions could be reached by comparing the recorded zero-sequence currents shown in Figure 18 with those given in Figure 19.
Further analysis revealed that the transient behavior of zero-sequence currents could be also briefly observed in Figure 14, Figure 15, Figure 16, Figure 17, Figure 18 and Figure 19. The polarity of the zero-sequence current of the faulted line was always opposite to that of the sound line, this characteristic could be used to identify the fault line. However, the duration of the most transient responses was less than 3 ms, which would lead to unsuccessful faulted feeder identification. High sampling rates are needed to be applied in the fault indicators if transient zero-sequence currents are used to locate the fault position.

4.4. Validation of the Lab Facility Outputs in Comparison to Real Phenomena

To validate the lab facility outputs, the experimental results should be compared with the fault records data under single-phase earth fault conditions in NGDSs provided by the field operators. One typical recorded zero-sequence current waveform of the fault records data is shown in Figure 20. In Figure 20, the single-phase earth fault occurred at 16.9 ms, and then the zero-sequence current reached its instantaneous maximum value after the transient process with a 1.3 ms time frame. The instantaneous maximum value of zero-sequence current of Feeder 124 (faulted line) reached 13.88 A (the ratio of the current transformer was 50:5), while those of other feeders was negative and the absolute values were much smaller than that of Feeder 124. Namely, in the fault transient process, the polarity of the zero-sequence current of the faulted line was always opposite to that of the sound line, and its magnitude was the biggest. At the end of the short-period fault transient process, the steady-state process followed on. In the steady-state process, it could be derived that the phase of the zero-sequence current of Feeder 124 (faulted line) was opposite to that of other feeders, and the RMS value of the current of Feeder 124 was the biggest.
The transient and steady-state waveforms of the measured zero-sequence currents shown in Figure 14, Figure 15, Figure 16, Figure 17, Figure 18 and Figure 19 were compared with the fault records data in the field shown in Figure 20. We could conclude that the measured zero-sequence currents from our proposed PDSLP when a single-phase earth fault occurred could reveal the true features of the fault-generated signals, including steady-state and transient characteristics of zero-sequence currents. Undergraduate and graduate students could readily observe relevant physical phenomena and design corresponding fault location algorithms based on this platform.

5. Students’ Evaluation

The proposed platform was used for the undergraduate course “Power System Protective Relaying” at Wuhan University of Technology, China, during the second semester of 2017 and the first semester of 2018. In this course, the platform was used to explain the principle of overcurrent protection in the distribution network. The experiment designed based on this platform was fault location for the single-phase earth fault in the neutral indirectly earth systems. Three exercises were assigned to the students:
(1)
Faulted line identification based on the magnitude difference of the steady-state zero-sequence currents.
(2)
Faulted line identification based on the phase difference of the steady-state zero-sequence currents.
(3)
Faulted line identification based on the polarity difference of the transient zero-sequence currents.
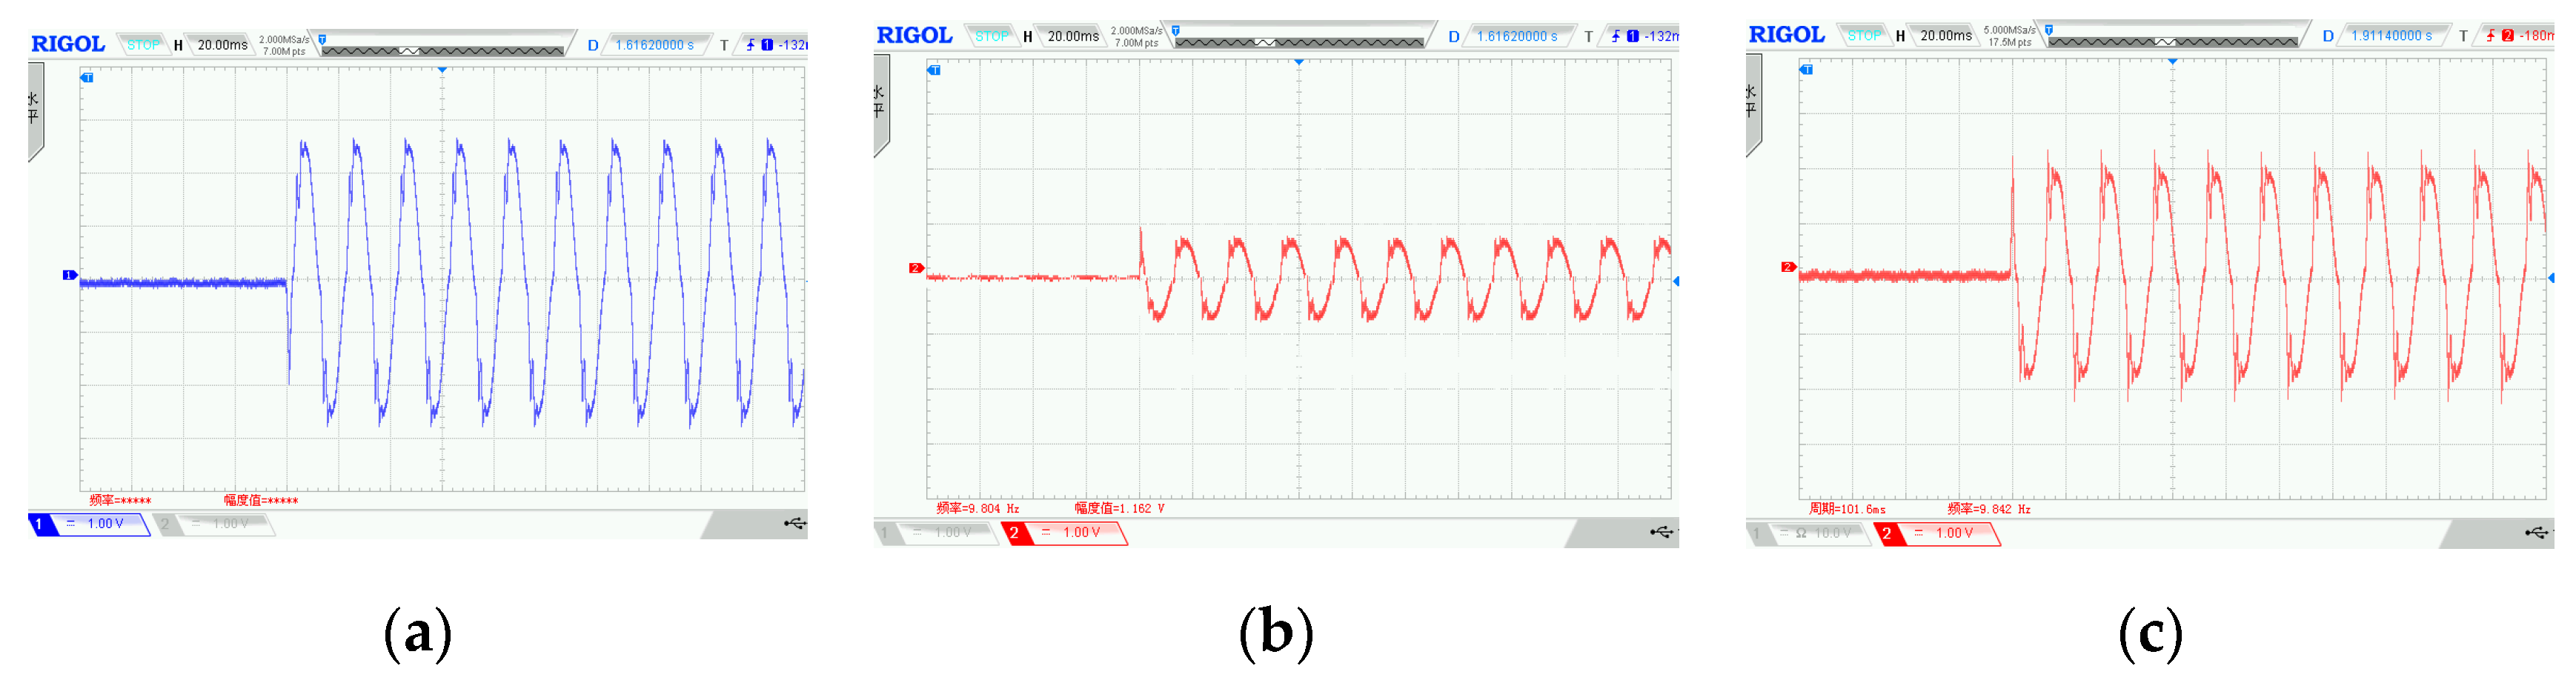
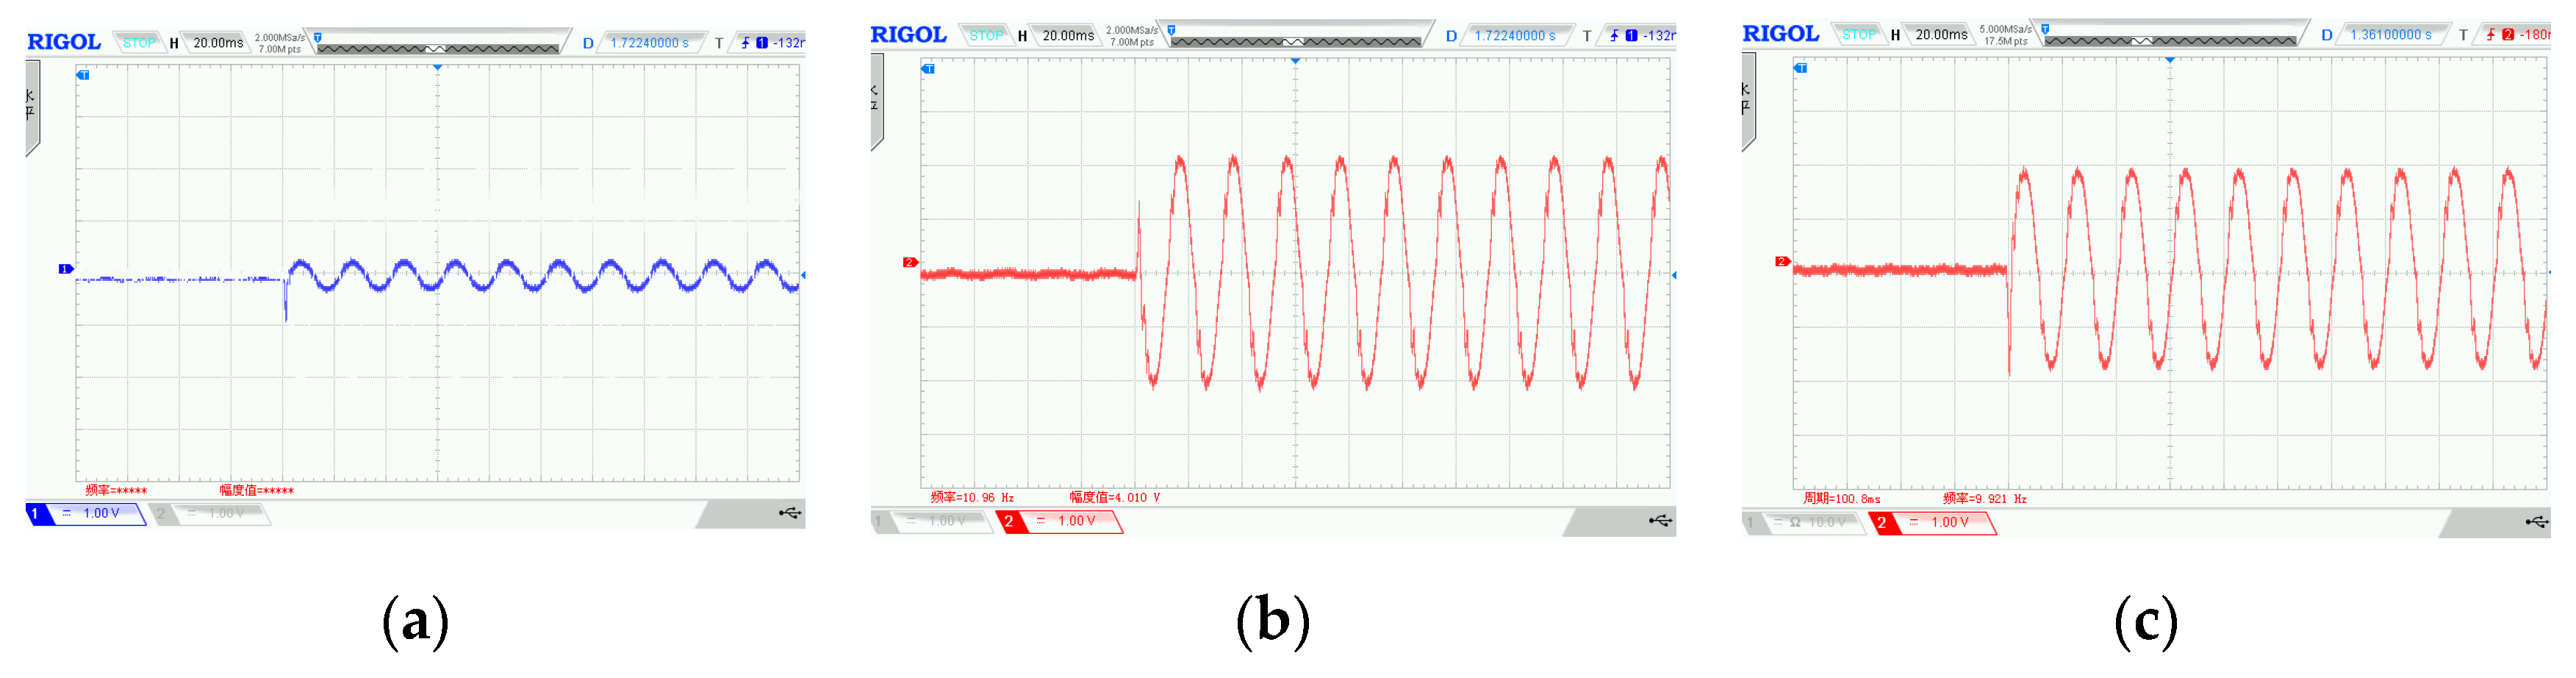
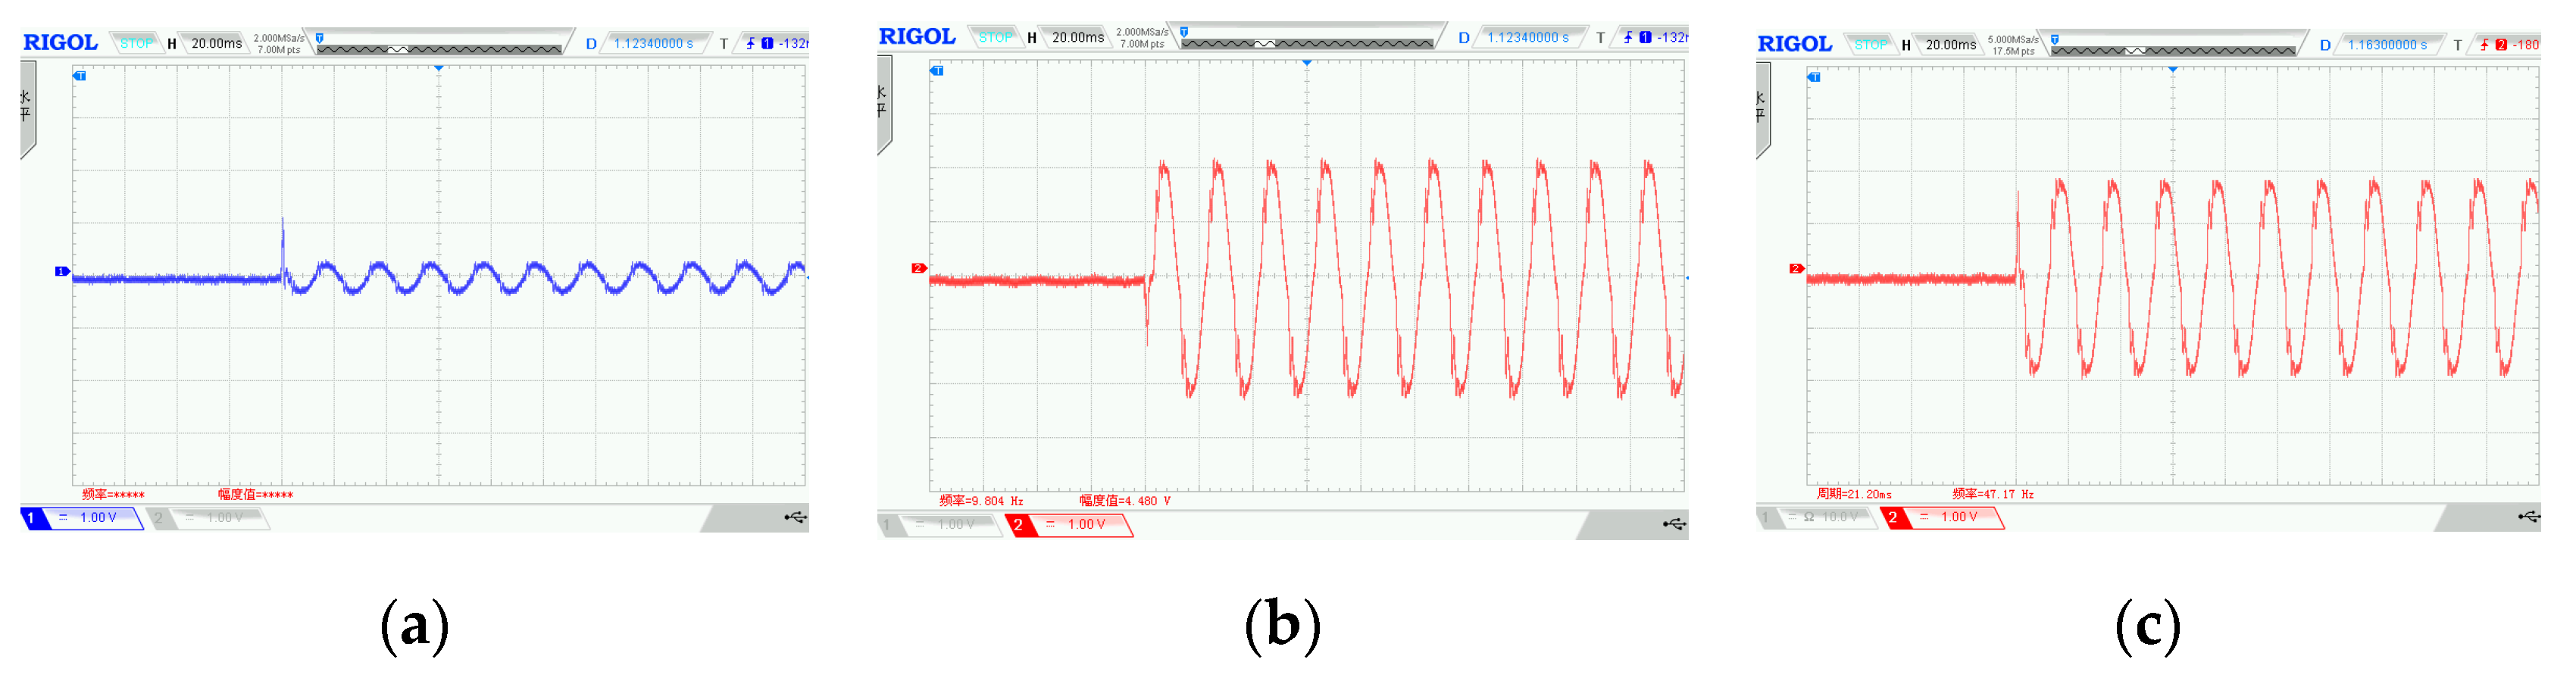
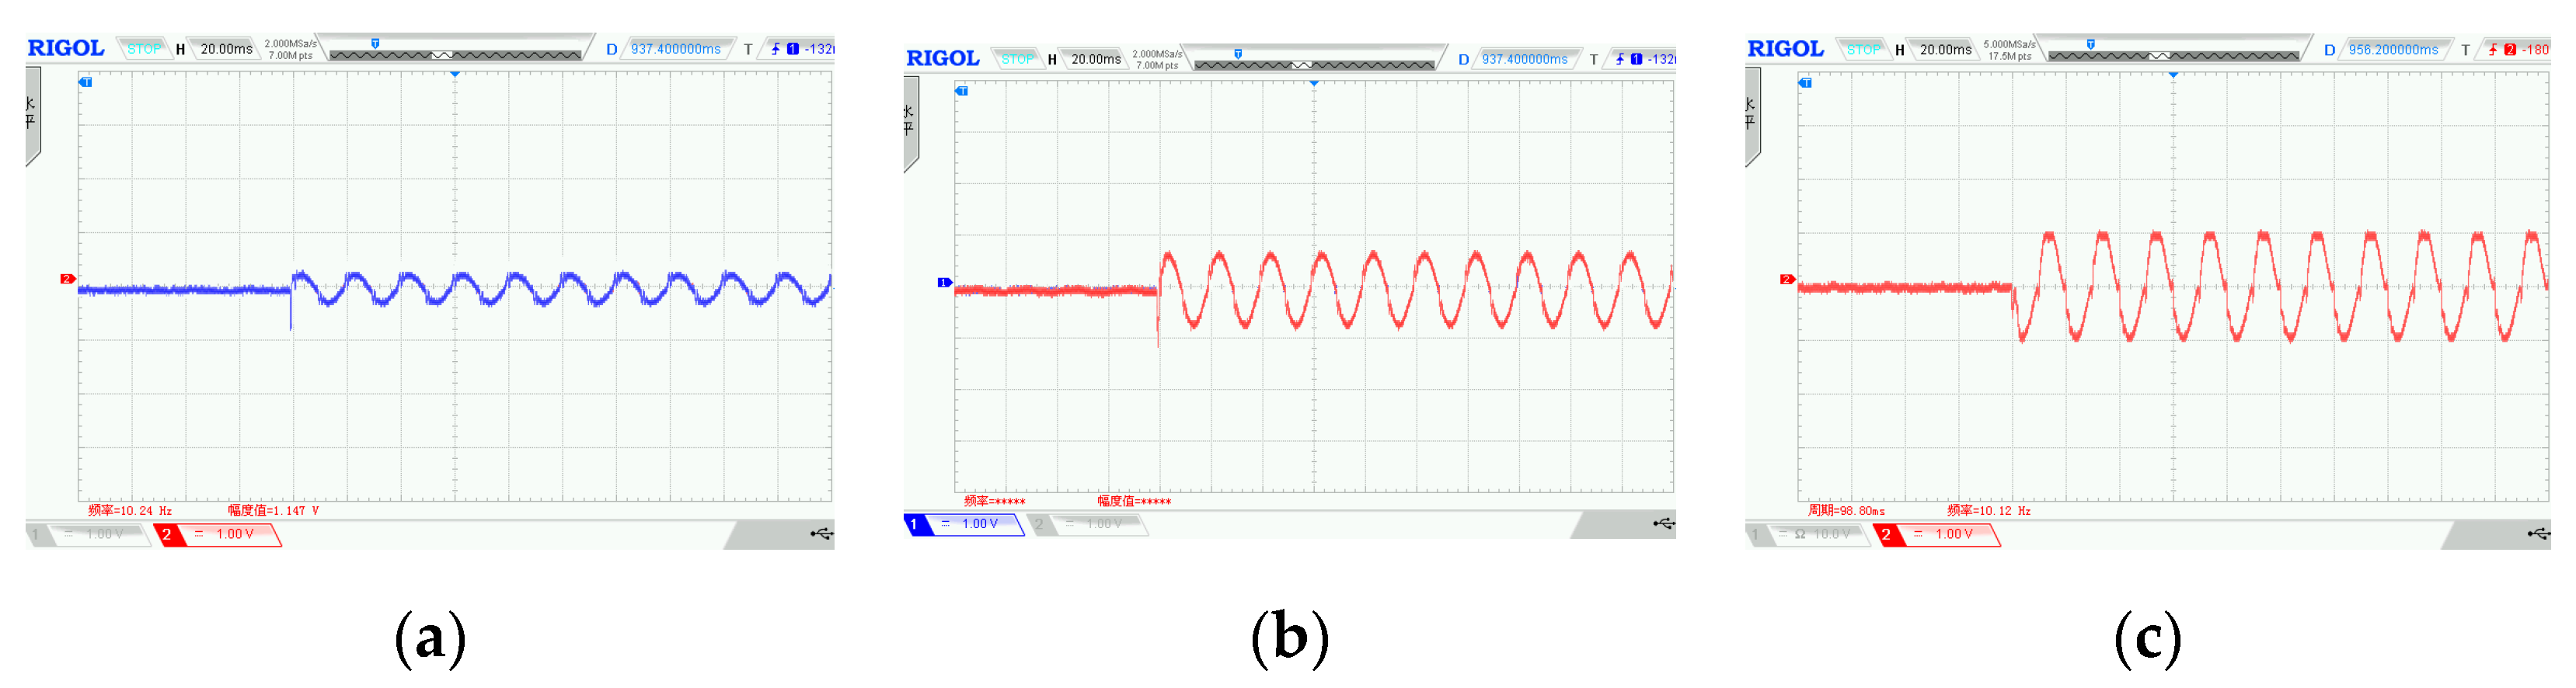
The objectives of this experiment were to make the student become familiar with zero-sequence current characteristics measured at the beginning of the distribution feeders once a single-phase earth fault occurs. In particular, students were exposed to the inapplicability of traditional overcurrent protection for single-phase earth faults in NGDSs and the influence of weak fault current and noise jamming on zero-sequence-current feature-based protection. The three exercises were also performed by computer-based simulation tools (e.g., Matlab/Simulink) during the course. At the end of the course, anonymous questionnaires were prepared and then filled by the students in order to get feedback regarding the exercises on our proposed platform. The responses on the questionnaires were analyzed and the final evaluation score is shown in Table 7 (5 = Excellent, 1 = Very Poor).
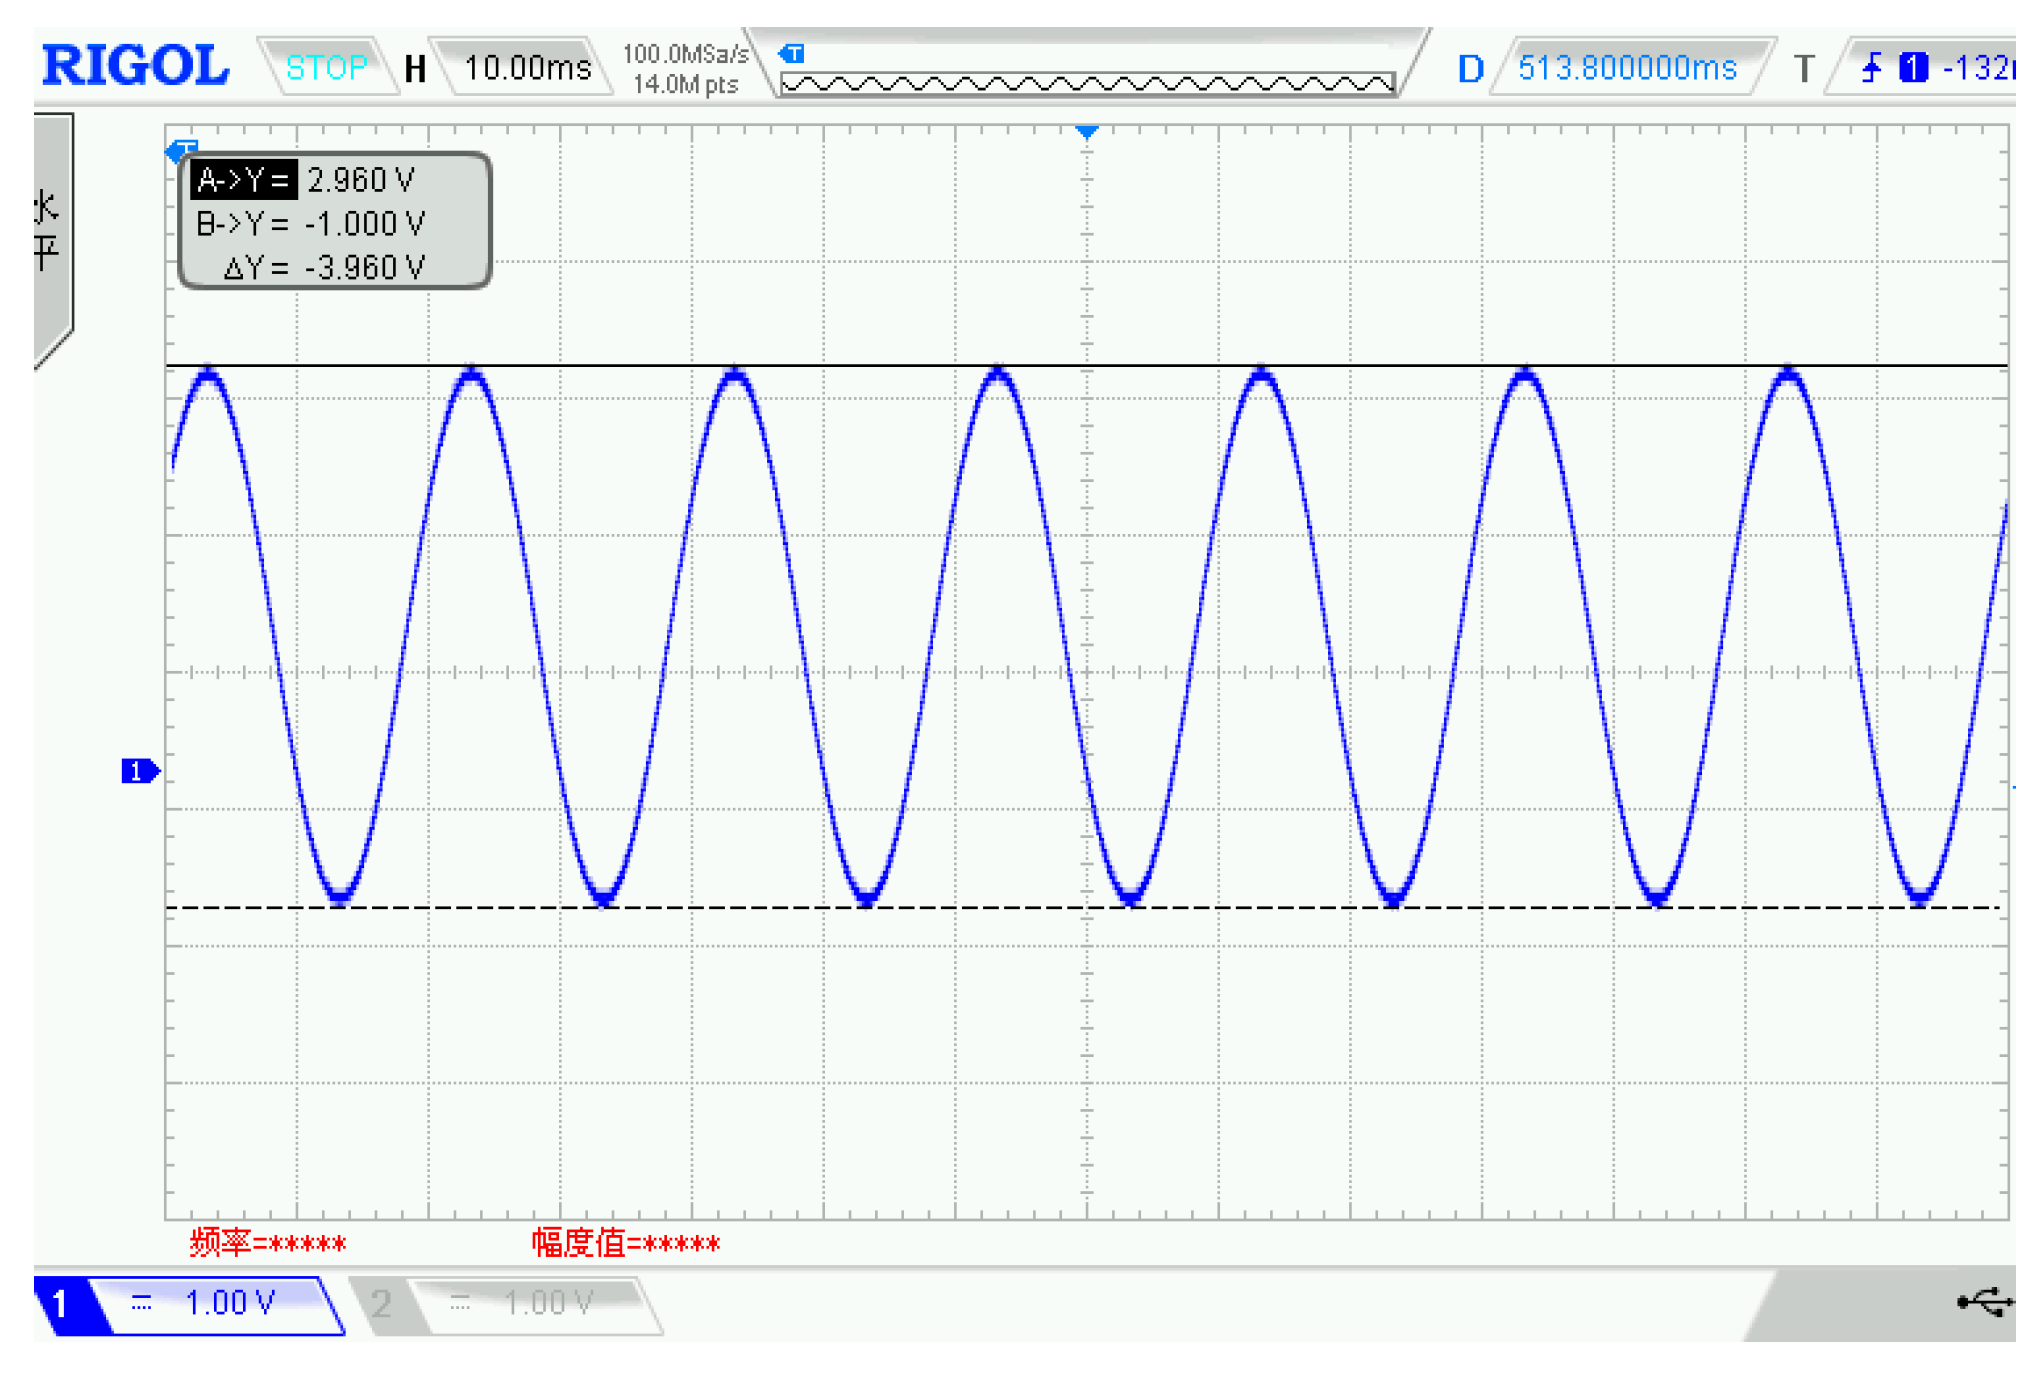
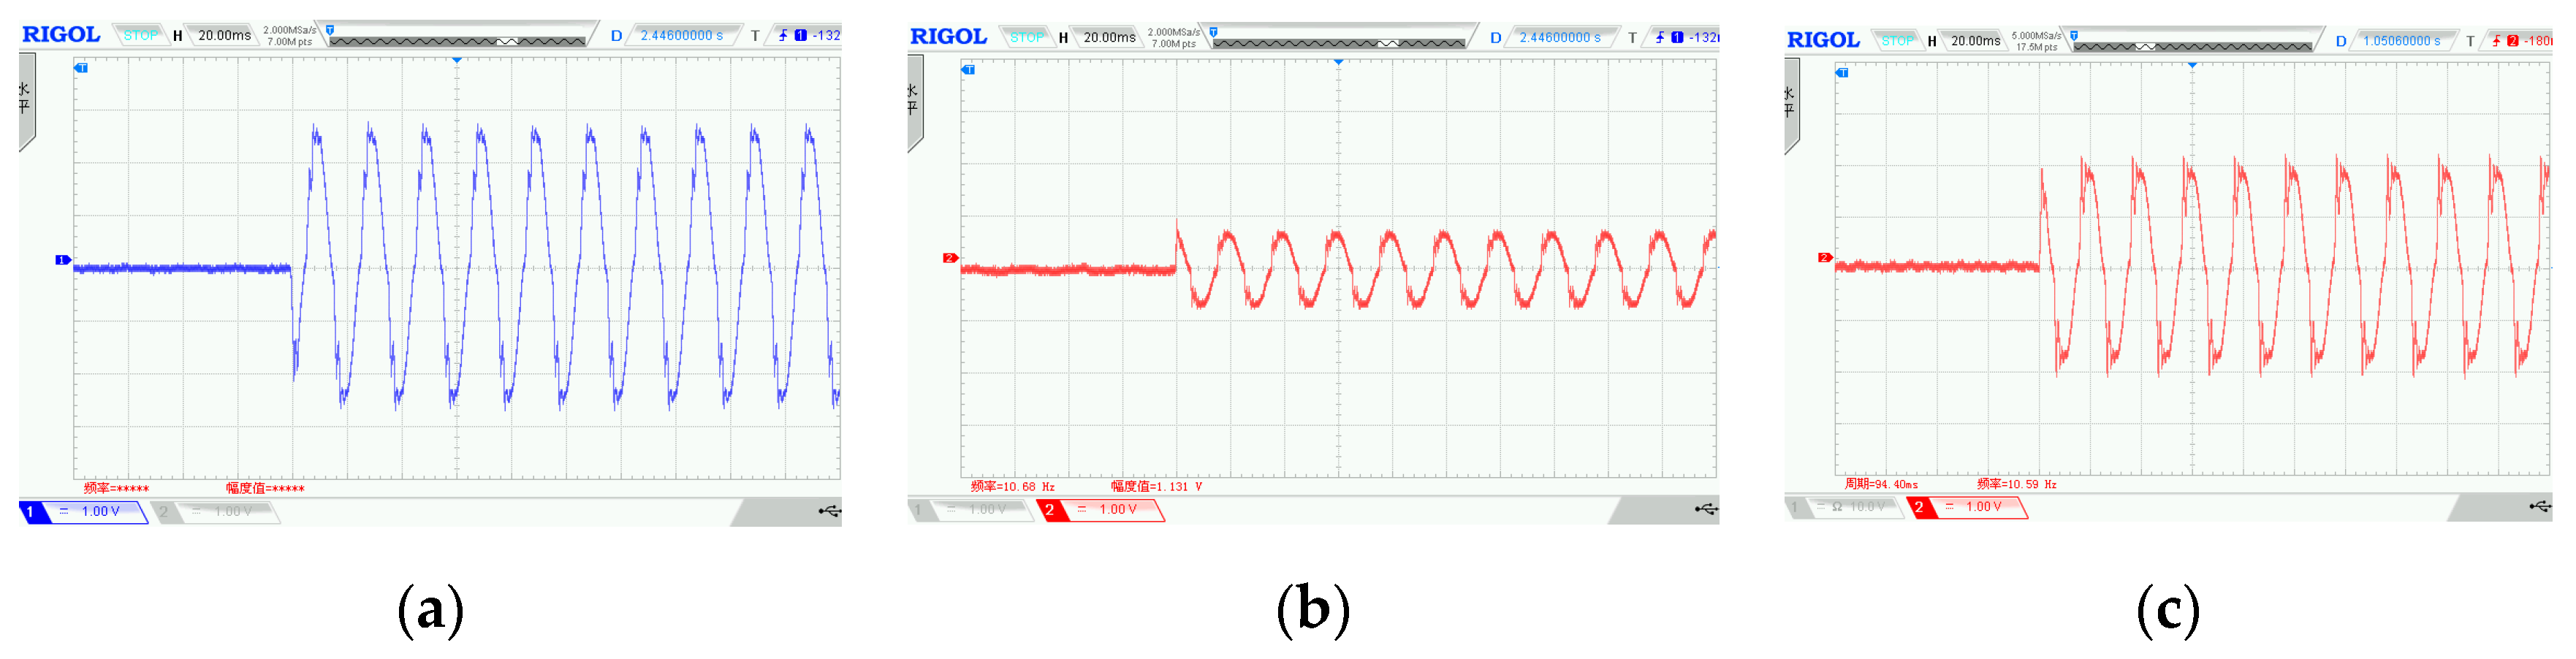
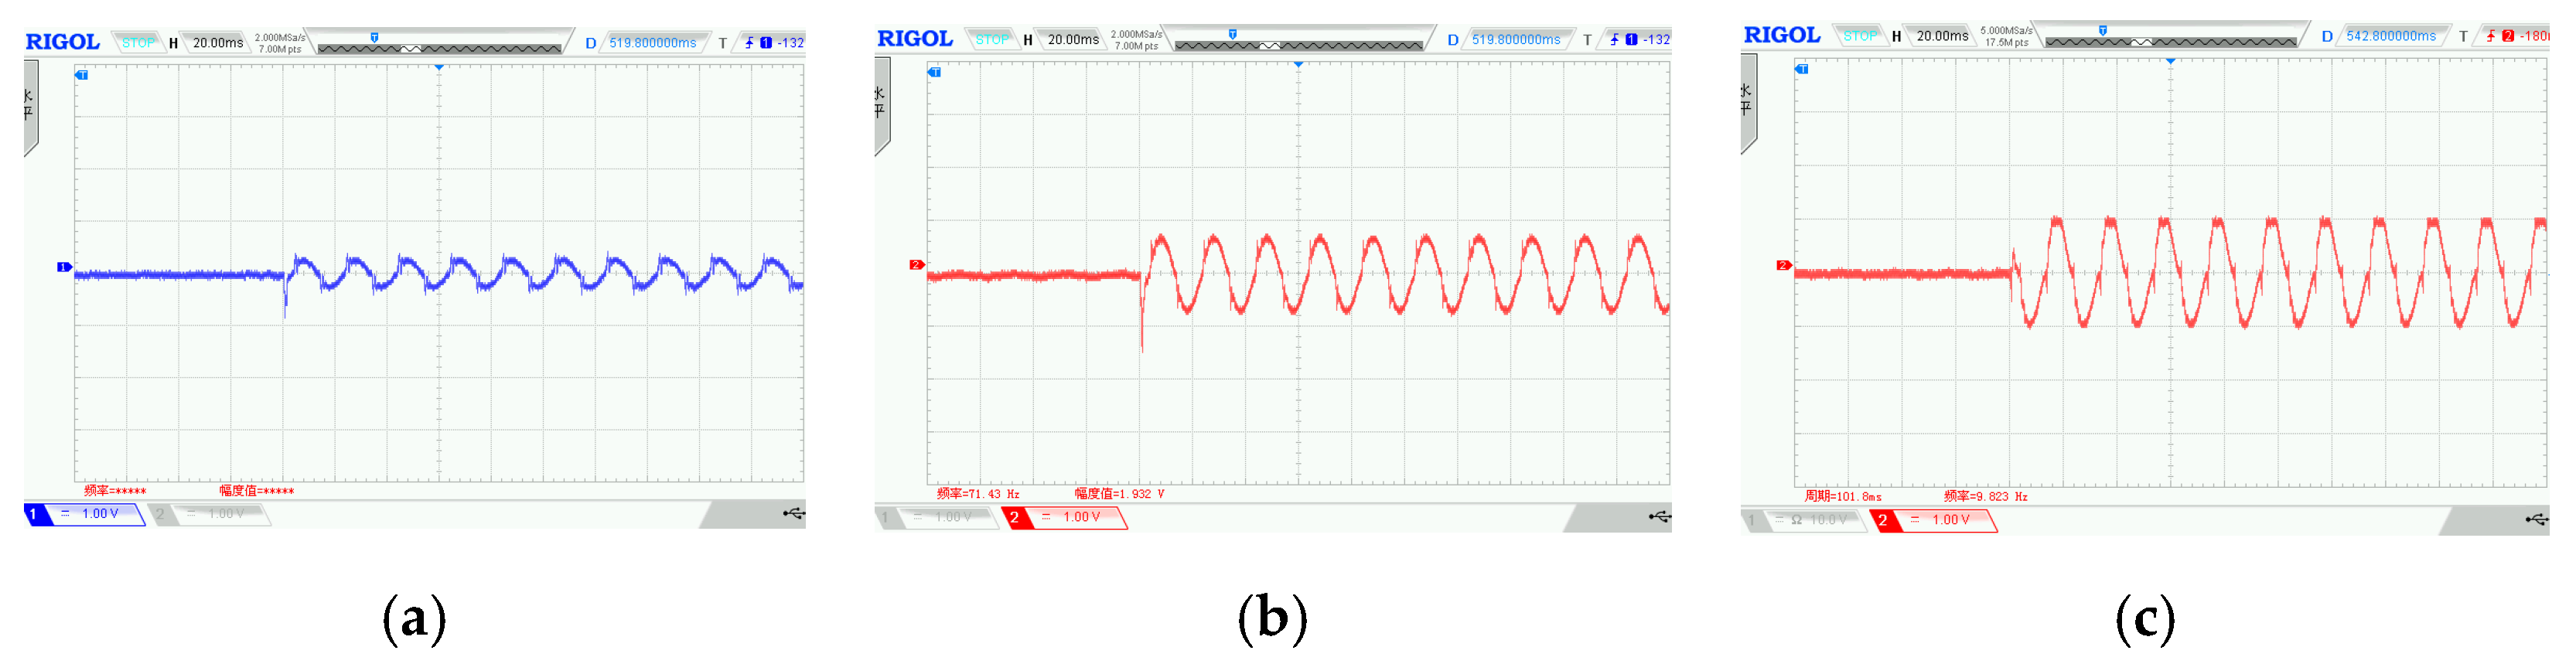
A comparison of students’ survey responses between semesters shows that the proposed platform was positively reviewed by students. Response data collected from students indicated that students felt that the proposed platform could provide hardware-based experiments and immersive physical phenomenon visualization of fault location in NGDSs. Students also indicated that the power waveforms could be easily observed and recorded when a “real-world” single-phase earth fault occurred using the short-circuit fault generator module.

6. Conclusions

In this paper, an integrated power distribution system laboratory platform (PDSLP) was proposed for education purposes using modular miniature physical elements. The platform was implemented in a laboratory environment to provide students with the visualized experience on the distribution network phenomenon. Modular miniature physical elements, such as a three-phase distribution line module, were constructed by printed circuit boards (PCBs) and microelectronic technology. Furthermore, the constructed physical elements were used to set up the integrated scaled-down analogous electrical power systems based on modular assembly technology.
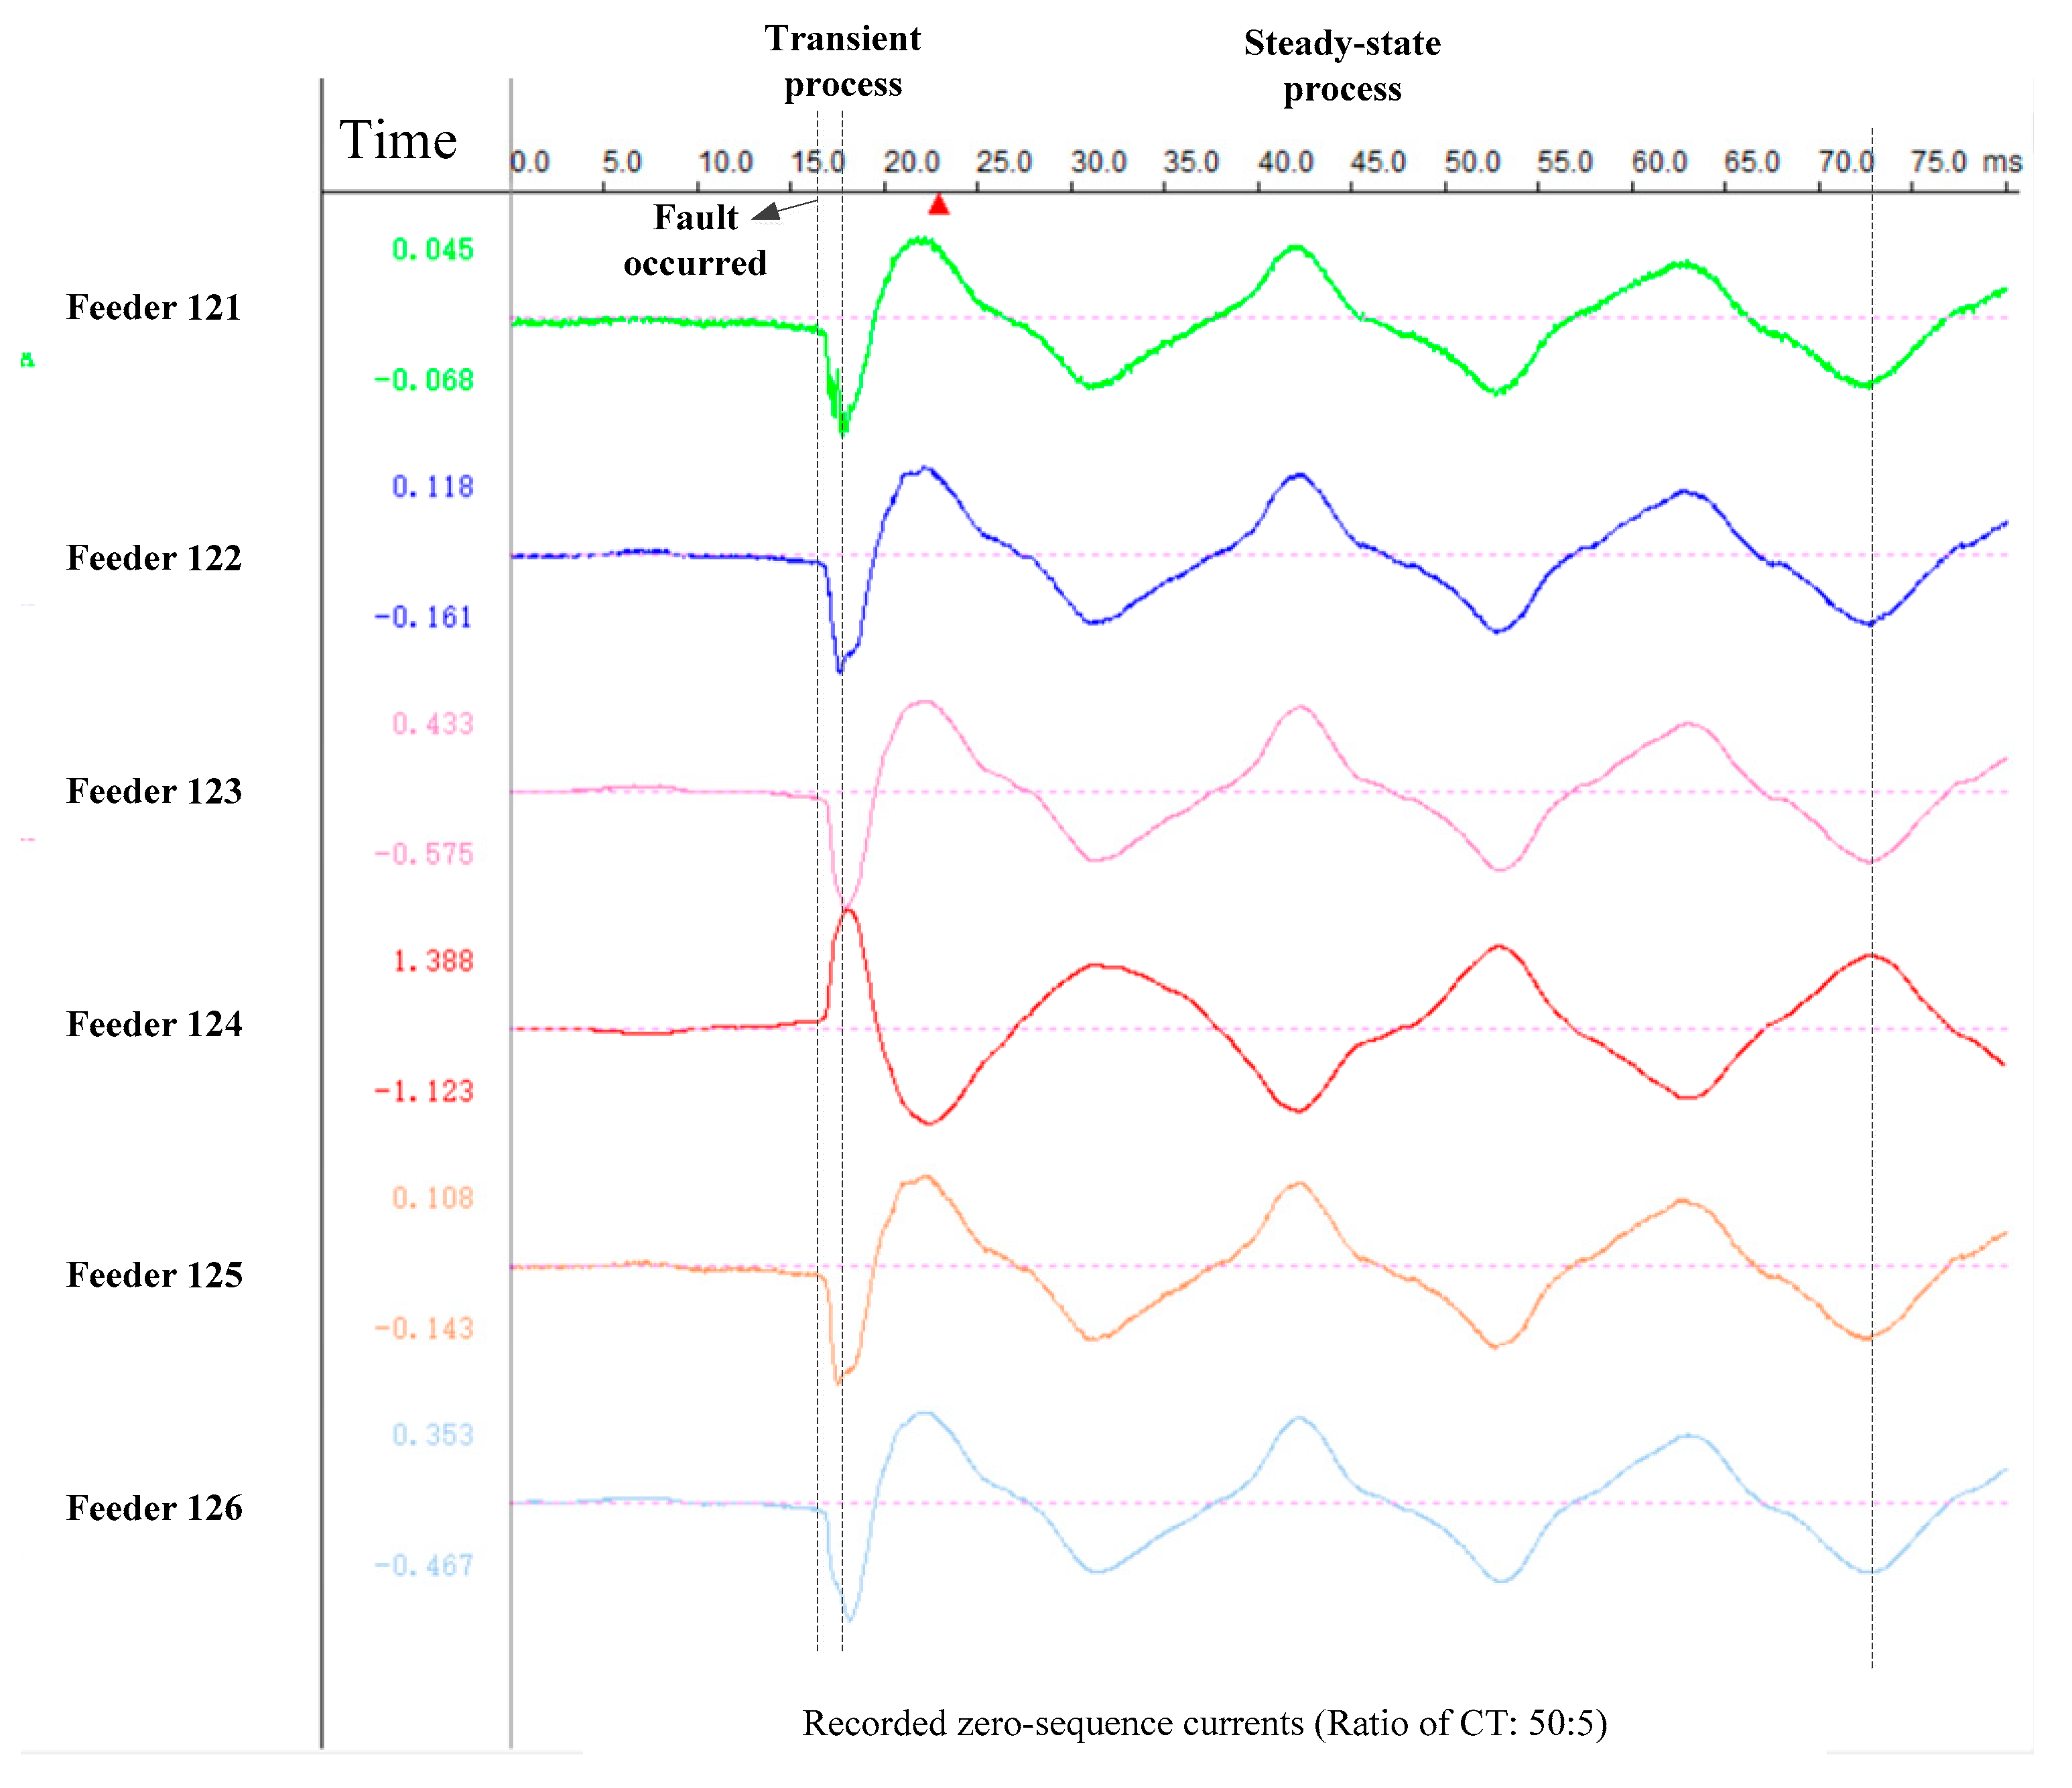
More specifically, a laboratory educational platform for fault location in neutral non-effectively grounded distribution systems (NGDSs) was selected as a typical experimental scenario in this paper. A scaled-down distribution network with three feeders was implemented and its nominal voltage was below 35 VL−L. The total cost of this platform was about US $1000, and the size of the proposed platform was about 30 cm × 30 cm × 3 cm. The zero-sequence currents of three feeders under a single-phase earth fault at different fault locations were measured and analyzed. It shows that the phase of the zero-sequence current of the faulted feeder was opposite to that of sound feeders, and the RMS value of the zero-sequence current of the faulted feeder equaled the sum of those of the sound feeders. Although the polarity of the zero-sequence current of the faulted line was always opposite to that of the sound line, the duration of most transient responses was less than 3 ms. Therefore, a high sampling rate was needed for the transient-information-based fault location algorithm.
In future, modular renewable energy sources and other elements will be designed, implemented, and integrated into the proposed platform. Then the proposed PDSLP can be extended to provide a multi-purpose and cost-effective platform and means for the laboratory education of the active distribution networks.

7. Patents

There were patents resulting from the work reported in this manuscript: Invention Patents in China (#ZL 2017 1 0278706.8); Utility Model Patents in China (#ZL 2018 2 0752870.8 and #ZL 2018 2 0657681.2).

Author Contributions

Conceptualization, J.T. and G.S.; Methodology, J.T. and C.T.; Hardware, G.S. and X.B.; Validation, J.T., G.S. and C.Y.; Investigation, J.T.; Writing—Original Draft Preparation, J.T.; Writing—Review and Editing, B.X. and Y.L.; Supervision, J.T.; Project Administration, J.T.; Funding Acquisition, J.T.

Funding

This research was funded by National Natural Science Foundation of China, grant number 51707139.

Conflicts of Interest

The authors declare no conflict of interest.

References

  1. Karady, G.G. Roll of laboratory education in electrical power engineering education. In Proceedings of the IEEE Power and Energy Society General Meeting, Pittsburgh, PA, USA, 20–24 July 2008. [Google Scholar]
  2. Strasser, T.; Stifter, M.; Andren, F.; Palensky, P. Co-simulation training platform for smart grids. IEEE Trans. Power Syst. 2014, 29, 1989–1997. [Google Scholar] [CrossRef]
  3. Georgilakis, P.S.; Orfanos, G.A.; Hatziargyriou, N.D. Computer-assisted interactive learning for teaching transmission pricing methodologies. IEEE Trans. Power Syst. 2014, 29, 1972–1980. [Google Scholar] [CrossRef]
  4. Donadel, C.B.; Fardin, J.F.; Encarnacao, L.F. Educational tool for radial electrical distribution networks analysis and optimization studies involving distributed generation units. Int. J. Elec. Eng. Educ. 2018, 55, 3–13. [Google Scholar] [CrossRef] [Green Version]
  5. Fehr, R.E. A model curriculum for power engineering. In Proceedings of the IEEE Power and Energy Society General Meeting, Pittsburgh, PA, USA, 20–24 July 2008. [Google Scholar]
  6. Mao, C.X.; Leng, F.; Li, J.L.; Zhang, S.T.; Zhang, L.D.; Mo, R.; Wang, D.; Zeng, J.; Chen, X.; An, R.R.; et al. A 400-V/50-kVA digital-physical hybrid real-time simulation platform for power systems. IEEE Trans. Ind. Electron. 2018, 65, 3666–3676. [Google Scholar] [CrossRef]
  7. Kotsampopoulos, P.C.; Kleftakis, V.A.; Hatziargyriou, N.D. Laboratory education of modern power systems using PHIL simulation. IEEE Trans. Power Syst. 2017, 32, 3992–4001. [Google Scholar] [CrossRef]
  8. Pires, V.F.; Martins, L.S.; Amaral, T.G.; Marçal, R.; Rodrigues, R.; Crisóstomo, M.M. Distance-learning power-system protection based on testing protective relays. IEEE Trans. Ind. Electron. 2008, 55, 2433–2438. [Google Scholar] [CrossRef]
  9. Martins, L.S.; Fortunato, C.; Pires, V.F. A computer-based testing system to evaluate protective relays as a tool in power system protection education. Comput. Appl. Eng. Educ. 2012, 20, 19–28. [Google Scholar] [CrossRef]
  10. Meliopoulos, A.P.S.; Cokkinides, G.J.; Mohagheghi, S.; Dam, Q.B.; Alaileh, R.H.; Stefopoulos, G.K. A laboratory setup of a power system scaled model for testing and validation of EMS applications. In Proceedings of the IEEE Bucharest Power Tech Conference, Bucharest, Romania, 28 June–2 July 2009. [Google Scholar]
  11. Celeita, D.; Hernandez, M.; Ramos, G.; Penafiel, N.; Rangel, M.; Bernal, J.D. Implementation of an educational real-time platform for relaying automation on smart grids. Electr. Power Syst. Res. 2016, 130, 156–166. [Google Scholar] [CrossRef]
  12. Carullo, S.P.; Nwankpa, C.O. Interconnected power systems laboratory: A computer automated instructional facility for power system experiments. IEEE Trans. Power Syst. 2002, 17, 215–222. [Google Scholar] [CrossRef]
  13. Gedra, T.W.; An, S.; Arsalan, Q.H.; Ray, S.R. Unified power engineering laboratory for electromechanical energy conversion, power electronics, and power systems. IEEE Trans. Power Syst. 2004, 19, 112–119. [Google Scholar] [CrossRef]
  14. Patricio, M.A.; Jaime, M.C.; Jaime, C.N.; Rodrigo, E.P. Lab-scale TCR-based SVC system for educational and DG applications. IEEE Trans. Power Syst. 2011, 26, 3–11. [Google Scholar]
  15. Lee, W.J.; Gu, J.C.; Li, R.J.; Didsayabutra, P. A physical laboratory for protective relay education. IEEE Trans. Educ. 2002, 45, 182–186. [Google Scholar]
  16. Jose, M.M.; Manuel, B.V.; Francisco, P.G.; Juan, J.; Juan, M.M.; Lazaro, A.B.; Antonio, G.E. A multi-platform lab for teaching and research in active distribution networks. IEEE Trans. Power Syst. 2017, 32, 4861–4870. [Google Scholar]
  17. Rasheduzzaman, M.; Chowdhury, B.H.; Bhaskara, S. Converting an old machines lab into a functioning power network with a microgrid for education. IEEE Trans. Power Syst. 2014, 29, 1952–1962. [Google Scholar] [CrossRef]
  18. Coleman, N.S.; Ogawa, K.L.; Hill, J.; Miu, K.N. Reconfigurable distribution automation and control laboratory: Solar microgrid experiments. IEEE Trans. Power Syst. 2018, 33, 6379–6386. [Google Scholar] [CrossRef]
  19. Deese, A.S. Development of smart electric power system (SEPS) laboratory for advanced research and undergraduate education. IEEE Trans. Power Syst. 2015, 30, 1279–1287. [Google Scholar] [CrossRef]
  20. Yang, X.G.; Carullo, S.P.; Miu, K.; Nwankpa, C.O. Reconfigurable distribution automation and control laboratory: Multiphase, radial power flow experiment. IEEE Trans. Power Syst. 2005, 20, 1207–1214. [Google Scholar] [CrossRef]
  21. Hsu, Y.Y.; Hsiao, N.Y.; Tsai, M.H.; Wang, P.C.; Jou, H.S.; Wang, H.Y. A distribution automation laboratory for undergraduate and graduate education. IEEE Trans. Power Syst. 1998, 13, 1–7. [Google Scholar] [CrossRef]
  22. Gupta, R.P.; Srivastava, S.C. A distribution automation system simulator for training and research. Int. J. Elec. Eng. Educ. 2008, 45, 336–355. [Google Scholar] [CrossRef]
  23. Zeng, H.; Yang, P.H.; Cheng, H.B.; Xin, J.B.; Lin, W.X.; Hu, W.G.; Wan, M.Y.; Li, Y.H.; Wu, H. Research on single-phase to ground fault simulation base on a new type neutral point flexible grounding mode. IEEE Access 2019, 7, 82563–82570. [Google Scholar] [CrossRef]
  24. Du, Y.; Liu, Y.D.; Shao, Q.Z.; Luo, L.G.; Dai, J.D.; Sheng, G.H.; Jiang, X.C. Single line-to-ground faulted line detection of distribution systems with resonant grounding based on feature fusion framework. IEEE Trans. Power Deliver. 2019, 34, 1766–1775. [Google Scholar] [CrossRef]
  25. Gururajapathy, S.S.; Mokhlis, H.; Illias, H.A. Fault location and detection techniques in power distribution systems with distributed generation: A review. Renew. Sustain. Energy Rev. 2017, 74, 949–958. [Google Scholar] [CrossRef]
  26. Winter, K.M. The RCC ground fault neutralizer—A novel scheme for fast earth-fault protection. In Proceedings of the 18th International Conference on Electricity Distribution, Turin, Italy, 6–9 June 2005. [Google Scholar]
  27. Transmission Line, Transformer & Protective Relays. Available online: https://www.tercosweden.com/ products/electrical-power-systems/transmissions-line/ (accessed on 9 September 2019).
  28. De Lorenzo Group Power Transmission and Distribution. Available online: https://www.delorenzo global.com/electrical-power/distribution/ (accessed on 9 September 2019).
  29. Lucas Nülle-EDP Protection for Busbars Systems. Available online: http://www.lucas-nuelle.us/ 2768/apg/8506/EDP-Protection-for-Busbars-systems.htm (accessed on 9 September 2019).
  30. Oza, B.A.; Brahma, S.M. Development of power system protection laboratory through senior design projects. IEEE Trans. Power Syst. 2005, 20, 532–537. [Google Scholar] [CrossRef]
  31. Xia, Y.J.; Zhang, Z.; Liu, Y.; Yin, X.G.; Hu, G.; Zhang, K.J. Development of a novel dynamic physical model for double-circuit transmission lines on the same tower. Automat. Electron. Power Sys. 2010, 34, 61–64. [Google Scholar]
  32. Ghassan, B.; Pablo, G.; Reynaldo, S.; Juan, M.V. Electromagnetic transient studies of large distribution systems using frequency domain modeling methods and network reduction techniques. Int. J. Electr. Power 2019, 110, 11–20. [Google Scholar]
  33. Wang, X.W.; Gao, J.; Chen, M.F.; Wei, X.X.; Wei, Y.F.; Zeng, Z.H. Faulty line detection method based on optimized bistable system for distribution network. IEEE Trans. Ind. Inform. 2018, 14, 1370–1381. [Google Scholar] [CrossRef]
  34. Jin, N.; Xing, J.W.; Liu, Y.; Li, Z.T.; Lin, X.L. A novel single-phase -to-ground fault identification and isolation strategy in wind farm collector line. Int. J. Elec. Power 2018, 94, 15–26. [Google Scholar] [CrossRef]
  35. Derakhshandeh, S.Y.; Mobini, Z.; Mohammadi, M.; Nikbakht, M. UAV-assisted fault location in power distribution systems: An optimization approach. IEEE Trans. Smart Grid 2019, 10, 4628–4636. [Google Scholar] [CrossRef]
  36. Mehrdad, T.H.; Hossein, R.; Mohammadreza, D. Faulted feeder identification in active grounded networks. IET Gener. Transm. Dis. 2019, 13, 3476–3483. [Google Scholar]
  37. Zeng, X.J.; Li, K.K.; Chan, W.L.; Su, S.; Wang, Y.Y. Ground-fault detection with fault-current and fault-resistance measurement in mine power systems. IEEE Trans. Ind. Appl. 2008, 44, 424–429. [Google Scholar] [CrossRef]
  38. Givelberg, M.; Lysenko, E.; Zelichonok, R. Zero sequence directional earth-fault protection with improved characteristics for compensated distribution networks. Electr. Power Syst. Res. 1999, 52, 217–222. [Google Scholar] [CrossRef]
  39. Xue, Y.D.; Chen, X.R.; Song, H.M.; Xu, B.Y. Resonance analysis and faulty feeder identification of high-impedance faults in a resonant grounding system. IEEE Trans. Power Deliver. 2017, 32, 1545–1555. [Google Scholar] [CrossRef]
  40. Wang, Y.Y.; Huang, Y.H.; Zeng, X.J.; Wei, G.; Zhou, J.M.; Fang, T.; Chen, H.W. Faulty feeder detection of single phase-earth fault using grey relation degree in resonant grounding system. IEEE Trans. Power Deliver. 2017, 32, 55–61. [Google Scholar] [CrossRef]
  41. Guo, M.F.; Zeng, X.D.; Chen, D.Y.; Yang, N.C. Deep-learning-based earth fault detection using continuous wavelet transform and convolutional neural network in resonant grounding distribution systems. IEEE Sens. J. 2018, 18, 1291–1300. [Google Scholar] [CrossRef]
Figure 1. Architecture of the proposed integrated power distribution system laboratory platform.
Energies 12 03780 g001
Figure 2. Prototype of the scaled-down educational distribution network platform.
Energies 12 03780 g002
Figure 3. Traditional π-shape physical model of the three-phase transmission line.
Energies 12 03780 g003
Figure 4. The schematic diagram of the three-phase distribution line module.
Energies 12 03780 g004
Figure 5. Layout of the three-phase distribution line printed circuit board (PCB) module: (a) obverse side; and (b) reverse side.
Energies 12 03780 g005
Figure 6. The schematic diagram of the signal conditioning circuit for a voltage transducer.
Energies 12 03780 g006
Figure 7. The schematic diagram of the signal conditioning circuit for a current transducer.
Energies 12 03780 g007
Figure 8. Experimental test results of the signal conditioning circuit: (a) voltage transducer; and (b) current transducer.
Energies 12 03780 g008
Figure 9. The schematic diagram of the breaker module.
Energies 12 03780 g009
Figure 10. The schematic diagram of the short-circuit fault generator module.
Energies 12 03780 g010
Figure 11. The schematic diagram of the zero-sequence current signal monitoring circuit.
Energies 12 03780 g011
Figure 12. Experimental test results of the zero-sequence signal monitoring circuit.
Energies 12 03780 g012
Figure 13. Experimental platform set-up for fault location in distribution systems.
Energies 12 03780 g013
Figure 14. Experimental results of zero-sequence currents when a single-phase earth fault occurs on the middle of the first feeder: (a) first feeder; (b) second feeder; and (c) third feeder.
Energies 12 03780 g014
Figure 15. Experimental results of zero-sequence currents when a single-phase earth fault occurs on the end of the first feeder: (a) first feeder; (b) second feeder; and (c) third feeder.
Energies 12 03780 g015
Figure 16. Experimental results of zero-sequence currents when a single-phase earth fault occurs on the middle of the second feeder: (a) first feeder; (b) second feeder; and (c) third feeder.
Energies 12 03780 g016
Figure 17. Experimental results of zero-sequence currents when a single-phase earth fault occurs on the end of the second feeder: (a) first feeder; (b) second feeder; and (c) third feeder.
Energies 12 03780 g017
Figure 18. Experimental results of zero-sequence currents when a single-phase earth fault occurs on the middle of the third feeder: (a) First feeder; (b) second feeder; and (c) third feeder.
Energies 12 03780 g018
Figure 19. Experimental results of zero-sequence currents when a single-phase earth fault occurs on the end of the third feeder: (a) first feeder; (b) second feeder; and (c) third feeder.
Energies 12 03780 g019
Figure 20. One typical recorded zero-sequence current waveform under a single-phase earth fault in the field.
Energies 12 03780 g020
Table 1. Equipment list and its cost in our proposed platform.
EquipmentDescriptionUnit Cost/US $NumberTotal Cost/US $
Three-phase distribution line moduleEquivalent π-type distribution line model with different parameters represent different lengths of the overhead line or cable1620320
PCB motherboard for distribution feederPCB motherboard integrated with the voltage and current monitoring circuit module, short circuit fault generator and breaker module, module of input, and out ports3610360
DC power supplyTo power the voltage and current monitoring circuit module1501150
Other equipmentAntistatic experimental table, soldering iron, etc.//150
Total cost/US $///980
Table 2. Cost comparison between our platform and the commercial platform.
EquipmentCommercial PlatformOur PlatformCost Reduced By
Unit Cost/US $NumberTotal Cost/US $Unit Cost/US $NumberTotal Cost/US $
Three-phase distribution line module15002030,000162032098.9%
PCB motherboard for distribution feeder///3610360/
DC power supply///1501150/
Other equipment//41,500//150/
Total cost/US $//71,500//98098.6%
Table 3. Typical sequence parameters of distribution lines.
PositiveZero
r+ (Ω/km)L+ (mH/km)C+ (μF/km)R0 (Ω/km)L0 (mH/km)C0 (μF/km)
overhead line0.0961.220.0110.233.660.007
cable0.110.520.290.341.540.19
Table 4. Typical values of the elements in module of the distribution line module.
Length (km)R1 (Ω)R4 (Ω)L1 (mH)L4 (mH)C1 (μF)C4 (μF)
overhead line100.960.4512.28.130.0550.288
cable1.50.1650.1150.780.510.2181.24
cable50.550.3832.61.70.7254.13
cable101.651.157.85.12.1812.4
Table 5. Detailed cascaded resistor components to form the required resistor.
Serial NumberTarget Values/(Ω)Detailed Cascaded Resistor ComponentsError
Cascaded Components’ NumberDetailed Nominal Values/(Ω)
10.11510.124.3%
20.16510.159.1%
30.38320.15/0.223.4%
40.4520.22/0.222.2%
50.5510.561.8%
60.9610.915.2%
71.1511.24.3%
81.6511.63.0%
Table 6. Detailed parallel capacitor components to form the required capacitor.
Serial NumberTarget Values/(μF)Detailed Parallel Capacitor ComponentsError
Parallel Components’ NumberDetailed Nominal Values/(μF)
10.05510.0561.8%
20.21810.220.9%
30.28830.027/0.047/0.222.1%
40.72530.047/0.22/0.471.7%
51.2430.047/0.22/12.2%
62.1812.20.9%
74.1331/1/2.21.7%
812.430.22/2.2/100.2%
Table 7. Students’ evaluation of the proposed platform.
Survey QuestionStudent PopulationMedianStandard Deviation
Overall, I would rate this platform as:Proposed platform4.40.65
Matlab/Simulink3.81.03
The platform provides an appropriate hands-on approach:Proposed platform4.50.45
Matlab/Simulink2.81.26
The platform provides an easy way to study fault location in NGDSsProposed platform4.50.55
Matlab/Simulink4.10.78

