1. Introduction
Directional overcurrent protection elements are a fundamental part of the protection schemes of transmission lines around the world, since in all meshed transmission networks, it is impossible to ensure selectivity without limiting the operation of the overcurrent protection devices for just one direction, as indicated in [
1,
2]. These elements provide backup protection for line differential and distance protection elements, especially for high impedance faults, beyond the reach settings of the distance protection elements [
3], and they are often used in pilot scheme applications to provide sensitive communications-assisted protection. Therefore, proper direction determination is of paramount importance for ensuring reliable operation of the transmission line protection system, including directional elements.
Traditionally, the subject of settings determination for directional overcurrent protection elements have focused on the problem of ensuring selectivity by proposing basic to advanced techniques for the proper coordination of these elements in transmission and distribution networks [
4,
5,
6,
7], thus leaving the definition of direction determination settings, such as the Relay Characteristic Angle (
RCA), or the limits of directional regions (forward and reverse) to general guidelines and typical values [
4], which, from the author’s practical experience, have resulted, in some cases, in non-selective tripping for faults outside of the protected line, or non-tripping for certain fault conditions within the protected line, without performing further analysis oriented to evaluate the performance of the general settings criteria. Even in recent years, few publications [
7,
8,
9,
10,
11] have been made on the subject of proposing settings or evaluating its performance in directional overcurrent elements based on fault simulations; however, they deal with very specific application problems of directional overcurrent elements, such as underground cable systems [
7] or mutually-coupled transmission lines [
9], cross country faults in medium voltage loops [
10], and the impact of fault current limiters and wind turbines on the direction determination algorithms [
11], without addressing the problem related to the determination or evaluation of the settings defining the performance of the direction determination algorithm. In [
7], although a very basic performance analysis is presented for directional phase and ground overcurrent elements, the settings used and verified are the typical values recommended in the specialized literature, and therefore, its selection is not justified, besides the fact that the simulations performed do not consider some of the most influencing factors affecting the performance of these protection elements, in part, due to the specific application to which the proposed methodology is applied. In [
9], although the performance of directional overcurrent elements under the influence of mutual coupling in the protected lines is presented, the settings used for the direction determination algorithm are not presented. In [
10], although the relay characteristic angle (
RCA) and the forward and reverse regions are clearly established, there is no justification on the settings provided, and the presented tests have been carried out using very few study cases, thus leaving most of the problems affecting the performance of the direction determination algorithm out of the scope. These problems and their solutions are presented in detail in this paper. In [
11], the evaluation of several direction determination algorithms is oriented to the transient effect produced by the fault current limiter in the study cases presented, which again, do not represent a wide scope for evaluating the performance of the settings behind the direction determination characteristic, and its suitability for the system where the directional overcurrent elements are applied.
Other studies have been carried out proposing new methods for the direction determination algorithm in very specific cases, as the one proposed in [
12], for its application in distribution networks with inverter-interfaced generation (IIG), but again, they do not provide specific means to calculate the relevant settings, and are limited to present the operation characteristic, with setting values not supported by a detailed analysis.
Reference [
13], which was developed by the same authors of the present article, describes an alternative method for obtaining the directional characteristic angle (
RCA) of directional overcurrent elements in transmission networks; by formulating the problem of obtaining such angle through the performance of a complete short-circuit sensitivity analysis and the solution of a simple optimization problem. However, the principles for the application of the method described in [
13] to evaluate the performance of the direction determination algorithm, along with the verification of the settings obtained from the solution of the optimization problem, and the detailed development of the general methodology for using this approach to define other settings related to the direction determination algorithm are missing in [
13]. This article will describe the general guidelines for the application of the method described in [
13] to calculate key settings of the direction determination characteristic of directional overcurrent relays, such as the relay characteristic angle, the selection of the polarizing quantities (negative sequence or zero sequence) for the directional ground overcurrent protection function, and the minimum thresholds for the activation of the voltage memory for the directional phase overcurrent element.
Since the work presented in [
13] was focused on the formulation of the optimization problem to calculate the
RCA and its advantages over the use of traditional setting criteria, the present article will describe in more detail the factors affecting the most commonly used polarization techniques, the factors to be considered when configuring the short-circuit sensitivity analysis block, the processing of the results obtained from it, the application of the method to define other important settings related to the directional characteristic different from the
RCA, such as the polarization quantities for directional ground overcurrent elements, and the discussion of the results obtained from the application of this method to several study cases, based on a comparative analysis with the traditionally used typical settings, from which the advantages of the application of the proposed methodology are outlined. Additional variables to those introduced by [
13] were defined in order to measure the performance of any given settings, typical or optimal, of the direction determination characteristic, so that selectivity issues related to the incorrect direction determination, or sensitivity issues, related to the starting settings, were easily identified, from the extensive fault conditions simulated in the short-circuit sensitivity analysis. Finally, based on the additional variables defined to address the performance of the settings related to the direction determination characteristic, a methodology for the controlled modification of the
RCA setting, in order to improve the coverage of the Forward and Reverse regions is included, in order to enhance the advantages of using the methodology, based on the approach described in [
13].
The paper has been divided into three major sections.
Section 2 describes in detail the theoretical background and specific guidelines and solution method employed in the proposed methodology; it also includes the sample transmission system to be used in the tests performed to demonstrate the proper performance of the solutions obtained from the application of the proposed methodology.
Section 3 presents comparative results between the application of the traditional methodology and the proposed alternative, as applied to the sample transmission system presented in
Section 2, and for three different real applications where the proposed methodology has been tested. Finally,
Section 4 presents the general conclusions resulting from the subjects discussed along the paper, as well as the summary of the obtained results from the comparative analysis presented in
Section 3.
2. Methodology
2.1. Short-circuit Sensitivity Analysis According to the Main Factors Affecting the Performance of Directional Overcurrent Protection Elements
As described in [
13], the short-circuit sensitivity analysis must be performed in a software tool allowing the representation of the power system of interest through a reliable model, in which the different factors affecting the components of the direction determination algorithms can be reproduced, so that the proper characterization of the relations between the electrical variables used by the different direction determination algorithms can be obtained. As a result, the analysis must include the simulation of multiple types, locations and conditions of the simulated faults in the transmission system where the relay to be set is located. For the results presented in this paper, the software tool used was PowerFactory 2019, developed by DIgSILENT GmbH, which includes the so-called Complete Method as the short-circuit calculation approach. The Complete Method adopted reproduces more accurately the short-circuit conditions of a given power system than standard methods, intended for dimensioning the short-time withstand capability of the power system elements. This method, which is described in more detail in [
14,
15], uses superposition, which is a more realistic approach to the actual short-circuit condition simulated than standard approaches. In this case, the fault currents related to the short-circuit condition are obtained by overlaying a healthy load-flow condition before the short-circuit fault inception with the short-circuit condition. The load flow represents the pre-fault conditions of the power system under analysis, from which the pre-fault voltage of the faulted element is obtained, and then the method overlays, by complex summation, both the pre-fault and fault inception conditions.
In regard to the fault types to be considered, only single-phase to ground, double-phase to ground and three-phase types should be considered, since these are the most representative for considering the variation in magnitude and phase angle of the different polarization quantities. Naturally, three-phase faults cannot be used for the determination of the directional characteristic settings related to the directional ground overcurrent element (ANSI 67N), since only positive sequence quantities are related to such fault type.
Regarding the fault impedance to be considered for the simulations, it shall be purely resistive, as exposed in [
16], given its nature on transmission systems, where it is mainly composed of the arc resistance and the effective grounding resistance, if applicable. The set of values for the fault resistance will be user defined, so that the required step sizes and maximum values can be defined by the protection engineer for every particular application, depending on the expected performance in terms of sensitivity, related to the directional overcurrent elements. This will be of utmost importance to evaluate the performance of the directional ground overcurrent element in terms of sensitivity, since it is supposed to be the main backup protection element for high resistance ground faults beyond the reach of the distance protection element.
Regarding the fault location, this will be composed of a configurable set of faulted elements and a variable set of locations, depending on the element type to be considered for the fault. In most software applications, it is only possible to define faults on transmission lines and bus bar or auxiliary nodes. The set of faulted elements should be configured in order to cover the protected line and forward and reverse adjacent elements, including buses at different voltage levels from that related to the protected transmission line.
The operating scenarios to be considered for all the simulated fault conditions should be selected considering the effect of the pre-fault power transfer through the protected line, which will affect mainly the polarization methods related to the directional phase overcurrent elements (ANSI 67), like cross-polarization and voltage memory polarization, as it can be seen in
Figure 1. As stated in [
13,
17], variation of fault resistance and power transfer, which will vary with the operating scenario considered, are the two main factors affecting the phasor relationships between the reference voltage, from which the directional characteristic regions will be defined, and the operating current, which will indicate if the fault is detected in the forward or reverse region. As a result, at least two extreme generation dispatch scenarios should be considered: the one increasing the power transfer through the protected line at a maximum prior to the simulation of the fault condition, and the one reducing the power transfer to the minimum. For parallel lines, an additional operating scenario should be considered, as the outage of the parallel line increases the current flow during normal operating conditions through the protected line. All the operating scenarios affecting the current flow through the protected line should be considered in the short-circuit sensitivity analysis, as only this factor can produce variations of the reference polarizing voltage phasor up to 60°, as stated in [
13,
17].
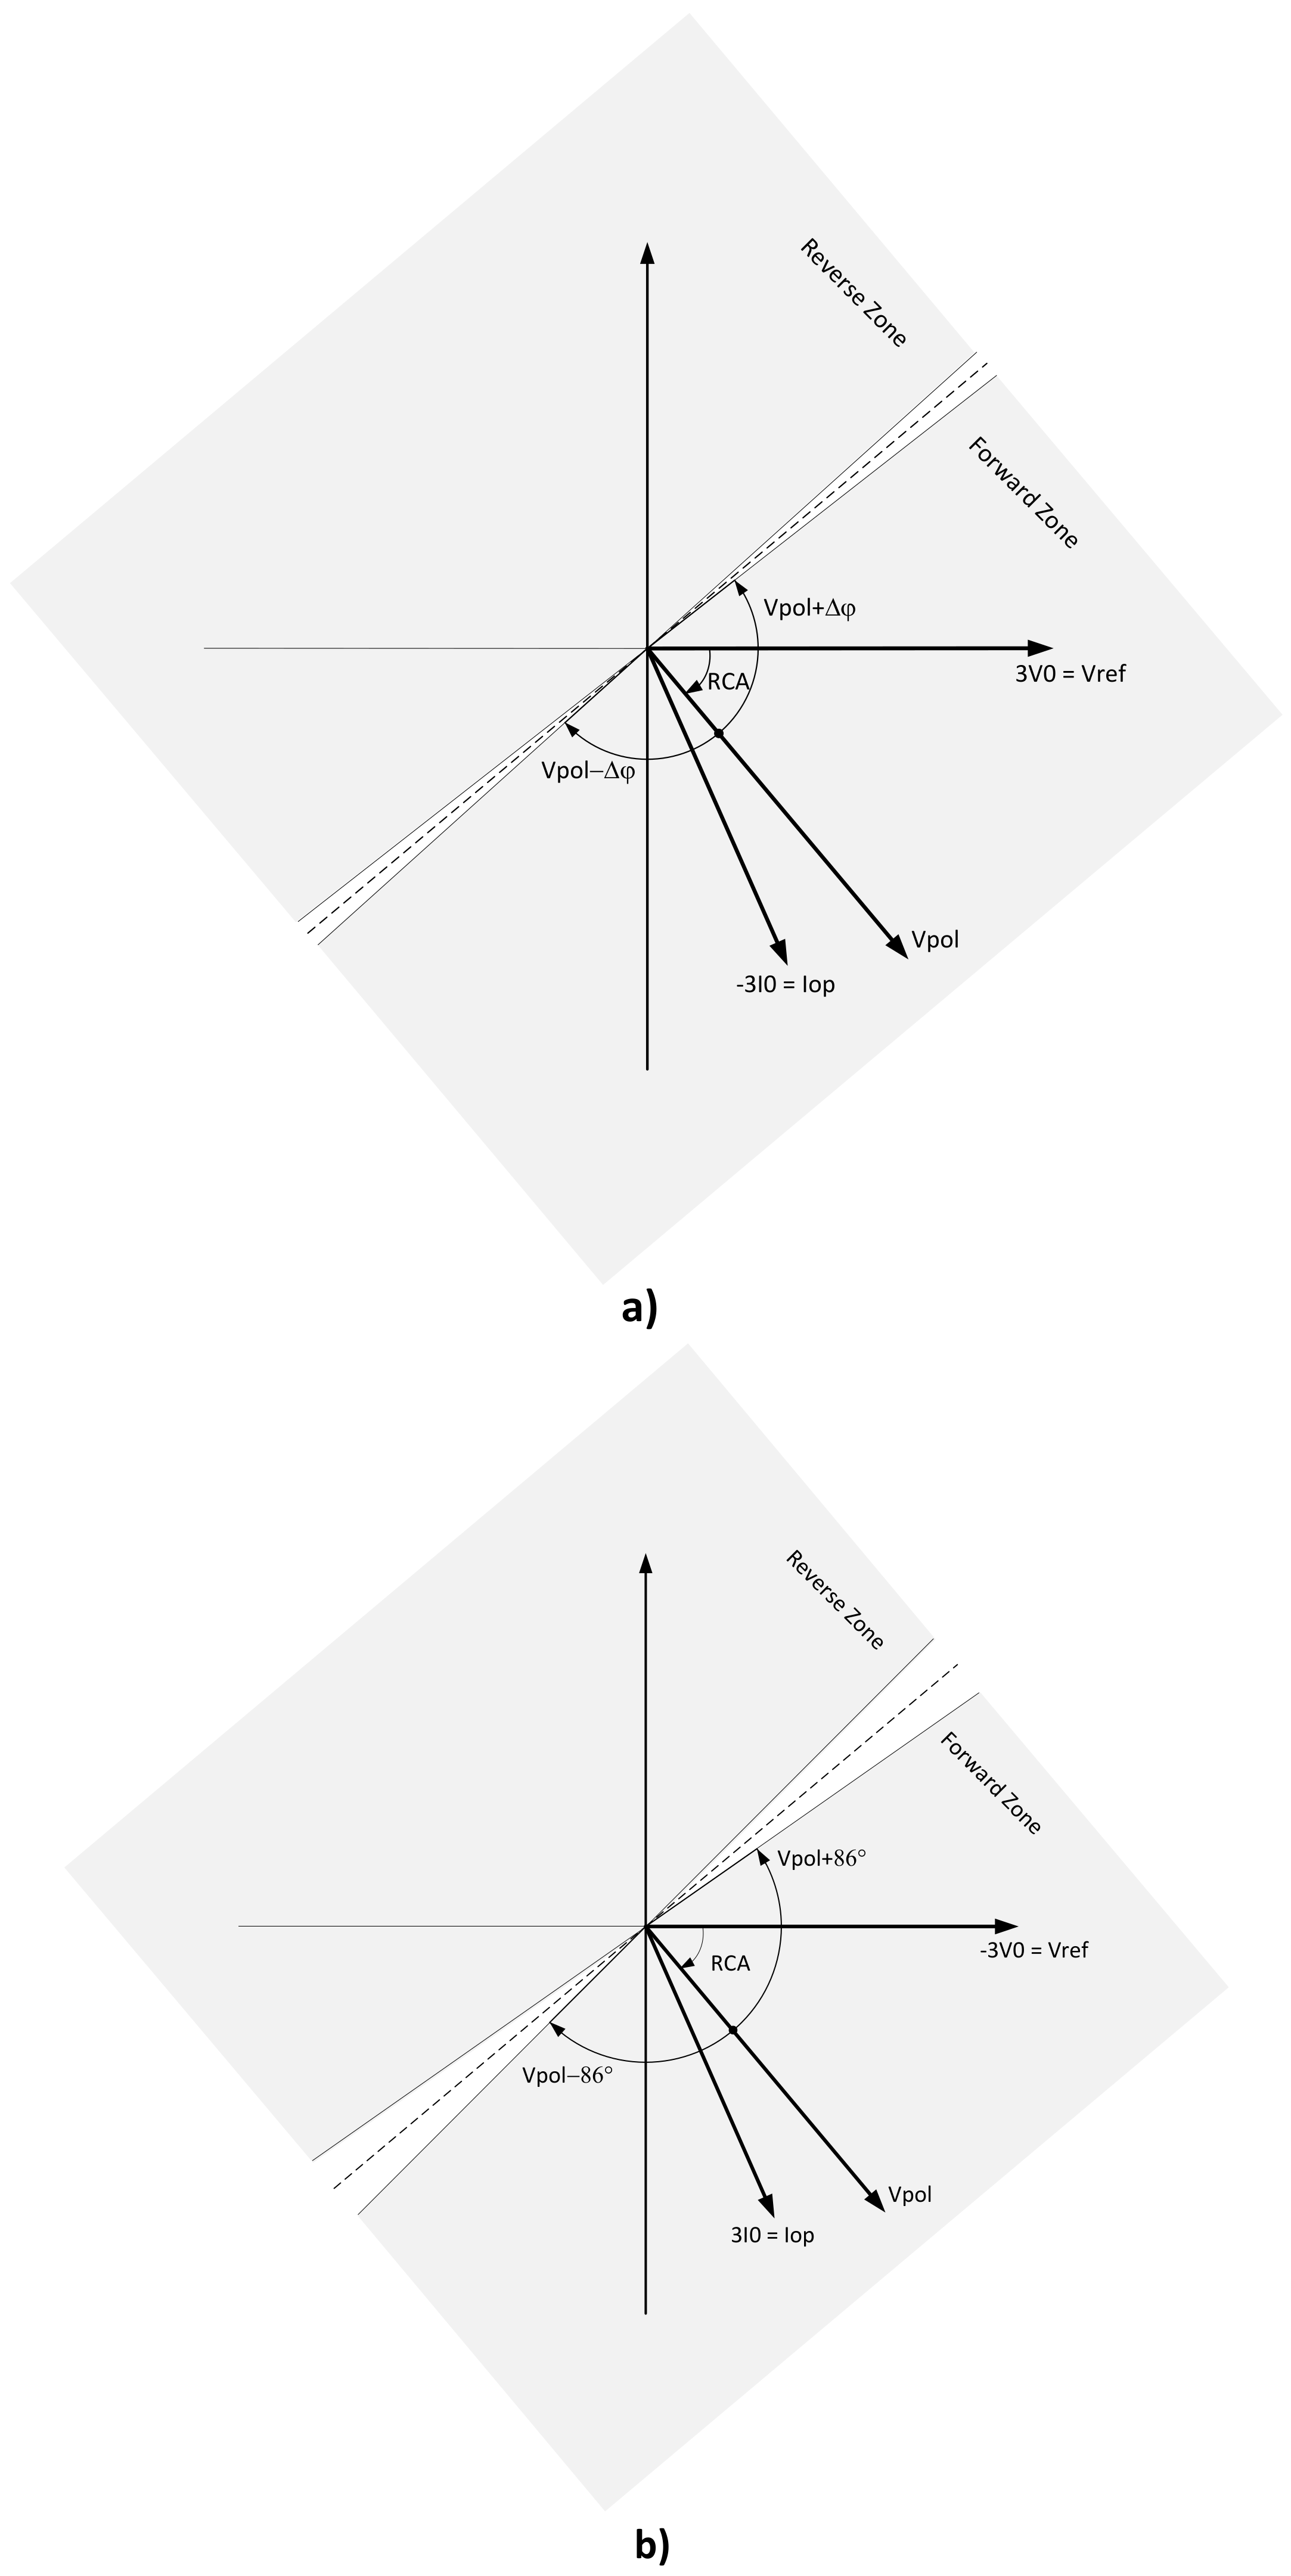
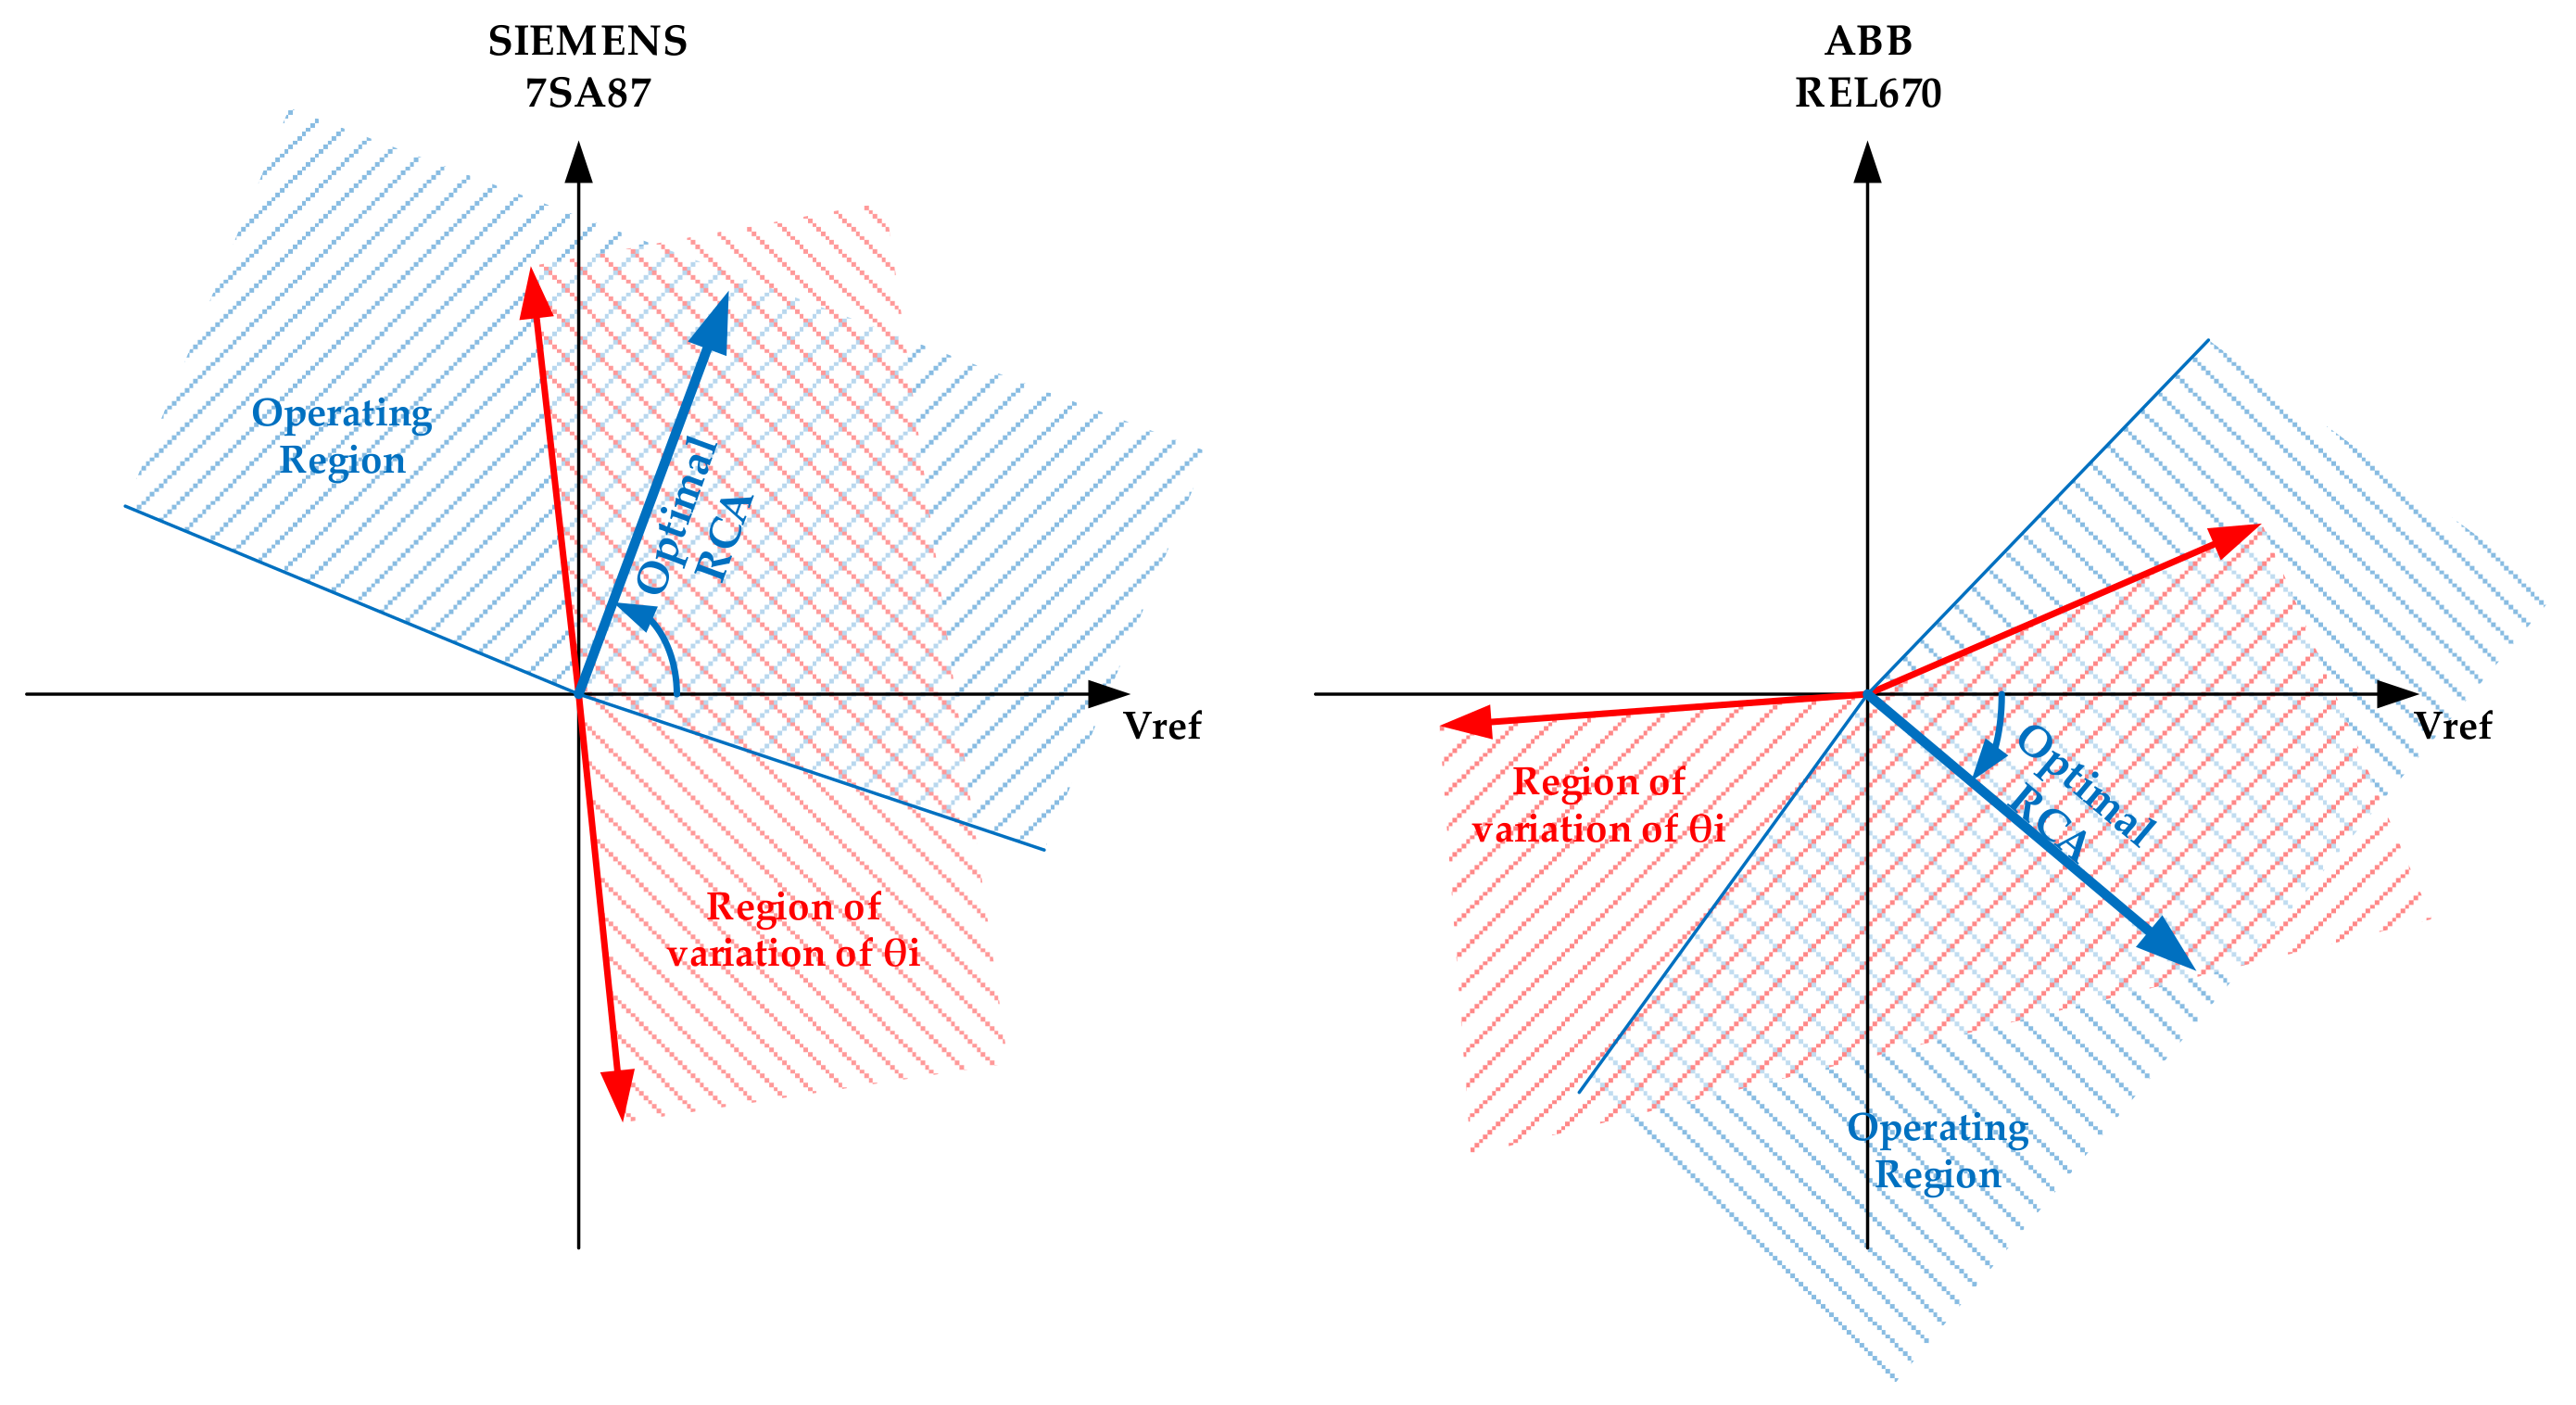
For the polarization techniques related to the directional ground overcurrent element (ANSI 67N), where the zero-sequence and negative-sequence voltage and current phasors are used to determine the direction of the fault, different relay manufacturers use different reference values, but the essence is the same: a phasor relationship between a zero or negative sequence voltage with a zero or negative sequence current. Two examples of the reference and polarization quantities taken by the directional ground overcurrent element with zero-sequence quantities are presented in
Figure 2, for two state of the art protection relays widely used in transmission network applications (SIEMENS 7SJ85 and ABB REL670). As can be seen, the zones for forward and reverse detection may vary from relay to relay; nevertheless, the problem, as stated in [
13], remains pretty much the same: define the optimum
RCA to enhance the performance of the forward and reverse zones in order to avoid detecting the wrong direction of a given fault, thus preventing non-selective tripping.
The use of zero-sequence or negative-sequence quantities imply that the power transfer prior to the application of the fault will not affect the phasor relationship between the polarization quantities, since these are negligible during normal operation, and their behavior is determined only by the fault type and the power system topology behind the location of the relay containing the 67N element.
Figure 3 presents an example of a forward ground fault and the related connection of the sequence networks to represent such fault. It can be seen that the fault impedance value (Z
F) has a direct effect on the magnitude of both voltages and currents from the negative-sequence and zero-sequence networks, but it does not affect the phasor relationship between the negative-sequence or zero-sequence voltage and current; therefore, its variation has no relevance in the calculation of the
RCA according to the method proposed in [
13].
From
Figure 3, it can be seen that, for the specific case of a forward ground fault, the main element determining the phasor relationship between voltages and currents from the negative-sequence and zero-sequence networks are the negative-sequence equivalent impedance from source A (Z
A2) and the zero-sequence equivalent impedance from source A (Z
A0), respectively. For reverse faults, the relationship would be determined by the combination of impedances Z
L2 and Z
B2 for the negative-sequence network, and Z
L0 and Z
B0 for the zero-sequence network. As a result, the operating scenarios to be included in the short-circuit sensitivity analysis for the determination of the optimal
RCA must be selected according to the expected impact on the negative and zero sequence impedances at both terminals of the protected line. These include line outages, especially for mutually coupled transmission lines, outages of power transformers including delta-connected windings at voltage levels different from those at which the protected line operates, and in general, any topological change impacting the distribution of negative-sequence or zero-sequence currents around the location of the evaluated relay, and its phasor relationship with the related sequence voltage.
Special considerations apply when the protected line is mutually coupled with another line, since, as described in [
3,
4,
18], the different operating conditions of mutually coupled lines represent different conditions for the zero-sequence networks, given the importance of the zero-sequence mutual impedance for the equivalent fault circuit to be used as basis for the calculation of the zero-sequence reference voltage and operating current used by the direction determination algorithms, as stated in [
4]. Therefore, the short-circuit sensitivity analysis must also consider the three operating states of mutually-coupled lines, as described in [
18], in order to ensure that the behavior of the zero-sequence quantities is considered for the solution method proposed in [
13].
2.2. Conditioning of the Results Obtained from the Short-Circuit Sensitivity Analysis and Calculation of the Objective Function
The objective function of the optimization problem formulated in [
13] is presented in Equation (1), including an additional variable which is described below. In Equation (1),
n represents the number of simulations considered in the short-circuit sensitivity analysis,
is a weighting factor related to the assumed probability of occurrence of the fault type for every single simulation,
is the angle between the operating current and reference voltage used for the direction determination characteristic in every fault simulated, and
is the characteristic angle of the direction determination characteristic, defining the forward and reverse zones, as presented in
Figure 1 and
Figure 2. Since the only decision variable of the optimization problem is
, the constraints of the optimization problem depend on the setting range of a given protection relay where the directional overcurrent protection elements are included:
In order to avoid including non-relevant information in the calculation of the objective function of the optimization problem, an additional binary variable was included to consider only those faults with current and voltage values with a magnitude enough to produce starting of the directional overcurrent operation characteristic, or the minimum thresholds required by the direction determination algorithm. The value of will be equal to 1 for any simulation producing starting of both features, and equal to 0 for any other case, in such a way that those simulated faults not producing the starting of the operation or direction determination characteristics will not be considered in the calculation of the objective function.
Care must be taken with the calculation of variable
, which should represent the minimum angular separation between the reference voltage and operating current quantities. It is also very important to consider the rotation direction of the angles involved in the calculation of the
RCA, before the calculation of the objective function.
Figure 4 presents a flowchart of the conditioning of the results from the short-circuit sensitivity simulations including all the previously described considerations.
2.3. Solution Method
Given the simplicity of the optimization problem formulated in [
13], which represents a convex problem with a unique optimum solution, and its non-linearity, given the absolute value included in the objective function, the Generalized Reduced Gradient algorithm (GRG) was used as the solution method, given its high robustness and reliability for well-scaled models as that of interest. Additionally, it is worth noticing that the search region for the GRG algorithm, as outlined by the results from the short-circuit sensitivity analysis, will always be feasible if the initial value for the
RCA is any
taken from the results, since the constraints, defined by the setting range of the evaluated relay, will ensure that the
RCA calculated by the search process of the GRG algorithm will remain within such setting range and among the values taken by
. Finally, the availability of the GRG algorithm in basic solver tools, including Microsoft Excel, and the easiness of its implementation in any given programming language, makes it ideal for solving the formulated problem. A detailed description of the GRG algorithm and its application to the solution of different engineering problems is included in [
19,
20,
21], with a basic step-by-step scheme describing the GRG approach and its application to structural and design optimization including in [
19], a detailed flowchart in [
20], and its application to optimal control of very-large-scale robotic systems and a detailed pseudocode in [
21].
The only condition for the use of the GRG algorithm is that the initial value of the RCA must be within the variation of , as if a value very distant from the values of is used, resulting from the short-circuit sensitivity analysis, some implementations of the GRG will not converge. The execution times of the GRG algorithm are within a few seconds for most of the application problems where it was tested, even for over 10,000 simulation results.
2.4. Variables for Evaluating the Quality of the Solution
In order to evaluate the quality of the
RCA obtained from the GRG algorithm, three additional variables are required. The first one is a binary variable
aiming to validate if every fault in the short-circuit sensitivity analysis passing the starting filter (
) produces a current phasor that remains inside the operating zone of the direction determination characteristic defined by the
RCA, in which case it takes a value of 1, or if it falls outside the operating zone, it takes a value of 0. Since all the reverse faults must have been inverted at this point, according to the process described in
Figure 4, this variable will evaluate both Forward and Reverse faults considering the Forward zone only as the general operating region, as presented in the logic scheme of
Figure 5, in such a way that if any reverse fault takes a value of zero, the fault is not detected in the Reverse zone, given the symmetry of both Forward and Reverse zones, as shown in
Figure 2.
The second variable is the starting rate (
SR), calculated as the percentage of faults, from all those simulated in the short-circuit sensitivity analysis, causing start of the direction determination algorithm, according to the minimum thresholds of the reference voltage and the operating current. The starting rate can be calculated according to Equation (2).
The starting rate is expected to be always lower than 100%, since the short-circuit sensitivity analysis, according to the guidelines in
Section 2.1, should consider high impedance faults, sometimes applied in weak ends of the protected line or under operating scenarios which compromise the sensitivity of the directional overcurrent protection elements. This variable is just an indicator and can be used to select the proper polarizing quantities, as described in
Section 2.6.
The third variable is the detection rate (
DR), calculated as the percentage of faults detected in the correct direction from those producing starting of the directional overcurrent protection element (
), as indicated in Equation (3):
For a detection rate lower than 100%, the set of faults producing a zero value for must be isolated and analyzed carefully in order to determine the impact of such faults on the actual performance of the protection system, especially for all those cases where the directional overcurrent elements are supporting a directional comparison teleprotection scheme, or in general, to verify if the incorrect direction determination yields to selectivity issues with adjacent protection elements.
If the isolated faults cause major affectation to the reliable operation of the power system, a shift in the proposed RCA must be performed to include such faults, verifying that by modifying the optimum RCA obtained through optimization, according to the probability distribution assigned, no additional issues arise for other fault conditions. This can be easily performed in the post-processing of the obtained results, as will be discussed later. It is also important to consider the analyzed protection relay as a whole, before modifying settings or assessing the vulnerability condition of the protection scheme. This is performed by identifying patterns during the results analysis, such as if all the faults with incorrect direction determination are ground faults, in which case it is not enough to address the problem individually for the ANSI 67 and ANSI 67N functions; the speed of both elements and its operation for the faults falling in the incorrect region needs to be considered.
2.5. Methodology for Improving the Detection Rate for the Directional Phase Overcurrent Protection Element
Since the formulated optimization problem proposed in [
13] is intended to determine the best possible
RCA based on the characterization of the phasors used by the polarization algorithm, through the short-circuit sensitivity analysis, and given the factors affecting the variation of the
RCA, as described in
Section 2.1, it is possible to obtain values of
RCA compromising the correct direction determination of very particular fault cases, with values of the polarizing angle
of significant differences with respect to the majority of fault cases.
An alternative to cope with this problem is proposed as follows, consisting of the modification of the
RCA as a director angle, ensuring a higher detection rate than with the optimal
RCA, under very specific conditions, in order to avoid incorrect operation of the direction determination characteristic for faults too close to the operating region boundary. The director
RCA can be calculated according to Equation (4):
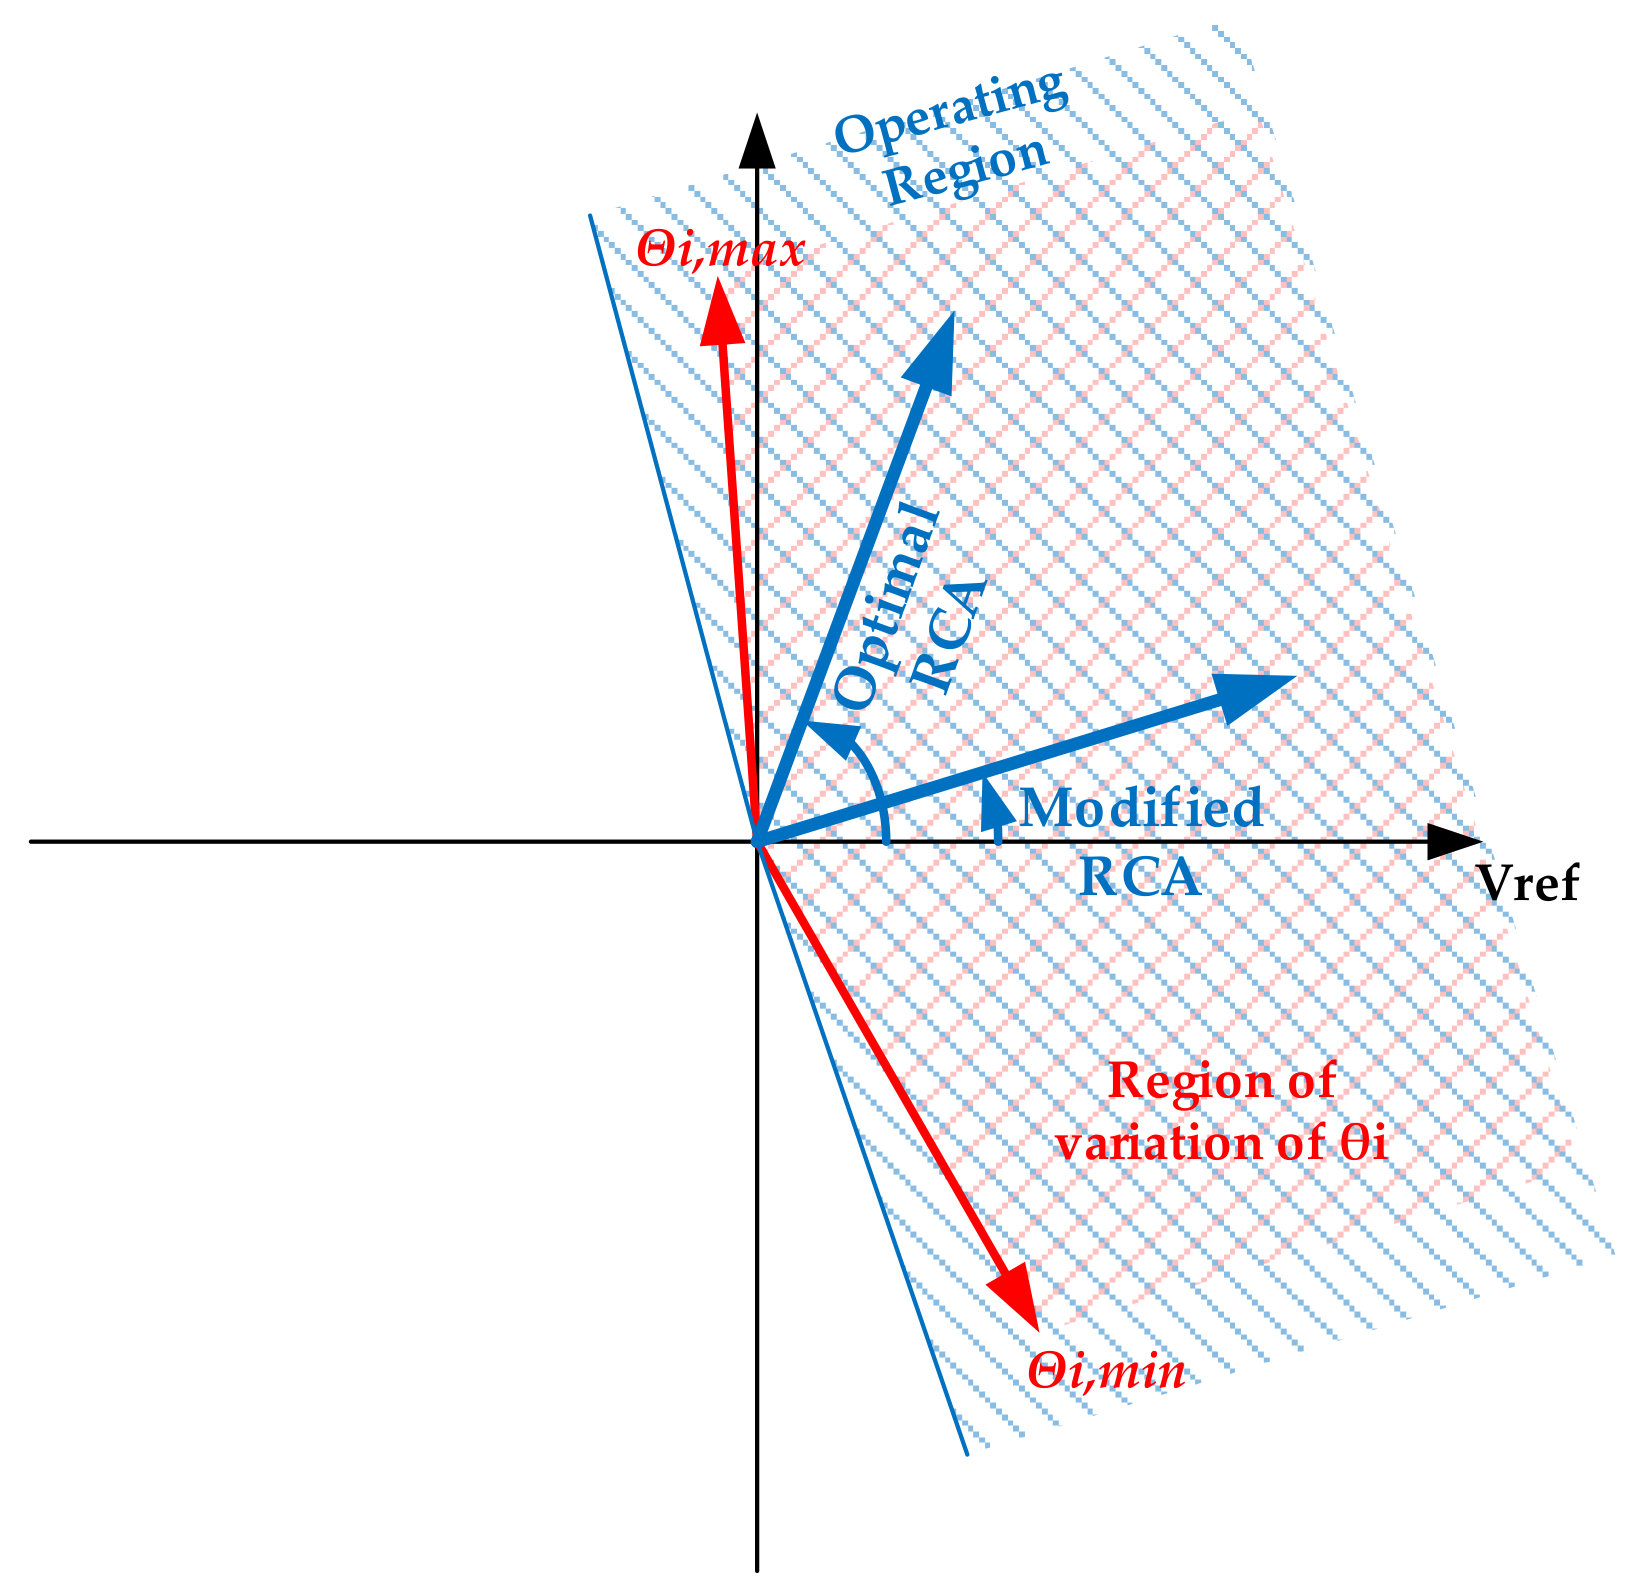
As shown in
Figure 6, this is only possible if the region of variation of
is smaller than the operating region coverage, by at least 10° for security reasons, considering the potential variation of the phase angle of the operating current during heavy current transformer saturation conditions, and its effect on the performance of the direction determination characteristic. This can also be done for faults not compromising the overall selectivity of the protection system, considering other protection elements and its redundancy and reliability for faults in adjacent forward elements, such as transmission lines or power transformers with reliable and redundant protection systems, according to the definition of reliability and redundancy indicated in [
3]. This last exception should only apply to forward faults, since the reverse faults must be used to ensure the reliability of pilot protection schemes based on directional comparison of ANSI 67 elements. This means that the modified
RCA will ensure a higher detection rate than that obtained from the optimal
RCA, under the previously described specific conditions. Under no additional circumstances should the optimal
RCA be modified.
Finally, it is important to analyze the type of faults producing incorrect direction determination, since earth faults will be detected faster by the directional ground overcurrent elements (ANSI 67N), which are more reliable and stable than the directional overcurrent elements (ANSI 67). Detailed selectivity validations should be performed for these identified cases, in order to evaluate the impact of these faults on the general performance of the protection system in a specific application.
2.6. Methodology for Selecting the Proper Quantities for Polarizing the Directional Ground Overcurrent Protection Element
General guidelines, application principles and examples are given in [
4,
10] to select the proper sequence quantities (among negative and zero-sequence) for polarizing the directional ground overcurrent element (ANSI 67N), including all the major aspects affecting the performance of the different direction detection algorithms supporting the 67N protection elements; however, a detailed methodology oriented to ensure the proper direction determination for the particularities of a given application from the settings calculation stage, is still missing.
The value of the objective function resulting from the application of the method proposed in [
13], along with the variables introduced in the previous section to determine the performance of the calculated directional settings, can be compared in order to establish the proper sequence quantities to polarize the 67N protection element, based on the characterization of any given application, as obtained from the short-circuit sensitivity analysis, so that all the factors affecting the performance of the directional ground overcurrent protection can be considered in the proposed solution.
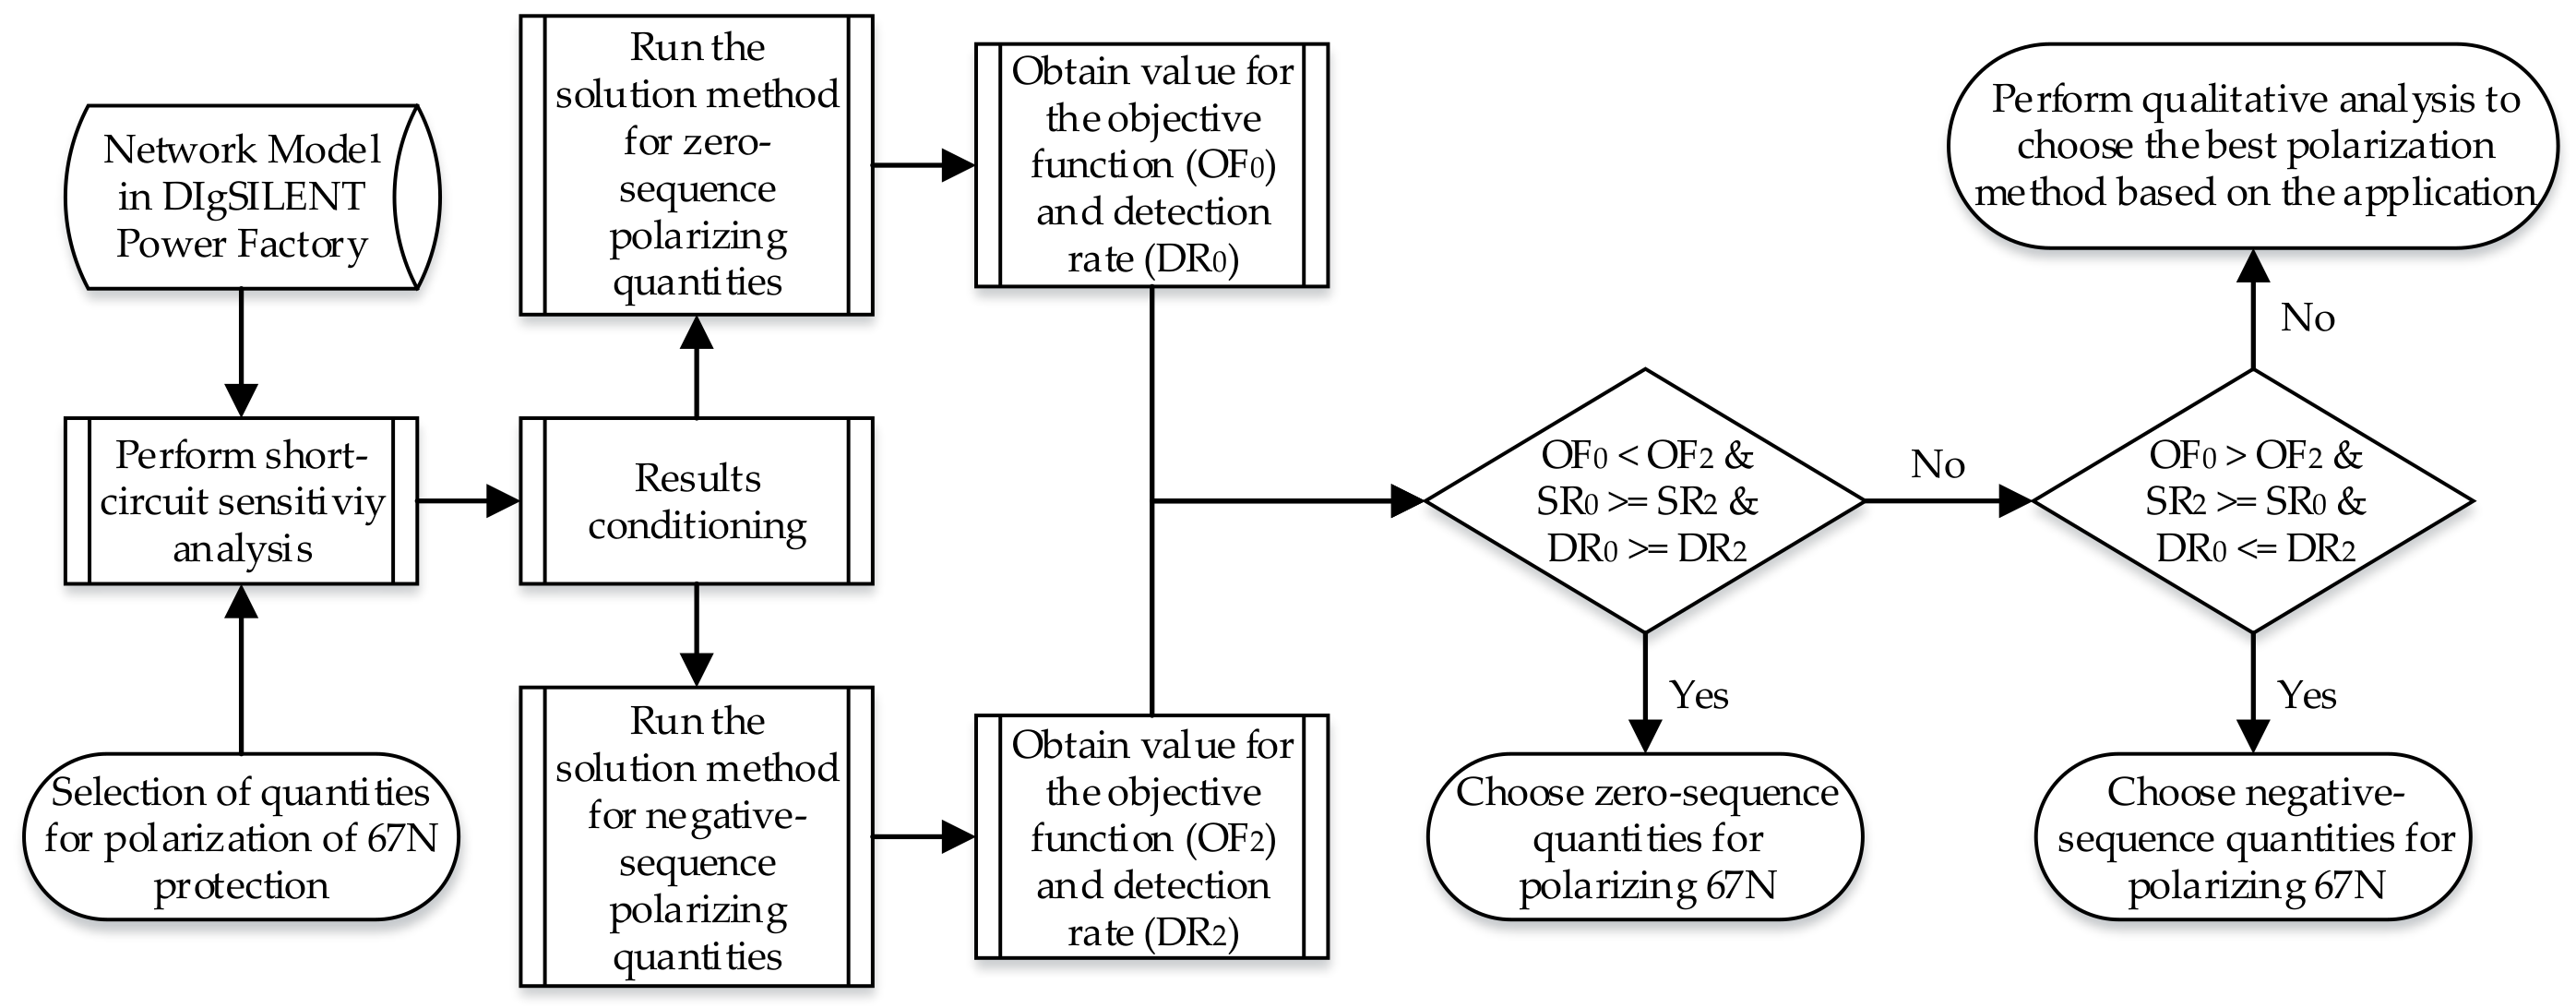
Figure 7 shows the basic flowchart for the proposed methodology for selecting the most adequate polarizing quantities for the 67N element, among negative sequence and zero sequence voltages and currents, which are commonly used in the direction determination algorithms related to the 67N element, as indicated in [
1,
4]. Both polarizing quantities result in different performance of the direction determination algorithm for different applications. For example, the mutual coupling of transmission lines sharing the same support structure represents major challenges when using zero sequence voltages and currents, due to the fact that the mutual coupling is stronger in this sequence than in positive and negative sequence, as it can be obtained from the comparison of the mutual impedances of the mutually coupled transmission lines, as described in [
4,
18].
The qualitative analysis should be performed when the results obtained from running the solution method proposed in [
13], with the previously described enhancements, for both zero-sequence and negative-sequence polarizing quantities, show opposite performance of the objective function when compared with the detection rate. For example, for a given application case, a possible result of opposite performance would be obtained if for the zero-sequence polarizing quantities the OF is lower than for negative-sequence polarizing quantities, but the DR is higher for negative-sequence polarization. The basis for such an analysis is to prioritize the proper direction determination for faults in the protected line, and then, in reverse fault locations, since if the directional relay at the opposite end detects such faults in the correct direction, a non-selective trip of the directional comparison pilot scheme using the 67N protection would be obtained. This analysis must consider the probability of occurrence of the faults detected in the incorrect direction and its impact on the power system. If a given application case demands it, it should even be necessary to modify the
RCA solution obtained from the proposed solution method, in such a way that the risks identified can be mitigated. Care must be taken when proposing an
RCA different that the optimal solution of the proposed solution method, in order to avoid that many phasors remain very close to the operating directional border, since current transformer saturation for such faults could result in incorrect direction determination.
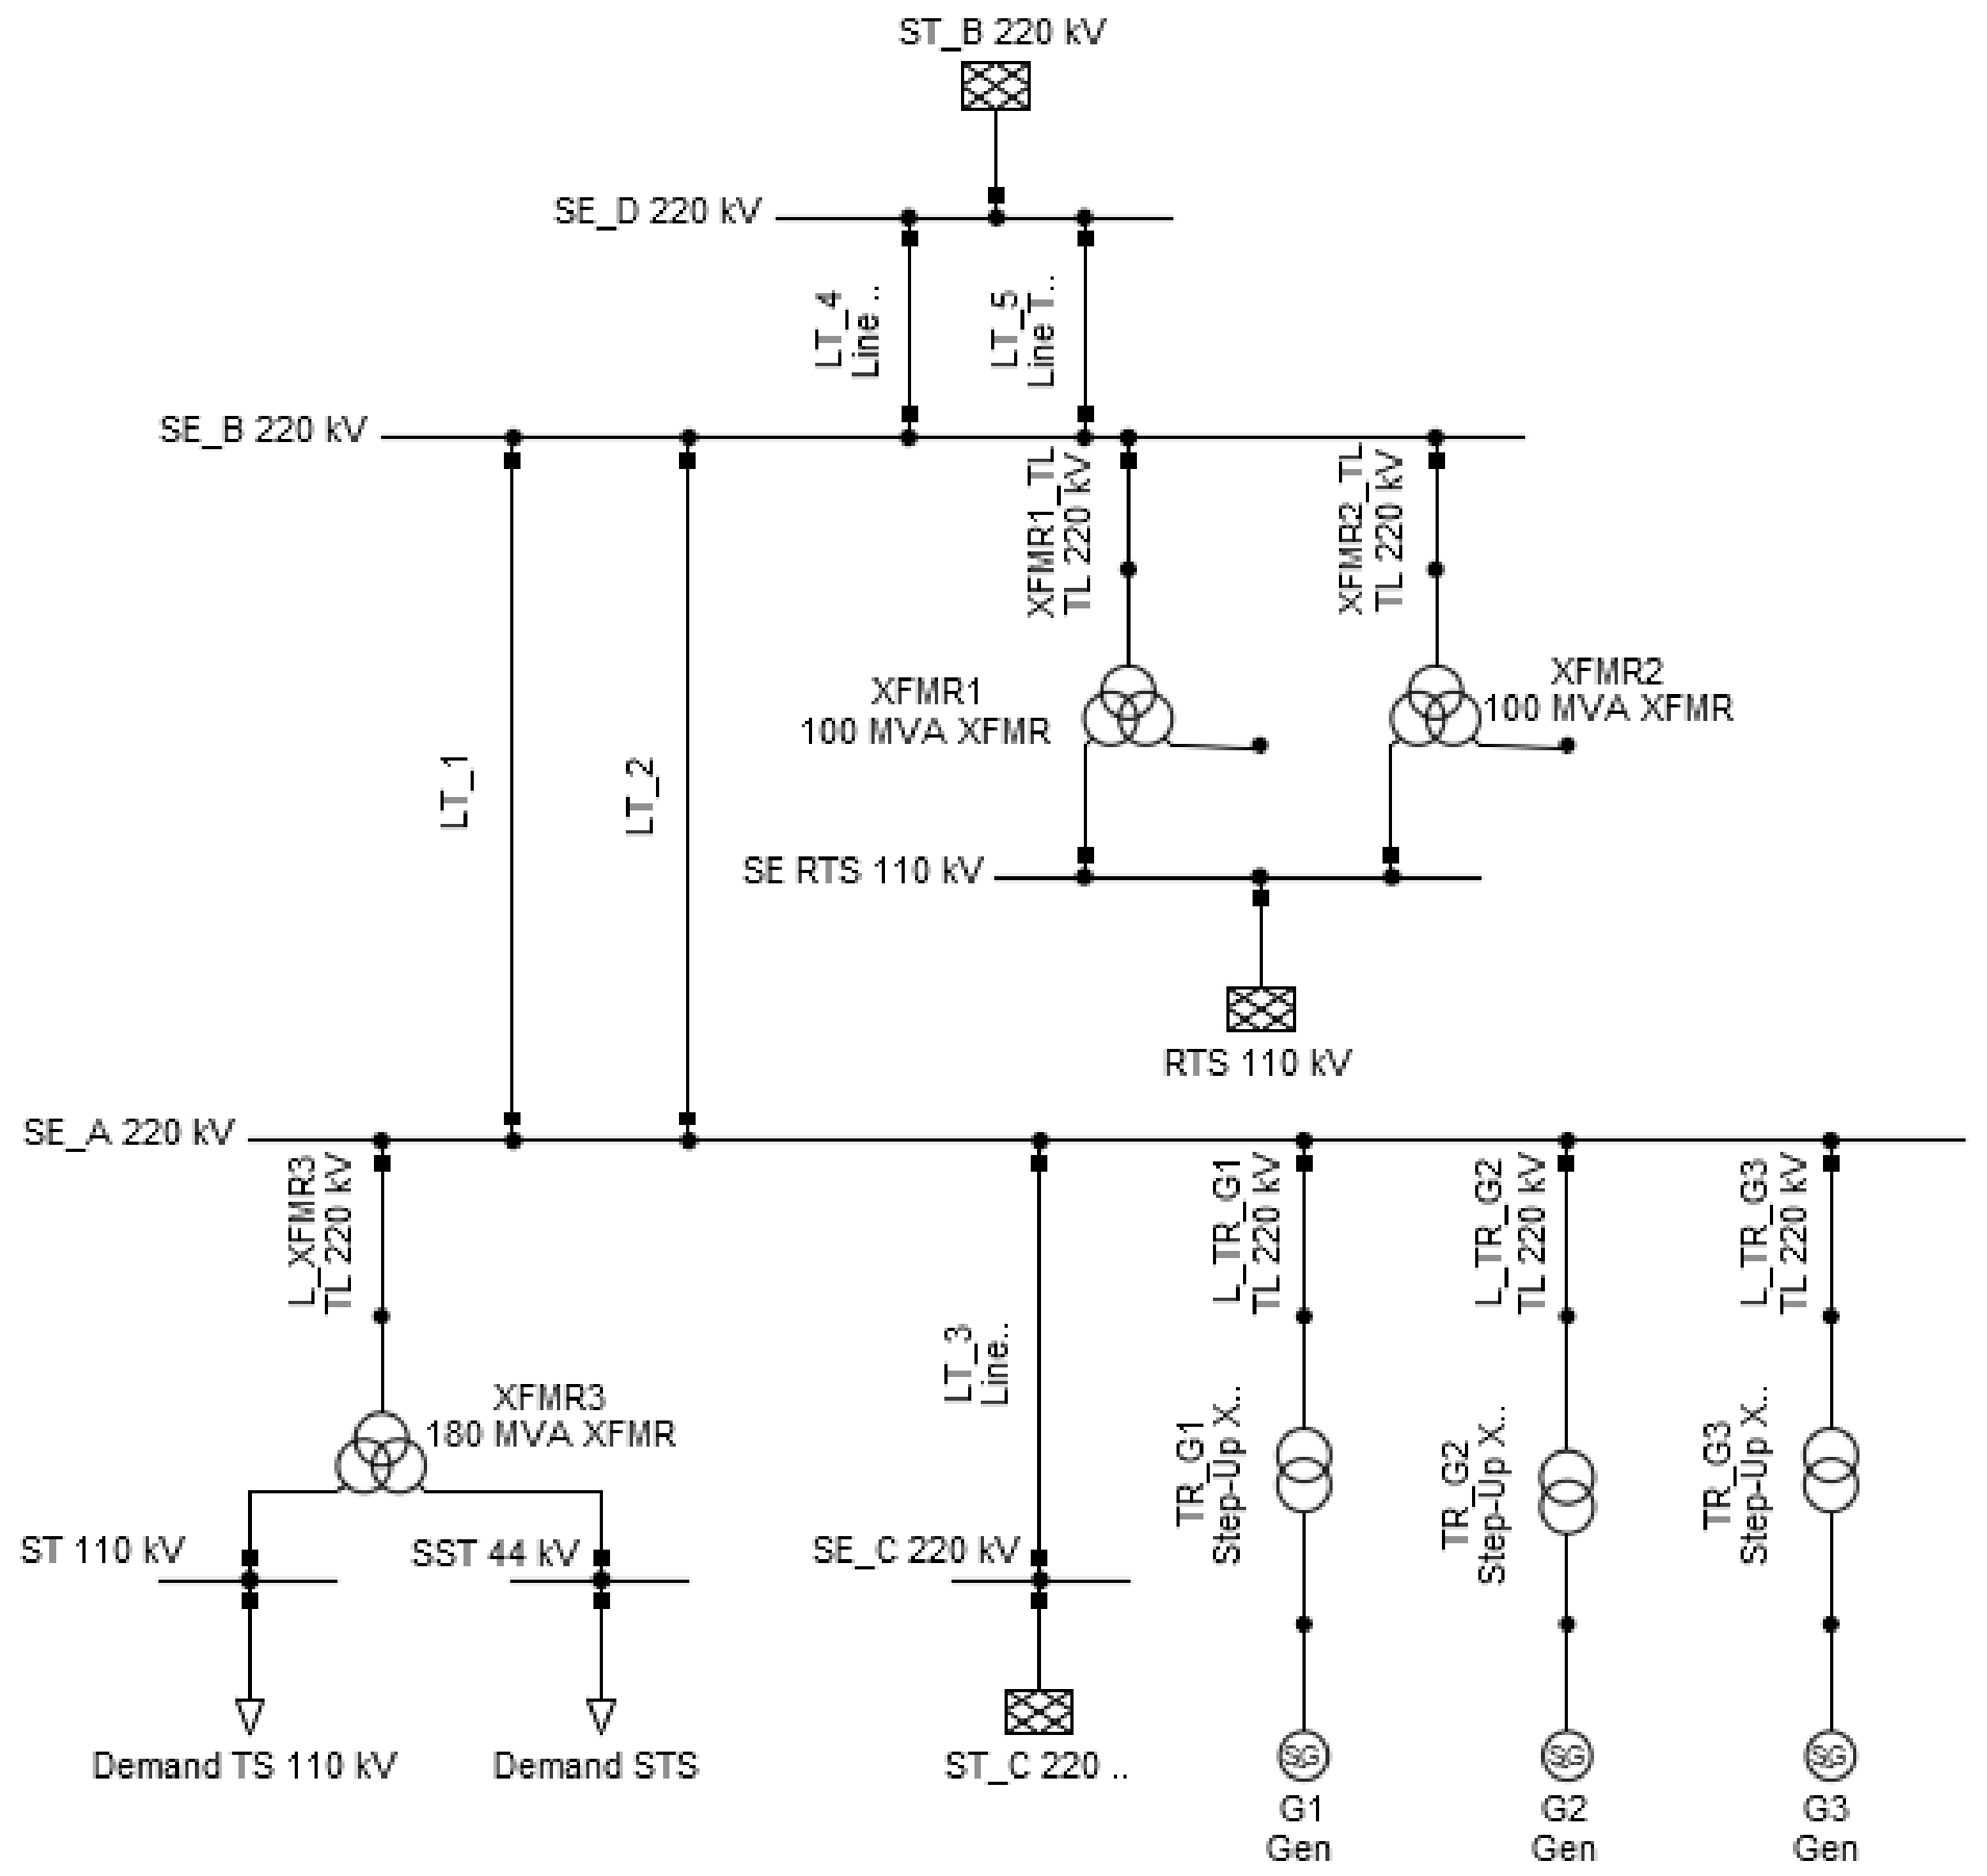
2.7. Sample Transmission System and Relays to Be Evaluated
In order to illustrate the proposed methodology for calculating the polarization settings of directional overcurrent elements, and given the effects on the direction determination algorithms of power transformers with delta-connected windings in voltage levels different from those where the transmission system of interest is connected, protected lines with mutual coupling and variation of the power transfer through the protected line, as described in the previous sections, the sample network in
Figure 8 is used to evaluate the performance of directional phase and ground overcurrent elements for two state of the art protection relays widely used in transmission systems around the world, namely the ABB REL670 from the RELION 600 family [
22] and the SIEMENS 7SA87 from the SIPROTEC 5 family [
23], whose operation principles slightly vary from the classic polarization methods discussed in [
13] and reviewed in
Section 2.1, but keep the same basic principle of an
RCA defining a forward and reverse looking region.
In the case of the SIEMENS 7SA87 relay, for directional ground overcurrent elements, from the obtained value of the RCA, the actual settings defining the forward and reverse zones are obtained. These are related to the angles
and
, which are counted in positive sequence from the reference phasor −3I0 to determine the Forward zone of the relay, leaving the Reverse zone as the complement. The other phasor to be considered for this relay is the polarizing voltage Vp, which is based on the zero-sequence voltage for most applications, and from a combination of the zero-sequence voltage and the measured residual current IY. In any case, the obtained
RCA should be in the middle of the border, and therefore, the values of
and
should result from the shifting of the
RCA in positive and negative sequence, by the maximum desired angle defining the coverage of the Forward zone. The direction determination characteristic is detailed in [
23]; however, in essence, it is the same principle reviewed in
Section 2.1.
In the case of the ABB REL670 relay, it must be considered that the RCA is always clockwise (counted in negative sequence), and that, for the specific case of the directional phase overcurrent element, the setting range for the RCA is limited between 40° and 65°.
3. Results
3.1. Comparative Results for the Sample Transmission System
The proposed methodology was applied to determine the directional settings of the directional overcurrent elements protecting transmission line LT_1 of the sample transmission system presented in
Section 2.7. Following the methodology described in
Section 2.1,
Section 2.2,
Section 2.3,
Section 2.4,
Section 2.5 and
Section 2.6, a detailed short-circuit sensitivity analysis was performed for different fault types and locations, variable fault impedance, and a set of four representative operating scenarios considering the operating conditions of the mutually coupled transmission lines LT_1 and LT_2. A set of 13,860 results were obtained, which were then subjected to the results conditioning process described in
Section 2.2. Then, the
RCA setting for the protection relays SIEMENS 7SA87 and ABB REL670 was obtained by solving the optimization problem described by Equation (1), with the constraints related to the
RCA setting range of the related protection relay.
The results for the directional overcurrent elements of the evaluated relays located at the SE_A 220 kV end of the LT_1 transmission line are presented in
Table 1 for the SIEMENS 7SA87 relay and in
Table 2 for the ABB REL670 relay. A variable
k means that the probability distribution taken from [
13,
18] was considered for the different fault types, and a fixed
k means that the three fault types considered (three-phase, phase-to-phase to ground and single-phase to ground) have the same probability of occurrence, and therefore, the same weight in the objective function.
As it can be observed, the performance of both protection relays for the 67N element is almost identical, with detection rates of 100% in both cases and a superior performance of the negative-sequence polarization over the zero-sequence polarization, as it is evident by the comparison of the values of the objective function and starting rate. It is also worth noticing the difference in the proposed RCA with respect to the typical setting of 0° to −45° commonly used.
A slightly different story can be told regarding the 67 element in both relays, since higher detection rates and much smaller values of the objective functions were obtained for the SIEMENS 7SA87 relay, when compared with the ABB REL670 relay. This is explained by two major factors: the first and most important is the limited setting range of the
RCA in the REL670 relay, which goes from 40° to 65° clockwise (negative-sequence) according to [
22], whereas the 7SA87 relay has a setting range from −180° to 180° counterclockwise; and the second one is related to the different operating principle in the polarization algorithm of both relays, since, as stated in [
22,
23], the 7SA87 uses classical cross-polarization and voltage memory, whereas the REL670 combines self-polarization (85%) and voltage memory (15%) to obtain the reference voltage for polarization.
The graphic results presented in
Figure 9 confirm that the detection rate of both relays is not 100%, but close to such value, as the region of variation of
for both relays is bigger than the operating region for both relays, which, for the case of the 7SA87 relay, is
or lower, around the proposed
RCA. According to [
23], the actual settings defining the operating region can be chosen from the obtained
RCA, according to Equations (5) and (6) below:
For the case of the REL670 relay, the operating region is established by a fixed angle of
around the obtained
RCA, which results in a total coverage of 172°; however, the results presented in
Table 2 and
Figure 9 show that the total region of variation of
is 199.124°, which is impossible to properly cover by any
RCA setting.
From the 13,860 faults simulated, a total of 8830 produced starting of the directional phase overcurrent element in the 7SA87 relay, and from these, 371 faults will be detected in the wrong direction. For the REL670 relay, 10,182 faults produced starting of the 67 element, from which a total of 658 faults will be detected in the wrong direction. For both relays, there is no common factor defining the faults detected in the incorrect direction, since these include different fault locations, included the protected line, the four operating scenarios and fault types considered.
As a result, the optimal
RCA settings for both relays, as obtained from the proposed methodology, represents the closest value to the majority of phasors produced by the faults in the sample transmission system, and from its application, it can be concluded that the 67 element is not suitable to reliably protect the LT_1 transmission line, which is a general application guideline for lines at this voltage level, due to the speed requirements these units cannot comply if not used to support a directional comparison pilot protection scheme, as indicated in [
3]. Many utilities use the ANSI 67 elements as a delayed backup protection for phase-to-phase faults beyond the reach of the distance protection function, and the results have proven that the proposed methodology also serves the purpose of evaluating the performance of these elements and if these are reliable enough for a specific application, in addition to the definition of the most suitable polarizing sequence for the ANSI 67N element, which would have not been possible through the application of typical settings, as indicated in the results presented in
Table 3 and
Table 4.
As can be seen, the performance of both relays in detection rate is pretty similar to those obtained with the optimal RCA; however, the performance in the objective function is much worst, which could cause that even faults detected within the operating region, could be very close to the border, where measurement errors produced by current transformer saturation or transients in voltage could force additional phasors out of the operating region. Since the objective function value has no relevance when the typical values are used, it is not possible to determine which polarizing sequence, among negative-sequence and zero-sequence, is most suitable for the evaluated relays, since the detection rate is the same for both sequences.
The results for the same relays at substation SE_B are presented in
Table 5 and
Table 6, where similar results as those previously discussed for substation SE_A were obtained.
3.2. Comparative Results for Real Application Cases
The proposed methodology has been successfully applied in several transmission networks in Colombia, as part of the development of protection coordination studies for different utility companies. The comparative results for the application of both optimal and typical values are presented for three application cases: Study Case 1 includes four relays of two 115 kV transmission lines with low infeed and strong zero-sequence sources at both line ends; Study Case 2 includes eight relays of four 115 kV transmission lines, including mutual-coupling and strong generation sources nearby the protected lines; Study Case 3 includes two relays of a short 220 kV line connecting a major power generating station to the transmission system. It is important to clarify that this does not mean that the proposed methodology is only applicable for the Colombian transmission system, since as stated previously, the proposed methodology is entirely based on the specific issues affecting any given transmission system, as it obtains the input variables from an extensive short-circuit sensitivity analysis, whose results and impact on the direction determination algorithms will depend on the specific topological and operational conditions of the transmission system where the methodology is to be applied.
3.2.1. Study Case 1
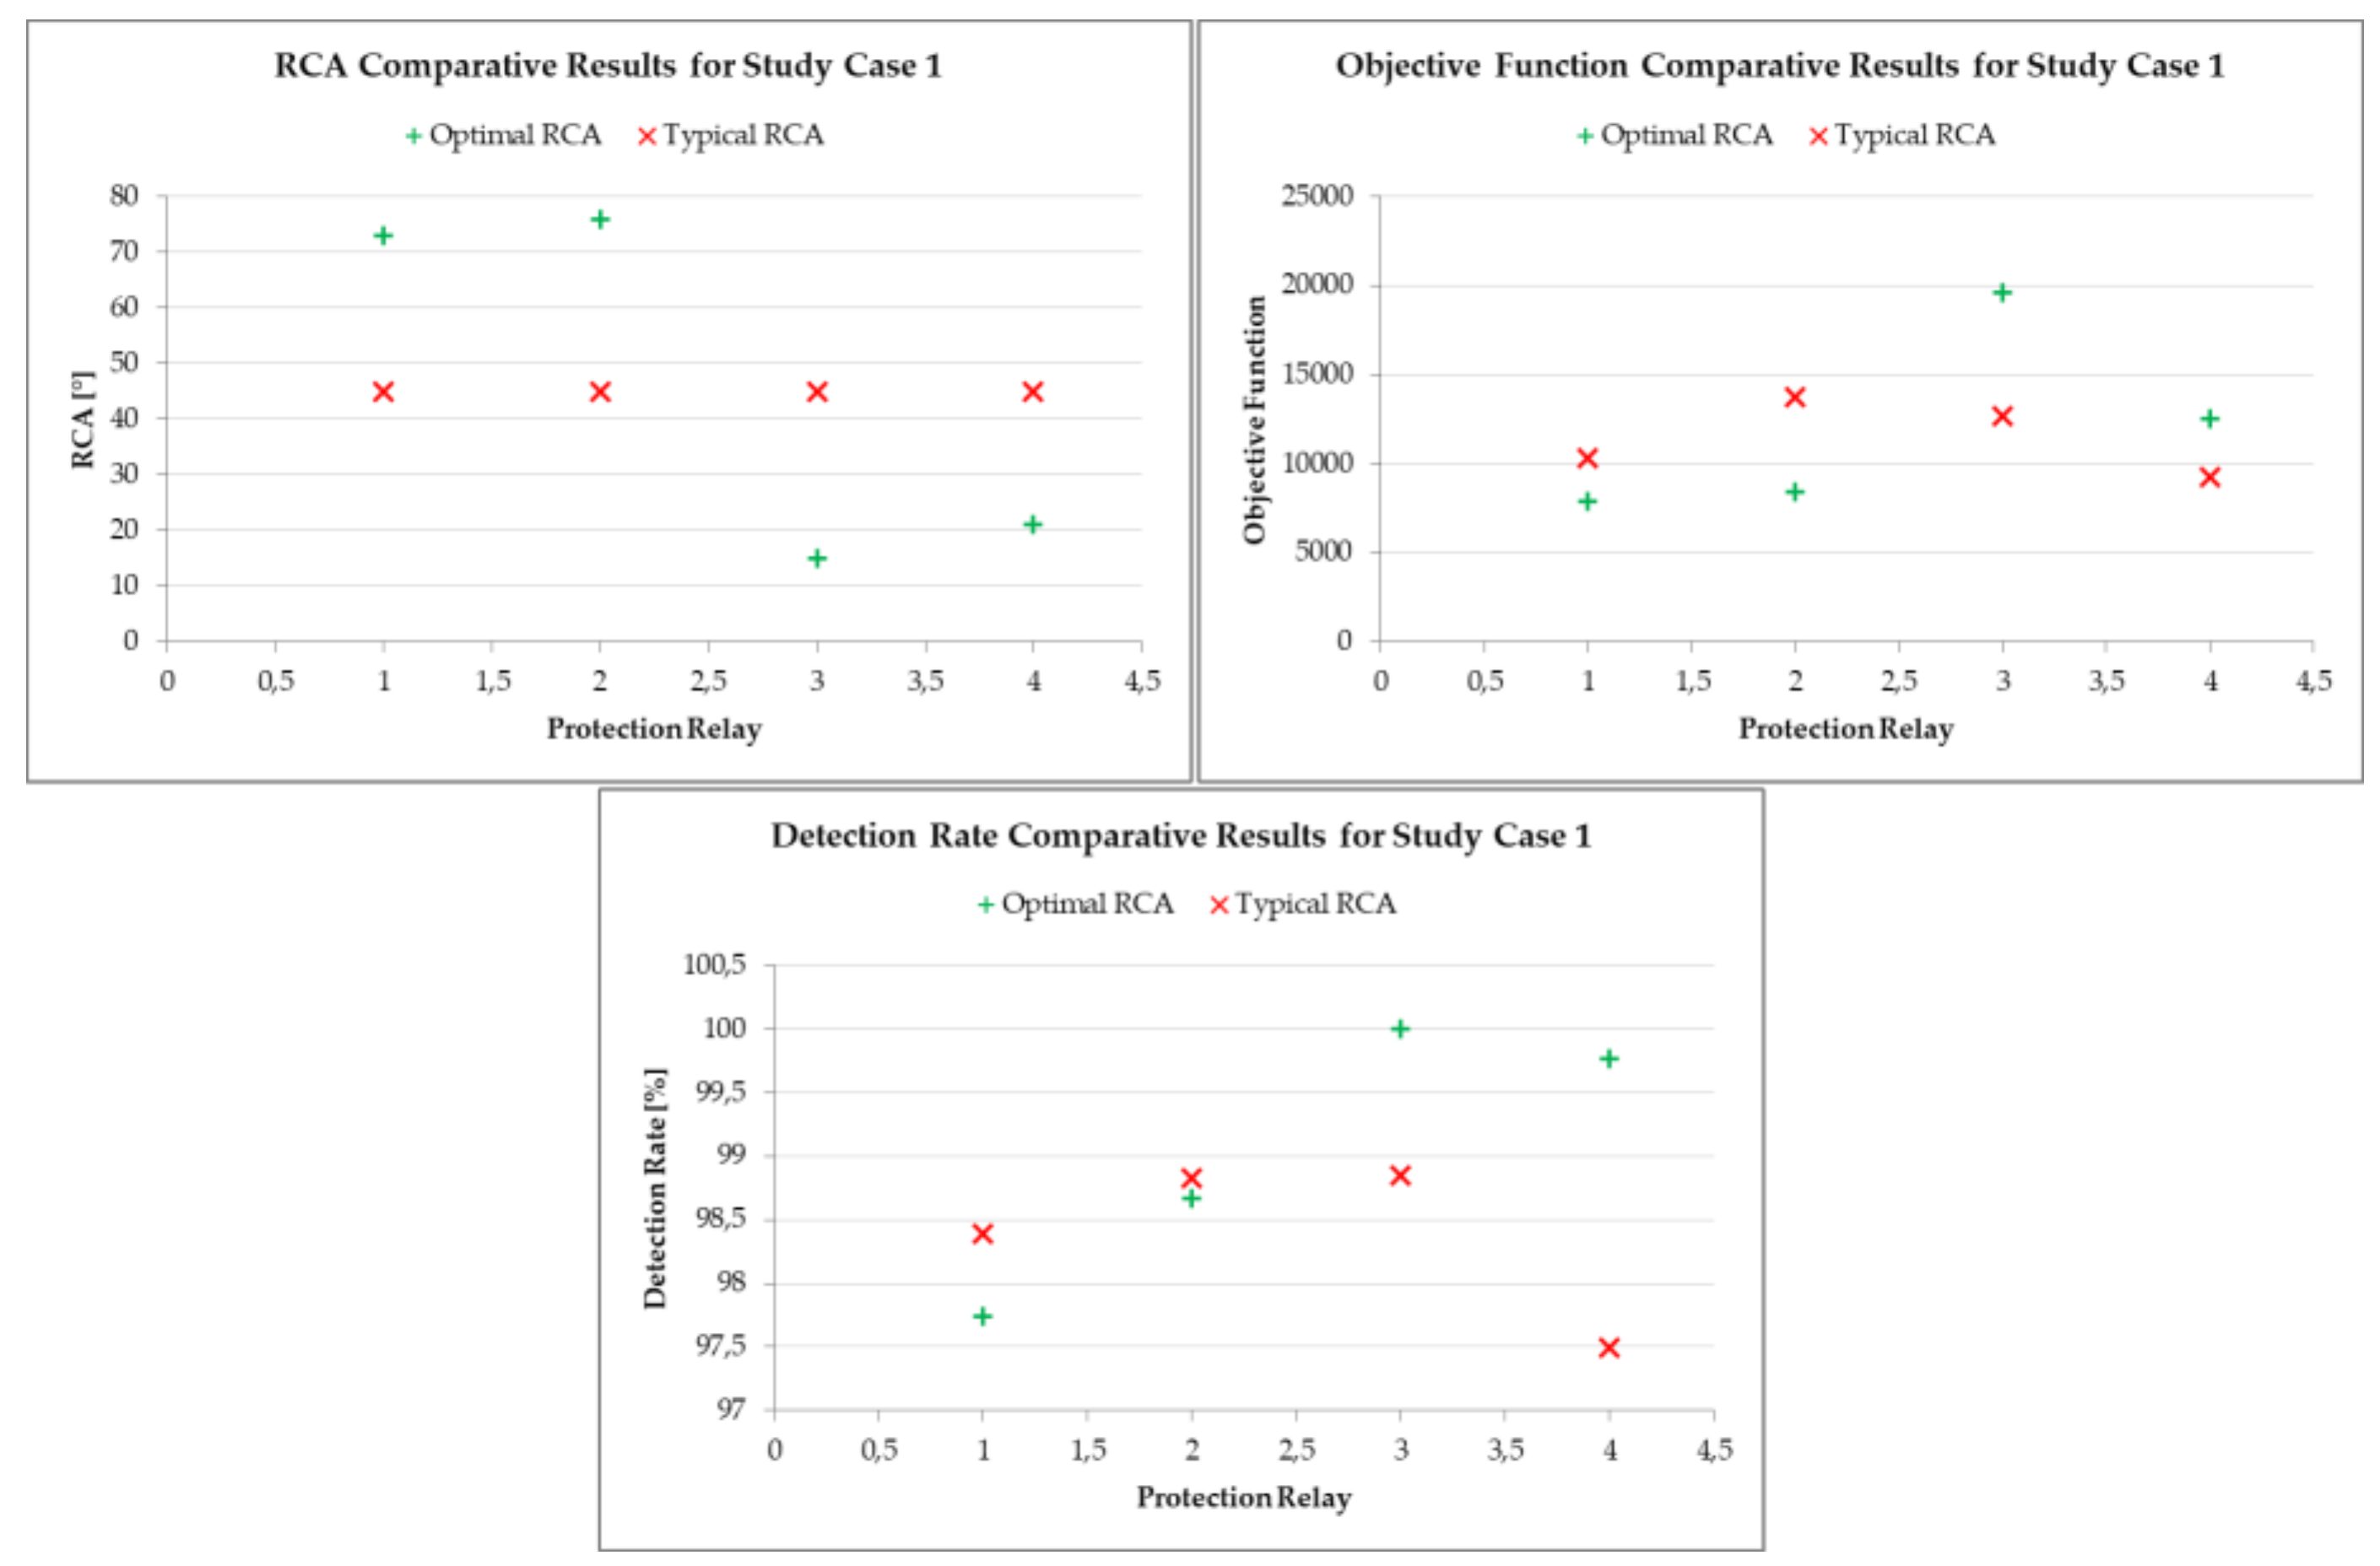
All the relays in this study case are state of the art SIEMENS SIPROTEC 5 relays.
Figure 10 shows the comparative results for the application of both optimal and typical
RCA of the ANSI 67 element, and the performance of both approaches using the proposed methodology. For relays 1 and 2, the use of the optimal
RCA shows better performance in the objective function but lower detection rate when compared with the use of typical settings, whereas for relays 3 and 4, the
RCA has been modified according to the guidelines described in
Section 2.5 to improve the detection rate, so that the opposite occurs when compared with relays 1 and 2, as the performance of the proposed
RCA is better in detection rate but has lower performance on the objective function. However, both cases were deemed as more appropriate when using the proposed
RCA setting instead of the typical value, since for relays 1 and 2, the slightly improved detection rate brings a set of phasors closed to the directional border, thus increasing the risk of incorrect operation during current transformer saturation or other external measurement errors; for relays 3 and 4, the observed variation of
was lower than the operating region coverage for faults within the protected line and in order to exclude the reverse faults with incorrect direction determination that would have been caused by the application of the optimal or typical
RCA.
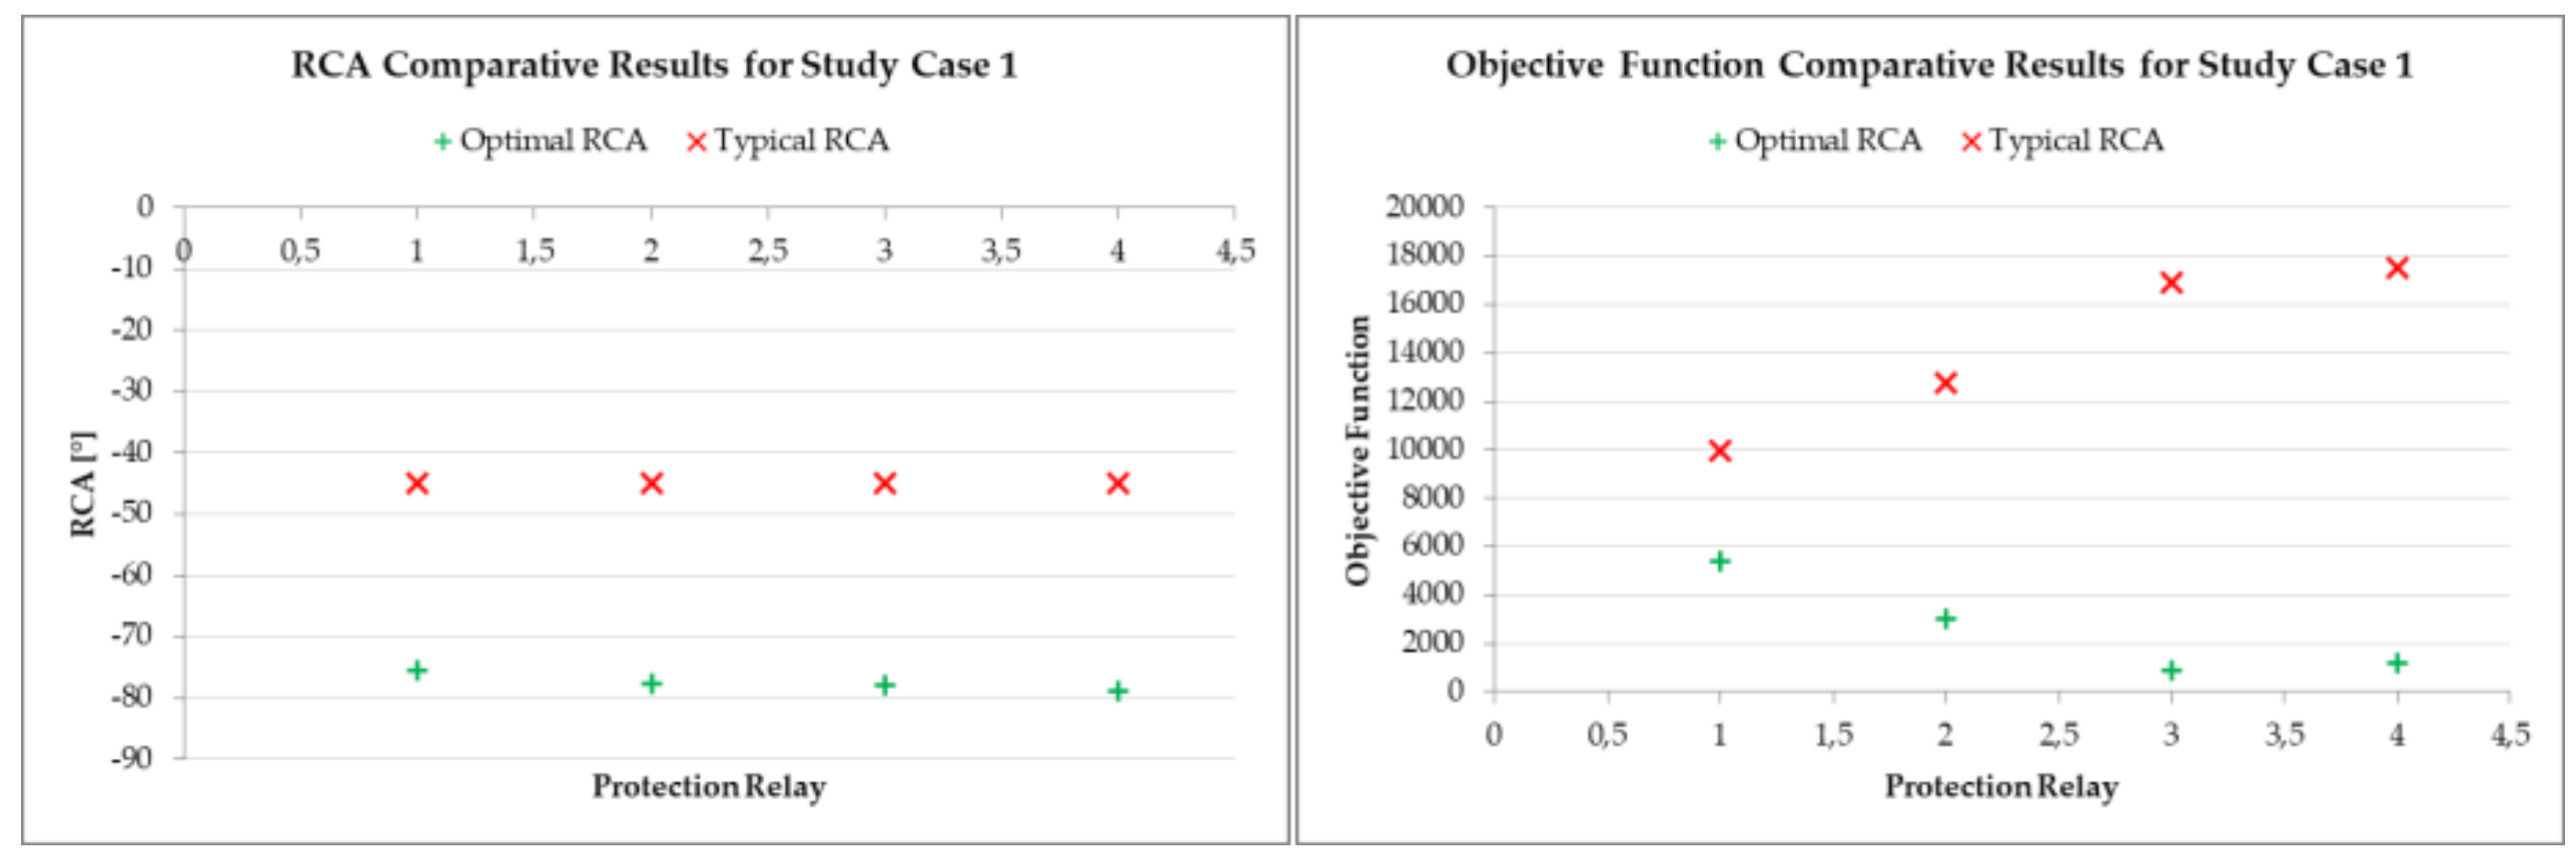
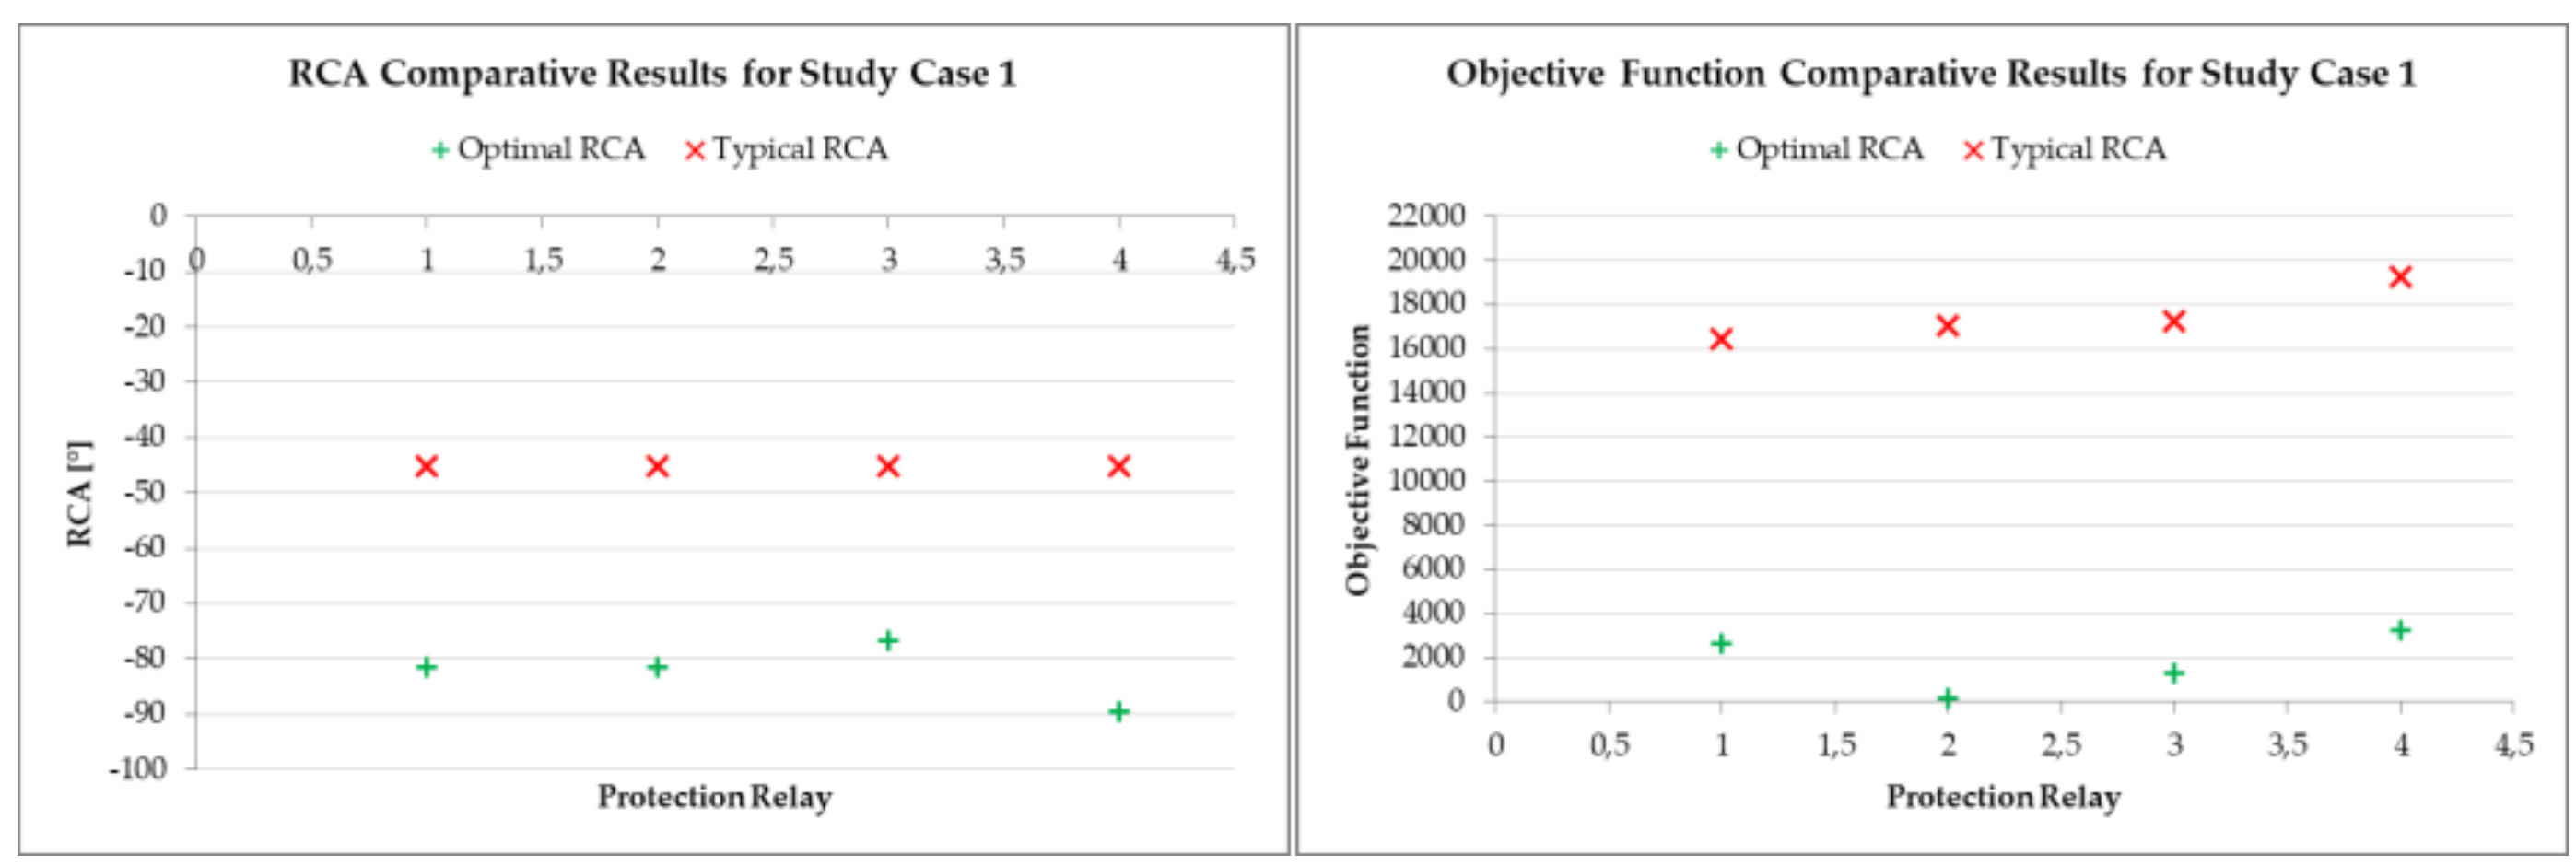
Figure 11 and
Figure 12 show the comparative results for the application of both optimal and typical
RCA of the ANSI 67N element, and the performance of both approaches using the proposed methodology, for the polarization with both zero-sequence and negative-sequence quantities. For both polarization sequences it is clear the higher performance of the optimal
RCA over the typical in terms of the objective function, since the detection rate is always 100% for all the evaluated cases. It is also clear which sequence is most suitable to polarize the ANSI 67N element for every relay.
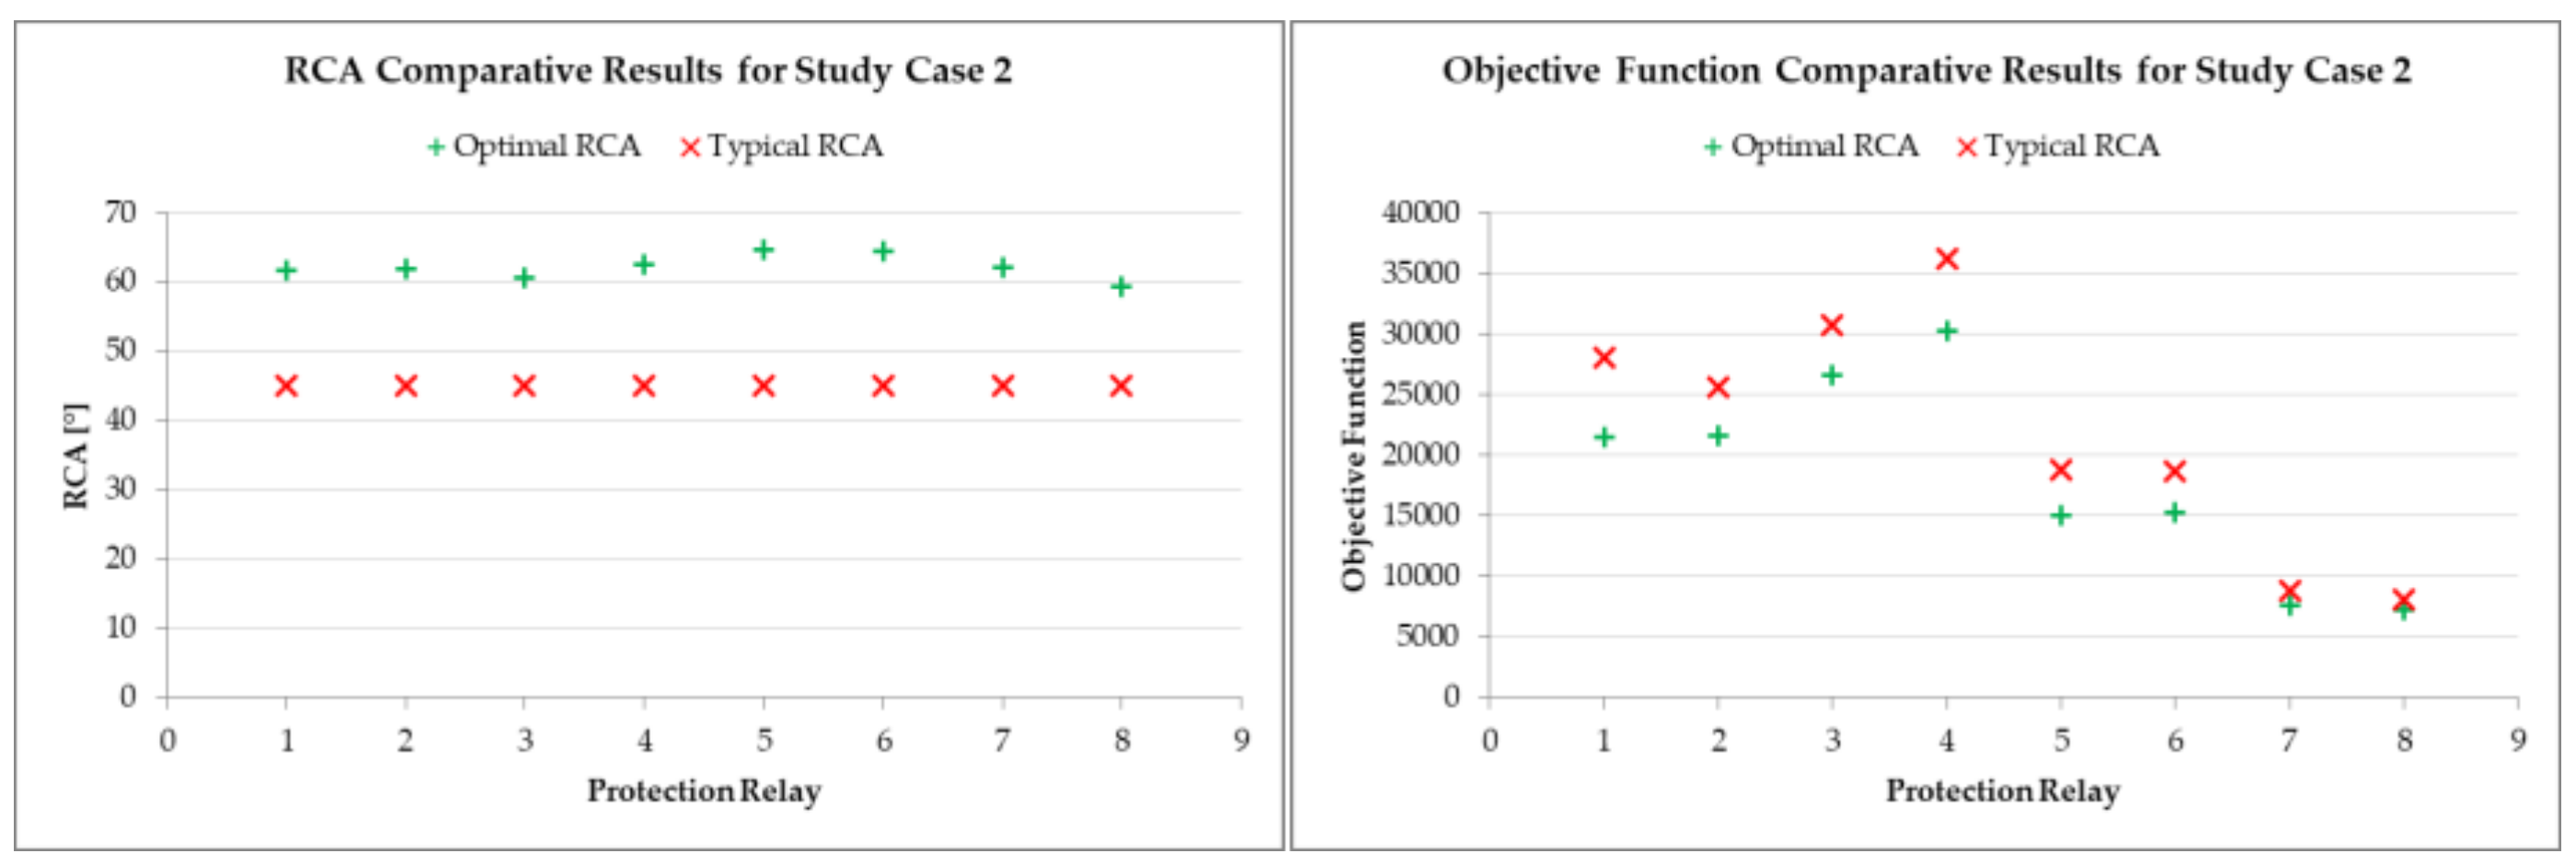
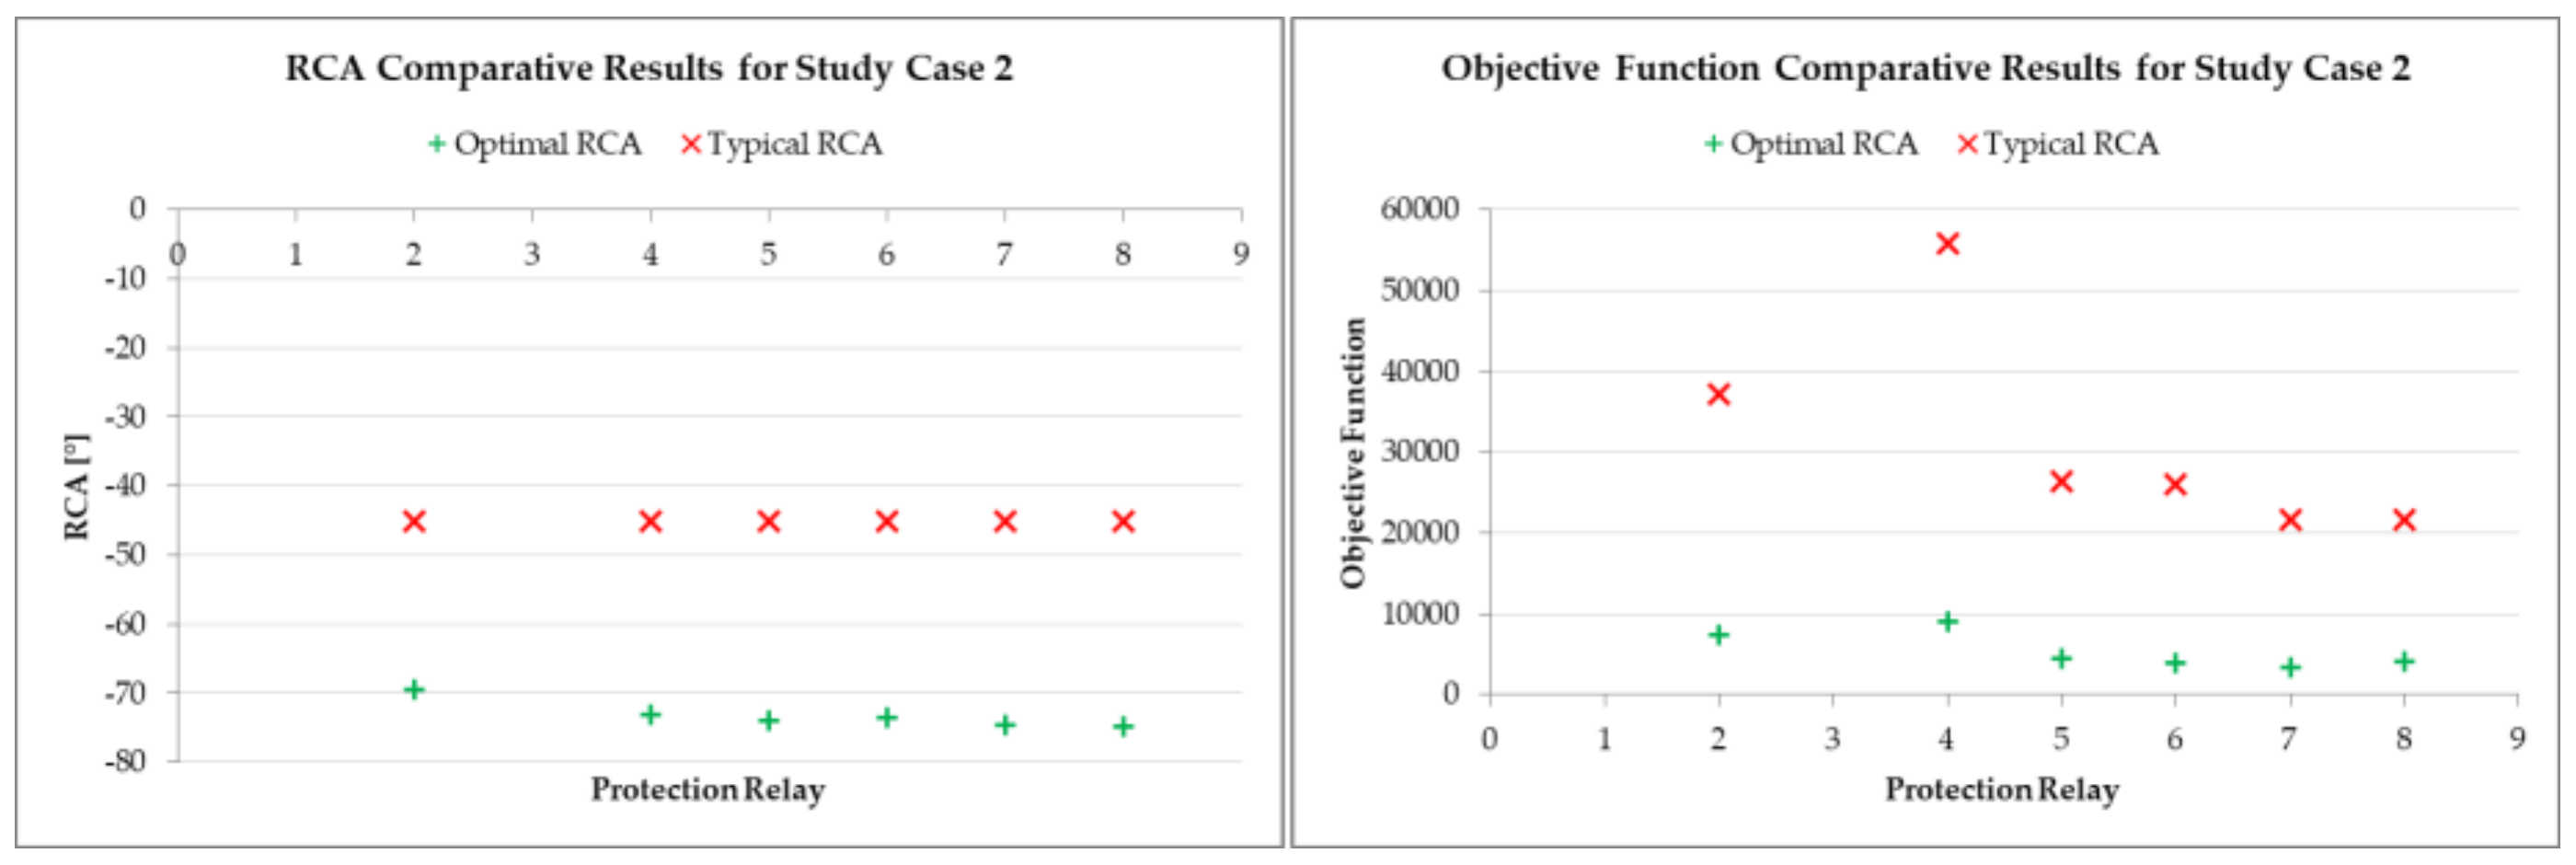
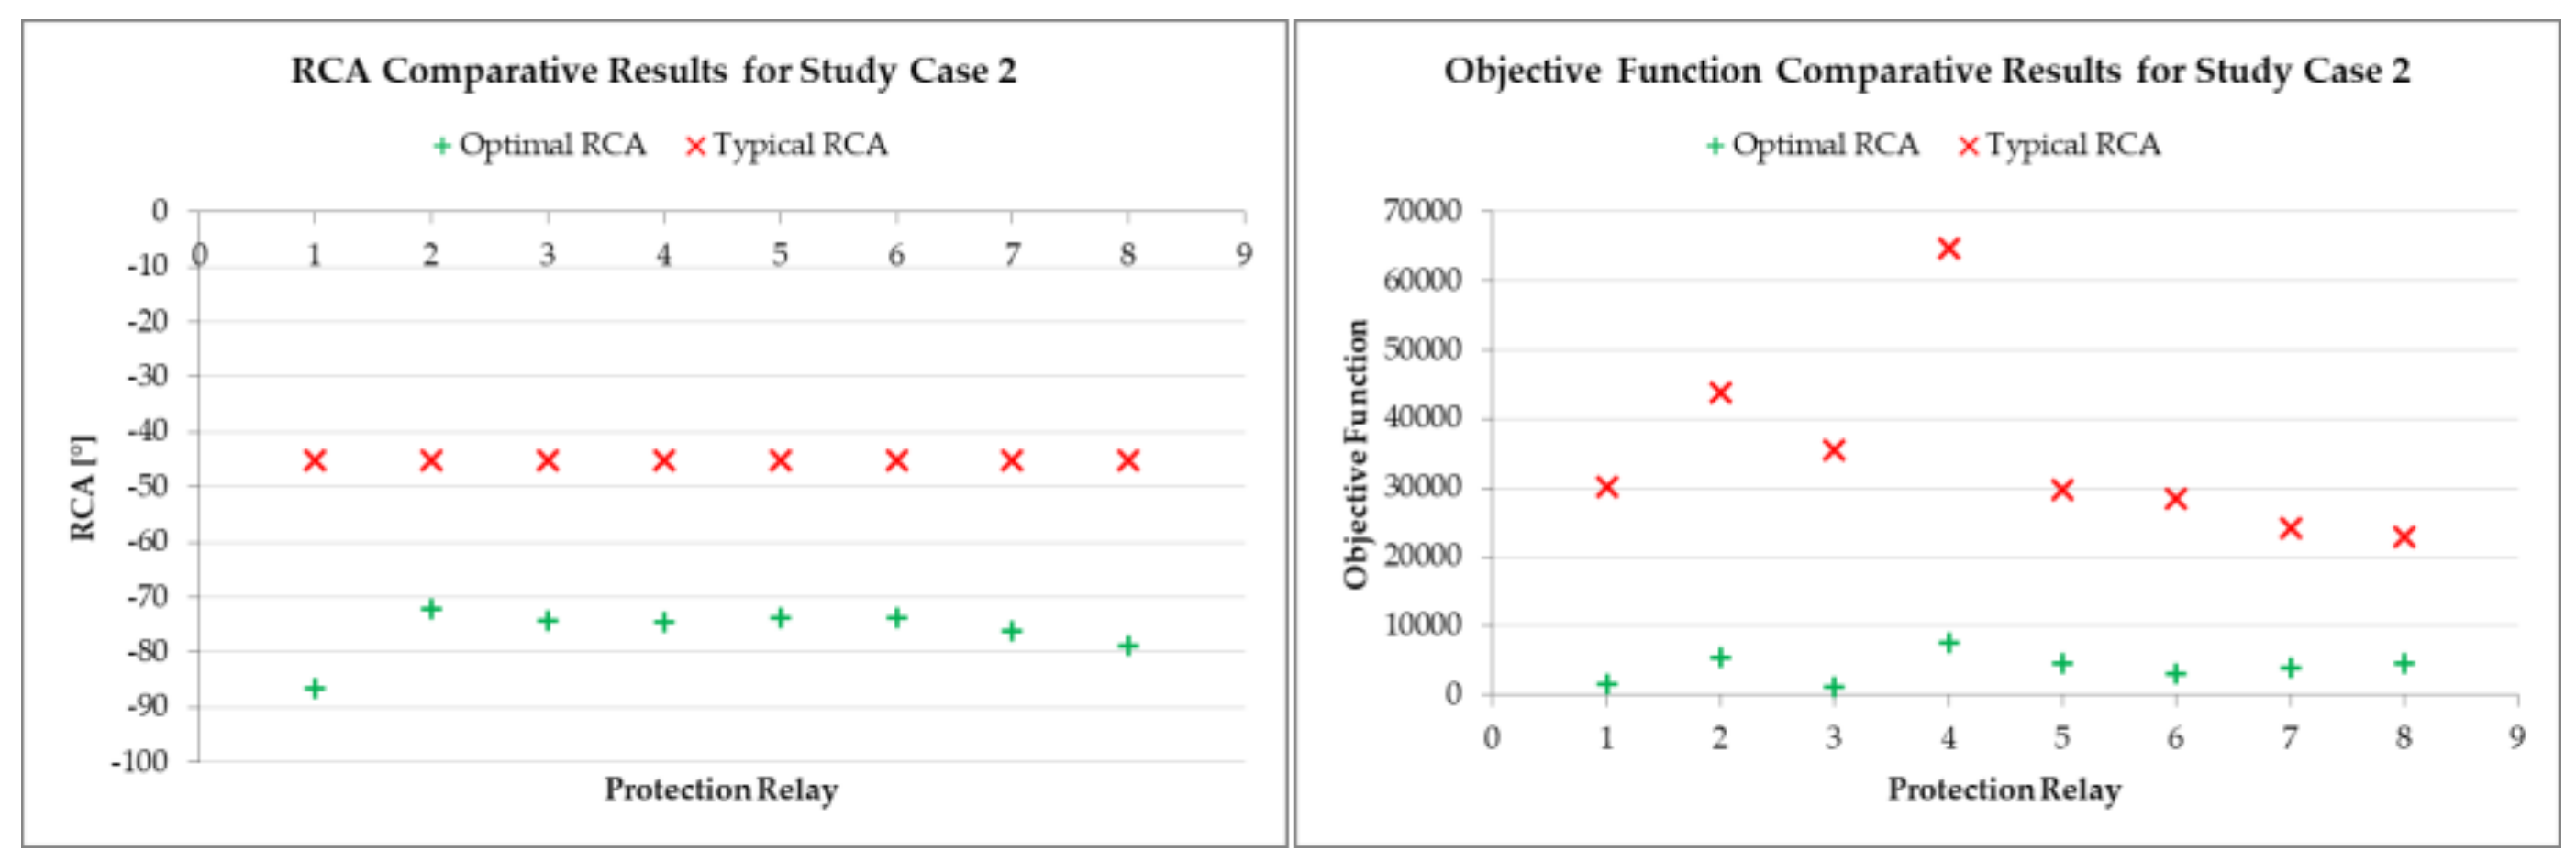
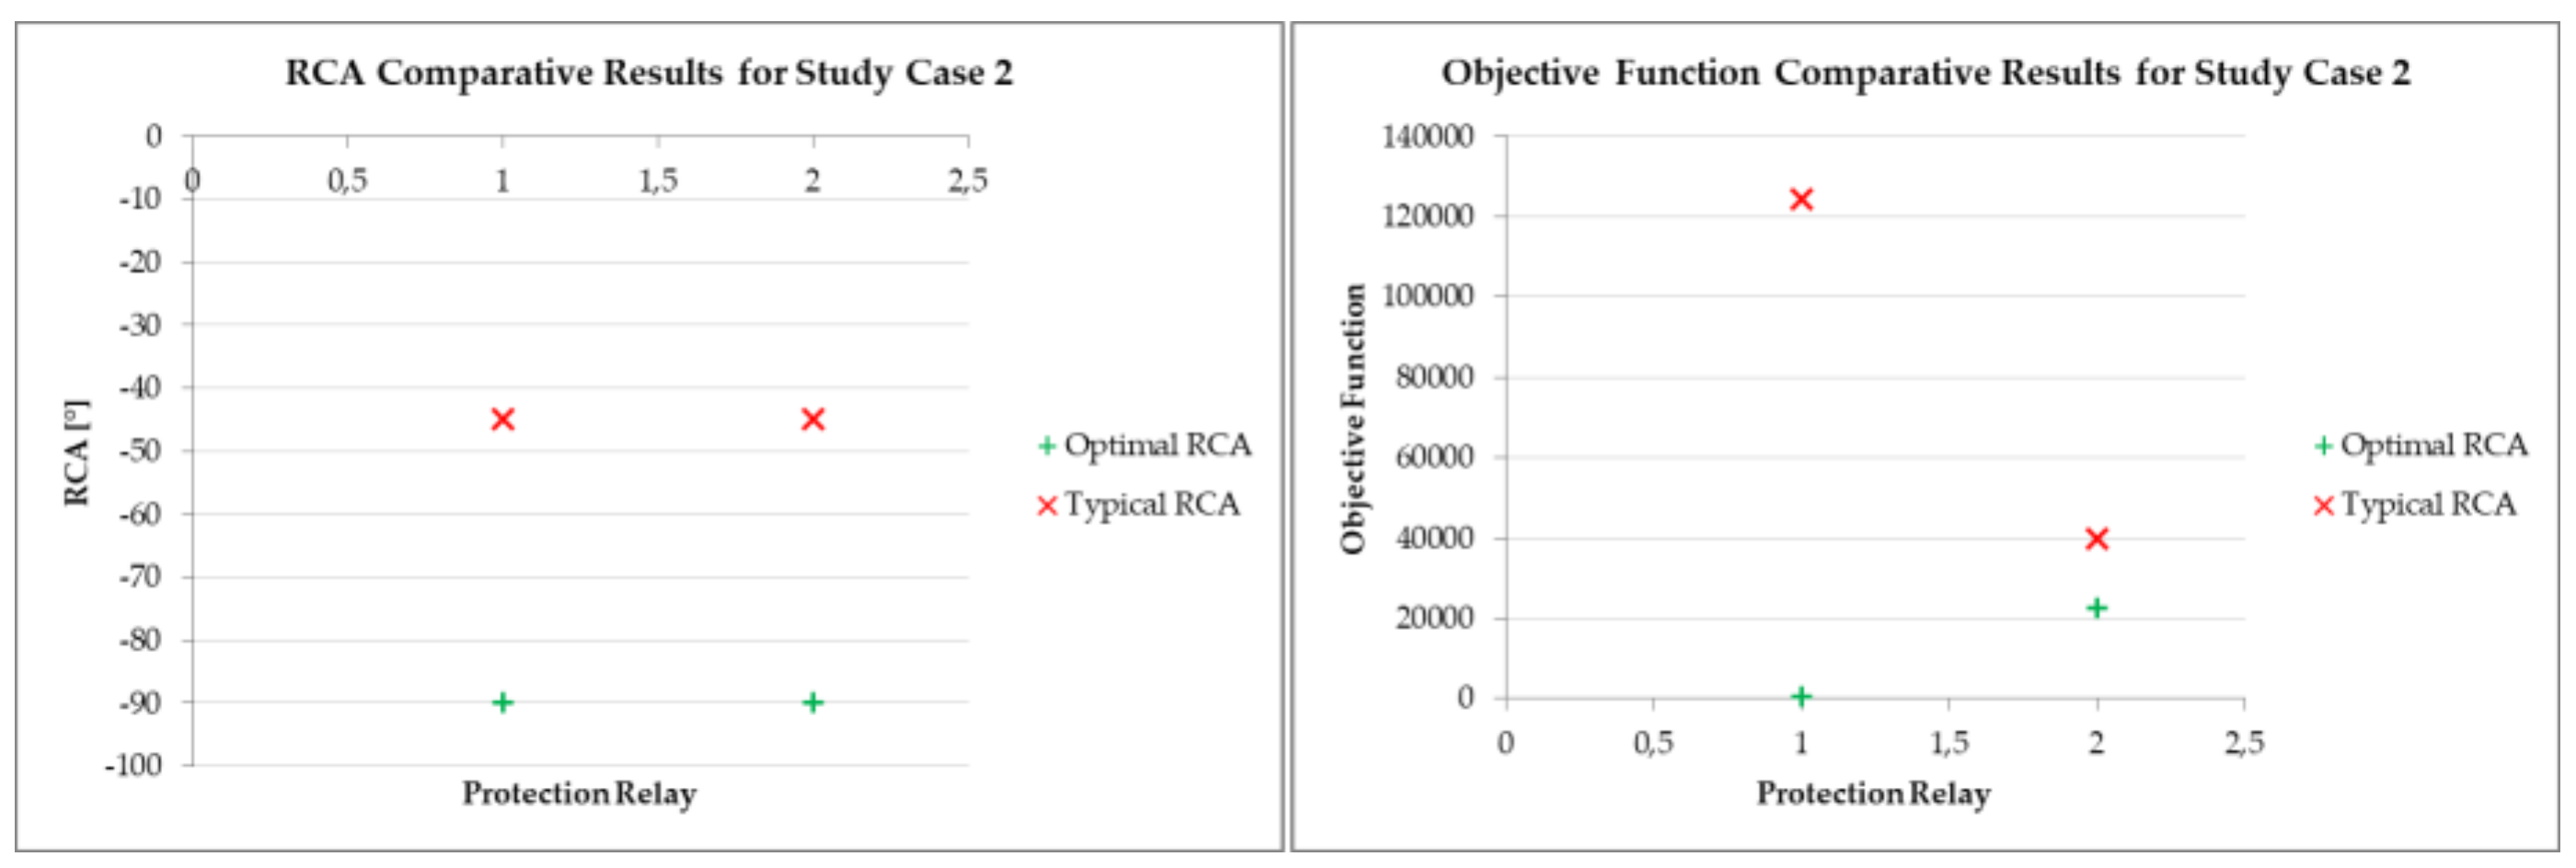
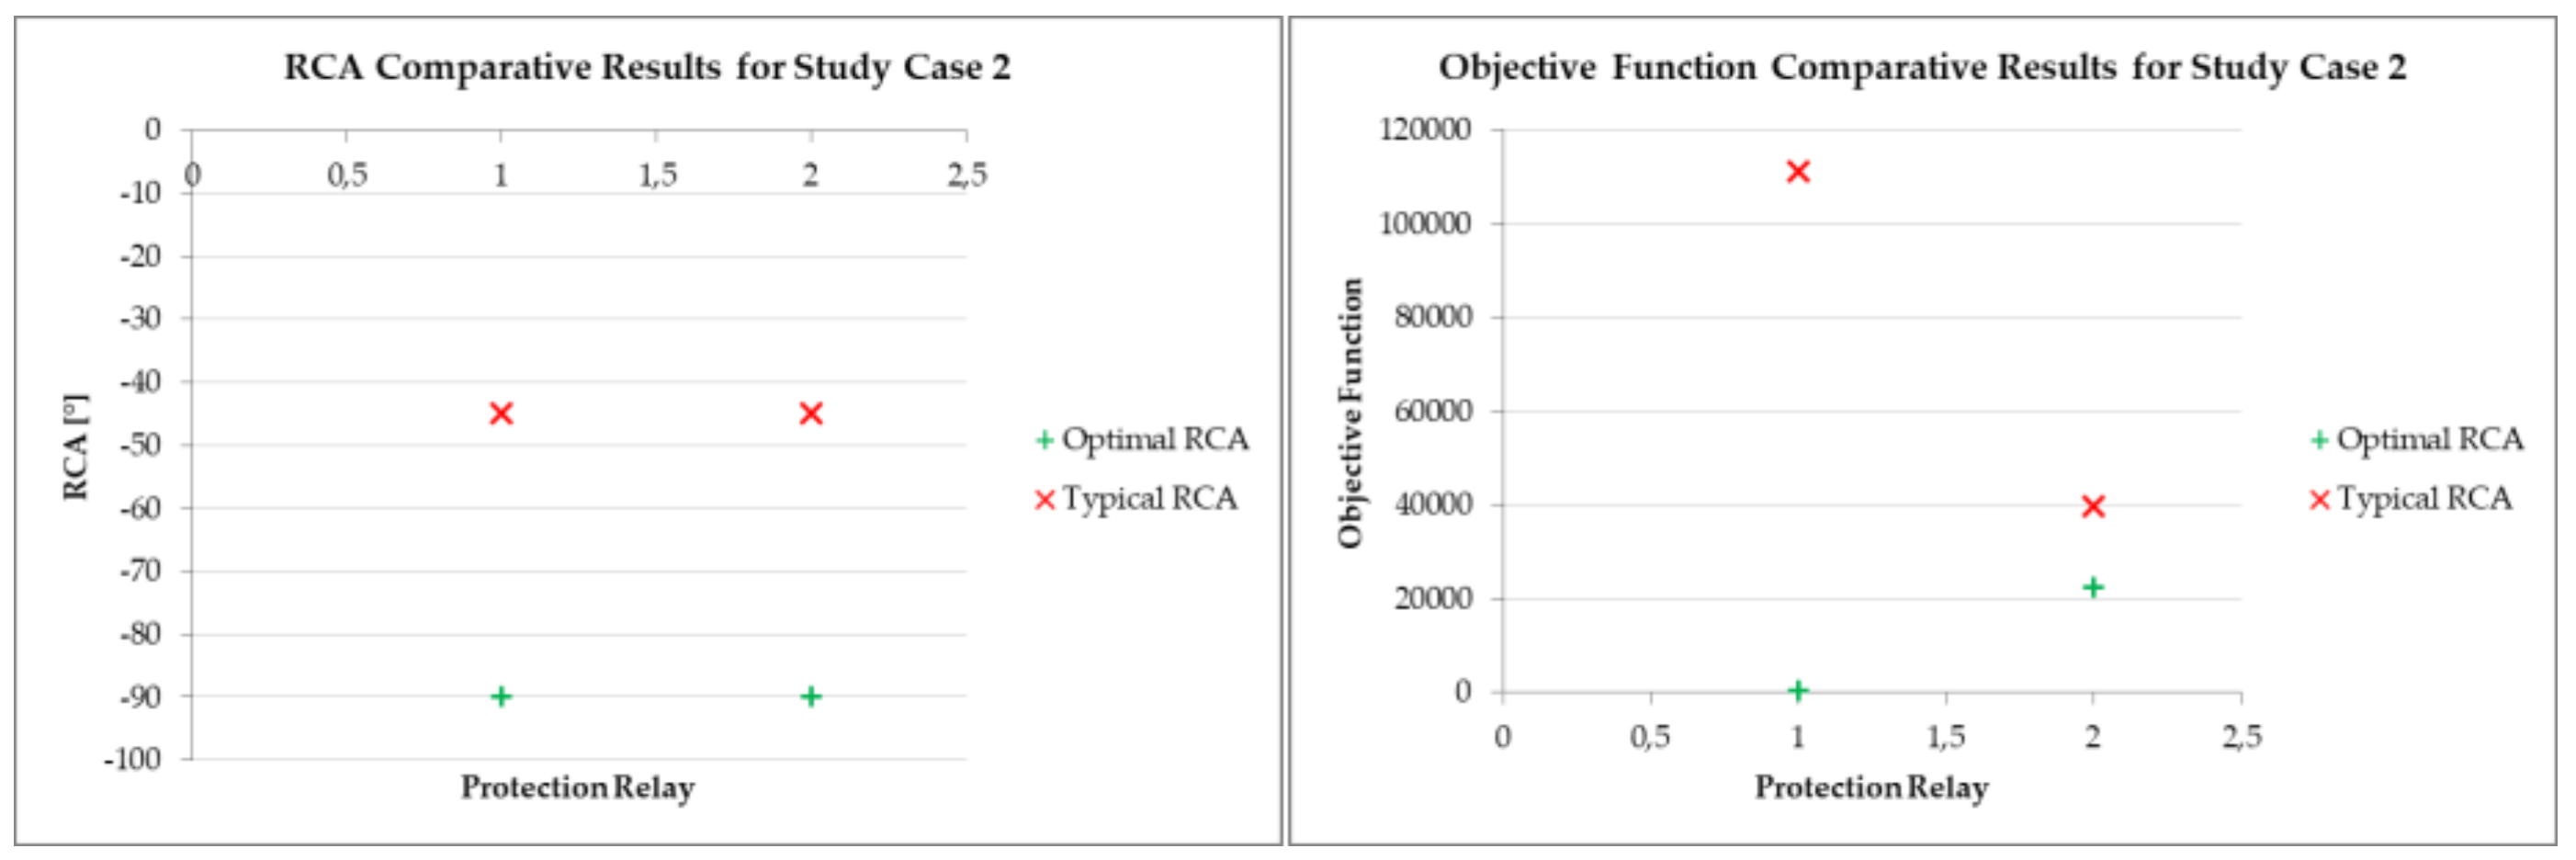
3.2.2. Study Case 2
The results of the Study Case 2 are shown in
Figure 13 for the ANSI 67 element,
Figure 14 for the ANSI 67N element polarized with negative-sequence quantities, and in
Figure 15 for the ANSI 67N element polarized with zero-sequence quantities. Relays 1 and 3 are GE SR760 relays, which only have the possibility to use zero-sequence as polarization quantities; the other relays are SIEMENS SIPROTEC 5 relays. For all the results, it is possible to observe the improvement in the performance of the directional overcurrent protection elements when applying the proposed methodology when using typical settings.
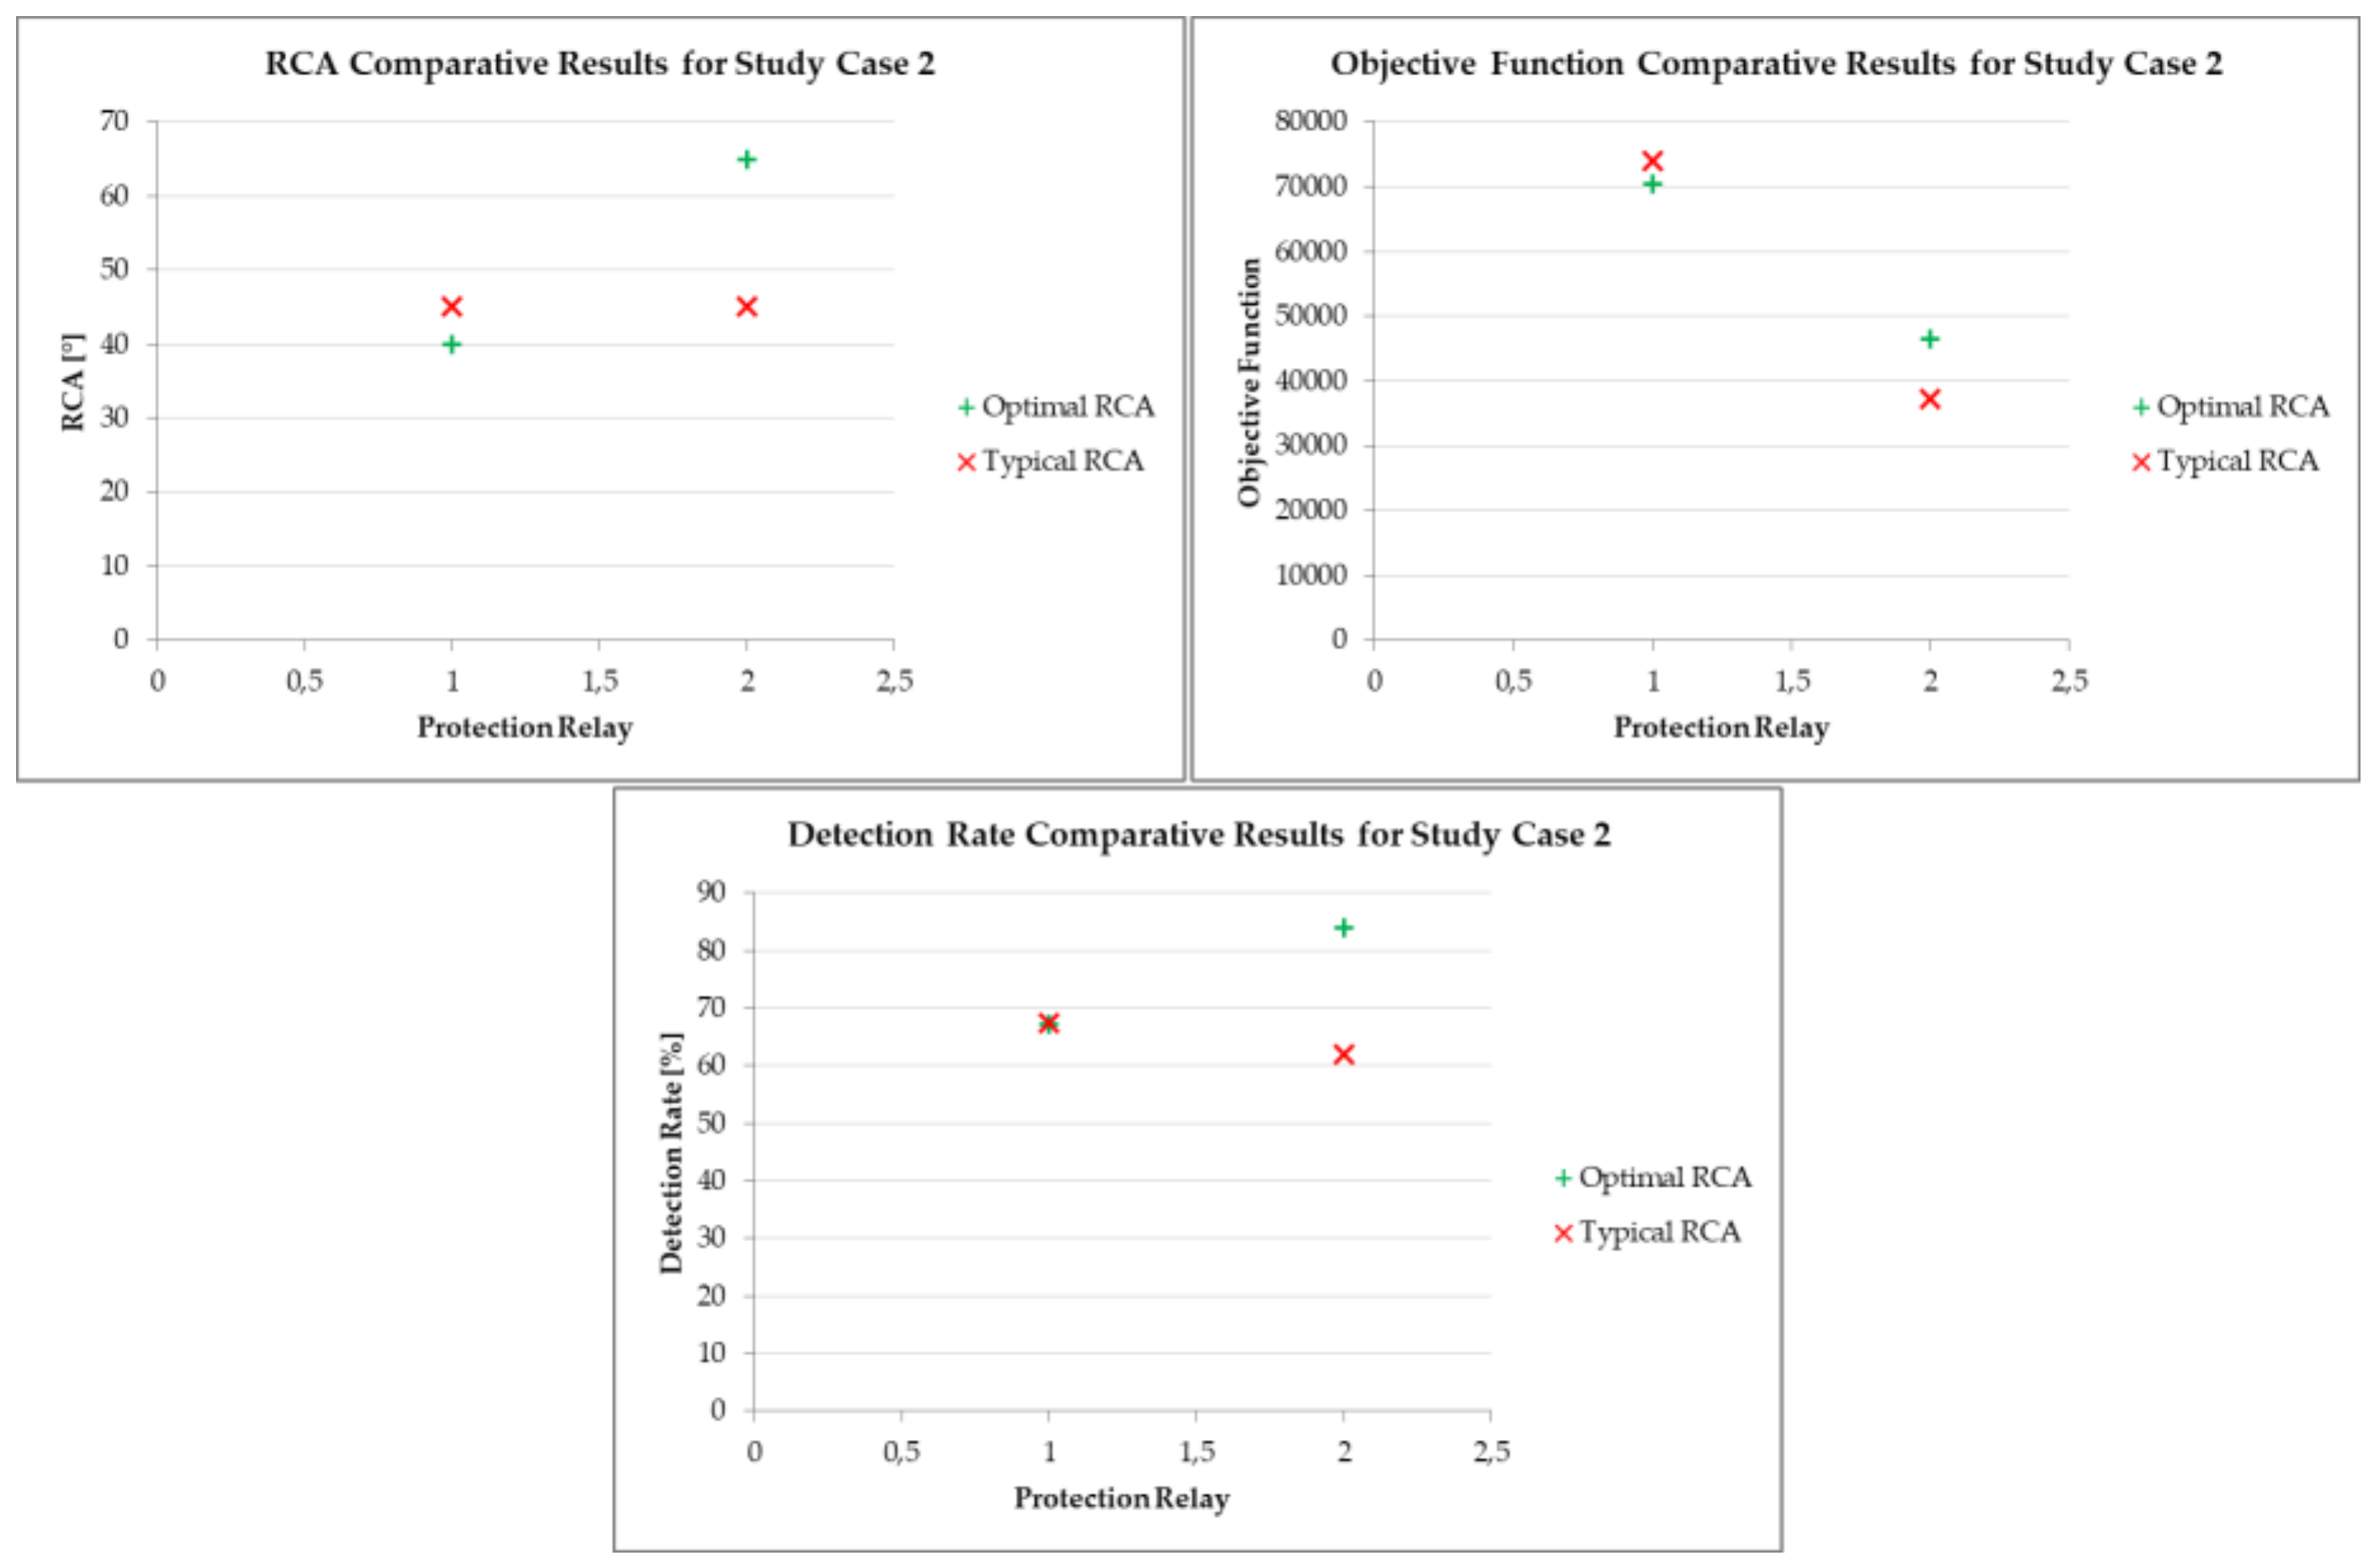
3.2.3. Study Case 3
The results of the Study Case 3 are shown in
Figure 16 for the ANSI 67 element,
Figure 17 for the ANSI 67N element polarized with negative-sequence quantities, and in
Figure 18 for the ANSI 67N element polarized with zero-sequence quantities. Both relays are ABB RED670, which have a limited setting range between 40° and 65° for the ANSI 67 element.
The results outlined in
Figure 16 show that, for Protection Relay 1, the optimal
RCA has a slightly improved performance over the typical
RCA, although due to the limited setting range of the
RCA in the ABB RED670 relays there is a major difference compared to the relays in the first two study cases. For Protection Relay 2, the
RCA was modified from its optimal value, according to the guidelines described in
Section 2.5, in order to improve the detection rate. As a result, the performance in the objective function is sacrificed in order to increase the detection rate, where once again the performance of the proposed methodology has proven superior to the application of typical settings, which in turn would have left the presented direction determination issues unseen, since the detection rate, even after being improved through the recalculation of the
RCA according to Equation (4), is below 90%, which means that a considerable amount of faults will produce incorrect direction determination in the ANSI 67 element. As a result, the analysis performed on Protection Relay 1 and 2 for the ANSI 67 element showed that both relays will present selective operation even for faults detected in the opposite direction, given the protection schemes used in the faulted elements producing these issues.
The results presented in
Figure 17 and
Figure 18 for the ANSI 67N element demonstrate, once again, the higher performance of the optimal
RCA over the typical
RCA.
4. Conclusions
An alternative methodology for the calculation and verification of the settings defining the performance of the direction determination characteristic in directional overcurrent elements has been presented in detail, demonstrating its advantages over the traditional methods for the calculation and verification of such settings, and adding theoretical background to support the performance analysis of these protection elements through the development of a short-circuit sensitivity analysis, from which a characterization of the main factors affecting such performance can be obtained. Then, the problem for obtaining the settings is formulated based on the variables introduced to evaluate the quality of the proposed solution, which includes solving a simple minimization problem for obtaining the RCA and the value of the objective function as one of the variables to determine the performance of the direction determination algorithm; then, the starting and detection rates are calculated, based on the RCA obtained, and from these values, it is possible to explore improvements in the detection rate and to identify the most suitable variables to polarize the directional ground overcurrent elements.
With the application of the proposed methodology, it will be possible to anticipate any potential risk of malfunction of the chosen polarization technique and the direction determination characteristic defined from the calculated settings, which is entirely based on the specific issues imposed by the system where the directional relays are applied, and not on general guidelines or typical settings, which makes the results obtained from the proposed methodology much more reliable and trackable. It is important to emphasize that the reliability of the obtained solutions is entirely dependent on the performance of a complete and detailed short-circuit sensitivity analysis, for which specific guidelines and recommendations have been included in this paper, in relation to the main factors affecting the performance of the direction determination algorithms.
The solutions obtained from the application of the described methodology have been compared with the application of typical settings, from where significant advantages were identified on the application of the proposed methodology, as well as risks involving the application of generalized typical values and general guidelines for the selection of the settings controlling the direction determination characteristic in different direction determination algorithms, as presented by state of the art protection relays from different manufacturers. These results were presented for a sample transmission system and for three different real application cases, and for all of them, a superior performance of the direction determination characteristic was obtained when using the settings calculated following the described methodology. Since the proposed solution is entirely based on the specific aspects affecting the general performance of directional relays using the polarization methods outlined, which are used by most relay manufacturers, the application of the method is general for any given transmission or distribution system where directional relays are used.
The proposed methodology is also valid for the direction determination characteristics used by distance protection elements, as a separate condition for processing the calculated impedance loops determining the operation of these protection elements, as these are also based on the definition of borders to limit the forward and reverse set zones, based on the same polarization techniques discussed in this paper for the directional overcurrent elements.
In order to improve the criteria for identifying the security required by the direction determination characteristic, when modifying the RCA obtained through the solution of the optimization problem based on the results of the short-circuit sensitivity analysis, it is necessary to study the impact of current transformer saturation on the phase angle of the operating current used by the direction determination characteristic. This remains an open problem for a future work complimenting the guidelines for the application of the proposed methodology.


