Article

Comparative Analysis of Technical Route and Market Development for Light-Duty PHEV in China and the US

1
State Key Laboratory of Automotive Safety and Energy, School of Vehicle and Mobility, Tsinghua University, Beijing 100084, China
2
School of Mechanical, Electronic and Control Engineering, Beijing Jiaotong University, Beijing 100044, China
3
School of Economics and Management, Beijing Jiaotong University, Beijing 100044, China
*
Author to whom correspondence should be addressed.
Energies 2019, 12(19), 3753; https://doi.org/10.3390/en12193753
Submission received: 25 August 2019 / Revised: 28 September 2019 / Accepted: 30 September 2019 / Published: 30 September 2019
(This article belongs to the Section E: Electric Vehicles)

Abstract

:
China and the US have become the world’s largest plug-in hybrid electric vehicle (PHEV) markets. Powertrain architecture is the framework of PHEV technology which represents its technical route. The research on the market development and technical route of Chinese and American PHEV is helpful to grasp the internal law of the global PHEV market and technology situation, and thus is significant to lay out a development strategy and technical route but has not been sufficiently studied. Therefore, an evaluation method of three dimensions combining market sales, powertrain architectures and performance indexes was proposed for comparative analysis, and PHEV mainstream architectures were put forward. Besides, qualitative evaluation levels from nine dimensions were built for architecture analysis, and fuel consumption to curb weight (FC2CW) as an indicator was introduced for economy evaluation. Some conclusions can be drawn: (a) The most mainstream architecture in sales volume is four-wheel drive (4WD) Bridge, and that in models’ amount is P2 in China, while those respectively are PS and P2 in the US. This reflects that a difference exists between the choice of the consumers and that of the automakers, and another difference also exists between the two countries. (b) With the phasing down of subsidies, the single-motor parallel architecture may become the first choice of China’s next technical route, while the 4WD Bridge will still be the main architecture for sports utility vehicles (SUVs) or sports car. (c) Among the models of the top five sales, the types and sales of SUVs in China are significantly more, however, the fuel economy rankings of theirs in the US are relatively better. (d) It is difficult to distinguish which architecture has the absolute best economy, but the fuel economy of the series type in the two markets is not very good.

Graphical Abstract

1. Introduction

Plug-in hybrid electric vehicles (PHEVs) can take advantage of both external electrical energy and hybrid powertrain to reduce fuel consumption (FC). It is recognized as one of the most effective energy-saving and emission reduction schemes [1,2]. Currently in China, new energy vehicles (NEVs) include battery electric vehicles (BEVs), PHEVs and fuel cell electric vehicles (FCEVs) [3,4]. The range-extended electric vehicle (REEV) belongs to a kind of PHEVs since it also has a pluggable hybrid powertrain. The sales of FCEVs could almost be negligible so far. Therefore, the discussion on NEVs in this paper does not cover FCEVs. This paper focuses on light-duty PHEVs, including sedans and sports utility vehicles (SUVs).
PHEVs and BEVs together, also called plug-in electric vehicles (PEVs), have been energetically developed by many countries for the reduction of oil consumption and the construction of national energy security [5]. Before 2011, the development of PEVs was very slow, basically in the stage of technology accumulation. Since 2011, the development of PEVs of many countries has been able to claim to be market-scale. Based on this, the market share data can only just be found. Subsequently, technological breakthrough, industrial chain improvement, product richness and policy-supporting interact with each other, and finally, reflect on the increasing market production and sales. By 2018, China had been the world’s largest producer and seller of NEVs for four consecutive years [6]. The sales of NEVs in China and the US accounted for more than 70% of the global NEV market in 2018 [7], and China and the US are the two largest automobile production and sales countries in the world. It can be said that the analysis on the NEVs of China and the US market development and technology has extensive reference significance for all countries in the world [8], which is one of the reasons for this research.
The research about the NEV market mainly focuses on analysis of market penetration [9], incentive policies [10], NEVs’ cost of ownership [11] and full life-cycle cost [12,13], as well as consumer preferences [14]. In a nutshell, the analysis of market conditions, market-related policies, costs and choices of market subjects. The market penetration or market share is often used to characterize the development situation of the NEV market. For example, Du et al. [1] analyzed the market penetration rate of PEVs, which indicate the dominant position of national policies on the developed process, and found that the development of charging infrastructure cannot keep up with the market penetration. Gnann et al. [15] studied 40 market diffusion models, and pointed out that the main influencing factors in the US are purchasing price and operating cost, while those of the energy price and charging infrastructure in Germany Policies play a key role in the initial market of NEVs. For instance, Rietmann et al. [16] investigated the impact of incentive policies in 20 countries on the market share of electric vehicles (EVs), and established a covariance model indicating that various incentive policies have positive impacts on the market shares of EVs. In the research on the impacts of policies on the NEV market, the policy research in China, the US, Japan and European countries are hotspots [17]. These policies can be classified into financial subsidy policies, infrastructure promotion policies, and R&D investments [18]. Specific measures such as subsidies, taxes, investments, and infrastructure pricing standards still need to be continuously optimized [19]. In the research directly targeting the NEV market subject, the cost and consumer behavior are the main focuses, including establishing a total cost of ownership (TCO) model to measure the cost of different NEVs [20], establishing a cost-effectiveness and energy consumption model to evaluate the potential development direction [21], and considering the preferences of consumers. Like other emerging industries, the initial development of the NEV market faces many difficulties, such as high battery cost [22], inadequate charging infrastructure, short driving range, and even local protectionism [23], etc. The situation of NEVs today is basically formed and dominated by stimulus factors such as monetary incentives, traffic regulations, and charging infrastructure incentives. In the above research on the NEV market, few studies have analyzed the NEV market combined with technology, which makes the researches more biased towards the market situation and out of the technical situation in the market. Although there was a small amount of literature such as References [1,6] which explored technical indicators, they were all limited to the statistics of basic vehicle parameters, such as the maximum speed. They had not provided an in-depth analysis for the complicated and diverse PHEV technical routes in combination with market conditions, which is one of the problems to be solved in this paper.
Among the PHEV-related technologies, the architecture design [24,25], component sizing [26] and control strategy [27] are the core technologies. The design and selection of the architecture is the overall framework of other PHEV technologies. Therefore, the architecture of PHEV represents its technical route and is the primary problem in the development of a powertrain [28]. Unlike the concise powertrain of traditional cars and BEVs, there are many different types of hybrid systems that lead to different operation modes and energy flows, which ultimately lead to different powertrains’ performance and cost. The three types of architectures: Series, parallel, and compound, which are divided according to the connection form of components, have been analyzed in plenty of studies [29]. However, this classification was not detailed enough to describe the specific powertrain structure. A classification based on the degree of hybridization is also a common method. The performance of different architectures were compared and analyzed among micro, mild, full and plug-in hybrid powertrains [30], while this classification could only describe the ratio of electric power to mechanical power, but not visually describe the specific structure. There are a number of studies comparing different variants of a basic architecture in detail. For instance, the power split type was divided into input-split, output-split and compound-split variants [31]. Ngo et al. [32] analyzed the potential 37 parallel architectures. Although these studies about structures are exhaustive, it is difficult to combine analysis with the actual market, and there is also a lack of performance comparison of different detailed architectures in the market. Some researchers have redesigned different architectures for different application scenarios [33,34], or used various kinds of mechanical systems for powertrains [35]. These studies provided new architecture design ideas, however, have not combined with market data for analysis.
Although the hybrid powertrain architectures have vast varieties, the diversity may end up focusing on several leading designs that are best suited [36]. Several typical hybrid systems that have a large market share might finally be the focusing points [37], for instance, Toyota Hybrid System (THS) [38], Honda Intelligent Multi Mode Drive (IMMD) [39], General Motor two modes [40], etc. In these studies of numerous architectures, three problems exist: Firstly, there is a lack of a unified classification method to characterize the specific structure of the hybrid powertrain. In recent years, a method to describe the specific architecture by adopting the position of the motor has appeared, named P0—P4 systems [41,42], which can well represent the specific structural form and are widely used in automobile manufacturers. This paper will draw on such method and expand it. Secondly, few studies have combined the architecture classification with market data and analyzed the mainstream architectures of the market. Although Reference [43] referred to the main architecture, there was still a lack of relevant data to support the analysis. Thus, there was no explanation for how to extract the mainstream architectures [37]. Therefore, the analysis on the architectures needs to be combined with the market data, and the mainstream architectures need to be determined. Thirdly, most of the research has been based on the optimization theory to compare architectures and lacked test performance comparison on the actual market. When comparing analysis, they mainly used the simulation method, maintaining the same dynamic property and all electric range (AER) under the same driving cycle, adopting the global optimization algorithm, and comparing the energy consumption. The global optimization algorithm was always used to eliminate the bias caused by non-optimal control [44]. In order to make up for the lack of comparison of only single objective performance, Reference [45] further optimized multiple objectives and simultaneously optimized the parameters and control strategies to explore performance potential for different architectures. However, these findings were mainly based on the optimization theory. These calculation conditions are difficult to achieve in the actual development process, so differences exist consequentially between the real performance and these theoretical analyses. This paper will use the real PHEV models on the market and the actual measured performance data to analyze the architecture, in order to make up for the theoretical deficiencies.
A summary of the literature review is shown in Table 1. To compensate for the shortcomings of the above research, this paper analyzes the sales of models in the market in China and the US, classifies the detailed architectures, compares the measured performance, proposes the mainstream architectures, and offers deep insight into the technical routes and performance. This research focuses on: (1) in-depth evaluation of the trends and composition characteristics of the PHEV market in China and the US, (2) classification and multi-dimensional evaluation of the detailed architectures, and proposition of the mainstream architectures, and (3) analysis of the architectures and models in combination with performance.
The rest of this paper is organized as follows: Section 2 discusses the development trend and market composition of PHEVs in China and the US. Section 3 shows the detailed PHEV architectures classification based on motor position, and proposes the mainstream architectures of PHEV in the Chinese and American markets. In Section 4, technical performance indicators are analyzed in combination with market data and architectures. The main conclusions and findings are summarized in Section 5.

2. Analysis of the PHEV Market Development

2.1. Development Trend

The oil shock and environmental pollution are common, serious problems that every country needs to face together. The automobile industry is one of the major contributors to oil consumption and pollution emissions [46]. Studies have shown that emissions account for more than 20% of particulate matter (PM) 2.5 emissions [47,48]. In 2018, China’s automobile sales volume was 28.08 million, and the US sold 17.33 million [49]. They are respectively the world’s first and second largest automobile sales markets. Therefore, the development of automobile energy transformation in China and the US plays a decisive role in the world’s energy conservation and emission reduction.
In order to save energy, reduce emissions and protect national energy security, both the Chinese and American governments have formulated development plans and targets for NEVs, provided a large amount of technical research and development funding support, subsidized automobile manufacturers or users, and implemented stricter emissions regulatory restrictions. In the past ten years, the NEV technology has gradually matured and been quickly introduced into the market. It will be an important planning node for China’s NEV development by 2020, and also a symbolic year for the US’s PHEV by 2022. National policies play a critical part in this period [50].
PHEVs and BEVs are the two most important components in the market development of NEVs. PHEVs have long been recognized as the most major transitional product before the breakthrough in battery technology. Figure 1 show the development of sales of PHEVs and NEVs in China and the US from 2011 to 2018. By 2018, sales of PHEVs in China and the US reached 271- and 120-thousand respectively, accounting for 0.97% and 0.69% of all native automobile sales. Over the past eight years, PHEVs sales in China have increased by 105 times, and 16 times in the US. China’s PHEV and NEVs sales have surpassed the US’s in terms of quantity, market share, and growth rate, which is related to the Chinese government’s urgency to build national energy security and to change the dependence on foreign oil, of which the proportion reached 70%. The lines in Figure 1c show that the proportion of PHEV in NEV has been fluctuating. China’s PHEV is always below 40% in NEV, and this proportion is lower than the US’s, because China’s BEVs are developing faster. The sales of A00-class BEVs account for 60% of the total, since the purchase threshold is low, and the subsidies can be attained. PHEVs are mainly A-class and B-class vehicles, and the technical and purchase threshold are high. In addition, the sales of NEVs are mainly in first-tier cities, however, several local governments, such as Beijing, have imposed traffic restrictions and a license plate lottery for PHEVs, which cannot enjoy preferential policy.
It is also worth noting that China’s PHEV sales in 2018 increased by 117%, compared to the previous year. This may be related to the reduction of purchase subsidies for BEVs with 300 km below AER in 2018, which is a challenge for many A00-class models. In addition to technological development of PHEV and the increasing models in the past two years, the proportion of PHEV is on the rise. At present, the subsidies for BEVs in the two countries are based on the battery capacity. With the gradually decrease of the subsidies, the proportion of PHEV to NEV sales in China is likely to increase. However, local government’s policies purchase restrictions and limit line remain the main factors. The development trend and market share of PHEVs and BEVs are still not the natural adjustment of the market, but the result of the orientation of government policy.

2.2. Composition Characteristics

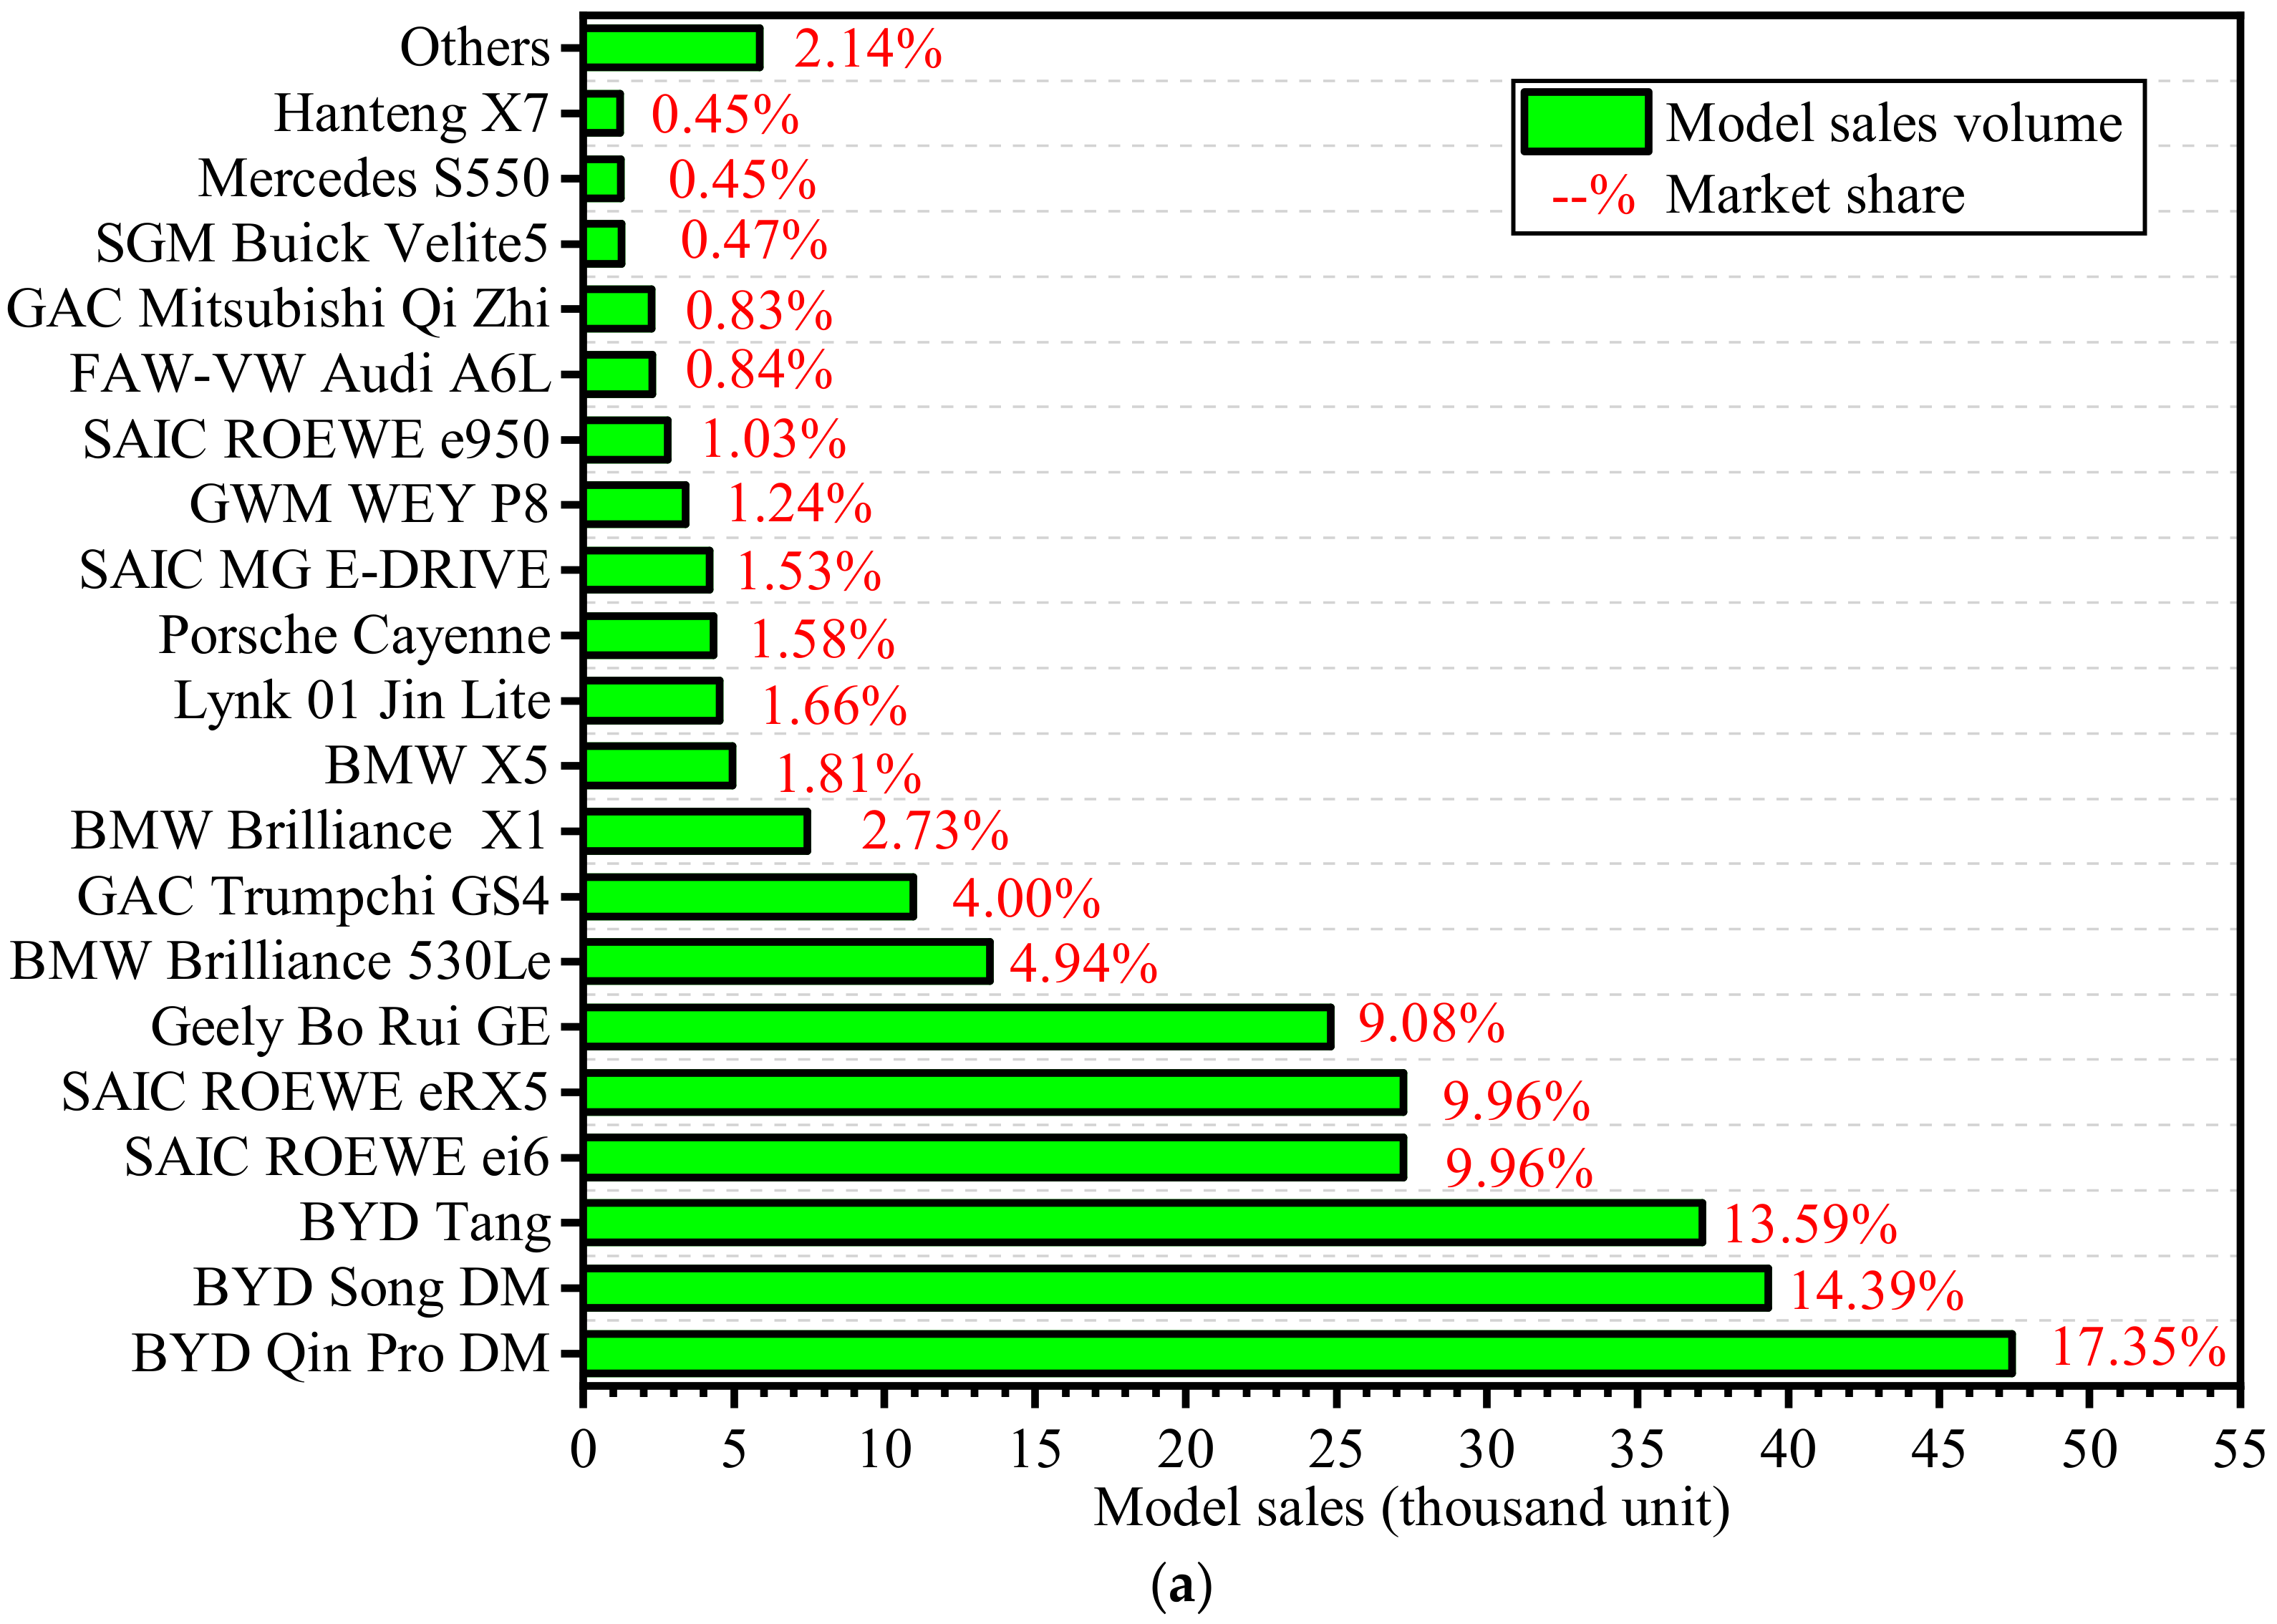
In order to understand the composition and characteristics of the PHEV market in China and the US, the statistical analysis on sales, manufacturers and models of 2018 was conducted. In 2018, there were 34 and 29 models with statistical sales data in the PHEV market in China and the US respectively, including domestic and joint ventures and imported cars. As shown in Figure 2, a few models occupy the majority of the sales volume in the both markets. The total sales volume proportion of the top five models reach 65.24% and 64.73% in China and the US separately, which is basically close. The top 10 sales account for 87.79% and 81.98% in China and the US respectively, and China is slightly higher. Build Your Dream (BYD) occupies the top three sales volume of China’s PHEV models. The top 10 are all domestic independently produced models, which are made by four manufacturers of BYD, Shanghai Automotive Industry Corporation (SAIC), Geely and Bavarian Motor Works (BMW) Brilliance. BMW Brilliance is a Sino-German joint venture. In comparison, the top two models in the US are produced by Japan’s Toyota and Honda, which accounted for 36.81% of total sales. Besides, the manufactures of the top ten models also include the US’s Chevrolet Chrysler and Ford, Germany’s BMW, Japan’s Mitsubishi and South Korea’s Kia, which are more abundant. The top three manufacturers of PHEV sales in China’s market are BYD, SAIC and BMW, and those are Toyota, Honda and BMW in the US’s market. Although the sales of single BMW models are not in the top three, there are many BMW models with good sales in both markets.

3. Analysis of PHEV Technical Route

3.1. Classification of Architectures

3.1.1. Classification Method

PHEV and hybrid electric vehicles (HEV) have basically the same powertrain system architectures. According to the coupling relationship between electrical and mechanical energy, the architectures can be divided into three basic types: Series, parallel and compound, which include various specific deformation structures, as mentioned above [2,4,5,6,12,14,17,24,25,26,27,28,29,30,31,32,33,34,35,37,39,40,41,42,43,44,45,46,51,52]. In order to accurately describe the specific architecture forms, analyze the performance characteristics of the hybrid system, and accurately plan the products’ processes for the enterprise, BorgWarner proposed a method based on motor position in the powertrain for representing their product planning, which is widely accepted by the industry and is commonly used to express the detailed architectures of hybrid powertrain systems.
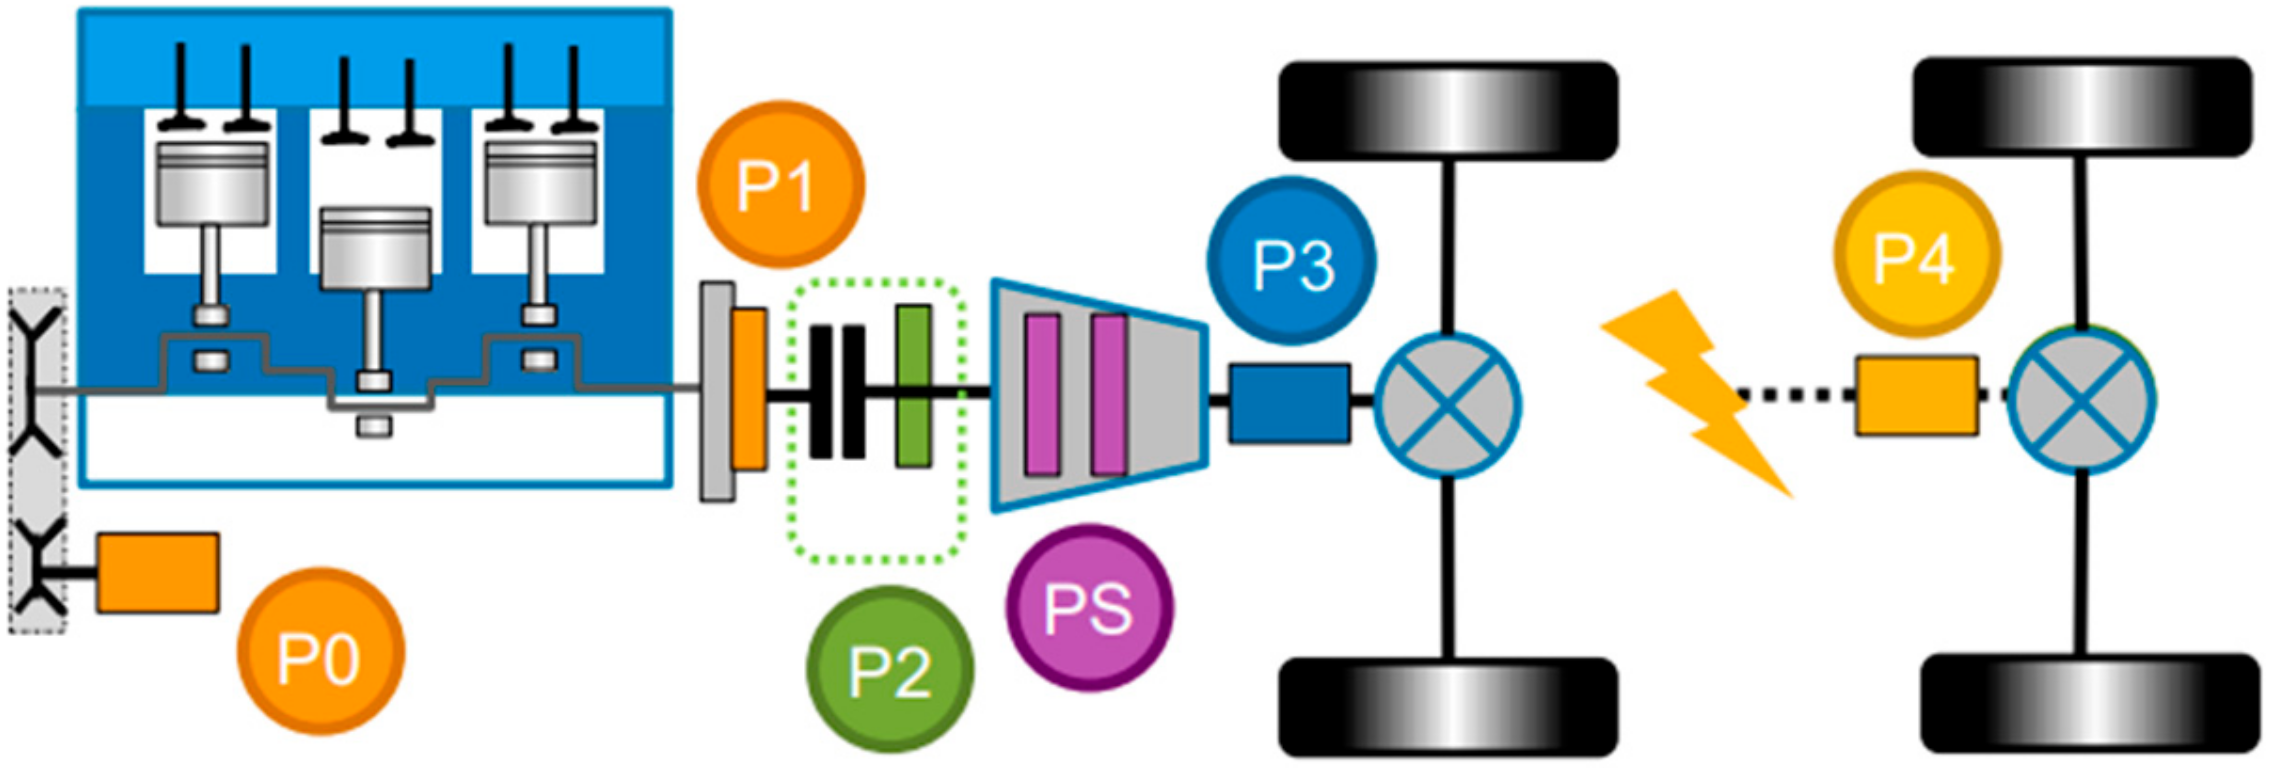
As shown in Figure 3, the power system can be divided into the following types according to the position of the motor:
P0: The motor is connected to the engine through a belt and is located at the front end of the engine, also known as belt-driven starter/generator (BSG) technology.
P1: The motor is directly connected to the engine crankshaft or at the position of the engine flywheel, also known as integrated starter/generator (ISG) technology.
P2: The motor is in the middle of the engine and gearbox, after the C0 clutch, at the input of the gearbox, and decoupled from the engine by the C0 clutch.
P3: The motor is located at the output of the gearbox and connected to the output shaft through gears.
P4: The motor directly drives the wheel on the other drive shaft, that is, if the engine drives the front axle, then the motor is on the rear axle.
PS: Two motors are connected by planetary gears and integrated in the gearbox, named power split (PS) technology.
In addition, in the Chinese market, there is a type of powertrain that puts the position of the motor in the middle of the gearbox, such as in the front of a set of gears in the dual clutch transmission (DCT), called the P2.5 system by the manufacture.
The P0–P4 motor only represents the basic structure, respectively. There are various types formed by combining different motors together.

3.1.2. Architectures of Models

In order to explain the technical route of the PHEV in the Chinese and American markets in detail, the models of typical hybrid models which appeared are summarized according to the basic architecture classification, coupling mode, motor position and common name in Table 2. Although the early BSG micro hybrid system using P0 motor and the ISG light hybrid system using P1 motor are not PHEV, they do represent the typical hybrid system architectures, so they are also included in the table.
In Table 2, the series hybrid system based on electrical coupling has fewer models. From the perspective of the motor position, the series system has “P1” and “P3” position motors, because P1 + P3 statement always refers to a combined parallel system, so a quotation mark is added here to represent a series system.
In the parallel hybrid power system with mechanical coupling, P0 and P1 systems do not have the capability of pure electric drive when used alone. The P0 system is mostly the BSG micro-hybrid system developed in the early stage, which can achieve the quick start and stop of the engine, cancel the idle speed, etc. The parallel P1 system is usually an ISG system and has a single clutch, becoming a single clutch parallel system. The motor is in front of the clutch, whose rotor is usually connected with the flywheel of the engine. The most typical applied models are Honda’s early Insight 2001 with an Integrated Motor Assist (IMA) power system and the Mercedes-Benz S400. If the pure electric mode is executed, the engine is driven reversely by the motor with energy consumption, so the motor often only assists the engine to adjust torque, starts the engine quickly, and generates electricity, rarely alone in PHEV system.
The P4 position motor is impossible to be used alone, since this way can only rely on the braking energy recovery to replenish the battery power. Without the extra motor connected to the engine, the P4 system will not be able to replenish the battery continuously for the balance of State of Charge (SOC). The P4 motor is often used together with motors in other positions, such as the P0, P1 and P3 motor. The engine and motors compose a system to drive the front axle, and the P4 motor drives the rear axle, which forms a four-wheel electric driven powertrain, also named four-wheel drive (4WD) Bridge or “P4+” system in this study.
Therefore, in the PHEV models with single-motor parallel hybrid systems, the most applied ones are P2, P2.5 and P3 systems, because the P2 system often uses dual clutches, also known as the dual clutches parallel system. If only a single clutch is used, there usually should be a torque converter between the motor and the gearbox, such as the Mercedes Benz S550. The P2 system is mainly adopted in many European, Korean and parts of Chinese models. P2.5 has only been proposed by China’s Geely and Lynk. Since the details of some models are not exposed, it may not be found in other models. The application of the P3 motor alone is principally the first generation of BYD Qin, also known as the rear parallel hybrid system.
One compound hybrid system in which two or more parallel positions are combined, and is not a planetary PS system, is called a series-parallel (S-P) or combined hybrid system. The combined hybrid can be divided into a 4WD Bridge system characterized by “P4+” motors and a non-“P4+” S-P system. The 4WD Bridge is mostly applied in the SUVs or super sports models produced by BYD, BMW and Volvo.
In the 4WD Bridge system, the P0 + P4 and P1 + P4 motors system use the P0 and P1 motor to control the start and stop of the engine and use the engine to drag the motor to recharge the battery for supplying P4 motor power sufficiently. The P1 motor can also adjust engine output torque. The architecture of P3 + P4 motors is mainly applied on BYD’s first-generation DM power system, which not only utilizes BYD’s early P3 single-motor parallel system for realizing the engine torque adjustment and start-up, but also increases a P4 motor to become electric 4WD for improving power and response speed. The P0 + P3 + P4 three-motor system is mainly represented by BYD’s second-generation DM system. Based on the P3 + P4 system, the P0 motor is added to reduce the difficulty of quick start and stop control with only a P3 motor, and to improve ride and speed. In another three-motor architecture adopting P1 + P4 + P4 motors, two P4 motors are wheel motors independently driven by the rear wheels. The system is applied in a sports car to make full use of the ground adhesion and improve the power.
In the non-"P4+" S-P system, the most typical applications are the Honda’s Intelligent Multi Mode Drive (IMMD) with the P1 + P3 motors and the SAIC’s electric drive unit (EDU) system with the P1 + P2 motors. Combining the P1 motor with the P2 or P3 motor, the P1 position motor can be used for rapid start and stop, torque change of engine or battery charging. The whole system only has one or two sets more of clutch devices than the series architecture.
The other compound hybrid system which is necessary to be separately classified and analyzed is the PS system. The planetary gears are the main components connecting the two motors. This architecture is mainly applied in models of Japanese and American automobile companies with good performance. The Toyota Prius with a single-mode PS system and the Chevrolet Volt with a two-mode PS system are the typical representatives.

3.2. Proposition of Mainstream Architectures

The architecture of a hybrid powertrain represents the choice of its technical route, which is the overall route to be determined for the development of the hybrid system [54], relating to the performance of the vehicle, and the platform and resource investment of the automobile manufacturer [55]. Once the choice is determined, the power system framework of the next three to five years cannot be easily changed, so it is necessary to classify and analyze the typical architecture of PHEV models in the Chinese and American markets.
Sales volume represents the comprehensive strength of the hybrid power system in models, reflecting performance, appearance and price, and so on. The models number represents the ability of the power system to be applied in different models and the universality of technical route choices in different manufactures, reflecting powertrain architecture selections and understandings of multiple research and development (R&D) teams. Therefore, in order to analyze the technical routes of the Chinese and American PHEV markets and propose the mainstream architectures, all models and architectures in 2018 in China and the US market were counted and analyzed. The statistics were made according to the number of models and sales volume of each architecture.
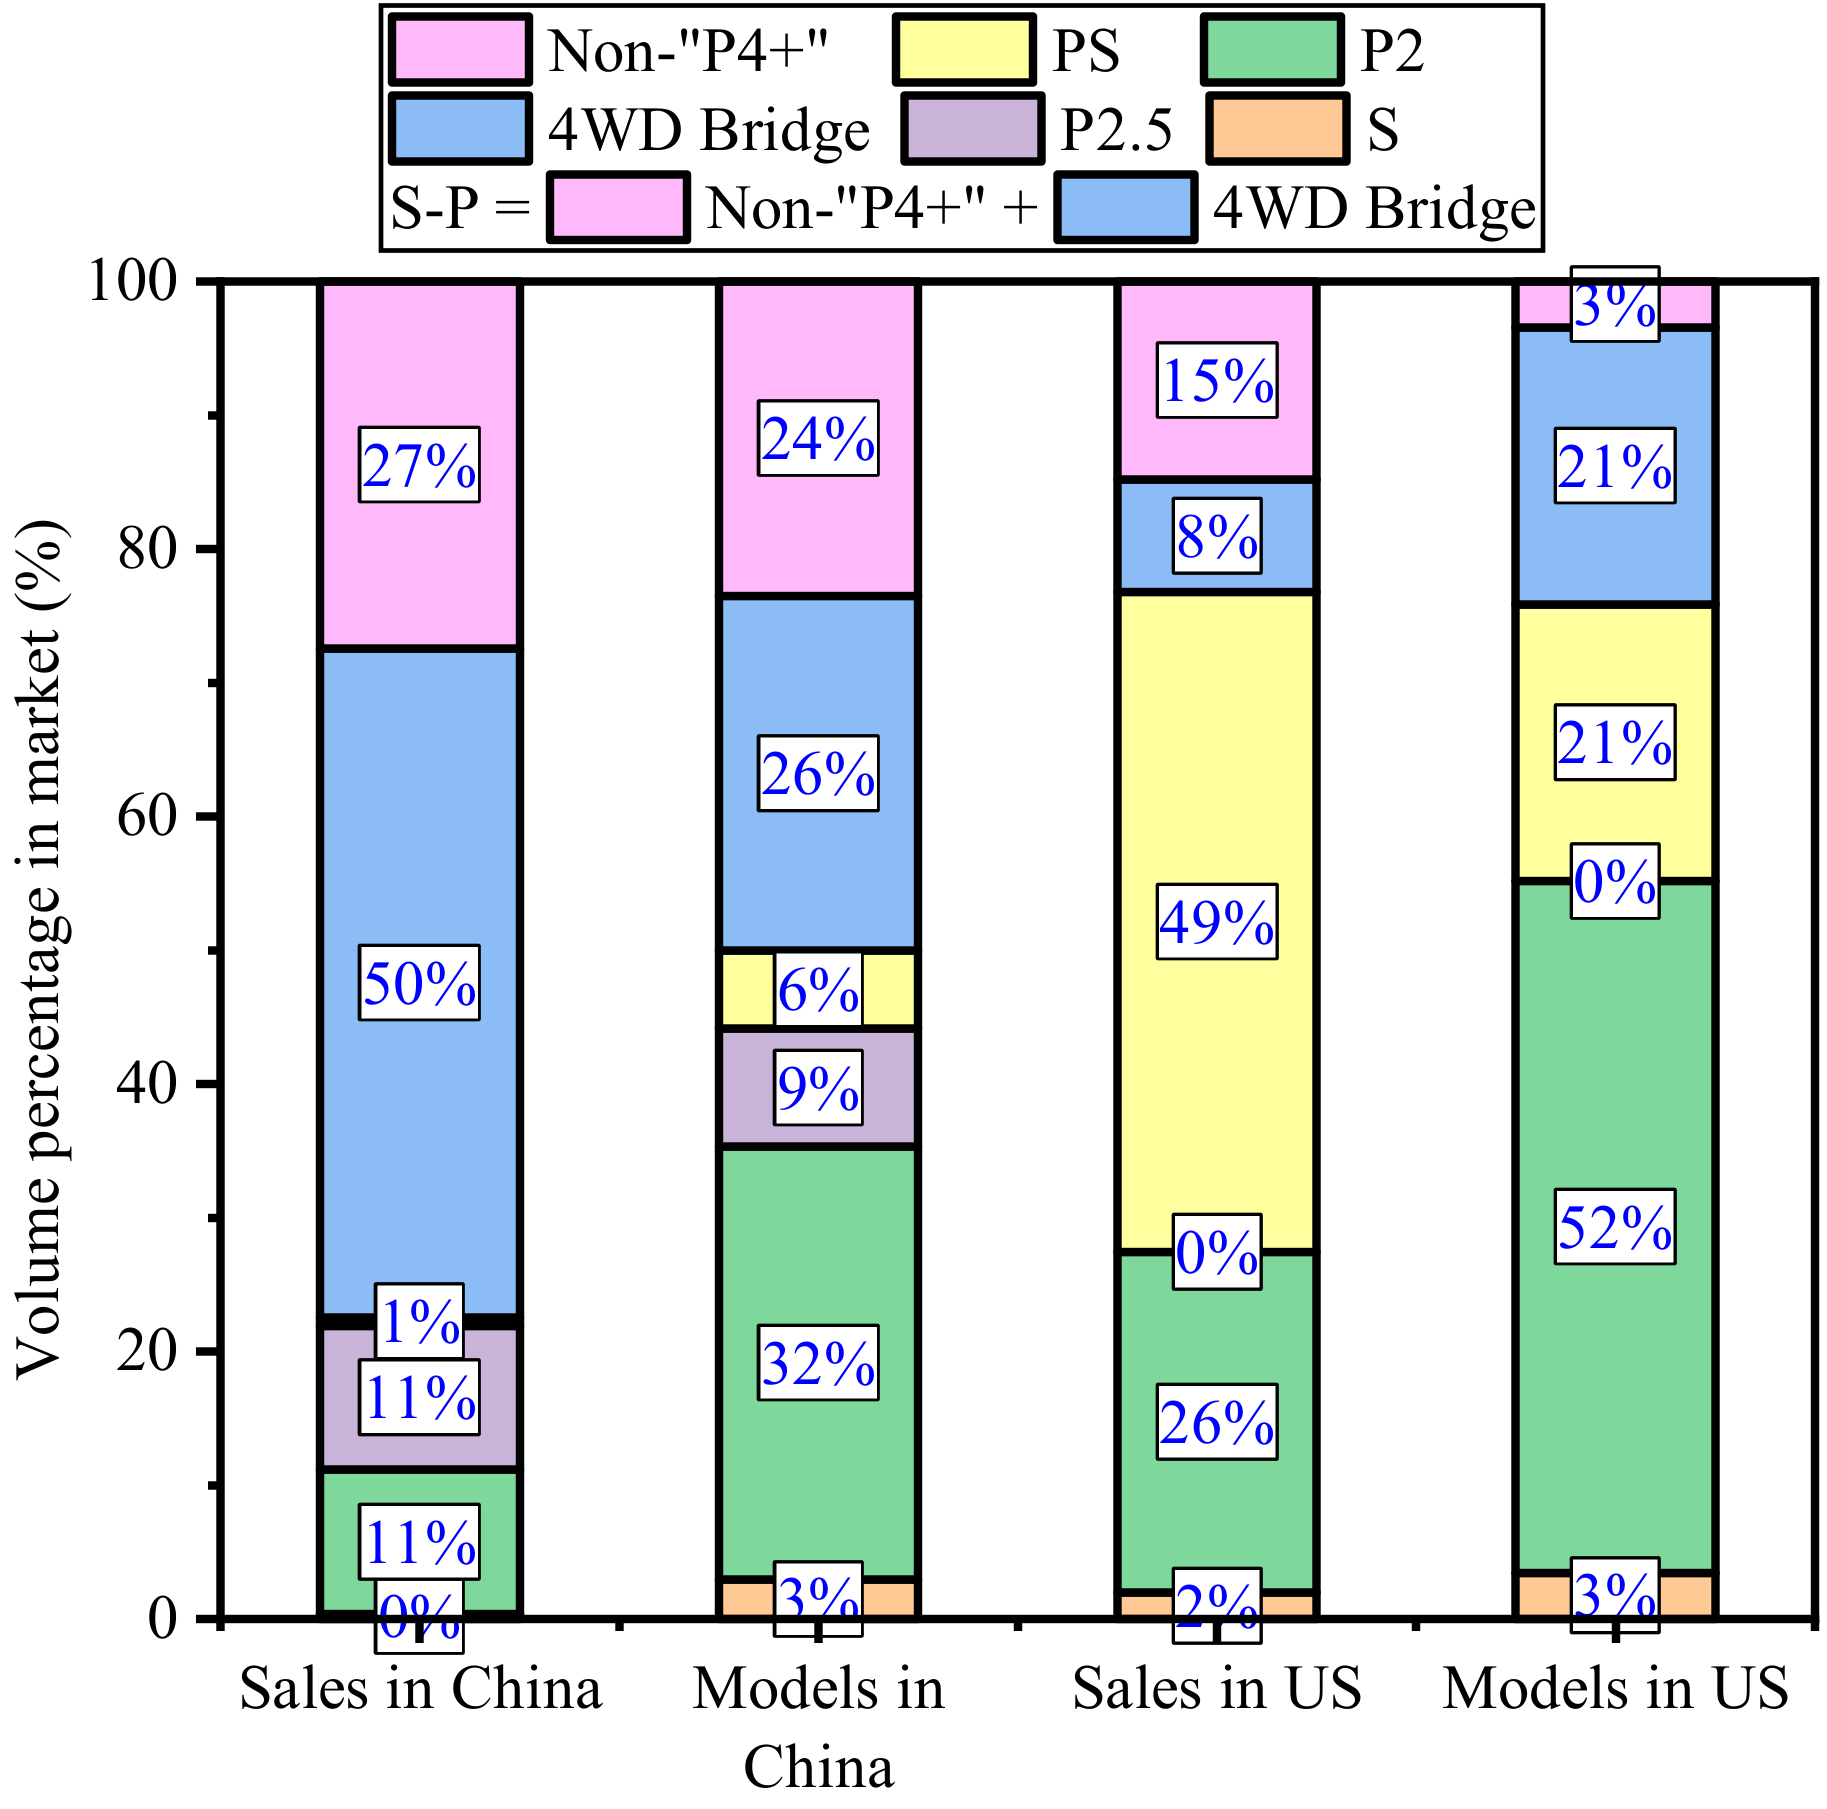
As shown in Figure 4, the S-P system in the form of the 4WD Bridge reaches 50% in the Chinese market. The total of the 4WD Bridge and non-“P4+”, that is, all of the S-P or combined hybrid system sales volume accounts for about 77%, and the total number of models adopting the architecture accounts for 50%. Next, it is remarkable to see that the total number of models utilizing P2 architecture in the Chinese market is 32%, and the sales volume is about 11%. However, in the US market, there are significant differences that show that the sales volume of the PS system is the largest, accounting for 49%, followed by P2 accounting for 26%. In terms of the models number, 52% of the models choose the P2 architecture as the technical route in the US, and S-P models totally account for 24%, which is close to 21% of PS models.
Therefore, there is a difference between which architectures are achieving higher sales in the market and which architectures automakers are offering. A difference also exists between China and the US. The most mainstream architecture in sales volume is the 4WD Bridge, that in the models’ amount is P2 in China’s market, and those respectively are PS and P2 in the US market. This reflects that a difference exists between the choice of consumers and that of automakers, and another difference also exists between China and the US. There may be a disconnect between the consumers’ preferences and the incentives that automakers are facing to design their vehicles. Besides, the proportion of series architecture is very little. The P2.5 architecture is only proposed and applied in the Chinese market. The P3 single-motor parallel system has already withdrawn from the market.

3.3. Multi-Dimensional Comparative Analysis

In order to understand the performance of various PHEV architectures, the performance and their advantages and disadvantages can be qualitatively analyzed based on the structural form, the position and function of motor and engine, and so on, so that the developer can arrange the powertrain system according to the existing resources and models.
As mentioned above, there is no P0, P1 and P4 single-motor parallel hybrid system for PHEV. Table 3 analyzes the possible existing PHEV power systems. To illustrate the characteristics, the “P4+” and non-“P4+” in S-P systems are listed separately for analysis, as shown in Table 3.
In terms of engine efficiency, η e , and operating point control, the series system can mechanically decouple the engine from the wheel. The engine operating point could be controlled according to the optimal efficiency, so that the engine efficiency, η e , is excellent. The 4WD Bridge, non-“P4+” and PS all include more than two motors, which can mostly operate in series mode to achieve optimal control of the engine operating point, so that the engine efficiency, η e , is better. In the parallel architecture, the engine is related to the wheel speed, even if a transmission is adapted, it is more difficult to optimize engine operating points than the front.
In the aspect of motor efficiency, η m , since the efficiency of the two motors in the series system is usually not optimized at the same time, and the P3 motor is often optimized with a simple two-speed transmission, the motor efficiency is medium. The transmissions of the parallel P2 and P3 architectures can only take care of the operating point optimization of the engine, and it is hard to optimize the efficiency of the motor simultaneously, so the drive system efficiency, η d s , is medium. The parallel P2.5 motor is at the front end of a transmission shaft of the DCT, and the transmission can be used to optimize the operating point of the motor, so the motor efficiency, η m , is better. The motor efficiency, η m , in the three kinds of compound hybrid systems can be optimized with the transmission, so the efficiency is superior.
Considering drive system efficiency, η d s , the series has multiple energy conversion processes, so it’s η d s is low. The energy conversion process in parallel system is less, so it’s η d s is higher than that of series type. The compound hybrid can make full use of the series and parallel working modes, and it’s η d s is higher. Several studies have shown that with the advancement of technology, when high-efficiency electrical components such as silicon carbide components are adopted in the future, the electric drive path efficiency is improved, and the disadvantageous series architecture might be likely to be more efficient [43].
In regard to energy of recovery E r e , the recoverable energy is affected by the limit of the peak power and torque of the brake motor, and is also limited by the safety braking force distribution between the front and rear axles. Studies have shown that the ratio of recyclable braking energy of two-axle drive is much higher than that of single axle drive [56]. Therefore, the 4WD Bridge architecture, which can perform two-axles braking energy recovery and adjust electric braking force distribution of each axle, can recover the most brake energy.
For the energy saving from engine idle stop, E i s , since the motor needs to immediately switch mode, close clutch, and tow to start the engine after pure electric process in the single-motor parallel architectures, the difficulty of the engine quick start and stop is higher than that in the series or compound hybrid system with P0 and P1 motors. Thus, the E i s of single-motor parallel architectures are lower that of series and compound architectures.
For dynamic performance, because the 4WD Bridge has the 4WD system whose ground adhesion utilization is higher compared to other architectures, the system has better dynamic performance. It is also one of the reasons why many SUVs and sports car models use this system.
In terms of cost, since the parallel P2 and P3 architectures use a single motor, the cost is relatively low. Although parallel P2.5 uses a single motor, it needs to couple the motor with a DCT, so the cost and difficulty are slightly higher. The series architecture has two motors whose cost are higher. The compound architectures not only have two motors but also need to add other mechanical structures for coupling, which are the most costly.
In terms of control difficulty, the engine and motor control of the series system are flexible, and the difficulty is the lowest. The 4WD Bridge system not only needs multi-mode control, and switching control between series and parallel mode, but also needs to perform braking force distribution control, etc., so it might have higher control difficulty than other systems.
For assembly and layout difficulty, the series and parallel P3 systems have flexible spatial position and are suitable for assembly. Parallel P2 architecture has certain difficulties for assembly and arrangement of powertrains when the engine is installed horizontally. Parallel P2.5 is hard for assembly in the longitudinal dimension. The arrangement and electromechanical coupling of multiple motors and mechanical devices in the compound hybrid architectures also have some difficulties. In addition, the 4WD Bridge system needs to be equipped with a P4 position motor and its cooperated reducer.
Therefore, based on the above analysis, the 4WD Bridge has better overall performance, but the cost is higher. It is suitable for SUVs and sports cars with higher performance requirements. With the policies of gradually reducing subsidies in the future, the cost will become the primary consideration for manufacturers to select architectures, so the single-motor parallel architecture will probably become the first choice of major manufacturers.

4. Analysis of PHEV Testing Performance

To comprehensively analyze the performance of PHEV in the Chinese and American markets, FC, curb weight (CW), AER and other performance indicators of different models and architectures are analyzed based on the official certificated testing data of China and the United States.

4.1. Comparison of Testing Methods

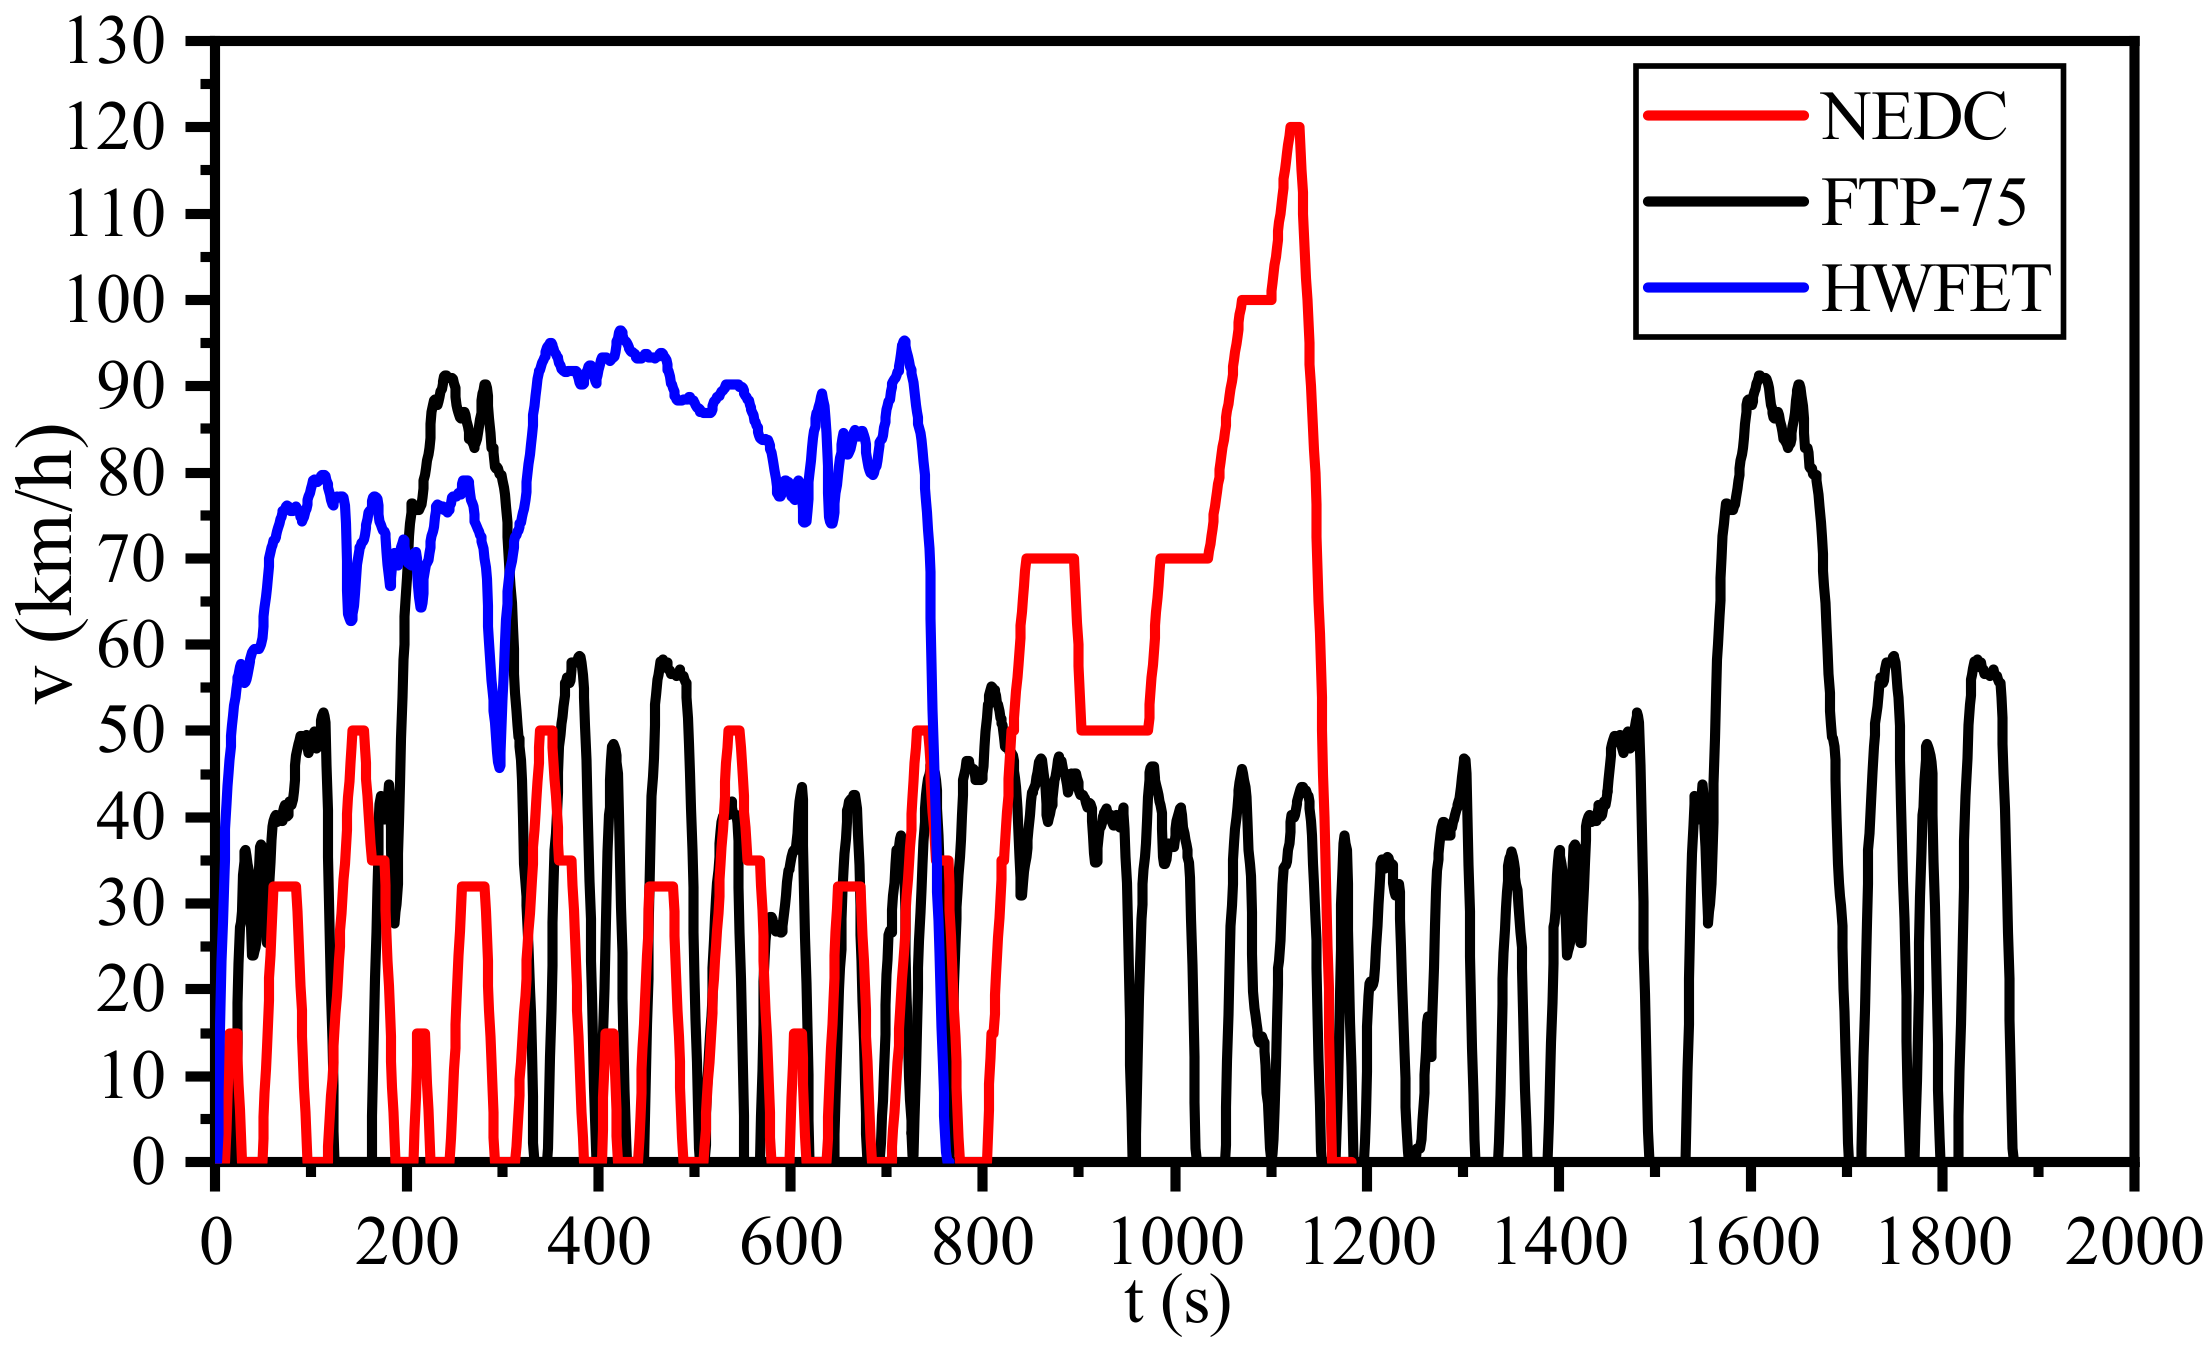
The official test conditions and calculation methods should be understood firstly for using the officially published PHEV data. China’s Ministry of Industry and Information Technology (MIIT) announced the comprehensive FC and AER and so on for the listed models in the PHEV market. They were tested and calculated according to the national related testing standards and methods of China [57,58]. The testing drive cycle was the new European driving cycle (NEDC). The US Environmental Protection Agency (EPA) announced those performance indicators of the PHEV in the US market. According to the EPA test procedure based on test method of the Society of Automotive Engineers (SAE) [59], the testing drive cycles were the federal test procedure (FTP)-75 and highway fuel economy test (HWFET). These cycles are shown in Figure 5.
It can be seen from Figure 5 and Table 4 that NEDC is a modal cycle and an abstraction of an actual drive cycle. FTP-75 and HWFET are transient cycles, which are similar to the actual drive cycles. The NEDC can be divided into four urban driving cycles (4UDC) and one extra urban driving cycle (EUDC), which represent the urban low-speed segment and the suburban high-speed segment, respectively. The FTP-75 and HWFET driving cycles separately represent the EPA-tested city and highway cycles. As shown in Table 4, the NEDC cycle has a shorter time and driving distance, smaller average speed and maximum acceleration and deceleration, and longer idle time than EPA testing cycles. The standard deviation of the acceleration shows that the acceleration of FTP-75 is more dispersing than those of 4UDC. The acceleration of EUDC is slightly more dispersing than that of HWFET. The distribution of city and highway speed of the MIIT testing cycle is more dispersing than that of EPA, which indicates that the distribution of vehicle operating points of China is more disperse, but the US drive cycle has more acceleration and deceleration times and a larger acceleration distribution.
The comprehensive FC published by the MIIT of China is a calculation based on the FC in the charge-depleting (CD) and charge-sustaining (CS) operating modes of PHEVs, given in Equation (1):
F C M I I T = ( D e × F C C D + D a v × F C C S ) D e + D a v
where, F C M I I T is comprehensive FC announced by the MIIT of China, F C C D and F C C S are the FC in the CD and CS phases of the PHEVs, D e is the distance of pure electric driving, and D a v is the distance between two charging settings to 25 km.
Equation (1) indicates that the longer pure electric driving distance leads to a smaller comprehensive FC. Therefore, in order to more objectively compare the power system performance of each PHEV model, the CS stage FC is deduced by Equation (1) for FC comparative analysis.
Differently, the comprehensive FC given by EPA is the weighting value of miles per gallon (MPG) of PHEV in CS phase under FTP-75 and HWFET, as follows:
M P G c o m = 55 % × M P G F T P 75 + 45 % × M P G H W F E T
where, M P G c o m is comprehensive FC announced by EPA, M P G F T P 75 and M P G H W F E T are FC of CS mode in FTP-75 and HWFET tested by EPA.
To conform to the form of the expression in the US, the FC of the NEDC drive cycle can be divided into that of four urban drive cycles and one extra urban drive cycle. Since the test is completed in a one-time operation, the FC in the CS stage can be decomposed based on Equation (3), which could be regarded as the weighted value of 36% of the FC in the urban phase and 65% of the FC in the extra urban phase.
F C N E D C = V N E D C D N E D C × 100 = ( D 4 U D C × F C 4 U D C + D E U D C × F C E U D C ) D 4 U D C + D E U D C 36 % × F C 4 U D C + 64 % × F C E U D C
where, F C N E D C , F C N E D C and F C E U D C respectively, indicate the FC per 100 kilometers of NEDC and its urban and extra urban phases, V N E D C is the FC volume in the NEDC drive cycle, D N E D C , and D 4 U D C and D E U D C are the distance of each cycle, as shown in Table 4.
Since the EPA only gives the comprehensive FC in the form of MPG, and does not give the FC in the city and highway stages separately, we can only use the comprehensive FC data directly. Direct observation of Equation (2) and Equation (3) shows that in calculating the FC in the CS mode, the weight of FC in the urban stage in the US is greater than that in China. Equation (2) still needs to be converted into FC of 100 kilometers as follows:
F C E P A = 235.22 M P G c o m = F C F T P 75 F C H W F E T 45 % × F C F T P 75 + 55 % × F C H W F E T
For comparison with Equation (3), it can be assumed that Equation (4) could be expressed as a similar form:
F C E P A = a × F C F T P 75 + ( 1 a ) × F C H W F E T
where, a is a variable coefficient.
Then Equation (4) can be converted into:
F C E P A = 55 % × F C H W F E T 45 % × F C F T P 75 + 55 % × F C H W F E T × F C F T P 75 + + 45 % × F C F T P 75 45 % × F C F T P 75 + 55 % × c H W F E T × F C H W F E T = 1 45 % × F C F T P 75 55 % × F C H W F E T + 1 × F C F T P 75 + + 1 1 + 55 % × F C H W F E T 45 % × F C F T P 75 × F C H W F E T
The larger the F C F T P 75 value is, the smaller its proportion is in the calculation, and then the larger the proportion of F C H W F E T is. When the ratio of the city to highway FC is 11:9, the weights of the two stages are the same, but a moderate range of the FC ratio must exist inevitably and will be explored in our further research. Therefore, the FC announced by EPA is a variable of FC per 100 kilometers according to the two-driving stage.
Equations (1–6) give the comparison of testing the FC in China and the US, which helps us to understand the proportion of FC of various test roads and to see the impacts of differences of the two methods on fuel economy indicators. In future, if we can get every stage of FC data of the PHEV models, based on the two testing methods, we could give a more explicit comparison.

4.2. Fuel Economy Analysis

4.2.1. Fuel Consumption of Models

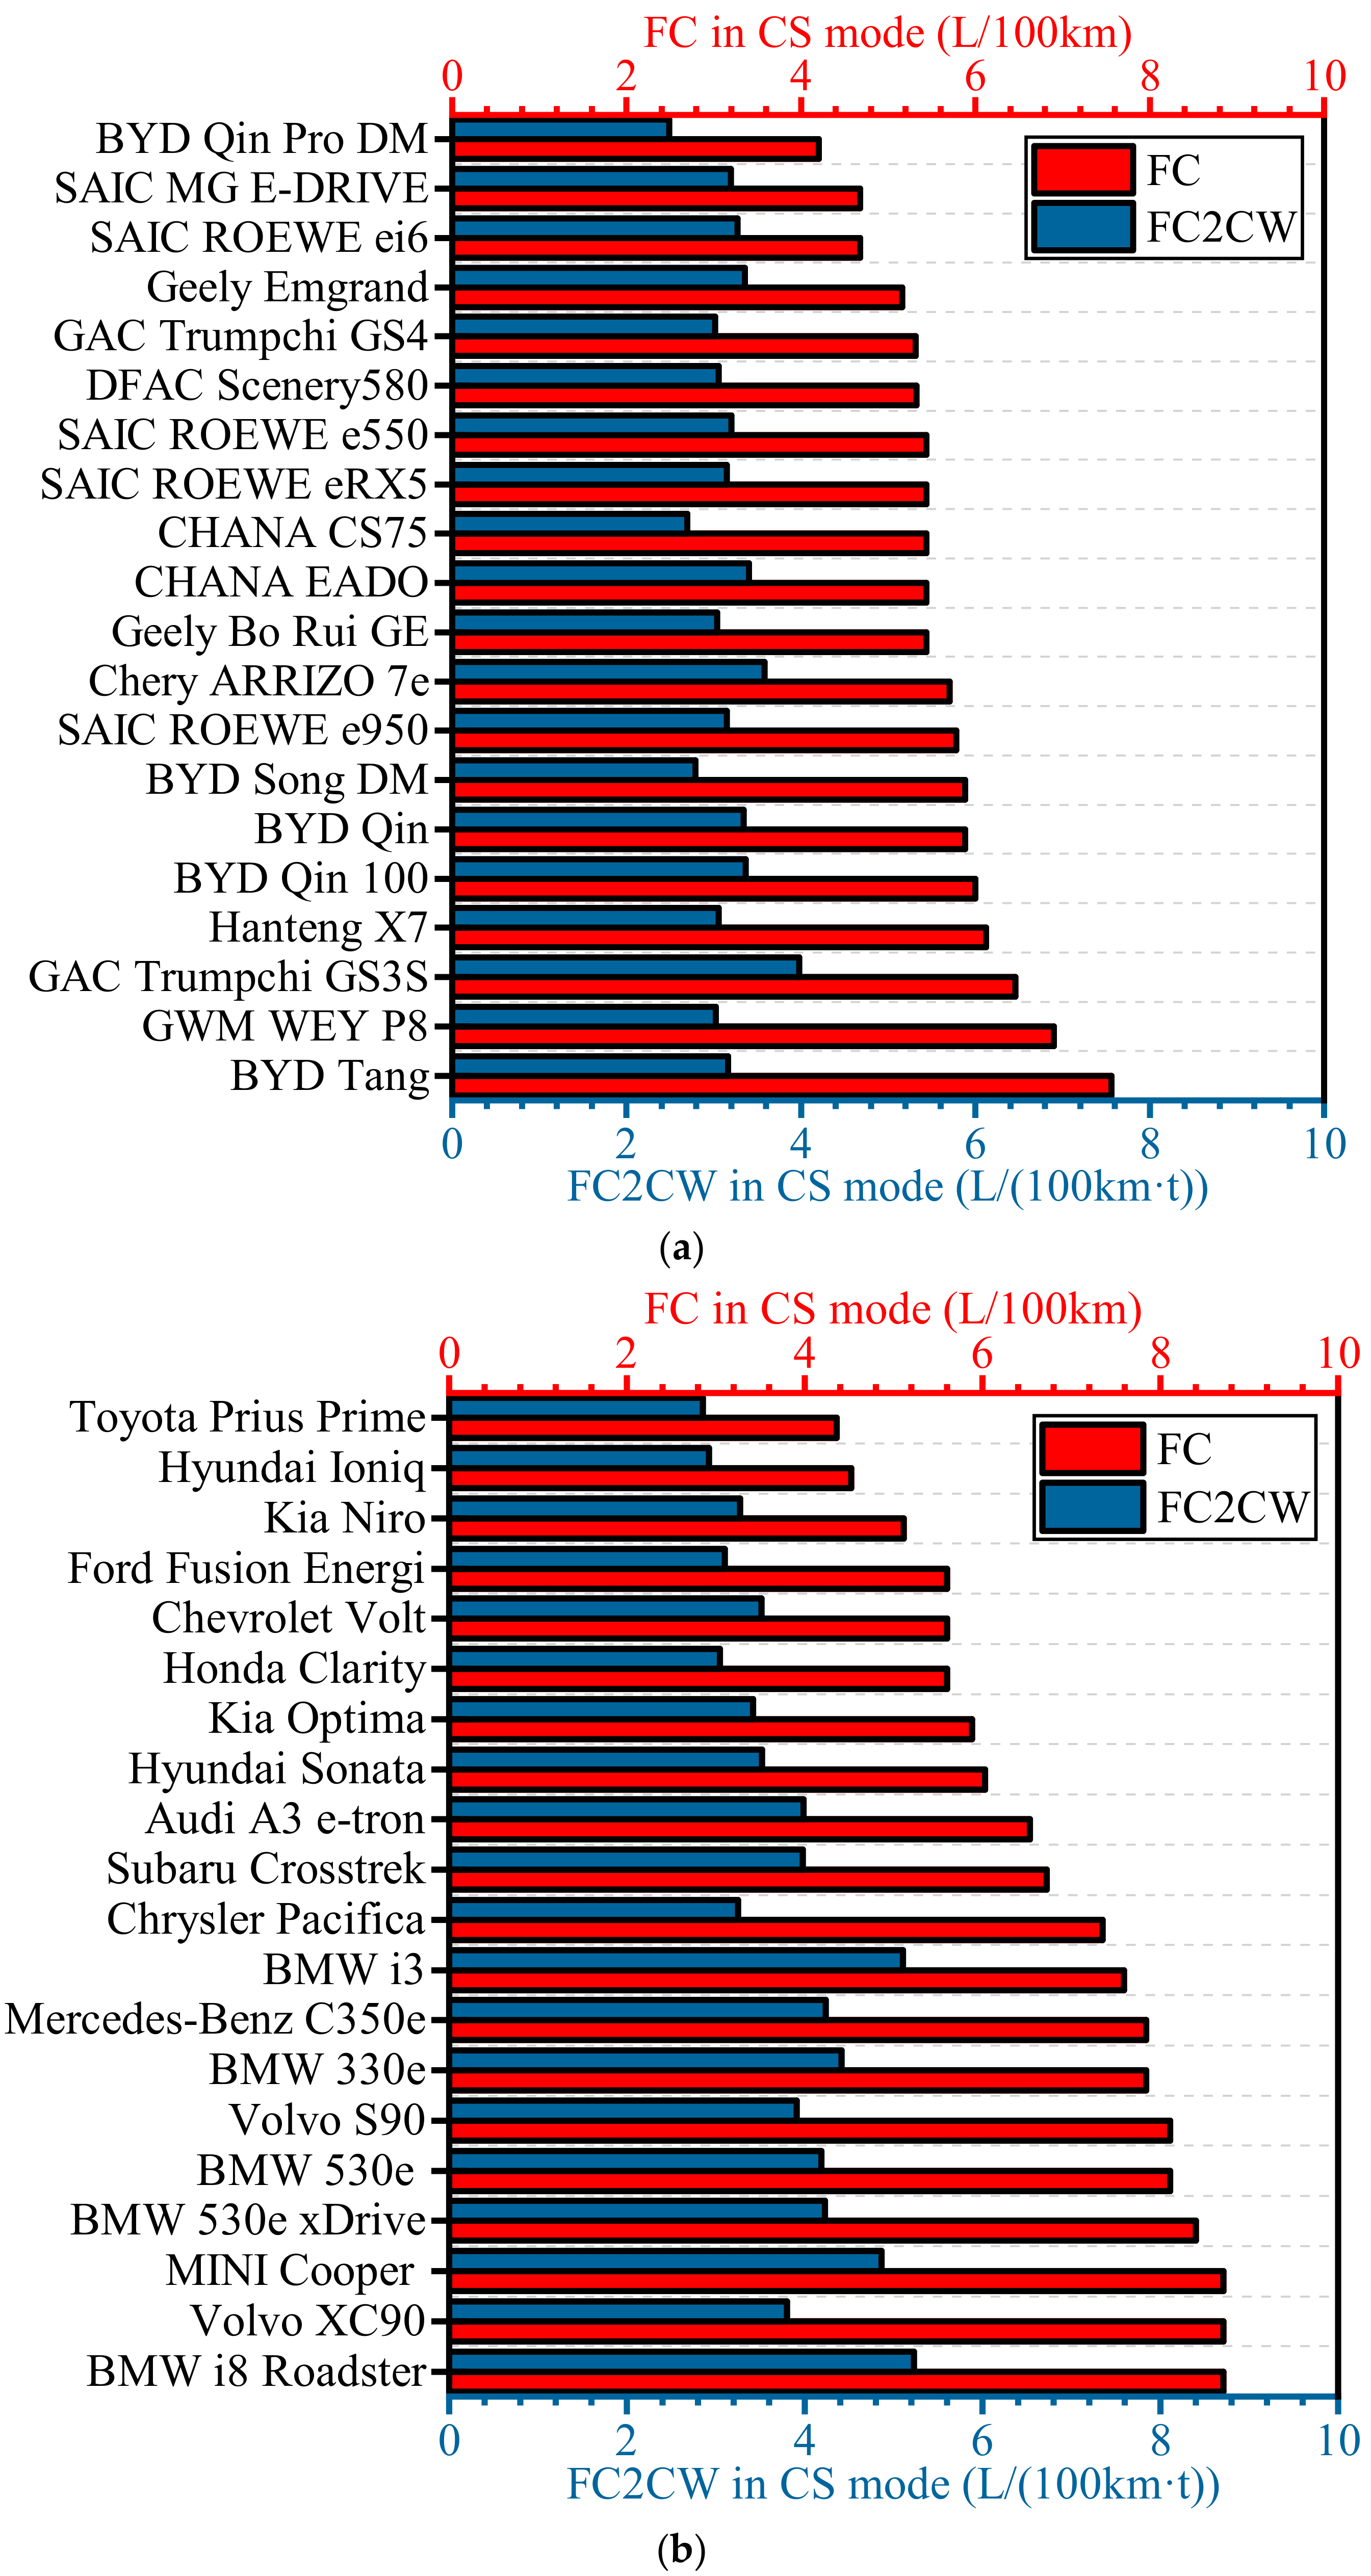
According to the main PHEV models and their FC data that can be obtained in the market of China and the US, the FC of PHEV in the CS stage could be converted and attained, as described in the previous section. The CW of the various models can be found, so that FC per unit CW were calculated, as shown in Figure 6. It shows the FC of 20 models in the PHEV markets of China and the US. The models in the Chinese market include domestic, Sino-foreign joint and imported products.
FC per CW is defined as follows:
F C 2 C W = F C / C W
where, FC2CW is the ratio of FC to CW (L/(100 km·t), CW is the curb weight.
Comparing Figure 6 with Figure 2, the models with the lowest FC and FC2CW of the CS stage in China and the US markets are BYD Qin Pro DM and Toyota Prius Prime respectively, which are all sedans and also happen to be the models with the largest market share in the two markets in 2018, accounting for 17.35% and 21.99%. The comparison reflects that the models with the best fuel economy have the largest market share in Chinese and American markets. The sales of models with lower FC also perform well, such as SAIC Roewe ei6 accounted for 9.96% in China. The second, third and fifth place of sales volume in the US market are Honda Clarity, Chevrolet Volt and Ford Fusion Energi, whose fuel economy are all in top six sales place. Along with the first place, these four cars account for 57.83% of sales. In addition to the FC of BYD Qin Pro DM and SAIC Roewe ei6, whose sales ranked in the top five in the Chinese market, being low, the other three vehicles in the top five sales are all SUVs whose FC and FC2CW are relatively high.
From the comparative analysis, the following conclusions are basically obtained: (1) The first-ranked sales PHEV models in China and the US markets are both sedans with first-ranked FC and FC2CW, (2) Among the models with the top five sales of two countries, the types and sales of SUVs in China, whose fuel economy are not very good, are significantly more than that in the US, and (3) The fuel economy rankings of the models with the top five sales in the US are relatively better than that in China.

4.2.2. Fuel Consumption Distribution Characteristics

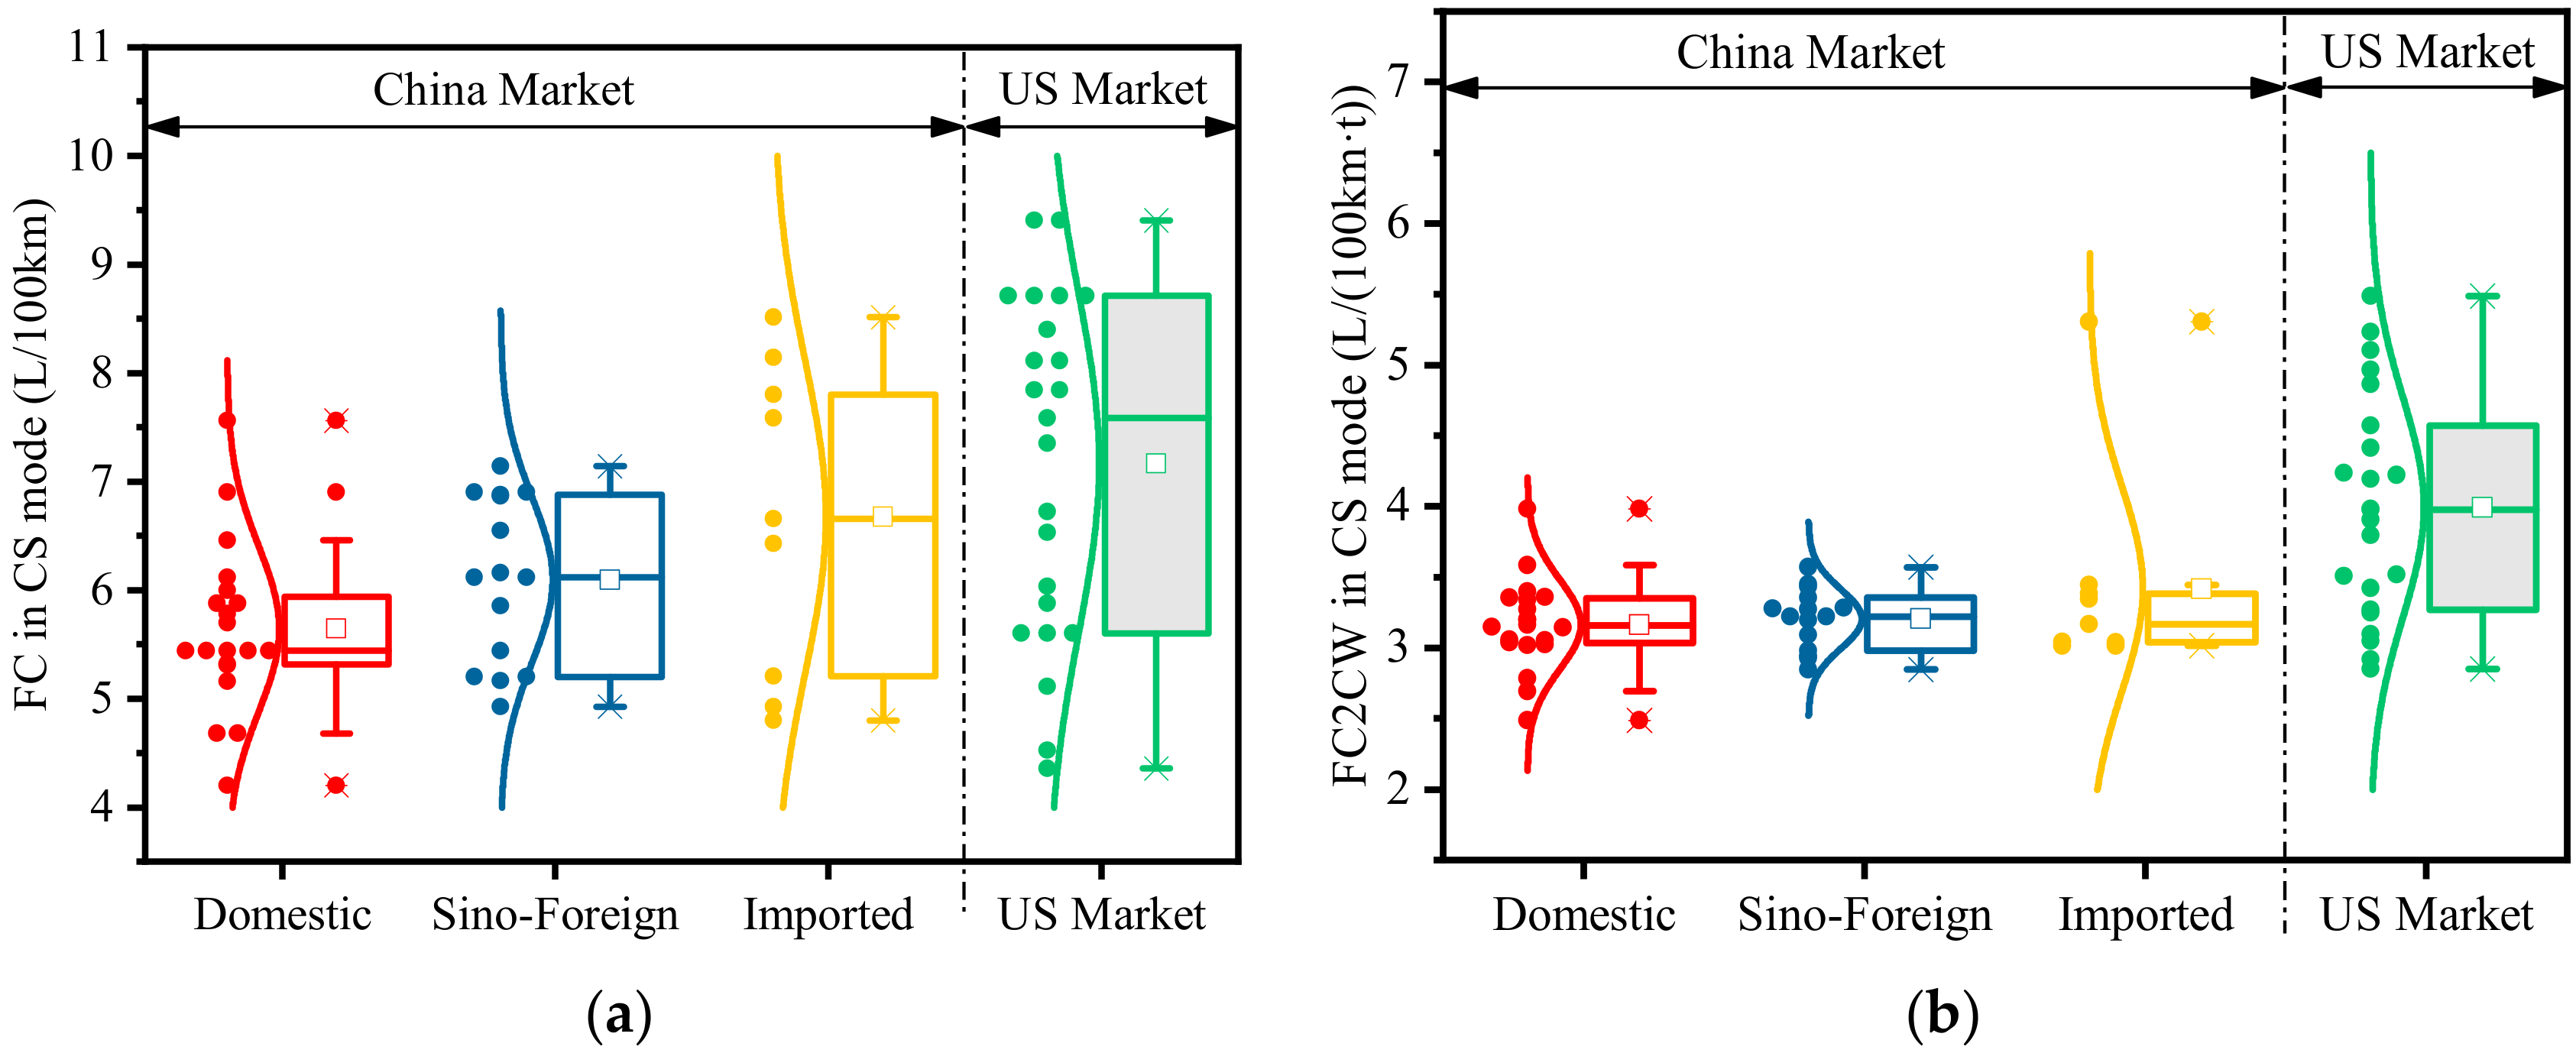
In order to observe the overall distribution of FC of PHEV models in the Chinese and American markets, the box-line diagram shows the FC distribution of Chinese domestic, Sino-foreign and imported vehicles and vehicles in the US market, as shown in Figure 7.
Figure 7a shows that in the Chinese market, the average and median FC of domestic PHEVs is lower than that of Sino-foreign joint ventures-produced models and is also lower than that of imported models and models in the US markets. Observing the FC distribution of each part could find that the median of domestic models is lower, and the average value is near 50%, which indicates that more than half of domestic models can achieve lower FC. The average FC of Sino-foreign joint models is nearly equal to the median value, which is the same to the imported models. The FC distribution of imported models is very broad, and that is broader in the US market.
Figure 7b shows that the FC per unit mass in the Chinese market is relatively concentrated. The FC2CW distribution of the three types of vehicles in China is relatively close, especially that distribution of domestic and joint venture vehicles. Their close median, average and distribution characteristics reveal that although the FC distribution of the three types of vehicles is quite different, the technical level of FC per unit mass is close in the Chinese market. Among the imported cars, there is a model having the highest FC2CW value. It is the BMW i3, which is a Range-extended Electric Vehicle (REEV) and has a series hybrid system. Multiple energy conversion processes of mechanic and electric cause too much energy loss in the CS stage. The FC2CW distribution of models in the US is still wider than that in China, which may be due to the obvious differences in the types of models in the US market under the EPA test conditions.

4.2.3. Fuel Consumption of Architectures

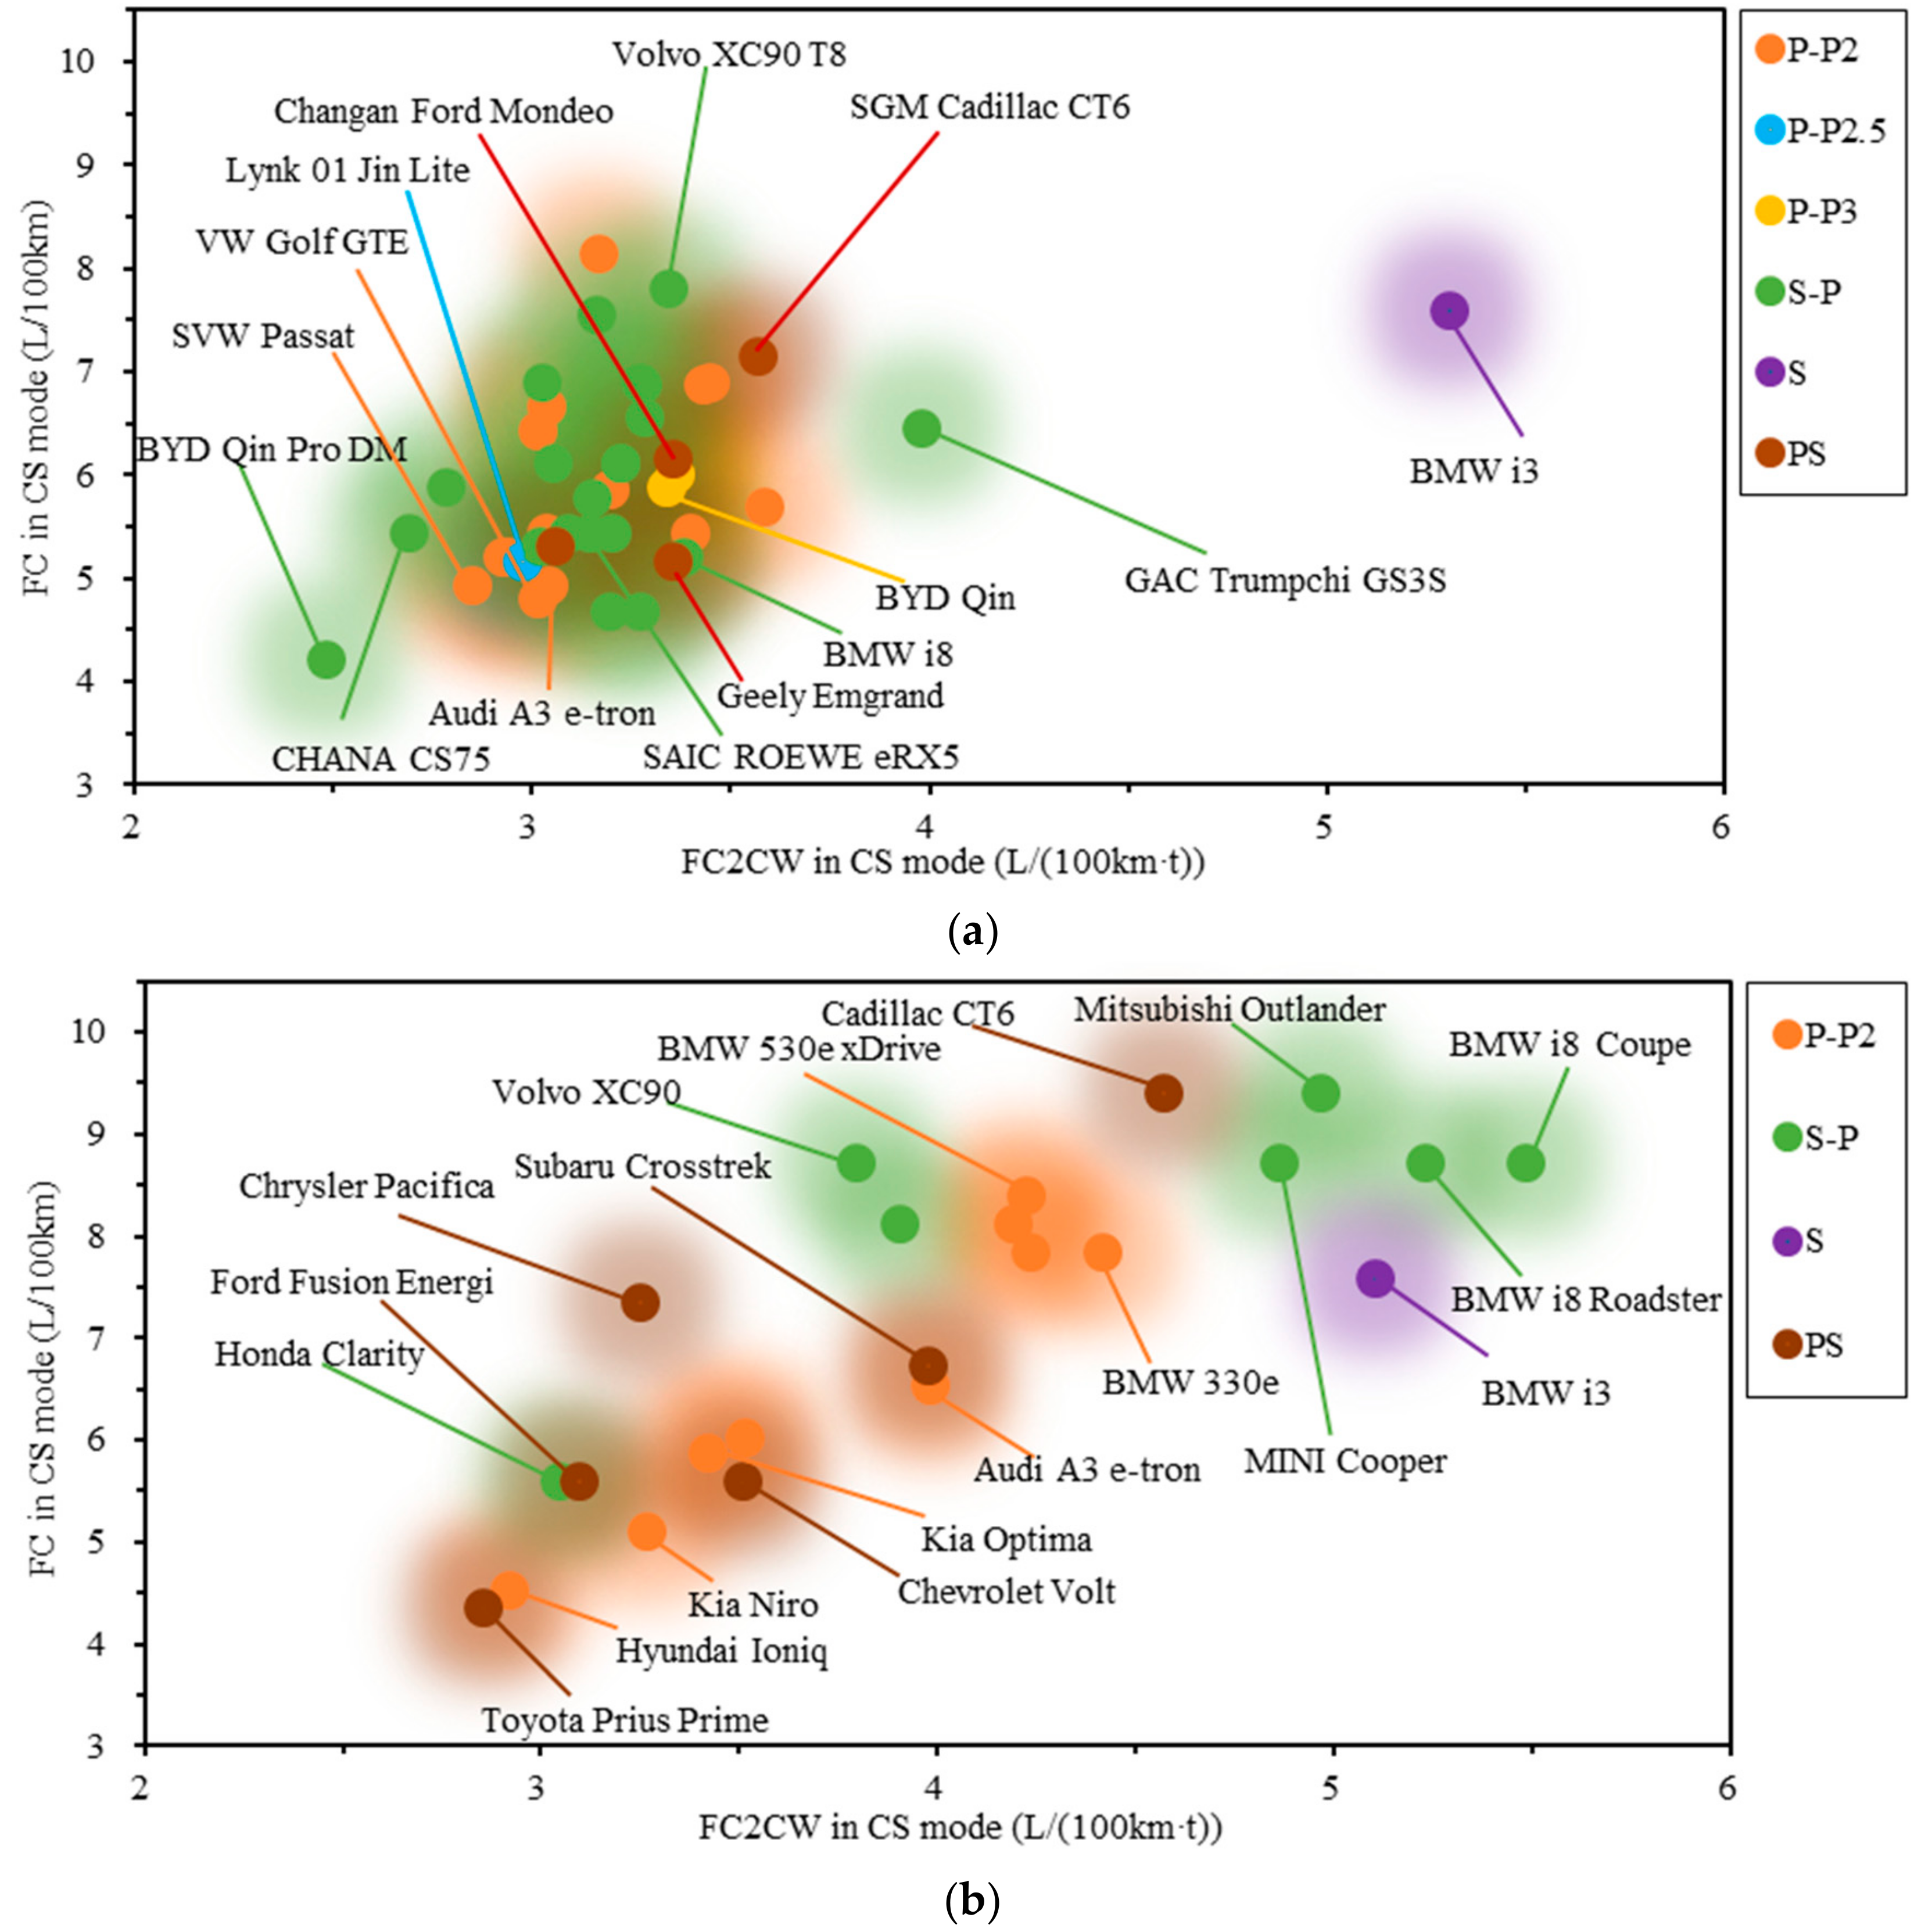
In order to analyze the relationship between PHEV architectures and FC in the Chinese and American markets, FC and FC2CW distribution of different architectures and models are shown in Figure 8.
The domestic, Sino-foreign joint and imported cars in the Chinese market are all in Figure 8a. It can be seen that the only series hybrid BMW i3 in the Chinese market has a prominent position with the highest FC2CW and a higher FC under NEDC. The fuel economy of REEV with a series hybrid system under NEDC is poor, which may be the reason why series hybrid is not the mainstream technology choice in China. The economic performance of other architectures distribute relatively concentrated and cross with each other. It seems that each architecture has models with a lower or a higher FC and FC2CW. Therefore, in the Chinese market, there is no certain architecture’s fuel economy which could always absolutely be the best, but the series system’s fuel economy is worse relatively.
It can be seen from Figure 8b that under the EPA test method, FC2CW of the series hybrid BMW i3 is still high under the FTP-75 and HWFET conditions in the US market. The sports car BMW i8 series also have relative higher FC and FC2CW. In the US market, the fuel economy of PS and the parallel P2 system are very good and have wide application in models. Many models which apply these two architectures can achieve lower FC and FC2CW. However, among models which used S-P architectures, except for Honda Clarity which used the P1 + P3 IMMD system, they could achieve better fuel economy, other models which applied S-P are distributed on the upper right end, mainly the 4WD Bridge power system in the form of "P4+" motors. The PS and P2 systems have the largest sales and models in the US market, as shown in Figure 4. The top five best-selling models mainly adopt the PS architecture. Perhaps other architectures could also achieve lower FC under EPA testing, but the situation in the US market shows that the P1 + P3 IMMD of the S-P system, PS and P2 system can achieve better fuel economy, which are sold better.
Therefore, it can be seen that in the Chinese and American markets, it could not be possible to distinguish the architecture whose FC or FC2CW can be absolutely lowest under the corresponding test conditions, and that any architectures have the models with performance pros and cons. However, FC and FC2CW of the series system of REEV are not very good in both markets. In the US market, the performance of PS and P2, which sold well, are generally better than that of the 4WD Bridge power system.

4.3. Curb Weight Analysis

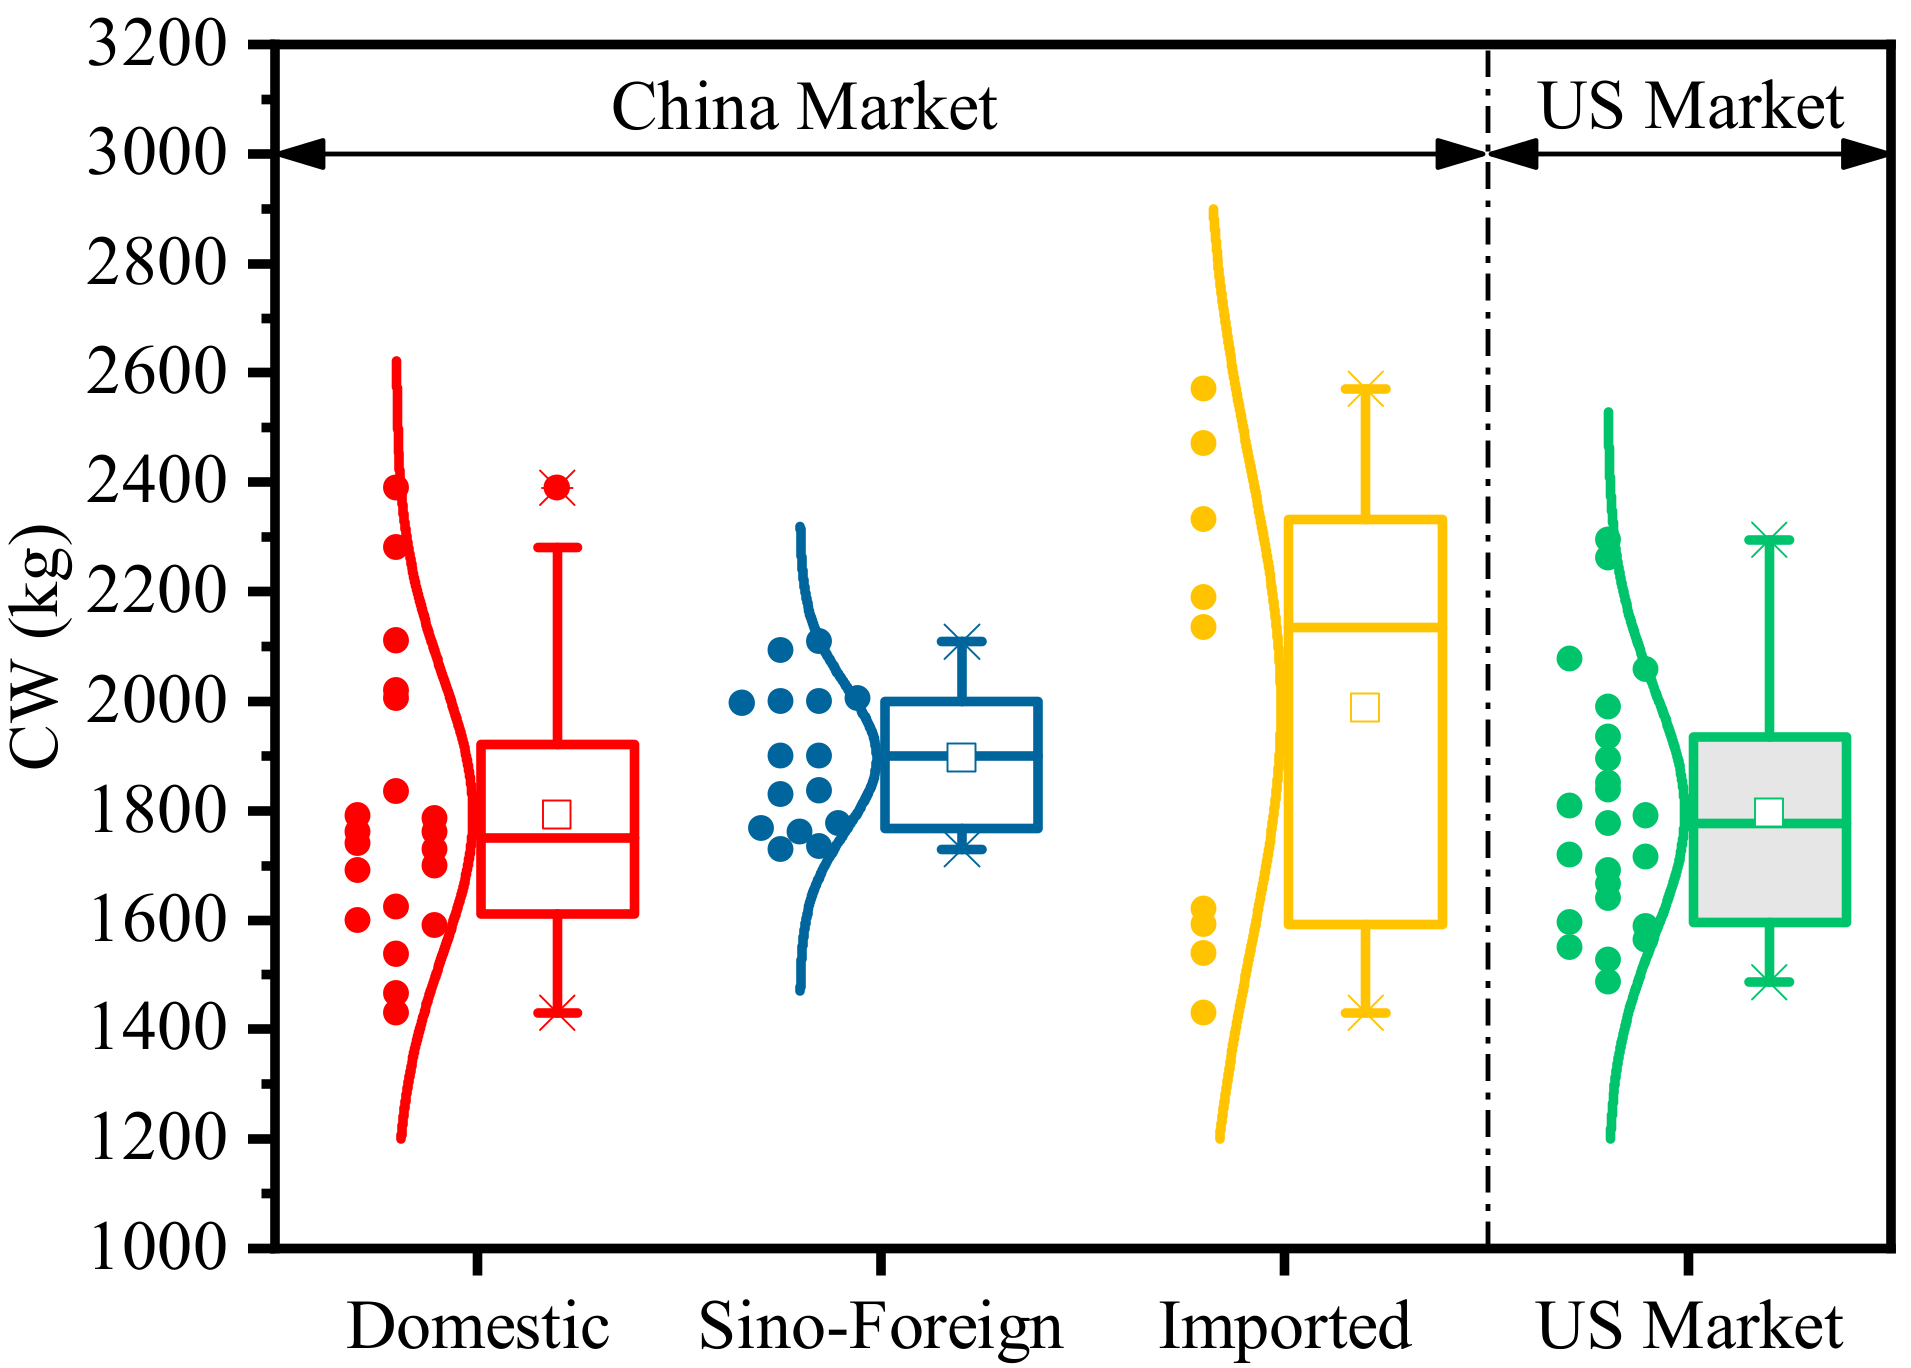
The CW of models’ distribution in Chinese and American markets are shown in Figure 9. The average and median value of domestic models are slightly lower than that of Sino-foreign and imported models, whose tendency is consistent with FC. The widest distribution is the imported models. The comparison of Figure 9 and Figure 7 shows that the FC2CW level of three kinds of models tested under NEDC in the Chinese market are very close, the inconsistency of FC is mainly caused by the difference of models’ CW. The CW of models in the US market is relatively concentrated, and its mean and median value is slightly lower than that of the Chinese market. The CW distribution represents a higher lightweight level of models in the US market.

4.4. All Electric Range Analysis

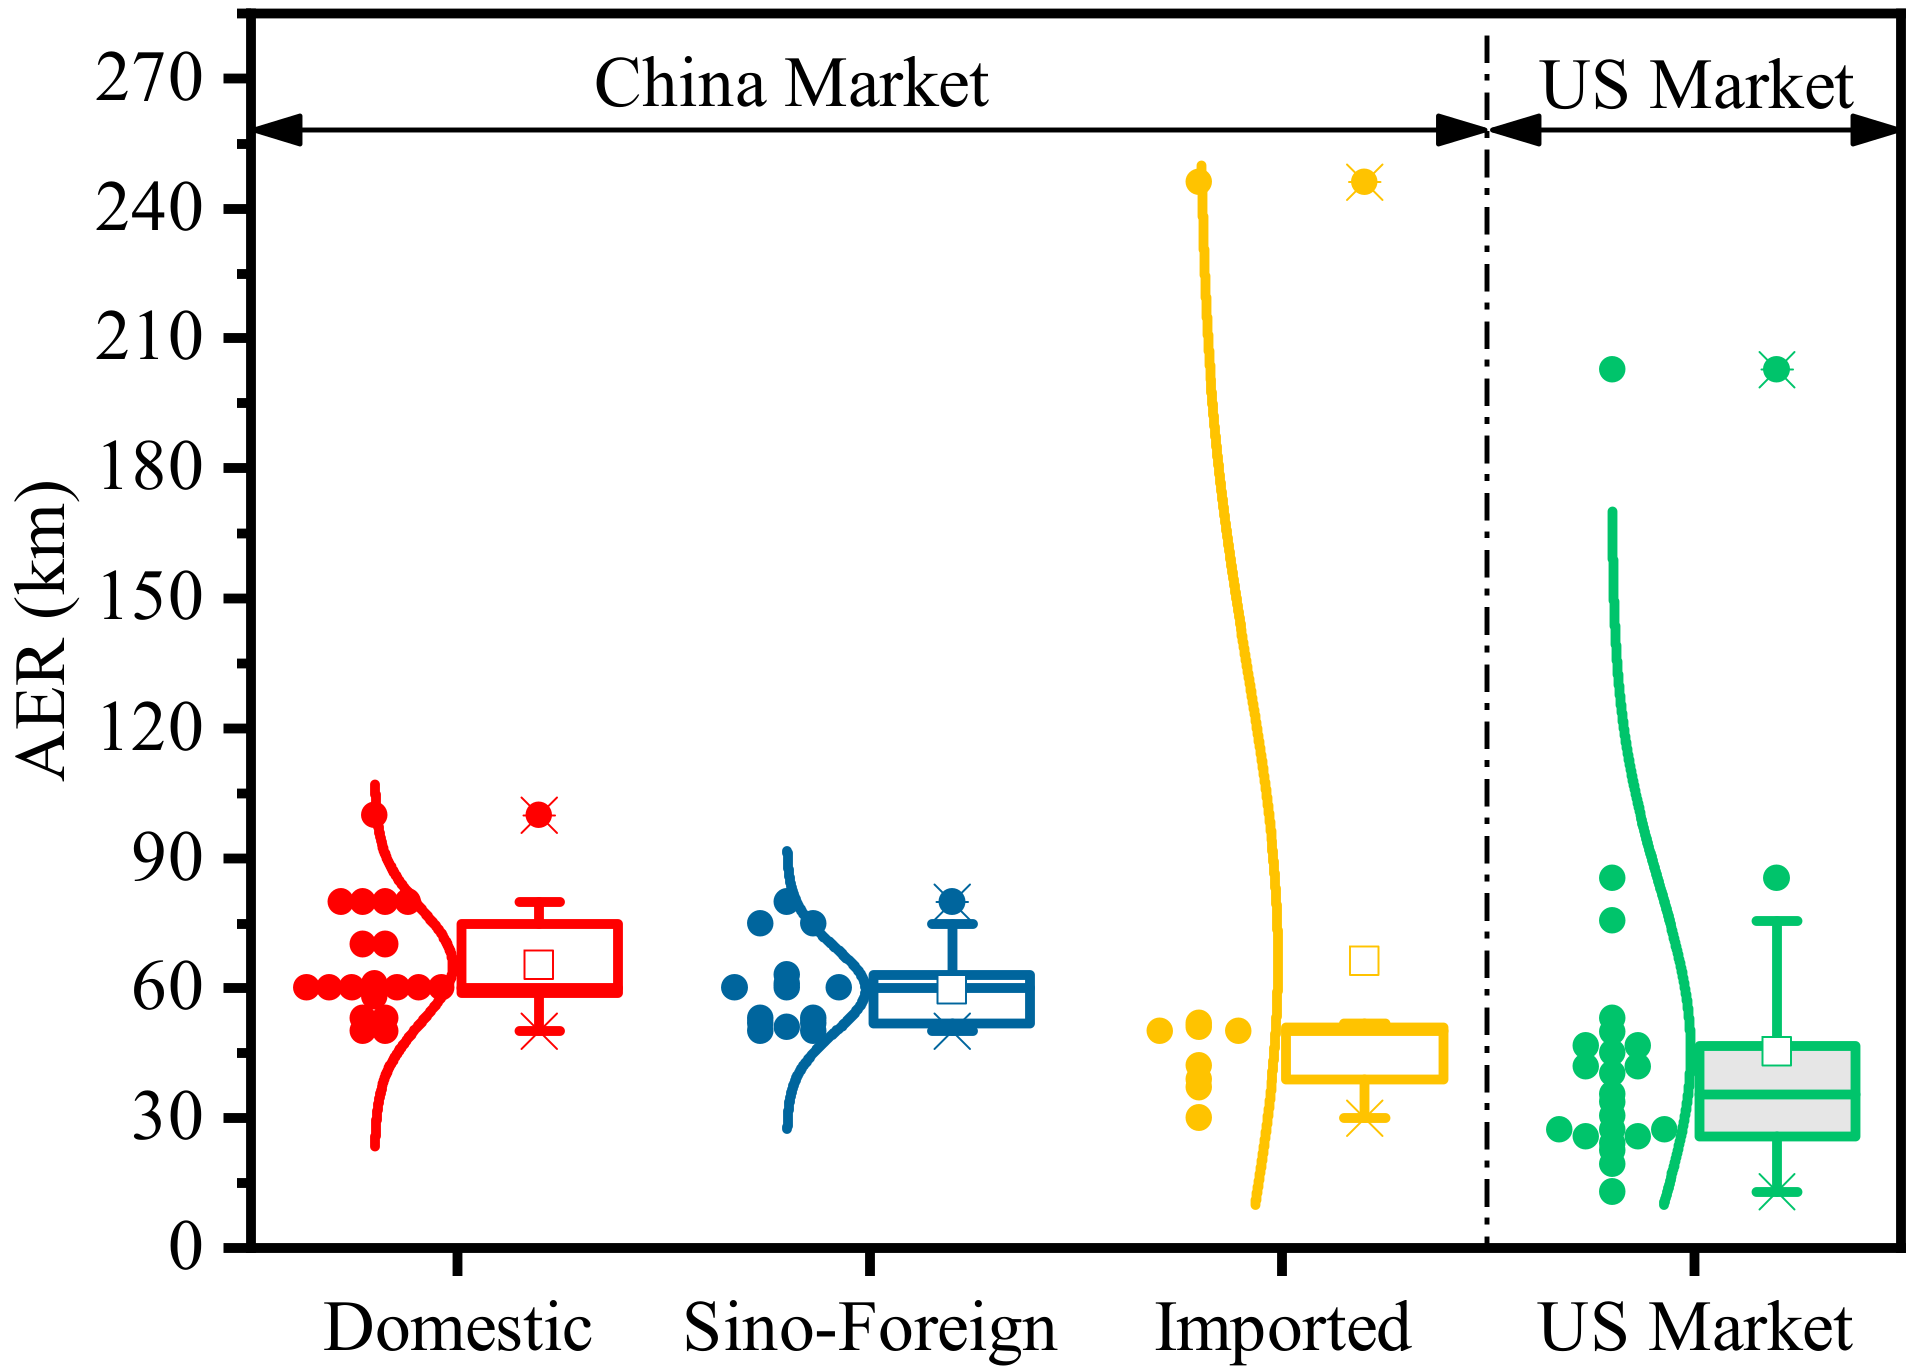
The distribution of AER of PHEV in China and the US market is shown in Figure 10. It can be seen that the AER median value of domestic and Sino-foreign models in the Chinese market is close, slightly higher than that of imported models, and significantly higher than the US market models. This shows that the AER of most domestic and Sino-foreign models are larger than that of imported models and the models in the US market. It might be due to the PHEV subsidy policy on AER that the Chinese government offer subsidies to consumers based on the threshold value of AER at about 50 km. Both the imported models and the models in the US market have a REEV BMW i3 with long AER, which increases the average value of their distributions.

5. Conclusions

This study got insight into the development and technical characteristic of PHEVs in China and the US and presented analysis from the PHEV market to the technical route and then to technical performance. Through the analysis of combined market sales with architectures, the mainstream architectures and the difference of the choices between consumers and automakers in the two largest markets could be found. Through analyzing the performance with market sales and architectures, the salable and high-performance architectures or models could be found, and the relationship between performance and architectures and market sales could also be clearly seen, which is useful for the decision layer of automakers. The main conclusions and findings can be drawn as follows:
(1) In the market aspect, the market analysis shows that the sales, the market share, and the growth of PHEVs in China have surpassed that in the US, but the proportion of PHEVs to NEVs in China is relatively lower. This trend is related to the Chinese government’s efforts to build national energy security, and directly to battery subsidies and PHEV purchase restriction policies. The decline of subsidies will be an opportunity for the increase of proportion of PHEV in China. Besides, both the Chinese and American markets are dominated by a few main models, and the former is dominated by domestic models, while the latter is dominated by Japanese, German and American models.
(2) In respect of architectures, the most mainstream architecture in sales volume is 4WD Bridge and that in models’ amount is P2 in China market, those respectively are PS and P2 in the US market. This reflects that a difference exists between the choice of consumers and that of automakers, and another difference also exists between China and the US. Then the typical architectures qualitative analysis shows that with reducing subsidies in the future, the single-motor parallel architecture will become the first choice for China’s next technical route, and especially the widely studied P2 technology, while the 4WD Bridge will still be the main architecture of SUV or sports car for its better comprehensive performance.
(3) On fuel economy and sales, the comparison of FC and FC2CW in the CS phase shows that the first-ranked sales PHEV models in China and the US markets are both sedans with first-ranked FC and FC2CW, and that among the models with the top five sales of the two countries, the types and sales of SUVs in China are significantly more, however, the fuel economy rankings of theirs in the US are relatively better.
(4) On fuel economy and architectures, the fuel economy comparison of different architectures shows that it is not possible to clearly distinguish the architecture whose economy is absolutely optimal, but that of series REEV is not very good. The fuel economy of PS and P2 models in the US market is generally better than that of the 4WD Bridge models.
(5) In respect to CW and AER, the overall CW of models in the US market is slightly lower than that in the Chinese market, indicating that the lightweight level is slightly higher. In addition to the REEV, the AER of Chinese domestic models are higher than that in the US market, which may be related to the Chinese subsidy policy for PHEVs with AER greater than 50. The results have a reference for manufacturers to deploy PHEV products in China and the US, and also have direct supports for the technical route choice and strategic decision of the enterprise. In future work, we will explore the conversion factor between different testing methods, in order to obtain more accurate rules for the technical route. Besides, we would like to add the time dimension to the analysis of architectures in further study.

Author Contributions

Conceptualization, B.Z. and F.Y.; Data curation, B.Z., L.T. and K.G.; Formal analysis, B.Z., L.T., K.G., W.L. and J.D.; Methodology, B.Z.; Project administration, F.Y. and M.O.; Resources, B.Z.; Supervision, F.Y. and M.O.; Writing—original draft, B.Z.; Writing—review & editing, B.Z., L.T., M.O., W.L. and J.D.

Funding

This study is sponsored by the National Key R&D Program of China (2018YFB0106403). The authors would like to thank the anonymous reviewers for their reviews and comments.

Conflicts of Interest

The authors declare no conflict of interest.

Abbreviations

AERAll Electric Range
BEVBattery Electric Vehicle
BSABelt-driven Starter/Alternator
BSGBelt-driven Starter/Generator
BMWBavarian Motor Works
BYDBuild Your Dream
CDCharge-Depleting
CHANAChangan Auto
CSCharge-Sustaining
CWCurb Weight
DCTDual Clutch Transmission
DMDual Mode
EDUElectric Drive Unit
EPAEnvironmental Protection Agency
EUDCExtra Urban Driving Cycle
FCFuel Consumption
FC2CWFuel Consumption to Curb Weight
FCEVFuel Cell Electric Vehicle
FTPFederal Test Procedure
GACGuangzhou Automobile Company
GMGeneral Motors
GWMGreat Wall Motors
HWFETHighway Fuel Economy Test
HEVHybrid Electric Vehicle
IMAIntegrated Motor Assist
IMMDIntelligent Multi Mode Drive
ISGIntegrated Starter/Generator
MIITMinistry of Industry and Information Technology
MPGMiles per Gallon
NEDCNew European Driving Cycle
NEVNew Energy Vehicle
PEVPlug-in Electric Vehicle
PHEVPlug-in Hybrid Electric Vehicle
PMParticulate Matter
PSPower Split
REEVRange-extended Electric Vehicle
R&DResearch and Development
SAESociety of Automotive Engineers
SAICShanghai Automotive Industry Corporation
SOCState of Charge
SVWShanghai Volkswagen
S-PSeries-Parallel
TCOTotal Cost of Ownership
THSToyota Hybrid System
VWVolkswagen
4UDCFour Urban Driving Cycles
4WDFour-Wheel Driven

References

  1. Du, J.; Ouyang, D. Progress of Chinese electric vehicles industrialization in 2015: A review. Appl. Energy 2017, 188, 529–546. [Google Scholar] [CrossRef]
  2. Kong, F.; Jiang, J.; Ding, Z.; Hu, J.; Guo, W.; Wang, L. A personalized rolling optimal charging schedule for plug-in hybrid electric vehicle based on statistical energy demand analysis and heuristic algorithm. Energies 2017, 10, 1333. [Google Scholar] [CrossRef]
  3. Liu, F.; Zhao, F.; Liu, Z.; Hao, H. China’s electric vehicle deployment: Energy and greenhouse gas emission impacts. Energies 2018, 11, 3353. [Google Scholar] [CrossRef]
  4. Du, J.Y.; Ouyang, M.G.; Chen, J.F.; Hao, H. Evaluation of the plug-in electric vehicles technological roadmap in china. In Proceedings of the International Electric Vehicle Symposium and Exhibition, Seoul, Korea, 3–6 May 2015; pp. 1–7. [Google Scholar]
  5. Vergis, S.; Chen, B. Comparison of plug-in electric vehicle adoption in the United States: A state by state approach. Res. Transp. Econ. 2015, 52, 56–64. [Google Scholar] [CrossRef]
  6. Du, J.Y.; Meng, X.F.; Li, J.Q.; Wu, X.G.; Song, Z.Y.; Ouyang, M.G. Insights into the characteristics of technologies and industrialization for plug-in electric cars in China. Energy 2018, 164, 910–924. [Google Scholar] [CrossRef]
  7. Irle, R. Global EV Sales for 2018—Final Results. Available online: http://www.ev-volumes.com/country/total-world-plug-in-vehicle-volumes/ (accessed on 19 August 2019).
  8. Ouyang, M.; Du, J.; Peng, H.; Wang, H.; Feng, X.; Song, Z. Progress review of US-China joint research on advanced technologies for plug-in electric vehicles. Sci. China-Technol. Sci. 2018, 61, 1431–1445. [Google Scholar] [CrossRef]
  9. Yan, Z.; Wang, M.; Han, H.; Johnson, L.; Wang, H.; Han, H. Plug-in electric vehicle market penetration and incentives: A global review. Mitig. Adapt. Strateg. Glob. Chang. 2015, 20, 777–795. [Google Scholar]
  10. Zhang, X.; Bai, X. Incentive policies from 2006 to 2016 and new energy vehicle adoption in 2010–2020 in China. Renew. Sust. Energ. Rev. 2017, 70, 24–43. [Google Scholar] [CrossRef]
  11. Diao, Q.; Sun, W.; Yuan, X.; Li, L.; Zheng, Z. Life-cycle private-cost-based competitiveness analysis of electric vehicles in China considering the intangible cost of traffic policies. Appl. Energy 2016, 178, 567–578. [Google Scholar] [CrossRef]
  12. Xie, X.; Zhang, T.; Huang, Z. Life cycle assessment of energy use and GHG emissions of plug-in hybrid electric vehicles in China. In Proceedings of the SAE World Congress & Exhibition, Detroit, USA, 16–18 April 2013; pp. 1–8. [Google Scholar]
  13. Xiong, S.; Ji, J.; Ma, X. Comparative life cycle energy and GHG emission analysis for BEVs and PHEVs: A case study in China. Energies 2019, 12, 834. [Google Scholar] [CrossRef]
  14. Hutchinson, T.; Burgess, S.; Herrmann, G. Current hybrid-electric powertrain architectures: Applying empirical design data to life cycle assessment and whole-life cost analysis. Appl. Energy 2014, 119, 314–329. [Google Scholar] [CrossRef] [Green Version]
  15. Gnann, T.; Stephens, T.S.; Lin, Z.; Plotz, P.; Liu, C.; Brokate, J. What drives the market for plug-in electric vehicles? - a review of international pev market diffusion models. Renew. Sust. Energ. Rev. 2018, 93, 158–164. [Google Scholar] [CrossRef]
  16. Rietmann, N.; Lieven, T. How policy measures succeeded to promote electric mobility—worldwide review and outlook. J. Cleaner Prod. 2019, 206, 66–75. [Google Scholar] [CrossRef]
  17. Andress, D.; Das, S.; Joseck, F.; Dean Nguyen, T. Status of advanced light-duty transportation technologies in the US. Energ. Policy 2012, 41, 348–364. [Google Scholar] [CrossRef]
  18. Zhang, X.; Liang, Y.; Yu, E.; Rao, R.; Xie, J. Review of electric vehicle policies in China: Content summary and effect analysis. Renew. Sust. Energ. Rev. 2017, 70, 698–714. [Google Scholar] [CrossRef]
  19. Saxena, S.; Phadke, A.; Gopal, A. Understanding the fuel savings potential from deploying hybrid cars in China. Appl. Energy 2014, 113, 1127–1133. [Google Scholar] [CrossRef]
  20. Palmer, K.; Tate, J.E.; Wadud, Z.; Nellthorp, J. Total cost of ownership and market share for hybrid and electric vehicles in the UK, US and Japan. Appl. Energy 2018, 209, 108–119. [Google Scholar] [CrossRef]
  21. Du, J.; Ouyang, M.; Wu, X.; Meng, X.; Li, J.; Li, F.; Song, Z. Technological direction prediction for battery electric bus under influence of China’s new subsidy scheme. J. Cleaner Prod. 2019, 222, 267–279. [Google Scholar] [CrossRef]
  22. Fotouhi, A.; Auger, D.J.; Propp, K.; Longo, S.; Wild, M. A review on electric vehicle battery modelling: From lithium-ion toward lithium-sulphur. Renew. Sust. Energ. Rev. 2016, 56, 1008–1021. [Google Scholar] [CrossRef]
  23. Jochem, P.; Doll, C.; Fichtner, W. External costs of electric vehicles. Transport. Res. Part D-Transport. Environ. 2016, 42, 60–76. [Google Scholar] [CrossRef] [Green Version]
  24. Sabri, M.F.M.; Danapalasingam, K.A.; Rahmat, M.F. A review on hybrid electric vehicles architecture and energy management strategies. Renew. Sust. Energ. Rev. 2016, 53, 1433–1442. [Google Scholar] [CrossRef]
  25. Roy, F.; Gazo, C.; Ossart, F.; Marchand, C. Triz methodology adapted to hybrid powertrains performances evaluation. Procedia Eng. 2015, 131, 861–870. [Google Scholar] [CrossRef]
  26. Huang, Y.; Wang, H.; Khajepour, A.; Li, B.; Ji, J.; Zhao, K.; Hu, C. A review of power management strategies and component sizing methods for hybrid vehicles. Renew. Sust. Energ. Rev. 2018, 96, 132–144. [Google Scholar] [CrossRef]
  27. Martínez, C.M.; Hu, X.; Cao, D.; Velenis, E.; Wellers, M. Energy management in plug-in hybrid electric vehicles: Recent progress and a connected vehicles perspective. IEEE Trans. Veh. Technol. 2016, 66, 1–16. [Google Scholar] [CrossRef]
  28. Cagatay Bayindir, K.; Gozukucuk, M.A.; Teke, A. A comprehensive overview of hybrid electric vehicle: Powertrain configurations, powertrain control techniques and electronic control units. Energy Convers. Manag. 2011, 52, 1305–1313. [Google Scholar] [CrossRef]
  29. Freyermuth, V.; Fallas, E.; Rousseau, A. Comparison of powertrain configuration for plug-in hevs from a fuel economy perspective. SAE Int. J. Engines 2008, 1, 392–398. [Google Scholar] [CrossRef]
  30. Wu, G.; Zhang, X.; Dong, Z. Powertrain architectures of electrified vehicles: Review, classification and comparison. J. Franklin Inst. 2015, 352, 425–448. [Google Scholar] [CrossRef]
  31. Wang, W.; Song, R.; Guo, M.; Liu, S. Analysis on compound-split configuration of power-split hybrid electric vehicle. Mech. Mach. Theory 2014, 78, 272–288. [Google Scholar] [CrossRef]
  32. Ngo, H.T.; Yan, H.S. Configuration synthesis of parallel hybrid transmissions. Mech. Mach. Theory 2016, 97, 51–71. [Google Scholar] [CrossRef]
  33. Hegazy, O.; Barrero, R.; Van den Bossche, P.; El Baghdadi, M.; Smekens, J.; Van Mierlo, J.; Vriens, W.; Bogaerts, B. Modeling, analysis and feasibility study of new drivetrain architectures for off-highway vehicles. Energy 2016, 109, 1056–1074. [Google Scholar] [CrossRef]
  34. Walker, P.D.; Roser, H.M. Energy consumption and cost analysis of hybrid electric powertrain configurations for two wheelers. Appl. Energy 2015, 146, 279–287. [Google Scholar] [CrossRef]
  35. Rashid, M.I.M.; Danial, H. Advisor simulation and performance test of split plug-in hybrid electric vehicle conversion. Energy Procedia 2017, 105, 1408–1413. [Google Scholar] [CrossRef]
  36. Anderson, P.; Tushman, M.L. Technological discontinuities and dominant designs: A cyclical model of technological change. Adm. Sci. Q. 1990, 35, 604–633. [Google Scholar] [CrossRef]
  37. Shi, T.; Zhao, F.; Hao, H.; Chen, K.; Liu, Z. Structure analysis and cost estimation of hybrid electric passenger vehicle and the application in china case. In Proceedings of the Wcx World Congress Experience, Detroit, MI, USA, 3–6 April 2018; pp. 1–10. [Google Scholar]
  38. Liu, J.; Peng, H. Modeling and control of a power-split hybrid vehicle. IEEE Trans. Control Syst. Technol. 2008, 16, 1242–1251. [Google Scholar]
  39. Chen, Y.-S.; Chang, J.; Chen, I.-M.; Chen, M.-Y.; Liu, T. Conceptual design and evaluation of a hybrid transmission with power-split, series, and two parallel configurations. SAE Int. J. Altern. Powertrains 2017, 6, 122–135. [Google Scholar] [CrossRef]
  40. Ahn, K.; Cho, S.; Lim, W.; Park, Y.I.; Lee, J.M. Performance analysis and parametric design of the dual-mode planetary gear hybrid powertrain. Proc. Inst. Mech. Eng. Part D-J. Automob. Eng. 2006, 220, 1601–1614. [Google Scholar] [CrossRef]
  41. Yang, Y.; Hu, X.; Pei, H.; Peng, Z. Comparison of power-split and parallel hybrid powertrain architectures with a single electric machine: Dynamic programming approach. Appl. Energy 2016, 168, 683–690. [Google Scholar] [CrossRef]
  42. Knackstedt, C.; Jambor, E.; Bradley, T. Ecocar 3: Architecture selection validation through vehicle modeling and simulation for the colorado state university vehicle innovation team. IFAC-PapersOnLine 2015, 48, 147–152. [Google Scholar] [CrossRef]
  43. Lanzarotto, D.; Marchesoni, M.; Passalacqua, M.; Prato, A.P.; Repetto, M. Overview of different hybrid vehicle architectures. IFAC-PapersOnLine 2018, 51, 218–222. [Google Scholar] [CrossRef]
  44. Karbowski, D.; Pagerit, S.; Kwon, J.; Rousseau, A.; Karl-Felix Freiherr, V.P. “Fair” Comparison of Powertrain Configurations for Plug-in Hybrid Operation Using Global Optimization; SAE Technical Paper, 2009-01-1334; SAE: Warrendale, PA, USA, 2009. [Google Scholar]
  45. Zhou, X.; Qin, D.; Hu, J. Multi-objective optimization design and performance evaluation for plug-in hybrid electric vehicle powertrains. Appl. Energy 2017, 208, 1608–1625. [Google Scholar] [CrossRef]
  46. Chung, C.-T.; Hung, Y.-H. Performance and energy management of a novel full hybrid electric powertrain system. Energy 2015, 89, 626–636. [Google Scholar] [CrossRef]
  47. MEP. China Vehicle Environment Management Annual Report; Ministry of Environmental Protection of People Republic of China: Beijing, China, 2016; pp. 1–47.
  48. Clairand, J.-M.; Guerra-Teran, P.; Serrano-Guerrero, X.; Gonzalez-Rodriguez, M.; Escriva-Escriva, G. Electric vehicles for public transportation in power systems: A review of methodologies. Energies 2019, 12, 3114. [Google Scholar] [CrossRef]
  49. Demandt, B. Global Car Sales Analysis 2018. Available online: http://carsalesbase.com/global-car-sales-2018/ (accessed on 20 August 2019).
  50. Chen, K.; Zhao, F.; Hao, H.; Liu, Z. Synergistic impacts of China’s subsidy policy and new energy vehicle credit regulation on the technological development of battery electric vehicles. Energies 2018, 11, 3193. [Google Scholar] [CrossRef]
  51. Xu, C.; Guo, K.; Yang, F. A comparative study of different hybrid electric powertrain architectures for heavy-duty truck. IFAC-PapersOnLine 2018, 51, 746–753. [Google Scholar] [CrossRef]
  52. Vora, A.P.; Jin, X.; Hoshing, V.; Saha, T.; Shaver, G.; Varigonda, S.; Wasynczuk, O.; Tyner, W.E. Design-space exploration of series plug-in hybrid electric vehicles for medium-duty truck applications in a total cost-of-ownership framework. Appl. Energy 2017, 202, 662–672. [Google Scholar] [CrossRef]
  53. Brooke, L. Positioning for hybrid growth. SAE Int. Automot. Eng. 2017, 9, 32–34. [Google Scholar]
  54. Cheng, C.; McGordon, A.; Jones, R.P.; Jennings, P.A. Comprehensive forward dynamic HEV powertrain modelling using dymola and Matlab/Simulink. IFAC Proc. Vol. 2010, 43, 536–541. [Google Scholar] [CrossRef]
  55. Emadi, A.; Rajashekara, K.; Williamson, S.S.; Lukic, S.M. Topological overview of hybrid electric and fuel cell vehicular power system architectures and configurations. IEEE Trans. Veh. Technol. 2005, 54, 763–770. [Google Scholar] [CrossRef]
  56. Enang, W.; Bannister, C. Modelling and control of hybrid electric vehicles (a comprehensive review). Renew. Sust. Energ. Rev. 2017, 74, 1210–1239. [Google Scholar] [CrossRef]
  57. MEE; GAQSIQ. Limits and Measurement Methods for Emissions from Light-Duty Vehicles (China 5), GB 18352.5-2013; Ministry of Eology and Environment of People Republic of China: Beijing, China, 2013; pp. 1–164.
  58. SAC; GAQSIQ. Test Methods for Energy Consumption of Light-Duty Hybrid Electric Vehicles, GB/T 19753-2013; Standardization Administration of People Republic of China: Beijing, China, 2013; pp. 1–20.
  59. SAE. Recommended Practice for Measuring the Exhaust Emissions and Fuel Economy of Hybrid-Electric Vehicles, Including Plug-in Hybrid Vehicles. J1711; SAE: Warrendale, PA, USA, 2010; pp. 1–63.
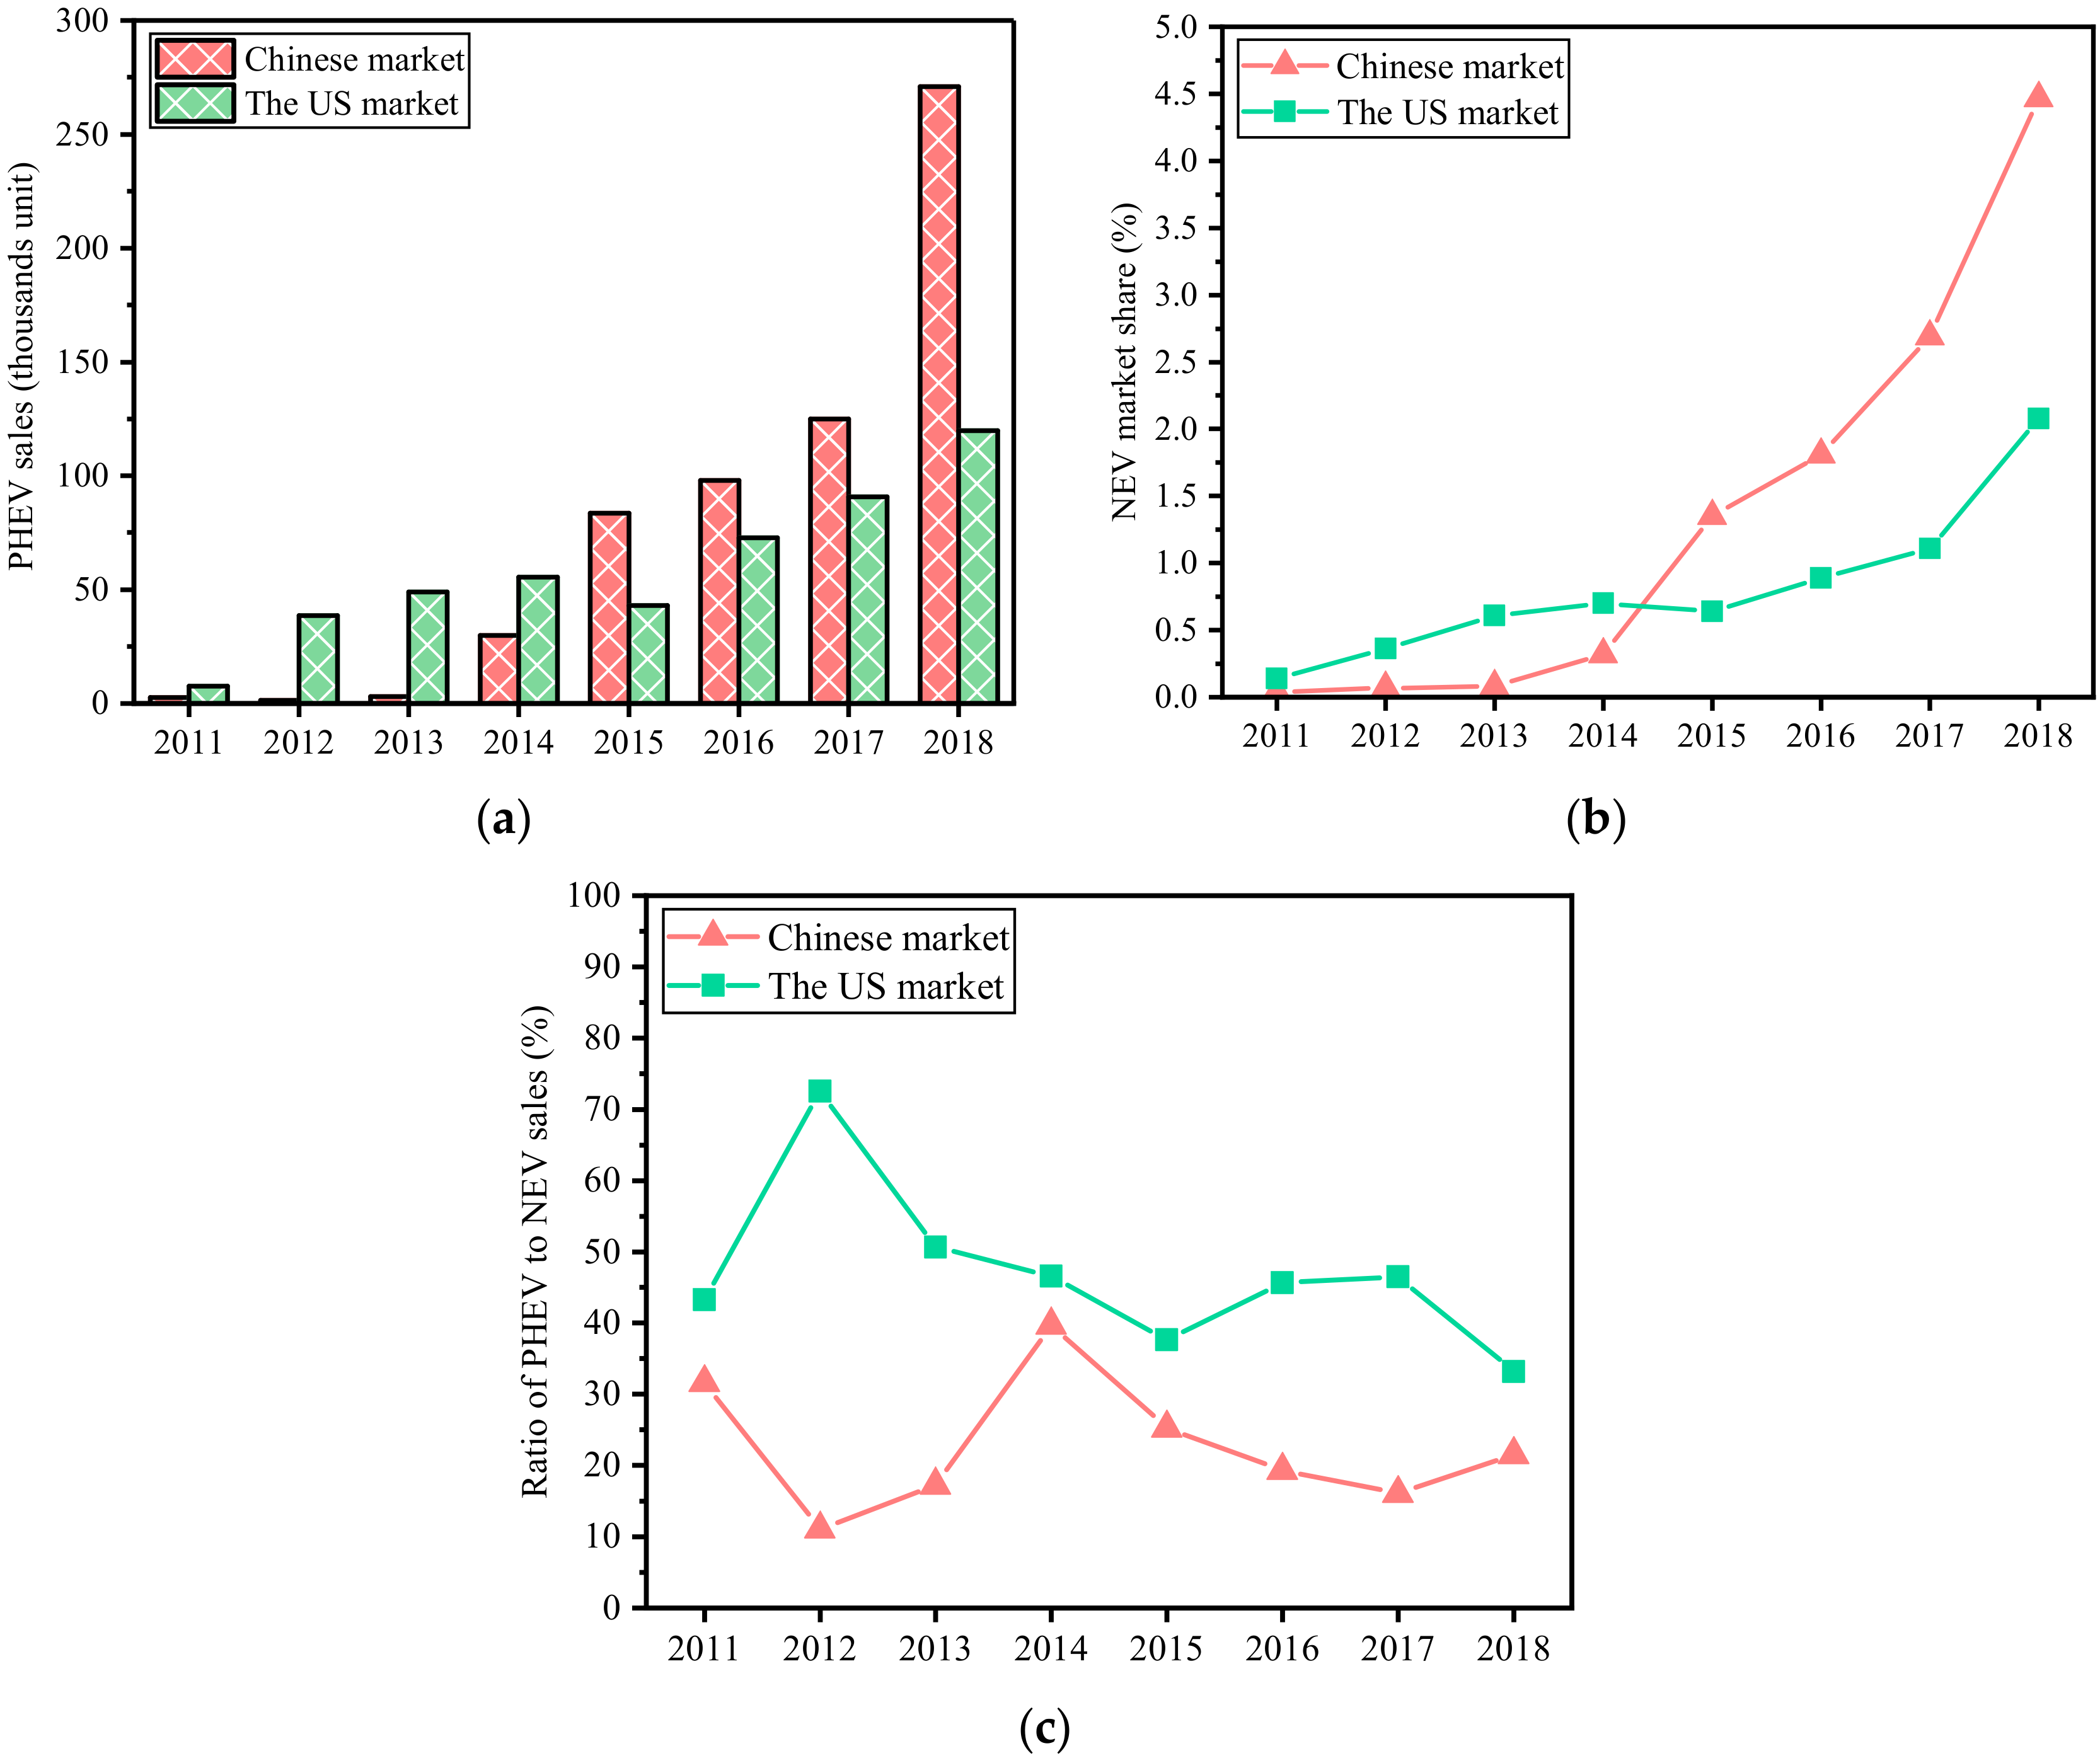
Figure 1. Plug-in hybrid electric vehicle (PHEV) and new energy vehicle (NEV) sales and market share in the Chinese market and the US market: (a) PHEV sales, (b) NEV market share, (c) the ratio of PHEV to NEV sales.
Energies 12 03753 g001
Figure 2. PHEV models and manufacturers in (a) China’s market and (b) the US market, in 2018.
Energies 12 03753 g002aEnergies 12 03753 g002b
Figure 3. Hybrid system architectures classified by motor position [53].
Energies 12 03753 g003
Figure 4. Proportions of different architectures in 2018.
Energies 12 03753 g004
Figure 5. PHEV testing drive cycles in China and the US.
Energies 12 03753 g005
Figure 6. Fuel consumption (FC) and fuel consumption to curb weight (FC2CW) of PHEV models in (a) China’s market and (b) the US market.
Energies 12 03753 g006
Figure 7. (a) FC and (b) FC2CW statistical distribution of PHEV models in China’s market and the US market.
Energies 12 03753 g007
Figure 8. FC and FC2CW of different PHEV architectures and models in (a) the Chinese market and (b) the American market.
Energies 12 03753 g008
Figure 9. Curb weight (CW) distribution in Chinese and American markets.
Energies 12 03753 g009
Figure 10. All electric range (AER) distribution in Chinese and American markets.
Energies 12 03753 g010
Table 1. Summary of the literature review.
CategoryFocusMethodComment
MarketMarket conditions [9];
Market-related policies [10];
Costs [11,12,13];
Choices of market subjects [14]
Market penetration [1];
Market share [16];
Market model [15];
Cost model [20,21,22,23];
Policy review [10,16,17,18,19];
Policy and market model [16]
(1) Few analyses combined market and technology;
(2) Lack of test performance comparison of detailed architectures of models in the market;
(3) Lack of a unified classification method to characterize models in market
TechnologyArchitecture design [24,25];
Component sizing [26];
Control strategy [27]
Architecture classification and selection [28,29,30,31,42,43];
Architecture design [32,33,34]; Performance simulation [35,37];
Optimization and comparison [2,41,44,45]
Combined market and technologyParameter and market comparisonParameter data comparison [1,6]Lack of analysis on architectures and market data.
Table 2. Detailed classification of typical HEV models and architectures.
Basic CategoryMixed ModeMotor PositionCommon NameApplied Model
SeriesElectric coupling“P1 + P3”SeriesNissan Note e-Power, BMW i3, GAC GA5
ParallelMechanical couplingP0BSG/BSAGM Saturn VUE, Mazda CX-5
P1ISG/Single clutch parallelHonda Insight 2001, Honda Civic 2003, Honda Accord 2005, Mercedes Benz S400
P2Parallel P2/Dual clutch parallelAudi A3 e-Tron, BMW 330e, BMW 530e, BMW X5, VW Golf GTE, SVW Passat, Mercedes Benz E00, Mercedes Benz S550, Infiniti Q50, Hyundai Sonata 9, Hyundai Ioniq, Honda Fit, Kia Niro, Kia Optima, CHANA EADO, Chery Exeed TX
P2.5Parallel P2.5Lynk 01 Jin Lite, Geely Bo Rui GE
P3Parallel P3/Rear parallelBYD Qin
P4--
CompoundElectric and mechanical couplingP0 + P4Series-Parallel/Combined hybrid4WD Bridge/“P4+”BMW X1, BMW i8, GWM WEY P8, MINI Cooper
P1 + P4Volvo S60L, Volvo XC90 T8
P3 + P4BYD Song 1st DM, BYD Tang DM 1st Gen, BYD Yuan DM 1st Gen
P0 + P3 + P4BYD Tang DM 2nd Gen, BYD Qin Pro DM, Mitsubishi Outlander
P1 + P3 + P4CHANA CS75
P1 + P4 + P4Honda Acura NSX
P1 + P3Non-“P4+”Honda Clarity, Honda Accord, GAC Trumpchi GS4, BYD F3DM
P1 + P2SAIC Roewe e550, SAIC Roewe e950, SAIC Roewe eRX5
PSPower splitToyota Prius Prime, Ford Fusion Energi, Chrysler Pacifica, GM Cadillac CT6, GM Velite5, Subaru Crosstek, Chevrolet Volt, Changan Ford Mondeo, Geely Emgrand
BSA: Belt-Driven Starter/Alternator; BSG: Belt-Driven Starter/Generator; BMW: Bavarian Motor Works; BYD: Build Your Dream; CHANA: Changan Auto; DM: Dual Mode; GAC: Guangzhou Automobile Company; GM: General Motors; GWM: Great Wall Motors; ISG: Integrated Starter/Generator; PS: Power Split; SVW: Shanghai Volkswagen; VW: Volkswagen; 4WD: Four-Wheel Driven.
Table 3. Qualitative evaluation of multi-dimensional performance for PHEV architectures. Each typical architecture is qualitatively evaluated from the aspects of its economy and dynamic performance, cost, and technical difficulty of powertrain control and assembly, a total of 9 dimensions.
Typical ArchitectureEconomyDynamicCostTechnical Difficulty
η e η m η d s E r e E i s ControlAssembly
Series
Parallel P2
Parallel P2.5
Parallel P3
4WD Bridge
Non-“P4+”
PS
█: Good/ High/Difficult; ▄: Medium; ▁: Bad/Low/Easy. η e : Engine efficiency; η m : Motor efficiency; η d s : Drive system efficiency; E r e : Energy of recovery; E i s : Energy saving from engine idle stop.
Table 4. Characteristic parameters of drive cycles.
AttributesNEDC4UDCEUDCFTP-75HWFET
Time (s)11807804001874765
Top speed (km/h)1205012091.2596.4
Average speed (km/h)33.3518.3562.5934.1377.67
Distance (km)10.933.986.9517.7716.51
Maximum acceleration (m/s2)1.061.060.831.481.43
Minimum deceleration (m/s2)−1.39−0.83−1.39−1.48−1.48
Idling time percent (%)23.8130.9010.0017.930.65
Standard deviation of speed (km/h)31.0617.0131.4125.6516.47
Standard deviation of acceleration (m/s2)0.420.450.380.630.30
Coefficient of variation of speed (%)93.1292.6950.1975.1621.21
NEDC: New European Driving Cycle; 4UDC: Four Urban Driving Cycles; EUDC: Extra Urban Driving Cycle; FTP: Federal Test Procedure; HWFET: Highway Fuel Economy Test.