Article

A Dynamic Analysis of the Multi-Stack SOFC-CHP System for Power Modulation

Hydrogen & Fuel Cell Project, Green Energy & Environment Research Laboratories, Industrial Technology Research Institute, 7F, No.301, Gaofa 3rd Rd., Guiren Dist., Tainan 71150, Taiwan
*
Author to whom correspondence should be addressed.
Energies 2019, 12(19), 3686; https://doi.org/10.3390/en12193686
Submission received: 31 July 2019 / Revised: 18 September 2019 / Accepted: 23 September 2019 / Published: 26 September 2019

Abstract

:
This paper performs a dynamic analysis of a 10-kW solid oxide fuel cell/combined heat and power (SOFC-CHP) system with a multi-stack module via numerical simulations. The performance of stacks, tail gas burners, heat exchangers, and fuel reformers are modeled by the MATLAB/Simulink module. The effects of fuel and air maldistribution on SOFC-CHP systems are addressed in this work. A two-stack module for 10-kW power generation is adopted to represent the multi-stack module with high power modulation. The air flow rate and operating current, which are related to the fuel use rate of an SOFC system, should be optimally regulated to perform with maximum power generation and efficiency. The proposed dynamic analysis shows that the operating temperatures of the two stacks have a difference of 33 K, which results in a reduced total power generation of 9.77 kW, with inconsistent fuel use (FU) rates of 78.3% and 56.8% for the two stacks. With the optimal control strategy, the output power is increased to 10.6 kW, an increment of 8.5%, and the FU rates of the two stacks are improved to 79% and 70%, respectively. As a potential distributed power generator, the long-term effects of the studied SOFC-CHP systems are also investigated. The dynamic analysis of the long-term operating SOFC-CHP system shows that the total daily output power can be increased 7.34% by using the optimal control strategy.

Graphical Abstract

1. Introduction

Solid oxide fuel cells (SOFCs) are one of the most efficient types of power generation fuel cells. The efficiency of SOFC-based electricity generators exceeds that of conventional thermal cycles. Higher electrical efficiencies are expected if waste heat or fuel from the high-temperature SOFC is further used in the thermal cycles. An efficiency in excess of 70% is, for example, projected for the SOFC-gas turbine combined cycle concepts [1,2,3].
We analyzed a combined power generation cycle with low- and high-temperature SOFCs arranged in series (including a gas turbine) and revealed that the two-staged SOFC cycle has both higher SOFC power generation efficiency and higher combined cycle efficiency [4,5]. Some groups have also worked on the development of in-series interconnection SOFCs enabling a high-voltage and high-fuel-use compact unit [6,7].
A thermodynamic analysis of different SOFC combined cycles, including a novel reciprocating engine integrated scheme, have been discussed in recent years [8]. These studies investigate system performance to analyze the constant efficiency, stack power density, and fraction of total power delivered in different SOFC combined cycles. Herein, a combined heat and power (CHP) or combined cool, heat, and power (CCHP) system using an SOFC was investigated. The influence of several effective parameters (cell temperatures, pressures, fuel use coefficients, and system air: fuel ratios) on SOFC-CHP were investigated. Pirkandi et al. [9] developed a tubular single cell SOFC by using a self-established electrochemical model, including activation, ohmic, and concentrative losses. Increasing the working pressure and temperature of the cell causes the voltage to increase and enhances the cell’s performance.
Therefore, the system’s thermal and mass flow management directly affects the performance of the cell or system. An SOFC dynamic model based on electrochemical reactions and enthalpy balance equations was developed to solve thermal management issues [10]. Furthermore, the interactions between components of the micro-CHP system and SOFCs were analyzed by off-design simulation [11]. The electrical and overall efficiency maps can be used to establish an operating strategy for SOFC systems.
Moreover, we evaluated the potential of integrating a gasification-SOFC-CHP system in an existing manufacturing production process. The integrated SOFC/Gasifier can be considered a high-efficiency tri-generator capable of accomplishing energy valorization of high quality [12,13]. High-temperature fuel cells are appropriate energy converters for biogas. Different types of feeds as mixtures were considered. These mixtures differ from each other in the composition of their gaseous substances and their quantity of CO [14]. Stack performances were mapped by varying some operating cell parameters: the operating temperature and the fuel use factor. In particular, different mixtures made up of 10%, 15%, and 20% CO were taken into account at different operating temperatures (923, 973, and 1003 K) [15].
An optimized control system with a hybrid system transient model was implemented, validated, and tested. Compared to previous studies, we better performance in controlling fuel cell temperature, reducing the pressure gap between cathode and anode sides, and generating a higher safe margin for the steam-to-carbon ratio [16]. Hence, optimized operating procedures and controlling strategies should be developed to implement a high-efficiency and reliable SOFC combined system.
For the long-term operation test of an SOFC system, a multi-supply–multi-demand-controlled strategy was provided, which was deemed to be effective for year-round operation of the SOFC combined cycle under changing climatic and loading conditions [17]. This control strategy can be realized for an actual CCHP system linked up with a building and energy management system.
Moreover, not only energy and heat management but also component materials are considered for a developing a SOFC system. Due to thermal shock issues of the SOFC stack and system, both the large thermal gradients in the system and thermal expansion coefficient mismatches must be avoided [18]. Therefore, the start-up and thermal aspects of SOFC stacks embedded in a whole system with additional components, such as reformers, heat exchangers, and catalytic burners, are key factors in the system’s demonstration.
In addition, anode off-gas recycling and fuel control are methods used to increase the system efficiency. Different operating conditions and system configurations can increase the stack net electrical efficiency to 57% by implementing an anode off-gas recycle rate of 65% and a fuel use for the stack of 55% [19]. The estimation of balance of power (BOP) for the SOFC system and minimization of the system’s heat loss are key factors to establish a high performance SOFC system. If the external heat transfer coefficient related to the environments is decreased to 50%, the system’s heat loss is reduced significantly, and the reformer’s efficiency is enhanced [20].
We used a previously developed dynamic SOFC model, which consists of mass and energy balances and an electrochemical model that relates the fuel and air gas compositions and temperature to voltage, current density, and other relevant fuel cell variables. Knowledge of the dynamic behavior of these variables is important when looking for suitable control strategies [21,22,23]. Predictions of the model provide basic insight into the operation of power generation-based SOFC systems during various transients and support its further design modifications [24].
To improve the performance and efficiency of the SOFC power generation system, and achieve thermal control of the whole SOFC system, we used a thermodynamic method and a dynamic analysis model to calculate the gas outlet temperature from the dual SOFC stack and hot box in several different operating conditions. The predictions that can be made using thermodynamic equations are essential for understanding and modeling SOFC performance, since SOFCs transform chemical energy into electrical energy.
This paper focuses on the numerical simulations of a 10 kW SOFC-CHP system with a two-stack module. The performance parameters of an SOFC system, fuel use rate, operating temperature, current, and mass flow rate are discussed. To optimize the system control strategy, the previous parameters are modulated to increase the electrical power and fuel use rate. The dynamic model is built to be multi-dimensional and time-dependent to simulate the status of each component in the SOFC system from start-up to power generation.
Finally, the simulation model for the SOFC-CHP with dual stacks is presented to evaluate different operating parameters, with a focus on achieving the maximum possible power efficiency. As a potential distributed power generator, the long-term effects of the studied SOFC-CHP systems are also investigated. The dynamic analysis of the long-term operating SOFC-CHP system shows that the total daily output power can be increased by using the optimal control strategy.

2. Method

The SOFC power system can be divided into three main parts, the stack module, the hot box, and the cold box. The stack module integrates multi-stacks with series and parallel connections to convert the chemical energy of fuel gas to electrical power and heat. To make the system operate under efficient thermodynamic equilibrium, the components of the hot box, e.g., the heat exchanger, burner, and reformer, are used for the heat and mass transfer and recovery of the fluids in the system. The cold box includes balance of plant (BOP) components to control the fluid flow rates and power loading, and to ensure that the system is safely operating.
In this paper, a theoretical model for oxygen-ion conducting SOFC systems is simulated using the Thermolib, which is a toolbox based on MATLAB/Simulink for the design and development of thermodynamic systems. The simulation program of Thermolib has been used to simulate the system widely, including SOFC systems. For example, T. C. Cheng et al. [25] used Thermolib to calculate the proton type of an SOFC system and analyze its efficiency for different flow rations. D. Y. Tanaka et al. [26] used Thermolib to calculate SOFC efficiency and analyze the influence between fuel use and efficiency. In this paper, Thermolib is used to simulate the dynamic process of the whole SOFC system. Thermolib is a program that can be accurately fit to simulate heat components, such as a heat exchanger, reformer, and SOFC stack. By using Thermolib, the parameters of heat components can be selected by a researcher to fit the true experiments. The numerical models are described below:

2.1. Numerical Modeling of the SOFC Stack

The electrochemical reactions of the solid oxide fuel cell are
Anode:
H 2 + O 2 H 2 O + 2 e ,
Cathode:
1 2 O 2 + 2 e O 2 ,
Overall:
H 2 + 1 2 O 2 H 2 O .
To calculate the performance of the SOFC, the cell voltage variation under different loads is evaluated by the Bulter–Volmer Equation:
E ( i ) = E 0 - η Ohm - η Act , a - η Act , c - η Con , a - η Con , C
where E 0 is the open circuit voltage, η Ohm is the ohmic impedance, η Act , a is the anode activation impedance, η Act , c is the cathode activation impedance, η Con , a is the anode concentration polarization impedance, and η Con , C is the cathode concentration polarization impedance. The impedance is calculated by the Nernst equation, as follows:
E 0 = R T 2 F ln K R T 4 F ln ( ( p H 2 O I ) 2 p 0 ( p H 2 I ) 2 p O 2 I )
η O H m = i R e
η Act , a = 2 R T n e F sinh 1 ( i 2 i oa )
η Act , c = 2 R T n e F sinh 1 ( i 2 i oc )
η Con , a = R T 2 F ln [ 1 ( R T 2 F ) ( l a D a ( eff ) p H 2 I ) i 1 + ( R T 2 F ) ( l a D a ( eff ) p H 2 O I ) i ]
η Con , C = R T 4 F ln [ ( p C δ O 2 ) ( ( p C δ O 2 ) p O 2 I ) exp [ ( R T 4 F ) ( δ O 2 l C / D e ( eff ) p C ) i ] p O 2 I ]
The parameters used in the above equations are listed in Table 1 with reference to the literature [27,28,29].

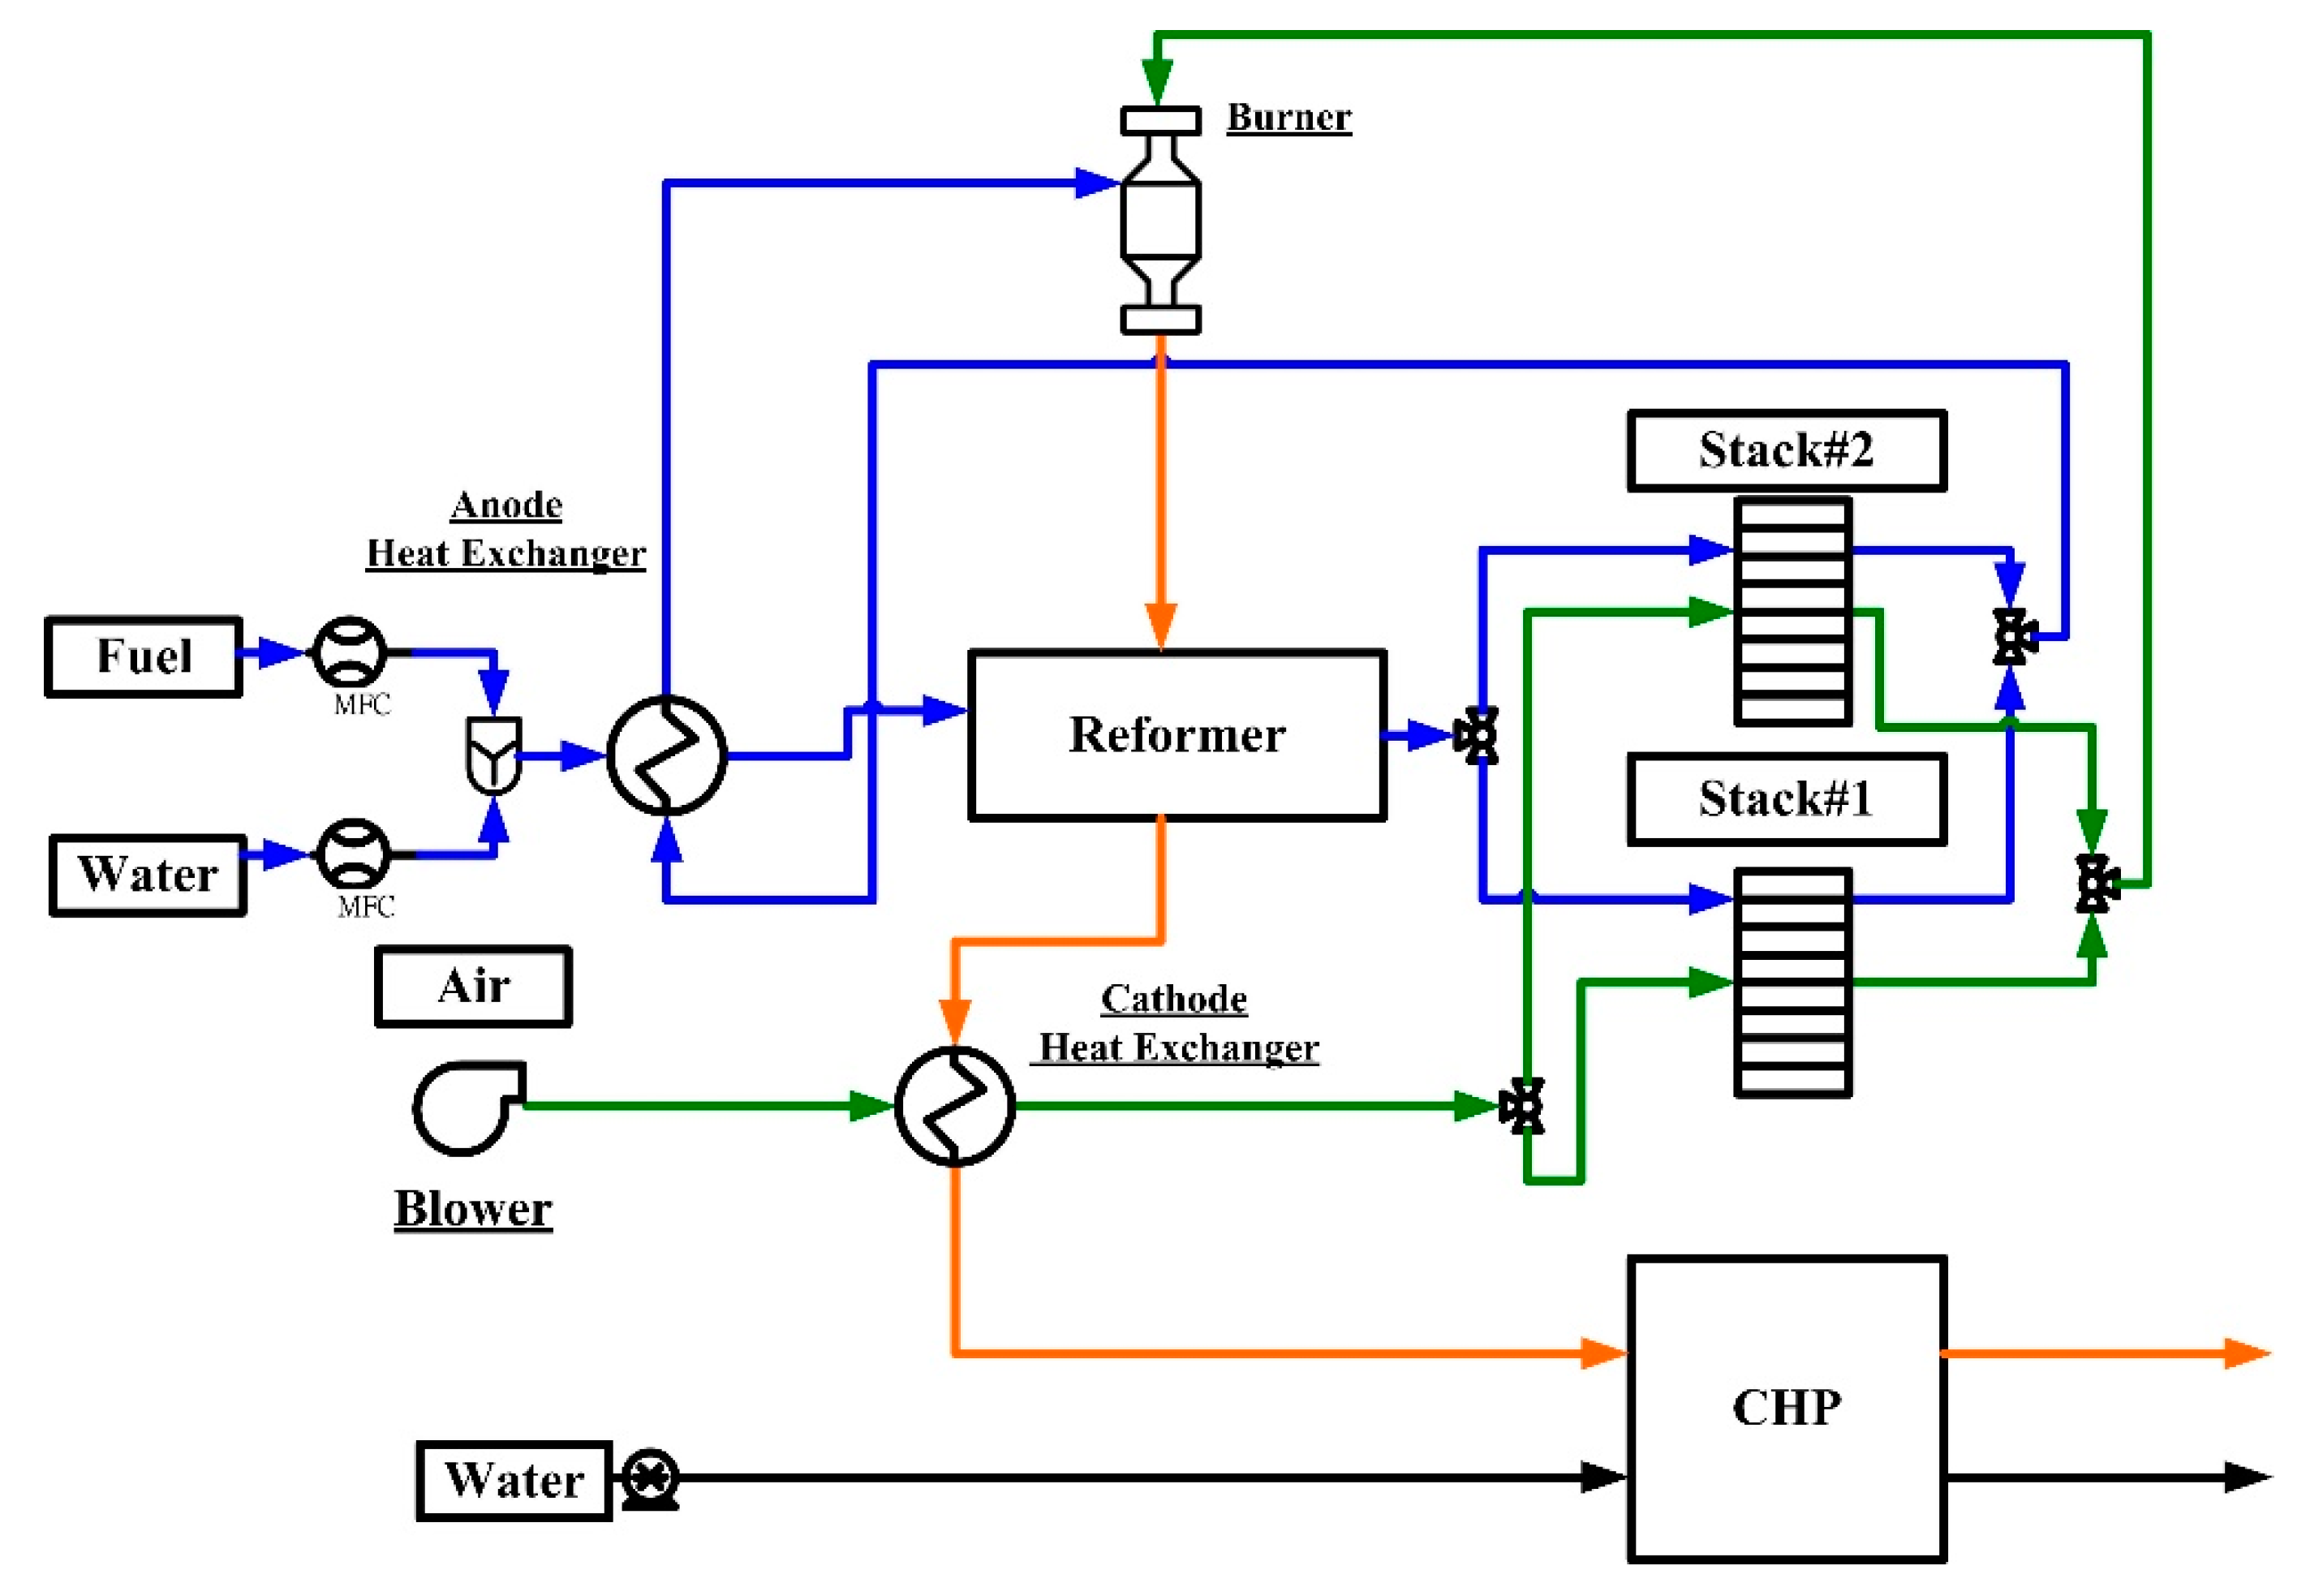
2.2. Numerical Modeling of the Hot Box Components

In this study, the steam reformer is used to convert methane to hydrogen gases. The performance of a reformer is mainly dependent on the chemical catalysts. The reactions are described as
CH 4 + H 2 O ( g ) CO + 3 H 2
CO + H 2 O ( g ) CO 2 + H 2 .
The reaction of Equation (11) is the endothermic process, Δ h = + 206.2 kJ / mol , while an exothermic process occurs in Equation (12): Δ h = 41.2 kJ / mol .
In an SOFC power system, an afterburner is required to combust the remaining fuel gases that exit the anode of the SOFC stack with a high temperature. The required heat energy of the methane reformer can be provided by the heat recovery of the combustion exhaust gases. For the methane-based SOFC system, the chemical energy of the anode off-gases is changed to heat energy by the following reaction:
H2(g) + 0.5 O2(g)→ H2O(g)
CH4+2O2→ 2H2O + CO2
CO + 0.5 O2→ CO2.
The heat energy of combustion exhaust is recovered to preheat the fuel gases and the air entering the stack via the anode and cathode heat exchangers.
The heat exchanger plays an important role in the SOFC system, since the fuel and air flows that pass through the stack must be pre-heated with a temperature high enough to keep the stack temperature. The system’s efficiency is also significantly dependent on the efficiency of the heat exchangers. The heat capacity of the cold and hot gas streams in a heat exchanger is calculated as [30]
{ C c = q c C p , c C h = q h C p , h .
The low and high values of the heat capacities of the hot and cold streams are assigned as Cmin and Cmax, which refers to the ratio of heat capacity (Cr) given by
c r = c min c max .
The effectiveness of the heat exchanger is defined as the ratio of the actual heat transfer rate between the hot and cold streams and the maximum possible heat transfer rate between these streams (qmax):
q heat =   ε q max
where the theoretical maximum heat transfer rate is
q max   =   C min ( T h , 1 - T c , 1 ) ,
where Th,1 and Tc,1 are the hot stream inlet temperature and the cold stream inlet temperature, respectively. The effectiveness of the heat exchanger can be calculated by
ε = C h ( T h , 1 - T h , 2 ) C min ( T h , 1 - T c , 1 ) = C h ( T C , 2 - T C , 1 ) C min ( T h , 1 - T c , 1 ) .
The temperature of the hot and cold gas streams exiting the heat exchanger is obtained by
T h , 2   =   T h , 1 - q C h
T C , 2   =   T C , 1 + q C C .

2.3. MATLAB/Simulink/Thermolib Simulation Procedure

By modeling the reactions of the SOFC stack and the hot box components, the power generation and system performance can be evaluated by numerical simulation [30,31,32]. The simulated parameters in the studied SOFC-CHP system of this work are listed in Table 2. The simulation procedure of an SOFC system via the MATLAB/Simulink/Thermolib tool includes the following steps:
(a)
Perform the system design and confirm that the types of components and paths of the fuel, air, and exhaust gas flows are appropriate for thermodynamic equilibrium.
(b)
Carry out the modeling of each thermal component and perform simulation test with operating parameters for validation.
(c)
Connect the components of the SOFC system to carry out system simulation.
(d)
For the dynamic simulation of an SOFC system, the calculation is performed under finite time intervals with specified time steps.

3. Results and Discussions

The present work studied the effects of fuel and air maldistribution in SOFC-CHP systems. A two-stack module for 10 kW power generation is adopted to represent the multi-stack module that is often used in a high power-generation system. The system configuration is shown in Figure 1. The manifold channels are used to distribute the fuel and air flows into the cells. The methane and water preheat and evaporate via a heat exchanger, with the anode off-gases on the hot sides as the heat source. The steam methane reformer is applied in this study. The heat required for fuel reforming is supplied by a burner that combusts the anode off-gases while integrating the high-temperature cathode off-gases into a single gas flow. After steam methane reforming, the residual heat of the combustion exhaust gas is used to preheat the air entering the cathode manifolds to retain sufficient temperature for the stacks to generate electricity. Finally, a CHP heat recovery system is adopted to increase the energy efficiency and provide hot water for residential or industrial use.

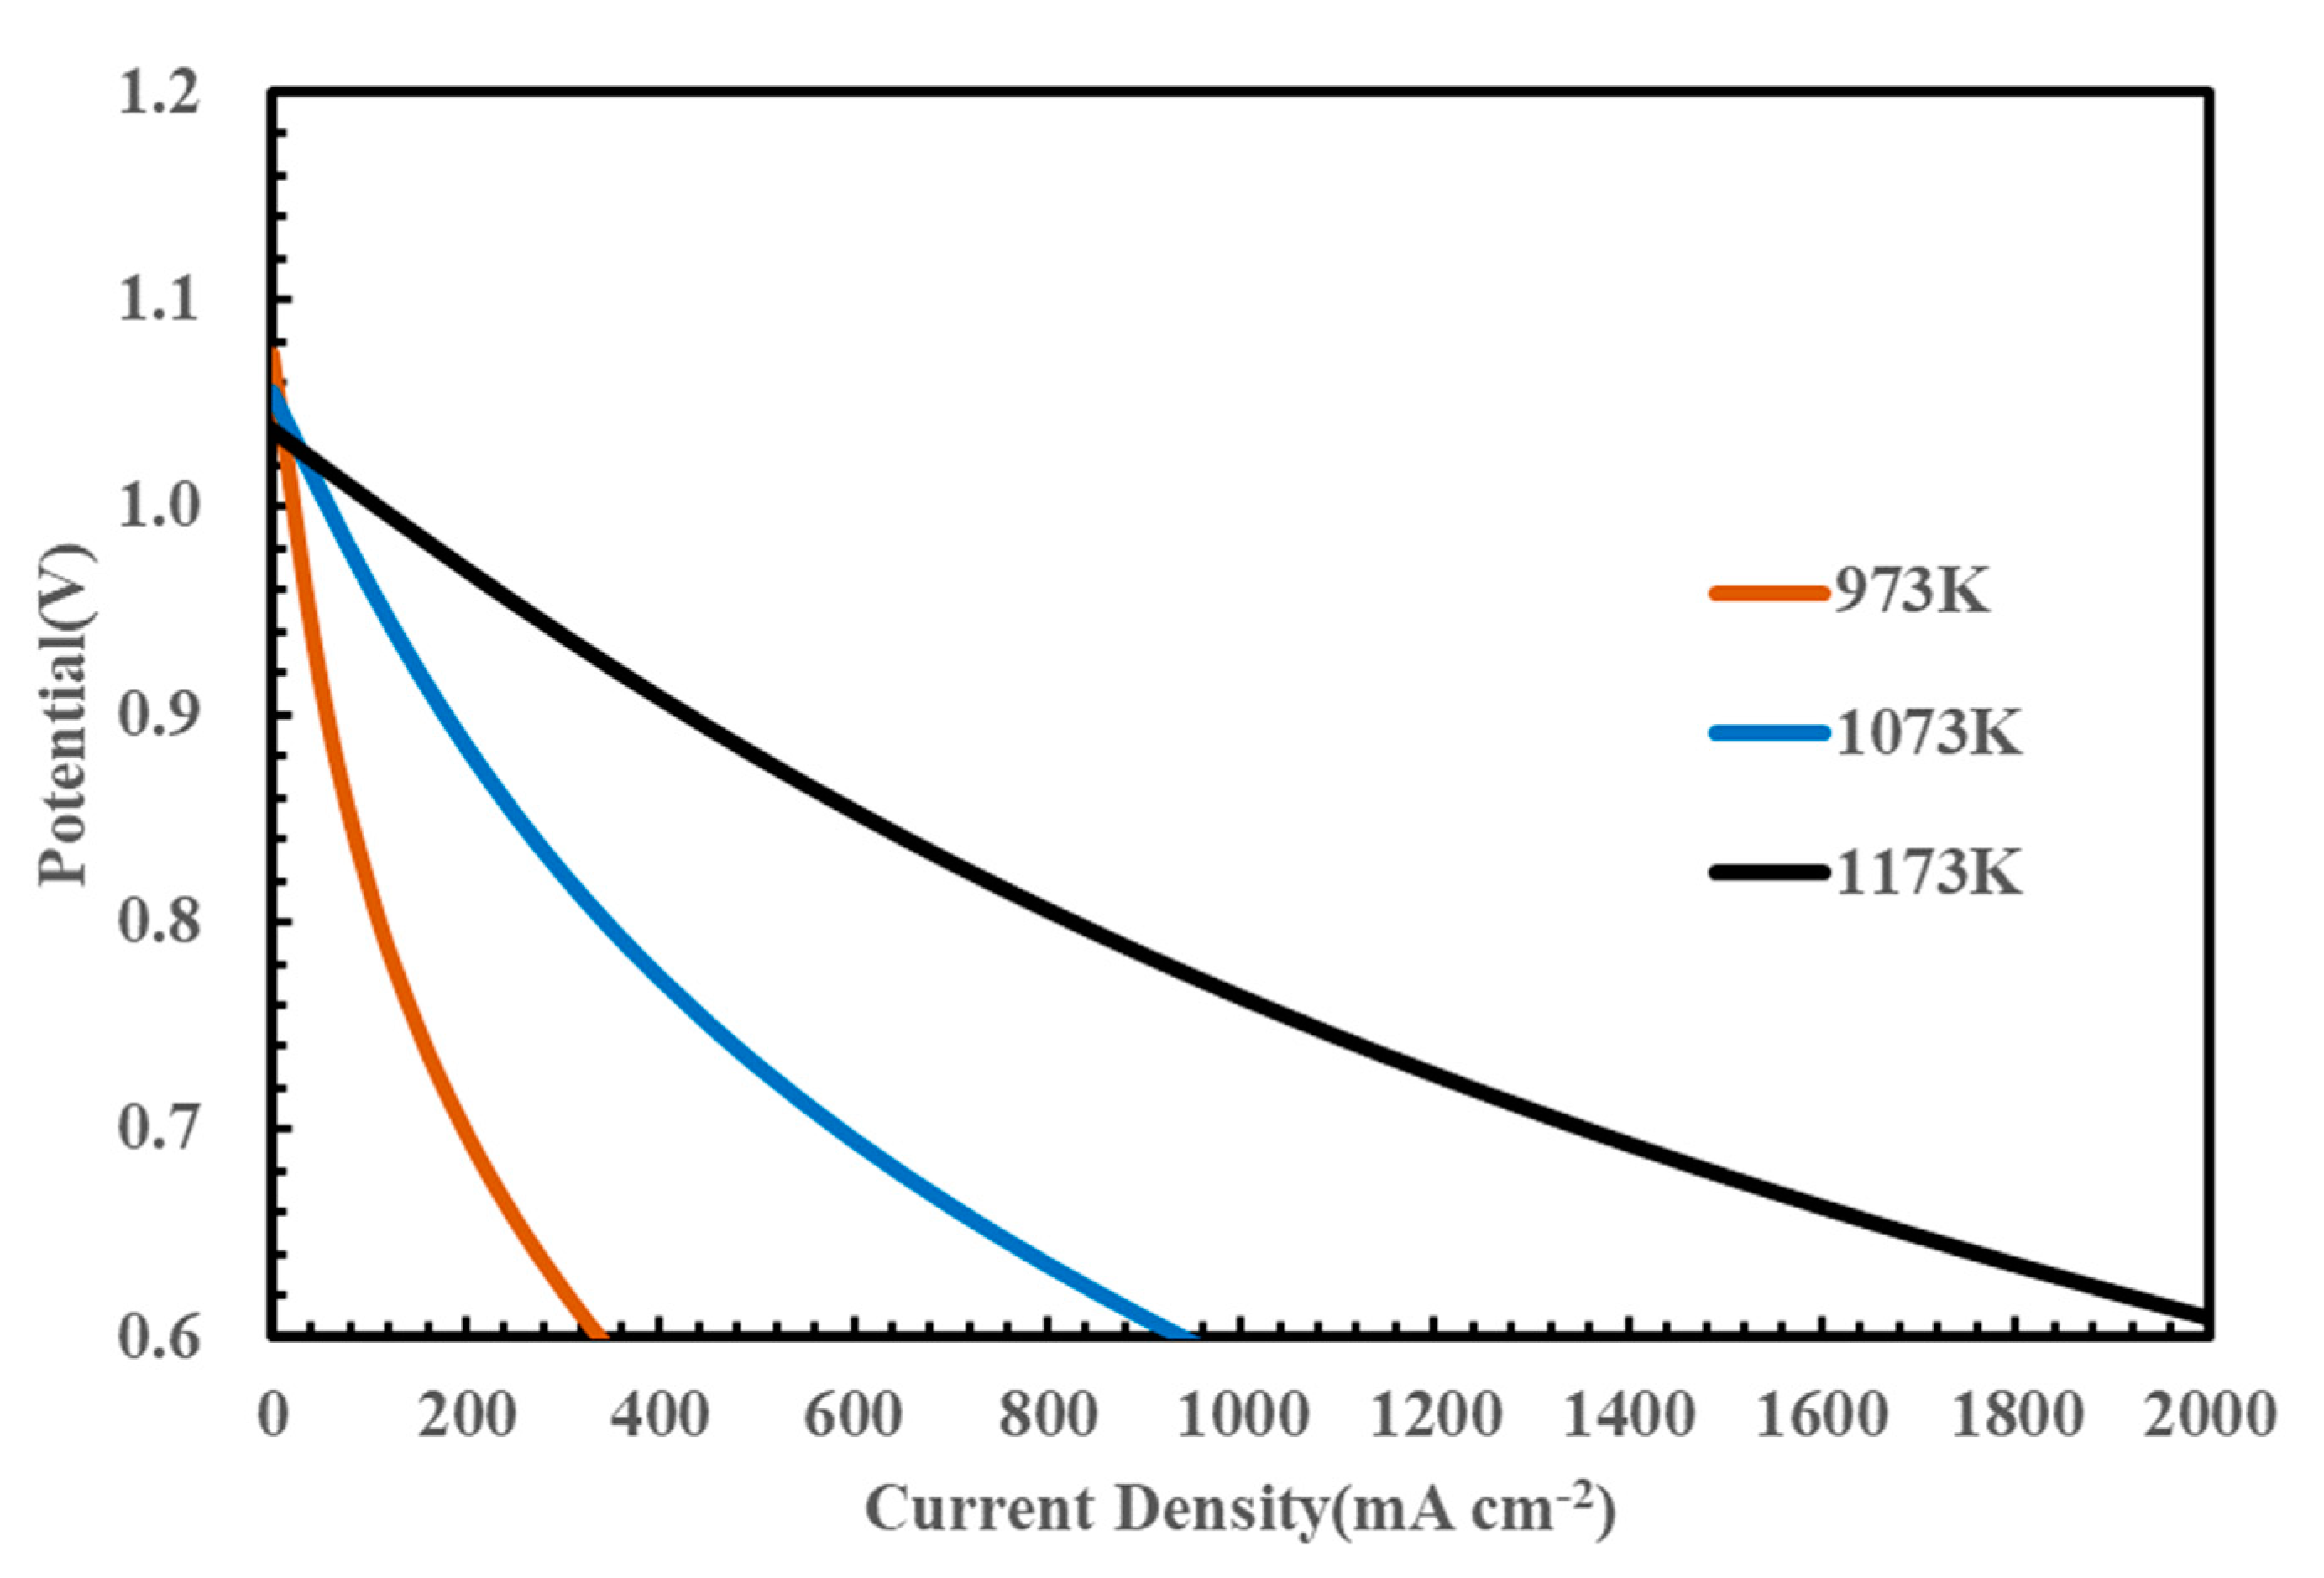
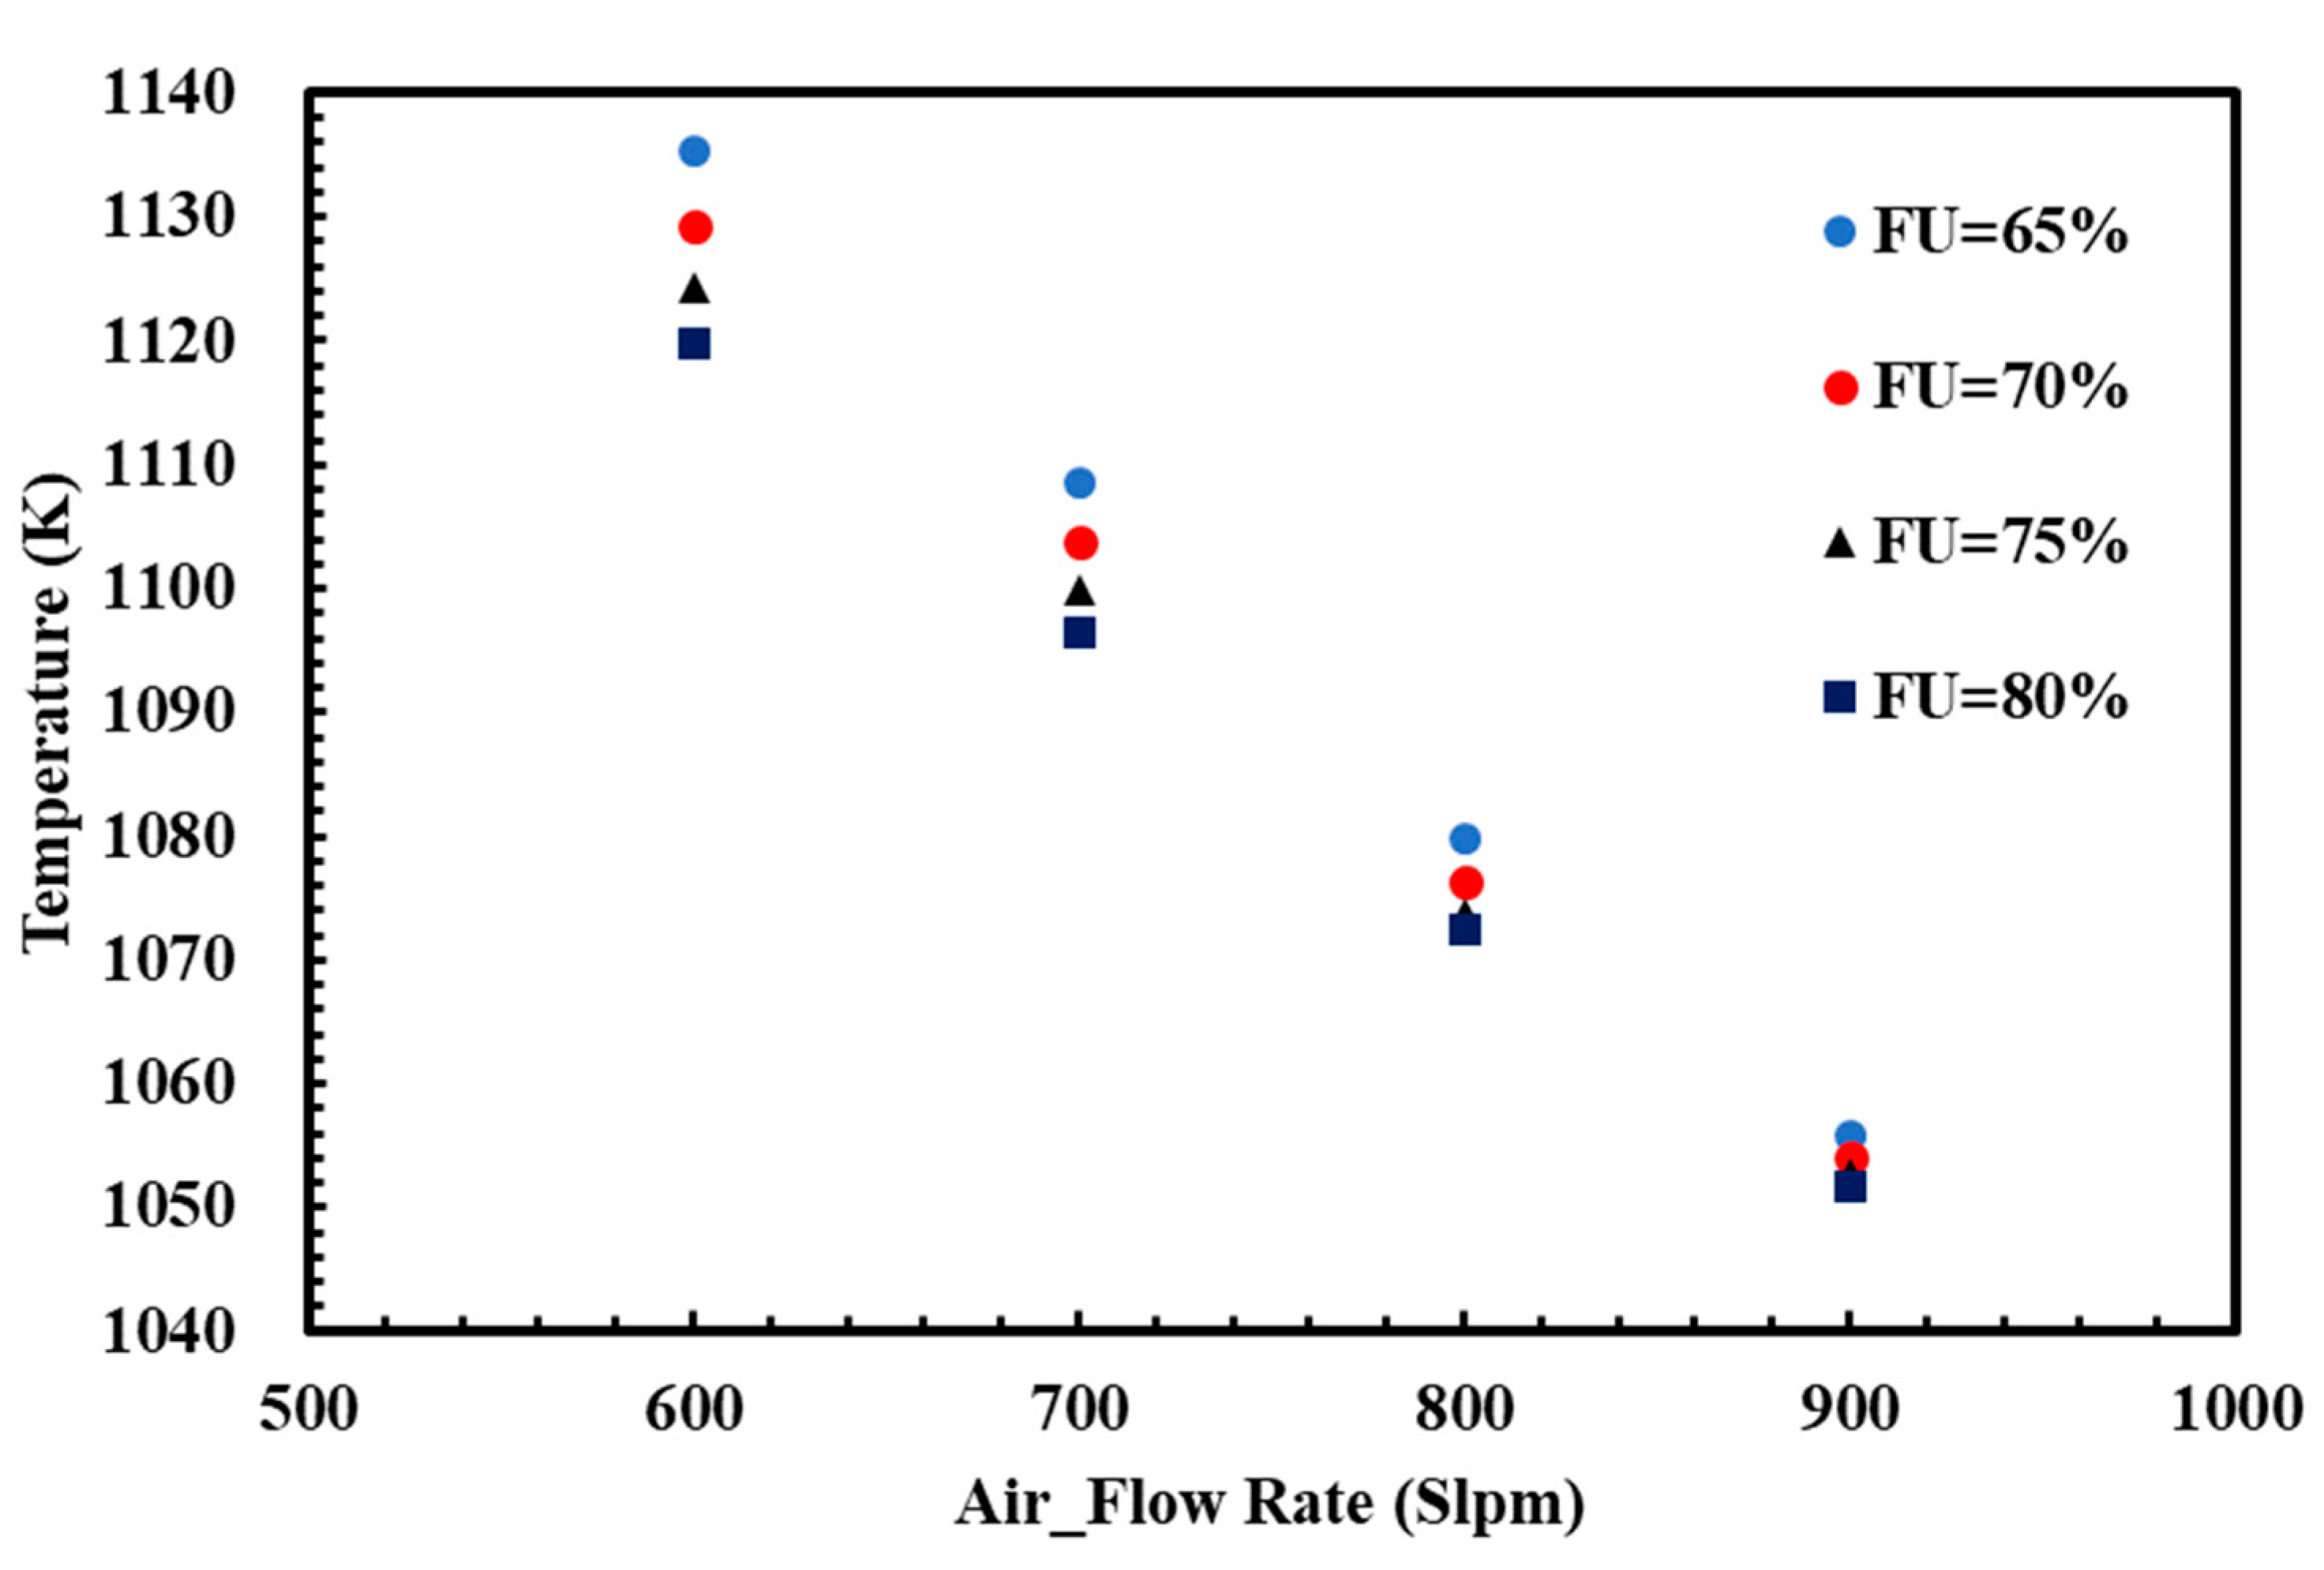
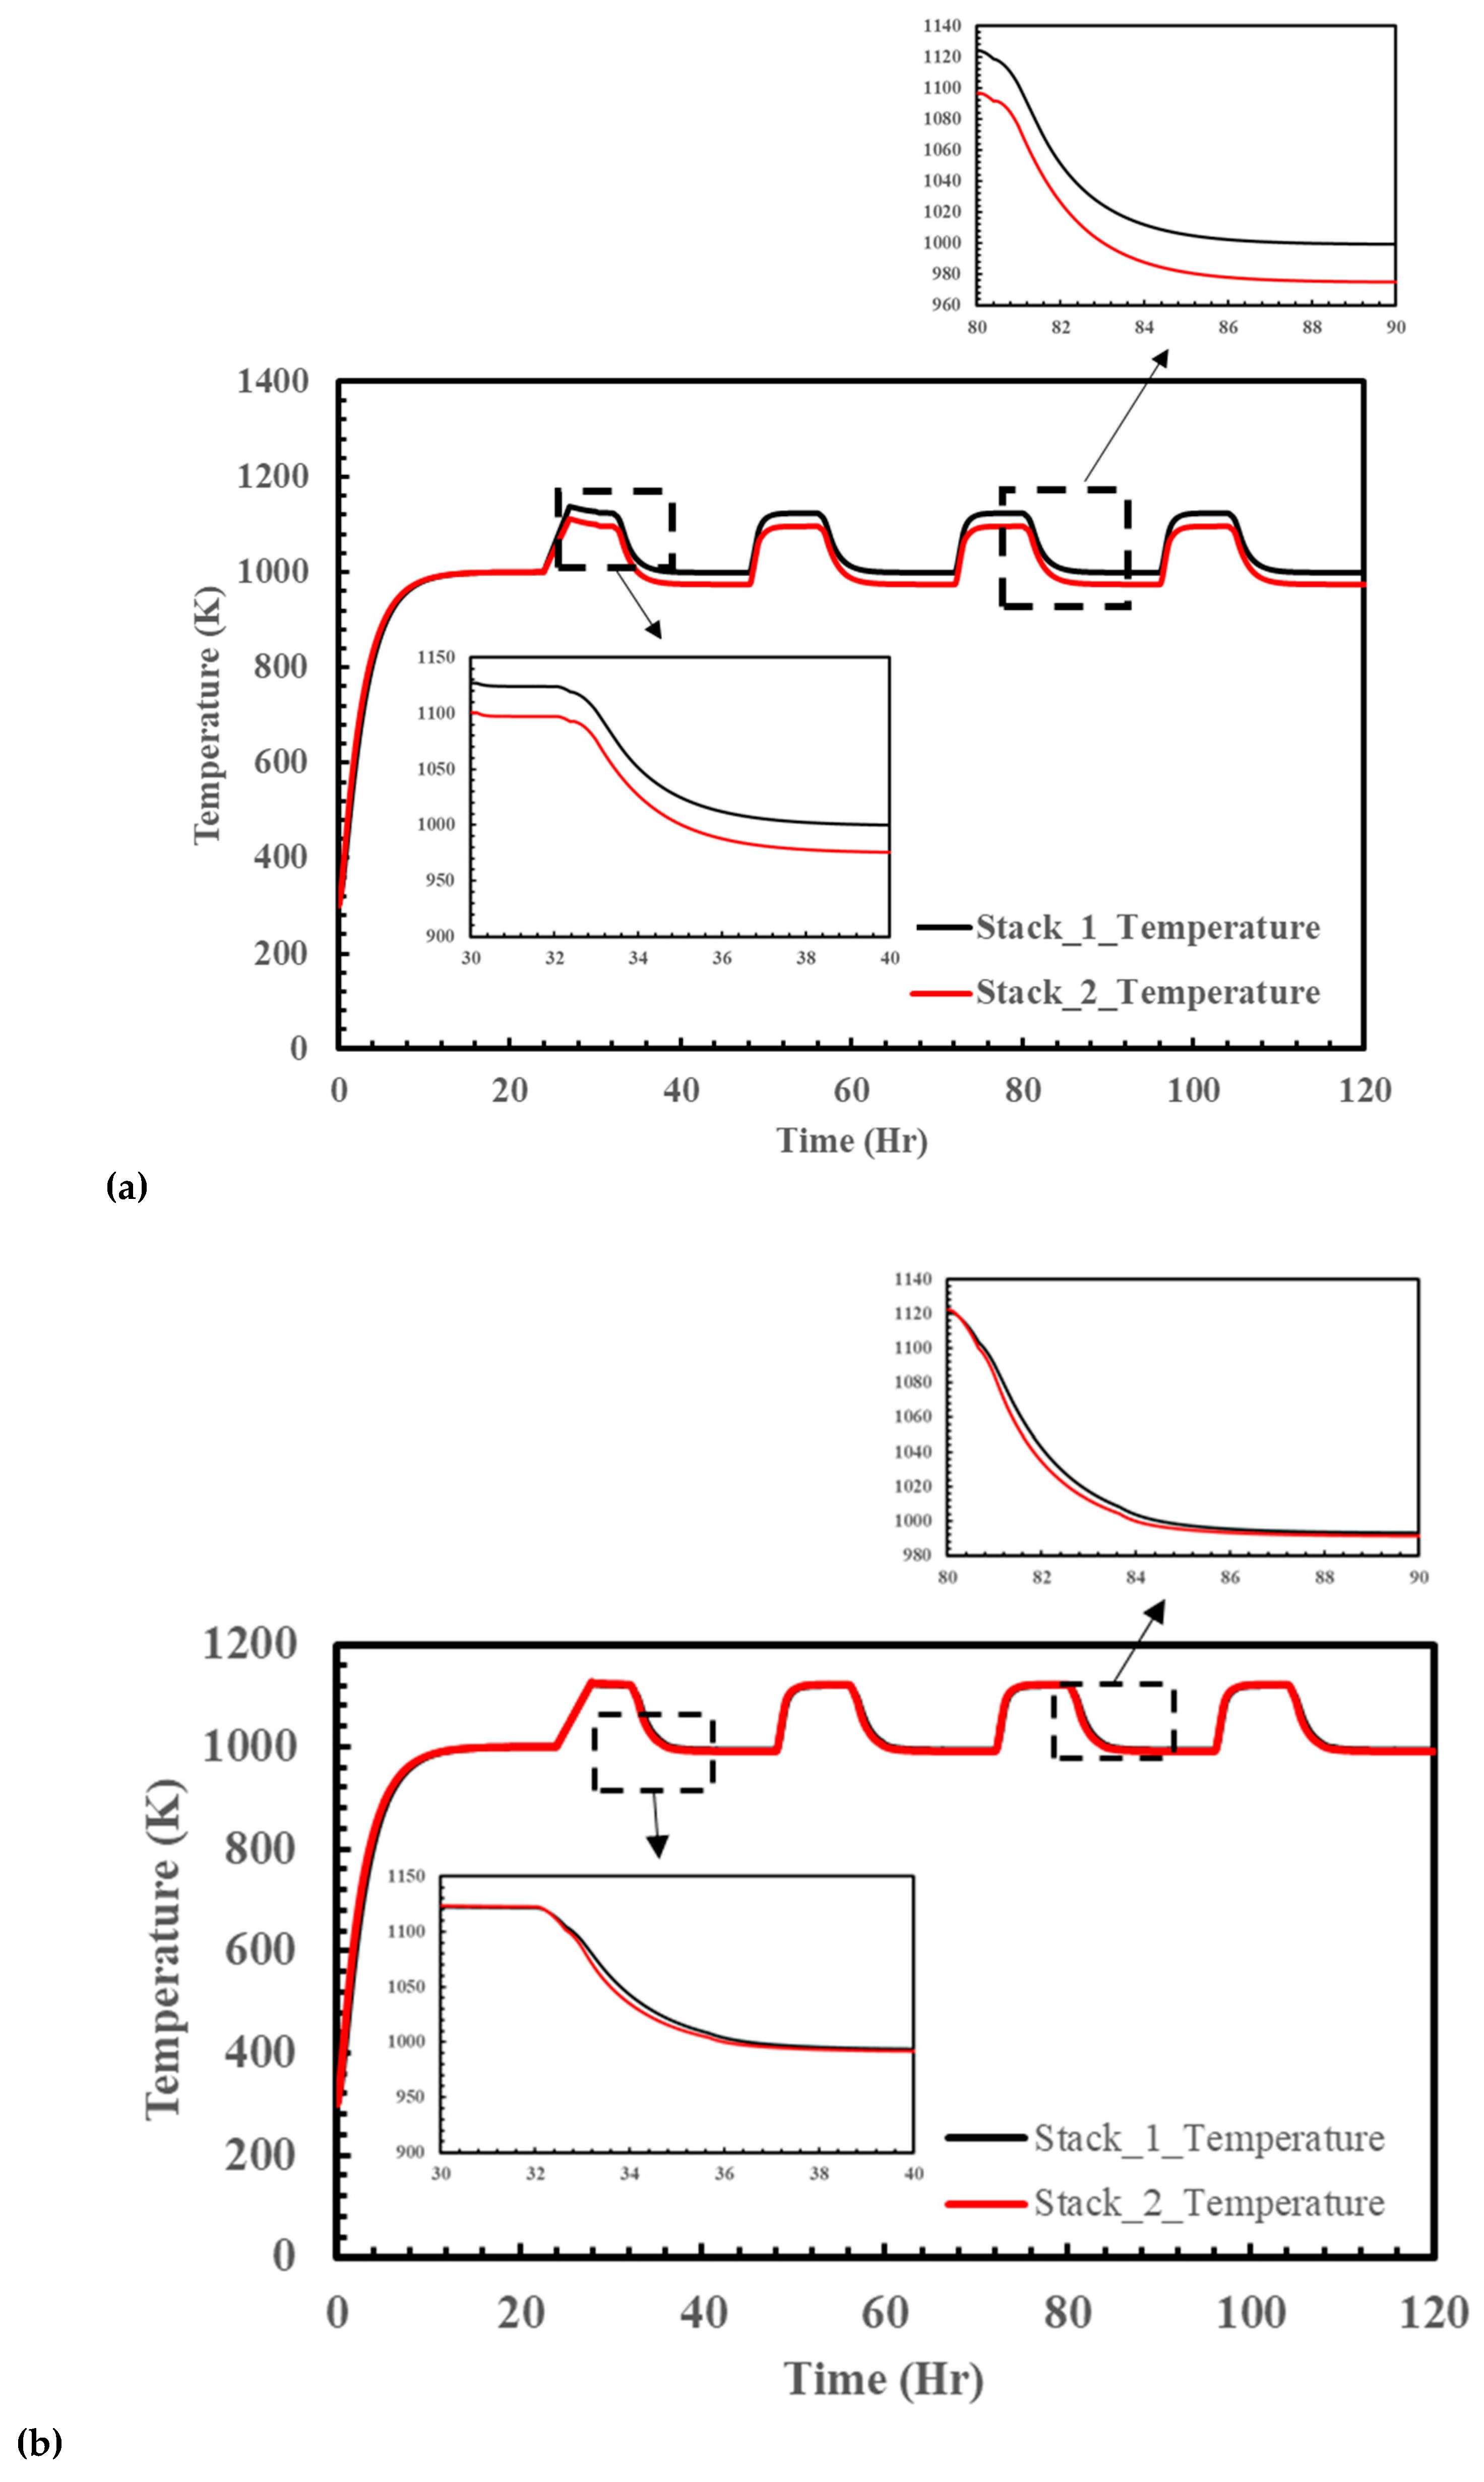
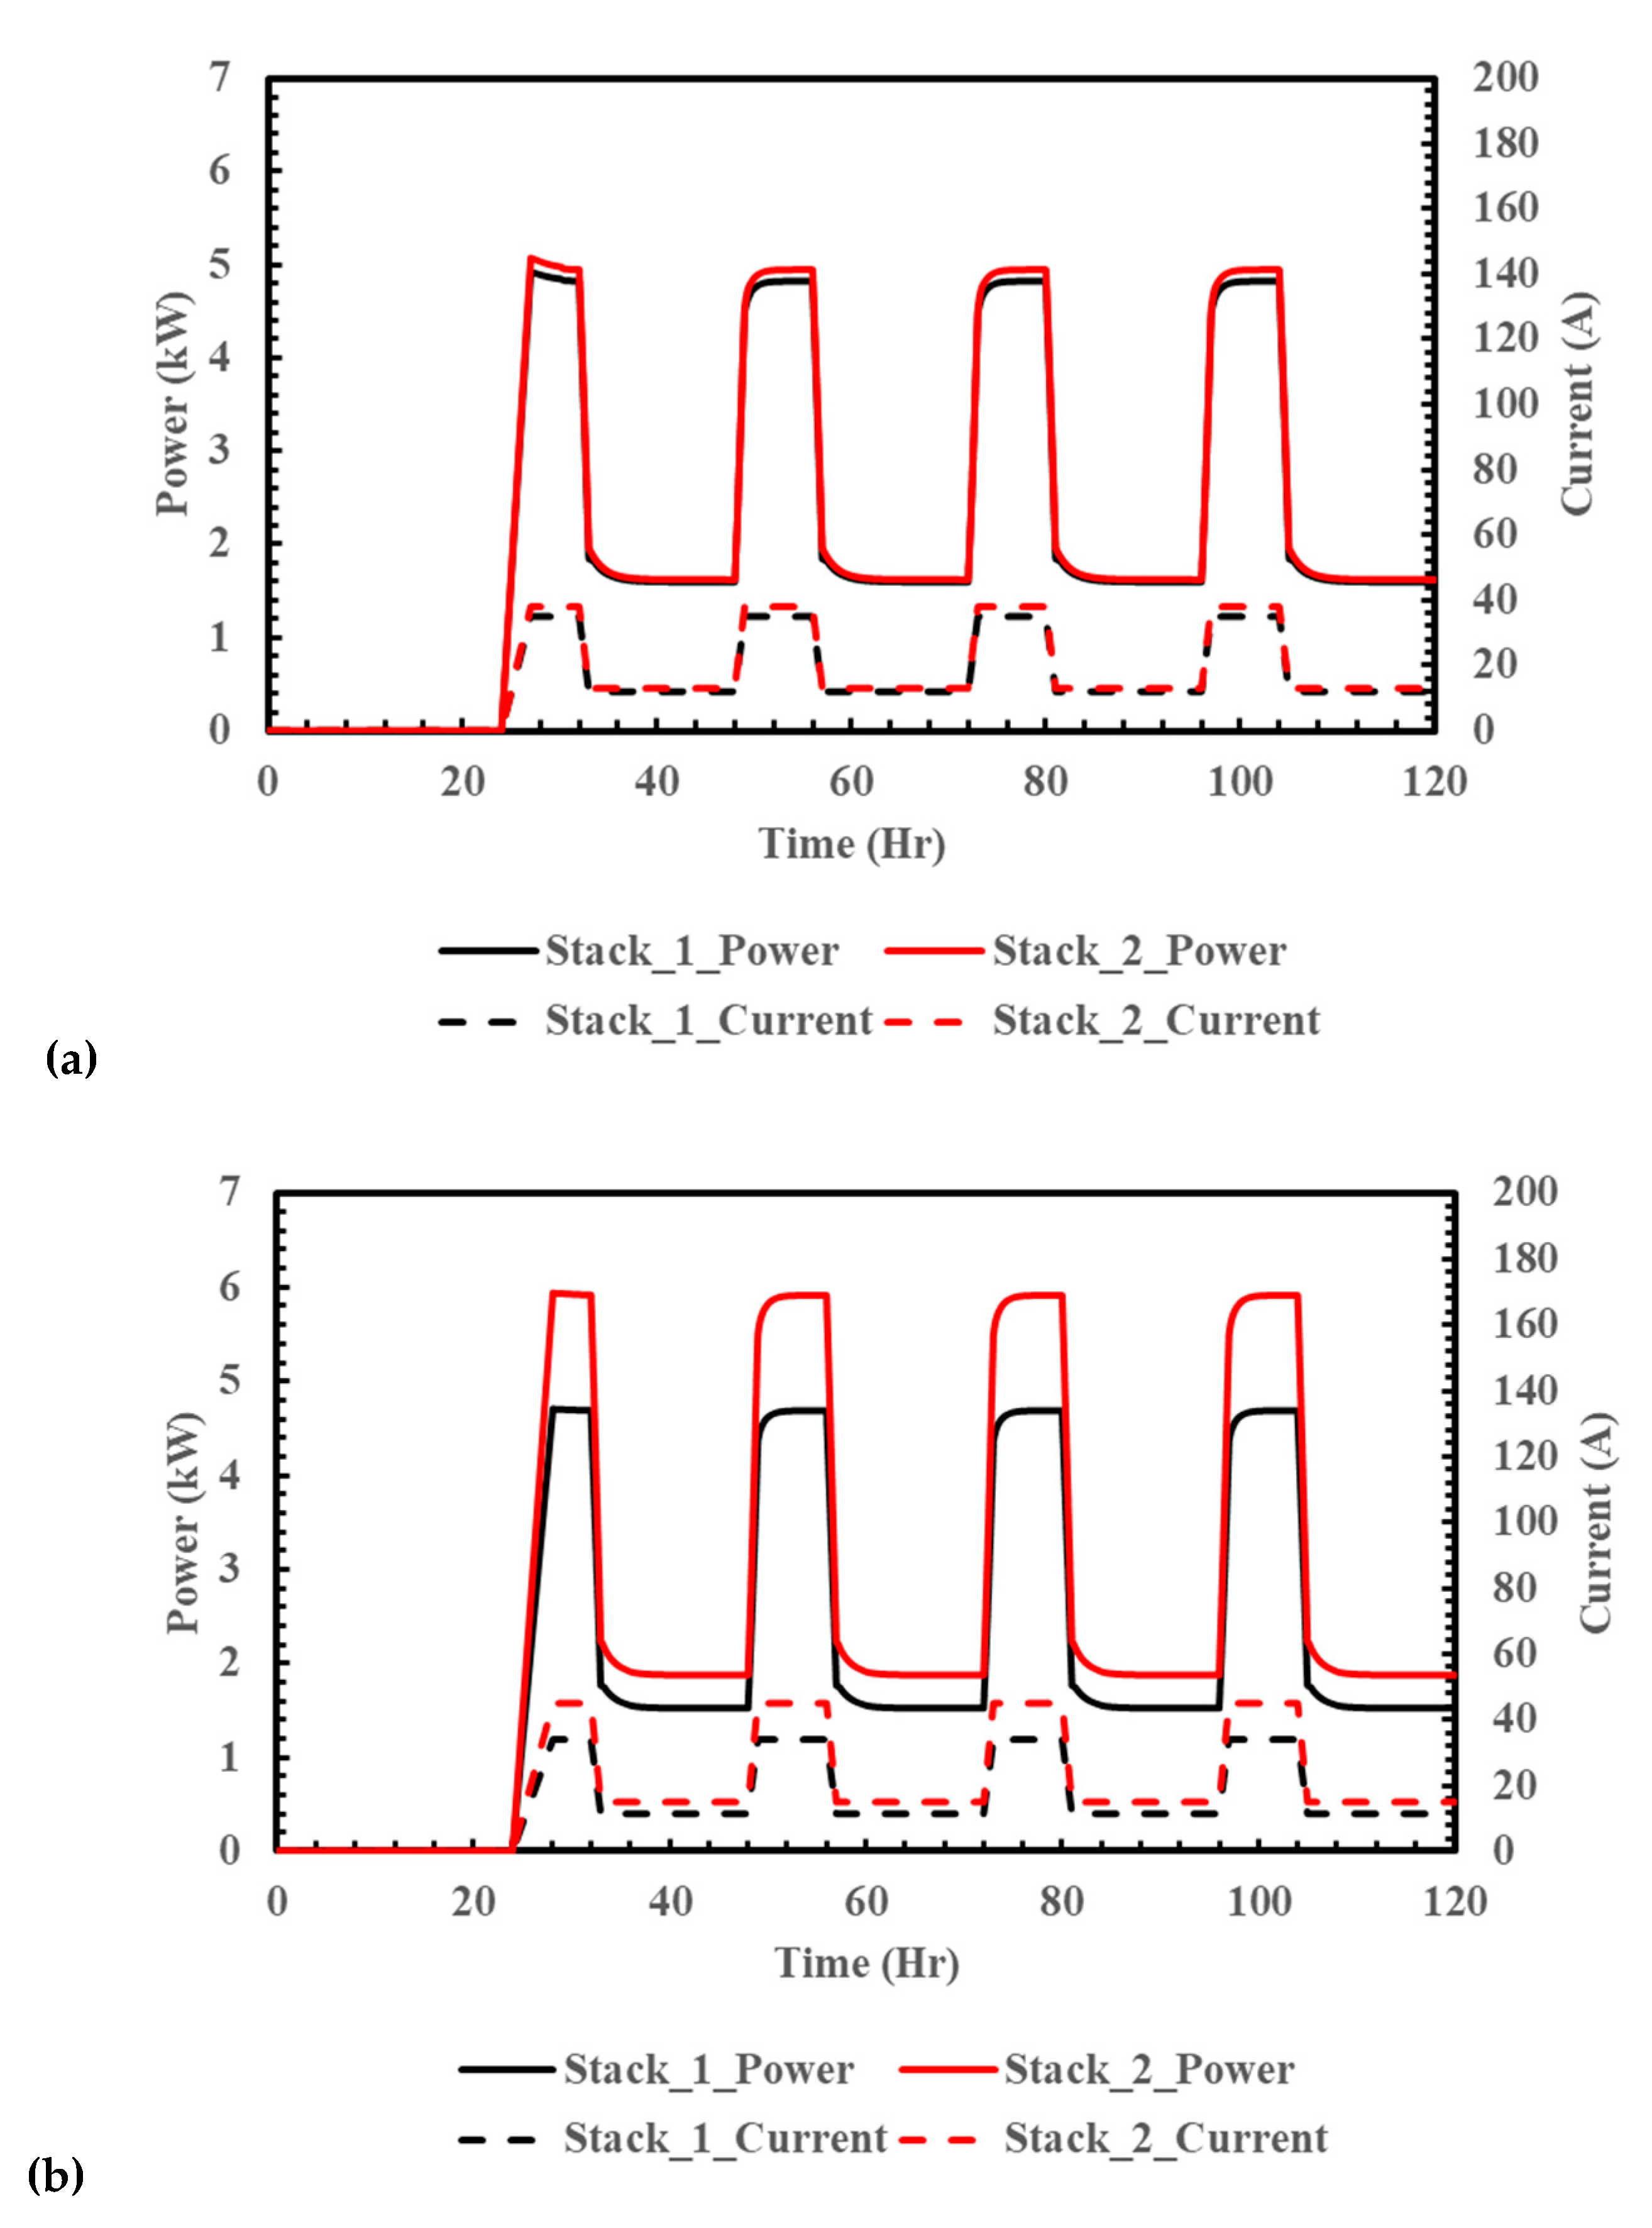
3.1. Temperature-Dependent System Performance

The simulations of the SOFC stacks and balance of plant (BOP) components are performed by using the thermodynamic system simulation module in MATLAB/Simulink. The accuracy was validated in the previous work [33] via comparison with the published numerical and experimental data [34,35]. In Zhao and Virkar’s experiments [34], the inlet fuel consisting of H2(97%)/H2O(3%) was passed through a solid oxide fuel cell, in which the thickness of the anode, cathode, and electrolytes were 1000, 20, and 8 μm, respectively. The simulated performance of the SOFC at 873 K, 973 K, and 1073 K by Thermolib [33] was consistent with the experimental and simulation data [34,35]. The j-V curves of the solid oxide fuel cell in this study are shown in Figure 2. The temperature-dependent effect is also presented in the graph, which shows that the current densities at 0.7 V are 200, 590, and 1320 mA/cm2 at 973, 1073, and 1173 K, respectively. The results show that the performance of the SOFC stack is significantly affected by its operating temperature.
To control the stack temperature within an optimal operating range, the air flow rate is generally regulated in an SOFC system by carrying away more or less heat generated during the power loading process. The fuel use rate (FU) is another important factor affecting the stack temperature. Figure 3 presents the effects of fuel use and air flow rate on the SOFC stack’s temperature. Since the operating FU does not typically exceed 80% to prevent cell damage [36], an FU of 65%, 70%, 75%, and 80% are performed in this study, with air flow rates ranging from 600 to 900 slpm. The results indicate that the stack temperature is raised as the FU decreases. This is because a lower FU means that greater combustion heat is provided from the burner to the exchangers, which increases the preheating temperature of the fuel and air flows. Consequently, the stack temperature is increased.
The temperature difference of the stacks for 600 slpm air flows is 15.6 K—about a 1.39% deviation. However, for 900 slpm air flows, the temperature difference of the stacks is only 4 K (a 0.37% deviation). The results show that the effects of FU can be suppressed if the air flow rate is large enough to dominate the stack temperature. However, excessive air flows would cause the stack temperature to drop below the optimal operating range and result in reduced power performance. The calculated current and power output of the SOFC stacks under different fuel use and air flow rates are listed in Table 3. The power differences between the lowest and highest air flow rates are 0.83–0.85 kW at different FU rates. Therefore, the air flow rates and fuel use rates, i.e., the operating current values, of an SOFC system should be optimally regulated to perform the maximum power generation and efficiency.

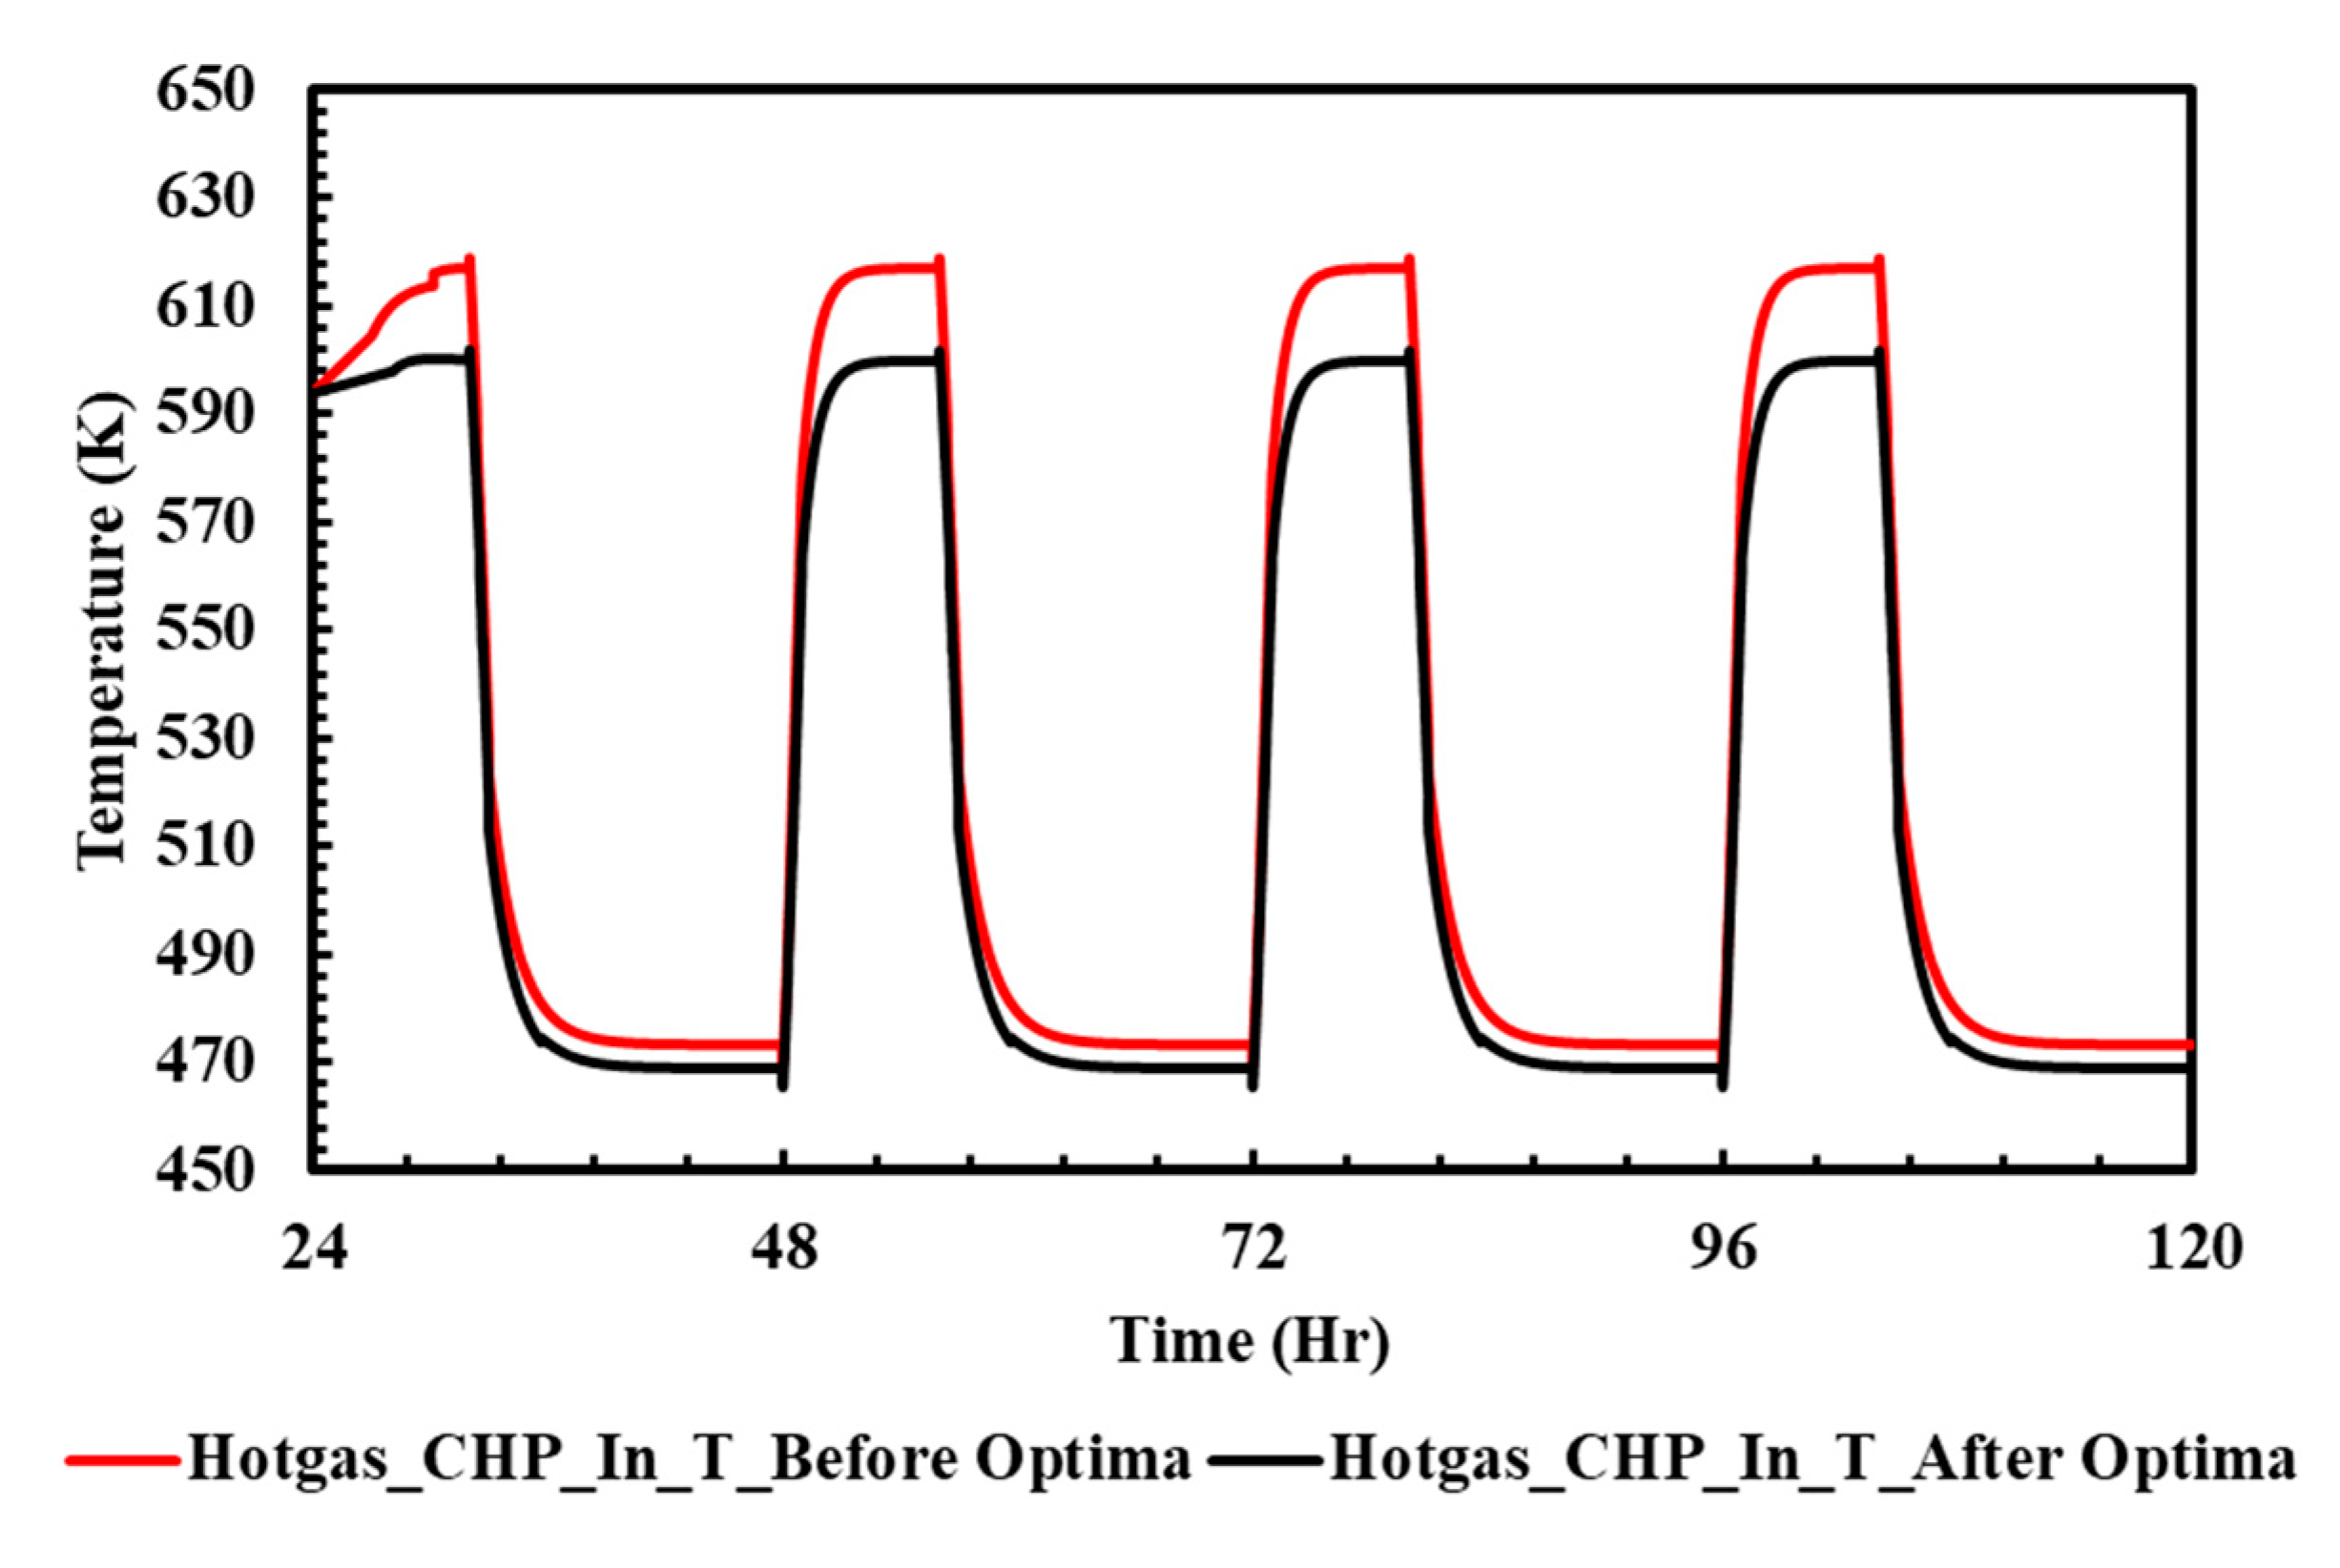
3.2. Manifold Effect Modification by the Optimal Control Strategy

In an SOFC system with a multi-stack module, the manifold effect due to asymmetrical channels inside the module would cause maldistribution of the fuel and air flows into each stack. Unequal stack performance is undesirable because it reduces the power efficiency of the system. In the present work, the manifold effects on the studied SOFC system are performed by setting the maldistribution gas flows of the two stacks. The parameters of the simulation model are listed in Table 4. As shown by the data in Table 3, an FU of 70% and an air flow rate of 700 slpm are used to generate 10 kW electric power at 38 A, as the flow split ratios of the two stacks are equal.
To simulate the SOFC system from start-up and heating to operating, the standard operating procedure and operating parameters were followed in this paper. The parameters are shown in Table 4. To start-up and heat the system, methane was used as the fuel and burned in a burner to generate the heat needed to warm up the system. The total fuel needed in the heating process is 8 slpm, and 480 slpm of air is needed at the same time. By using 8 slpm of methane to heat up the system, the SOFC stack can heat up to over 700 °C, which is the condition at which the ASC (Anode-supported cell) starts to generate the power. In this way, the system can start to generate power when the temperature of the SOFC stack is over 700 °C. Furthermore, the flow rate of the anode and cathode need to be changed step by step. In this system, several conditions should be followed when changing the flow process; these conditions are shown in Table 4 (for example, the anode/cathode flow rate should be smaller than 20 slpm/min, the steam should supply fuel to the anode at the same time, and the S/C should always remain around 2.5).
Figure 4 presents the dynamic curves of the stack temperature and operating power and current of the system with an equal flow split ratio of stacks. The air flow rate of 480 slpm is used to warm up the system. As the stack temperature reaches 973 K, the system starts to generate power with an increase in the current increment. Since the stack temperature increases alongside the power generation, the air flow rate is progressively enlarged until it reaches 700 slpm, to control the stack temperature. As the system reaches the steady state, its power efficiency is 51.09% and the system efficiency is 85.12%, with a 6.67 kW heat output of CHP water.
Figure 5 shows the dynamic curves of the case with a gas flow split ratio of 40%–60% into the two stacks of the system. The power generation is divided into two stages. In the early stage, the operating temperatures of the two stacks are evidently different, with one at 1125 K and another at 1092 K. These temperatures, consequently, affect the power generation, as shown in Figure 5b, causing the different fuel use rates of 78.3% and 56.8%. The total electricity power output is 9.77 kW, accompanied by a 6.9 kW heat output for the CHP system. The power and system efficiencies of 49.86% and 85.06% are less than those for the equal flow split ratio of the stacks.
To modify the reduced power generation caused by the manifold effects, this study presents a strategy for controlling the operating current and air flow rates to eliminate the differences between the stack temperatures. As shown in the second stage of power generation (in Figure 5a), the temperatures of the two stacks are adjusted to 1122 K by reducing the current of stack 1 from 35 A to 34 A, increasing the current of stack 2 from 38 A to 45 A, and reducing the air flow rate to 620 slpm. The modified FU rates of the two stacks increased to 79% and 70%, respectively. Figure 5b shows that the total output power increases to 10.6 kW, with an enhanced electrical efficiency of 54.11%. The system efficiency is also increased to 86.91%, with a 6.43 kW heat output for CHP system.

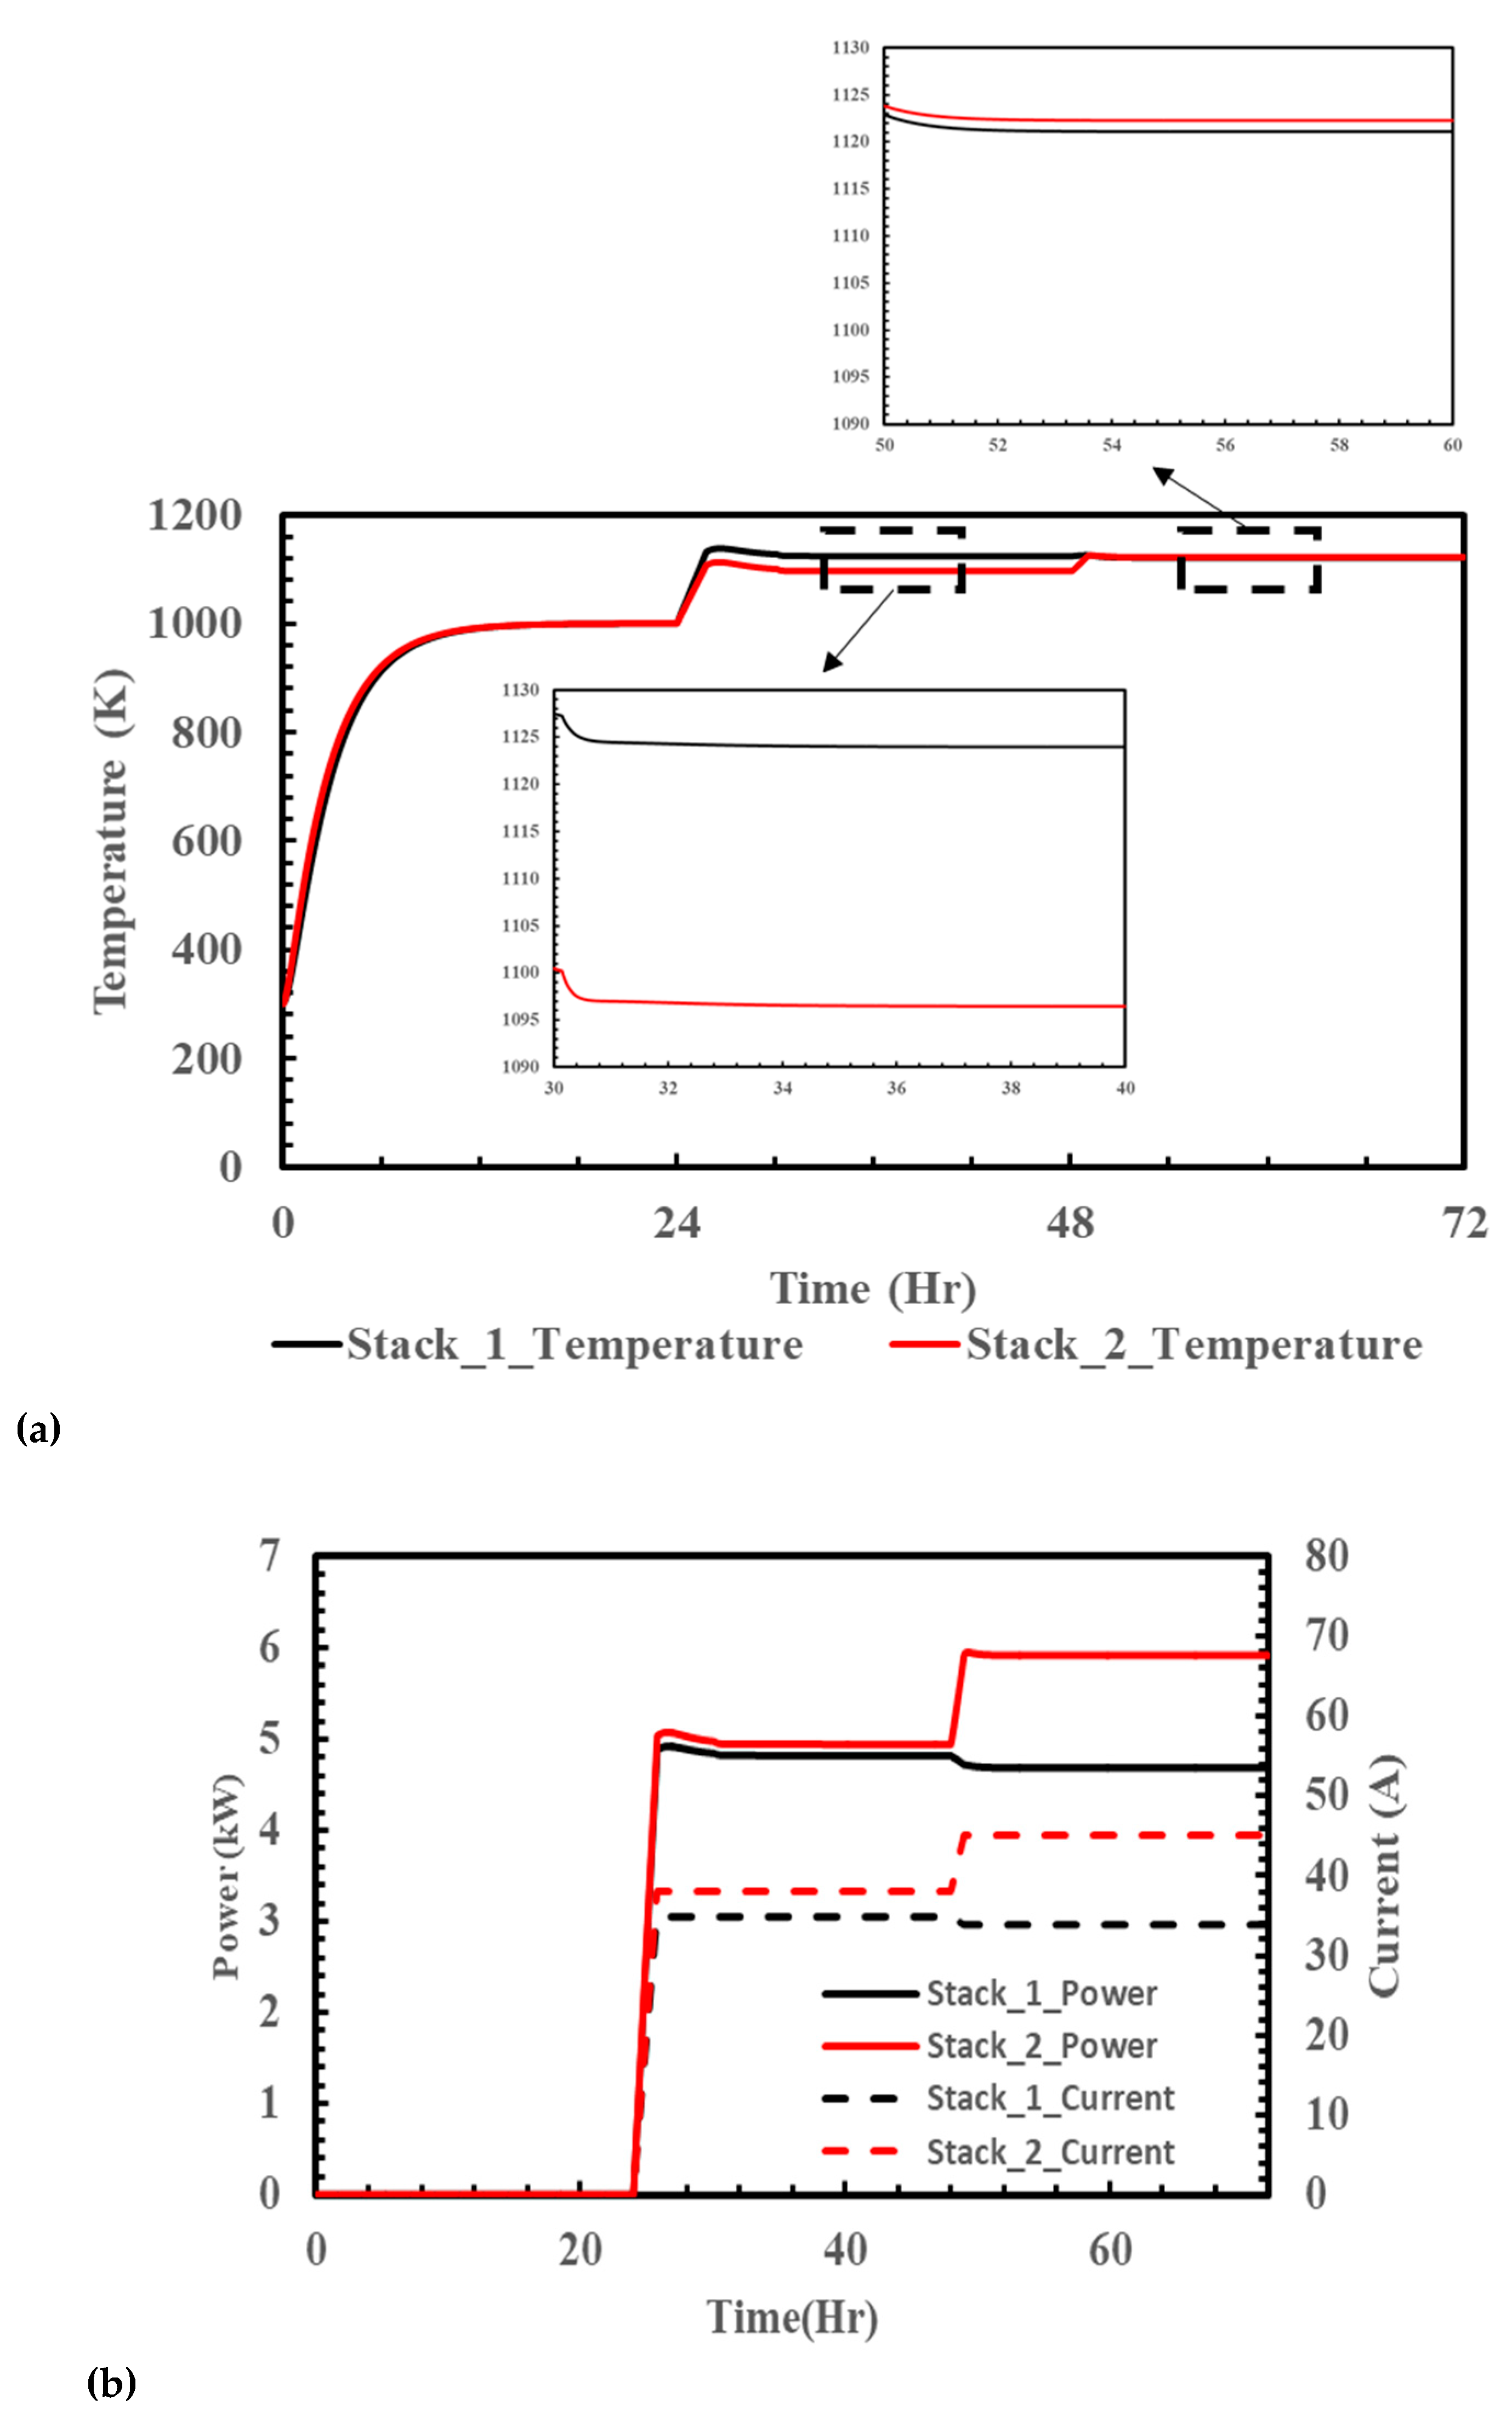
3.3. Analysis of Long-Term SOFC-CHP Benefits

The SOFC-CHP system has great potential for distributed power generators, especially for sites that demand electricity and heat, such as commercial buildings, hospitals, stores, supermarkets, factories, and residential areas. In some applications, the peak power demand is only part of one day (e.g., only in the working hours). During off-peak times, the loading of the SOFC system should be reduced to save fuel costs. To maintain the stack temperature at a level high enough for rapid re-loading, this paper presents an operation period with 100%/30% input fuel flow rates for the study case of Figure 1. The full loading operation occupies 8 hours of a day, whereas in the remaining time, the system is standby and provides lower power electricity and heat energy for the basic demand of the site. For the maldistribution of gas flow rates into the two stacks, the long-term benefits of the optimal control strategy are investigated.
The dynamic curves of the stack temperature in the first five days are shown in Figure 6. For the non-modified case, the two stacks are kept at 1000 K and 975 K in standby mode. In the optimal case, the two stacks are both kept at 992 K. The optimal control of stack temperature affects the standby power and heat output as well as it does in the full loading period, as shown in Figure 7. An enhanced total power generation of 3.4 kW in standby mode is performed. Comparisons of power and system efficiencies in the non-modified and optimal control cases are shown in Table 5. The results show that the power efficiency in standby mode is decreased, but the system efficiency remains high because a greater proportion of energy is recovered in the CHP system. The temperature curves in Figure 8 show that the exhaust temperature of the non-modified case is 20 degrees higher than in the optimal control case in the full loading mode, while the temperature difference of 2 K between the two cases in the standby mode is small.
The simulation data in Table 5 indicate that the flow maldistribution into the two stacks in the SOFC-CHP system mainly influences power generation. For the maldistribution case, the output power is 129.68 kWh/day, which is 2.84% less than the non-maldistribution case in Figure 4. When the current and air flow control strategy is applied, the total output power of one day is increased to 139.2 kWh, an increment of 7.34%. The fuel use rates of the two stacks of the optimal case in standby mode are 79% and 67%, which are higher than those of the non-modified case (as in the full loading mode). The non-modified CHP systems can output 1872 liter/day of hot water at 70 °C; the output amount is 6.85% larger than that of the optimal case.

4. Conclusions

This paper performed the dynamic analysis of a 10 kW SOFC-CHP system with a two-stack module by numerical simulations. The performance of stacks, tail gas burners, heat exchangers and fuel reformers was modeled by the MATLAB/Simulink module. Since the performance of the SOFC stack is significantly affected by the operating temperature, the effects of the fuel use and air flow rates on the stack’s operating temperature and power generation are thoroughly discussed. The results indicate that the stack temperature raises as the FU decreases due to the increasing combustion heat from the burner to gas heat exchangers. The stack temperature can also be increased by reducing the air flow rate. Therefore, the air flow rate and operating current (which are related to the fuel use rate) of an SOFC system should be optimally regulated to achieve maximum power generation and efficiency.
In the present study, the optimal control strategy for operating current and air flow rate was applied in an SOFC-CHP system, in which the gas flow rates into the two stacks were non-equal. The dynamic analysis shows that the operating temperatures of the two stacks have a difference of 33 K, which results in a reduced total power generation of 9.77 kW, with inconsistent FU rates of 78.3% and 56.8% for the two stacks. By using the optimal control strategy, the output power is increased to 10.6 kW, an increment of 8.5%. In this way, the FU rates of the two stacks are improved to 79% and 70%, respectively. As a potential distributed power generator, the long-term effects of the studied SOFC-CHP systems are also investigated. An operating period with 100%/30% input fuel flow rates is adopted to simulate the 8 h full/16 h standby loading mode of one day, which is applicable in, for example, residential or non-24 h working sites. Dynamic analysis of the long-term operating SOFC-CHP system shows that the total daily output power can be increased 7.34% by using the optimal control strategy developed in this study.
For a high-power SOFC module, the stacks are connected by series and parallel arrangements. Therefore, the manifold effect on the stack performance is an important issue. For SOFC-CHP system with maldistribution gas flows into each stack, the strategy of controlling both operating current and air flow rate is useful to eliminate the temperature difference between stacks caused by the manifold’s effects. Consequently, the power generation efficiency is increased.

Author Contributions

Conceptualization, C.-H.Y. and W.-S.C.; data curation, Y.-H.C.; formal analysis, Y.-H.C.; investigation, C.-H.Y.; methodology, S.-C.C.; writing—original draft, C.-H.Y. and S.-C.C.

Funding

This research was funded by Bureau of Energy (BOE), Ministry of Economy Affairs (MOEA), Taiwan (Grant number: 108-D0901).

Acknowledgments

We gratefully appreciate the financial support from the Bureau of Energy (BOE), Ministry of Economy Affairs (MOEA), Taiwan.

Conflicts of Interest

The authors declare no conflict of interest.

Nomenclature

E 0 Open circuit voltage, V
η ohm Ohmic impedance, V
η Act , a Anode activation impedance, V
η Act , c Cathode activation impedance, V
η Con , a Anode concentration polarization impedance, V
η Con , c Cathode concentration polarization impedance, V
RGas constant, J⋅K−1⋅mol−1
TTemperature, K
pGas pressure, Pa
FFaraday’s constant, C mol−1
∆hReaction enthalpy, kJ / mol
C c Heat capacity of cold gas, kJ⋅kg−1⋅K−1
ChHeat capacity of hot gas, kJ⋅kg−1⋅K−1
CrRatio of heat capacity
CminLow values of heat capacities of the hot and cold streams, kJ⋅kg−1⋅K−1
CmaxHigh values of heat capacities of the hot and cold streams, kJ⋅kg−1⋅K−1
εEffectiveness of heat exchanger
qmaxMaximum possible heat transfer rate, kW
Th,1Hot stream inlet temperature, K
Th,2Hot stream outlet temperature, K
Tc,1Cold stream inlet temperature, K
Tc,2Cold stream outlet temperature, K

References

  1. Payne, R.; Love, J.; Kah, M. Generating electricity at 60% electrical efficiency from 1 to 2 kWe SOFC products. ECS Trans. 2009, 25, 231–239. [Google Scholar]
  2. Massardo, A.F.; Lubelli, F. Internal Reforming Solid Oxide Fuel Cell-Gas Turbine Combined Cycles (IRSOFC-GT): Part A—Cell Model and Cycle Thermodynamic Analysis. J. Eng. Gas Turbines Power 1999, 122, 27–35. [Google Scholar] [CrossRef]
  3. Van Biert, L.; Woudstra, T.; Godjevac, M.; Visser, K.; Aravind, P. A thermodynamic comparison of solid oxide fuel cell-combined cycles. J. Power Sources 2018, 397, 382–396. [Google Scholar] [CrossRef]
  4. Araki, T.; Ohba, T.; Takezawa, S.; Onda, K.; Sakaki, Y. Cycle analysis of planar SOFC power generation with serial connection of low and high temperature SOFCs. J. Power Sources 2006, 158, 52–59. [Google Scholar] [CrossRef]
  5. Mai, B.E. US 20110070509 A1 Fuel Cell System having Two Fuel Cell Stacks Connected in Series. U.S. Patent 9,525,183, 20 December 2016. [Google Scholar]
  6. Fujita, K.; Seyama, T.; Sobue, T.; Matsuzaki, Y. Development of Segmented-in-series-type Solid Oxide Fuel Cells for Residential Applications. Energy Procedia 2012, 28, 153–161. [Google Scholar] [CrossRef] [Green Version]
  7. Kupecki, J.; Skrzypkiewicz, M.; Wierzbicki, M.; Stepien, M. Experimental and numerical analysis of a serial connection of two SOFC stacks in a micro-CHP system fed by biogas. Int. J. Hydrog. Energy 2017, 42, 3487–3497. [Google Scholar] [CrossRef]
  8. Kobayashi, Y.; Ando, Y.; Nishiura, M.; Kishizawa, H.; Iwata, M.; Matake, N.; Tomida, K. Recent Progress of SOFC Combined Cycle System with Segmented-In-Series Tubular Type Cell Stack at MHI. ECS Trans. 2013, 57, 53–60. [Google Scholar] [CrossRef]
  9. Pirkandi, J.; Ghassemi, M.; Hamedi, M.H.; Mohammadi, R. Electrochemical and thermodynamic modeling of a CHP system using tubular solid oxide fuel cell (SOFC-CHP). J. Clean. Prod. 2012, 29, 151–162. [Google Scholar] [CrossRef]
  10. Barelli, L.; Bidini, G.; Ottaviano, A. Solid oxide fuel cell modelling: Electrochemical performance and thermal management during load-following operation. Energy 2016, 115, 107–119. [Google Scholar] [CrossRef]
  11. Kupecki, J. Off-design analysis of a micro-CHP unit with solid oxide fuel cells fed by DME. Int. J. Hydrog. Energy 2015, 40, 12009–12022. [Google Scholar] [CrossRef] [Green Version]
  12. Fragiacomo, P.; De Lorenzo, G.; Corigliano, O. Performance Analysis of a Solid Oxide Fuel Cell-Gasifier Integrated System in Co-Trigenerative Arrangement. J. Energy Resour. Technol. 2018, 140, 092001. [Google Scholar] [CrossRef]
  13. Palomba, V.; Prestipino, M.; Galvagno, A. Tri-generation for industrial applications: Development of a simulation model for a gasification-SOFC based system. Int. J. Hydrog. Energy 2017, 42, 27866–27883. [Google Scholar] [CrossRef]
  14. Corigliano, O.; Florio, G.; Fragiacomo, P. A Performance Analysis of an Anaerobic Digester—High Temperature Fuel Cells Fed by Urban Solid Waste Biogas. Energy Sources Part A Recover. Util. Environ. Eff. 2011, 34, 207–218. [Google Scholar] [CrossRef]
  15. Fragiacomo, P.; Corigliano, O.; De Lorenzo, G.; Mirandola, F.A. Experimental Activity on a 100-W IT-SOFC Test Bench Fed by Simulated Syngas. J. Energy Eng. 2018, 144, 04018006. [Google Scholar] [CrossRef]
  16. Ferrari, M.L. Advanced control approach for hybrid systems based on solid oxide fuel cells. Appl. Energy 2015, 145, 364–373. [Google Scholar] [CrossRef]
  17. Luo, X.; Fong, K. Development of multi-supply-multi-demand control strategy for combined cooling, heating and power system primed with solid oxide fuel cell-gas turbine. Energy Convers. Manag. 2017, 154, 538–561. [Google Scholar] [CrossRef]
  18. Apfel, H.; Rzepka, M.; Tu, H.; Stimming, U. Thermal start-up behaviour and thermal management of SOFC’s. J. Power Sources 2006, 154, 370–378. [Google Scholar] [CrossRef]
  19. Wahl, S.; Segarra, A.G.; Horstmann, P.; Carr, M.; Bessler, W.G.; Lapicque, F.; Friedric, K.A. Modeling of a thermally integrated 10 kWe planar solid oxide fuel cell system with anode offgas recycling and internal reforming by discretization in flow direction. J. Power Sources 2015, 279, 656–666. [Google Scholar] [CrossRef] [Green Version]
  20. Hong, S.K.; Dong, S.K.; Yang, J.B. Experimental and simulated investigation of 1 kW solid oxide fuel cell balance of power system. J. Power Sources 2012, 214, 28–32. [Google Scholar] [CrossRef]
  21. Aguiar, P.; Adjiman, C.S.; Brandon, N.P. Anode-supported intermediate-temperature direct internal reforming solid oxide fuel cell: II. Model-based dynamic performance and control. J. Power Sources 2005, 147, 136–147. [Google Scholar] [CrossRef]
  22. Martinez, A.S.; Brouwer, J.; Samuelsen, G.S. Feasibility study for SOFC-GT hybrid locomotive power: Part I. Development of a dynamic 3.5 MW SOFC-GT FORTRAN model. J. Power Sources 2012, 213, 203–217. [Google Scholar] [CrossRef]
  23. Whiston, M.M.; Bilec, M.M.; Schaefer, L.A. SOFC Stack Model for Integration into a Hybrid System: Stack Response to Control Variables. J. Fuel Cell Sci. Technol. 2015, 12, 031006. [Google Scholar] [CrossRef]
  24. Pianko-Oprych, P.; Hosseini, S.M. Dynamic Analysis of Load Operations of Two-Stage SOFC Stacks Power Generation System. Energies 2017, 10, 2103. [Google Scholar] [CrossRef]
  25. Cheng, T.-C.; Huang, T.-Y.; Chen, C.-F.; Tseng, C.-J.; Lee, S.-W.; Chang, J.-K.; Jang, J.S.-C. Analysis of an intermediate-temperature proton-conducting SOFC hybrid system. Int. J. Green Energy 2016, 13, 1649–1656. [Google Scholar] [CrossRef]
  26. Tanaka, Y.; Terayama, T.; Momma, A.; Kato, T. Numerical Simulation of SOFC System Performance at 90% Fuel Utilization with or without Anode Off-Gas Recycle for Enhancing Efficiency. ECS Trans. 2015, 68, 293–300. [Google Scholar] [CrossRef]
  27. Chan, S.; Khor, K.; Xia, Z.; Khor, K. A complete polarization model of a solid oxide fuel cell and its sensitivity to the change of cell component thickness. J. Power Sources 2001, 93, 130–140. [Google Scholar] [CrossRef]
  28. Aguiar, P.; Adjiman, C.; Brandon, N.; Adjiman, C. Anode-supported intermediate temperature direct internal reforming solid oxide fuel cell. I: Model-based steady-state performance. J. Power Sources 2004, 138, 120–136. [Google Scholar] [CrossRef]
  29. Cui, D.; Liu, L.; Dong, Y.; Cheng, M. Comparison of different current collecting modes of anode supported micro-tubular SOFC through mathematical modeling. J. Power Sources 2007, 174, 246–254. [Google Scholar] [CrossRef]
  30. Al-Megren, H. Advances in Natural Gas Technology; BoD–Books on Demand: Deutschland, Germany, 2012. [Google Scholar]
  31. Pianko-Oprych, P.; Jaworski, Z. Numerical investigation of a novel burner to combust anode exhaust gases of SOFC stacks. Pol. J. Chem. Technol. 2017, 19, 20–26. [Google Scholar] [CrossRef] [Green Version]
  32. Lim, T.-H.; Song, R.-H.; Shin, D.-R.; Yang, J.-I.; Jung, H.; Vinke, I.; Yang, S.-S. Operating characteristics of a 5 kW class anode-supported planar SOFC stack for a fuel cell/gas turbine hybrid system. Int. J. Hydrog. Energy 2008, 33, 1076–1083. [Google Scholar]
  33. Chang, S.C.; Lin, H.J.; Li, S.W.; Yang, C.H.; Chang, W.S.; Liu, C.R. Analysis of Proton/Oxygen-Ion Conducting Solid Oxide Fuel Cell Systems with an External Reformer. J. Chin. Soc. Mech. Eng. 2017, 38, 597–603. [Google Scholar]
  34. Zhao, F.; Virkar, A.V. Dependence of polarization in anode-supported solid oxide fuel cells on various cell parameters. J. Power Sources 2005, 141, 79–95. [Google Scholar] [CrossRef]
  35. Thanomjit, C.; Patcharavorachot, Y.; Ponpesh, P.; Arpornwichanop, A. Thermodynamic analysis of solid oxide fuel cell system using different ethanol reforming processes. Int. J. Hydrog. Energy 2015, 40, 6950–6958. [Google Scholar] [CrossRef]
  36. Fang, Q.; Blum, L.; Peters, R.; Peksen, M.; Batfalsky, P.; Stolten, D. SOFC stack performance under high fuel utilization. Int. J. Hydrog. Energy 2015, 40, 1128–1136. [Google Scholar] [CrossRef]
Figure 1. The solid oxide fuel cell (SOFC) system with a two-sub-stack module. CHP, combined heat, and power.
Energies 12 03686 g001
Figure 2. j-V curves of the solid oxide fuel cell at different operating temperatures.
Energies 12 03686 g002
Figure 3. Effects of fuel use and air flow rate on the SOFC stack temperature.
Energies 12 03686 g003
Figure 4. The dynamic curves of (a) the stack temperature and (b) the operating power and current of the two-stack SOFC system with an equal flow split ratio.
Energies 12 03686 g004
Figure 5. The dynamic curves of (a) the stack temperature and (b) the operating power and current of the two-stack SOFC system with a non-equal flow split ratio. The inserts show the temperature differences of the two stacks.
Energies 12 03686 g005
Figure 6. Dynamic curves of stack temperatures in long-term SOFC-CHP system operation. (a) The non-modified case; (b) optimal control case.
Energies 12 03686 g006
Figure 7. Dynamic curves of the operating current and power generation in long-term SOFC-CHP system operation. (a) The non-modified case; (b) optimal control case.
Energies 12 03686 g007
Figure 8. Temperature variation of the exhaust gases in the non-modified and optimal control cases.
Energies 12 03686 g008
Table 1. Parameters for the numerical model of the solid oxide fuel cell.
Parameter Value
Fuel cell operating temperature (°C) 700, 800, 900
Fuel cell operating pressure (atm) 1
Electrolyte conductivity (S m−1) [29]33.4 × 10³ exp(−10.3 × 10³/T)
Anode conductivity (S m−1) [29]((95 × 106)/T) exp(−1150/T)
Cathode conductivity (S m−1) [29]((42 × 106)/T) exp(−1200/T)
Anode apparent diffusion coefficient (m2 s−1) [28]3.66 × 10⁻⁵
Cathode apparent diffusion coefficient (m2 s−1) [28]1.37 × 10⁻⁵
Cathode thickness (m) 12 × 10−6
Electrolyte thickness (m) 6 × 10⁻⁶
Anode thickness (m) 400 × 10−6
Faraday’s constant (C mol−1)96,487
Table 2. The base parameters for the dynamic analysis model.
ParameterValue
Number of SOFC stacks in one tower2
Activation area of a single cell (cm2)100
Number of single cells in a stack160
Fuel cell operating pressure (atm)1
Temperature where the stack started to produce power (°C)≥700
The efficiency of the combustion reaction (%)100
The efficiency of the heat exchanger (%)≥80%
The average heat capacity of methane (kJ/kg·K)3.46
The average heat capacity of nitrogen (kJ/kg·K)1.11
The average heat capacity of hydrogen (kJ/kg·K)14.68
The average heat capacity of carbon monoxide(kJ/kg·K)1.13
The average heat capacity of carbon dioxide (kJ/kg·K)1.05
The average heat capacity of steam (kJ/kg·K)2.111
The average heat capacity of oxygen (kJ/kg·K)1.01
The average heat capacity of steel (kJ/kg·K)0.45
The average heat capacity of ceramic (Al2O3) (kJ/kg·K)0.84
Table 3. Effects of fuel use and air flow rate on the current and gross power output of SOFC stacks under equal distribution of gases.
Air Flow/FU65%70%75%80%
Air Flow (slpm)Power (kW)I (A)Power (kW)I (A)Power (kW)I (A)Power (kW)I (A)
6005.14 37.05.27 38.55.39 40.0 5.52 41.5
7004.88 36.55.00 38.0 5.13 39.5 5.25 41.0
8004.61 36.04.74 37.5 4.86 39.0 4.94 40.0
9004.31 35.54.43 37.0 4.55 38.5 4.67 40.0
Table 4. Parameters of the simulation model for the manifold effect analysis.
Operating ParametersValues
Number of SOFC stacks in one tower2
CH4 for heating process (slpm)8
Air for heating process (slpm)480
CH4 for loading(slpm)36
Steam and Carbon ratio2.5
Air for loading (slpm)700
Fuel use (%)70%
The operating temperature for starting the power generation process (°C)≥700
The limit of changing the flow rate (slpm/min)20
The limit of changing the current (A/min)0.16
Table 5. Power and system efficiency of the SOFC-CHP system of a two-stack module with maldistribution flow rates.
CasesInput FuelSystem Efficiency (%)Power Efficiency (%)Power Generation (kW)Heat of CHP Water Output (kW)
non-modifiedfull85.0649.869.776.9
30%90.1149.33.222.66
Optimal controlfull86.9154.1110.66.43
30%90.4452.033.42.51

