Article

Mechanism of Saline Deposition and Surface Flashover on High-Voltage Insulators near Shoreline: Mathematical Models and Experimental Validations

by
Muhammad Majid Hussain
1,*,
Muhammad Akmal Chaudhary
2 and
Abdul Razaq
3
1
Faculty of Computing, Engineering and Science, University of South Wales, Treforest, Cardiff CF37 1DL, UK
2
Department of Electrical and Computer Engineering, Ajman University, Ajman P.O. Box 346, UAE
3
School of Design and Informatics, Abertay University, Dundee DD1 1HG, UK
*
Author to whom correspondence should be addressed.
Energies 2019, 12(19), 3685; https://doi.org/10.3390/en12193685
Submission received: 17 July 2019 / Revised: 9 September 2019 / Accepted: 24 September 2019 / Published: 26 September 2019
(This article belongs to the Special Issue High Voltage Engineering and Applications)

Abstract

:
This paper deals with sea salt transportation and deposition mechanisms and discusses the serious issue of degradation of outdoor insulators resulting from various environmental stresses and severe saline contaminant accumulation near the shoreline. The deterioration rate of outdoor insulators near the shoreline depends on the concentration of saline in the atmosphere, the influence of wind speed on the production of saline water droplets, moisture diffusion and saline penetration on the insulator surface. This paper consists of three parts: first a model of saline transportation and deposition, as well as saline penetration and moisture diffusion on outdoor insulators, is presented; second, dry-band initiation and formation modelling and characterization under various types of contamination distribution are proposed; finally, modelling of dry-band arcing validated by experimental investigation was carried out. The tests were performed on a rectangular surface of silicone rubber specimens (12 cm × 4 cm × 8 cm). The visualization of the dry-band formation and arcing was performed by an infrared camera. The experimental results show that the surface strength and arc length mainly depend upon the leakage distance and contamination distribution. Therefore, the model can be used to investigate insulator flashover near coastal areas and for mitigating saline flashover incidents.

Graphical Abstract

1. Introduction

The performance of outdoor high-voltage insulators near the shoreline is a key factor in the determination of power network systems’ stability and reliability. It is well known that contamination is considered a major critical factor responsible for surface flashovers [1]. The process of saline deposition on an insulator surface, associated with flashover and consequent power outages has been a major problem for power network systems since the early 1900s [2]. The time to surface flashover initiation depends on (i) deposition of saline contamination, and (ii) how salt particles penetrate and are diffused on the insulator surface through various wetting agents such as rain, fog, snow, dew or drizzle.
It is recognized that saline deposition and diffusion are affected by various natural processes such as temperature exposure, relatively humidity or moisture level, counter-diffusion of hydroxide ions and environmental load of salts and other adverse weather conditions. Types of contamination deposition on the insulator surface influence surface flashover, which has been extensively studied by several researchers [3,4,5,6,7,8]. The use of non-ceramic insulators increased significantly in last five decades. Silicone rubber insulators both in service [9] and high-voltage laboratory tests [10] demonstrated better performance than ceramic insulators in contaminated environmental conditions. Initially, non-ceramic insulators prevent water filming on the surface due to their hydrophobic properties, but this resistance gradually decreases due to physical and chemical changes in the silicone materials which can lead to dry-band arcing and surface discharges [11]. The combination of high-voltage stress and a contaminated water film produces dry-band arcing, and the resulting heat can lead to erosion of the insulator surface. The surface is damaged by physico-chemical changes caused by dry-band arcing [12,13]. Most of the previous work on surface flashover of contaminated insulators mainly focused on laboratory or onsite experiments based on alternating current (AC) and direct current (DC) voltage [14,15,16].
Kim et al. [17] studied chemical changes on the silicone rubber insulators during dry-band arcing but did not investigate the physical changes, for example the behavior of arc lengths with uniform and non-uniform pollution levels, as well as arc resistivity, power and energy. Therefore, there is a need to investigate the effects of dry-band arcing for a better understanding of the physical changes on the surface of silicone rubber insulators.
This paper presents a model, which is based on mechanism of sea salt transportation, deposition and diffusion on outdoor insulators near a shoreline, taking into account the saline concentration and the distance from the shoreline. It also introduces a new mathematical model to investigate the development of dry bands for different types of pollution layers on silicone rubber. A series of simulations and experiments were performed on the model to verify the theoretical results.

2. Mechanism of Salt Transportation and Deposition

The following three sub-models simulating three different processes were combined into one theoretical model of sea salt production, transportation and deposition:

2.1. Production of Saline

There are two major regimes where saline ions and particles are generated and scattered from shoreline to inland. Sea salt particles originate from breaking sea waves, a phenomenon that is followed by a high rate of wave motion and turbulence, air entrainment and surf formation. At high-level oceans, this breaking phenomenon is encountered under higher wind action with the formation of whitecap bubbles. As these bubbles rise, they are forced into the air where they scatter, thus producing saline particles. These particles can be routed to shoreline areas by oceanic wind speeds that exceed 4 to 12 ms−1 [18,19], where they tend to settle on outdoor insulators after a certain time and after having covered a certain distance. This mechanism is important in the generation of saline particles at intermediate to high wind speeds. In fact, wind speed is not the only factor to be taken into consideration. However, any factor favouring wave breaking and turbulence in the sea near the coast line must contribute to the formation of saline particles.

2.2. Saline Transportation and Deposition

Pollution near coastal regions is a major source of degradation of power network system equipment. In particular, saline attack is an important and major factor in the deterioration process of high voltage outdoor insulators near the coast. Feliu et al. proposed a complex theoretical model to represent transfer and deposition of saline on testing equipment near coastal areas [20]. However, this was based on constant spray of artificial aerosol, such as haze, dust and smoke, which do not represent natural climate conditions. In the present paper, a sea salt mechanism model representing saline transportation and deposition on outdoor insulators near coastal areas is proposed. The model represents the relationship between sea salt deposition on outdoor insulators and distance from the shoreline. Saline ions and particle changes are also taken into account driven on outdoor insulators by the wind from the sea. The study and experimental implementation of this new model is particularly useful for the investigation of surface degradation and surface flashover of outdoor insulators and substation components near shoreline based on salt concentration, wind speed and direction, and distance from coastal areas. The exposure of this model and experimental work is very similar to that of high-voltage transmission lines running along the seashore of Scotland, where outdoor insulators are exposed to wind, fog and rain, but not to direct saline spray. From various studies [21,22], it was found that near the shoreline salt particles mobilization was based on gravitational settlement and wind speed, and that these salt particles can travel longer distances before deposition. Based on that, a model and mechanism of sea salt transportation and deposition is presented in Figure 1.
Figure 1 represents a schematic mechanism of sea salt transportation and deposition, which shows the saline concentration (S) and its variation (S0, S1,... and Sn). In this model, oceanic winds, distance from the sea, diffusion and penetration of saline and gravitational settlement of saline on outdoor insulators are taken into account. The resultant vertical settlement flux (Fv) of saline due to gravitational effect and the saline transport near the shoreline on the outdoor insulators’ surface is represented by a horizontal flux (Fh), as a significance of saline concentration, saline variation and wind regime. The relationship between saline concentration (S) and its variation (S0, S1,… and Sn) from shoreline to the surface of insulator, vertical resultant deposition flux (Fv) and deposition rate (Vdep) is represented in Equation (1) by means of a mathematical simplification of flow velocity fluid mechanics equations:
F v = V d e p   S
From Equation (1), it is possible to determine the saline concentration (S) with variation (S0, S1…, and Sn) from shoreline to the surface of insulator, and deposition variation with time as a function of deposition rate (Vdep). It follows that the mass of saline deposited per unit of time is a negative function of the resultant vertical deposition flux. This is represented by Equation (2), where dt is the time variation, h is the thickness of the saline contamination layer and where the negative sign represents the reduction of saline concentration (S) deposition on the insulator surface with time and distance from the sea.
d S d t = S V d e p h
Equation (3) is the solution of Equation (2) on the basis of an environmental natural phenomenon by which saline characteristics change when transported and deposited on outdoor insulators and substations equipment from sea to near shoreline. The saline decreases exponentially as shown in Equation (3), where S0 is the saline concentration at shoreline, x is the distance from the sea and α is a constant represented by “α= Vdep/vh”, where v as the wind speed. However, to solve Equation (3) it should be assumed that the deposition rate is constant with time and for any distance from the shoreline and its decay function may be estimated as:
S = S 0 e α x
The unit of saline concentration is (mg/cm2), taking into account the exponential decrease of saline deposition rate with time (saline concentration and deposition velocity has a proportional relation, thus Equation (3) can be rewritten as V d e p = V d e p 0 e α t ), and that, during a time period (t) as some saline particles are deposited on the surface of insulators installed at certain distance from the sea, while the remaining particles travel from the shoreline to a subsequent distance (x) driven by wind speed (v). As a result, integration of Equation (3) can be expressed by Equation (4), where S is the saline concentration at a distance x from seashore, S0 is the saline concentration at seashore, Vdep0 is the initial deposition rate of a saline at shoreline, h is the thickness of the contamination layer on the insulator surface and α is a coefficient of the deposition rate reduction that characterizes saline contamination distribution and its influence on deposition rate.
S = S 0 e ( v d e p 0 α h ) [ e ( α x v ) 1 ]
where t = x v .
The coefficient of deposition rate reduction is directly influenced by saline particles that are distributed near the shoreline. Considering that saline deposition on an insulator surface corresponds to saline particles that influence and remain on its surface during migration of saline from shoreline to inland and assuming that there is a proportional relation between saline flux (Φ), which depends upon insulator weather sheds and environmental characteristics and saline deposition (D) on the insulator surface. This can be expressed by a simplified relationship:
D = Φ ( V S )
where Φ is capture efficiency constant for the saline, which depends upon climate conditions and outdoor insulators, V is the wind speed and S is the saline concentration. On the basis of these assumptions and as a consequence, Equation (4) can be integrated, simplified and rewritten as:
D = D 0 e ( v d e p 0 α h ) [ e ( α x v ) 1 ]
where D0 is the saline deposition on the insulator surface at a certain distance from the shoreline and D is the saline deposition on the insulator surface from shoreline to inland. Equations (4) and (6) combine the proposed model of saline transportation and deposition from shoreline to inland on the insulator surface. Thus, Equation (4) represents the saline concentration variation across the seashore regime and Equation (6) represents the saline deposition rate on the insulator surface across the same regime. Contamination deposition mechanisms rather than gravitational settlement, like high speed wind and the scavenging effects due to heavy rainfall or dense fog precipitation were also considered at this stage in the model and related experimental investigations are presented.
The proposed model, which is based on a physical phenomenon, can be used to allow for the action of saline particles generated at sea and to account for the saline concentrations and deposition on the insulator surface near the shoreline. The aim of the proposed model is to observe the action of different input variables individually. Thus, simulations were done taking as a reference Equation (6) to find the saline deposition on insulator surface at different wind speeds and distances from shoreline. Saline deposition on the insulator surface represents the severity of saline transportation from the shoreline. Figure 2 indicates the saline deposition behaviour, when average wind speed varies in a range between 4.0 to 12.0 ms−1. Figure 2 clearly shows that increase in wind speed contributes to migrate more saline ions further from shoreline, however, when wind speed was higher than 12 ms−1, the migration of saline ions tended to be constant. Consequently, saline deposition on the insulator surface increases at fixed distance from shoreline. Moreover, insulator surface deposition significantly decreases with increasing the distance from shoreline to inland. For the simulations displayed in Figure 2, the conditions used were with variable wind speed and initial deposition rate, assuming the constant of coefficient of deposition rate reduction α (0.01 s−1), which depends on insulator surface and environmental characteristics, derived from α = e A . T × V d e p v h , where A is total area of the insulator sheds and T is ambient temperature.

2.3. Saline Penetration and Moisture Diffusion

Saline and moisture migration are two important processes for studying the long-term durability of high-voltage insulators. The interaction between saline penetration and moisture diffusion become more important for high voltage insulator materials subjected to repeated wetting and drying cycles near the shoreline. Various other environmental stresses can also influence these. They will vary depending upon airborne saline particles and moisture levels in a marine environment. The saline penetration and moisture absorption on the insulator surface near the shoreline is usually caused by saline water spray carried by the prevailing winds coming from the coast [23]. It is a complex process that involves heat and mass transfer. Due to constant wetting rate, heat and mass transfer processes are much less important than diffusion and penetration processes. In this case, diffusion and penetration can be considered as one-dimensional, and numerical methods are required to solve it. The simulation was performed using COMSOL Multiphysics software. A 2-dimentional model was developed in COMSOL Multiphysics and two boundary conditions were considered for the simulation, as shown in Figure 3. The technical specifications of the 2-D model are summarized in Table 1. The first condition related to a fiber reinforced plastic (FRP) rod, was impermeability, so that saline concentration and moisture content were considered to be equal to zero. The second boundary was related to the insulator surface, for direct saline penetration and moisture diffusion. During the simulation work, saline ions and moisture struck and penetrated the silicone rubber (SiR), a process which may be described by Fick’s Second Law of Diffusion, assuming constant diffusivity and direct saline binding. This law is expressed by Equation (7):
S t = D 2 S 2 X
where S is the saline penetration (mg/cm2) as a function of time (t) at a distance X from the shoreline and D is the diffusion coefficient of moisture. The solution for saline penetration and moisture diffusion on insulator surface is given by Equation (8). The error function (erf) may be determined from the standard table of Fick’s law.
S ( x , t ) = S C ( 1 e r f X 2 D )
The model provides the estimation of the local saline penetration and moisture concentration along the insulator pollution thickness. Figure 4 shows a simulation from the beginning of the penetration and diffusion process to the end of it. The curves of penetration and diffusion into the insulator sample were a two-stage growth process such as that for wetting and drying. The saline penetration in the water film increases non-linearly with the development of moisture concentration. As this process unfolds, the saline dissolved in water steadily gathers at the top of the water film. It can be clearly seen that, at the beginning of penetration and diffusion, the initial rapid growth is followed by a slowdown and ultimately drifts towards saturation. Thus, it can be concluded that the transfer of moisture significantly accelerates the penetration of saline ions on SiR materials, this method can also be used on other types of insulator models such as porcelain and glass. The negative sign with error function (erf) in Equation (8) states that increasing the accumulate moisture in wetting condition has the effect of increasing diffusion and penetration of saline on the insulator surface.

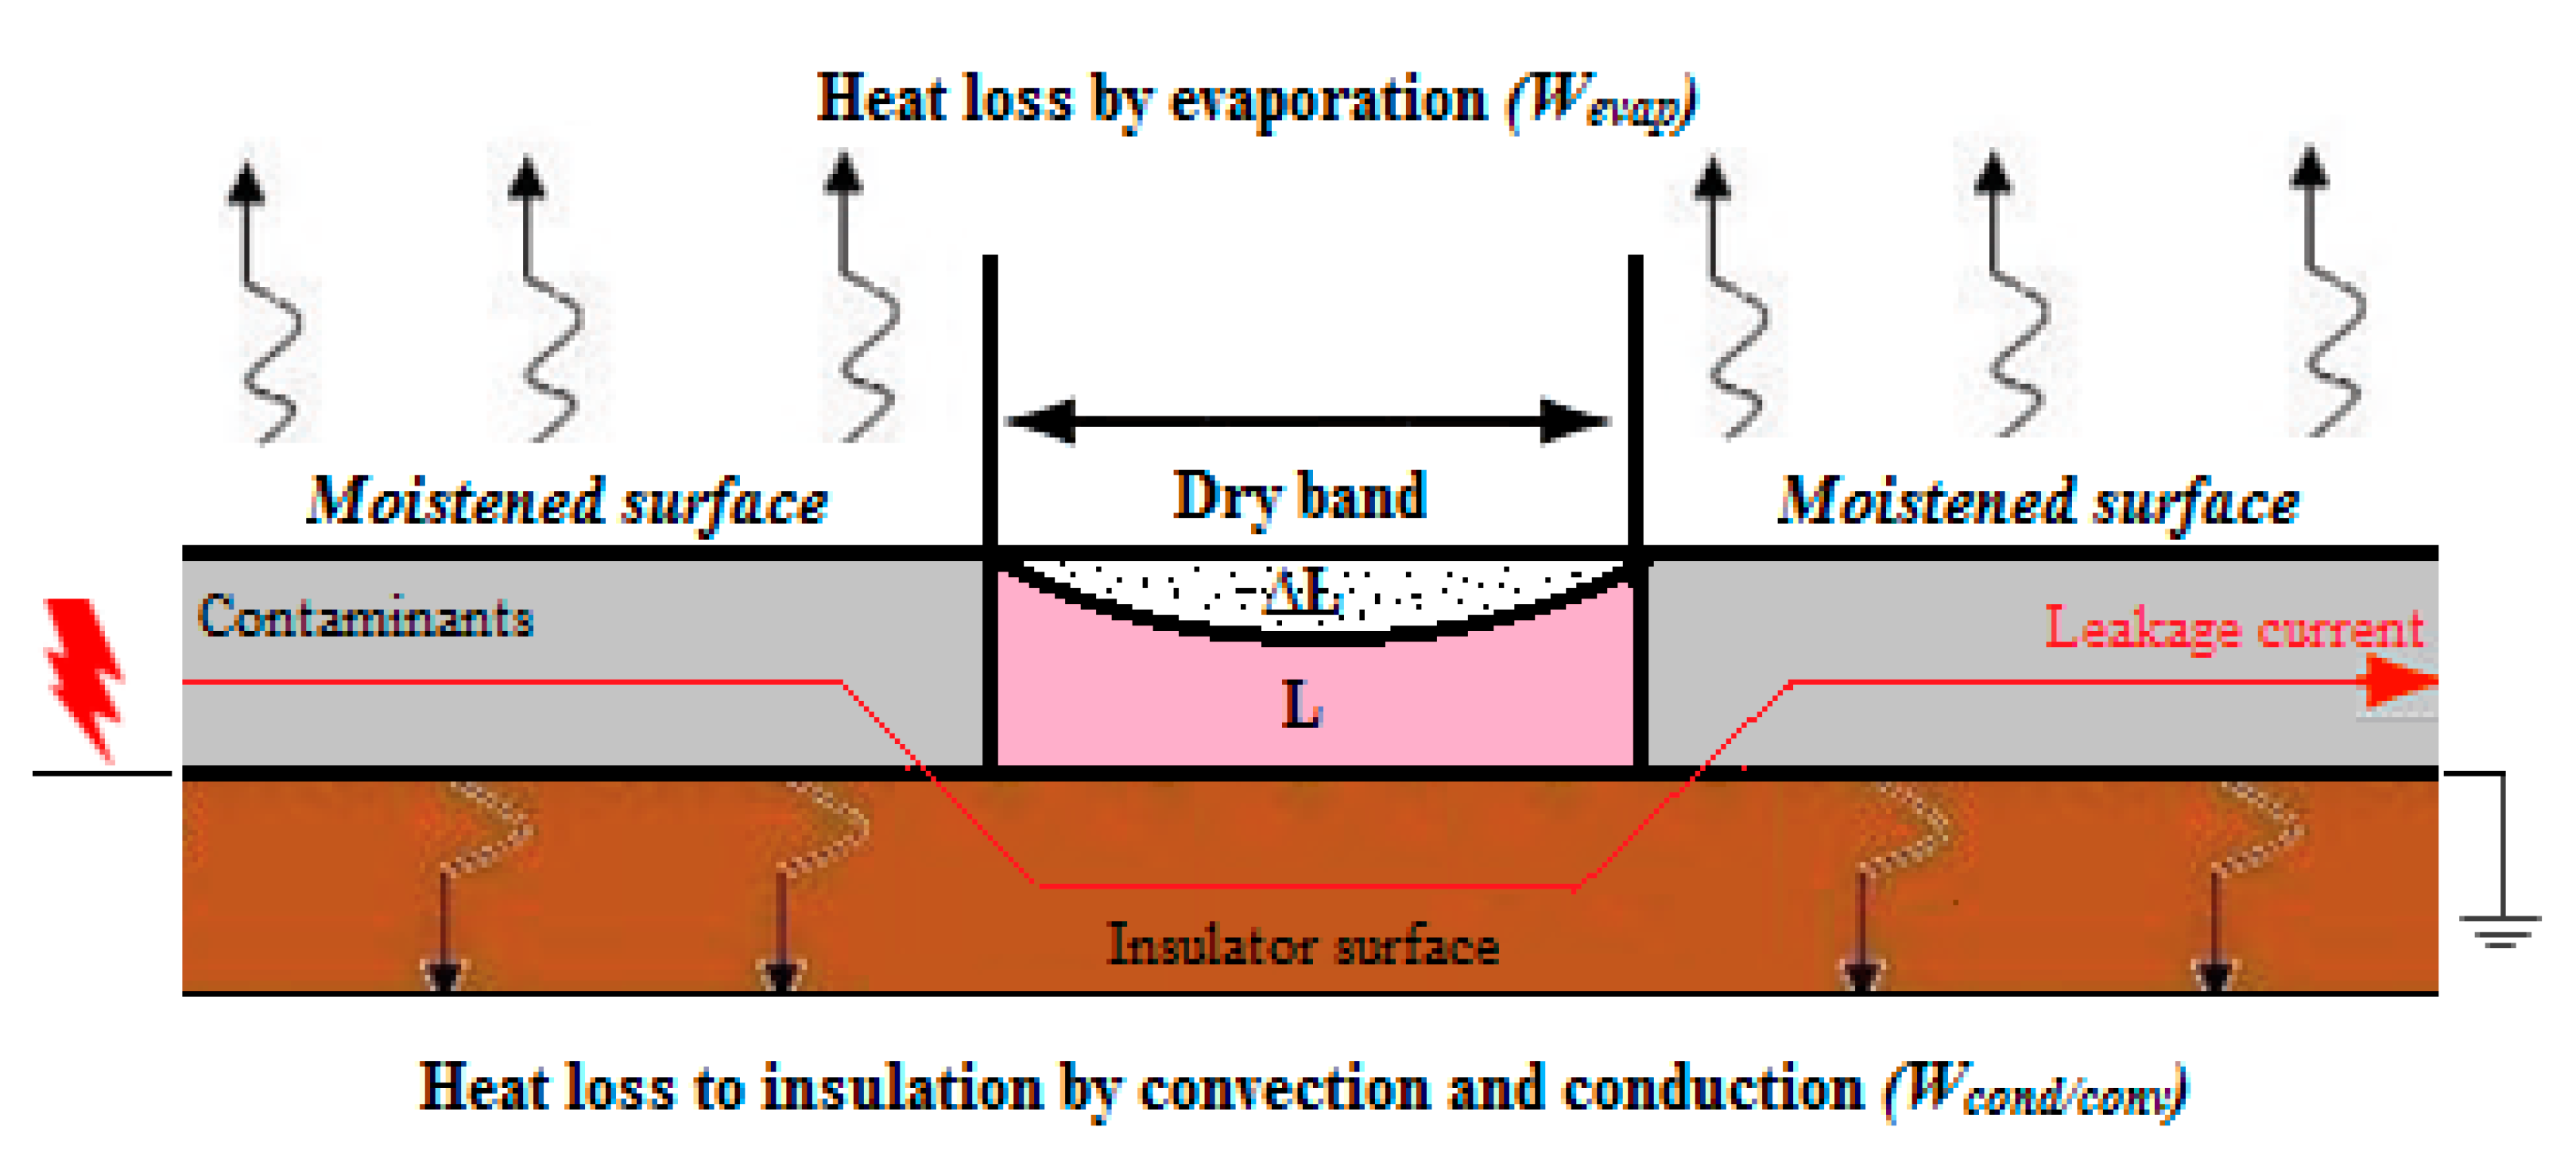
3. Modelling of Dry Band Initiation and Formation

The development of a dry band formation on the surface of a silicone rubber model in normal cold fog can be mathematically formulated by considering the energy balance equation, which can be expressed as:
Energy in = Energy out + Energy related to change in and on insulator surface
In our case, the energy balance equation can be expressed as:
W L C = W Δ T + W e v a p . + W c o n d . / c o n v .
  • WLC = Energy generated by leakage current
  • WT = Energy generated by change in temperature
  • Wevap. = Energy loss by evaporation due to ambient temperature
  • Wcond./conv. = Energy loss by convection and conduction
The model of dry band formation and initiation is shown in Figure 5. Evaporation is an important factor in cold and normal fog conditions in winter and early spring. Before the formation of the dry band, the voltage gradient along the insulator surface is uniform and its relationship to surface resistivity is:
E s = ρ s · J s
where subscript s represents the surface of insulator, Js is the surface current density, Es is the electric field intensity per unit area and ρ s mass of air per unit volume on insulator surface. Equation (11) shows the relationship between current density and variable dry band length,
J s = I Δ L
where ∆L is the variable length of dry band with surface current density.
The power dissipated per unit area of the insulator surface is:
p = ρ s · J s 2
Due to the dissipated power the temperature of the pollution layer is rising because of heat transfer with the surroundings. Due to heat transfer, the temperature and dry-band area increased by ∆T and ∆s·d(s), respectively, in a short period of time dt. Cold fog is made of condensed water droplets which are the result of a humid air mass being cooled to the dew point where it can no longer hold all of the water vapor.
Therefore, the corresponding volume d(L l , and mass of cold fog is ρs·d·(L l . Heat consumed by the evaporation process is given by:
W e v p . = L e ·   ρ s · d ( Δ L ) · l
where Le is the latent heat of fog.
The resistance of the dry band region is l /s. 1/σ due to a small volume of length L. Hence the heat generated by the current in AC system is:
W L C = 1 σ Δ L   · l · ( J S   Δ L ) 2
The conduction of heat is determined by the temperature difference between cold fog and insulator surface Hcond(TfTs) per unit area. The convection of heat between cold fog and the air interface on the insulator surface is Hconv(TfTa) per unit area.
The change in temperature of cold fog is in relationship with specific heat as ∆T·mCh. The latent heat of cold fog to moisture due to evaporation is ∆m·Lm. Surface resistivity changes with change of temperature along insulator surface length l in a short period of time dt so that:
W Δ T   = C h . ρ s · Δ L · l · d
where ρ s is the medium density.
If the volume of moisture is very small and does not interact with the air or insulator surface, then there is no convection or conduction. If it interacts with the insulator surface, then the area of interaction is ∆Am·ρ· l . In a short period of time dt, the dissipated heat is given by:
W c o n d c o n v e = H c ( T m T p ) ·   Δ A m · ρ · l · d t
By combining Equations (13)–(16), we obtain:
l σ Δ L · l · ( J S   Δ L ) 2 · d t = L e · ρ s · d ( Δ L ) · l + C h · ρ s · Δ L · l · d t + H c     ( T m T p ) ·   Δ A m   · ρ · l · d t
If the distribution of current is uniform along the insulator surface, then ∆ can be neglected. Then by dividing both side of Equation (17) by l · d t L Equation (18) is obtained:
l σ   ( J S   ) 2 = L e · ρ s · L · d L d t · l + C h · ρ s · L ·   l · d t + L · H c   ( T m T p ) · A m p
From Equation (18), it can be noted that there are five (σ, L, T, ρs and t) essential and critical physical parameters involved in the dry-band formation and arcing on the insulator surface. As L is the length of the dry band region, the drying rate can be calculated by using small steps dL/dt until L becomes zero. This is the point where time to dry band arcing on insulator surface will be started. The dry band is completely formed when the area L on the insulator surface becomes zero where the leakage current is intermittent.

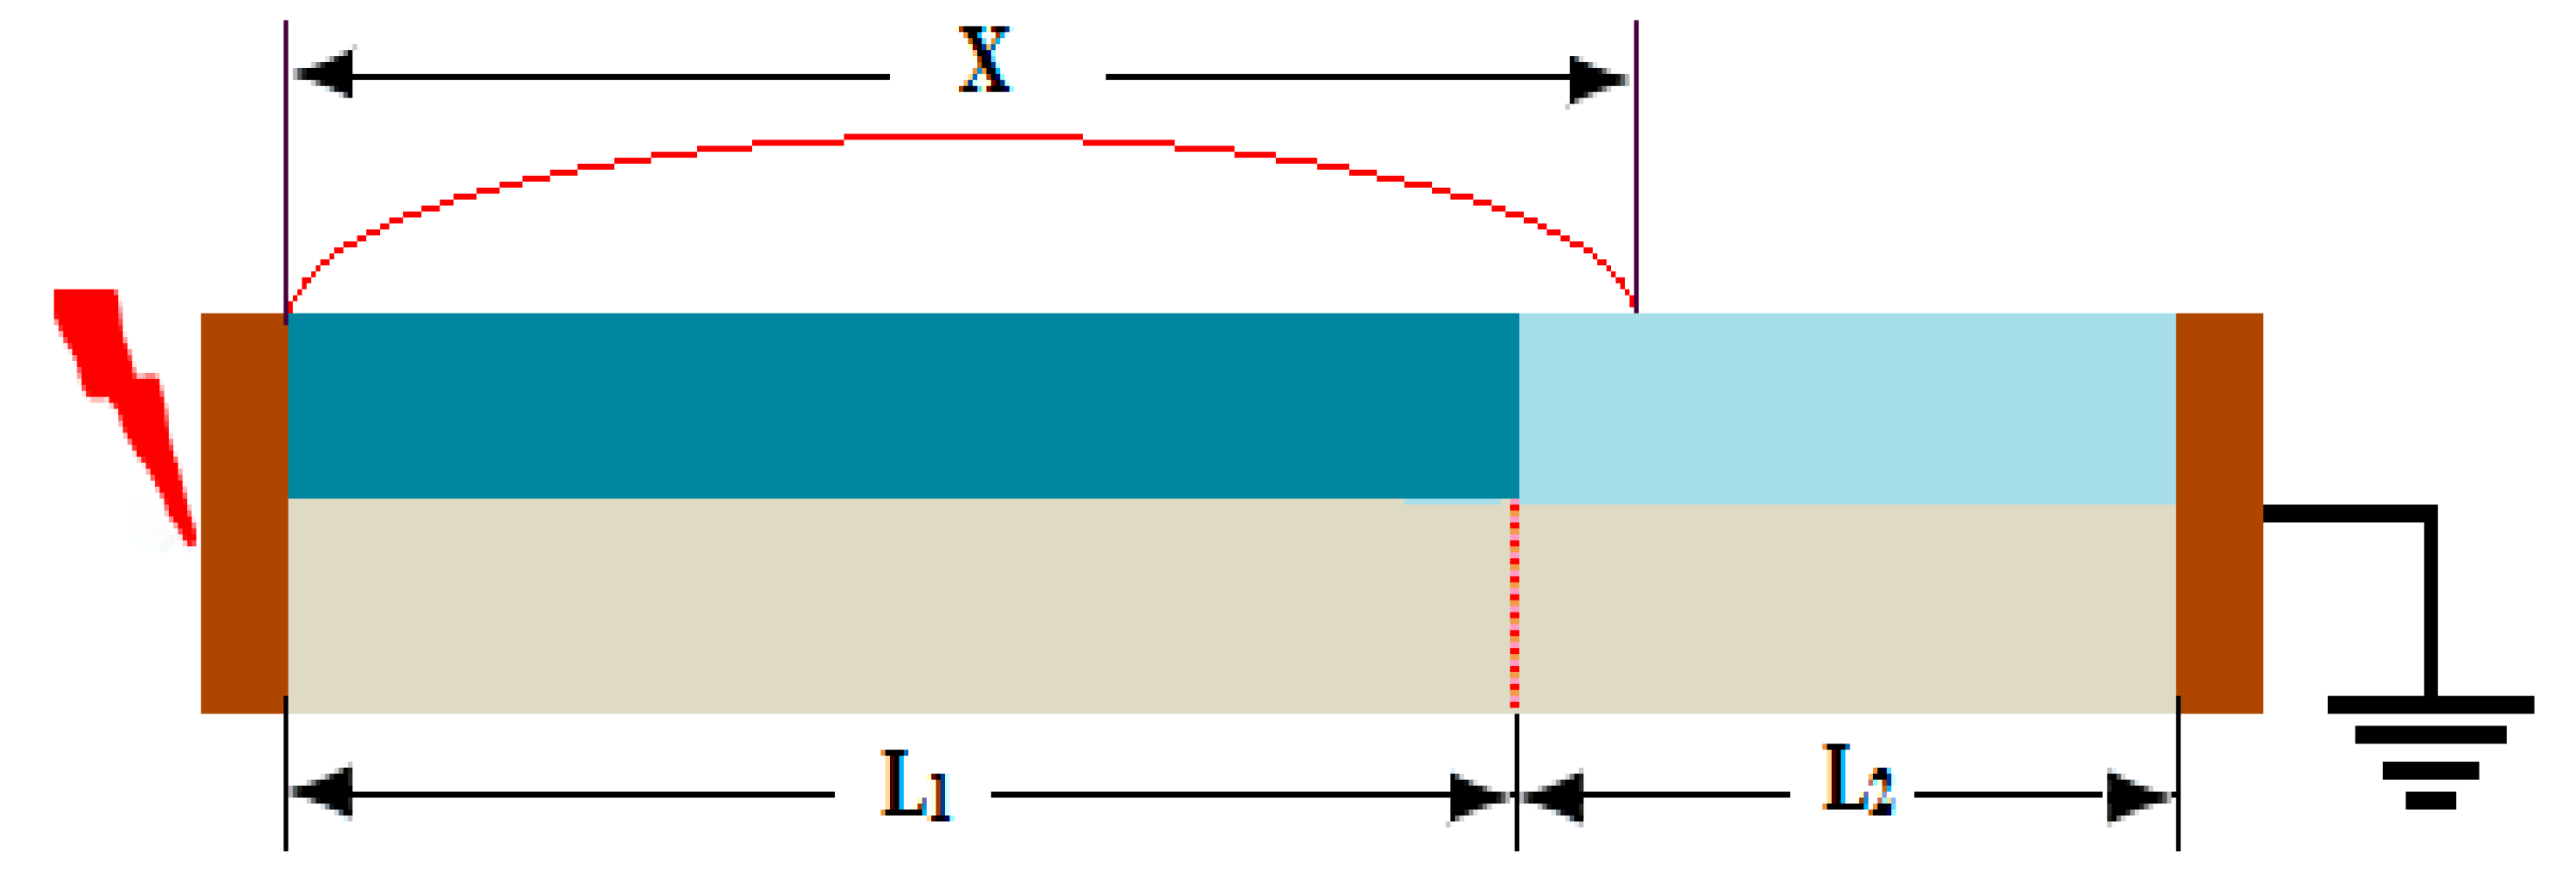
4. Partial Arc Electric Model of Dry-Band Flashover

Several researchers have worked to make useful contributions to this subject [1,24]. However, there are several key shortcomings in the models presently available. The present model capable of handling both uniform and non-uniform distributions pollution on the surface of insulators is more relevant. There are several aspects on which arc resistance and dry-band formation depend. The models assume that if a dry band can be formed and if the arc is able to bridge the dry band will continue propagation with different contamination degree. The dry band arcing is modeled mainly in two stages: First the formation of dry band and initial arc and second the arc propagation and arc bridging.
A thorough understanding of all aspects of flashover mechanism on an insulator surface is required to explore the subject further. Such a task would necessarily include an investigation of dry band arcing under different contamination levels along the leakage distance. Propagation of the alternating current (AC) surface flashover on polluted insulators is a complex phenomenon. The length and intensity of arcs may change in milliseconds. The arc is only highly ignited in the period of peak voltage, while during reaming periods the arc ignites and reignites following the voltage. Despite the complexity of the mechanism involved in dry-band arcing, many simplifying assumptions can be made in order to obtain an acceptable mathematical modelling.
The growth of the dry band and the dry-band arcing characteristics method have been well reviewed by Jolly and Poole [25] but their model will be extended here based on fundamental mathematical equations. The model was used for the analysis of the growth of the discharge with different contamination degrees along the leakage distance of specimen. The test procedures were as follows:
CASE 1:
In this case the sample leakage distance is divided into two sections L1 and L2 while the corresponding surface conductivities and surface resistances are σ1, σ2 and ri1, ri2, respectively, as shown in Figure 6. L1 is the high voltage side and L2 the grounded side. Section L1 was lightly polluted while L2 was polluted with heavy pollution levels. The hydrophobicity of the high-voltage side L1, is higher than that of the grounded side L2. Due to this difference, the arc cannot develop along the entire surface and its length is less than L1 due to surface strength, as shown in Equation (23). As long as the arc length is smaller than section L1, very small parts of L2 can hardly influence arc length X. In this case, it may assume that the probability of subsistence of surface flashover at energized condition is very low.
If the heavily contaminated surface is located at the grounded side, the influence of the totally hydrophilic section (L2) on arc length X can be described as follows:
L = L 1 + L 2
Then the resistance of heavily polluted section L2 that could not have connected with arc X can be written as:
R i = r i 1 ( L 1 L ) + r i 2 ( L 2 )  
It is a well-known fact that current is necessary to sustain and ignite the arcing process on the insulator surface so that it can be derived from the Obenaus model [26] and rewritten as:
I = [ n N X r i ( L X ) ] 1 1 + n
It is assumed that constants n and N for arcs and insulator are comparable. From Equation (21), we can find the critical arc length Xc of the composite insulator that relates to section L1 as follows:
L i m ( X   X c ) = [ X n 1 N 1 r i 1 ( L 1 L ) + r i 2 L 2 ] 1 1 + n 1
Equation (23) can be written in terms of sectional lengths and the ratio of surface conductivities and resistivities, and the root of an arc is close to section of L2 of resistance per unit length. The relationship of Equation (24) shows that the L1 leakage distance section, bridged with the arc, does not influence arc length X.
X c < [ N 1 r i 1 ] 1 1 + n 1
X c = [ L 1 + k L 2 1 + n 1 ]
The simplified relationship of the surface conductivities and resistivities of sections L1 and L2 can be expressed as: k = r i 2 r i 1 = σ 1 σ 2
where σ1 and σ2 are surface conductivities and ri1 and ri2 surface resistance of sections L1 and L2.
CASE 2:
In this case the section L1 was heavily polluted while L2 lightly polluted. It is assumed that the specimen is totally hydrophilic only near a high-voltage side, as presented in Figure 7. This consideration is due to long-term operating conditions. If section L1 is hydrophilic as compared to L2 then what influence of hydrophilic section of the creepage distance L1 has on the arc length X.
When arc length X connected with section L2 with reduced k-times is on the lightly polluted and more hydrophobic section, then the leakage distance of the sample corresponding to L2 can be written as Equation (25).
L 2 = L 2 + k L 1
L i m ( X   X c ) = [ X n 2 N 2 r i 2 ( L 2 + k L 1 L ) ] 1 1 + n 2
X c > [ N 2 r i 2 ] 1 1 + n 2
X c = [ L 2 + k L 1 1 + n 2 ]
The relationship indicates that the L1 section of creepage distance connected with the arc but practically L2 does not have any influence on a critical arc length Xc. To figure out the reason, it can be assumed that discharge current and arc length X is increased resulting in a heavy pollution level and more hydrophilic surface near high voltage end, and at a certain level of contamination, as described in the division of sample creepage distance, uneven potential distribution on the specimen occurs that ignites the arc along section L1 that causes an immediate extension for section L2 resulting in a sudden surface flashover occurring.

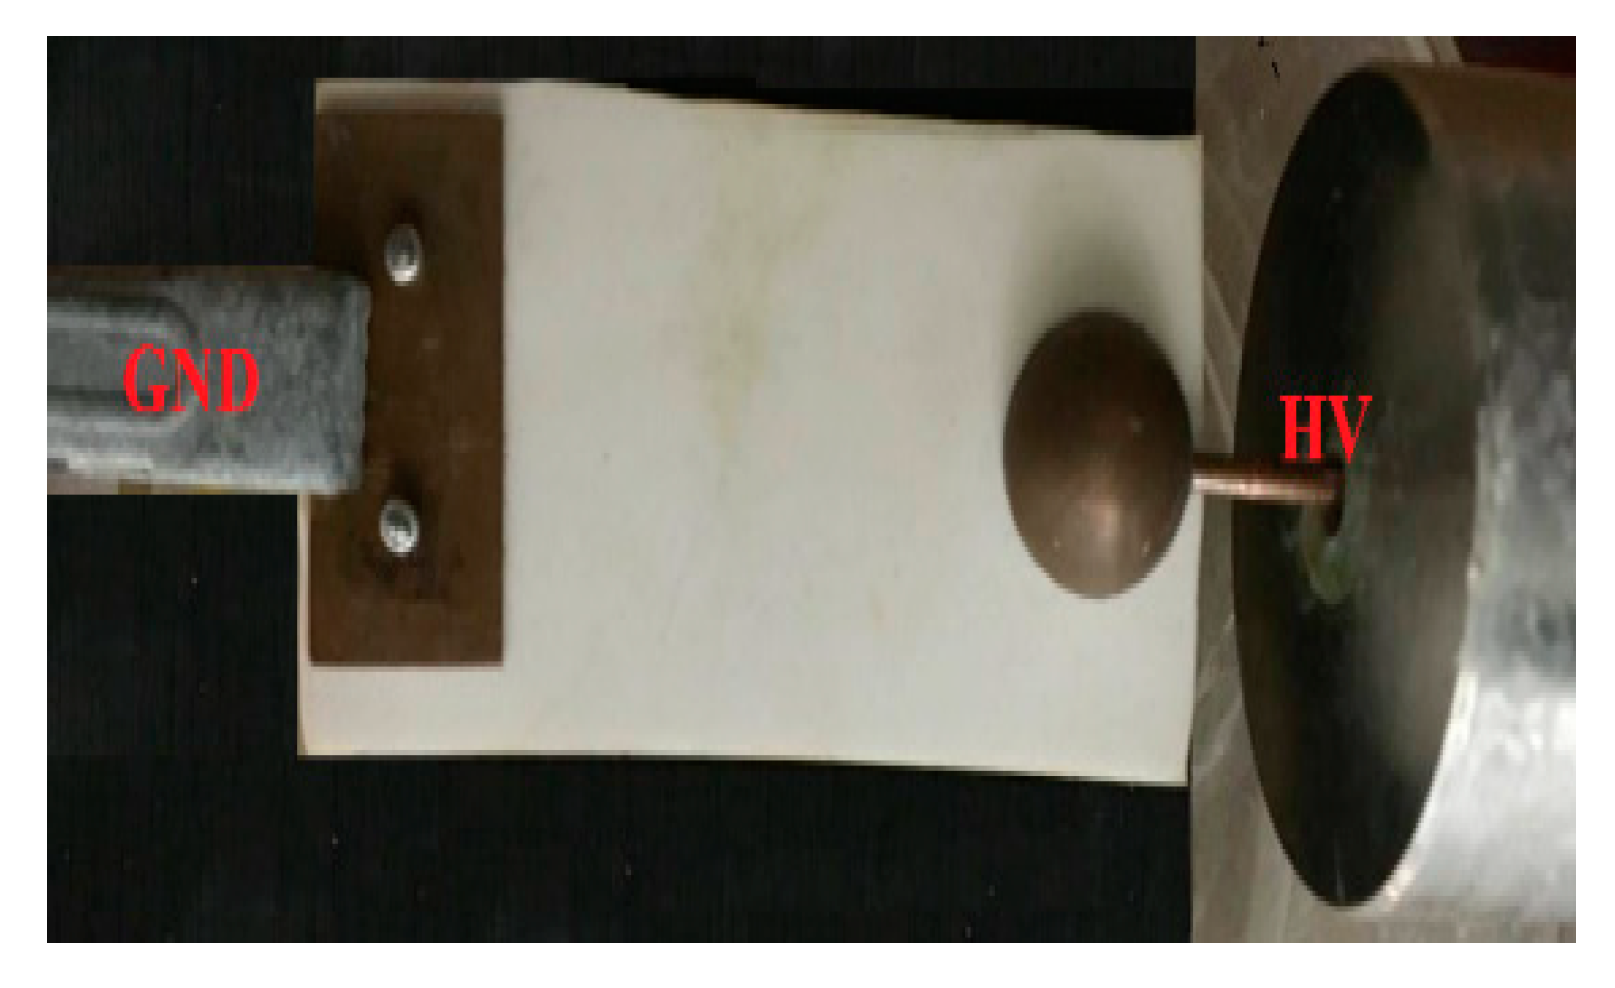
5. Experimental Setup and Results

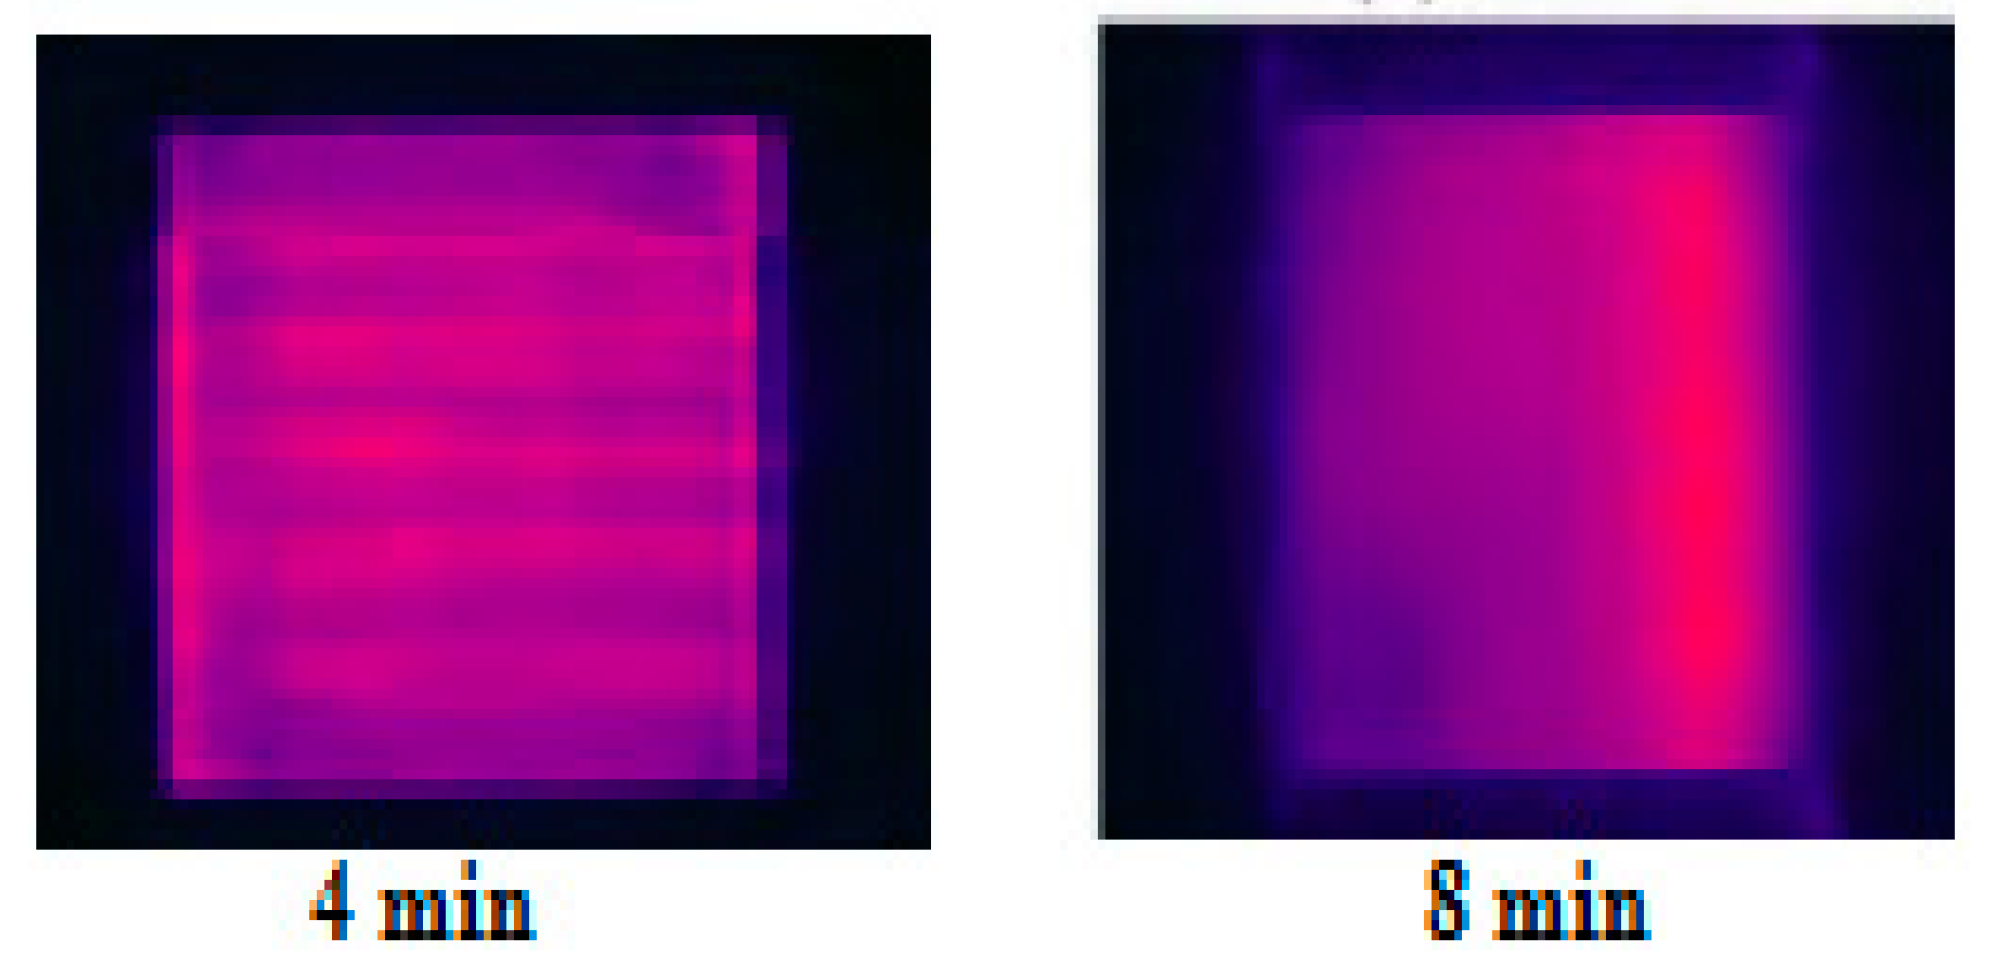
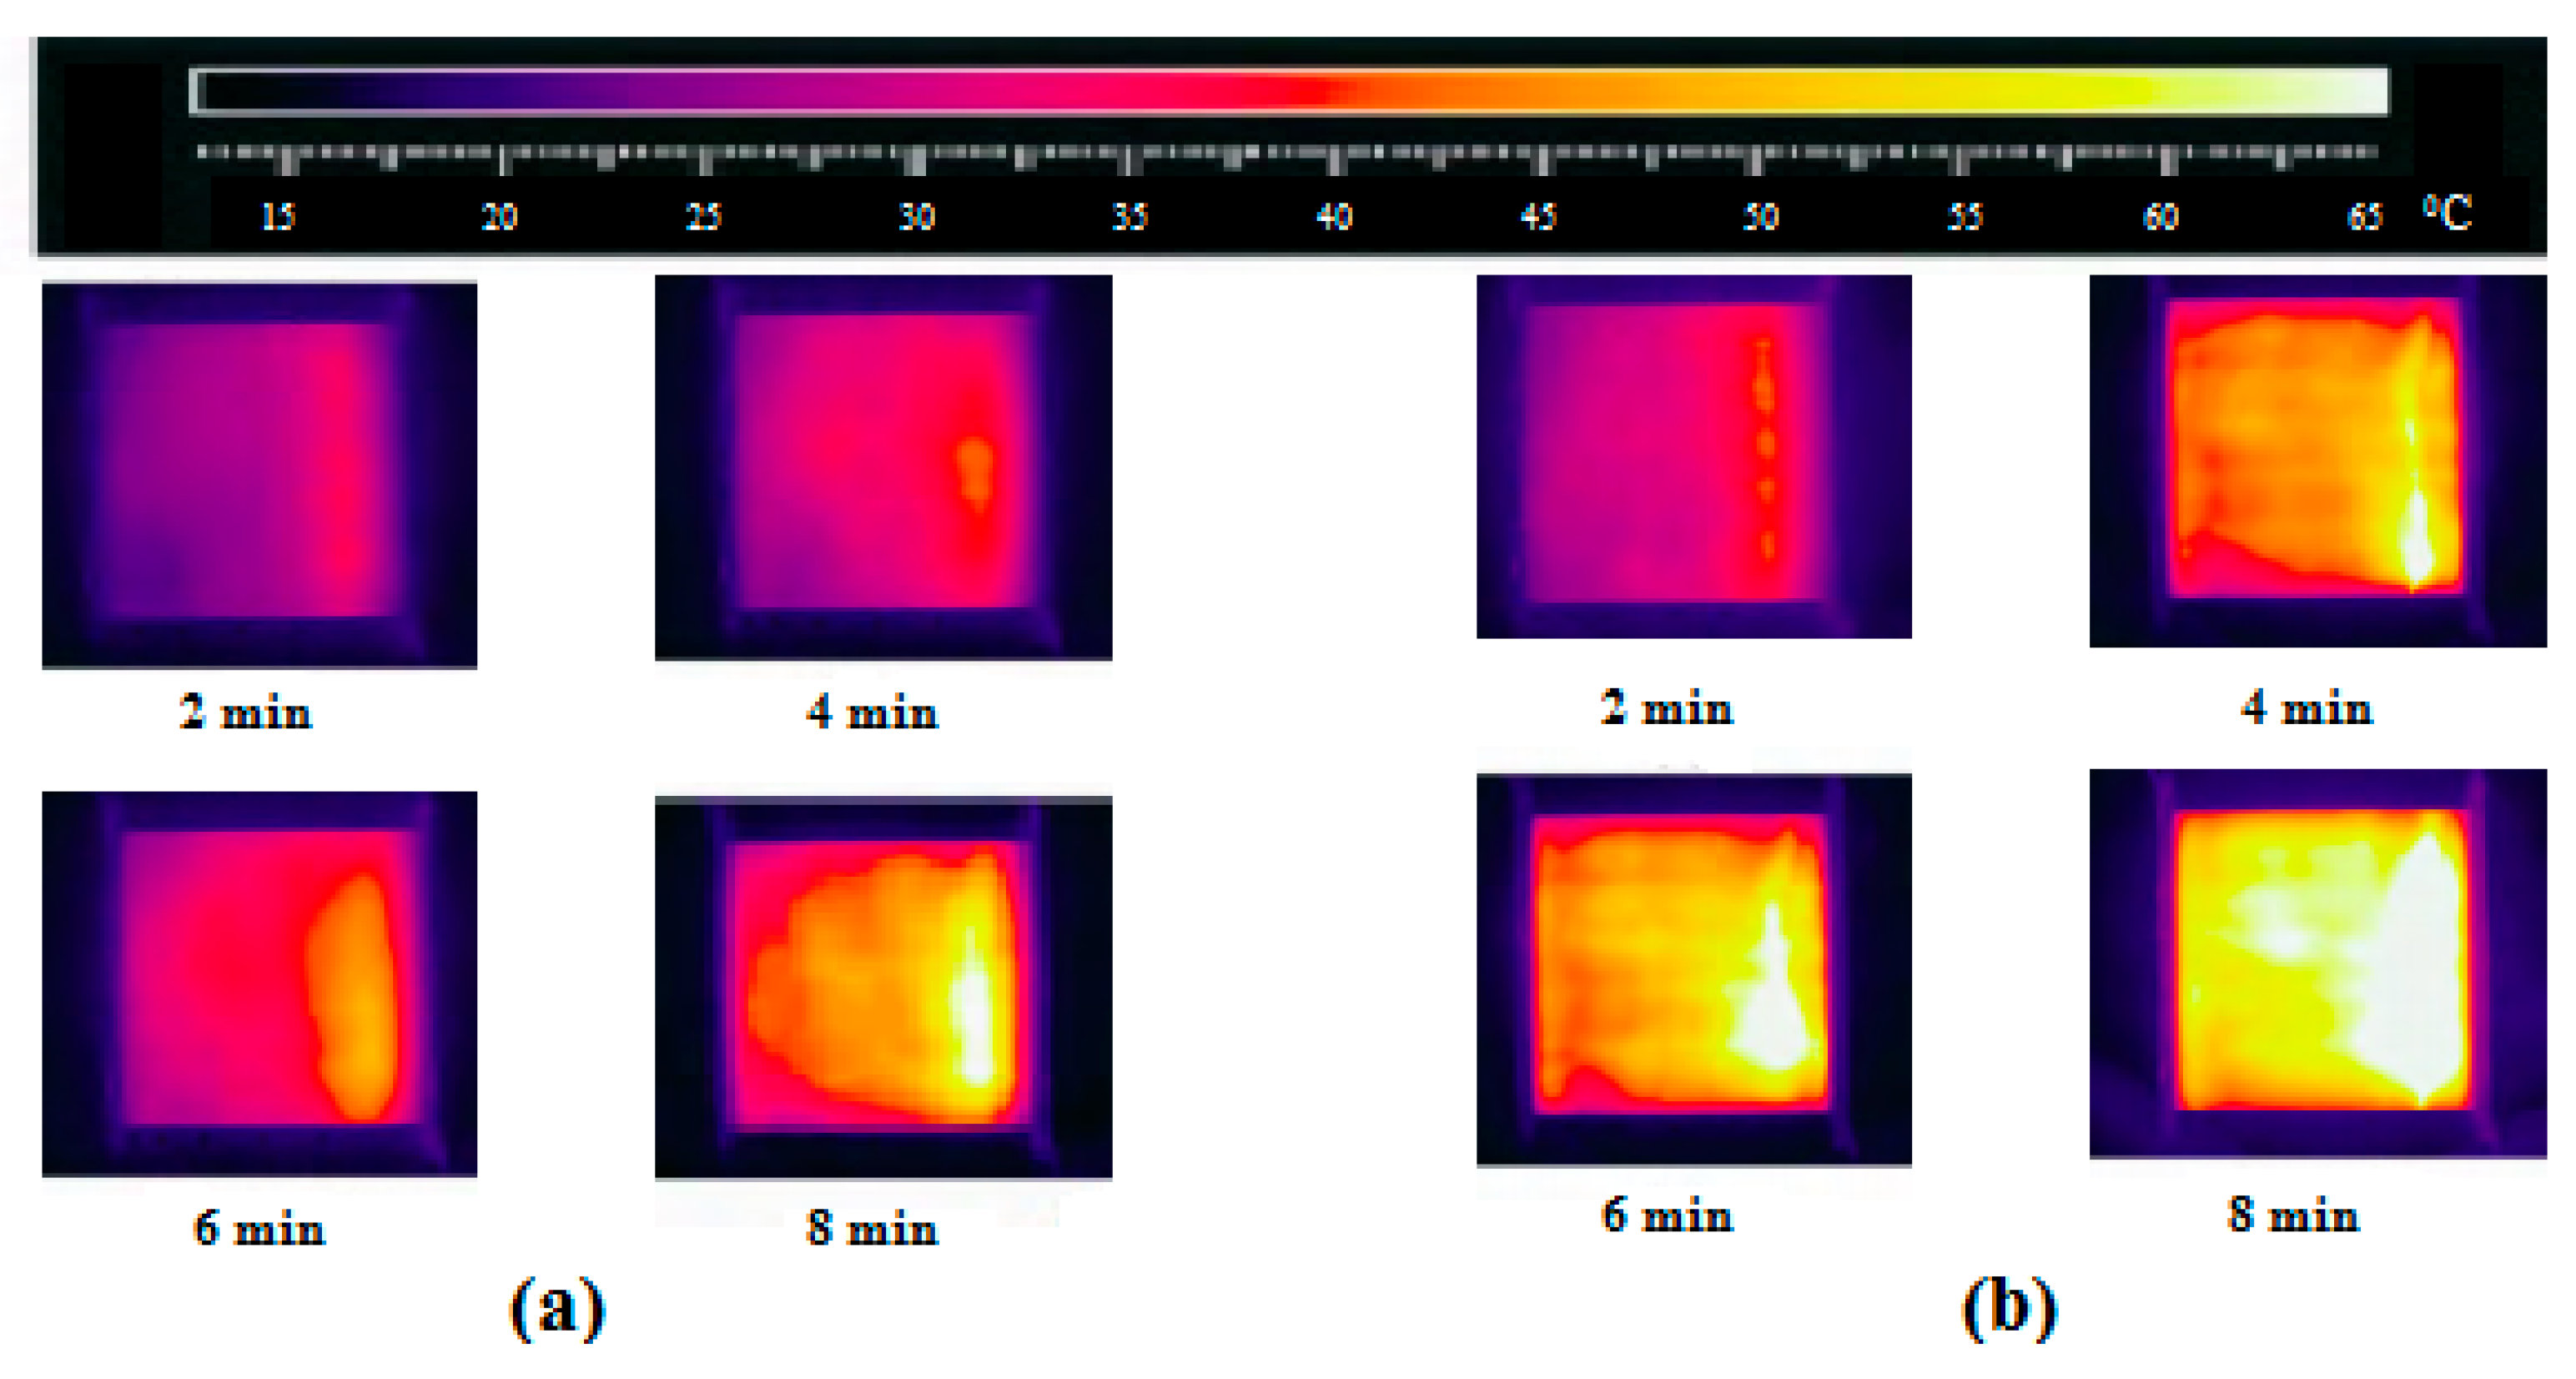
Characteristics of Dry-Band Formation

The most significant factors on the surface flashover voltage are the number, location and length of dry bands. The initiation and formation of dry band is due to many factors, such as voltage, contamination type, amount and distribution, and various environmental stresses. It is a well-known fact that, when wet and polluted insulators are energized, discharge current causes Joule heating to form dry bands. Joule heating drives the low resistance layer and evaporates wetting. Drying is more intense where the current density is high. As a result of more evaporation, more small dry bands are formed on the surface. The discharge current is associated with dry band length and if the length is sufficiently long the discharge current will decrease and the arc will extinguish, resulting in a surface flashover. Thus, a comparison is made between the dry band initiation and formation under uniform, non-uniform and discontinuous non-uniform contamination distribution on specimens. The investigation is based on contamination layer parameters, such as conductivity, layer thickness and length, and insulator surface dielectric strength. The reference insulator with no sheds consisted of two main parts. One part was a silicone rubber plate sample of rectangular shape (12 cm × 4 cm × 8 cm), mechanically connected with electrodes, one of them connected to a high voltage alternating current (HVAC) power source with AC voltage of 0–100 kV at 50 Hz, and the other one grounded as shown in Figure 8. The electrodes were made of 0.9 mm thickness copper. The contamination along the leakage distance was achieved by solid layer method has been given in IEC-60507, 1991, by brush applications of different conductivities. For experimental work the 69 kV AC test voltage was produced by a 10 kVA, 100 kV, and 50 Hz transformer. The supplied voltage can be increased manually or automatically at a rate of 1 kV/s. In the experimental setup, the analysis and processing units comprised a high frequency current transformer, a protection circuit, a LeCroy digital storage oscilloscope and a personal computer.
For sample contamination, the ratio of equivalent salt deposit density (ESDD) to non-soluble deposit density (NSDD) was 1:4. The values of ESDD and NSDD with contamination values are shown in Table 2.
Initially, the distribution of voltage and layer resistivity was uniform and the sample surface infrared pictures were uniformly heated, as shown in Figure 9. This confirmed that contamination layer conductance was also uniform. As the surface becomes wet, resistivity decreases and discharge current increases. This condition is not resilient due to slightly higher resistance in some segments of the sample surface with exceeding voltage gradient in these sections. The dissipation of heat is higher at these locations such that they become dry more rapidly than the remaining surface, forming dry bands. It is clearly shown that only small dry bands are formed near the high voltage electrode as well as near areas with higher electric field strength. However, as opposed to non-uniform contamination distribution, the dry bands do not tend to elongate towards the ground electrode.
Under non-uniform contamination distribution, however, the leakage current is increased, soon leading to reduced surface conductance, as shown in Figure 10a. This strongly indicates the drying part of the non-uniform contamination distribution by the heated area of the conducting layer, with the expected formation of a complete dry band. Initially the dry band formed at the high voltage electrode is followed by a series of small discharges that gradually scatter on other part of specimen. These discharges move towards near the ground electrode region and take the form of an arc-like discharge.
On the other hand, Figure 10b shows the infrared images of dry band discharges with discontinuous non-uniform contamination distribution. It is clearly shown that the extinction of the discharges is frequently followed by reignition, temporarily bridging the other dry bands. At this state, leakage current is at its maximum value just before the start of the discharge phenomenon. It is also observed that under discontinuous non-uniform contamination the insulating surface achieves its highest dielectric strength when the specimen conductive surface carries a lot of wider dry bands located at different locations of the specimen. Multiple dry bands created at same time on an insulating surface have the ability to weaken the field strength of each other. Therefore, with the existence of multiple dry bands the field strength of each one is normally less than when it is individually created. If a number of dry bands are formed, then after a short period only one will remain and due to its higher resistance almost all the voltage will be dropped across this dry band. The dry bands formed under a discontinuous non-uniform contamination layer may be considered as a potential barrier which may efficiently weaken the dielectric strength and develop a large voltage drop on outer dry bands.
Results obtained indicate that with discontinuous nonuniform contamination distribution, dry-band elongation on the full leakage distance took 6 minutes, and that after 8 minutes there was a sharp rise in dry band elongation with multiple dry bands. However, with a uniform contamination layer, dry-band elongation took place only up to the 40% of the total length in 6 minutes. After that there was no more elongation of dry-band length.

6. Comparison of Models with Experimental Results

6.1. Inspection of Dry-Band Formation

This section describes the difference between the mathematical model and the test results. It is noted that in the model there is a smooth increase of resistance at the initiation and development of dry bands, while in the test the dry bands outset suddenly as shown in Figure 9 and Figure 10. In the model (Section 3), it is anticipated that the dry band is initiated when the moist layer becomes wet. When the Δ L is very close to zero, it is shown that the dry band width is increased. However, this period is difficult to measure in the experiment. Therefore, the dry bands developed before the moisture is totally vaporized. The critical phenomena of moist film before the dry band forms are illustrate here. The equilibrium of forces between moist contact interfaces on insulator surface can be derived by the Young–Dupre equation:
λ m C o s   θ = R s   ( λ s λ m s )
In Equation (29), the Rs is the surface roughness coefficient which depend upon the material condition, θ is the contact angle in degrees between moisture and material surface, λm is the surface tension of moisture, λs surface tension of material surface and λms is the interfacial between the moisture and material surface.
This section explains the phenomena that observed during the experiment. For a moisture layer on the material surface, we anticipated the equilibrium state is stretched first. When the surface was hydrophilic, the length of dry bands varied from Δ L to L. However, as the moisture layer is being evaporated, the moisture layer becomes thinner and thinner, and therefore the interfacial force λms decreases. At this point the discharge current is cut off, which caused an increase of the local electric field. Therefore, the dry band’s initiation and development are started. Once the dry-band arcing is started, the arc temperature would dry the remaining part of moisture layer. At this stage, the surface is not fully dry, the dry-band arcing is weak and causes a number of multiple dry bands, which is observed in tests as shown in Figure 11.

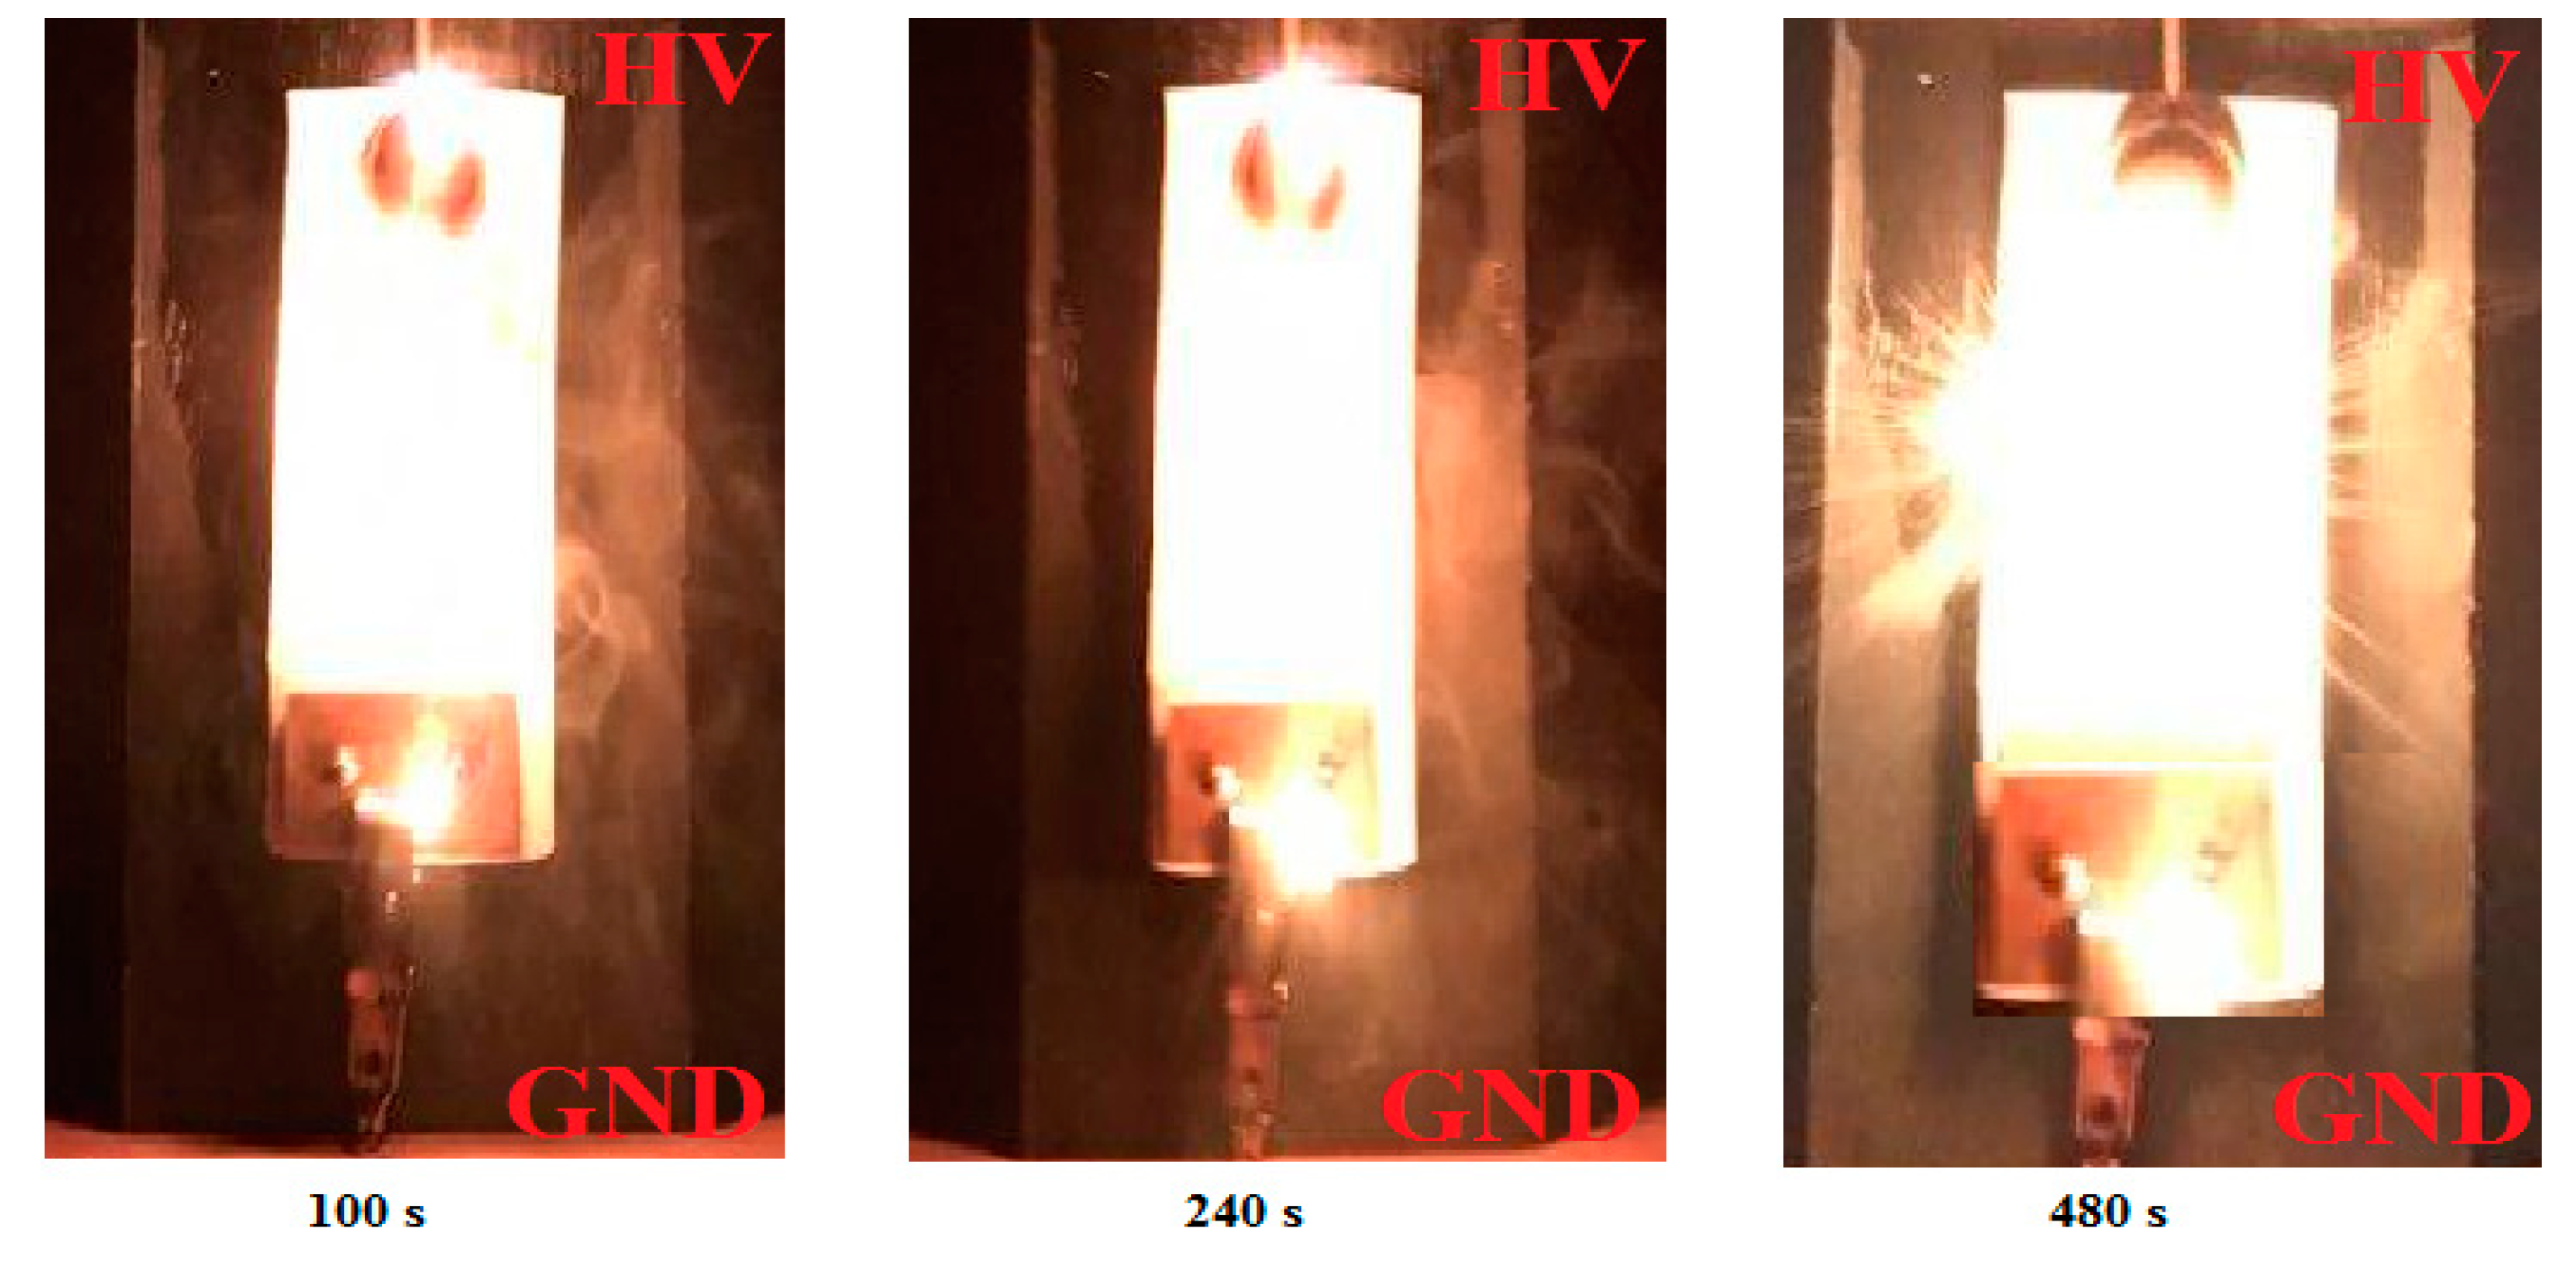
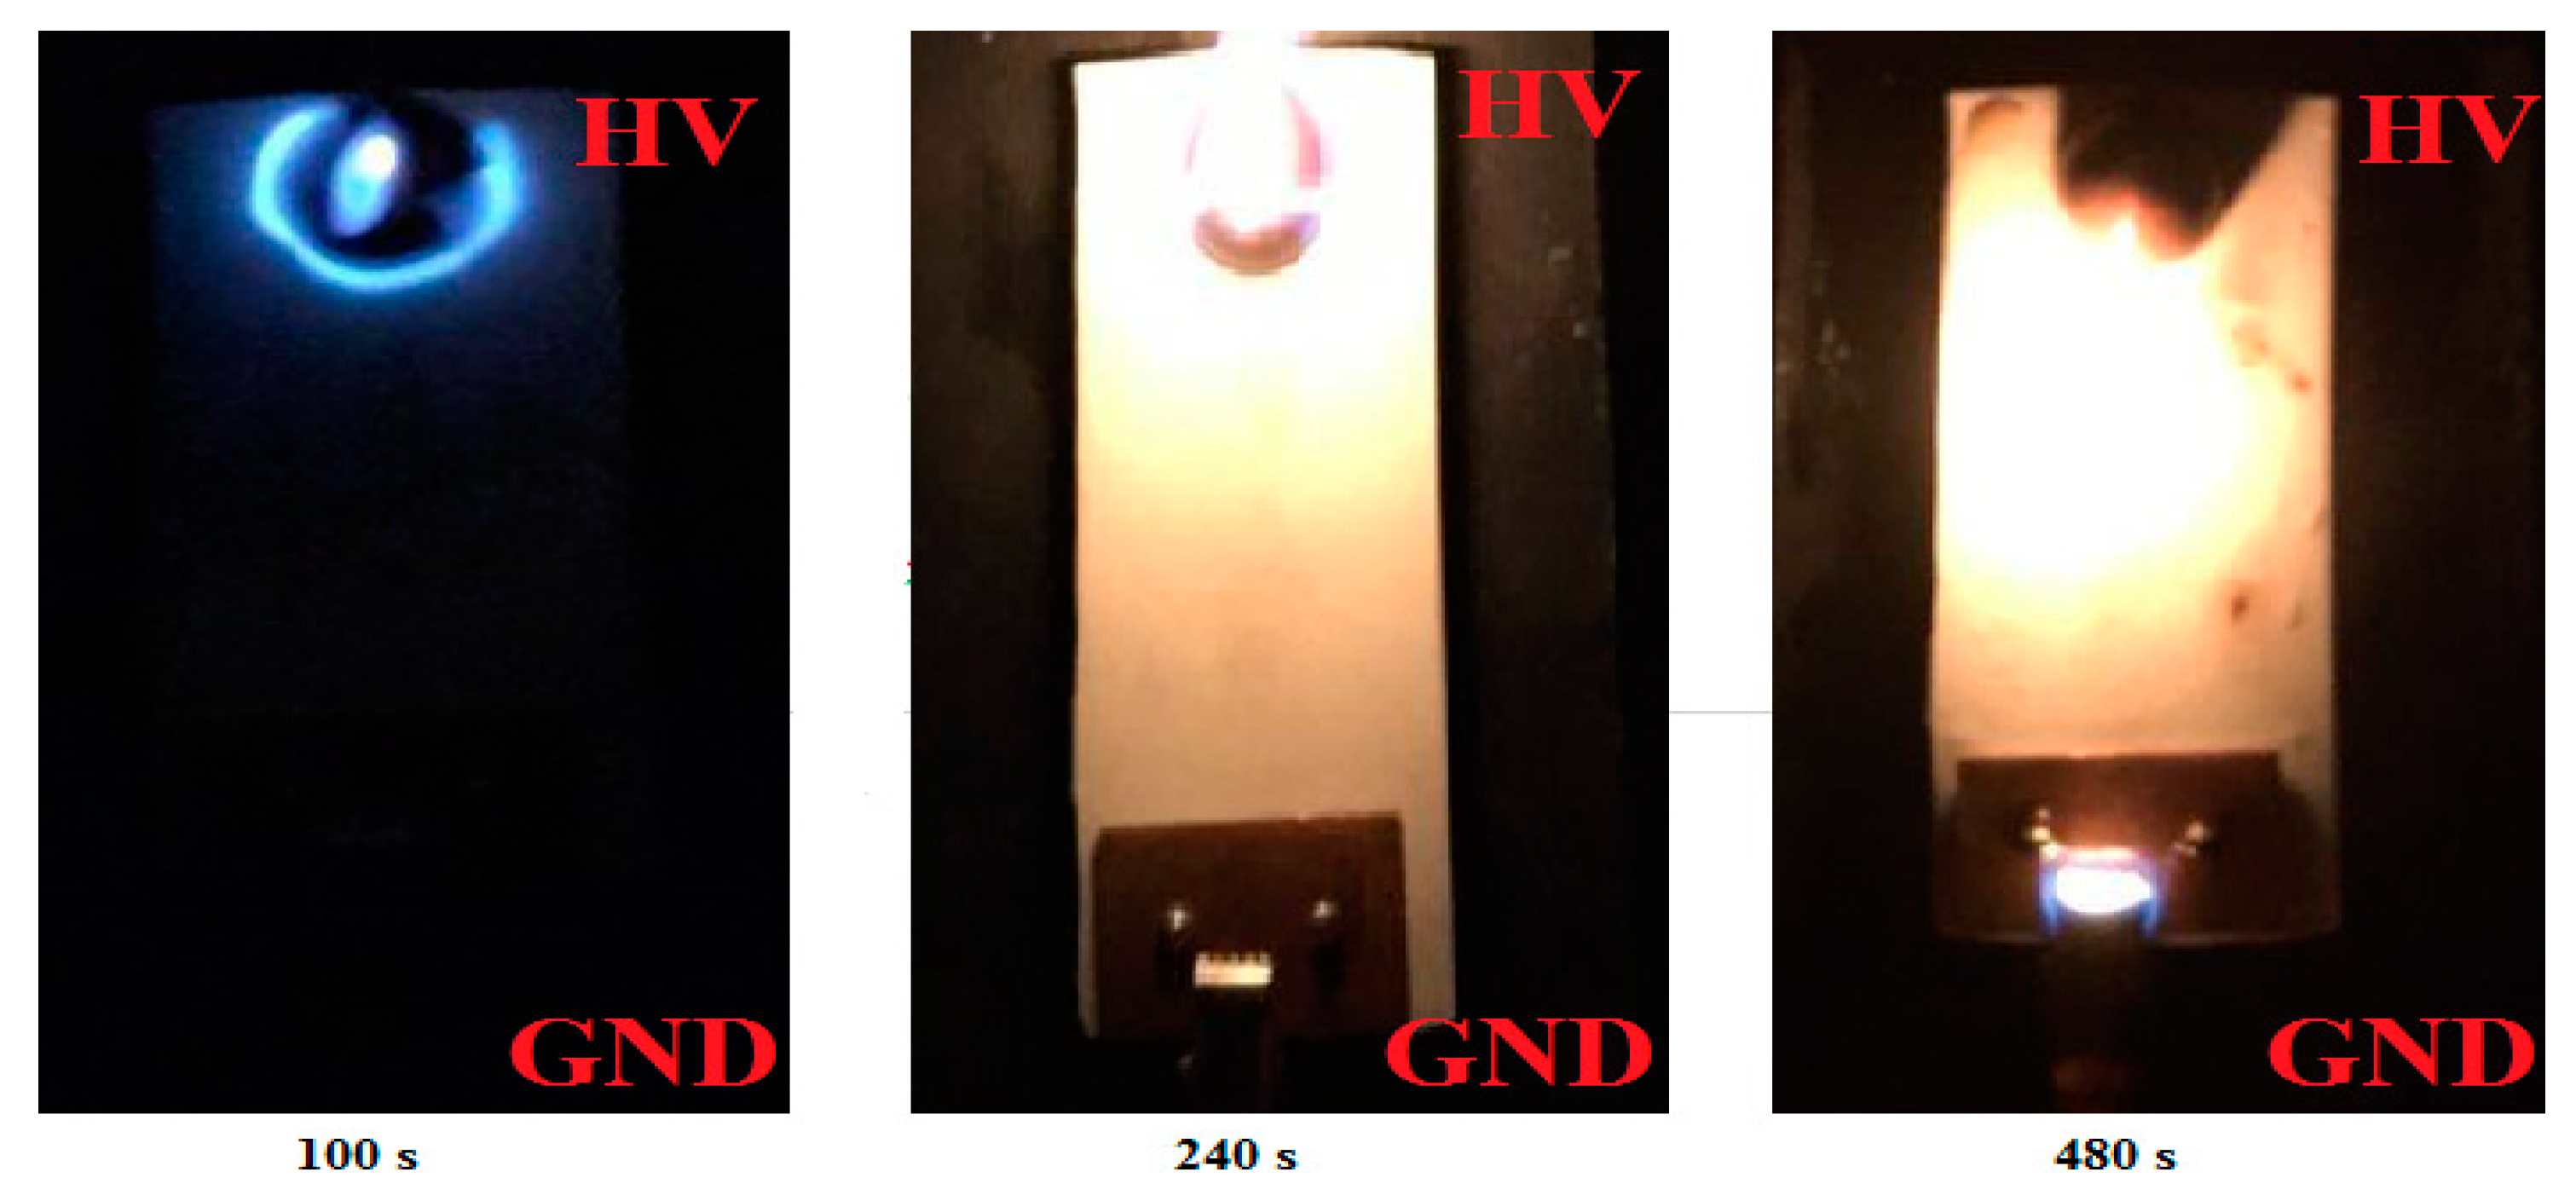
6.2. Onset of Dry-Band Arcing

To validate the model, the experimental results of dry band arcing, arc extension and surface flashover were compared with those of the proposed mathematical model. For the experimental analysis two scenarios were configured as those on the mathematical model: (1) high-voltage side with heavy pollution, whilst the grounded side was lightly polluted, and (2) high-voltage side with light pollution and grounded side with heavy pollution. These pollution scenarios are commonly seen in the field under the operating conditions to which are exposed insulators located near the shoreline and at sites with dominant winds speed [27,28,29,30].
In the first scenario (Figure 12), when voltage is applied to a sample, local arcs are first initiated on the heavily contaminated side/part, which is essentially due to higher discharge current. The discharge current causes ohmic heating to form multiple dry bands. The voltage across the dry bands which were usually the low conductive surface parts caused air break down. This caused the dry bands to be moved towards the lightly contaminated part which became electrical in series with the heavily contaminated part of the surface. Multiple dry bands spread out onto the sample surface and nearby the electrodes, and then some of the dry bands were bridged by local arcs. Local arcs ignited and reignited many times, and then gradually developed over the surface to connect to the other arcs, thus increasing the total length of the arcs.
On the other hand, in the case of the second scenario (Figure 13), the dry-band arcing did not initiate suddenly, as the section with light contamination levels, which is more hydrophobic than the other section, can strongly limit the development of the discharge current. It was found that if the length of the arc is equal to the length of the considered leakage section (such that the considered section is completely bridged) then the arc will propagate over to the next section and that the contamination level of the remaining part of the sample will have little effect on dry-band arcing. The experimental results obtained show that the surface strength and arc length mainly depend on the leakage distance and contamination distribution.
From the above results, it can be concluded that due to voltage drop along an arc channel the arc root transfers the potential of the electrodes next to the lightly contaminated section of the leakage distance. If the potential is sufficiently high, then after attainting the edge of the lightly contaminated section of the leakage distance, arc extension surface flashover will occur on the specimen. Surface flashover instantly occurs and is not connected with the partial arc’s development. It was also observed that on the lightly contaminated section, the drop of tangential component of electric field does not exit. However, it can be observed mainly along the heavily contaminated section of the specimen.

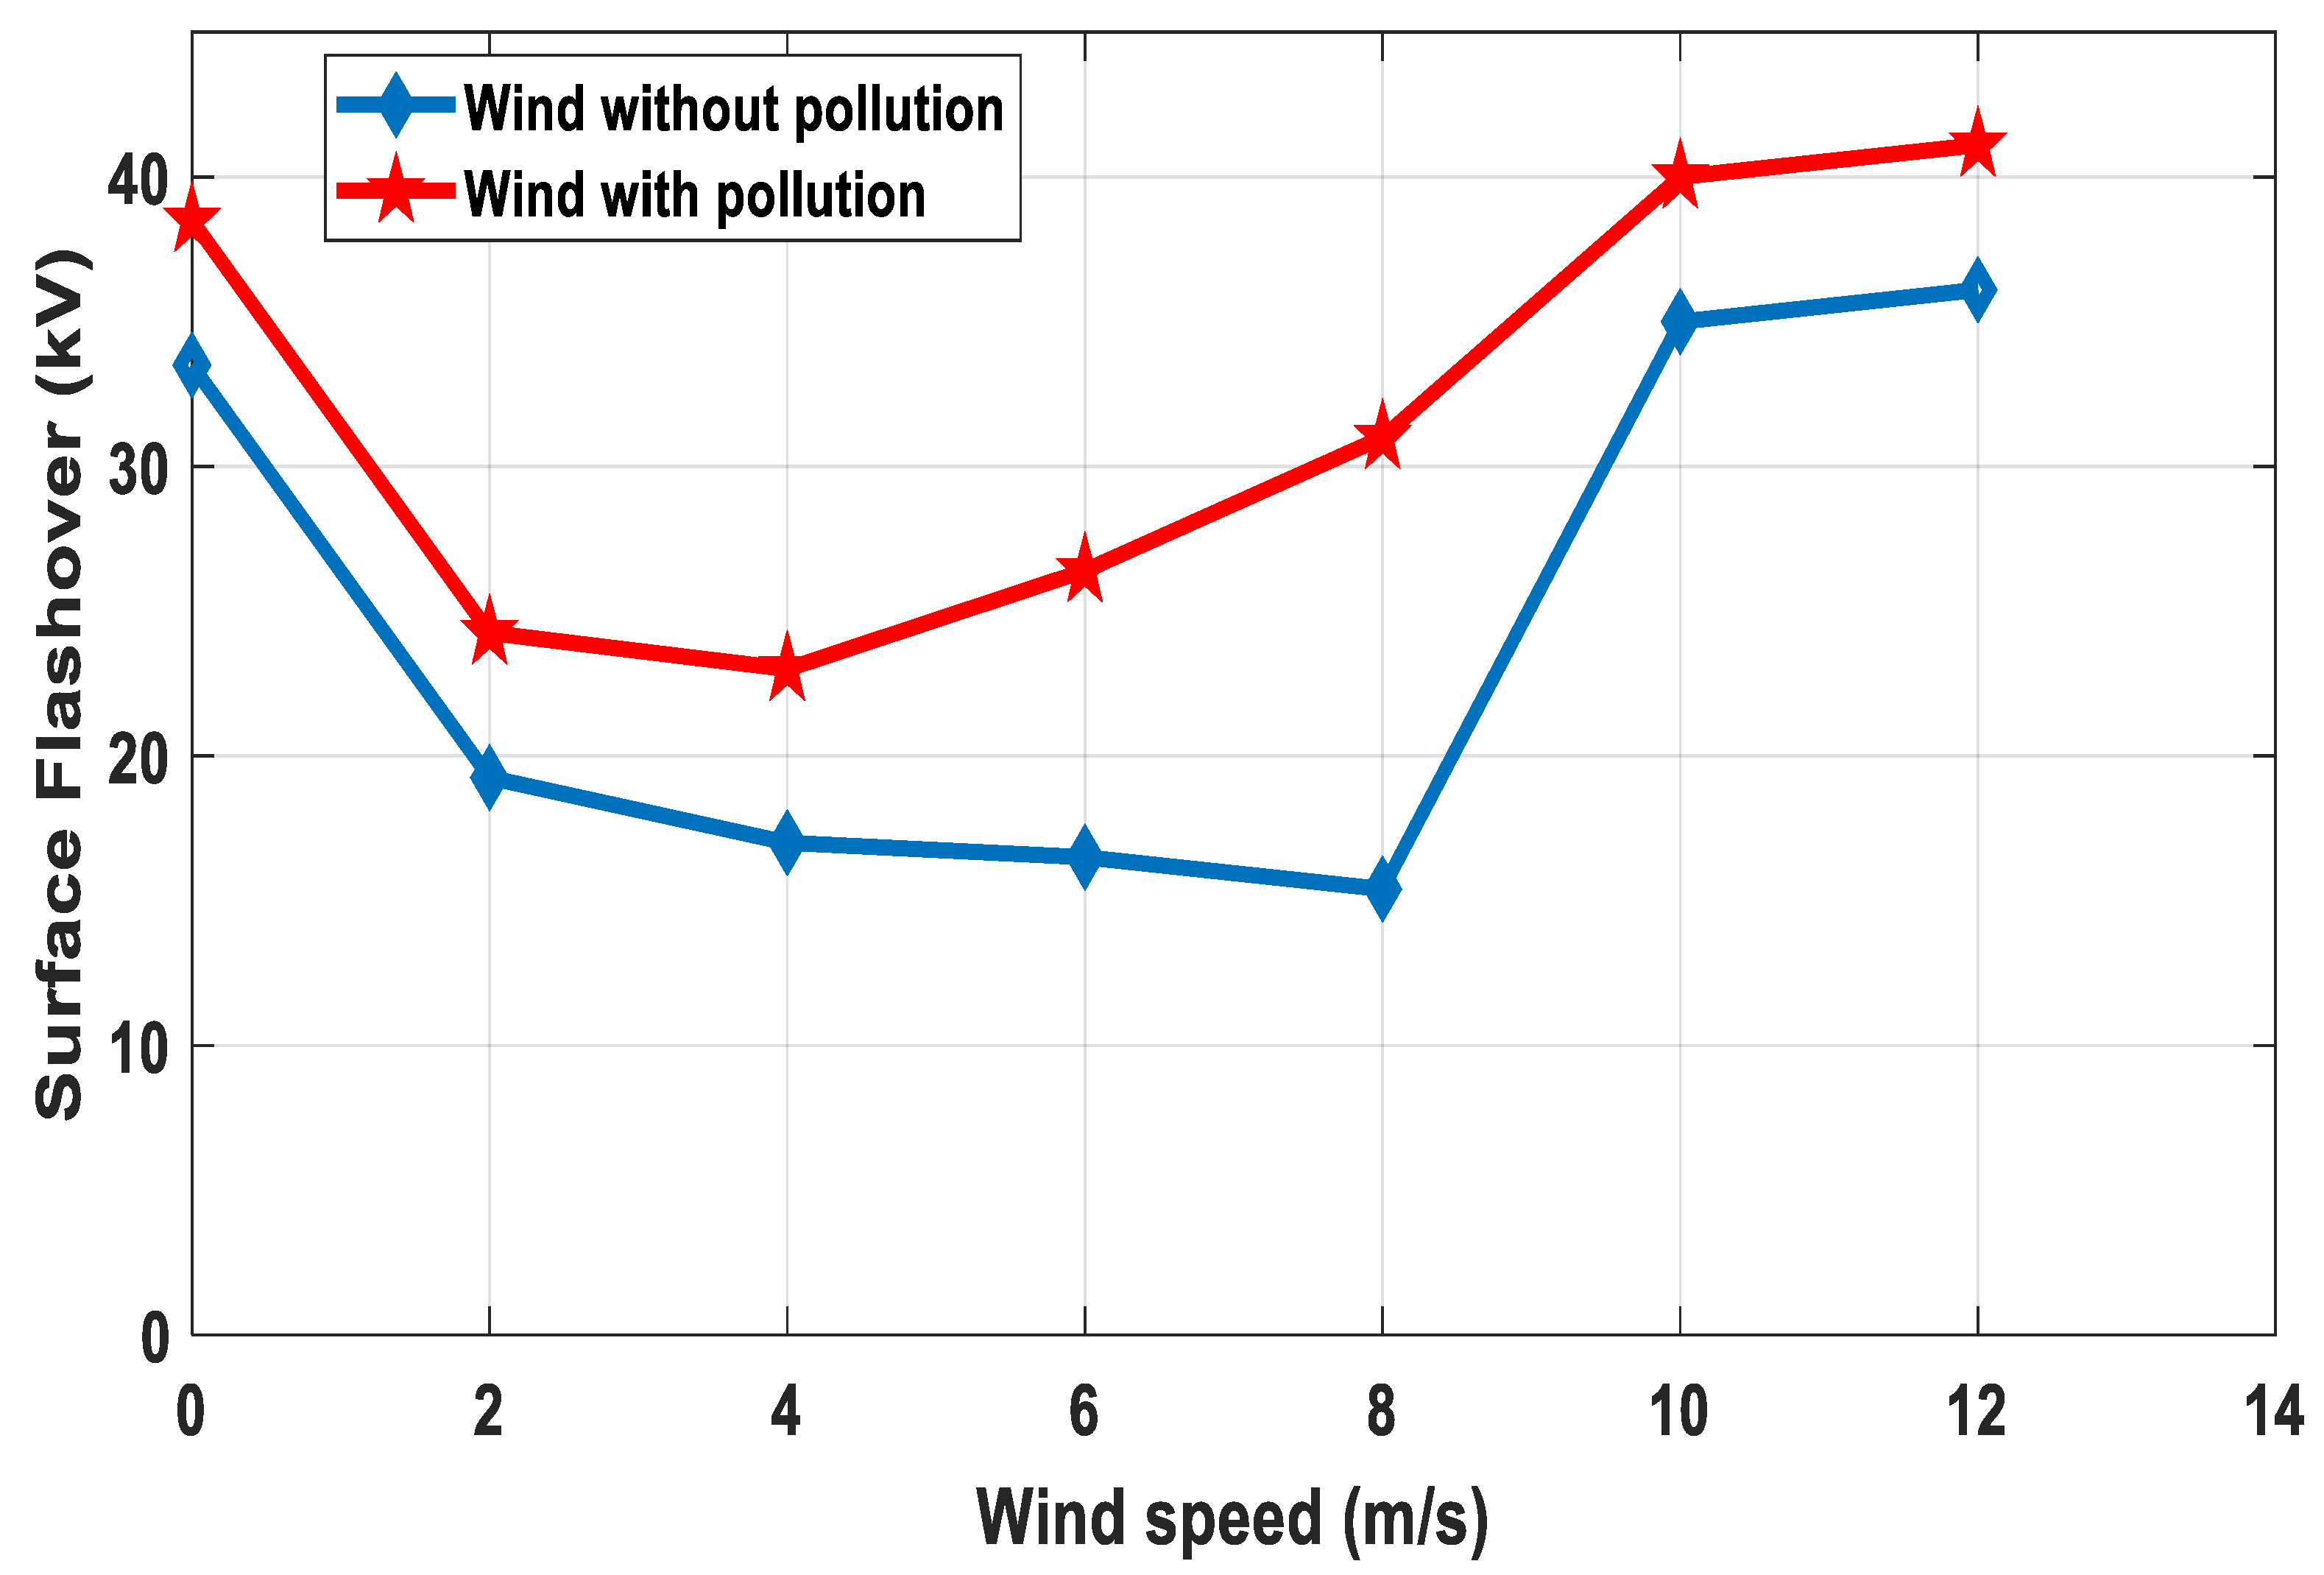
6.3. Impact of Wind Velocity on Surface Flashover Characteristics

To obtain the effects of the wind velocity on the surface flashover characteristics of composite insulator. The AC surface flashover process of polluted insulator was observed at 0 m/s, 2 m/s, 4 m/s, 8 m/s 10 m/s and 12 m/s wind velocities, respectively. The tests were carried out under two conditions. One was wind but no contamination deposition condition and other was wind with contamination deposition condition. In order to wet the surface of insulator and contamination distribution uniform, θ = 90° was selected between wind direction and insulator axis. During the experiment, the relative humidity was sustained in between (80%–90%) in the environmental chamber, which helped to bond the saline mixtures on the insulator surface, and the temperature was maintained between 0 °C and 2 °C.
During tests it was observed that, when the wind velocity bellowed 8 m/s or less as shown in Figure 14, the fog drifts slowly, and approached the surface of the insulator all around it. Simultaneously, the influence of contamination on surface flashover voltage was continuous due to the result of the wetting and drying process on insulator surface. Although at some moment the effect of moistening was larger and the surface flashover voltage was higher; while other, the effect of drying was larger and the surface flashover voltage was lower. Therefore, the value of surface flashover voltage changed by a big margin at 8 m/s and for lower wind speed values. Thus, the lowest value was selected as the surface flashover voltage value. However, when the wind velocity is higher than 8 m/s, the mist drifts very fast. The fog cannot completely approach with the insulator surface, so the drying effect was higher than the wetting effect. At this situation, the flashover voltage was relatively low and stable as compared to lower wind velocities, thus the average value was preferred as the surface flashover voltage value. From Figure 14, it can be clearly seen that when the wind velocity bellows up to 8 m/s, the surface flashover voltage diversifies by a big margin, the lowest higher than the normal down 32.9%, and when the wind velocity higher than 8 m/s, the surface flashover voltage gradually decreases steadily and at 12 m/s surface flashover voltage is lower than the normal flashover voltage 6.2%.

6.4. Effect of Conductivity and Pollution Layer Length of Surface Flashover

The dimensioning of insulators with respect to contamination is always done based on the performance characteristic of real insulators under uniform artificial contamination. However, due to the shape and in-service position, climate conditions and following the action of electrical stresses, the outdoor high-voltage insulators are actually contaminated in a non-uniform manner. The surface flashover of a uniformly contaminated insulator can be defined by a one dry band arc connected in series with a resistance of the contamination layer. In contrast, for insulators with a non-uniform contamination layer, several dry-band arcs can ignite simultaneously over their contaminated surface and may develop to a full surface flashover. This section is made to investigate the effect of uniform, non-uniform and discontinuous non-uniform contamination layer parameters, such as the conductivity and the length of the contamination layer on the material surface. Surface flashover tests are carried out following the same procedure as presented in [30].
The results of the present work and the other investigations [31] are approximately close. However, the surface flashover voltage of the present work and the work carried out by [32] are slightly lower than the surface flashover voltage with natural contamination. The main reason for this is that ions solubility of marine specification salts in artificial contamination almost slightly varies in fog, but it is not in the case of natural contamination deposition such as desert and ash, which contains weaker electrolytes. Also, the other most significant factor on the flashover strength is the length of the pollution layer. These results agree with that mentioned in [31] and would explain the observations that artificially contaminated insulators do allow surface flashover voltage lower than those naturally contaminated for the same conduction and climate conditions. It is clearly shown in Figure 15 and Figure 16 that the length of contamination layer significantly affects the surface flashover voltage. The dielectric strength decreases with increasing of the conductivity layer. Finally, there is another strong effect observed on surface flashover due to the contamination class. It perceived that surface flashover strength is higher with uniform as compared to non-uniform and non-uniform discontinuous contamination distribution. Figure 16 shows the variation of surface flashover voltage with different pollution layer length under different types of contamination deposition. We can observe that surface flashover voltage decreases when the length of the pollution layer increases. It elapses from 36.2 kV with a uniform distribution to 33.1 kV for a surface entirely contaminated with a non-uniform discontinuous.

7. Conclusions

In this paper, a novel mathematical model is presented to understand the sea salt migration and deposition on high-voltage insulators near shoreline. The model introduced a new phenomenon based on saline transportation and deposition. Based on this, two more mathematical models were presented to understand the phenomenon of dry-band initiation and formation, as well as the behaviour of dry-band arcing with two different conduction states of the contamination layer on the insulator surface. Based on these, the following conclusions could be drawn:
  • From simulation and experimental work it was found that the pollution accumulation rate on the insulator surface increases with the increase of wind velocity and decreases with the increase of distance from shoreline to inland. However, when wind speed was higher than 12 m/s, the contamination density tended to be constant.
  • It was also observed that the transfer of moisture significantly accelerates the saline ions’ penetration on the insulator surface.
  • The dry-band initiation and formation model presented is based on the energy balance equation. The integration of this equation results in a variation of dry-band length under moisture evaporation on the insulator surface. With the reduction of dry-band length, the surface resistance increases, which increases the discharge current on the insulator surface. The conduction and convection processes increase the surface resistance. It was observed that under this process single and multiple dry bands appear on the insulator surface.
  • Discontinuous non-uniform contamination distribution of the insulator surface leads to multiple dry bands and lower surface flashover voltage as compared to uniform and non-uniform contamination distribution.
  • A dry band arcing model was developed. It showed that the insulator surface strength and arc length mainly depend on the distribution of the pollution layer and leakage distance. The results obtained show that the configured scenarios are trustworthy to detect the dry band arcing on the insulator surface with different contamination distribution. The obtained dry-band arcing initiation and elongation rate confirm the efficiency of the proposed model.

Author Contributions

Conceptualization, M.M.H.; methodology, M.M.H., M.A.C. and A.R.; analysis, M.M.H., M.A.C. and A.R.; investigation, M.M.H.; writing—review and editing, M.M.H., M.A.C. and A.R.; visualization, M.M.H. and M.A.C.; supervision, M.M.H.; project administration, M.M.H., M.A.C. and A.R.

Funding

This research received no external funding.

Conflicts of Interest

The authors declare no conflict of interest.

References

  1. Venkataraman, S.; Gorur, R.S. Extending the applicability of insulator flashover models by regression analysis. IEEE Trans. Dielectr. Electr. Insul. 2007, 14, 368–374. [Google Scholar] [CrossRef]
  2. Baker, A.C.; Farzaneh, M.; Gorur, R.S.; Gubanski, S.M.; Hill, R.J.; Schneider, H.M. Insulator selection for overhead AC lines with respect to contamination. IEEE Trans. Power Deliv. 2009, 24, 1633–1641. [Google Scholar] [CrossRef]
  3. El-Amine Slama, M.; Hadi, H.; Flazi, S. Investigation on influence of salts mixture on the determination of flashover discharge constant Part I: A Preliminary Study. In Proceedings of the IEEE Conference on Electrical Insulation and Dielectric Phenomena, Quebec, QC, Canada, 26–29 October 2008; pp. 674–677. [Google Scholar]
  4. Sima, W.; Yuan, T.; Yang, Q.; Xu, K.; Sun, C. Effect of nonuniform pollution on the withstand characteristics of extra high voltage suspension ceramic insulator string. IET Gen. Trans. Distrib. 2009, 4, 445–455. [Google Scholar] [CrossRef]
  5. Majid Hussain, M.; Farokhi, S.; McMeekin, S.G.; Farzaneh, M. Dry band formation on HV insulators polluted with different salt mixtures. In Proceedings of the 2015 IEEE Conference on Electrical Insulation and Dielectric Phenomena (CEIDP), Ann Arbor, MI, USA, 18–21 October 2015; pp. 201–204. [Google Scholar]
  6. Naito, K.; Morita, K.; Hasegawa, Y.; Imakoma, T. Improvement of the dc voltage insulation efficiency of suspension insulators under contaminated conditions. IEEE Trans. Dielectr. Electr. Insul. 1988, 23, 1025–1032. [Google Scholar] [CrossRef]
  7. Seta, T.; Arai, N.; Udo, T. Natural pollution test of insulators energized with HVDC. IEEE Trans. Power Appar. Syst. 1974, PAS-93, 878–883. [Google Scholar] [CrossRef]
  8. Kimoto, I.; Fujimura, T.; Naito, K. Performance of insulators for direct current transmission line under polluted condition. IEEE Trans. Power Appar. Syst. 1973, PAS-92, 943–949. [Google Scholar] [CrossRef]
  9. Houlgate, R.G.; Swift, D.A.; Cimador, A.; Pourbaix, F.; Marrone, G.; Nicolini, P. Field experience and laboratory research on composite insulators for overhead lines. CIGRE Pap. 1986, 15, 12. [Google Scholar]
  10. Schneider, H.M.; Guidi, W.W.; Burnham, J.T.; Gorur, R.S.; Hall, J.F. Accelerated aging and flashover tests on 138 kV nonceramic line post insulators. IEEE Trans. Power Deliv. 1993, 8, 325–336. [Google Scholar] [CrossRef]
  11. Kim, S.H.; Cherney, E.A.; Hackam, R. The loss and recovery of hydrophobicity of RTV silicone rubber insulator coatings. IEEE Trans. Power Deliv. 1990, 5, 1491–1500. [Google Scholar] [CrossRef]
  12. Starr, W.T. Polymeric outdoor insulation. IEEE Trans. Electr. Insul. 1990, 25, 125–136. [Google Scholar] [CrossRef]
  13. Simmons, S.; Shah, M.; Mackevich, J.; Chang, R.J. Polymer outdoor insulating materials Part 3-silicone elastomer considerations. IEEE Electr. Insul. Mag. 1997, 13, 25–32. [Google Scholar] [CrossRef]
  14. Baker, A.C.; Zaffanella, L.E.; Anaivino, L.D.; Schneider, H.M.; Moran, J.H. Contamination performance of HVDC station post insulators. IEEE Trans. Power Deliv. 1988, 3, 1968–1975. [Google Scholar] [CrossRef]
  15. Wilkins, R. Flashover voltage of high-voltage insulators with uniform surface pollution films. Proc. IEE 1969, 116, 457–465. [Google Scholar] [CrossRef]
  16. Rizk, F.A.M. Mathematical models for pollution flashover. IEEE Trans. Dielectr. Electr. Insul. 1981, 78, 71–103. [Google Scholar]
  17. Kim, S.; Cherney, E.A.; Hackam, R.; Rutherford, K.G. Chemical changes at the surface of RTV silicone rubber coating on insulators during dry-band arcing. IEEE Trans. Dielectr. Electr. Insul. 1994, 1, 106–123. [Google Scholar]
  18. Morcillo, M.; Chico, B.; Mariaca, L.; Otero, E. Salinity in marine atmospheric corrosion: Its dependence on the wind regime existing in the site. Corros. Sci. 2000, 42, 91–104. [Google Scholar] [CrossRef]
  19. Spiel, D.E.; Leeuw, G.D. Formation and production of sea spray aerosols. J. Aerosol Sci. 1996, 27, S65–S66. [Google Scholar] [CrossRef]
  20. Feliu, S.; Morcillo, M.; Chico, B. Effect of distance from sea on atmospheric corrosion rate. Corrosion 1999, 55, 883–889. [Google Scholar] [CrossRef]
  21. Gustafsson, M.E.R.; Franzen, L.G. Dry deposition and concentration of marine aerosols in a coastal area. Atmos. Environ. 1996, 30, 977–989. [Google Scholar] [CrossRef]
  22. Meira, R.; Andrade, C.; Alonso, C.; Padaradtz, I.J.; Borba, J.C. Salinity of marine aerosols in a Brazilian coastal area–influence of wind regime. Atmos. Environ. 2007, 41, 8431–8441. [Google Scholar] [CrossRef]
  23. Hamada, S.; Hino, S.; Kanyuki, K. Salt measurement in the coastal region. Fac. Eng. Yamaguchi Univ. 1986, 01, 255. [Google Scholar]
  24. Karady, G.; Amrah, F. Dynamic modeling of AC insulator flashover characteristics. IEE Symp. High Volt. Eng. 1999, 467, 107–110. [Google Scholar]
  25. Jolly, D.C.; Poole, C.D. Flashover of contaminated insulators with cylindrical symmetry under DC conditions. IEEE Trans. Dielectr. Electr. Insul. 1979, EI-14, 77–84. [Google Scholar] [CrossRef]
  26. Obenaus, F. Contamination flashover and creepage path length. Dtsch. Elektrotechnik 1958, 12, 135–136. [Google Scholar]
  27. Majid Hussain, M.; Farokhi, S.; McMeekin, S.G.; Farzaneh, M. Risk assessment of failure of outdoor high voltage polluted insulators under combined stresses near shoreline. Energies 2017, 10, 1661. [Google Scholar] [CrossRef]
  28. Mizuno, Y.; Kusada, H.; Naito, K. Effect of climatic conditions on contamination flashover voltage of insulators. IEEE Trans. Dielectr. Electr. Insul. 1997, 4, 286–289. [Google Scholar] [CrossRef]
  29. Majid Hussain, M.; Farokhi, S.; McMeekin, S.G.; Farzaneh, M. Contamination performance of high voltage outdoor insulators in harsh marine pollution environment. In Proceedings of the IEEE 21st International Conference on Pulsed Power, Brighton, UK, 18–22 June 2017. [Google Scholar]
  30. Majid Hussain, M.; Farokhi, S.; McMeekin, S.G.; Farzaneh, M. Mechanism of saline deposition and surface flashover on outdoor insulators near coastal areas Part II: Impact of various environmental stresses. IEEE Trans. Dielectr. Electr. Insul. 2017, 24, 1068–1076. [Google Scholar] [CrossRef]
  31. Terrab, H.; Bayad, A. Experimental study using design of experiment of pollution layer effect on insulator performance taking into account the presence of dry bands. IEEE Trans. Dielectr. Electr. Insul. 2014, 21, 2486–2495. [Google Scholar] [CrossRef]
  32. Zohng, H.P.; Dong, X.C. Tests and Investigations on Naturally Polluted Insulators and Their Application to Insulation Design for Polluted Areas; CIGRE Report 33–07; CIGRE: Paris, France, 1982. [Google Scholar]
Figure 1. Schematic diagram of sea salt transport and deposition phenomenon.
Energies 12 03685 g001
Figure 2. Simulated analysis of the model.
Energies 12 03685 g002
Figure 3. Two-dimensional (2-D) geometry used in simulation.
Energies 12 03685 g003
Figure 4. Characteristic curves of saline concentration and moisture diffusion.
Energies 12 03685 g004
Figure 5. Modeling of energy balance on moistened insulator surface.
Energies 12 03685 g005
Figure 6. Polluted insulator model for dry band arcing with X < L1.
Energies 12 03685 g006
Figure 7. Polluted insulator model for dry band arcing with X > L1.
Energies 12 03685 g007
Figure 8. Experimental set up.
Energies 12 03685 g008
Figure 9. Dry-band development with uniform contamination record by infrared camera.
Energies 12 03685 g009
Figure 10. Dry-band development recorded by infrared camera: (a) under non-uniform contamination; (b) under non-uniform discontinuous contamination.
Energies 12 03685 g010
Figure 11. Interfacial equilibrium between water and sample surface.
Energies 12 03685 g011
Figure 12. Image of dry-band arcing activity progression.
Energies 12 03685 g012
Figure 13. Image of discharge activity progression.
Energies 12 03685 g013
Figure 14. Influence of wind on surface flashover characteristic.
Energies 12 03685 g014
Figure 15. Surface flashover voltage versus the pollution layer conductivity with various contamination class.
Energies 12 03685 g015
Figure 16. Surface flashover voltage versus the pollution layer length for different contamination class.
Energies 12 03685 g016
Table 1. Parameters of 2-D insulator model.
Insulator TypeLeakage Distance (cm)Shed Spacing (cm)Shed Diameter
Silicone rubber40312
Table 2. Contamination values.
Contamination TypeESDD (mg/cm2)NSDD (mg/cm2)
Uniform0.2000.850
Non-uniform0.0800.350

