Article

The Impact of an Energy Efficiency Improvement Policy on the Economic Performance of Electricity-Intensive Firms in Ghana

1
Graduate School for International Development and Cooperation, Hiroshima University, 1-5-1 Kagamiyama, Higashi Hiroshima-ken 739-8529, Japan
2
Akosombo Hydro Station, Hydro Generation Department, Volta River Authority, 28 February Road, Accra GA-145-7445, Ghana
3
Network for Education and Research on Peace and Sustainability (NERPS), Hiroshima University, 1-5-1 Kagamiyama, Higashi Hiroshima-ken 739-8529, Japan
*
Author to whom correspondence should be addressed.
Energies 2019, 12(19), 3684; https://doi.org/10.3390/en12193684
Submission received: 11 August 2019 / Revised: 16 September 2019 / Accepted: 18 September 2019 / Published: 26 September 2019
(This article belongs to the Special Issue Revisiting the Nexus between Energy Consumption and Economic Activity)

Abstract

:
This paper investigates the economic impact of an energy efficiency improvement policy on electricity-intensive firms in Ghana. The policy imposed a penalty on these electricity-intensive firms, which are referred to as special load tariff (SLT) customers, when their power factor was below 90%. This paper applies the regression discontinuity design (RDD) to the panel data of these SLTs ranging from 1994 to 2012, excluding those years characterized by energy crisis. The results show adverse impacts of the policy on the employment and salary levels of the firms in the long run, in particular, the small- and medium–voltage firms. The results indicate that small- and medium–voltage firms are economically vulnerable to the penalty policy in the long run and recommend two policies to overcome this challenge. Firstly, the penalty for power factor improvement should not be imposed identically across firms with different voltage levels. Secondly, firms that satisfy the power factor standard should receive subsidies to improve their competitiveness in the market.

1. Introduction

Humans have continued to increase their use of energy since the first industrial revolution in 1760 [1]. The increasing use of energy by human societies, however, has several negative environmental consequences. In particular, the extraction and combustion of fossil fuels result in many environmental problems at local, regional, and global levels. Improving energy efficiency at the industrial level is an efficient way to minimize fossil fuel consumption, mitigating greenhouse gas emission and ensuring energy security and sustainability [2,3].
In developing and less-developed economies, the lack of an adequate policy framework, fragile economies, and poor energy infrastructure makes the existence of these barriers to improving energy efficiency more pronounced [4]. Apeaning and Thollander [5] showed that energy is poorly managed in various industries in Ghana and that there is an energy efficiency gap. Ghana’s government has been working closely on industrial energy efficiency improvement since 1987, when they initiated an “Industrial Energy Rationalization Program” [6]. Since then, several programs have been launched for industrial energy efficiency improvement in Ghana [7].
The positive impact of energy efficiency improvement on economic conditions has been observed by several model-based analyses. For example, Ringel et al. [8] argued that green energy policies in Germany resulted in noticeable GDP growth and new jobs. Hartwig et al. [9] showed the positive effects on employment by energy efficiency policy in Germany by using an input–output analysis. Henriques and Catarino [10] also concluded, by using an input–output-based model that green investment in energy efficiency has a positive impact on employment and income. Allan et al. [11] constructed a computable general equilibrium (CGE) model and measured the impact of energy efficiency improvement for the UK. By using a job creation model, Wei et al. [12] estimated that by 2030, over 4 million jobs could be created by pursuing aggressive energy efficiency measures.
In contrast, Costantini et al. [13] claimed that sectoral energy efficiency gains have a negative effect on employment growth, especially in energy-intensive industries in 15 European countries. Lee and Min [14] is one of a few studies that analyzed at the firm level to find a negative correlation between green R&D and the financial performance of Japanese manufacturing firms. These studies seem to indicate a negative relationship between energy efficiency improvement and business and economic performance.
The literature, however, is largely limited to either identifying mere correlation or deriving results that are heavily dependent on their modeling assumptions. Additionally, the impact of energy efficiency on economic performance has mostly been studied at an aggregate level such as country and industry levels. In a previous study, by using farm-level data, Lotsu et al. [15] have noticed that the impact of energy efficiency improvement policy, implemented by penalties on companies, is successful in this regard. However, the study did not focus on the impact of the penalty-oriented energy efficiency improvement on the economic performances of the firms. Therefore, there is a clear gap in the literature that identifies the effect of penalty-based energy efficiency improvement on business performance using firm-level data.
This paper investigates the impact of energy-efficient power factor improvement on business performance, measured in terms of workers’ salary and total employment by using panel data of large-scale electricity users in Ghana. Underemployment is a critical issue in Ghana, where 80% of the workforce is employed in the informal sector, which is characterized by underemployment. Large-scale energy-intensive firms are the main part of formal sector employment, their decision-making and performances are significantly important to evaluate the economic strategy for the sustainable development of Ghana. The remainder of this paper is organized as follows. Section 2 provides a background on the energy efficiency improvement policy in Ghana. Section 3 offers a discussion of our data and identification strategies. Section 4 presents the results. Section 5 concludes the paper.

2. Energy Infrastructure and Policy in Ghana

Ghana achieved independence in 1957 and began setting development projects with the support of developing partners (i.e., the World Bank). For industrialization, Ghana set several ambitious projects to ensure a stable power supply. As a part of the Volta River Project (VRP), Ghana built the Akosombo Dam within four years of independence, which set the foundation for the country’s industrialization [16].
Between 1983 and 1984, Ghana suffered a severe drought. This drought led to a shortfall of water inflows to Lake Volta, where the Akosombo Dam is located, which dropped below 15% of its long-term prospected total [17]. This shortfall hampered electricity supply, as Ghana’s only sources at the time were the Akosombo and Kpong Hydro Electric Power Stations. Lake Volta was unable to fully recover from the 1983 drought before it was hit by another drought in 1993–1994, which again led to the curtailment of electricity to consumers. This crisis revealed that the country’s heavily hydroelectric-power-dependent electricity supply is vulnerable to natural disasters and lacks adequate energy security [18].
To overcome the situation, the government of Ghana decided to improve energy efficiency by raising the power factor among electricity-intensive firms. Power factor is a measure of how efficiently an electrical energy is converted to useful work output. It is the ratio between active power (kwh) to the apparent power consumed by an alternating current device [19,20], where the apparent power is the vector sum of the active and reactive power. That is,
Power   Factor   ( PF ) =   Active   Power ( Reactive   Power ) 2   +   ( Active   Power ) 2
The active power is also called the useful power, which is the power used to produce effective work. Reactive power is the nonworking power used for the transmission of the active power.
Power factor correction (PFC) is a technique of increasing the efficiency of a power supply. In a case study, Olatinwo et al. [21] reported that by improving the power factor from 80% to 90%, agricultural firms successfully save 12% of the apparent power. Considering the electricity cost of firms, PFC is an effective energy-saving policy in Ghana, and it is evident that a steel smelting firm that introduced PFC has reduced the firm’s annual electricity bill by 5–10% since 2001 [5]. The contribution of PFC is important for a sustainable energy system, as well as to foster socioeconomic development.
There are three electricity tariff categories in Ghana: (i) residential customers, (ii) nonresidential customers, and (iii) special load tariff (SLT) customers [22]. Residential consumers are primarily domestic users, and nonresidential customers are commercial users whose energy capacity is less than 100 kVA [17]. Electricity customers whose consumption is equal to or greater than 100 kVA are classified as special load tariff (SLT) consumers in Ghana. SLT customers use energy for industrial purposes with electricity loads greater than or equal to 100 kVA. According to the PFC policy, SLT customers of Economic Campany of Ghana (ECG), whose power factor is below 90% are penalized in proportion to the shortfall as well as the maximum electricity demand. For example, if the actual power factor falls short of the threshold by 10%, the penalty is 10% of the electricity bill that is determined on the basis of the maximum electricity demand of the users.
SLT customers are further classified into three groups of low-, medium-, and high-voltage classes. The high-, medium-, and low-voltage customers are supplied electricity at 33,000, 11,000, and 415 volts respectively. Due to the advantage from a technical point of view, electricity-intensive firms prefer to receive at higher voltage levels. In the case of Ghana, many of the high-voltage consumers are the mining firms and other large-scale firms.
In 1994, the Government of Ghana imposed PFC policy by penalizing firms that did not improve energy efficiency by PFC measures [18]. The PFC policy is effective for the large-scale electricity user industry, which might face a penalty unless they improve power factor [15]. Given the growing concern over climate change, diminishing resources, and increased world demand for electricity consumption, power factor correction has the potential to provide long-term social, economic, and environmental gains to society [13].

3. Methodology

3.1. Data

This study utilized panel data from 183 Ghana SLT companies from 1994–1997 and 2012. Due to the power crises, some large-scale electricity users in Ghana folded up either temporarily or permanently or did not operate at their full capacities in 1998–2010 and 2012–2015. Therefore, we limited our sample by excluding those SLT firms and the respective years of crises. As our outcome variable was a one-year lag from 1994, the total number of valid observations was 732.
Figure 1 illustrates the power factor of firms in time t compared with time t-1. Horizontal and vertical lines at 0.9 of the X and Y axis represent the cut-off threshold of the power factor improvement policy. Points that fall to the right of the vertical line and above the horizontal line represent power-efficient firms that were not subject to the penalty under the policy. From Figure 1, we find those firms scattered along the 45 degree line did not improve their power factors from the previous years. Those above the 45 degree line are the compliers who responded to the policy and improved their power factor compared with that at time t-1. There are a number of firms to the left of the vertical line who are just above the horizontal line: these are the firms who have improved their power factor above the penalty threshold from the previous year. In turn, those scattered below the 45 degree line are the noncomplying firms.
Table 1 reports the summary statistics of our data. From the mean of power factor in each year, we can see that the firms’ power factor had gradually improved. The dispersion of power factor among firms also became smaller towards year 2012, where the range had shrunken from 61 to 23, approximately 2.5 times smaller. We report our interested outcomes, the total number of employed, average salary of all staff, the average salary of all management staff, and the average salary of non-management staff, in logarithm form to measure the changes in terms of the growth rates rather than the levels, given the large heterogeneity among firms. Log transformation of variables is a common practice in applied microeconomic analyses when the linear form has a long range, such as income and salary (see for example [23,24,25]).
Table 1 shows that the total number employed, average salary of all staff, the average salary of all management staff, and the average salary of non-management staff are all having a long skewed tail, with means being far from the max values, even after taking the log and the first difference.

3.2. Identification Strategies

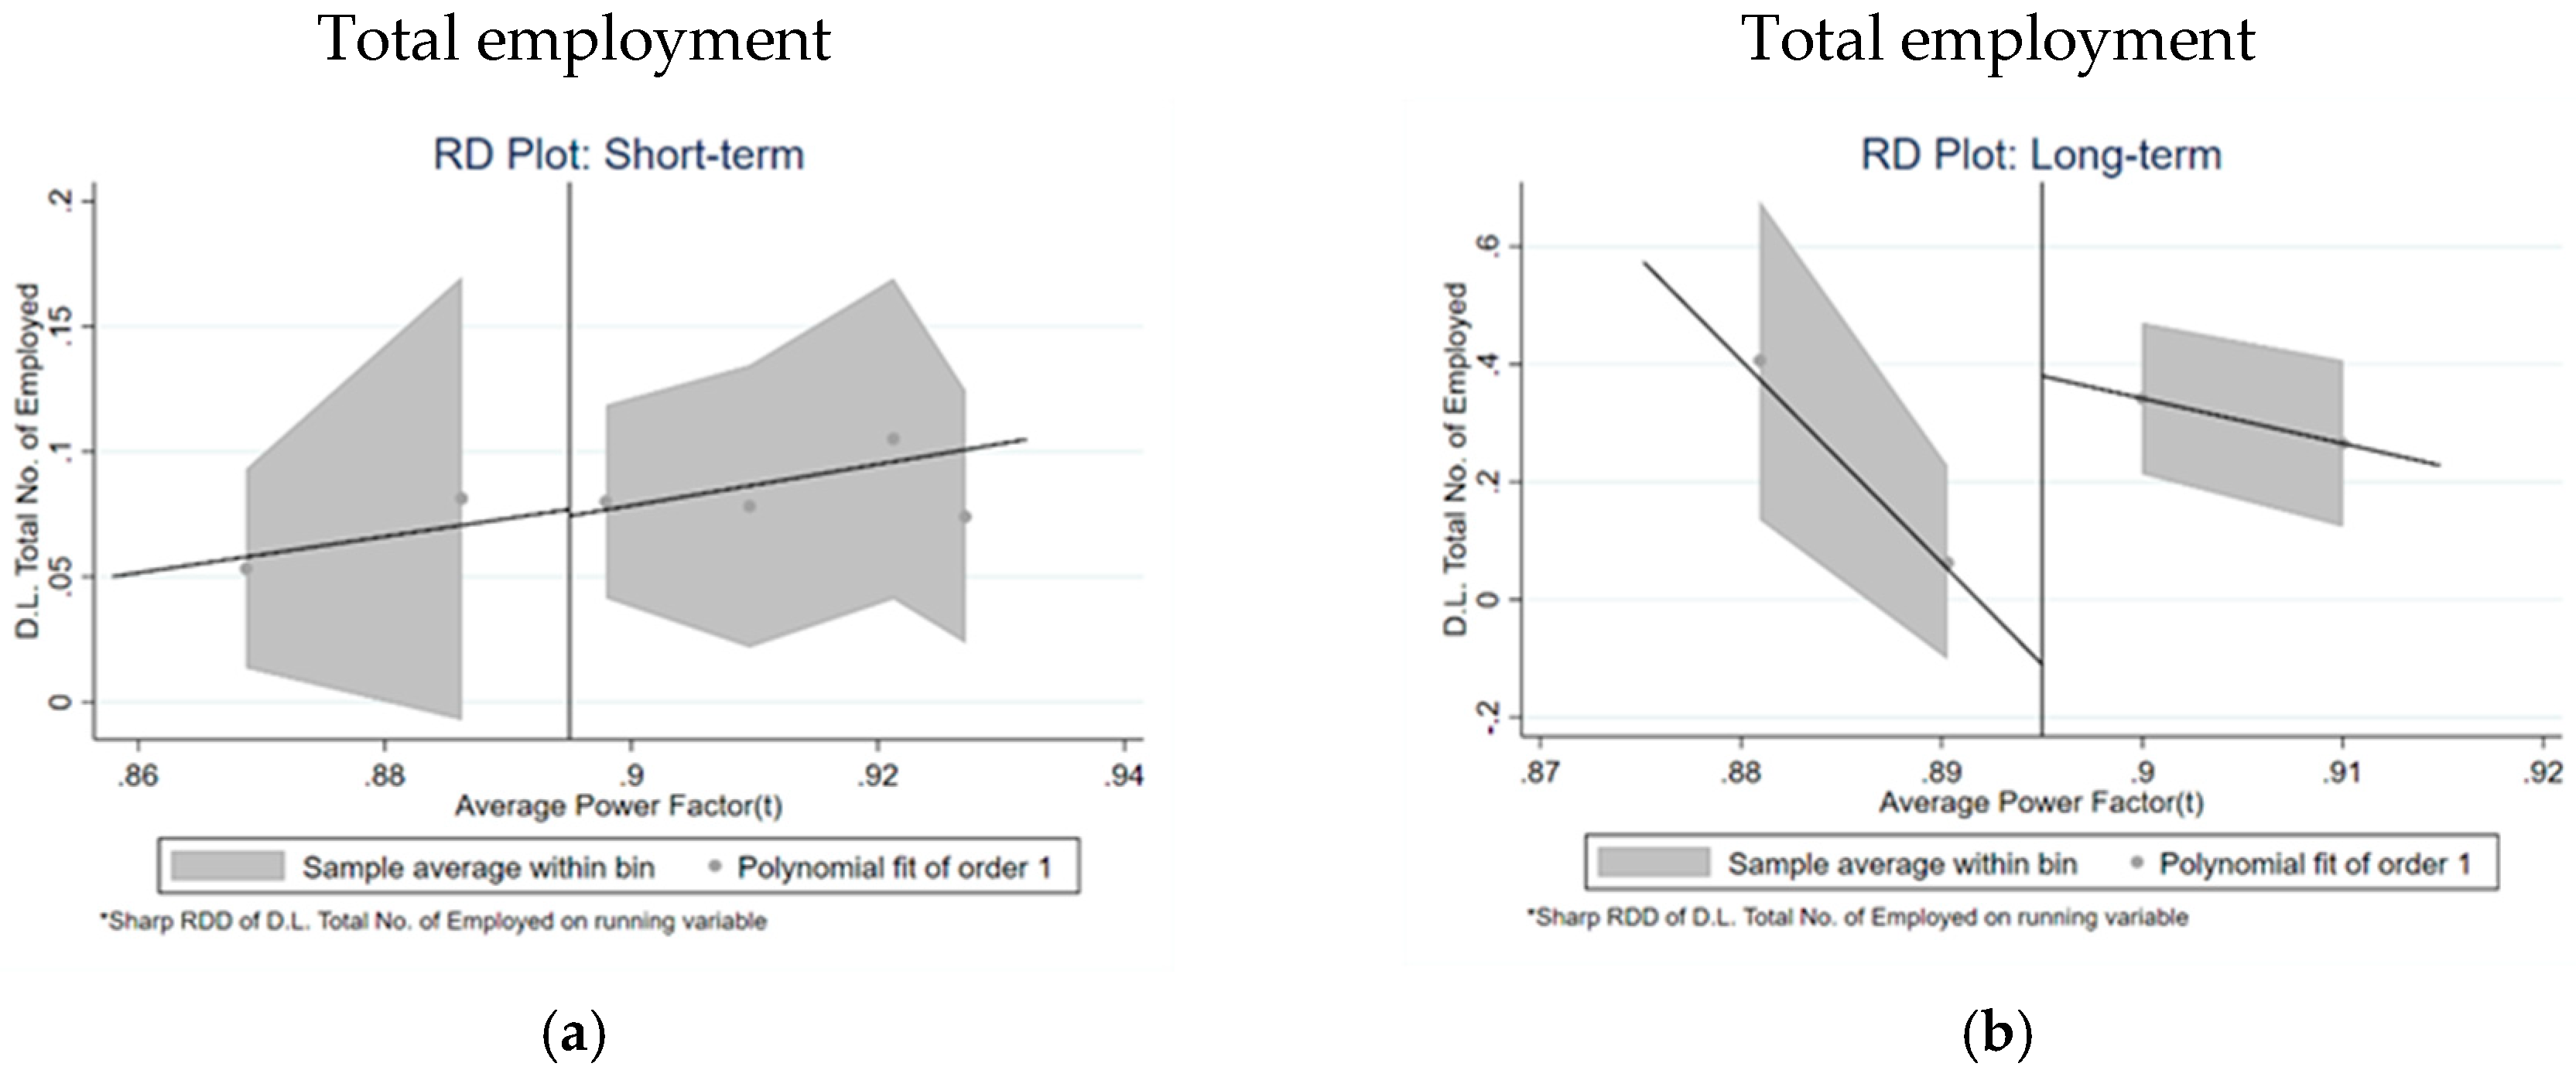
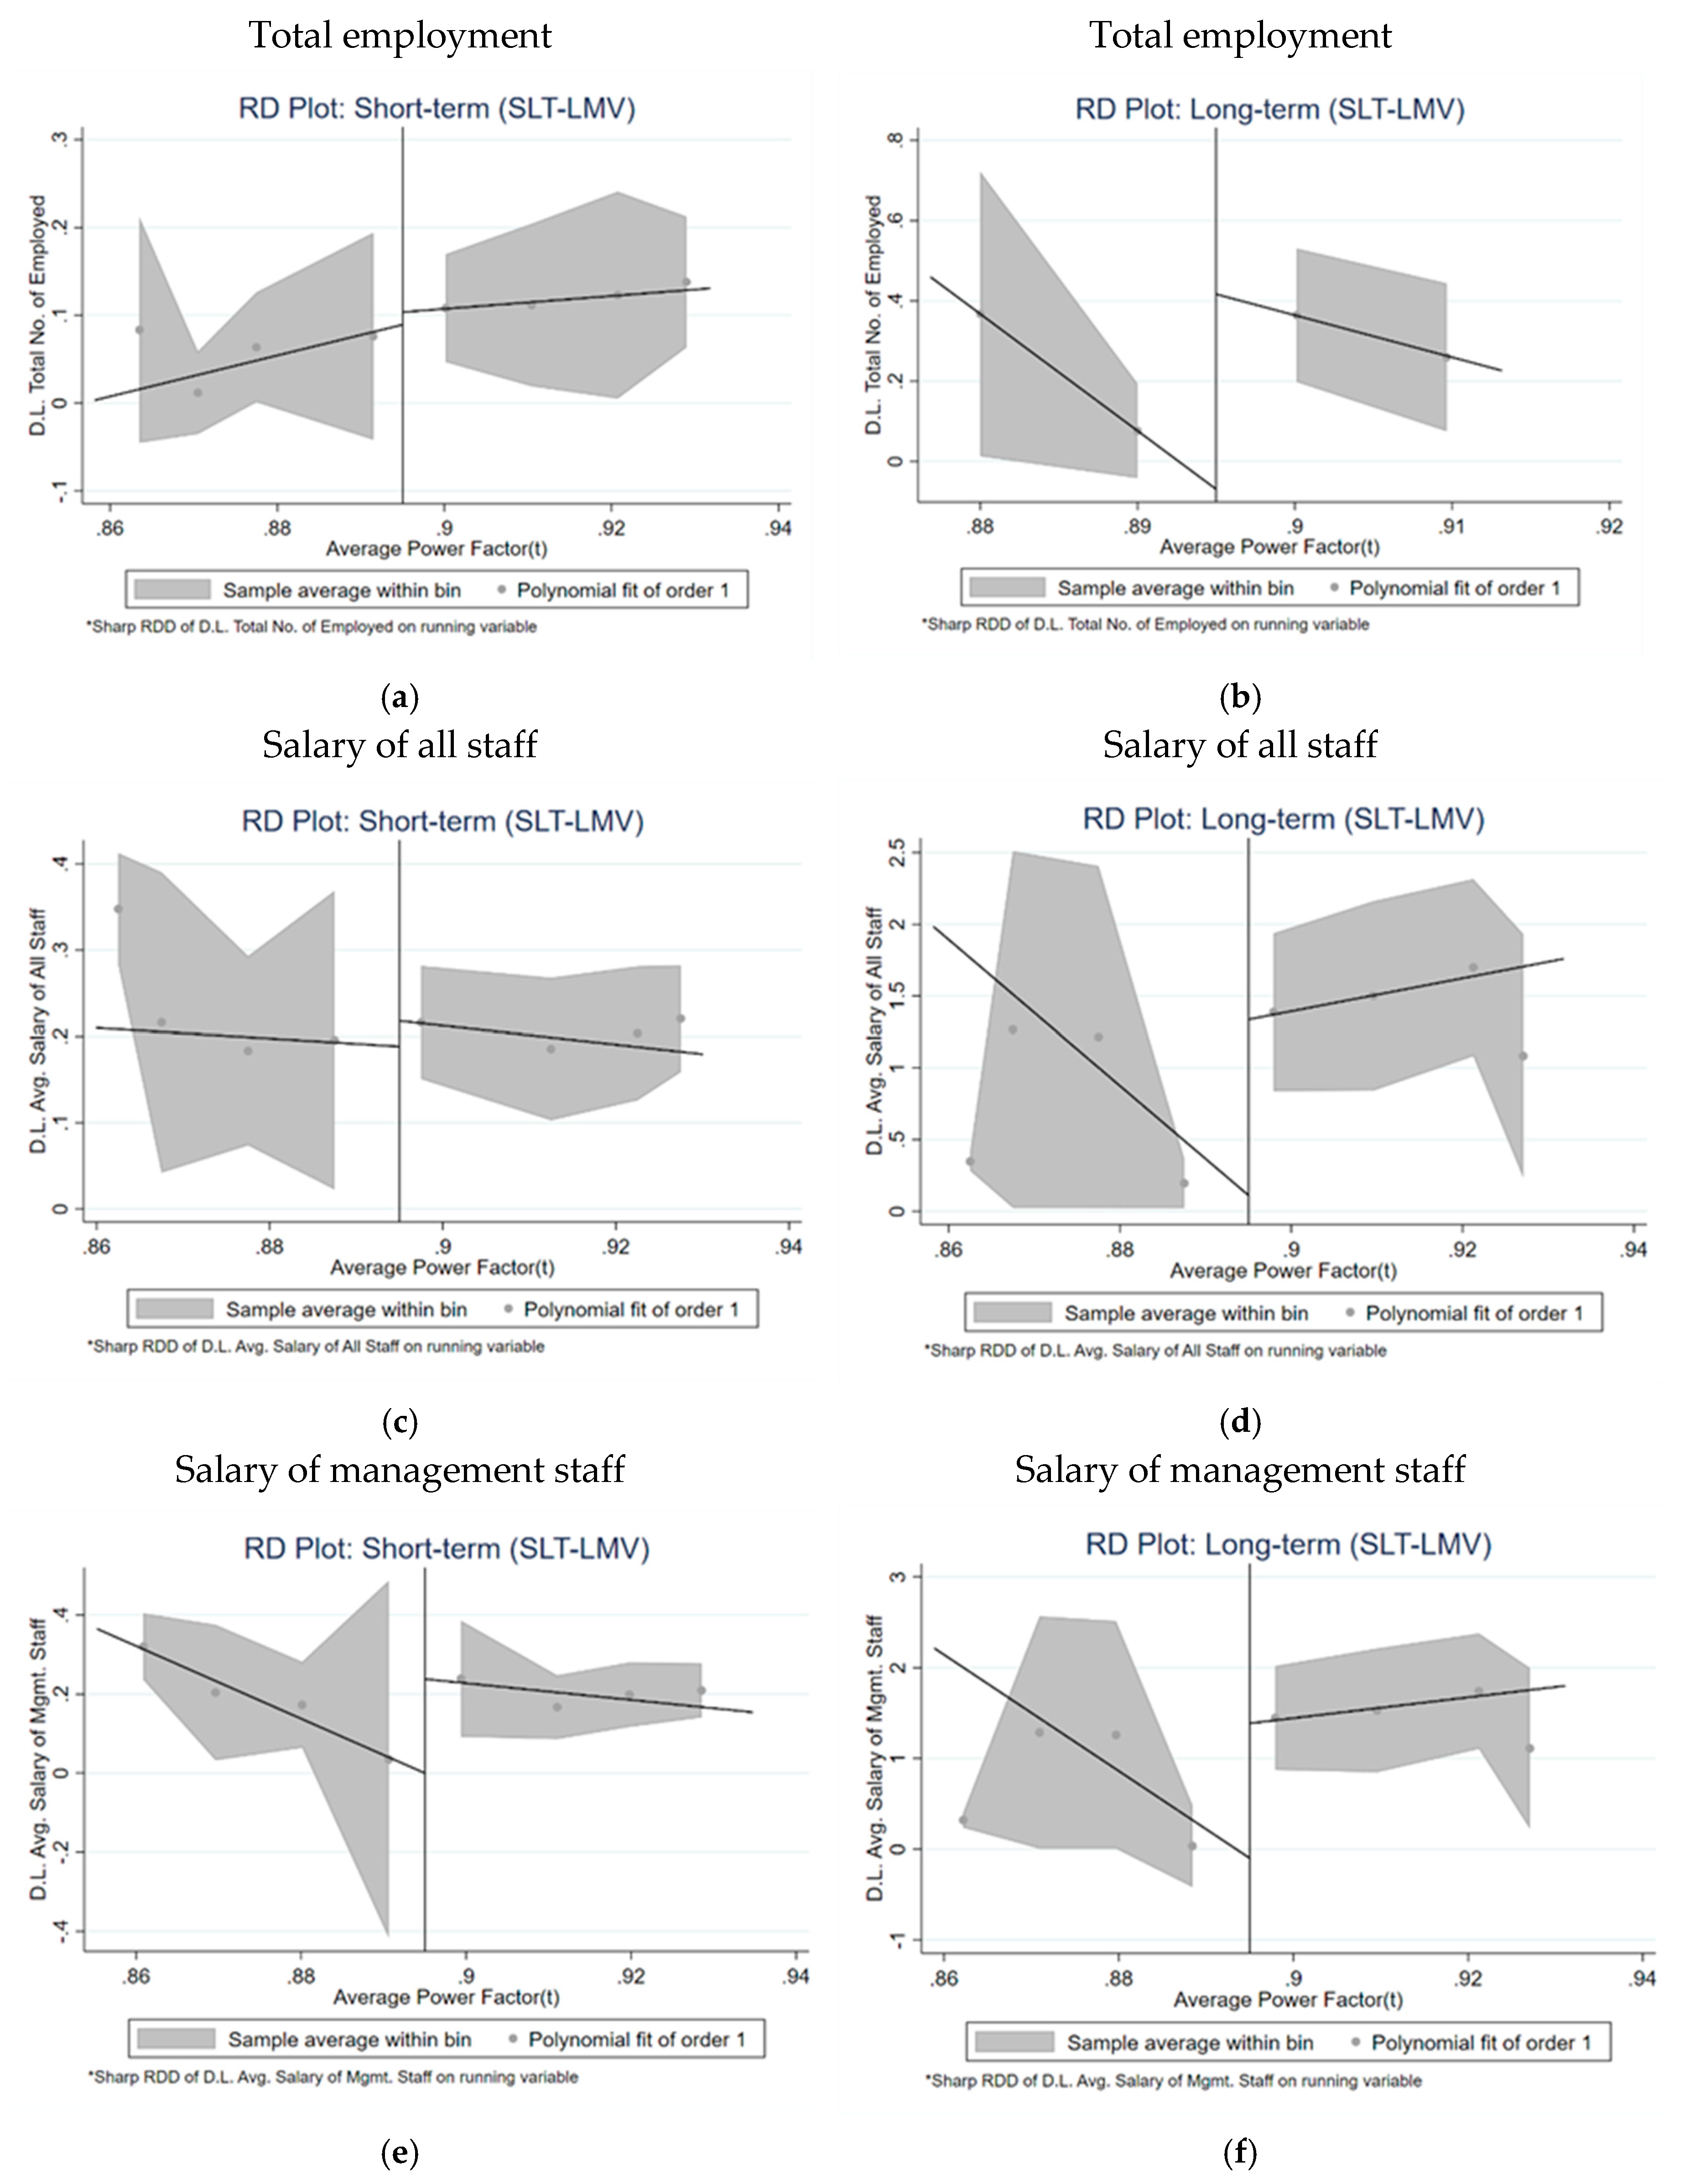
This paper aims to show the impact of PFC policy on the firm’s competency in both the short- and long-term perspective. Our study attempts to interpret a firm’s competitiveness through its human resource management outcomes by employing four managerial outcomes, namely, total number of employed, average salary of all staff, average salary of managerial staff, and average salary of nonmanagerial staff. For the short-term perspective, we pooled the observations from 1994 to 1997 in the analysis, while for the long-term perspective, we further included the observations from 2012, which brought our total number in the sample to 915.
We presume that the salary offered by a firm can serve as a proxy for a firm’s competitiveness and productivity. This logical framework flows from the positive synergy attainable through energy efficiency, which can lead to the overall improvement in firm performance, while raising their ability to offer higher compensation to employees for retaining skilled human capital and keeping up the excellent performance. For instance, Rayton [26] showed that top-performing firms tend to link their employee’s remuneration more closely to a firm’s annual growth.
Apart from overall staff salary, we also tried to separately measure managerial and nonmanagerial staff salary given our interest in outcomes to address the existence of vertical and horizontal pay dispersion in firms [27,28]. As firms might want to control or even reduce pay for nonmanagerial staff or nonskilled labor, it is more reasonable to distinguish managerial and nonmanagerial staff remuneration in separate measurements to avoid plausible mixed effects.
We took first differences and one lag for all outcome variables, as the impact of the power factor improvement would usually take time to be reflected in all of these human resource managerial outcomes. We also conducted a robustness check by using two-period lagged outcome variables to allow firms to have a longer time to adjust to the penalized situation after the PFC policy is in place.
Our treatment variable is a power factor improvement dummy that equals one when the firm in the current year strictly improved its power factor from the last year, and zero otherwise. Obviously, this treatment variable is not randomly assigned and therefore suffers from confounding. To avoid this endogeneity, we adopted the identification strategy via a regression discontinuity design (RDD), which constitutes a quasi-experimental setting. (In Lotsu et al. [15], the main equation outcome is the power factor in year t, while treatment is whether or not a firm received a penalty based on power factor in year t − 1 with the strict cut-off value (running variable) of power factor 0.895.) Fortunately, the policy of imposing a penalty on any firm whose power factor is less than the threshold value of 0.9 provides us with a quasi-experimental setting that can draw a causal estimation. Following the identification strategy in Lotsu et al. [15], we also employed a cutoff value of 0.895 of power factor, as our running variable is measured in the increment of 0.01. The policy is designed to encourage firms to improve their power factor compared with the previous year. Therefore, unlike the previous paper that utilized sharp RDD, this study applied a fuzzy RDD (FRD hereafter), where power factor improvement is regarded as the treatment. The underlining identification assumptions for this FRD framework are (i) both potential outcome and potential treatment are continuous in the power factor around the penalty threshold and (ii) monotonicity and relevance of the PFC policy as an instrument are satisfied.
Our parameter of interest is defined as follows:
τ F R D = τ Y ,   S R D τ T ,   S R D = μ Y + μ Y μ T + μ T
which is obtained by taking the ratio of the average treatment effect of the penalty policy on the outcome at the threshold, τ Y ,   S R D , to that on the treatment, τ T ,   S R D (see Calonico et al. [29]), where the subscript SRD refers to the sharp RD estimates. In other words, this can be regarded as the local average treatment effect (LATE) at the penalty policy threshold. The + and − signs refer to the range of optimal bandwidth that is selected by the data. We followed the nonparametric specification of [30] and calculated the mean squared error- (MSE)-optimal bandwidths based on the data. Note that since the computation is based on minimizing MSE, the optimal bandwidth is different for each outcome variable.
Since this optimal data-driven bandwidth computation method was introduced by Calonico et al., [29,30] it has been adapted by several different studies that employed FRD. For instance, in the political economy field, Pons and Tricaud [31] adopted the method in the French election to study the voters’ behavior by leveraging on the fact that 12.5% qualification threshold exists for the third candidate to be eligible in the second-round election. In the agricultural economy field, Aung et al. [32] applied the method to the case of farmers in Myanmar whose eligibility to receive credit depends on whether their rice farming area is greater than 10 acres or not, to study a credit policy’s impacts on rice production. In the health economics field, Zhang et al. [33] utilized the China’s statutory retirement ages of 60 years for men and 50 for women as the cutoff to study the causality of retirement on healthcare services utilization. Although in different fields, the common issue among these studies lays on the existence of compliers and noncompliers around the threshold. This necessitates the assessment of causal effect by examine the LATE, by taking up the nonparametric FRD estimation.
In our study, we assumed that the treatment status of a firm is induced by the power factor that is lower than 0.895, reflecting the firms’ incentive to avoid the penalty. With the existence of noncompliers, not all firms whose power factor in the last year is lower than 0.895 improve their power factor, or in other words, get “treated.” However, it still raises the probability of a firm being treated, which creates discontinuity on the likelihood of treatment that allows us to measure causality.
Furthermore, we also trimmed the sample within a reasonably narrow bandwidth, above and below the threshold value of the running variable (i.e., the power factor). By limiting the sample within this small window of the power factor, those firms located right above and below the threshold were nearly identical to each other as a group. These firms have by chance been cut off into two groups, one of which is subject to the penalty while the other is not.

4. Results and Discussion

Before proceeding to our main results, we would like to illustrate our reduced-form estimation, (i.e., the average treatment effect of the penalty policy on the outcome at the threshold, τ Y ,   S R D , as mentioned in the numerator of Equation (1)). In Figure 2, we plot the short- and long-term outcomes of all SLT firms for the total number employed, average salary of all staff, the average salary of all management staff, and the average salary of non-management staff, respectively.
The shaded region shows the 95% confidence interval. Overlapping of the shaded regions in the left and right sides of the diagram indicates no significant difference between the potential treatment and control groups. For instance, in Figure 2, only long-term salary for all staff, management staff, and non-management staff are significantly different. The significant difference in reduced-form estimation for potential treatment and control groups is important, as we divide this by the average treatment effect (ATE) of power factor correction policy on the probability of power factor improvement, in order to obtain our FRD estimates. (Similar to Figure 2, we also plot the results of subsample analyses, namely that for low- and medium-voltage firms separately from high-voltage firms in both short and long term, which can be found in Appendix A).
Table 2 reports the main result of our study. Our first-stage estimations were always significant, which means that encouragement design of a penalty policy is relevant and is effectively causing firms to improve their power factor performance, as found in Lotsu et al. [15]. Our first-stage estimators were all negative, which shows that those firms whose power factors were just below the cutoff (i.e., the penalty threshold) were more likely to be treated compared with those that were just higher than the threshold. Our estimation in the first stage differed slightly from what had been reported in the previous paper. This difference is mainly due to the data-driven approach to minimizing MSE; thus, we have a different bandwidth from one model to another.
Columns (1) to (4) of Table 2 presents the short-run impacts to four outcome variables that are of interest—neither of them showing a significant result in the short run. By including the observations from 2012, we examined the long-run impacts, as reported in columns (5) to (8) of Table 2. The results showed the adverse effects on firms that were slightly below the penalty threshold in the long run and complied with the encouragement by improving their power factors. In the long run, the difference in the employment, average salary of all staff, the average salary of all management staff, and the average salary of non-management staff were all significant. Firms that had improved their power factor were less able to keep their employment and offer a higher salary, due to improving their power factor. These firms were not only less capable of paying a higher salary to non-management staff, but were even less capable of paying a high salary to retain the human capital at the managerial level that is crucial to a firm’s long-run operation.
In addition to this full sample analysis, we also conducted two sub-sample analyses to examine whether there are any different impacts between high-voltage firms and low- or medium-voltage firms. This categorization is potentially relevant as these two groups of firms are facing different tariff charges and have different capabilities to absorb the extra expenses to improve their power factor. To describe the energy sector dependent firms and the energy capacity in Ghana, In Appendix B, Table A1 and Table A2, we report the types of firms that considered in this analysis and the electricity capacity from different sources respectively.
The results of the sub-sample analyses were consistent with the overall results in general. There were no significant findings in short-term outcomes. For a long-run consequence, only low-voltage and medium-voltage firms were found to be negatively and significantly affected by this policy, whereas high-voltage firms’ outcomes were not affected significantly. The long-term subsample analysis result is reported in Table 3, while the short-term subsample analysis can be found in the Appendix B, Table A3 and Table A4.
By comparing the full sample with low- and medium-voltage firms’ subsample analysis in the long run, we can see that the negative coefficient had increased for all three salary indicators: average salary of all staff, the average salary of all management staff, and the average salary of non-management staff. The increase in the negative coefficient for the growth rate of average salary of management staff was the highest. Even though it carries less significance, from the high-voltage subsample analysis results we can consistently see the adverse impacts on low- and medium-voltage firms were twice as large as that on high-voltage firms when we compare columns (2) to (4) with columns (6) to (8) of Table 3. In particular, impacts on the growth rates of average management staff salary among low-voltage and medium-voltage firms were nearly three times (2.9 times) as large as the impacts on high-voltage firms. In our analysis, the negative impact on the growth rate of total number of employed was not significant in the short run. Our findings highlight the adverse effect of Ghana’s PFC policy on the competitiveness of electricity-intensive firms in the long run, especially for low-voltage and medium-voltage SLT firms. These results suggest that they are now no longer being able to offer better remuneration to retain or hire valuable human capital.
We also conducted an analysis by allowing two years lagged outcomes as a robustness check. The findings are robust and consistent with our main results. No impacts were found on short-term outcomes, and impacts on all three payroll-related variables in the long term were significantly negative for treated firms, ranging from −3.09% to −3.39%. These results, obtained even when we allowed for longer adjustment times for firms, indicate negative impacts were persistent and slightly reduced in the coefficient impacts. These robustness check results for the full sample are reported in Table 4 and for subsample analysis can be found in Appendix B, Table A4 and Table A5.

5. Conclusions and Policy Implications

This paper investigated whether the energy efficiency improvement that was induced by a power factor correction policy implemented by Ghana’s government in 1995 has had a long-run impact on the salary levels of low-voltage and medium-voltage companies. The high-voltage companies have been able to adapt to the penalty policy without reducing employees’ compensation. This policy does not have an impact on the employment level of firms.
Generally, a higher power factor results in lower energy-related costs to users, allowing businesses to become competitive. However, the necessary investment in capacitor banks places a financial burden on users. Which of these two offsetting effects dominates is a highly empirical question. Our results showed negative long-run impacts on these business performance measures in 2012, especially for those firms that were relatively efficient when the policy was announced in 1994.
Ghana is facing continuously increasing demand for electricity due to its growing economy. The PFC policy has successfully contributed to ensuring electricity-use performance. However, the policy needs some incentives to ensure the economic performance of low-voltage and medium-voltage firms that are less able to absorb the policy-induced penalty shocks than large-voltage firms.
The energy efficiency policy to increase the power factor over 90% in Ghana requires modification or improvement. We recommend two policies to overcome this challenge. Firstly, the penalty for power factor improvement should not be imposed identically on lower- and higher-voltage firms. Secondly, firms that satisfy the power factor standard should receive subsidies to improve their competitiveness in the market.
We believe that this energy efficiency policy in Ghana requires more rigorous empirical research to identify the optimal solution given that the policy is directly related to countries economic growth. Future research should focus on renewable energy infrastructure to ensure a green energy policy. There is a clear trend of the thermal share exceeding the hydroelectricity share of the electricity generation in Ghana in recent years. This would cause environmental damages in the long run and impose challenges to achieve sustainable development goals.

Author Contributions

Conceptualization, C.Y.L., S.L.; M.I., and Y.Y.; Methodology, C.Y.L., S.L.; M.I., Y.Y. and S.K.; Software, C.Y.L., S.L.; M.I., Y.Y. and S.K.; Validation, C.Y.L., S.L.; M.I., Y.Y. and S.K.; Formal Analysis, C.Y.L., S.L.; M.I., Y.Y. and S.K.; Investigation, Y.Y.; Resources, S.L.; Data Curation, S.L.; Writing-Original Draft Preparation, C.Y.L., S.L.; M.I., Y.Y. and S.K.; Writing-Review & Editing, C.Y.L., S.L.; M.I., Y.Y. and S.K.; Visualization, C.Y.L., S.L.; M.I., Y.Y. and S.K.; Supervision, Y.Y.; Project Administration, Y.Y.; Funding Acquisition, Y.Y. and S.K.

Funding

This work is partly supported by the Ministry of Education of Japan Grant-in-Aid for Scientific Research #16K03628.

Acknowledgments

We thank Takahiro Ito for his constructive comments.

Conflicts of Interest

The authors declare no conflict of interest.

Appendix A

Figure A1. Subsample SLT—Low- and Medium-Voltage Firms Sharp RD result of average treatment effect of the penalty policy on the outcome at the threshold, τ Y ,   S R D . Short-term and long-term RD plots for total employment are shown in (a,b), respectively. Similarly, RD plots for all staffs for short and long run are represented in (c,d), accordingly. In addition, (e,f) show the short-run and long-run RD plots of management staffs’ salary, respectively. Finally, (g,h) represent short- and long-run RD plots of non-management staffs’ salary, accordingly.
Energies 12 03684 g0a1aEnergies 12 03684 g0a1b
Figure A2. Subsample SLT—High-Voltage Firms Sharp RD result of average treatment effect of the penalty policy on the outcome at the threshold, τ Y ,   S R D . Short-term and long-term RD plots for total employment shown in (a,b), respectively. Similarly, RD plots for all staffs for short and long run are represented in (c,d), accordingly. In addition, (e,f) show the short-run and long-run RD plots of management staffs’ salary, respectively. Finally, (g,h) represent short- and long-run RD plots of non-management staffs’ salary, accordingly.
Energies 12 03684 g0a2aEnergies 12 03684 g0a2b

Appendix B

Table A1. Types of firms according to voltage capacity and production.
Firm TypeSpecial Load Tariff (SLT) Customers
Low VoltageMedium VoltageHigh Voltage
Industries102921
Manufacturing151315
Mining4613
Food storage31220
Construction services859
Total406578
Table A2. Electricity capacity, production, and consumption in Ghana from 1990 to 2017.
YearsAverage Annual Growth Rate (%)
199020002005201020172000 to 2017
Capacity of electrical plants (GWe)
Thermal0.000.470.550.992.811
Hydro1.070.951.181.181.583
Total1.071.421.732.144.46.9
Electricity production (TWh)
Thermal0.010.611.163.148.4216.7
Hydro5.726.615.6375.620.6
Total5.737.226.7910.1414.074
electricity consumption (TWh)
Total4.626.925.927.7312.093.0
Source: Volta River Authority, Ghana Energy Statistical Bulletin—2011, National Energy Statistics 2008 to 2017. Notes: Gigawatt electrical (GWe), Terawatt-hour (TWh), Capacities are recorded as gross.
Table A3. Subsample analysis in short-term outcomes for SLT low- and medium-voltage firms and high-voltage firms.
Subsample Analysis in Short-Term Outcomes
SLT—Low and Medium VoltageSLT—High Voltage
(1)(2)(3)(4)(5)(6)(7)(8)
Total Number EmployedAvg. Salary of StaffAvg. Salary of Management StaffAvg. Salary of Non-Management StaffTotal Number EmployedAvg. Salary of StaffAvg. Salary of Management StaffAvg. Salary of Non-Management Staff
RD Estimate−0.064−0.139−0.5570.1590.0320.0190.0240.019
Conventional Std. Err.0.1990.2730.5920.1800.3400.1110.1050.130
Conventional 95% CI[−0.454; 0.327][−0.673; 0.395][−1.717; 0.603][−0.194; 0.512][−0.636; 0.699][−0.199; 0.238][−0.182; 0.230][−0.235; 0.273]
First Stage Est.−0.306 ***−0.317 ***−0.319 ***−0.313 ***−0.678 ***−0.687 ***−0.687 ***−0.686 ***
First Stage Std. Err.0.1160.1180.1110.1120.1300.1260.1260.128
Bandwidth0.0510.0470.0630.0600.0460.0580.0590.056
N. Obs.312312312312237237237237
N. Obs. above the cutoff10010010010083838383
N. Obs. below the cutoff212212212212154154154154
Effective N. obs. above the cutoff8686939371757575
Effective N. obs. below the cutoff3939454527323232
Notes: We report the conventional standard error. All outcomes are in logarithmic scales with first difference and a log. *** p < 0.01, ** p < 0.05, * p < 0.1.
Table A4. Subsample analysis with short-term two-lag outcomes for SLT low- and medium-voltage firms and high-voltage firms.
Subsample Analysis in Short-Term 2-Lags Outcomes
SLT—Low and Medium VoltageSLT— High Voltage
(1)(2)(3)(4)(5)(6)(7)(8)
Total Number EmployedAvg. Salary of StaffAvg. Salary of Management StaffAvg. Salary of Non-management StaffTotal Number EmployedAvg. Salary of StaffAvg. Salary of Management StaffAvg. Salary of Non-management Staff
RD Estimate−0.391−0.351−0.468 *−0.2380.197−0.058−0.028−0.091
Conventional Std. Err.0.2970.2340.2770.2080.1880.1310.1230.150
Conventional 95% CI[−0.973; 0.190][−0.810; 0.107][−1.010; 0.075][−0.647; 0.171][−0.171; 0.564][−0.314; 0.200][−0.268; 0.213][−0.386; 0.203]
First Stage Est.−0.405 ***−0.402 ***−0.403 ***−0.403 ***−0.805 ***−0.799 ***−0.801 ***−0.797 ***
First Stage Std. Err.0.1520.1530.1520.1530.1370.1390.1370.139
Bandwidth0.0500.0530.0520.0520.0550.0630.0590.066
N. Obs.208208208208158158158158
N. Obs. above the cutoff8484848471717171
N. Obs. below the cutoff12412412412487878787
Effective N. obs. above the cutoff7272727264646467
Effective N. obs. below the cutoff1616161617171719
Notes: We report the conventional standard error. All outcomes are in logarithmic scales with first difference and a log. *** p < 0.01, ** p < 0.05, * p < 0.1.
Table A5. Subsample analysis with long-term 2-lag outcomes for SLT low- and medium-voltage firms and high-voltage firms.
Subsample Analysis in Long-Term 2-Lags Outcomes
SLT—Low and Medium VoltageSLT—High Voltage
(1)(2)(3)(4)(5)(6)(7)(8)
Total Number EmployedAvg. Salary of StaffAvg. Salary of Management StaffAvg. Salary of Non-management StaffTotal Number EmployedAvg. Salary of StaffAvg. Salary of Management StaffAvg. Salary of Non-management Staff
RD Estimate−0.093−5.197 **−5.526 **−4.712 **2.281 *−2.283−2.350−2.172
Conventional Std. Err.2.0242.5972.7482.3791.3611.6381.6741.595
Conventional 95% CI[−4.059; 3.874][−10.286; −0.107][−10.913; −0.139][−9.375; −0.050][−0.386; 4.948][−5.494; 0.928][ -5.630; 0.931][−5.298; 0.954]
First Stage Est.−0.341 **−0.389 **−0.389 **−0.389 **−0.576 ***−0.582 ***−0.581 ***−0.581 ***
First Stage Std. Err.0.1410.1560.1560.1560.1120.1220.1210.121
Bandwidth0.0440.0240.0240.0250.0480.0430.0440.044
N. Obs.312312312312237237237237
N. Obs. above the cutoff137137137137113113113113
N. Obs. below the cutoff175175175175124124124124
Effective N. obs. above the cutoff11259595998919191
Effective N. obs. below the cutoff2012121221151515
Notes: We report the conventional standard error. All outcomes are in logarithmic scales with first difference and a log. *** p < 0.01, ** p < 0.05, * p < 0.1.

References

  1. McFarland, E.L.; Hunt, J.L.; Campbell, J.L. Energy, Physics and the Environment; Wuerz Publishing: Winnipeg, MB, Canada, 1994; ISBN 0920063624. [Google Scholar]
  2. Barker, T.; Bashmakov, I.; Bernstein, L.; Bogner, J.; Bosch, P.; Dave, R.; Davidson, O.; Fisher, B.; Grubb, M.; Gupta, S. Summary for policymakers. In Climate Change 2007: Mitigation of Climate Change: Contribution of Working Group III to the Fourth Assessment Report of the Intergovernmental Panel on Climate Change; Cambridge University Press: Cambridge, UK, 2007; pp. 1–24. [Google Scholar]
  3. UNIDO. Industrial Energy Efficiency for Sustainable Wealth Creation: Capturing Environmental, Economic and Social Dividends: Industrial Development Report; United Nations Industrial Development Organization (UNIDO): Vienna, Austria, 2011. [Google Scholar]
  4. Compton, M.E. Industrial Energy Efficiency in Developing Countries: A Background Note; United Nations Industrial Development Organization (UNIDO): Vienna, Austria, 2011. [Google Scholar]
  5. Apeaning, R.W.; Thollander, P. Barriers to and driving forces for industrial energy efficiency improvements in African industries—A case study of Ghana’s largest industrial area. J. Clean. Prod. 2013, 53, 204–213. [Google Scholar] [CrossRef]
  6. ESMAP. Ghana: Industrial Energy Efficiency Activity; ESMAP: Washington, DC, USA, 1992. [Google Scholar]
  7. Ghanaian Ministry of Energy. National Energy Policy 2010; Ministry of Energy: Accra, Ghana, February 2010. [Google Scholar]
  8. Ringel, M.; Schlomann, B.; Krail, M.; Rohde, C. Towards a green economy in Germany? The role of energy efficiency policies. Appl. Energy 2016, 179, 1293–1303. [Google Scholar] [CrossRef]
  9. Hartwig, J.; Kockat, J.; Schade, W.; Braungardt, S. The macroeconomic effects of ambitious energy efficiency policy in Germany—Combining bottom-up energy modelling with a non-equilibrium macroeconomic model. Energy 2017, 124, 510–520. [Google Scholar] [CrossRef]
  10. Henriques, J.; Catarino, J. Motivating towards energy efficiency in small and medium enterprises. J. Clean. Prod. 2016, 139, 42–50. [Google Scholar] [CrossRef]
  11. Allan, G.; Hanley, N.; McGregor, P.; Swales, K.; Turner, K. The impact of increased efficiency in the industrial use of energy: A computable general equilibrium analysis for the United Kingdom. Energy Econ. 2007, 29, 779–798. [Google Scholar] [CrossRef]
  12. Wang, F.; Peng, X.; Wei, R.; Qin, Y.; Zhu, X. Environmental behavior research in resources conservation and management: A case study of Resources, Conservation and Recycling. Resour. Conserv. Recycl. 2019, 141, 431–440. [Google Scholar] [CrossRef]
  13. Costantini, V.; Crespi, F.; Paglialunga, E. The employment impact of private and public actions for energy efficiency: Evidence from European industries. Energy Policy 2018, 119, 250–267. [Google Scholar] [CrossRef]
  14. Lee, K.H.; Min, B. Green R&D for eco-innovation and its impact on carbon emissions and firm performance. J. Clean. Prod. 2015, 108, 534–542. [Google Scholar] [Green Version]
  15. Lotsu, S.; Yoshida, Y.; Fukuda, K.; He, B. Effectiveness of a Power Factor Correction Policy in Improving the Energy Efficiency of Large-Scale Electricity Users in Ghana. Energies 2019, 12, 2582. [Google Scholar] [CrossRef]
  16. Eshun, M.E.; Amoako-Tuffour, J. A review of the trends in Ghana’s power sector. Energy Sustain. Soc. 2016, 6, 9. [Google Scholar] [CrossRef]
  17. Kumi, E.N. The Electricity Situation in Ghana: Challenges and Opportunities; Center for Global Development: Washington, DC, USA, 2017. [Google Scholar]
  18. Edjekumhene, I.; Amadu, M.B.; Brew-Hammond, A. Power Sector Reform in Ghana: The Untold Story; A Paper written as part of a collaborative project on Power Sector Reform and Public Benefits in Developing and Transition Economies coordinated by the World Resources Institute; Kumasi Institute of Technology and Environment (KITE): Kumasi, Ghana, 2001. [Google Scholar]
  19. Bhattacharyya, S.; Choudhury, D.A.; Jariwala, P.H.R. Case Study On Power Factor Improvement. Int. J. Eng. Sci. Technol. 2011, 3, 8372–8378. [Google Scholar]
  20. Khader, S.H.; Daud, A.K.K. Single-phase AC supply. In Chap. 9 in Electric Renewable Energy Systems; Muhammad, H.R., Ed.; Academic Press: New York, NY, USA, 2015; pp. 156–182. [Google Scholar]
  21. Olatinwo, O.S.; Adejumobi, I.A.; Wara, S.T.; Waheed, M.A. The Effect of Power factor Improvement on Switching Transients: A Case of FUMMAN Agricultural Products Industry Plc. J. Electr. Electron. Eng. 2015, 10, 1–9. [Google Scholar]
  22. Ajodhia, V.; Mulder, W.; Slot, T. Tariff Structures for Sustainable Electrification in Africa; European Copper Institute (ECI): Arnhem, The Netherlands, 2012; pp. 1–56. [Google Scholar]
  23. Depetris-Chauvin, E.; Santos, R.J. Unexpected Guests: The Impact of Internal Displacement Inflows on Rental Prices in Colombian Host Communities. J. Dev. Econ. 2016, 134, 1–38. [Google Scholar] [CrossRef]
  24. Magnani, E.; Zhu, R. Gender wage differentials among rural–urban migrants in China. Reg. Sci. Urban Econ. 2012, 42, 779–793. [Google Scholar] [CrossRef]
  25. Magruder, J.R. Can minimum wages cause a big push? Evidence from Indonesia. J. Dev. Econ. 2013, 100, 48–62. [Google Scholar] [CrossRef]
  26. Rayton, B.A. Firm performance and compensation structure: Performance elasticities of average employee compensation. J. Corp. Financ. 2003, 9, 333–352. [Google Scholar] [CrossRef]
  27. Connelly, B.L.; Haynes, K.T.; Tihanyi, L.; Gamache, D.L.; Devers, C.E. Minding the gap: Antecedents and consequences of top management-to-worker pay dispersion. J. Manag. 2016, 42, 862–885. [Google Scholar] [CrossRef]
  28. Tenhiälä, A.; Laamanen, T. Right on the money? The contingent effects of strategic orientation and pay system design on firm performance. Strateg. Manag. J. 2018, 39, 3408–3433. [Google Scholar] [CrossRef]
  29. Calonico, S.; Cattaneo, M.D.; Titiunik, R. Robust nonparametric confidence intervals for regression-discontinuity designs. Econometrica 2014, 82, 2295–2326. [Google Scholar] [CrossRef]
  30. Calonico, S.; Cattaneo, M.D.; Farrell, M.H.; Titiunik, R. Rdrobust: Software for regression-discontinuity designs. Stata J. 2017, 17, 372–404. [Google Scholar] [CrossRef]
  31. Pons, V.; Tricaud, C. Expressive Voting and Its Cost: Evidence From Runoffs With Two or Three Candidates. Econometrica 2018, 86, 1621–1649. [Google Scholar] [CrossRef]
  32. Aung, N.; Nguyen, H.T.M.; Sparrow, R. The Impact of Credit Policy on Rice Production in Myanmar. J. Agric. Econ. 2019, 70, 426–451. [Google Scholar] [CrossRef]
  33. Zhang, Y.; Salm, M.; van Soest, A. The effect of retirement on healthcare utilization: Evidence from China. J. Health Econ. 2018, 62, 165–177. [Google Scholar] [CrossRef] [PubMed]
Figure 1. Current and Last Year Power Factor in scatter plot.
Energies 12 03684 g001
Figure 2. Full sample sharp regression discontinuity (RD) result of average treatment effect of the penalty policy on the outcome at the threshold, τ Y ,   S R D . Short-term and long-term RD plots for total employment are shown in (a,b), respectively. Similarly, RD plots for all staffs for short and long run are represented in (c,d), accordingly. In addition, (e,f) show the short-run and long-run RD plots of management staffs’ salary, respectively. Finally, (g,h) represent short- and long-run RD plots of nonmanagement staffs’ salary, accordingly.
Energies 12 03684 g002aEnergies 12 03684 g002b
Table 1. Summary statistics.
VariablesNMeanSdMinMax
Power factor7320.8350.1230.3600.980
Power factor in year 19951830.7990.1390.3600.970
Power factor in year 19961830.8100.1320.3700.980
Power factor in year 19971830.8300.1240.3700.980
Power factor in year 20121830.9030.0420.7400.970
Indicator of power factor improvement in time t7320.7010.458
D.L. Total No. Employed 17320.2520.494−0.6083.287
D.L. Avg. Salary of Staff 17321.1151.597−0.5195.924
D.L. Avg. Salary of Mgmt Staff 17321.1331.656−1.5016.002
D.L. Avg. Salary of Non-mgmt Staff 17321.0871.517−0.3045.817
Tariff Category Dummy
Tariff Category 22 = 415 V1830.1970.398
Tariff Category 42 = 11,000 V1830.3720.483
Tariff Category 43 = 33,000 V1830.4320.496
1 Indicates four main outcome variables in our study. D.L. indicates the first differences of log variables.
Table 2. Full sample result.
Full Sample
Short-Term OutcomesLong-Term Outcomes
(1)(2)(3)(4)(5)(6)(7)(8)
Total Number EmployedAvg. Salary of StaffAvg. Salary of Management StaffAvg. Salary of Non-Management StaffTotal Number EmployedAvg. Salary of StaffAvg. Salary of Management StaffAvg. Salary of Non-Management Staff
RD Estimate−0.006−0.016−0.3060.129−1.077 **−3.864 ***−4.409 ***−3.410 ***
Conventional Std. Err.0.1740.1430.3390.1170.4561.3371.5191.214
Conventional 95% CI[−0.348; 0.335][−0.297; 0.265][−0.970; 0.359][−0.099; 0.358][−1.971; −0.183][−6.483; −1.244][−7.386; −1.432][−5.789; −1.030]
First Stage Est.−0.477 ***−0.515 ***−0.494 ***−0.492 ***−0.455 ***−0.455 ***−0.455 ***−0.455 ***
First Stage Std. Err.0.0930.1010.0960.0960.1040.1040.1040.104
Bandwidth0.0430.0300.0370.0370.0190.0240.0250.025
N. Obs.549549549549732732732732
N. Obs. above the cut off183183183183278278278278
N. Obs. below the cut off366366366366454454454454
Effective N. obs. above the cut off147120147147116116116116
Effective N. obs. below the cut off5244525232323232
Notes: All outcomes are in logarithmic scales with first difference and a lag. We report the conventional standard error. *** p < 0.01, ** p < 0.05, * p < 0.1.
Table 3. Subsample analysis in long-term outcomes for special load tariff (SLT) low- and medium-voltage firms and high-voltage firms.
Subsample Analysis in Long-Term Outcomes
SLT—Low and Medium VoltageSLT—High Voltage
(1)(2)(3)(4)(5)(6)(7)(8)
Total Number EmployedAvg. Salary of StaffAvg. Salary of Management StaffAvg. Salary of Non-Management StaffTotal Number EmployedAvg. Salary of StaffAvg. Salary of Management StaffAvg. Salary of Non-Management Staff
RD Estimate−1.073−4.280 **−5.157 **−3.604 **−0.527−2.052 *−2.164 *−1.872 *
Conventional Std. Err.0.6002.0882.4861.8340.5991.0811.1291.009
Conventional 95% CI[−2.249; 0.103][−8.372; −0.187][−10.030; −0.284][−7.198; −0.010][−1.701; 0.648][−4.172; 0.067][−4.377; 0.049][−3.849; 0.105]
First Stage Est.−0.322 ***−0.384 ***−0.384 ***−0.384 ***−0.569 ***−0.568 ***−0.564 ***−0.579***
First Stage Std. Err.0.1050.1380.1380.1380.1300.1260.1240.130
Bandwidth0.0300.0190.0190.0200.0280.0360.0360.035
N. Obs.416416416416316316316316
N. Obs. above the cut off153153153153125125125125
N. Obs. below the cut off263263263263191191191191
Effective N. obs. above the cut off10568686877999999
Effective N. obs. below the cut off3220202020242424
Notes: All outcomes are in logarithmic scales with first difference and a log. We report the conventional standard error. *** p < 0.01, ** p < 0.05, * p < 0.1. We only show the long-term outcomes for both subsample analyses in this table, please refer to the annex for the short-term outcomes.
Table 4. Full sample analysis with two-lag outcomes.
Full Sample
Short-Term OutcomesLong-Term Outcomes
(1)(2)(3)(4)(5)(6)(7)(8)
Total Number EmployedAvg. Salary of StaffAvg. Salary of Management StaffAvg. Salary of Non-Management StaffTotal Number EmployedAvg. Salary of StaffAvg. Salary of Management StaffAvg. Salary of Non-Management Staff
RD Estimate−0.020−0.210−0.225−0.163−0.506−3.262 ***−3.394 ***−3.087 ***
Conventional Std. Err.0.1750.1310.1400.1280.3931.2391.2891.170
Conventional 95% CI[−0.363; 0.324][−0.467; 0.048][−0.499; 0.050][−0.413; 0.087][−1.277; 0.264][−5.691; −0.833][−5.921; −0.867][−5.381; −0.793]
First Stage Est.−0.586 ***−0.599 ***−0.602 ***−0.575 ***−0.437 ***−0.436 ***−0.436 ***−0.436 ***
First Stage Std. Err.0.1120.1130.1120.1110.0970.0970.0970.097
Bandwidth0.0370.0320.0300.0430.0410.0420.0420.042
N. Obs.366366366366549549549549
N. Obs. above the cut off155155155155250250250250
N. Obs. below the cut off211211211211299299299299
Effective N. obs. above the cut off128104104128203203203203
Effective N. obs. below the cut off2523232535353535
Notes: All outcomes are in logarithmic scales with first difference and a log. We report the conventional standard error. *** p < 0.01, ** p < 0.05, * p < 0.1.

