Article

Energiewende @ Risk: On the Continuation of Renewable Power Generation at the End of Public Policy Support

by
Barbara Glensk
1 and
Reinhard Madlener
1,2,*
1
Institute for Future Energy Consumer Needs and Behavior (FCN), School of Business and Economics/E.ON Energy Research Center, RWTH Aachen University, Mathieustrasse 10, 52074 Aachen, Germany
2
Department of Industrial Economics and Technology Management, Norwegian University of Science and Technology (NTNU), 7491 Trondheim, Norway
*
Author to whom correspondence should be addressed.
Energies 2019, 12(19), 3616; https://doi.org/10.3390/en12193616
Submission received: 31 August 2019 / Revised: 15 September 2019 / Accepted: 16 September 2019 / Published: 22 September 2019
(This article belongs to the Special Issue Economics of Sustainable and Renewable Energy Systems)

Abstract

:
This paper aims to analyze what happens with renewable energy power plants, such as onshore wind, photovoltaics and biomass, when the public policy support based on the Renewable Energy Law expires. With its expiration, the first renewable energy (and especially onshore wind) power plants will have to be scrutinized as to whether they can economically continue operation, whether they have to be repowered, or whether they need to be decommissioned. The relative merits of these three alternatives are evaluated by applying real options analysis. In contrast to traditional project evaluation techniques, the real options approach takes advantage of the use of uncertain parameters included in the model, such as the development of the electricity price or electricity output. The results obtained suggest that parameters such as the level of future operation and maintenance costs, the expected development of the electricity price at the spot market, and the interrelations between these, as well as the development of the electricity output from renewables can significantly affect the profitability of these power plants and thus impact the decision about their further optimal operation.

1. Introduction

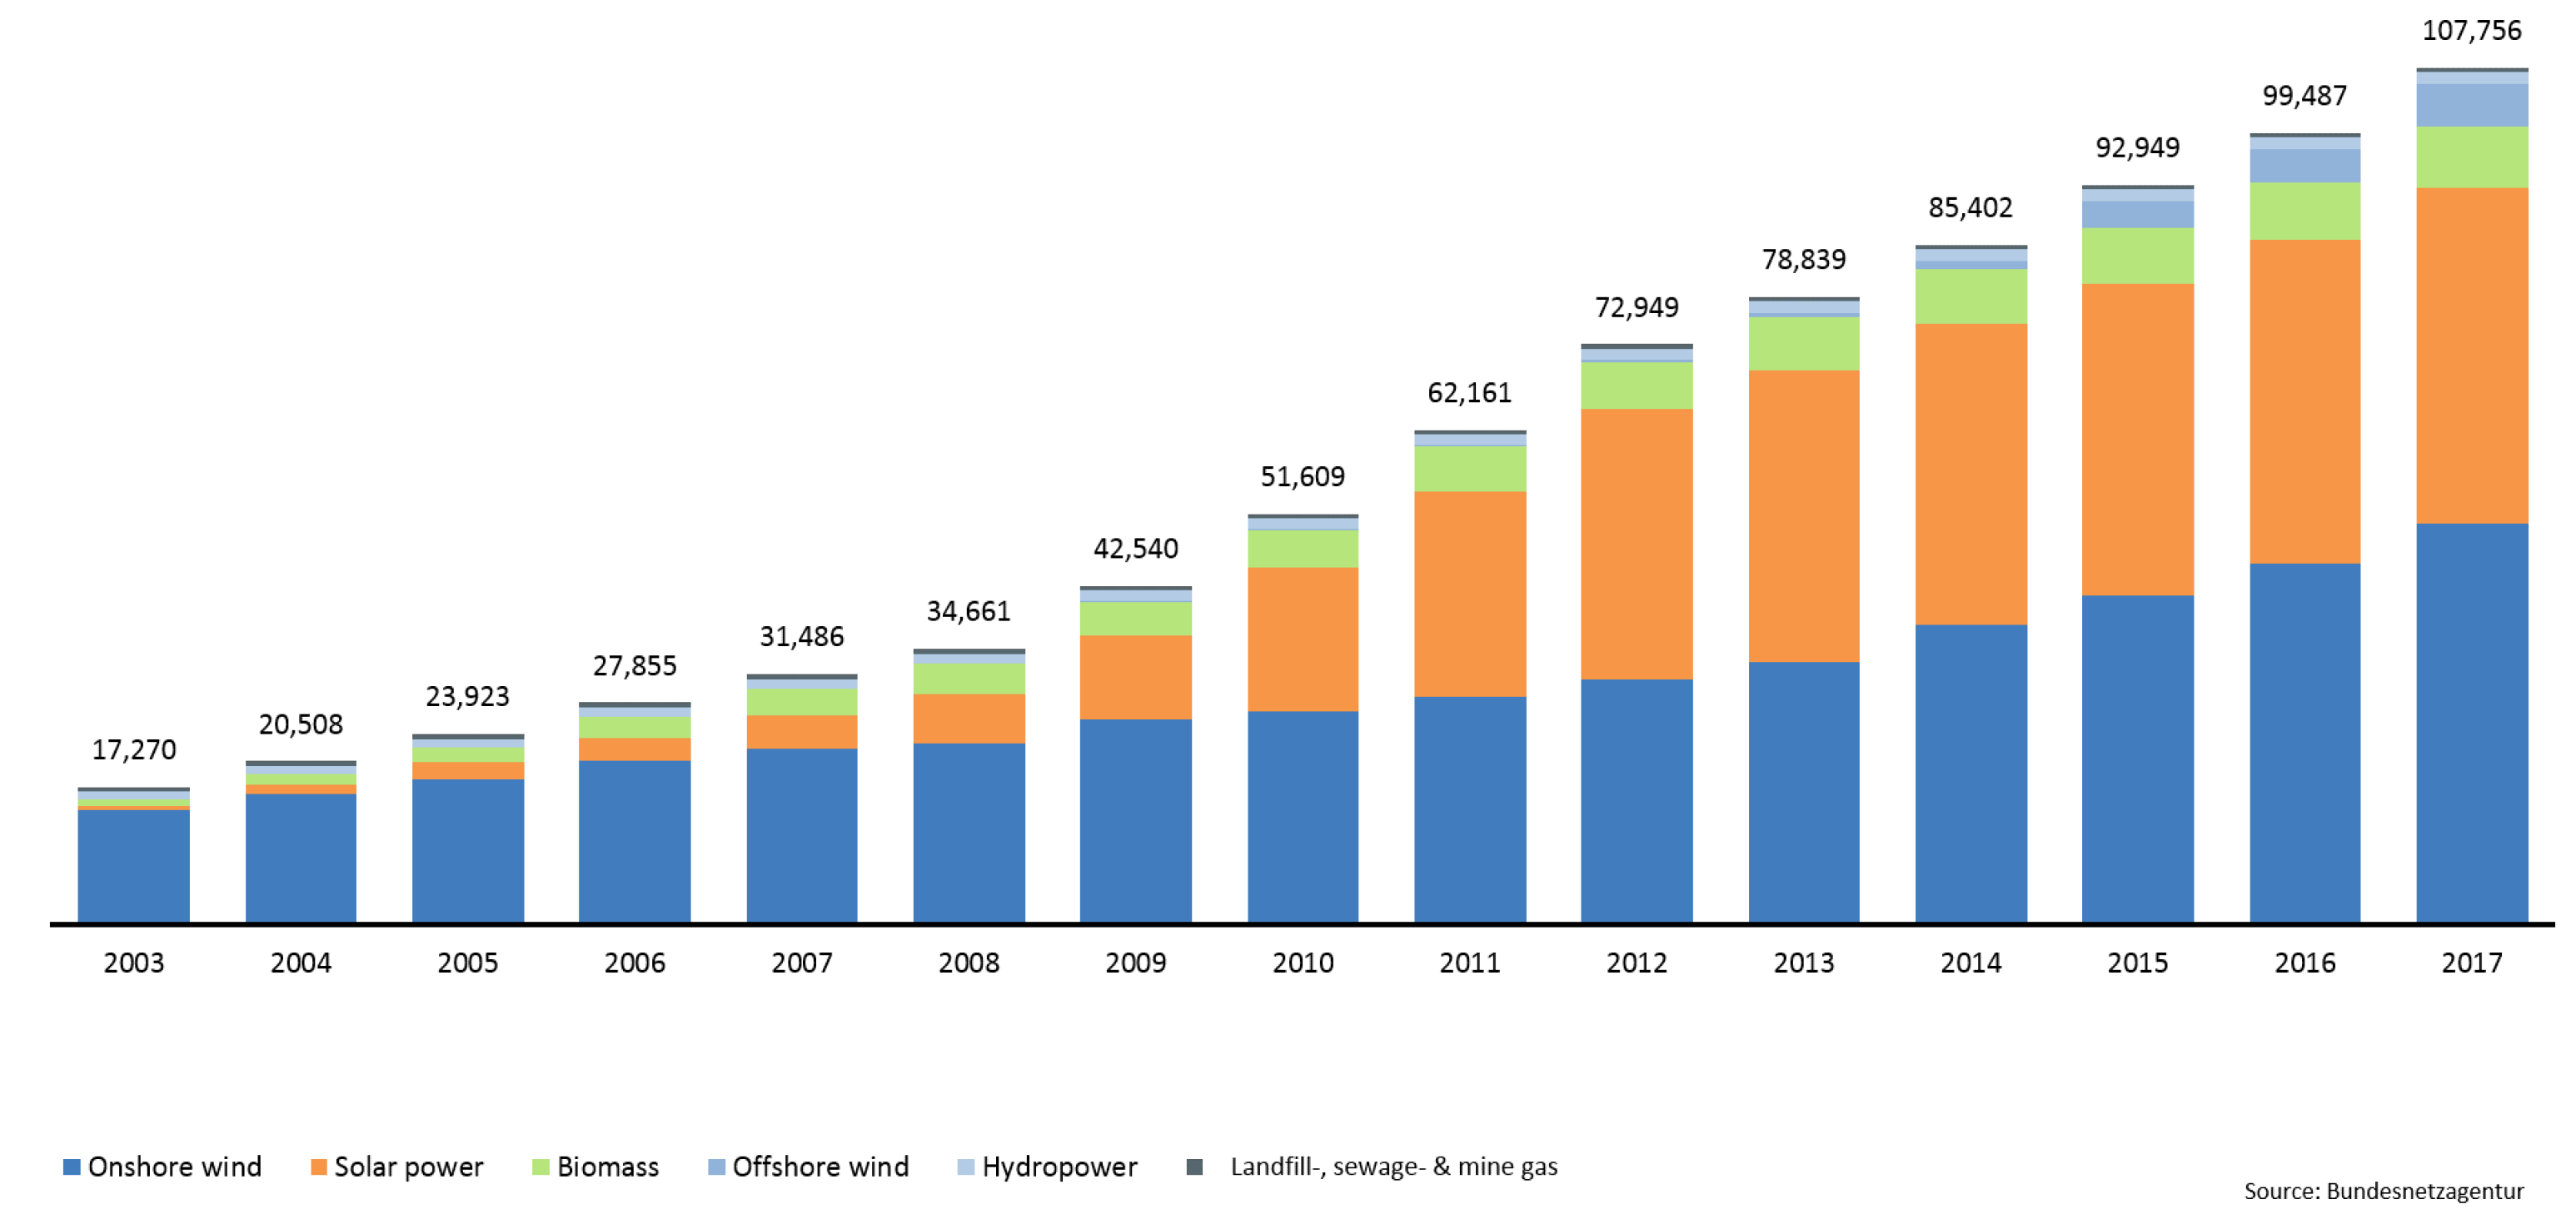
The transition of the German energy system, known as Energiewende, is a complex and challenging process. It refers to the switch in energy supply from fossil and nuclear power generation to cleaner and sustainable energy generation from renewable energy technologies, such as wind and hydro power, solar and geothermal energy. According to [1] (p. 11), it is “An ability of organizations and society to efficiently impact their bottom line and provide positive social change through reduction in energy consumption, production of renewable energy, and efficient management of energy”. This long-term process was initiated in the 1970s and was connected to the oil crisis at the time. It was the starting point for adopting a new energy policy which should promote energy efficiency and the diversification of the energy mix, including more renewable energy sources (RES). Furthermore, the Energiewende was reinforced in the 1990s when Germany begun promoting renewable electricity using feed-in tariff (FIT) schemes by means of the Electricity Feed-in Act (StrEG), the predecessor of the Renewable Energies Act of 2000. The German Renewable Energies Law (EEG–Erneuerbare-Energien-Gesetz) with its guaranteed FITs for 20 years was and still is the key factor for the rapid growth of renewable power production. During this process, the German power system changed dramatically from centralized power production with only a few fossil and nuclear power plants to a more decentralized one with a high share of fluctuating power output from wind and solar energy power plants. The share of the electricity consumption in Germany covered by RES increased between 2000 and 2015 from 6.5% to 31.6% [2] and in 2018 reached 38.2% [3]. Mainly, there are on- and offshore wind, solar photovoltaics (PV), biomass and hydro power plants, whereas wind energy continued to be the largest source of renewables power generation with 112 TWh in 2018 [4]. This significant progress over the years was possible thanks to the promotion policy and EEG regulation, which enabled the impressive increase in the installed capacity shown in Figure 1.
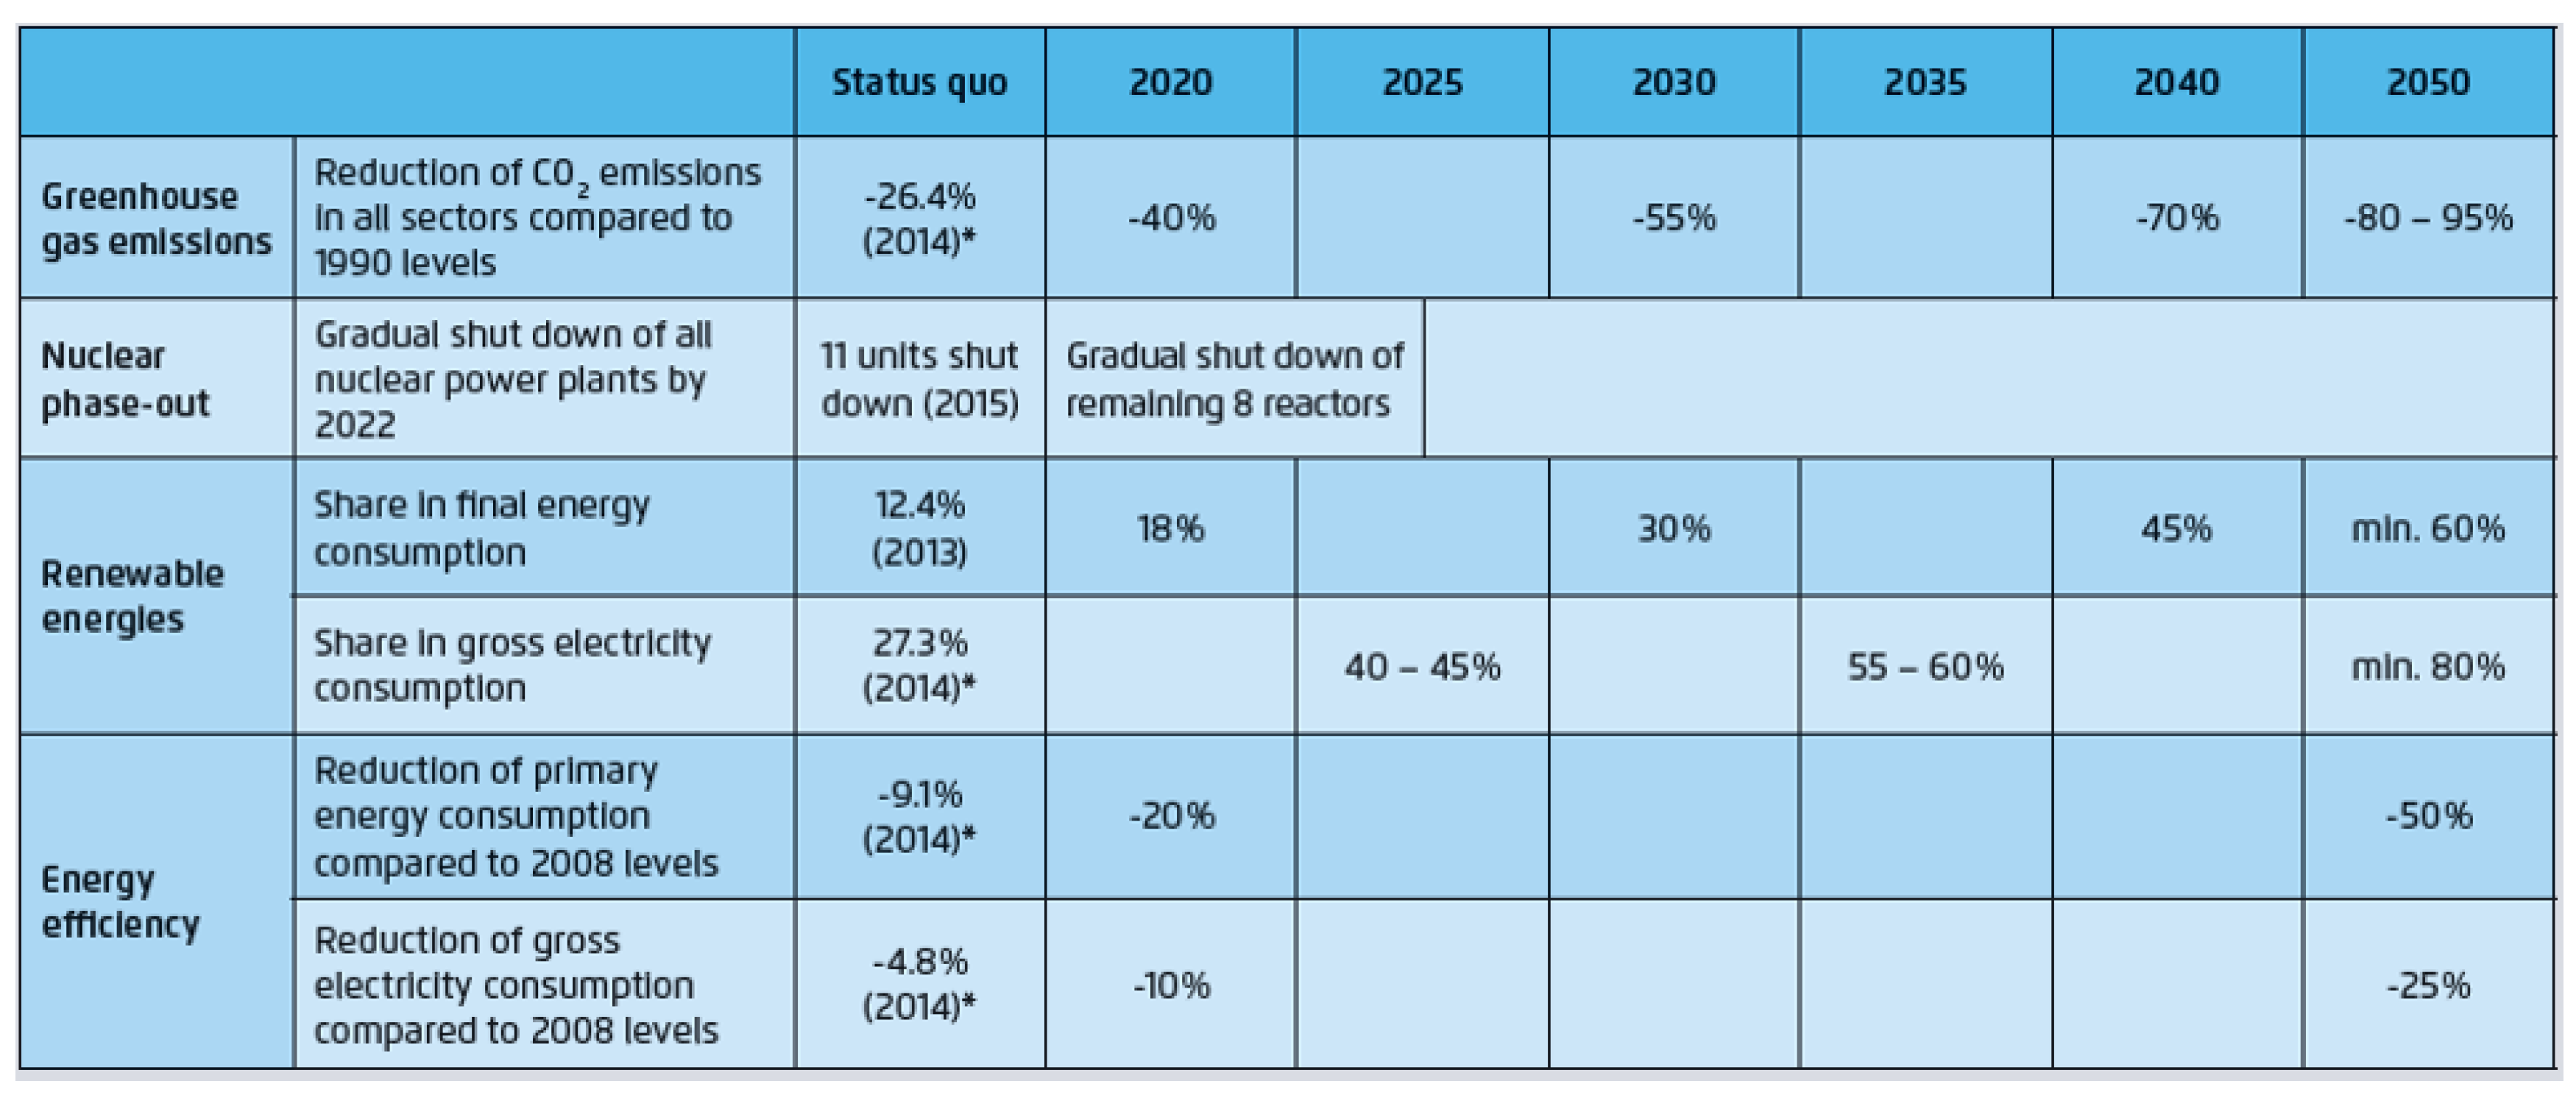
Moreover, since the end of the last century, German energy policy has been strongly influenced by decarbonization policy, which implies a significant reduction of energy demand by higher energy efficiency and a high share of renewables. Officially, the new German energy policy is dated to 2011, after the Fukushima disaster, and called Energiewende (for more information regarding the development of the German energy policy, also in the institutional and regulatory context, see Dickel [6]; furthermore, the background and history of the Energiewende in more detail can be found in Woodrow [7]). It should be noticed that, next to the nuclear phase-out by 2022, the reduction of greenhouse gas emissions (GHG) and of primary energy consumption, the further development and increase of the share of RES in final energy consumption is one of the four main aims of the Energiewende (see Figure 2). Nevertheless, changes in the legislative landscape of the renewable energy market currently being undertaken by the German government can significantly affect the achieving of these aims.
In 2017, the remuneration system for the most important renewable energy technologies in Germany (wind, solar, biomass) and larger systems switched from feed-in tariffs to auctions. The decisive criterion for winning an auction is the bid for the market premium (i.e., the subsidy to be received) in Euros per Megawatt-hour. Notice that with the reform of the EEG in 2014 market premium has become the main support scheme for electricity from RES. The amount of funding is determined by the pay-as-bid procedure (for more information, see [9,10]). The Federal Network Agency (Bundesnetzagentur, BNetzA) is responsible for the competitive bidding procedure. The new regulations cover all offshore wind farms, solar power installations, and onshore wind farms with an installed capacity of over 750 kW, as well as biomass plants with an installed capacity of more than 150 kW. EEG 2017 allows only in the biomass sector the further public policy support of existing facilities after the original 20-years subsidy period and participation in auctions (for an additional 10 years only, and provided the subsidization received so far expires after less than eight years; see EEG 2017 [11] Art. 39f,g). Previously, according to EEG 2009, the base tariff for onshore wind power plants was 5.02 €-ct/kWh, whereas in the first five years after putting the plant into operation an increased rate of 9.2 €-ct/kWh (so-called initial remuneration) applies (according to the EEG, this duration is prolonged by two months for every 0.75% of the reference yield by which the plant yield undercuts 150% of the reference yield, i.e., if the plant is situated at a location with less favorable wind conditions; see EEG 2009 [12], Art. 29). Over the years, the EEG was repeatedly amended, and the base tariff for onshore wind power plants decreased to 4.11 €-ct/kWh, and the initial remuneration to 7.39 €-ct/kWh in the year 2017 (according to EEG 2016). Regarding PV power plants, the tariff depended on the installed capacity and varied from 50.62 €-ct/kWh in the year 2000 to 10.65 €-ct/kWh in 2017. The remuneration tariff for biomass power plants also changed over the years and, depending on the installed capacity, varied from 11.50 €-ct/kWh in the year 2004 to 13.06 €-ct/kWh in 2018 for power plants with up to 15 kW of installed capacity, from 9.90 €-ct/kWh in 2004 to 11.26 €-ct/kWh in 2018 for power plants with up to 500 kW of installed capacity, from 8.90 €-ct/kWh in 2004 to 10.09 €-ct/kWh in the year 2018 for power plants with up to 5 MW of installed capacity, and from 8.40 €-ct/kWh in 2004 to 5.60 €-ct/kWh in 2018 for power plants with up to 200 MW of installed capacity (for more information about the development of the EEG remuneration tariffs, see Appendix A).
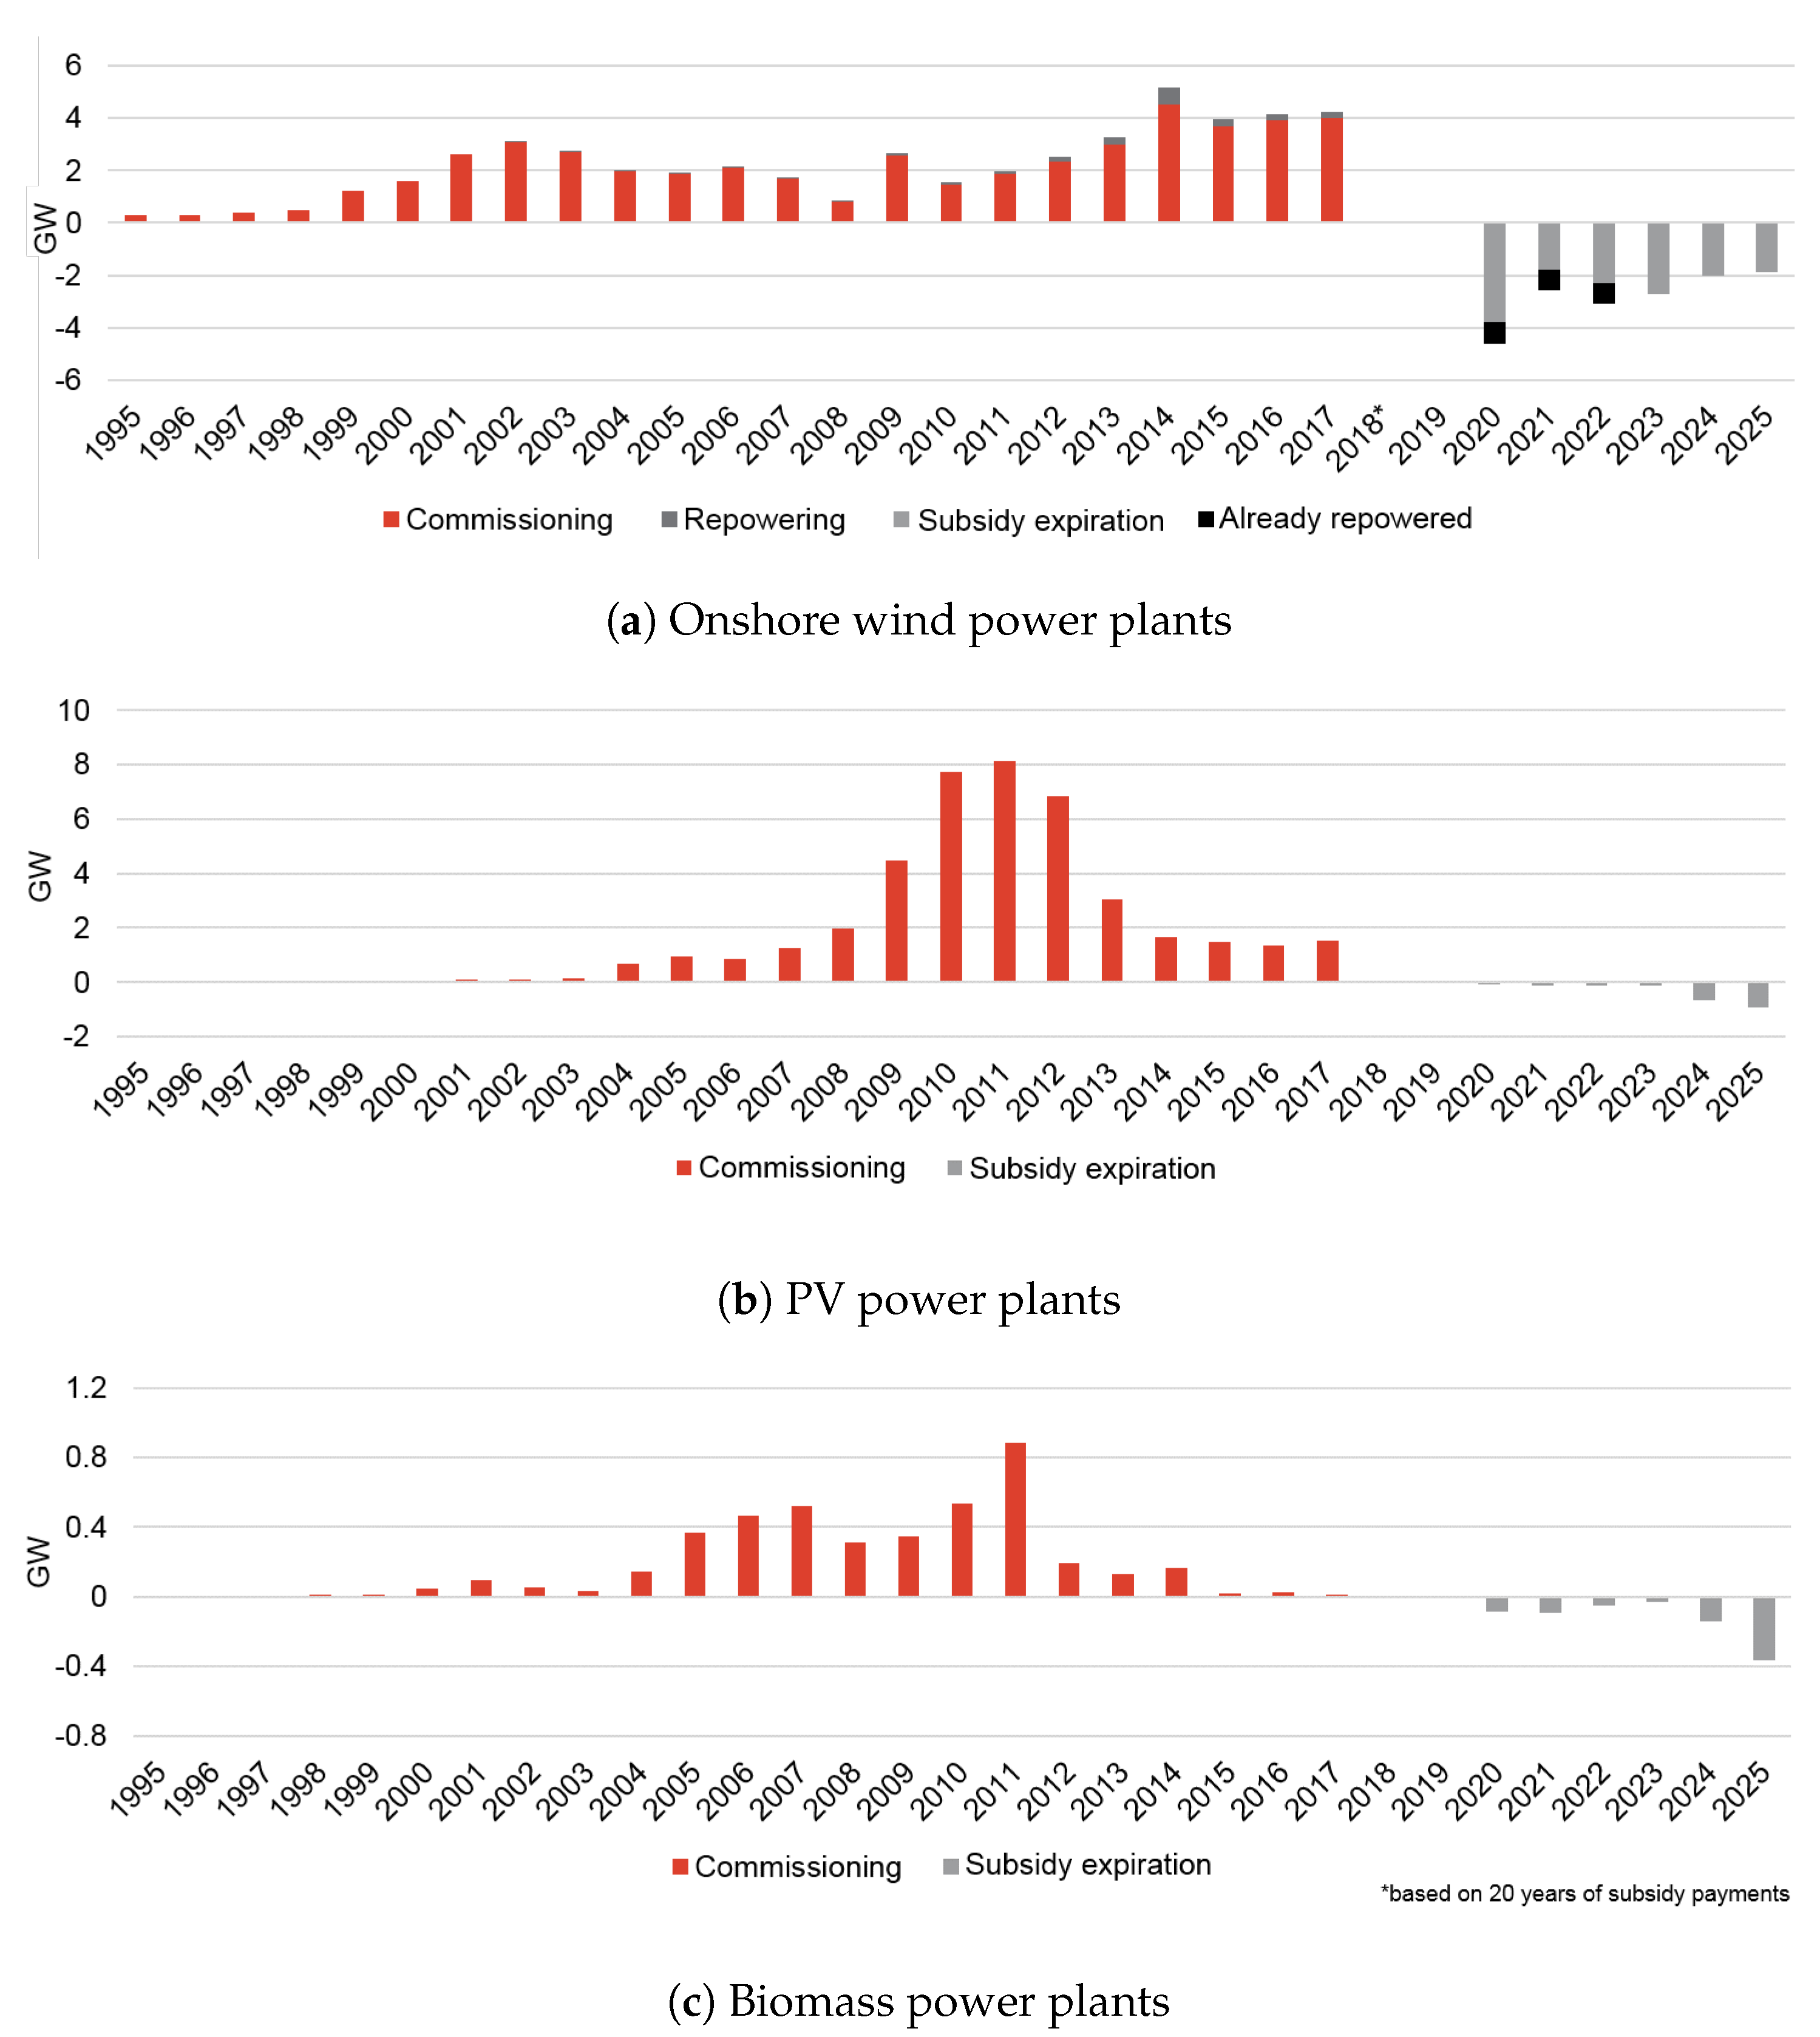
Renewable energy technologies in Germany still enjoy a privileged position regarding their diffusion and marketing, and take advantage of EEG support. Nevertheless, today many of the existing renewable energy power plants, mainly onshore wind, have reached their operational lifetime and thus also the end of their support via the EEG feed-in tariff. Regarding onshore wind power, around 4 GW of plant capacity will be affected in the year 2020. In the following years, it is expected that an average of 2.4 GW of wind power capacity per year will fall short of EEG support. In other words, in the period from 2021 till 2025, between 32 and 47 percent of wind power output will reach the end of its funding period [13]. Because only early adopters installed PV systems before the year 2000, the subsidy’s expiration for an ever higher number of installed PV systems is expected in 2025 and thereafter. The lower installed capacity of biomass power plants compared to wind power plants and PV systems implies a lower number of biomass units leaving the subsidy scheme overall. Moreover, the changes in the policy regarding this technology are not so critical in comparison to wind and PV power plants (see Section 2.1).
The Energiewende, a sustainable energy transition process, is going to substantially alter the way the German society is organized in terms of its energy use. The economic, environmental, social, and to a certain extent the governance aspects of the firm (e.g., energy provider) and the society overall are affected in this transition process. On the one hand, this transition process can be seen as a part of sustainability planning where rational management of resources in the present does not need to compromise the needs of future generations. On the other hand, this process is a part of resilience planning where the various economic, environmental, social, governance, and emergency preparedness strategies are incorparated to prepare organizations and communities for threats from climate change, identification of inherent risks, and planning of their risk mitigation strategies [1].
Keeping in mind the aims of the Energiewende, its connection to the sustainability and resilience planning as well as the changes in the EEG, we raise the following questions: (1) What happens with the renewable energy power plants after expiry of public policy support at the end of their lifetime? (2) Is it reasonable and economically feasible to operate these power plants any further? (3) Which decision options do owners or operators of those power plants have? (4) What is the impact of those decisions on the aims of the Energiewende? (5) Is the Energiewende at Risk? (6) Should the public policy support schemes be adapted, taking repowering more into consideration, in order to achieve the aims of the Energiewende?
In our paper, we propose the application of real options theory in order to evaluate and analyze the possible options for existing RES power plants after the expiration of the subsidization. Using real options analysis (ROA), we consider three possible options: (i) further operation of the existing power plants under new framework conditions, (ii) repowering of the existing power plant, and (iii) decommissioning. The proposed approach is based on the models developed by [14,15] for conventional power generation technologies based on lignite and natural gas, respectively. In contrast to these models, it is not necessary to define the operational strategy for RES power plants based on intermittent sources such as wind and solar power (the power generation for these technologies depends on weather conditions). This becomes an issue only when the RES power plants are combined with storage systems, enabling to shift supply and to self-consume self-generated electricity when it is economically most opportune. On the one hand, it makes the calculation procedure easier; on the other hand, the possible electricity generation over time from RES power plants should be estimated and, in the proposed procedure, is given as a probability distribution. The contribution of our paper is to capture the stochastic and dynamic character of the parameters needed to support the decision-making process regarding the future operation of RES power plants, which is in contrast to the existing studies (reviewed further below), where only deterministic static analysis was conducted.
The remainder of this paper is organized as follows. Section 2 provides a short literature review regarding the situation of existing RES after the end of public policy support and the application of ROA as a valuation method for RES power plants. In Section 3, we present our procedure for analyzing the mentioned early decision options. Section 4 introduces selected RES power plants for the case study and all necessary input information needed for the calculations. Results and a sensitivity analysis of the proposed model application for the case study are presented in Section 5. Section 6 provides conclusions and some policy implications.

2. Background and Literature Review

2.1. RES Technologies after Public Policy Support

In 2020, public policy support for renewable energy technologies under the EEG regime will have been in place for 20 years, so that, for the first renewable power plants installed, the support will expire. The discussion about the future of these power plants after the EEG expiration is of interest not only to researchers but especially to their owners and operators. Lehmann et al. [16] describe what can happen with the installed capacity of renewable energy technologies after 20 years of support policy and ask which consequences there are for the aims of Germany’s Energiewende. They notice that, according to the new EEG regulation from 2017 [11], the increase in installed capacities of wind, photovoltaics (PV) and biomass is regulated and based on the auction procedure. This means that the net increase in installed capacities in the first years after 2020 can be negative. From this perspective, they analyze possible further operation of old renewable power plants. Regarding the PV systems, a large part of them were installed by private households. These households will probably be able to continue their operation without state subsidies for self-consumption and have an increasing incentive to do so in light of the high electricity tariffs of around 30 €-ct/kWh. Nevertheless, in order to increase the profitability of these systems, the owners can undertake some investments, such as the installation of storage units or of heat pumps to take better advantages from the generated surplus electricity [17]. This possibility should be considered with some caution, however, because the additional investment may or may not pay off depending on the prevailing (economic) circumstances. Another option for them is other direct marketing (sonstige Direktvermarktung), i.e., selling either on the electricity exchange, directly to a final consumer (e.g., industry, commerce, or transportation companies), to electricity tenders, direct marketers or to energy supply companies ([11] Art. 21a). With commercial PV systems, the spot market is the main option after 20 years of public support; in contrast, here, lower earnings compared to EEG subsidies are expected [16].
For biomass power plants, the prospects for further economical operation are uncertain because of very high operation and maintenance (O&M) costs as well as the necessary reinvestment in the power plant’s technical upgrade. Nevertheless, the new regulation (EEG 2017) offers the option to participate in the tenders and thereby obtain follow-up funding for the next 10 years. This option is possible for those biomass installations whose previous entitlement to funding under the EEG regime at the time of the invitation to tender is only valid for a maximum of eight years. If funding is awarded, it must be proved (by an environmental expert) that the power plant is technically suitable for demand-oriented operation. It means that a biomass-fired power plant must be able to produce 20% flexibly, i.e., that its electricity is produced and fed into the grid when the electricity price is high (e.g., during peak demand or wind lulls). The owner of the biomass power plant may determine the date from which the new subsidy is to apply and, from that date on, the power plant will be deemed to be newly commissioned [18].
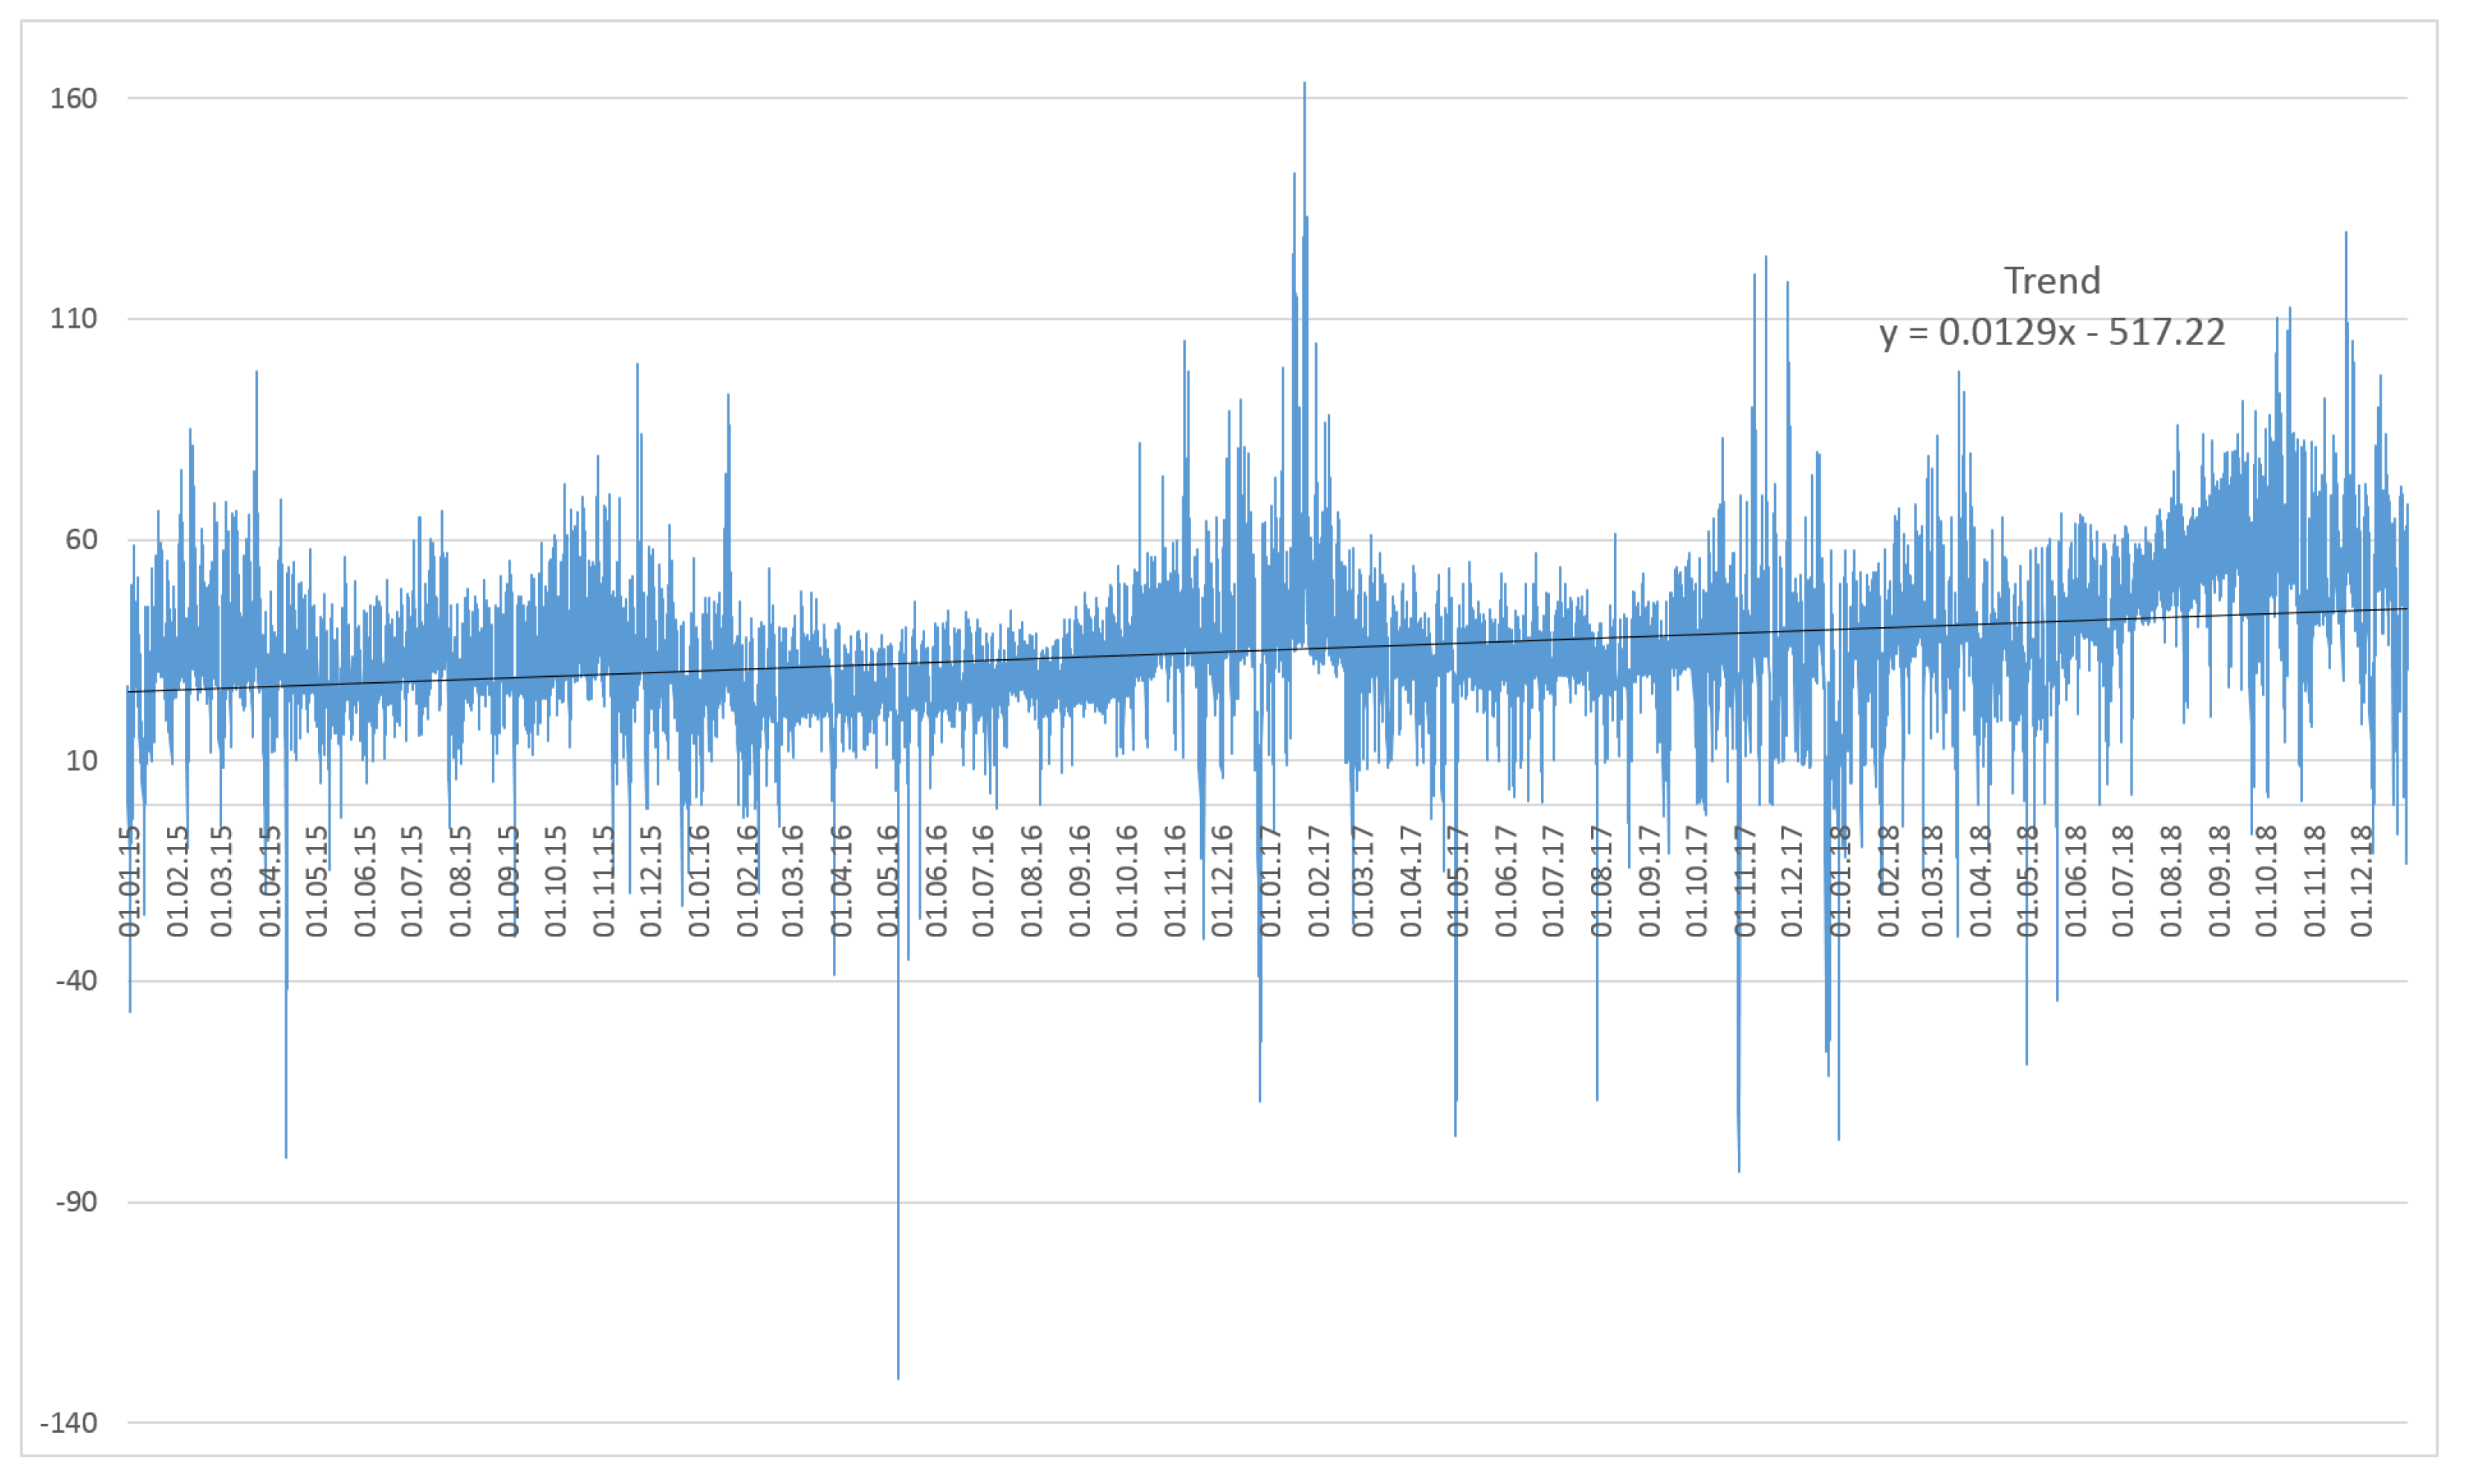
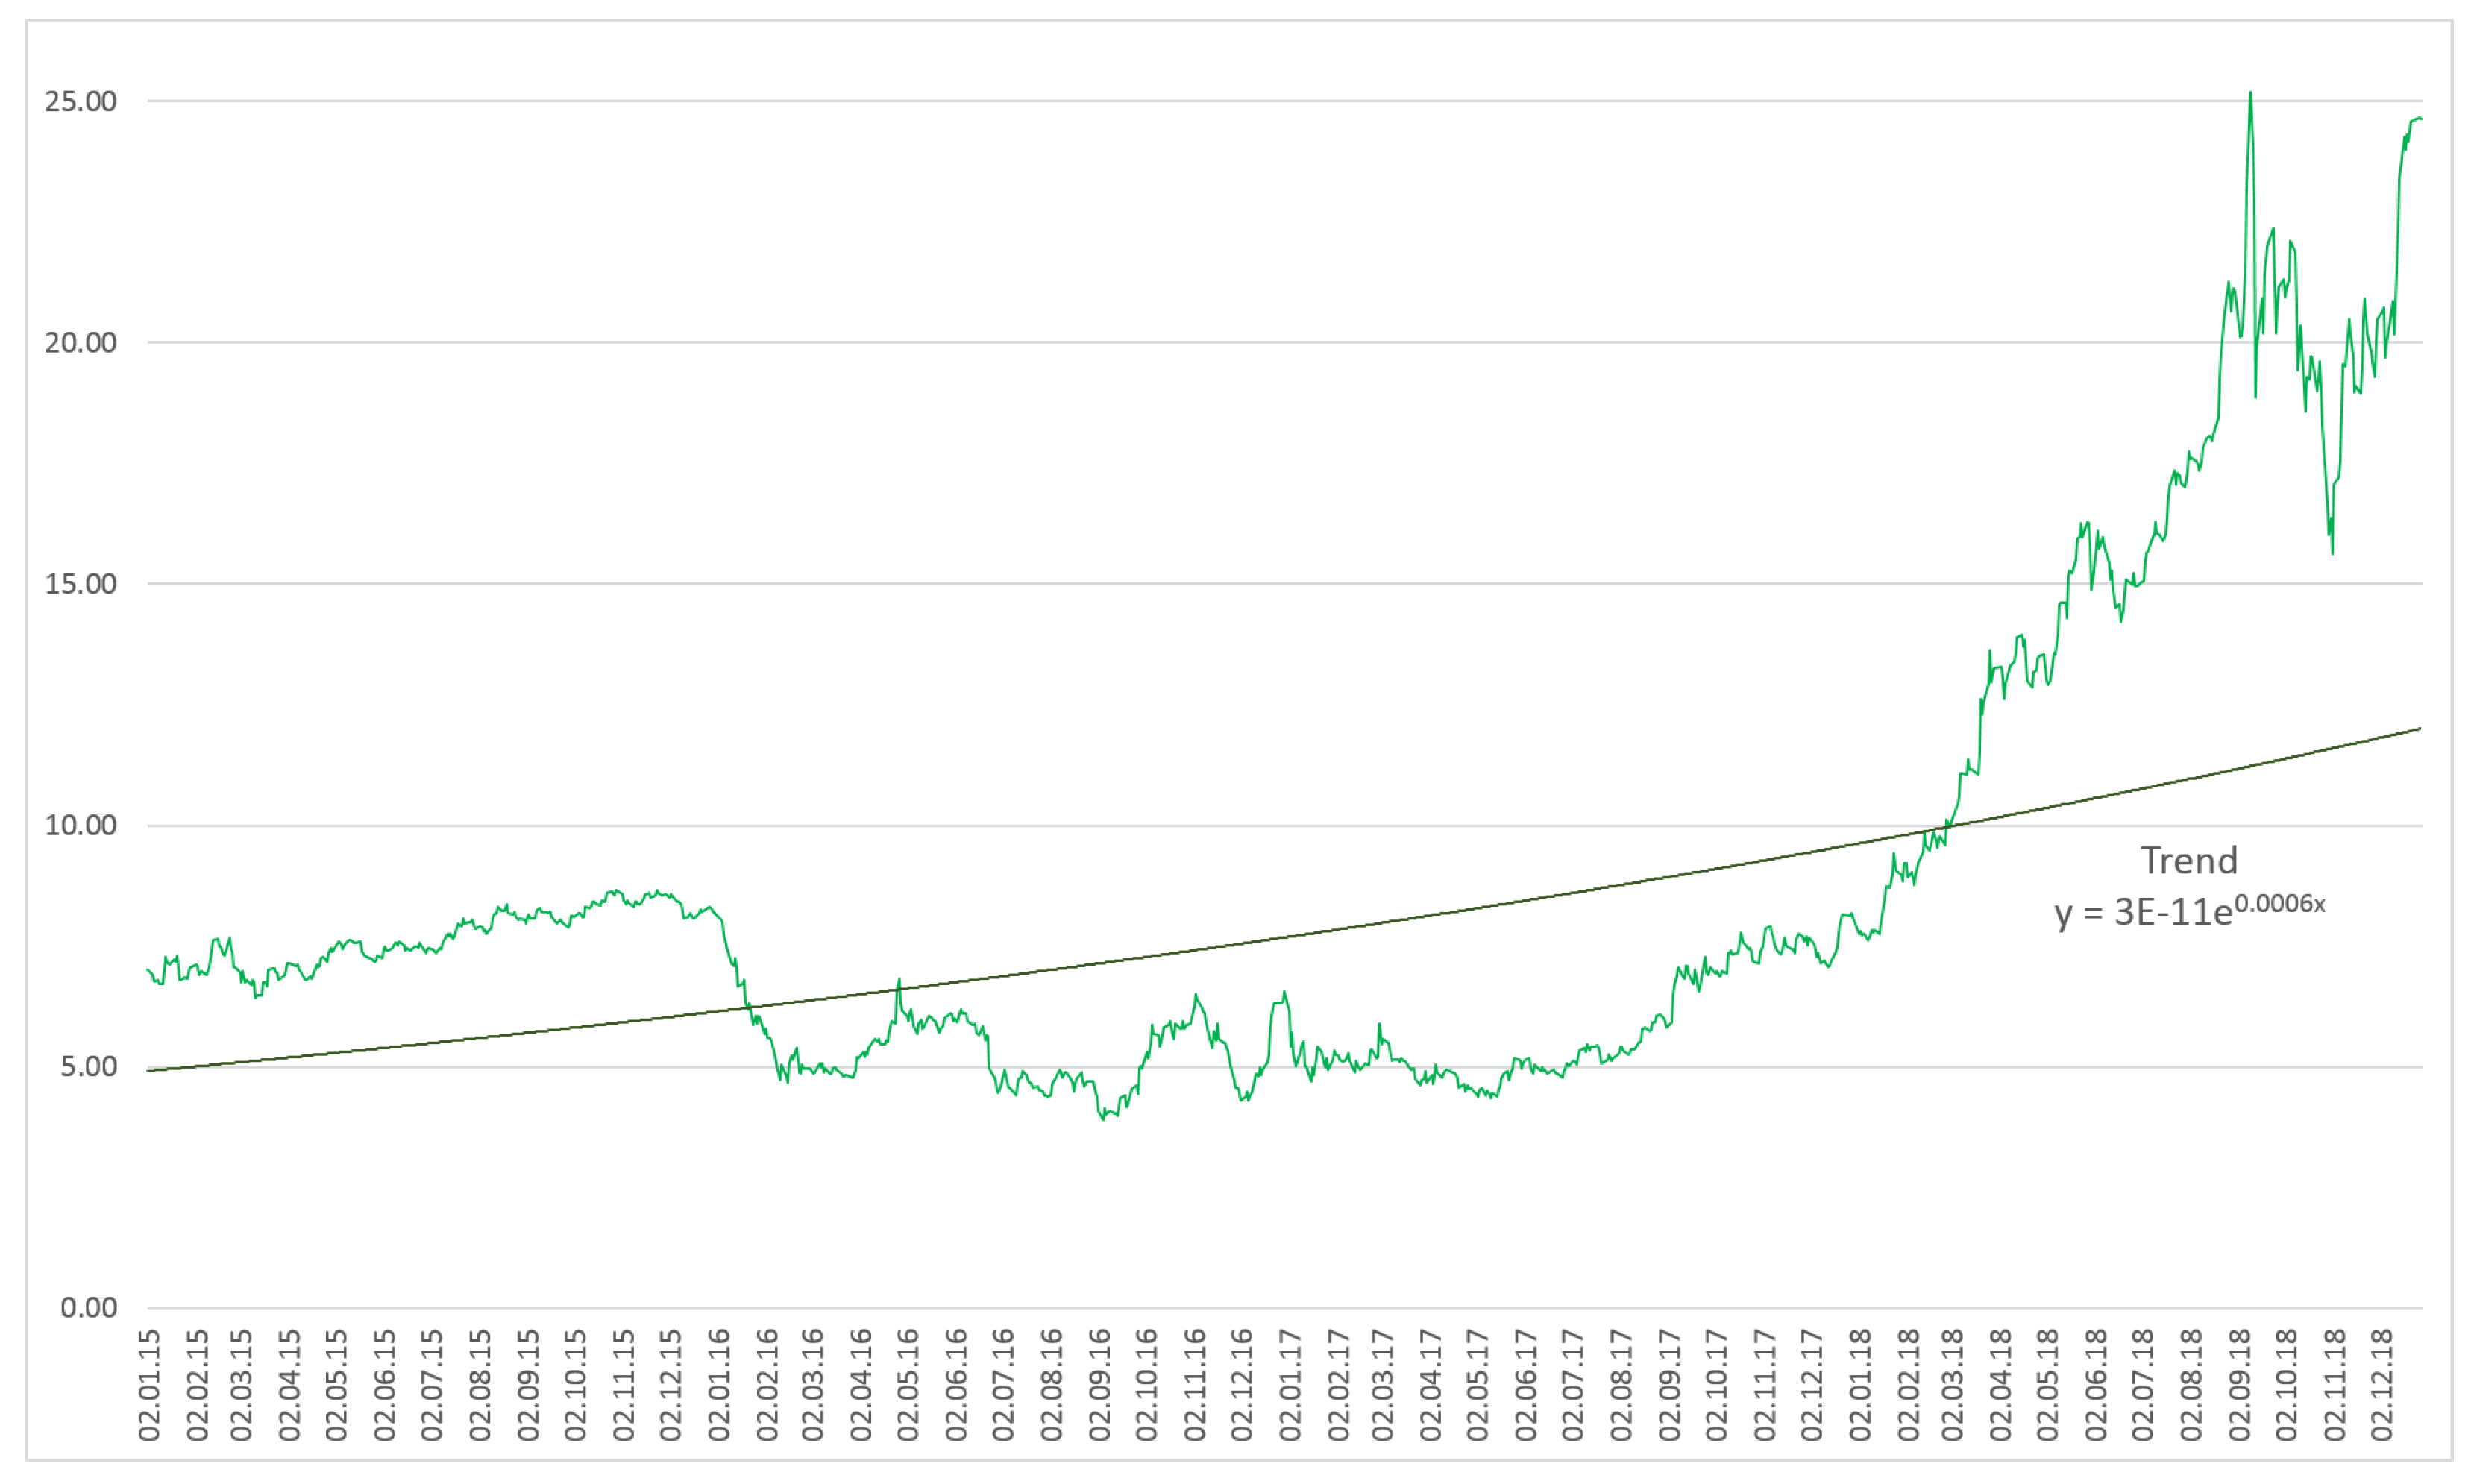
The further economic operation of wind power plants, especially onshore power plants after the expiry of EEG-subsidization, is doubtful. Lehmann et al. [16] compare the expected O&M costs (inclusive of increased repair costs of power plants at the beginning and towards the end of a so-called ‘bathtub curve’) of these power plants after 20 years with the average electricity spot price from the last few years. From this perspective, they conclude that a continued economical operation will no longer be guaranteed. Nevertheless, the authors ask how long the operation of renewable power plants should be continued in light of continuously increasing O&M costs. When is repowering of a power plant with lower long-term O&M costs the better decision? Moreover, Lehmann et al. [16] notice that the development of electricity and CO 2 prices can influence the competitiveness of existing renewable power plants but that this development is determined also by the political framework conditions for fossil power plants. Nevertheless, with the increase of CO 2 prices since mid-2017, a slight increase in electricity prices can be noticed (see Figure 3 and Figure 4), which can affect the profitability of renewable power plants traded on the spot market.
In the study of Quentin et al. [13], the authors ask the question: What is to be done with wind power plants after 20 years of subsidies? They consider three possibilities: repowering, continued operation, and decommissioning of these power plants. To analyze these options, the authors conduct a survey among the owners and operators of wind power plants in Germany. Repowering, in the field of wind energy, means the replacement of older turbines by more powerful and efficient ones, which make better use of the wind resources available at the site. In the past, the development was strongly influenced by the political conditions (concluded by Quentin et al. [13]) on the basis of questionnaire results, and the repowering potentials for the period up to 2020 are still very high. However, the implementation of repowering depends, in particular, on the planning and approval legislation, which must be admissible. Regarding the continued operation, an important basis for this decision is the future electricity price on the spot market vs. the future O&M costs. However, first, different permits for prolonged operation are necessary. The operators of the wind power plants are obligated to prove the construction permit, a permit foreseen by the Federal Emission Control Act (BundesImmissionsSchutzGesetz, BImSchG) and they have to test the specific type of turbines (individual tests after 20 years). These requirements impact, of course, the level of the future O&M costs of the power plant. In addition, the direct sales costs should be added to the future O&M costs [20]. The last considered option was that of decommissioning. According to the studies in the past, some of the old wind power capacities were already decommissioned and this option is always possible but may not make sense from a climate policy and economic point of view. Moreover, in this case, the operator can practically expect resale value minus decommissioning costs only.

2.2. Real Options Valuation for RES

Regarding market liberalization and the increase of market uncertainty, traditional project evaluation techniques (e.g., net present value or discounted cash flow analysis) are no longer sufficient to deal properly with risk and uncertainty in investment decisions also for the energy sector. The use of more sophisticated and more powerful project evaluation methods such as ROA thus becomes more relevant. Real options analysis is mainly inspired by the theory of financial options developed by Black and Scholes [21], Cox et al. [22], Merton [23], among others. Myers [24] was the first to describe the evaluation of non-financial assets applying option theory and to use the term “real option”. This theory was further developed by Brennan and Schwartz [25], Dixit and Pindyck [26], Pindyck [27], among others. The application of real options theory for the electricity market is mainly found in the context of electricity generation and investments into conventional as well as renewable power generation technologies.
Projects regarding electricity generation from conventional as well as renewable energy technologies have specific characteristics, such as irreversibility (the capital once used cannot be applied in other sectors or by different companies) and high level of uncertainty (associated with the liberalized electricity market), which impact the suitability of an investment evaluation method such as real options analysis [28]. Moreover, such investments may occur in a flexible time frame (i.e., the investor has a possibility to postpone the decision). Concerning all these characteristics, ROA seems to be the best approach to evaluate energy investments. A somewhat dated but useful and comprehensive review of the state-of-the-art in the application of ROA in the energy sector (for non-renewable as well as for renewable energy sources) is provided by Fernandes et al. [29]. The authors introduce the basic principles of real options theory and their common types and valuation methods, such as: partial differential equation modeling, binomial option valuation, Monte Carlo simulation and dynamic programming. Furthermore, the authors point out the considerable need for further research, and the application of ROA to renewable energy technologies. This can be found, for example, in Cesena [30] but also in Ioannou et al. [31], who investigate the impact of climate policy uncertainty on investors’ decisions for renewable energy technology projects. In a recent study, Kozlova [32] presents a critical review of the application of the real options approach for the renewable energy sector. Based on more than 100 academic papers, the author provides the main research focus and trends in the use of ROA for RES. Moreover, the results give a comprehensive picture of existing research and provide a foundation for further studies and developments in this field.
Li et al. [33] propose the real options model as a tool for evaluating investment in renewable energy technologies in China, and especially wind power plants. Considering the carbon price fluctuations, the model can help investors to find the optimal investment time and assess the volatility and risk of the renewable energy projects more precisely. Assuming that the renewable energy output is constant over the lifetime of the project, they find that the higher the carbon price and the fluctuation level, the more probable the decision to postpone the investment. Franzen and Madlener [34] propose the real options analysis for the step-wise investment in a hydrogen-based wind energy storage system (H2-WESS). They apply a binomial tree model to evaluate the development of the present value of the expected future cash flows for H2-WESS, which further are used in ROA. They also try to find out what additional revenues and costs are expected with the implementation of different storage systems for wind power plants and what is economically optimal from an investor’s perspective, especially in the situation where a liquid and transparent market for hydrogen does not yet exist. Optimal investment timing and sizing (capacity choice) of wind energy investment is investigated by Kitzing et al. [35]. These authors analyze offshore wind in the Baltic Sea and compare different support schemes (feed-in tariff, feed-in premium, and tradable green certificates). Using the analytical (closed-form) solution evaluation method for their real options model, they combine several correlated uncertainty factors into a single stochastic process. The authors find that the correlation between the underlying stochastic factors affects investment incentives and that this model can help investors to make better investment decisions, and policy makers to design better renewable energy support systems and to develop tailor-made incentive schemes. Applying a binomial tree model and taking into account local renewable energy regulations, Loncar et al. [36] investigate the potential investments in onshore wind power plants in Serbia. They examine a multi-phased compound path-dependent real option consisting of mutually exclusive options: to invest, expand, repower, contract and abandon. The results show “… that the proposed sequence of options increases project value by transforming higher risk and lower returns in the initial DCF model to lower risk and higher returns in the RO model” [36] (p. 366).
Regarding solar photovoltaics (PV), the optimal investment timing for such a project in China is investigated by Cheng et al. [37]. The authors examine the investment behavior for different market systems and support schemes. Applying real options models for the designed four different scenarios, they find that electricity market reform enhances the deferral option’s value, especially in the short term. As a consequence, the owners of solar PV projects postpone their investment. The authors show how the investments can be stimulated by the implementation of appropriate support schemes. Zhang et al. [38] also apply ROA for investments in solar PV, trying to find the optimal feed-in tariff level for this technology in different regions of China. For the analysis, the authors use a backward dynamic programming algorithm in combination with Least-Squares Monte Carlo simulation. As a result, they find a discrepancy in the calculated optimal levels of the feed-in tariffs in different regions and make some policy suggestions on how to improve the subsidy system and increase the attractiveness of the investments in the PV technology. Moon and Baran [39] propose a real options model for determining the optimal investment time for residential PV systems. The authors conduct not only a theoretical analysis but also case studies, and they find that the optimal waiting time for substantial PV investment in smaller PV systems is longer than that for larger systems. The case studies were undertaken in different countries, such as the United States, Germany, Japan, and South Korea, showing that in all countries considered except Germany the decision to invest should be postponed. The perspective of power generation enterprises in China regarding the investment value for PV systems under carbon market linkage is analyzed by Tian et al. [40]. In the proposed real options model, those authors consider uncertainties in investment costs (with market co-movements), electricity prices, carbon prices and subsidy payments, and use a geometric Brownian motion process to describe their movements. The results show that the enterprises should give up the investment or delay it until better market conditions prevail. Moreover, for continued investment in PV generation, subsidies are necessary.
An interesting study is also Gazheli and van den Bergh [41]. The authors investigate simultaneous investments in two different renewable energy technologies, namely wind and solar PV. In their real options model, they incorporate uncertainty about future electricity prices, and uncertainty about the speed at which learning drives down the costs of wind and solar electricity. The authors observe that the learning rate affects the option to invest, i.e., more learning stimulates earlier exercising of the option. Furthermore, they find that investments in both technologies may be profitable under particular conditions of price and cost uncertainty, but that the optimal strategy is to invest only in one of them. Moreover, they give a short overview of studies where ROA was applied to RES (solar PV, wind and hydro) in different countries by applying different evaluation methods (i.e., simulation, partial differential equation and tree approach). In another study, Ritzenhofen and Spinler [42], using ROA, aim at analyzing the impact of changes in public support schemes for RES on investment behavior. Moreover, they provide some insights for investors regarding the optimal investment time and for regulators with regard to support policy and changes in it. The authors show that changes in a sufficiently attractive policy support regime only have a little impact on investment decisions in RES but that a switch to the free-market regime can change investors’ behavior dramatically. Investments are postponed or abandoned when the base-load electricity futures market prices are lower than 50% of the subsidy level.
The studies mentioned in Section 2.1 have a static character and compare expected costs with expected electricity prices when the future of existing RES power plants is discussed. The application of a real options model for RES, as presented in Section 2.2, considers mostly the option to invest in renewable energy technologies rather than their future after expiry of their operational lifetime and the end of their received support. The proposed model in this paper helps to at least partly fill the existing gap in the literature and also in the decision-making process. Moreover, the model can assist power plant owners and operators with their decision-making under uncertainty, regarding electricity price and uncertain support policy. The importance of such models and studies is justified by changing the policy support system and the necessity to improve the decision-making process by using more sophisticated modeling than usual.

3. Methodology

On the one hand, real options theory is still to be seen as an innovative tool in capital budgeting. On the other hand, it is already well established and finding increasing application also in the energy sector. Over the last 40 years the evaluation methods developed for financial options have been successfully applied to evaluate real assets, too (with some caveats). As mentioned in Section 2.2, the valuation methods such as partial differential equation modeling, binomial option valuation, Monte Carlo simulation and dynamic programming can be distinguished. These evaluation methods can be categorized as analytical approximation techniques, comprising dynamic programming and contingent claims, and numerical methods such as tree-building methods or simulations needed to approximate the solution to the partial differential equation. Regardless of the kind of option (i.e., European or American), the binominal tree approach developed by Cox et al. [22] is a simple and efficient method that allows the holder of an option to decide whether it is most beneficial to exercise the option or to wait until its maturity date. Regardless of some losses in terms of precision compared to the Black–Scholes model in practice (asymptotically—for infinite resolutions—they yield equivalent results), the results obtained with the binomial approach are often found sufficiently accurate, easy to illustrate, and the option of graphical representation improves model transparency and accessibility [43].
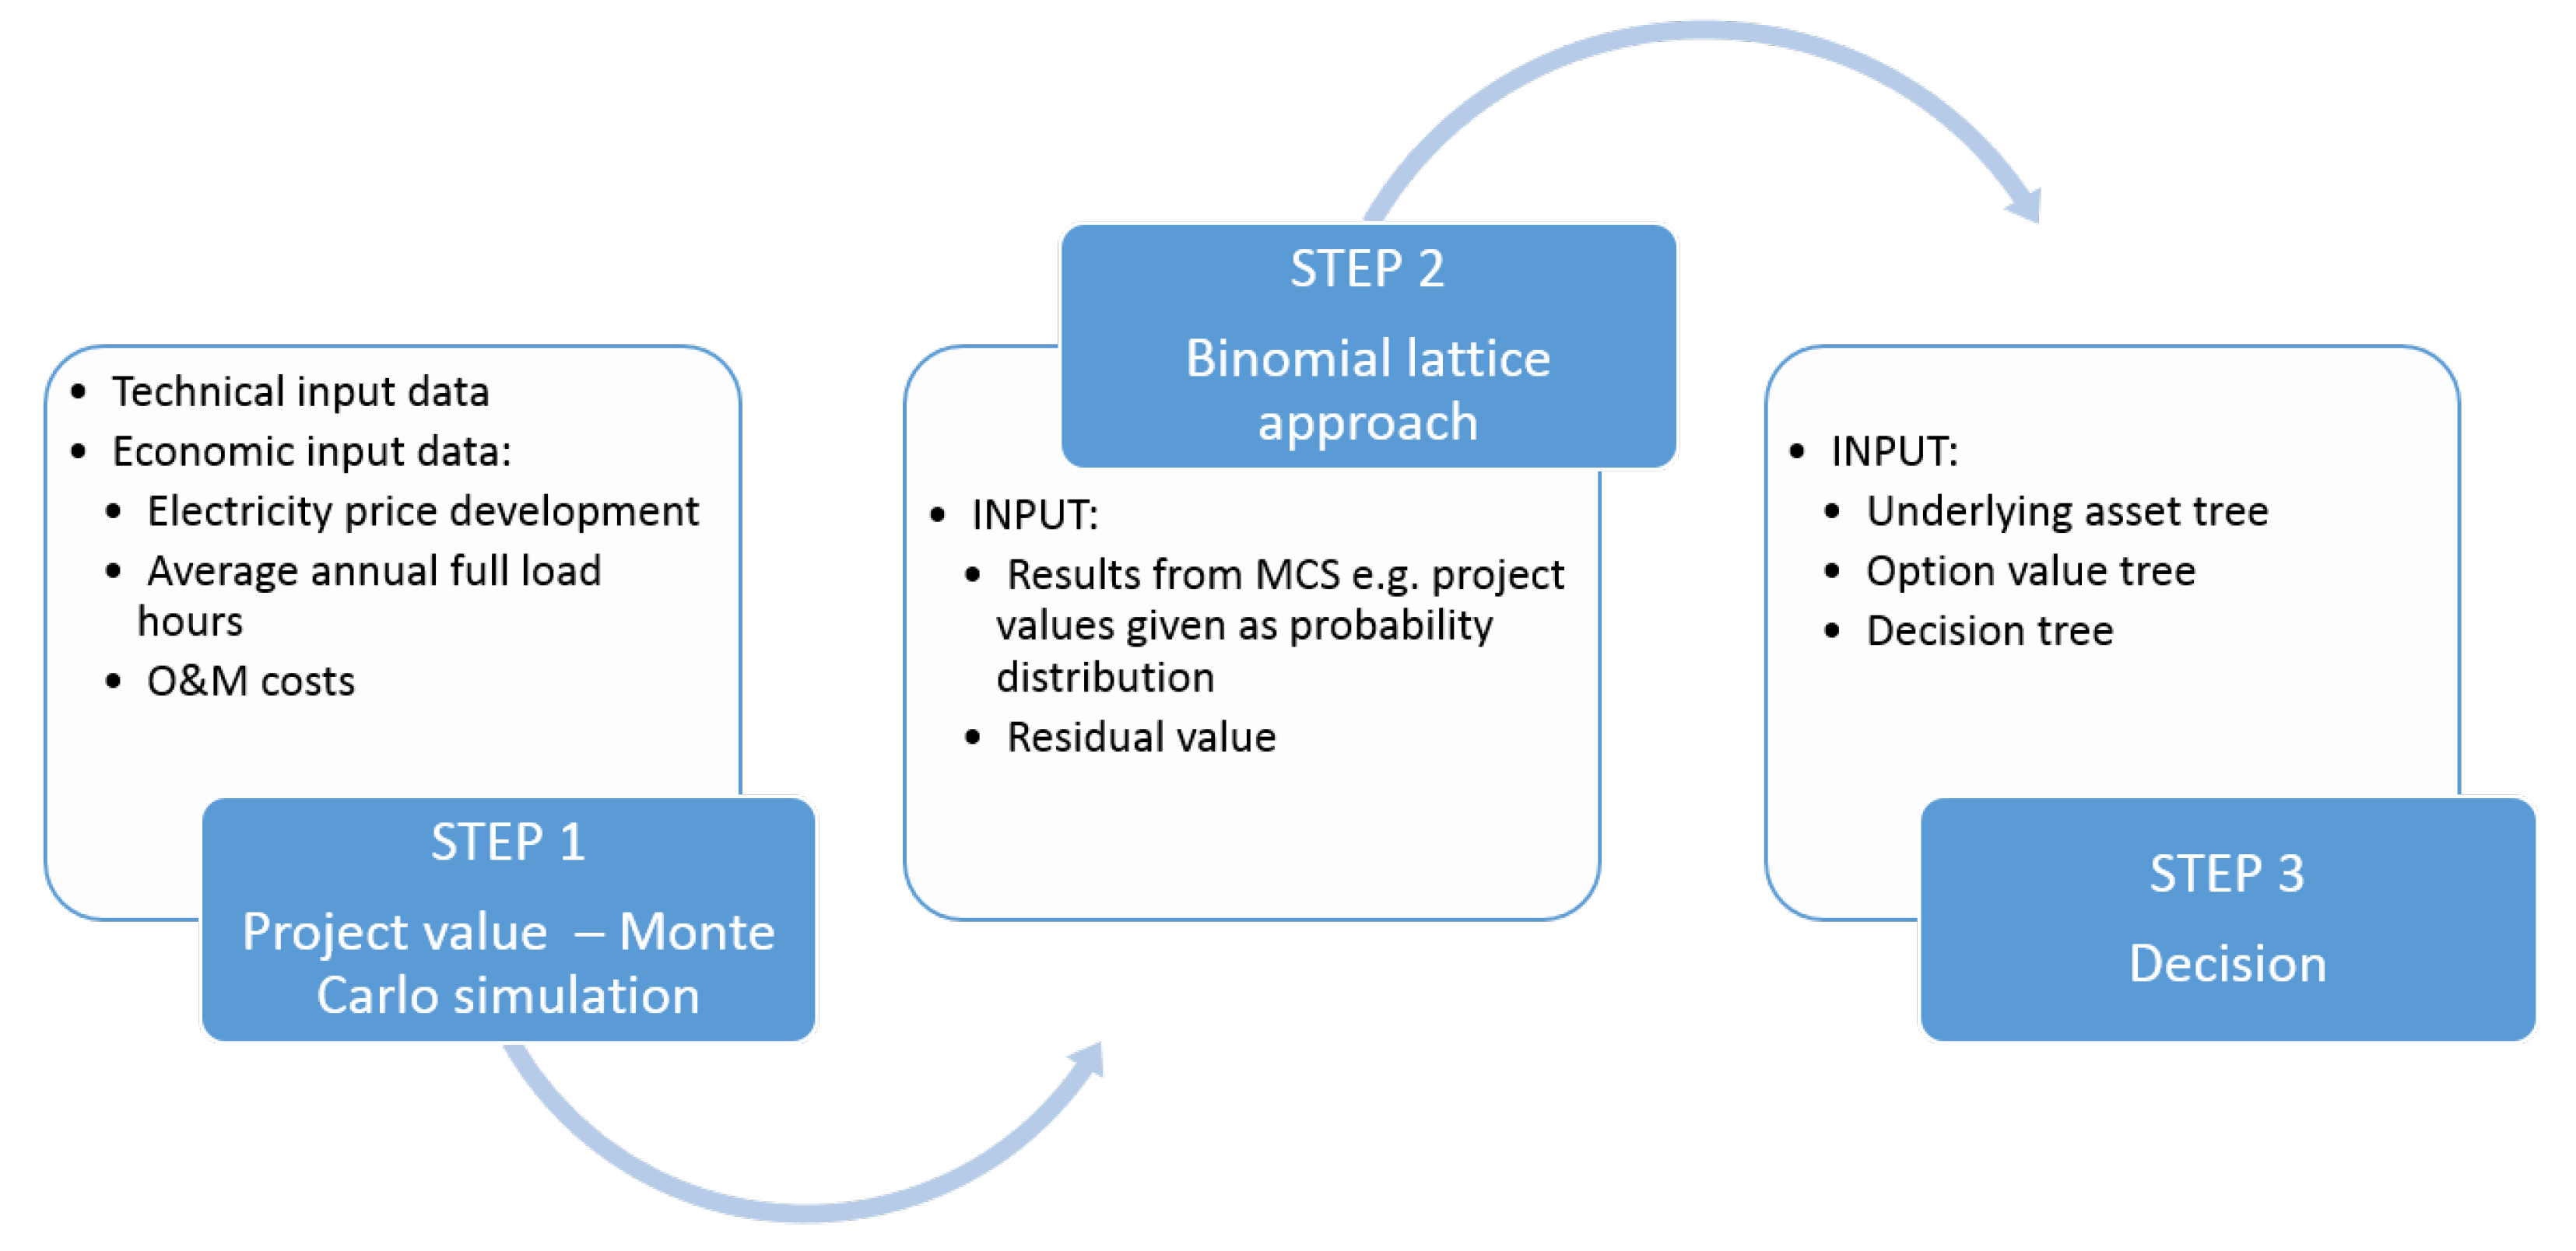
In the proposed model, we combine the binomial lattice approach for real options analysis with Monte Carlo simulation (see Figure 5).
Initially, the project-specific quantities (e.g., project values) are calculated using Monte Carlo simulation (step 1). The binomial tree approach (step 2) uses as a starting point an underlying asset (present value of the expected future cash flows), which undergoes a specific development given as a probability distribution. From the obtained tree for the underlying asset, the tree for the option value and decision can then be calculated and used to make the decision, i.e., to exercise the option or not (step 3).
Considering different types of projects and decision situations, ROA offers different types of options (e.g., to invest, abandon, expand, contract, shut down, switch, etc.) with respect to the project specification and managerial actions which have to be undertaken. In the following analysis, we propose to combine the option to choose between the continuation, abandonment or expansion of the project (here: RES power plant).

3.1. Project Value for RES Power Plants

The project value ( V t ) for each year of operation is simply given as:
V t = t = 0 T R t O M f i x e d , t ( 1 + W A C C ) t ,
where R t denotes the revenues obtained from electricity generation from RES at time t, O M f i x e d , t are the fixed operation and maintenance costs at time t, and the WACC (weighted average cost of capital) is used as the discount rate. The expected lifetime of the project is T years.
By calculating project values for RES, the determination of the revenues is connected with the uncertain development of the electricity price and power generation.
The price of electricity as a special commodity underlying reveals properties such as: high persistence to its long-term average level (mean-reversion), high volatility, seasonal patterns, price jumps and regional differences. To capture all these characteristics, different models for the electricity price development are proposed, e.g., the widely used geometric Brownian motion (GBM) model, the arithmetic Brownian motion (ABM) model, the mean-reverting proportional volatility model, the Ornstein–Uhlenbeck or the geometric Ornstein–Uhlenbeck model (for more information, see e.g., He [44]). Moreover, the choice of the appropriate modeling method depends on different factors, e.g., the complexity and nature of the research problem, availability of the data set, or prediction accuracy. A comprehensive and useful overview of different methods and the direction of future research in the field of electricity price forecasting can be found in Weron [45]. Debnath and Mourshed [46] point out that, besides the statistical methods, the machine learning approaches have recently become increasingly popular. The ABM model represents the simple one-factor model, which captures very well the randomness of the electricity prices. Moreover, the ABM model offers an alternative to the standard GBM (often used in ROA), especially when the values of the electricity prices become negative [47]. Negative electricity prices have emerged on the European Energy Exchange (EEX) since 2010, see [48].
Using the ABM model for modeling the electricity price, it is assumed that the electricity spot price follows a Brownian motion process, i.e., a continuous-time random walk. For the long-term evolution of the electricity price [49], an ABM process at time t ( S t ) is defined as:
S t = S t 1 + α d t + σ d Z t ,
where α (drift) and σ (volatility) are constants, Z t represents a standard Brownian motion process at time t, d t is the time increment and d Z is a Wiener process.
The second uncertain parameter in the revenue calculation from an RES project is the annual energy production from wind and PV power plants. Regarding renewable energy technologies, this depends on the location of the power plant as well as the wind speed and solar irradiation, respectively, and has to be determined separately for each individual location and plant. The energy yields for wind parks and PV power plants correspond to a maximum and minimum value of the average annual full-load hours for these two technologies combined in different regions.

3.2. Binomial Lattice Approach

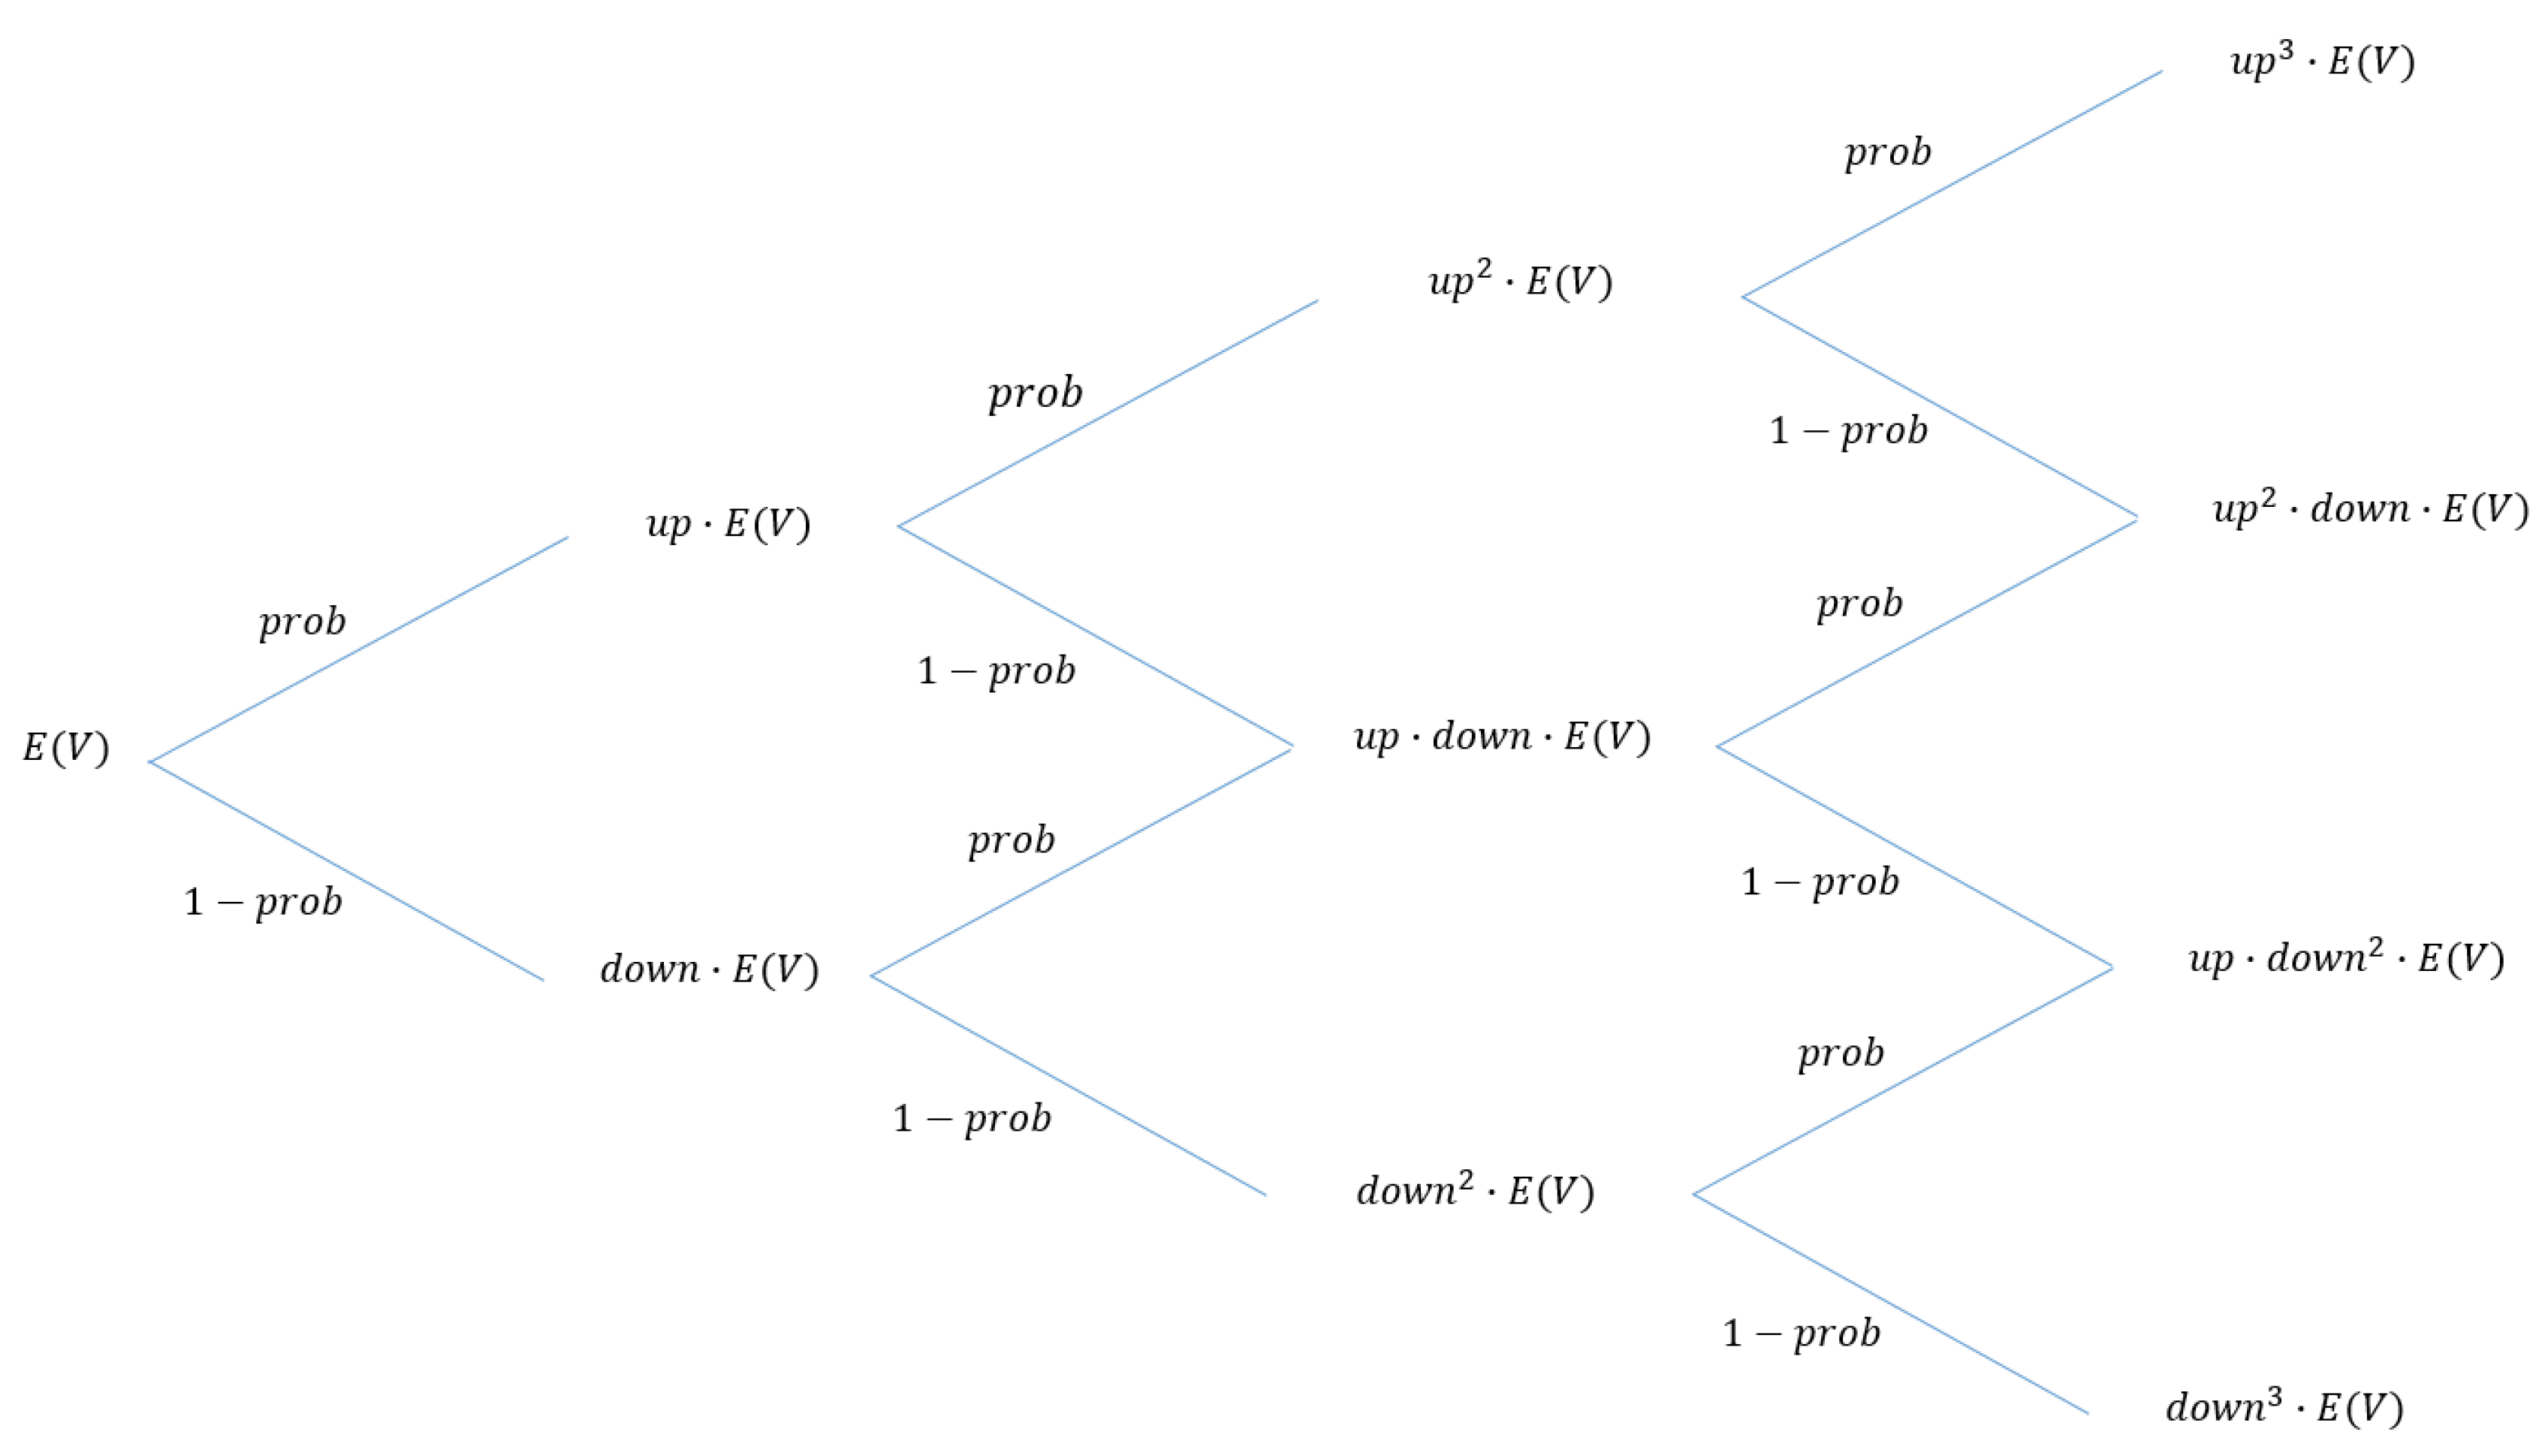
The binomial tree approach, i.e., a valuation method of real options in which the decisions are binary, can be seen as a special case of dynamic programming. This model uses a discrete time framework where the underlying variable varies (goes up and down by a specific multiplicative factor) via a binomial lattice (tree), for a given number of time steps between valuation date and option expiration. Nevertheless, some assumptions regarding the expected project value (underlying asset), whose distribution parameters are obtained from a Monte Carlo simulation (step 1), are necessary.
First, following the method of Cox et al. [22], we assumed a normal distribution of the expected project value; the “up” and “down” movement parameters are defined as:
u p = e ( σ Δ t ) and d o w n = e ( σ Δ t ) ,
where σ denotes the associated volatility and Δ t the incremental time. Figure 6 illustrates the binomial lattice valuation method.
Second, it is assumed that the investors are risk-neutral and that the “up” and “down” movements occur with probabilities p r o b and ( 1 p r o b ), respectively, which take the value between 〈0,1〉 and sum up to unity. Because in ROA the values of the underlying asset are very often non-traded, the adequate formula for the p r o b value calculation in such a situation is given as:
p r o b = K d o w n u p d o w n ,
where K is the risk-adjusted growth factor of the non-traded underlying asset (cf. [50], pp. 33–38).
Furthermore, using the binomial lattice of the underlying asset and backward calculation, the option value tree (binomial lattice with option value) can be defined. The calculation begins at the last period ( t = T ), and the option value for each time is equal to the maximum between the continuation value, abandonment (disinvestment) value, or expansion (repowering) value, i.e.,
O V t = m a x C V t ( continuation value ) , A V t ( abandonment value ) , E V t ( expansion value ) ,
where
C V t = V t for t = T , V t = p r o b · V t + 1 , u p + ( 1 p r o b ) · V t + 1 , d o w n e r f · Δ t for t = T 1 , T 2 , , 0 ,
A V t = D i s i n v e s t m e n t F a c t o r · I n v C o s t s ,
E V t = E x p a n s i o n F a c t o r · V t E x p a n s i o n C o s t s .
V t + 1 , u p and V t + 1 , d o w n denote the project’s present values after an “up” or “down” movement in the subsequent time period t + 1 , respectively, and r f the risk-free interest rate. The D i s i n v e s t m e n t F a c t o r in Equation (7) is related to the technology and the E x p a n s i o n F a c t o r in Equation (8) is the difference between the expected power plant value after repowering. A similar procedure using ROA was developed and used for conventional gas- and coal-fired power generation technologies and their flexibility (for more information, see [14]).

4. Case Study

In our case study, we analyze existing RES power plants in Germany for which public policy support will expire in the next years. The wind power generation technology will be mainly affected in the coming years. Based on the analysis by the Institute of Power Systems and Power Economics (IAEW) at RWTH Aachen University, in the year 2020, almost 4 GW of wind power plants will leave the subsidy scheme, and, in the following years 2021 to 2025, between 1.8 and 2.3 GW per annum (see Figure 7a). Regarding PV systems, the share of subsidy expiration rises until 2025 and beyond (see Figure 7b). Lower overall installed capacity of biomass power plants in comparison to onshore wind and PV leads to less biomass units leaving the subsidy scheme (see Figure 7c). Moreover, the new policy regulation [11] still accords existing biomass power plants a dominant position (see Section 2.1).
When analyzing onshore wind power technology in our case study, we consider five different wind parks which will leave the subsidy scheme by 2021. The power plants are located in different federal states and have different installed capacities. Two of them are located in Saxony-Anhalt and were commissioned in 1999 with installed capacities of 10 and 94.5 MW, respectively. The other two wind parks were commissioned in 2000; one is located in Brandenburg with 4 MW of installed capacity, another one in Lower Saxony with 34.2 MW of capacity. Moreover, we have chosen one older wind park located in Lower Saxony and commissioned in 1993 with 44.5 MW of installed capacity and which is still in operation. Although the first PV systems will leave the subsidy scheme only in 2025 and later, we also analyze three PV power plants in our case study. Analogously to the onshore wind technology, the analyzed PV power plants are located in different federal states, i.e., two of them are based in Saxony and one in Saxony-Anhalt; they were commissioned in different years and have different installed capacities (see Table 1).
The economic parameters for onshore wind and PV power plants needed for the analysis can be found in Table 2. Note that O&M costs of wind power technology (presented in Table 2) consist not only of maintenance and repair costs, but also of lease payment, insurance policies, reserves and other operating costs. The cost levels are caused by the operation year of the power plant, which means that some of the costs are higher when the power plant is operated beyond its technical lifetime of 20 years, whereas other costs, such as reserves, are no longer necessary. Additional costs for the operation period after 20 years are direct marketing costs and costs for technical expertise [20].
The potential further operation of existing onshore wind and PV power plants is set to a duration of five years after public policy support expiration (this assumption follows the study of Quentin et al. [13]). Without the policy support scheme, the generated electricity will be sold directly on the energy exchange. We evaluate the electricity price using an ABM process (as introduced in Section 3.1). The time series applied for the evaluation are hourly electricity spot prices from 1 January 2015 until 31 December 2018 (from EEX). Furthermore, the electricity output by onshore wind and PV power plants is given as a probability distribution of the average annual full-load hours for wind energy and solar power for the last few years for each analyzed state [57].
Regarding terminology, note that “repowering” in Germany refers to the complete replacement of older wind power plants with modern, more efficient ones. In contrast, in other countries, repowering often refers to the fundamental renewal and modernization of existing wind turbines with the replacement of essential components. Thus, in our model, repowering is considered as a new investment. This enables, based on the constant further development of technologies in recent decades, to triple the estimated wind power yield at repowered sites and a doubling of the rated output [58]. We assume that by the repowering the installed capacity of the power plants increased by 75%, which also means that the ExpansionFactor in Equation (8) is equal to 1.75. The generated electricity, in this case, is assumed to be sold directly on the power exchange, just like for the case of a further operation of the existing plant.

5. Results and Discussion

Using the proposed methodology and analyzing the RES power plants introduced in Section 4, the project values for five onshore wind and three PV power plants were simulated by applying the Crystal Ball software (version 11.1, ORACLE®, Redwood City, CA, USA). The simulation results were used further to determine the binomial lattice for the underlying asset (project value) and option value. In the last step of the proposed procedure, the decision about further electricity generation, abandonment of the operation, or repowering, was undertaken according to Equation (5).
Regarding onshore wind power plants and assuming a 5-year period for the further operation after the expiration of the public policy promotion, the decision about the continuation of electricity generation can be undertaken for all analyzed onshore wind power plants when the O&M costs are at the lower (1.81 €-ct/kWh) and mid (2.74 €-ct/kWh) level despite the level of the abandonment value (see Table 3). In the case where the O&M costs are at the higher level (3.67 €-ct/kWh), the further operation of these power plants should be stopped for both considered levels of the abandonment value. These decisions (to continue or abandon electricity generation) should be undertaken immediately, i.e., in the first year after the EEG levy expiration. The option to re-power these existing power plants for further operation with the option to sell the generated electricity at the spot market is found to be non-profitable (negative project values).
From Table 3, it can be noticed that the size of the possible market potentials of onshore wind power plants without EEG policy support depends on the level of the O&M costs.
As soon as permission for the further operation is granted, and all individual technical tests for structural stability of the power plant are positive, the subsequent continued operation can be longer than the typical expected five years proposed, such as in the study of Quentin et al. [13]. For the power plant owners, it can mean more profit at small costs. Table 4 presents the results obtained when the prolonged operation is 10 years instead of 5. In the first five years, the clear decision to continue the generation is reflected in the results presented in Table 3 (for lower and mid-level O&M costs). Considering the operation year number six after the EEG levy expiration and beyond, the situation changes. Here, the decision to continue can be taken with decreasing probability with every year of further operation. The results presented in Table 4 are the same for all analyzed onshore wind power plants, both residual values taken into consideration, and 1.81 €-ct/kWh and 2.74 €-ct/kWh values for the O&M costs. This is connected with the probability value for the “up” and “down” movements given with Equation (4) and the obtained decision (continue or stop) in each year of the possible further operation considered in the analysis. For O&M costs of 3.67 €-ct/kWh, the decision is always to stop generating electricity.
Regarding the PV technology, three PV power plants with two different levels of O&M costs and one level for the abandonment value (see Table 2) are analyzed. For the O&M cost level of 33 €/kW per annum and an abandonment value of 5% of the new investment costs, the simulation results are presented in Table 5. In contrast to the results obtained for onshore wind power plants, only in the first year after the EEG levy expiration is the decision definitely to continue electricity generation. For the next four out of the assumed five years of possible further operation after the EEG levy expiration and additional five years (i.e., assuming 10 years of possible further operation), the decision regarding the continuation of the operation is supported by a probability which decreases with the increasing number of years. For O&M costs of 2.5% of new investment costs, the decision is always to stop electricity generation for both the five and ten years after the EEG levy expiration.
Thus far, the analyzed parameters which definitely bias the decision about the operation of RES after expiry of the policy support schemes are the level of the O&M costs and the length of the further operation time. Nevertheless, the most important profitability indicator and source of uncertainty is the electricity price. In the methodology applied, the ABM process was proposed in order to reflect the stochastic character of the electricity spot prices. With the presented results in Table 3, Table 4 and Table 5, the electricity prices were simulated using an ABM process where the historical time series of the hourly electricity spot price from 1 January 2015 until 31 December 2018 from the electricity exchange (EEX) in Leipzig was applied. The simulated electricity prices were parametrized by a logistic probability distribution with a mean value of 34.53 €/MWh and a scale factor of 8.64 €/MWh.
Trying to analyze the impact of different electricity price scenarios on the possible decision and profitability of RES after EEG levy expiration, the spot market electricity price simulation conducted by the Institute of Power Systems and Power Economics (IAEW) at RWTH Aachen University was also applied to the presented case study. In this scenario, the simulated electricity prices were parametrized by a logistic probability distribution with a mean value of 47.23 €/MWh and a scale factor of 4.06 €/MWh. The results of this analysis for the onshore wind power plants are presented in Table 6. Here, despite the O&M costs level and abandonment value in the assumed five years’ operation period after the EEG levy expiration, the decision to continue should be made for all five onshore wind power plants (the probability to continue is equal to 1—see the first row in Table 6). This already shows some differences from the results obtained in the first analysis and presented in Table 3 and Table 4. Moreover, also in operation year number 6, the decision to continue is valid for all analyzed wind power plants with a low level of O&M costs and both abandonment values (Table 6, second row and second column) as well as for mid-level O&M costs and a lower abandonment value—AV2 (Table 6, second row and fourth column). In the next years of prolonged operation (7 until 10), the probability value for the decision to continue decreases with increasing operation years (similarly to the results presented in Table 4). The significant difference from the previous analysis can be observed for the O&M cost level of 3.67 €-ct/kWh. In the first analysis, the decision for this O&M cost level was to stop operation despite the abandonment value (see Table 3 and Table 4); in the second analysis, the decision was to continue for the first five years of extended operation and, with decreasing probability, for the years 6 until 10 (Table 6, column five).
Regarding the PV technology, the results obtained for the electricity price simulated by IAEW are the same as those obtained in the first analysis (Table 5). It means that, to make the further operation of PV power plants more profitable, the electricity price at the spot market should definitely be higher than the values for the time period studied.
Another source of uncertainty implemented in the project value simulation is the electricity output of onshore wind and PV power plants. This output depends on wind speed and solar irradiation, which both vary by region and power plant location. Although the analyzed onshore wind and PV power plants are located in different federal states of Germany, the electricity output determined by the average annual full-load hours for wind energy and solar is similar.
A short sensitivity analysis regarding this stochastic parameter reveals that, if the probability distribution of the average annual full-load hours for wind energy and solar irradiation is comparable, the installed capacity and the location of the power plant do not matter (i.e., the mean value and standard deviation of the project value after the simulation are almost the same). Comparing the power plants from the same federal state, it can be noticed that the mean value and standard deviation of the project value after the simulation are also almost identical, regardless of the installed capacity. Table 7 summerizes the results obtained in the case study regarding the impact of different parameters on the decision to continue or stop the further operation of the existing power plants.

6. Conclusions and Policy Implications

The feed-in tariff policy in Germany was widely used to promote the development of renewable energy. Nevertheless, regime changes in the RES support schemes (from feed-in tariffs to market premium and direct marketing to capacity auctioning and pay-as-bid-based premia for larger-scale assets), including siting restrictions, also change the rate of (net) increase in RES capacities installed. Moreover, the public policy support schemes have often been limited to the expected lifetime of the power plant. With the reached lifetime and expiration of the support scheme, continued operation of many RES power plants (especially onshore wind) is questionable. From a technical point of view, the further operation is possible, but the profitability of the power plants whose generation output should be sold on the electricity exchange is not clear. Moreover, regarding the turning-off of many RES power plants, the achieving of the aims of the Energiewende could be a problem if suddenly more RES power plants (in terms of installed capacity) are switched off than new ones commissioned. This can put the Energiewende at Risk.
Different studies, mentioned in Section 2.1, have tried to discuss this topic and to analyze which options of further operation are possible and which requirements (especially regarding the comparison between the future costs and revenues) have to be fulfilled. They mentioned, for example, the combined use of RES with storage systems (see e.g., Franzen and Madlener [34]), or with other conventional technologies (e.g., Pless et al. [59], observe synergies between natural gas and renewable energy technologies in the US energy system, the results of which show that the hybrid system of natural gas and renewable energy technologies is more favorable in comparison to the single one).
In contrast to these studies, we propose the use of ROA in order to support the decision-making process regarding the following three possibilities: (1) to continue the operation without public policy financial support (here: feed-in tariffs), (2) to stop operation, and (3) to repower the existing power plant with the sale of electricity also at the spot market. Here, it is possible to analyze all economic parameters, also with their stochastic character, which impact the revenues and profitability of the existing RES power plants. In the analysis conducted, we consider different levels of O&M costs as well as different abandonment values. As our results show, the level of the O&M costs is one of the more significant factors impacting the decision to repower the power plant, to continue or to stop the electricity generation. An important profitability factor and source of uncertainty is also the electricity price at the spot market. Its development in different scenarios (given by the probability distribution) affects the decision about the possible options. For higher levels of the future electricity price, higher revenues are expected and thus an increase also of the profitability of the RES power plant. Regarding these two parameters, it should be noted that the sufficient spread between the level of the specific O&M costs and the electricity price development makes the operation of a RES power plant profitable and enables continued generation. Furthermore, the profitability of RES power plants such as wind and PV depends on the weather conditions (i.e., wind speed and solar irradiation), which brings more uncertainty into the model. In our model, this is simplified. We apply the average annual full-load hours for wind energy and solar PV for different locations and use the probability distribution of the annual full-load hours to evaluate their development.
The proposed approach (1) extends the knowledge from previous studies (which have favored a more static analysis) regarding possible options for RES which, in the next few years, will lose public policy support; and (2) offers a simple decision support tool but still considers different stochastic parameters. Nevertheless, the model parts connected with repowering and abandonment still need some improvements. In addition, an improved estimation of power generation output in different locations can enhance the model results.
With regard to the conducted analysis, the stabilization of the spot market electricity prices above the current level, but also innovative marketing models, could be used to contribute to the further use of climate-friendly technologies such as wind and solar beyond their originally envisaged lifetime. This can help also to achieve the main aims of the German sustainable energy transition (Energiewende), which has been seen as an important model and testbed by many other countries worldwide. For example, in the European Union (EU) alone, 18 Member States use FIT schemes (similar to the German system) which guarantee the premium for a period of 10–20 years (for more information, see [60]). Those policy support instruments should help to achieve not only national goals regarding the electricity generation from renewable energy sources, but also the EU renewable energy targets2030 (32% overall share of energy from renewable sources, 14% energy from renewable sources in transport, cf. [61]). Nevertheless, in many EU countries, the revisions of single policy instruments over the last few years have been mostly related to the FIT scheme, aimed at ensuring that the financial support complies with the changing economic and market conditions. This need has been triggered by the significant cost reductions in renewable energy technologies (e.g., requiring reductions of FIT rates for PV for the new installations) and the decrease of subsidies through more competitive support schemes (e.g., the introduction of competitive capacity bidding processes e.g., for wind power plants) in a number of European countries [62]. From this perspective, the proposed model can support the decision-making process of firms and policy-makers alike in countries facing the problem of further operation of RES power plants after expiration of the support scheme.
Author Contributions

The authors conceived the real options model for the decision-making process considering continuation of further operation of RES power plants. The authors applied the model to selected RES assets in Germany and wrote the paper together using the Crystal Ball software.

Funding

The authors gratefully acknowledge the financial support provided by E.ON SE, Project B02—Enhancing the Revenue Potentials of Distributed Renewable Energy Power Generation Assets.

Conflicts of Interest

The authors declare no conflicts of interest.

Appendix A. Development of the Feed-in Tariffs for Onshore Wind, PV and Biomass Electricity According to EEG

Table A1. Development of EEG remuneration for onshore wind power plants.
Commissioning
from
Initial
Remuneration * [€-ct/kWh]
Basic
Remuneration [€-ct/kWh]
Source:
Erneuerbare-Energien-Gesetz (EEG)
Apr 200017.80 Pf ** 31 March 2000 (EEG)
Jan 200217.53 Pf **
Jan 200317.27 Pf **
Jan 200417.01 Pf **
Aug 2004 5.5021 July 2004 (EEG 2004)
Jan 2005 5.39
Jan 2006 5.28
Jan 2007 5.18
Jan 2008 5.07
Jan 20099.205.02
Jan 20109.205.02
Jan 20119.114.97
Jan 20128.934.87
Jan 20138.804.80
Jan 20148.664.72
Aug 20148.904.9522 July 2014 (EEG 2014)
Jan 20168.864.93
Apr 20168.814.90
Jul 20168.774.88
Oct 20168.724.85
Jan 20178.384.6622 December 2016 (EEG 2017)
Mar 20178.294.61
Apr 20178.204.56
May 20178.124.51
Jun 20178.034.47
Jul 20177.954.42
Aug 20177.874.37
Sep 20177.784.33
Oct 20177.754.31
Nov 20177.724.29
Dec 20177.694.28
Jan 20187.664.26
Feb 20187.634.24
Mar 20187.604.23
Apr 20187.574.21
May 20187.544.19
Jun 20187.514.17
Jul 20187.484.16
Aug 20187.454.14
Sep 20187.424.12
Oct 20187.384.11
* Compensation in the first 5 years after commissioning. ** 1 Pf (Pfennig) = 0.01 DM (Deutsche Mark) since 2001 1 Pf = 0.51129 €-ct.
Table A2. Development of EEG remuneration for biomass power plants of different sizes.
Commissioning
from
Remuneration [€-ct/kWh] for Plant SizeSource:
Erneuerbare-Energien-Gesetz (EEG)
≤150 kW≤500 kW>5 MW<200 MW
Apr 2000 20.00 Pf/kWh *18.00 Pf/kWh * 31 March 2000 (EEG)
Jan 2002 19.80 Pf/kWh *17.82 Pf/kW *
Jan 2003 19.60 Pf/kWh *17.64 Pf/kWh *
Jan 2004 19.41 Pf/kWh *17.47 Pf/kWh *
Aug 200411.509.908.908.4021 July 2004 (EEG 2004)
Jan 20011.339.758.778.27
Jan 200611.169.618.648.15
Jan 200710.999.468.518.03
Jan 200810.839.328.387.91
Jan 200911.679.188.257.7921 July 2004 (EEG 2008)
Jan 201011.559.098.177.71
Jan 201111.449.008.097.63
Jan 201211.328.918.007.56
Jan 201311.108.737.847.41
Aug 201413.6611.7810.555.8522 July 2014 (EEG 2014)
Jan 201613.5911.7210.505.82
Apr 201613.5211.6610.445.79
Jul 201613.4611.6010.395.76
Oct 201613.3911.5510.345.73
Jan 201713.3211.4910.295.7122 December 2016 (EEG 2017)
Apr 201713.2511.4310.245.68
Oct 201713.1911.3810.195.65
Apr 201813.1211.3210.145.62
Oct 201813.0611.2610.095.60
* 1 Pf (Pfennig) = 0.01 DM (Deutsche Mark) since 2001 1 Pf = 0.51129 €-ct.
Table A3. Development of EEG remuneration for PV power plants of different sizes.
Commissioning
from
Remuneration [€-ct/kWh] for Plant SizeSource:
Erneuerbare-Energien-Gesetz (EEG)
≤10 kW≤30 kW>10–40 kW>30–100 kW>40–100 kW>40–500 kW>100 kW–1 MW
up to 2000 50.62 50.62 29 March 2000
2001 50.62 50.62 29 March 2001
2002 48.10 48.10 29 March 2002
2003 45.70 45.70 29 March 2003
2004 57.40 54.60 Solar Power Preliminary Act
2005 54.53 51.87 8 January 2004
2006 51.80 49.28 8 January 2005
2007 49.21 46.82 8 January 2006
2008 46.75 44.48 8 January 2007
2009 43.01 40.91 EEG 2009
2010 36.34 34.57 EEG-Novelle 2010
2011 28.74 27.33
2012 24.43 23.23 15.78PV-Novelle 2012
201315.29 14.50 12.84EEG-Novelle 2012
201413.02 12.48 11.24EEG, PV-Novelle 2012; EEG 2014
201512.40 12.05 10.78 EEG 2014
201612.31 11.97 10.71
201712.25 11.92 10.65 8.48EEG 2017

References

  1. Alibašić, H. Sustainability and Resilience Planning for Local Governments: The Quadruple Bottom Line Strategy; Springer International Publishing AG: Cham, Switzerland, 2018. [Google Scholar]
  2. Arygyropoulos, D.; Gordon, P.; Graichen, P.; Litz, P.; Pescia, D.; Podewils, C.; Redl, C.; Ropenus, S.; Rosenkranz, G. Energiewende: What do the New Laws Mean? Agora Energiewende: Berlin, Germany, 2016. [Google Scholar]
  3. Graichen, P.; Peter, F.; Sakhel, A.; Podewils, C.; Lenck, T.D.; Hein, F. Die Energiewende im Stromsektor: Stand der Dinge 2018; Agora Energiewende: Berlin, Germany, 2019. [Google Scholar]
  4. Fraunhofer ISE Net Public Electricity Generation in Germany in 2018. 2019. Available online: https://www.energy-charts.de/energy_pie.htm?year=2018 (accessed on 30 January 2019).
  5. Bundesnetzagentur. EEG in Zahlen 2017. 2017. Available online: https://www.bundesnetzagentur.de/DE/Sachgebiete/ElektrizitaetundGas/Unternehmen_Institutionen/ErneuerbareEnergien/ZahlenDatenInformationen/zahlenunddaten-node.html (accessed on 30 January 2019).
  6. Dickel, R. The New German Energy Policy: What Role for Gas in a De-Carbonization Policy? The Oxford Institute for Energy Studies, University of Oxford: Oxford, UK, 2014. [Google Scholar]
  7. Woodrow, C. Global Sustainable Communities Handbook: Green Design Technologies and Economics; Elsevier: Waltham, MA, USA; Oxford, UK, 2014. [Google Scholar]
  8. Pescia, D.; Graichen, P. Understanding the Energiewende: FAQ on the Ongoing Transition of the German Power System; Agora Energiewende: Berlin, Germany, 2015. [Google Scholar]
  9. Grashof, K. Are auctions likely to deter community wind projects? And would this be problematic? Energy Policy 2019, 125, 20–32. [Google Scholar] [CrossRef]
  10. Voss, A.; Madlener, R. Auction schemes, bidding strategies and the cost-optimal level of promoting renewable electricity in Germany. Energy J. 2017, 38, 229–264. [Google Scholar] [CrossRef]
  11. Bundesministerium der Justiz und für Verbraucherschutz. Gesetz für den Ausbau Erneuerbarer Energien (Erneuerbare-Energien-Gesetz–EEG 2017). Available online: https://www.gesetze-im-internet.de/eeg_2014/BJNR106610014.html (accessed on 18 March 2019).
  12. Bundesministerium der Justiz. Gesetz für den Vorrang Erneuerbarer Energien (Erneuerbare-Energien- Gesetz–EEG). 2009. Available online: https://www.erneuerbare-energien.de/EE/Redaktion/DE/Dossier/eeg.html?cms_docId=71120 (accessed on 18 March 2019).
  13. Quentin, J.; Sudhaus, D.; Endell, M. Was tun nach 20 Jahren? Repowering, Weiterbetrieb oder Stilllegung von Windenergieanlagen nach Förderende; Fachagentur Windenergie an Land: Berlin, Germany, 2018. [Google Scholar]
  14. Glensk, B.; Madlener, R. Evaluating the enhanced flexibility of lignite-fired power plants: A real options analysis. Energy Convers. Manag. 2018, 177, 737–749. [Google Scholar] [CrossRef] [Green Version]
  15. Glensk, B.; Madlener, R. The value of enhanced flexibility of gas-fired power plants: A real options analysis. Appl. Energy 2019, 251, 113–125. [Google Scholar] [CrossRef]
  16. Lehmann, P.; Gawel, E.; Korte, K.; Purkus, A. 20 Jahre EEG: Ist das Förderende für alte Anlagen ein Problem fü die Energiewende? Wirtschaftsdienst 2017, 10, 727–732. [Google Scholar] [CrossRef]
  17. Jung, S. PV-Altanlagen: Sicherung des Weiterbetriebs nach Ablauf der Vergütung? 2019. Available online: http://www.sfv.de/artikel/pv-altanlagen_anschlussfoerderung_nach_ablauf_der_verguetung_.htm (accessed on 18 March 2019).
  18. Jenner, K.; Klewar, M. Das neue EEG 2017(7): Ausschreibungen für bestehende Biomasseanlagen. 2016. Available online: https://blogs.pwc.de/auf-ein-watt/regulierung-energierecht-energiesteuern/das-neue-eeg-2017-7-ausschreibungen-fuer-bestehende-biomasseanlagen/1766/ (accessed on 18 March 2019).
  19. EEX—European Energy Exchange 2019. Available online: https://mis.eex.com/ (accessed on 18 January 2019).
  20. Wallasch, A.; Lüers, S.; Rehfeldt, K. Weiterbetrieb von Windenergieanlagen nach 2020; Deutsche WindGuard GmbH: Varel, Germany, 2016. [Google Scholar]
  21. Black, F.; Scholes, M. The pricing of options and corporate liabilities. J. Polit. Econ. 1973, 81, 637–654. [Google Scholar] [CrossRef]
  22. Cox, J.; Ross, S.; Rubinstein, M. Option pricing: A simplified approach. J. Financ. Econ. 1979, 7, 229–263. [Google Scholar] [CrossRef]
  23. Merton, R.C. Theory of rational option pricing. Bell J. Econ. Manag. Sci. 1973, 4, 141–183. [Google Scholar] [CrossRef]
  24. Myers, S. Determinants of corporate borrowing. J. Financ. Econ. 1977, 5, 147–175. [Google Scholar] [CrossRef] [Green Version]
  25. Brennan, M.; Schwartz, E. Evaluating natural resource investments. J. Bus. 1985, 58, 135–157. [Google Scholar] [CrossRef]
  26. Dixit, A.; Pindyck, R. Investment under Uncertainty; Princeton University Press: Princeton, NJ, USA, 1994. [Google Scholar]
  27. Pindyck, R. Irreversible investment, capacity choice, and the value of the firm. Am. Econ. Rev. 1988, 78, 969–985. [Google Scholar]
  28. Santos, L.; Soares, I.; Mendes, C.; Ferreira, P. Real Options versus Traditional Methods to assess Renewable Energy Projects. Renew. Energy 2014, 68, 588–594. [Google Scholar] [CrossRef]
  29. Fernandes, B.; Cunha, J.; Ferreira, P. The use of real options approach in energy sector investments. Renew. Sustain. Energy Rev. 2011, 15, 4491–4497. [Google Scholar] [CrossRef] [Green Version]
  30. Cesena, E. Real Options Theory Applied to Renewable Energy Generation Projects Planning. Ph.D. Thesis, School of Electrical and Electronic Engineering, Electrical Energy and Power Systems Group, The University of Manchester, Manchester, UK, 2012. [Google Scholar]
  31. Ioannou, A.; Angus, A.; Brennan, F. Risk-based methods for sustainable energy system planning: A review. Renew. Sustain. Energy Rev. 2017, 74, 602–615. [Google Scholar] [CrossRef]
  32. Kozlova, M. Real option valuation in renewable energy literature: Research focus, trends and design. Renew. Sustain. Energy Rev. 2017, 80, 180–196. [Google Scholar] [CrossRef]
  33. Li, Y.; Wu, M.; Li, Z. A Real Options Analysis for Renewable Energy Investment Decisions under China Carbon Trading Market. Energies 2018, 11, 1817. [Google Scholar] [CrossRef]
  34. Franzen, S.; Madlener, R. Optimal expansion of a hydrogen storage system for wind power (H2-WESS: A real options analysis). Energy Procedia 2017, 105, 3816–3823. [Google Scholar] [CrossRef]
  35. Kitzing, L.; Juul, N.; Drud, M.; Boomsma, T. A real options approach to analyse wind energy investments under different support schemes. Appl. Energy 2017, 188, 83–96. [Google Scholar] [CrossRef]
  36. Loncar, D.; Milovanovic, I.; Rakic, B.; Radjenovic, T. Compound real options valuation of renewable energy projects: The case of a wind farm in Serbia. Renew. Sustain. Energy Rev. 2017, 75, 354–367. [Google Scholar] [CrossRef]
  37. Cheng, B.; Wang, Z.; Liu, M.; Chen, Q.; Gbatu, A.; Ren, X. Defer option valuation and optimal investment timing of solar photovoltaic projects under different electricity market systems and support schemes. Energy 2017, 127, 594–610. [Google Scholar] [CrossRef] [Green Version]
  38. Zhang, M.; Zhou, D.; Zhou, P.; Liu, G.Q. Optimal feed-in tariff for solar photovoltaic power generation in China: A real options analysis. Energy Policy 2016, 97, 181–192. [Google Scholar] [CrossRef]
  39. Moon, Y.; Baran, M. Economic analysis of a residential PV system from the timing perspective: A real option model. Renew. Energy 2018, 125, 783–795. [Google Scholar] [CrossRef]
  40. Tian, L.; Pan, J.; Du, R.; Li, W.; Zhen, Z.; Qibing, G. The valuation of photovoltaic power generation under carbon market linkage based on real options. Appl. Energy 2017, 201, 354–362. [Google Scholar] [CrossRef]
  41. Gazheli, A.; van den Bergh, J. Real options analysis of investment in solar vs. wind energy: Diversification strategies under uncertain prices and costs. Renew. Sustain. Energy Rev. 2018, 82, 2693–2704. [Google Scholar] [CrossRef] [Green Version]
  42. Ritzenhofen, I.; Spinler, S. Optimal design of feed-in-tariffs to stimulate renewable energy investments under regulatory uncertainty—A real options analysis. Energy Econ. 2016, 53, 76–89. [Google Scholar] [CrossRef]
  43. Csapi, V. Applying Real Options Theory in the Electrical Energy Sector. State Audit Off. Hung. 2013, 58, 469–483. [Google Scholar]
  44. He, Y. Real Options in the Energy Markets. Ph.D. Thesis, University of Twente, Enschede, The Netherlands, 2007. [Google Scholar]
  45. Weron, R. Electricity price forecasting: A review of the state-of-the-art with a look into the future. Int. J. Forecast. 2014, 30, 1030–1081. [Google Scholar] [CrossRef] [Green Version]
  46. Debnath, K.; Mourshed, M. Forecasting methods in energy planning models. Renew. Sustain. Energy Rev. 2018, 88, 297–325. [Google Scholar] [CrossRef] [Green Version]
  47. Alexander, R.; Mo, M.; Stent, A. Arithmetic Brownian motion and real options. Eur. J. Oper. Res. 2012, 219, 114–122. [Google Scholar] [CrossRef]
  48. Götz, P.; Henkel, J.; Lenck, T.; Lenz, K. Negative Strompreise: Ursachen und Wirkungen. Eine Analyse der aktuellen Entwicklung–und ein Vorschlag für ein Flexibilitätsgesetz; Agora Energiewende: Berlin, Germany, 2014. [Google Scholar]
  49. Jain, S.; Roelofs, F.; Oosterlee, C. Valuing modular nuclear power plants in finite time decision horizon. Energy Econ. 2013, 36, 625–636. [Google Scholar] [CrossRef] [Green Version]
  50. Guthrie, G. Real Options in Theory and Practice; Oxford University Press: New York, NY, USA, 2009. [Google Scholar]
  51. Bundesnetzagentur. List of Power Plants. 2019. Available online: https://www.bundesnetzagentur.de/EN/Areas/Energy/Companies/SecurityOfSupply/GeneratingCapacity/PowerPlantList/PubliPowerPlantList_node.html;jsessionid=2C86413CBE1133793F3EF894EDE36035 (accessed on 28 January 2019).
  52. Bundesnetzagentur. Core Energy Market Data Register. 2018. Available online: https://www.bundesnetzagentur.de/EN/Areas/Energy/Companies/SecurityOfSupply/GeneratingCapacity/PowerPlantList/PubliPowerPlantList_node.html;jsessionid=2C86413CBE1133793F3EF894EDE36035 (accessed on 10 September 2018).
  53. Wallasch, A.; Lüers, S.; Rehfeldt, K. Kostensituation der Windenergie an Land in Deutschland— Update; Deutsche WindGuard GmbH: Varel, Germany, 2015. [Google Scholar]
  54. Blesl, M.; Wissel, S.; Fahl, U. Stromerzeugung 2030—Mit welchen Kosten ist zu rechnen? Energ. Tagesfr. 2012, 62, 20–27. [Google Scholar]
  55. Kost, C.; Shammugam, S.; Jülch, V.; Nguyen, H.; Schlegl, T. Levelized Cost of Electricity Renewable Energy Technologies; Fraunhofer Institute for Solar Energy Systems ISE: Freiburg, Germany, 2018. [Google Scholar]
  56. BMWi. Kontrolle und Entsorgung von Windkrafträdern. 2018. Available online: https://www.bmwi.de/Redaktion/DE/Parlamentarische-Anfragen/2018/19-3619.html (accessed on 13 August 2018).
  57. Agentur für Erneuerbare Energien. Interaktive Karte zu Erneuerbaren Energien. 2018. Available online: https://www.foederal-erneuerbar.de/startseite (accessed on 28 January 2019).
  58. Wind Europe. Repowering and Lifetime Extension: Making the most of Europe’s wind energy resource. In The European Wind Industry’s Views on Managing Wind Energy Assets at the End of Their Operational Lifetime; Wind Europe: Brussels, Belgium, 2017. [Google Scholar]
  59. Pless, J.; Arent, D.; Logan, J.; Cochram, J.; Zinaman, O. Quantifying the value of investing in distributed natural gas and renewable electricity systems as complements: Applications of discounted cash flow and real options analysis with stochastic inputs. Energy Policy 2016, 97, 378–390. [Google Scholar] [CrossRef] [Green Version]
  60. CEER–Council of European Energy Regulators. Status Review of Renewable Support Schemes in Europe; CEER asbl: Brussels, Belgium, 2017. [Google Scholar]
  61. The European Commission’s Science and Knowledge Service 2019. Renewable Energy—Recast to 2030 (RED II). Available online: https://ec.europa.eu/jrc/en/jec/renewable-energy-recast-2030-red-ii (accessed on 20 September 2019).
  62. European Commission. Report from the Commission to the European Parliament, the Council, the European Economic and Social Committee and the Committee of the Regions; Renewable Energy Progress Report; European Commission: Brussels, Belgium, 2019. [Google Scholar]
Figure 1. Development of installed RES capacity by source, 2003–2017 (in MW). Source: [5].
Energies 12 03616 g001
Figure 2. Main goals of Germany’s Energiewende. Source: [8] (p. 10).
Energies 12 03616 g002
Figure 3. Hourly development of the wholesale spot market electricity price, 1 January 2015–31 December 2018 with a linear trend. Source: [19].
Energies 12 03616 g003
Figure 4. Daily development of the CO 2 price, 1 January 2015–31 December 2018 with an exponential trend. Source: [19].
Energies 12 03616 g004
Figure 5. Proposed procedure.
Energies 12 03616 g005
Figure 6. Binomial lattice of the project value.
Energies 12 03616 g006
Figure 7. Changes in installed capacity of selected renewable energy technologies in Germany due to subsidy expiry. Source: IAEW, RWTH Aachen University, based on data from [52].
Energies 12 03616 g007
Table 1. Onshore wind and PV power plants considered in the case study.
AcronymLocation (Federal State)Year of CommissioningInstalled Capacity (MW)
WP1Lower Saxony199344.5
WP2Saxony-Anhalt199910.0
WP3Saxony-Anhalt199994.5
WP4Brandenburg20004.0
WP5Lower Saxony200034.2
PV1Saxony200724.1
PV2Saxony20088.0
PV3Saxony-Anhalt200812.9
Source: [51].
Table 2. Economic parameters used in the case study for onshore wind and PV power plants.
ParameterOnshore WindPV
Investment costs1180 €/kW 11450 €/kW 2
O&M costs2.74 €-ct/kWh 333 €/kW a 4
1.81 €-ct/kWh 32.5% from new investment 5
3.67 €-ct/kWh 3
Abandonment value5% of investment costs 25% of investment costs 2
80.00 €/kW 6
WACC 52.5%2.1%
1 [53], 2 [54], 3 [20], 4 [13], 5 [55], 6 [56].
Table 3. Optimal decision regarding the further operation in the next five years of all onshore wind power plants analyzed after EEG levy expiration and regarding different levels of O&M costs and abandonment values (see Table 2).
O&M Costs [€-ct/kWh]Abandonment Value
80 €/kW5% of New Investment Costs
1.81ContinueContinue
2.74ContinueContinue
3.67StopStop
Table 4. Probability of the continuation or abandonment for all analyzed onshore wind power plants in the next 10 years after EEG levy expiration, for O&M costs equal to 1.81 €-ct/kWh and 2.74 €-ct/kWh.
Year of Further OperationProbability Value to Make Decision
ContinueStop
1–51.000.00
60.970.03
70.890.11
80.770.23
90.640.36
100.500.50
Table 5. Probability of the continuation or abandonment for all analyzed PV power plants in the next 10 years after EEG levy expiration for O&M costs of 33 €/kW per annum and abandonment value of 5% of the new investment costs.
Year of Further OperationProbability Value to Make Decision
ContinueStop
11.000.00
20.500.50
30.250.75
40.500.50
50.310.69
60.190.81
70.110.89
80.060.94
90.040.96
100.020.98
Table 6. Probability of the continuation or abandonment for all onshore wind power plants analyzed over the next 10 years after EEG levy expiration (AV—abandonment value equal to 80 €/kW; AV2—abandonment value equal to 5% of new investment costs).
Year of
Further Operation
Probability of the Decision (Continue/Stop)
by O&M Cost Level [€-ct/kWh]
1.81 and
AV1 or AV2
2.74 and
AV1
2.74 and
AV2
3.67 and
AV1 or AV2
1–51.00/0.001.00/0.001.00/0.001.00/0.00
61.00/0.000.97/0.031.00/0.000.97/0.03
70.98/0.020.89/0.110.98/0.020.89/0.11
80.94/0.060.78/0.220.94/0.060.78/0.22
90.86/0.140.64/0.360.86/0.140.64/0.36
100.75/0.250.50/0.500.75/0.250.50/0.50
Table 7. Impact of different parameters on the decision to continue operation.
ParameterTechnology
Onshore Wind PowerPhotovoltaics
O&M costsSmaller costs → higher probability to continue
Abandonment costsNo impact *
Electricity priceHigher price → higher probability to continue
Duration of further operationLonger operation → smaller probability to continue
Electricity outputNo impact **
* Results obtained for the assumed parameter in the analysis, ** Results obtained for the average annual full-load hours for wind energy and solar PV in analyzed regions.