Article

The Impact of Power Source Performance Decrease in a PV/WT/FC Hybrid Power Generation System on the Result of a Multi-Criteria Analysis of Load Distribution

by
Bartosz Ceran
* and
Agata Orłowska
Institute of Electric Power Engineering, Poznan University of Technology, Piotrowo 3A, 60-965 Poznan, Poland
*
Author to whom correspondence should be addressed.
Energies 2019, 12(18), 3453; https://doi.org/10.3390/en12183453
Submission received: 2 August 2019 / Revised: 2 September 2019 / Accepted: 3 September 2019 / Published: 6 September 2019
(This article belongs to the Section F: Electrical Engineering)

Abstract

:
The article presents a mathematical model designed for scheduling cooperation between Hybrid Power Generation System HPGS and an electricity system viewed from a multifaceted perspective. The multifaceted approach consists in taking into account energy, economic, and environmental criteria in the calculation process. The considered HPGS is constructed of a photovoltaic installation PV, wind turbines WT, and energy storage in the form of an electrolyzer El coupled with a fuel cell FC. The model consists of energy analysis and multi-variant analysis of the decision-making. Cooperation scheduling is performed in a long-term period taking into account the decrease in performance of HPGS components during the years of its operation. The impact of the performance decline in HPGS devices on the final result of scheduling the work of HPGS in the electricity system is the main issue considered in this article. This matter has not been analyzed yet. Additionally, a sensitivity analysis of the impact of a decrease in the efficiency of selected HPGS components (PV, FC, and El) on the final effect of the simulation is presented.

1. Introduction

The depletion of fossil fuel resources and environmental degradation have initiated the transformation of energy systems in Europe and the world. Radically progressing climate change has motivated decision-makers to take increasingly more effective actions aimed at shaping low-emission and climate-neutral energy policies. The greatest emphasis is placed on the decarbonization of electricity and heat generation systems and the use of renewable energy sources (RESs).
Investment in renewable energy sources entails a decentralization process in the energy sector [1]. Popularization of scientific research into the transformation of the energy sector towards distributed generation is very important, especially in countries that are skeptical of these changes. For example, in Poland, 80% of the total electricity is still produced from coal [2]. Coal owes its strong position in the national energy industry to historical grounds and the structural background, which has not yet been fully replaced.
The main problem of the integration of renewable energy sources with the national power system (NPS) is the high dependence of the power output on the availability of primary energy, such as wind speed or irradiance. Therefore, RESs cannot be considered as stable, predictable, reliable, and controllable. This problem may be limited or completely eliminated by hybrid power generation systems (HPGSs) cooperating with an energy storage device, which stabilizes the system [3,4].
The literature is abundant in works devoted to various configurations of HPGSs [5]. The HPGS, considered in this article, consists of wind turbines (WTs), a photovoltaic (PV) installation, and an electrolyzer coupled with a fuel cell (FC) as the energy storage system. This combination of energy sources increases reliability due to the complementarity of wind and solar energy [6] and uses an innovative alternative to electrochemical batteries.
The body of literature on hybrid power generation systems (HPGSs) usually focuses on the optimal design and sizing and/or the optimal energy generation management by planning load distribution or developing control algorithms.
In [7], in order to determine the nominal power of individual sources (PV, WT, FC), the authors used the artificial bee swarm optimization (ABSO) algorithm. In [8], the case of a remote area in Egypt was considered using the mine blast algorithm (MBA). In [9], an artificial immune system (AIS) based on the clonal selection algorithm (CLONALG) was used, as well as the HOMER software. Various artificial intelligence (AI) techniques were compared in [10] to optimize the size of the PV/WT/FC hybrid system. The particle swarm optimization (PSO) algorithm turned out to be the most effective method. A comprehensive review of the optimal sizing of solar wind HPGSs, including, in addition to artificial intelligence methods, classical methods and software tools, was presented in [11,12]. In the article [13], the authors used HOMER software to carry out a technical and economic assessment of an off-grid HPGS using the example of Masirah Island in Oman. Additionally, integration of the considered HPGS into the existing electricity grid was simulated and studied with the use of the software package DIgSILENT. The issue of the impact of power quality on the integration of distributed generation units into a power grid was studied thoroughly in [14]. The role of the energy storage systems was emphasized. In the body of literature, various types of energy storage systems are proposed. For example, in [15], the economic feasibility was analyzed for the integration of flywheel energy storage systems (FESSs) with a wind power plant.
Energy management and control strategy in a PV/WT/FC hybrid power generation system was proposed in [16]. The concept based on load following was described in [17]. In [18], energy management systems (EMSs), differing in terms of the optimization criterion, were developed on the basis of the particle swarm optimization (PSO) algorithm. In [19], an intelligent flower pollination algorithm (FPA) was used for sizing and energy management. An EMS based on an adaptive neuro-fuzzy inference system (ANFIS) exemplified by a hybrid system connected to the network was described in [20]. An overview of system optimization and energy management strategies for a standalone PV/WT/FC hybrid system was presented in [21].
On the basis of the literature review, the authors indicate that previous studies regarding the planning of HPGS exploitation in the electricity system do not take into account the aging of its components. HPGS operation is usually considered within one year of operation. Meanwhile, the decline in the performance of HPGS devices, such as photovoltaic panels and fuel cells, from a long-term perspective may have a significant impact on the exploitation indicators.
In fact, HPGSs are supposed to operate for approximately 10 to 20 years. After that time, HPGSs operating in an off-grid mode may not be able to cover the load demand for power and electricity (adverse impact on reliability). In the case of the systems operating in an on-grid mode, the energy consumer will have to use more energy from the electricity system. When the electricity system is based on fossil fuels, it is associated with higher CO2 emissions, as well as other pollutants. In addition, it means higher costs for the electricity consumer.
Research on the degradation and decrease of PV panel performance due to particular working conditions was presented in [22,23]. Random failures also affect the power availability of PV panels [24,25], but the authors did not consider this in this article. The phenomenon of a fuel cell efficiency decline was described in [26].
The research presented in this article is a continuation of the authors’ previous scientific achievements published in [27]. The result of the research described in [27] was the identification of the distribution of loads proposed for an on-grid HPGS consisting of wind turbines (WTs), photovoltaic installation (PV), and an electrolyzer coupled with a fuel cell (FC) as an energy storage system. In [27], the author presented and proved that the best variant of load distribution for the adopted criteria is the option in which the electricity system covers the basic load only. The peak and sub-peak loads are covered by the HPGS.
As assumed by the authors, the aspects of both the HPGS and electricity system should be taken into account in work scheduling. The analysis was conducted for the first year of operation, as is common in the cited literature.
The novelty and contribution of the authors’ research lies in taking into account the degradation of chosen devices in the HPGS in a multi-criteria analysis of load distribution between the electricity system and the HPGS. In contrast to previous research, our study was conducted from a long-term perspective rather than in their initial conditions. This is an important issue, because HPGSs are supposed to operate for approximately 10 to 20 years.
This paper is organized as follows. The second section of this article contains a problem description. The third section contains a model and method description, including the algorithm that was extended by taking into account the characteristics of the PV performance decrease as a function of the operating time, characteristics of fuel cell performance decrease, and characteristics of the decrease in hydrogen production by the electrolyzer.
The fourth section contains the results of the multi-criteria analysis of load distribution for seven years of HPGS operation. It also presents a sensitivity analysis of the decrease in the performance of individual HPGS components on the final effect of the multi-criteria load distribution analysis. The fifth section contains discussions of the obtained results. The conclusions and further plans are included in the sixth section.

2. Problem Description

PV/WT/FC hybrid power generation systems are characterized by higher unit costs of electricity production and lower environmental impact compared to conventional energy sources (coal- or gas-fired power plants).
Despite many advantages, renewable and unconventional technologies of electricity generation also have disadvantages. One of them is a relatively fast decrease in the efficiency of some devices during exploitation. According to the information provided by manufacturers, after 20 years of operation, photovoltaic installations work at 80% of their primary efficiency. Electrochemical devices, such as electrolyzers or fuel cells, lose their rated capacity after only one year of operation due to degradation processes [28]. The decrease in the efficiency of devices, such as photovoltaic cells, fuel cells, or electrolyzers, impacts on the energy efficiency of the entire PV/WT/FC HPGS.
The studied issue is extremely important in the ongoing period of transformation of the electricity system from a centralized to a dispersed structure. The issues of microgrids, energy clusters, and the integration of distributed energy sources with the electricity system are increasingly popular.
As mentioned in the introduction, scientific publications contain analyses of HPGS operations based on renewable energy sources and energy storage systems only in the first year of operation.
The impact of a decrease in the performance of HPGS devices on the final result of scheduling the operation of the HPGS in the electricity system is the main problem considered in this article. Taking into account the efficiency decrease in distributed sources during their operation will affect both the economic and environmental effect of electricity generation by HPGSs.
Additionally, a sensitivity analysis of the impact of a decrease in the performance of a selected HPGS component on the final simulation effect is presented.
In this article, the authorial algorithm based on the energy analysis of HPGS and a multi-variant decision analysis were used to examine the posed problem. Energy analysis was used to determine the value of the decision criteria used in multi-variant decision analysis. The choice of the multi-variant analysis method, compromise programming, allowed for the energy, economic, and environmental aspects to be considered during simulation of the cooperation between the HPGS and the electricity system.

3. Model and Method Description

Research on scheduling HPGS and electricity system cooperation was conducted using an original mathematical model developed in the Matlab/Simulink environment. According to the assumptions, the model was designed for exploitation planning of cooperation between the HPGS and the electricity system. The considered HPGS consisted of wind turbines (WTs), photovoltaic installation (PV), and an electrolyzer coupled with a fuel cell (FC) as the energy storage system. The HPGS supplies the load determined by the load profile. It was assumed that 90% of the electricity system is based on fossil fuels, hence electricity production is burdened with a high CO2 emission index of 824 kgCO2/MWh. The scheme of the considered hybrid power system supplying the consumer is shown in Figure 1.
The electrolyzer was powered from renewable energy sources in case of surplus production. Hydrogen produced by electrolysis is compressed and stored. Furthermore, hydrogen is used to generate electricity by the fuel cell [29]. The fuel cell compensates for the stochastic process of electricity production by wind turbines and photovoltaics. The fuel cell is first supplied with hydrogen produced by the electrolyzer. When the hydrogen container is empty, the fuel cell is supplied from the backup hydrogen source. The use of additional hydrogen is accompanied by CO2 emissions associated with the production process (steam reforming of hydrocarbons, coal or biomass gasification, etc.) [30].
The model makes it possible to define scenarios of supplying the consumer with a specific load profile by the electricity system and HPGS. The model also permits the selection of the best load distribution variant according to the assumed decision criteria and their weights. The model was based on the energy analysis of the HPGS and the compromise programming method of the multi-criteria analysis. Mathematical equations were used to conduct the energy analysis and equations describing the compromise programming method of multi-criteria decision support were also used.
The value of the annual average power generated by a solar installation was described by Equation (1):
P a v _ P V = W K W W T 1 0 T P P V d t .
To determine the value of the average power generated by wind turbines, the annual distribution of wind speed and operational characteristics of the turbine were used—Equations (2) and (3).
P a v _ W T = 0 v max P ( v ) f ( v ) d v ,
f ( v ) = k λ 1 v λ 1 k 1 e ( v / λ ) k .
The value of the nominal power of the fuel cell and electrolyzer was determined according to Equations (4) and (5):
P F C = P max _ l o a d ,
P E l = n ( P max _ W T + P max _ P V ) P min _ o d b .
The multi-criteria comparative analysis of load distribution scenarios consisted of measuring the distance of the adopted scenarios from the so-called ideal point. This point lies in the space consisting of n criteria. In the ideal point, normalized values of all decision criteria reach the value of 1—Equation (6):
L α ( S n ) = m = 1 M w m α ( x M x n m ) α .
The decision variables were normalized according to Equation (7):
x n m = 1 x n m ( j = 1 m x n j 2 ) 0.5 .
The best scenario according to the adopted decision criteria and their weights is the closest scenario to the ideal point—Equation (8):
S j = S * L α ( S j ) = min L α ( S n ) .
A detailed description of the energy analysis and the multi-criteria method can be found in the mentioned publication. Interested readers are referred to [27].
Four decision criteria were defined by the model.
The specific fuel consumption by HPGS was used as the energy criterion—Equation (9):
k 1 = V H 2 ( E L o a d ) 1 [ N m 3 k W h 1 ] .
The unit cost of electricity production by HPGS was adopted as the economic criterion—Equation (10):
k 2 = K e ( E H P G S ) 1 [ P L N k W h 1 ] .
Operating costs were defined in accordance with Equation (11):
K e = K O & M + K Hydrogen + K a + K H 2 O .
The environmental criterion represents CO2 emission linked to the production of electricity in the electricity system and the use of additional hydrogen. As mentioned earlier, production of hydrogen, e.g., in the process of hydrocarbons reforming, is burdened with CO2 emission. The environmental criterion was represented by Equation (12):
k 3 = ( E s y s W E C O 2 + M H 2 C O 2 / H 2 ) ( E L o a d ) 1 [ k g C O 2 k W h 1 ] .
The k4 criterion is called the system criterion and it represents the point of view of the electricity system. It would be the most beneficial situation for the electricity system if the power demand of the consumer were constant for a given period of time. The criterion prefers the scenario in which the electricity system covers the basic load—Equation (13):
k 4 = P o r d T a ( E s y s ) 1 [ ] .
The model described in [27] was extended to the needs of this article. The additional algorithm takes into account the degradation and decrease of the performance of selected HPGS elements during their operation. The dependence of the performance on the device’s operation time is called the aging characteristic. Figure 2 presents the first version of the model (blue blocks) in the form of a simplified block diagram. The green block represents the extension, with the algorithm taking into account any performance degradation associated with the aging of HPGS elements.
When the value of “i” equals 0, it means the beginning of HPGS operation and it corresponds to “year 0”. Year 1 (i = 1) means that the HPGS operated for 365 days, etc.
The analyses can be carried out for any generated load profile of a consumer, as well as any wind or irradiance profile. The decision criteria were determined in the loop for the assumed input data based on energy analysis expressed by Equations (1)–(8). Then, based on Equations (9)–(16), the multi-variant load distribution analysis between the HPGS and electricity system was performed. After obtaining the results, the operational characteristics were updated by taking into account the decrease in efficiency and performance of the devices and the calculation process was repeated.
According to the literature available, the lifetime of fuel cells is about 60,000 h [31]. Therefore, the authors conducted simulations for the estimated seven-year lifetime of the fuel cell. During the seven years of operation, the efficiency of energy conversion by photovoltaic installation and fuel cell decreases. Simultaneously the demand for electricity for hydrogen production by the electrolyzer increases. The exploitation experience of wind farms does not show a decrease in the efficiency of electricity generation caused by the degradation of components for a period of seven years. Therefore, for the purposes of the simulation, the authors adopted a constant characteristic of power generation as a function of the wind speed.
Photovoltaic panels, according to the manufacturers’ data, lose approximately 0.7% to 1% of their efficiency annually. The influence of the decline of the PV panel’s efficiency on the operational characteristic—PPV = f(E)—is shown in Figure 3.
The efficiency of converting solar energy into electricity can be described by Equation (14):
η P V = P P V ( E S ) 1 [ ] .
As a result of efficiency decline after years of operation, the photovoltaic installation generates less power. It is graphically represented as a greater slope of the PPV = f(E) characteristic in relation to the X axis (Figure 3).
The operational experience related to fuel cells [32] and electrolyzers shows that the average cell voltage of a given stack decreases at a rate of about 3 μV/h [33]—Figure 4.
On this basis, the authors developed the operational characteristics of the fuel cell stack (Figure 5) and electrolyzer (Figure 6 and Figure 7) for seven years of operation.
The efficiency of the fuel cell can be expressed by the relationship described by Equation (15):
η F C = U a v ( E t ) 1 [ ] .
The effect of the decrease in the Uav value during operation is a decrease in the efficiency of the conversion of hydrogen into electricity by the fuel cell. Graphically, this means a decline in the power curve, P = f(I). Since the stream of hydrogen consumed by the fuel cell is proportional to the flowing current, the P = f(I) characteristics can be represented as P = (VH2).
The electrolyzer efficiency was described by Equation (16):
η E l = E t ( U a v ) 1 [ ]
After years of operation, the voltage, Uav, will be higher. It is synonymous with a decrease in the efficiency of the process of splitting water into hydrogen and oxygen by the electrolyzer. This means an increase in the demand for electricity to produce 1 kg of hydrogen. Graphically, the angle of inclination of the P = f(mH2) characteristic relative to the X axis will increase.
Because electrolyzer manufacturers use the indicator of the unit energy consumption needed for the production of 1 kg of hydrogen, the characteristic P = f(mH2) is presented as d = (mH2).
The hydrogen consumption indicator was defined by Equation (17):
d H 2 = P E l ( m H 2 ) 1 .
Research on the impact of the aging of HPGS devices on the final results of the multi-criteria load distribution analysis was carried out for the consumer energy profile shown in Figure 8.
A comparison was made between four variants of the consumer supply by the HPGS and electricity system. On the basis of the energy analysis carried out for the operational characteristics for the year 0, the nominal power of the generation devices was determined. For each of the variants, the optimal composition of the generating units was selected according to the methodology described in the paper [27]. The nominal power of HPGS generation devices is summarized in Table 1.

4. Results

4.1. The Impact of a Decrease in the Performance of Generation Devices in HPGS (PV, FC, El) on the Value of Decision Criteria

For all scenarios, the values of decision criteria for seven years of operation were determined, with a time step of one year (algorithm in Figure 2). Table 2 presents a change in the criteria after seven years of operation. The efficiency drop in HPGS components affects the value of criterion k1. The lower efficiency of the photovoltaic installation and the decrease in the electrolyzer efficiency result in a lower production of hydrogen in the analyzed period of operation. The decrease in fuel cell performance increases the demand for hydrogen. All these factors make the value of criterion k1 grow. The decrease in the efficiency of HPGS components and the increasing demand for additional hydrogen results in higher operating costs. Consequently, the unit cost to generate 1 kWh of electricity using the hybrid system and the value of criterion k2 will grow. The greater the consumption of additional hydrogen burdened with CO2 emission in the production process, the greater the value of criterion k3 will be. The value of criterion k4 depends on the shape of the consumer energy profile; therefore, the changes in the operational characteristics through the years do not affect its value. The study of the impact made by the shape of the consumer energy profile on the result of the multi-criteria analysis was the subject of previous research described in [34].
Table 2 presents the values of the decision criteria for year 0 and year 7 of exploitation. Figure 9, Figure 10 and Figure 11 show the annual changes in the decision criteria for scenario I.
Degradation of the components has the greatest impact on changing the value of the energy criterion, k1. For all four scenarios, the demand for additional hydrogen increases by about two times. This generates additional operating costs (increased value of the economic criterion, k2). The k2 increase is smaller because the cost of additional fuel is only one of the components of the HPGS operating costs—Equation (11). The consumption of hydrogen increases the value of the k3 criterion, because its production is burdened with CO2 emission.

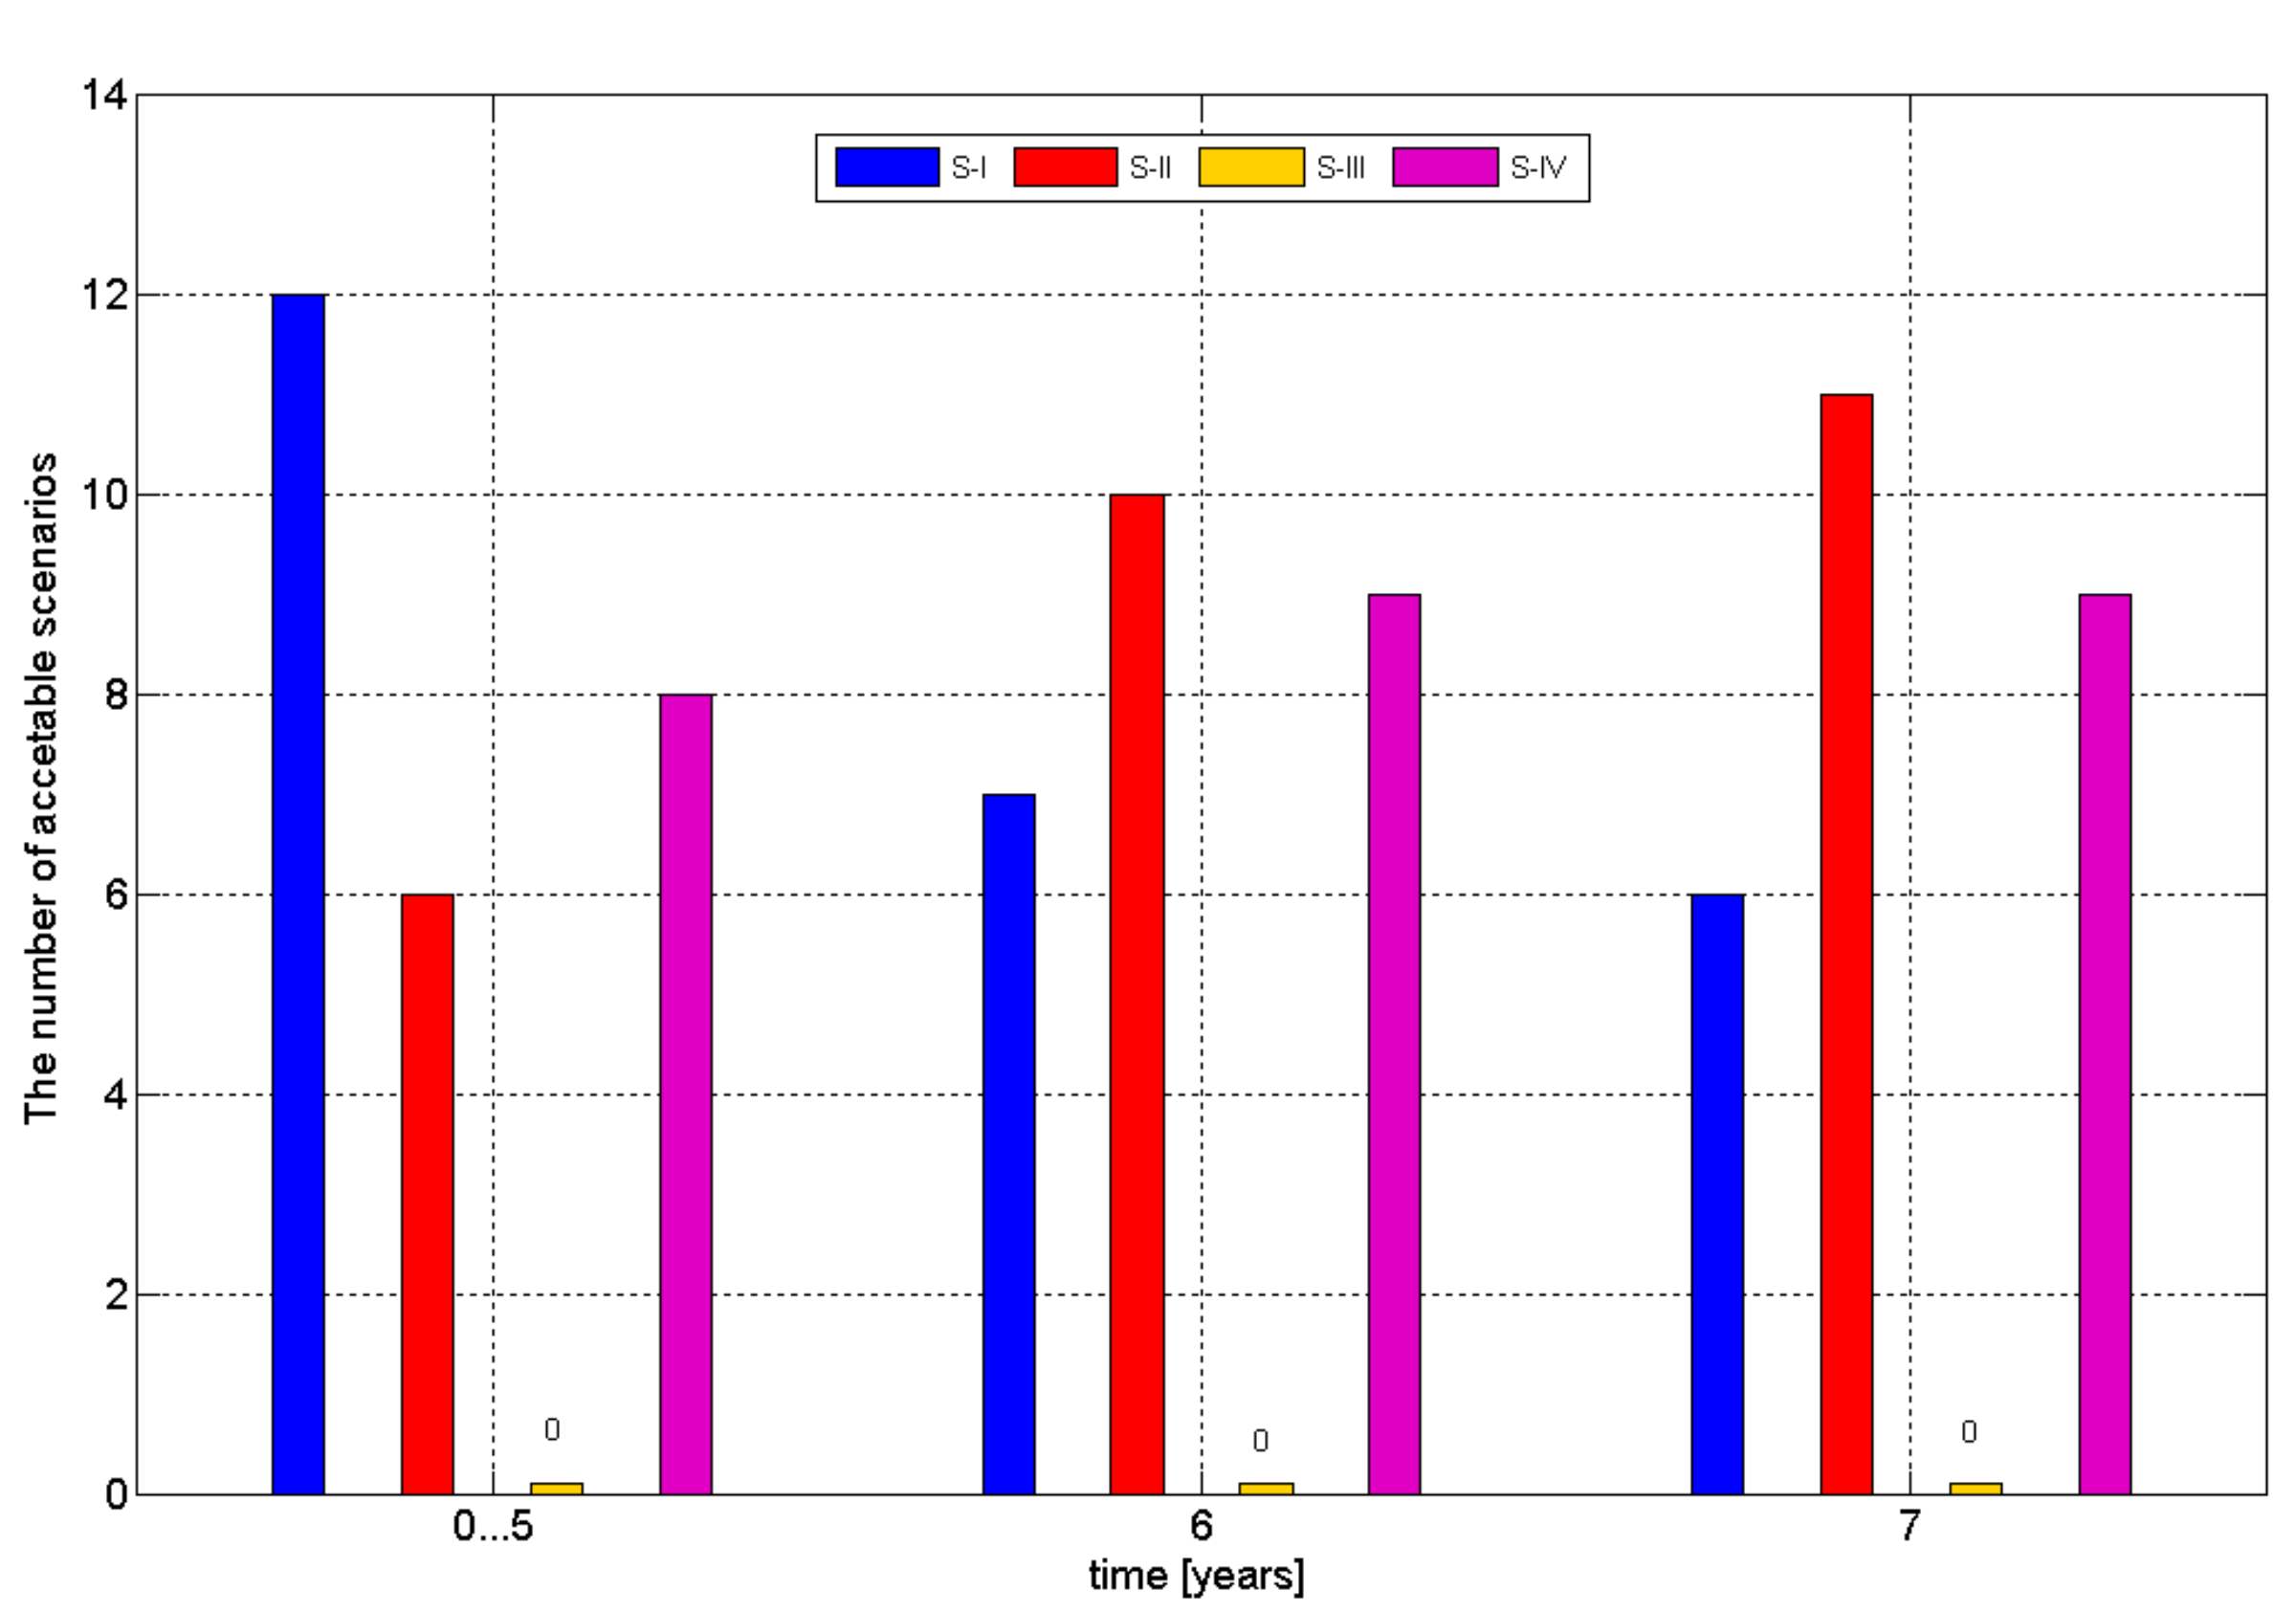
4.2. Impact of a Decrease in the Performance of Generation Devices in HPGS (PV, FC, El) on the Results of the Multi-Criteria Analysis of Load Distribution

The result of the simulation is a series of scenarios in order from the acceptable scenario to the scenario furthest from the ideal point. The research was conducted for α = 1 and α = 2. In order to improve the illustration of the impact of generation devices’ degradation on the results of the multi-criteria analysis of load distribution, Table 3 presents only those scenarios that were considered acceptable, i.e., scenarios that are nearest to the ideal point for the specific ratio of decision criteria weights. The beginning of the simulation (year 0) and the first two years are placed in one column because of the same simulation results.
The results of the analysis are presented graphically in Figure 12.
Figure 12 shows a comparison of the acceptable scenarios for the considered seven years of HPGS operation.
In the first two years of exploitation, the impact of a decrease in the performance of generation devices in HPGS on the final results of the multi-criteria analysis of load distribution is not observed. After the third year of HPGS exploitation, the analysis indicates that with a double overweighting of the system criterion, k4, the best option is the S-II scenario ahead of S-I. However, this change does not affect the final results of the multi-criteria analysis of load distribution. The S-I scenario is still most frequently indicated as the best option for customer supply during the period from year 3 to year 5 inclusive. After the sixth year of operation, it is observed that the S-I scenario begins to be replaced by S-II for double overweighting of the economic criterion, k2, and triple overweighting of the system criterion, k4. For both of these cases, S-II is the best option for α = 1. However, for the exponent value of α = 2, S-I is still the best scenario.
S-II is indicated as the best scenario for double overweighting of the economic criterion, k2. After the seventh year, replacement of the S-I scenario by S-II is observed for double overweighting of the k3 and k4 criteria, triple overweighting of criterion k3, and triple overweighting of the k4 criterion. As a result of the described changes, the S-II scenario is the most frequent indication of the best variant of supplying the consumer after seven years of operation. This means that the consumer is expected to take more electricity from the coal-based electricity system than from the HPGS based on renewable power sources. S-III was not indicated as the best scenario for the analyzed weight values of decision criteria.

4.3. Analysis of the Impact of a Decrease in the Performance of Specific HPGS Components on the Results of the Multi-Criteria Analysis of Load Distribution

In order to examine the sensitivity of the model to a decrease in the performance of individual HPGS components, simulations were performed taking into account the aging characteristics of only one of the devices subjected to degradation over time. The impact of PV degradation was examined based on the assumption of constant operational characteristics of the electrochemical energy converters. Similarly, the impact of an increased electricity demand by the electrolyzer was examined with the assumption of constant operational characteristics of the PV and FC installation and the impact of the fuel cell efficiency decrease assuming constant PV and electrolyzer operational characteristics.

4.3.1. Impact of the Degradation of PV Installation Alone on the Results of the Multi-Criteria Analysis of Load Distribution

The impact of a decrease in the performance of PV installation on the results of the multi-criteria analysis of load distribution is shown in Table 4.
The change in the value of decision criteria caused by the decrease in the performance of PV installation, with the assumption of constant operational characteristics of the fuel cell stack and electrolyzer, does not affect the final results of multi-criteria analysis of the load distribution in the period of exploitation considered.
Due to the fact that the lifetime of photovoltaic panels is over 20 years, the sensitivity analysis was extended to 20 years. After the 11th year of exploitation, it is observed that the S-I scenario is replaced by S-II at double overweighting of the k4 criterion. After the 13th year of exploitation, for the same ratio of decision criteria weights, the S-II scenario is indicated as the best one. This change does not affect the final result of the multi-criteria analysis—the S-I scenario is still most frequently indicated as the best option.

4.3.2. Impact of a Degradation of the Electrolyzer Alone on the Results of the Multi-Criteria Analysis of Load Distribution

The impact of a decrease in the performance of hydrogen production by the electrolyzer, in the considered period of exploitation, on the results of multi-criteria analysis of the load distribution is shown in Table 5.
The change in the value of the decision criteria caused by the increased electricity demand for the production of 1 kg of hydrogen by the electrolyzer, assuming constant operational characteristics of the fuel cell stack and PV panels, does not affect the final results of the multi-criteria analysis of load distribution in the considered period of exploitation. Currently, the lifetime of electrolyzers is about seven years. Therefore, it is unfounded to perform research for a longer exploitation time than the lifetime of the device.

4.3.3. Impact of Degradation of the Fuel Cell Alone on the Results of the Multi-Criteria Analysis of Load Distribution

The impact of a decrease in the performance of the fuel cell stack on the results of multi-criteria analysis of the load distribution is shown in Table 6.
The analysis results are presented graphically in Figure 13. Figure 13 shows a comparison of acceptable scenarios for the considered seven years of HPGS operation.
The change in the value of decision criteria caused by the increased demand for hydrogen to generate 1 kWh of electricity by a fuel cell, assuming constant operational characteristics of the electrolyzer and PV panels, affects the final results of the multi-criteria analysis of load distribution in the considered period of exploitation. After the sixth year of exploitation, the analysis indicates two cases, in which scenario S-I is replaced by S-II. This occurred through double overweighting of the environmental criterion, k3, and triple overweighting of the system criterion, k4. After seven years of exploitation, scenario S-II is the preferred one. It is worth mentioning that S-III is not indicated as the best scenario again.

5. Discussion

The results obtained on the basis of the simulation tests confirmed the thesis that degradation (aging) of HPGS components has an impact on the final result of the multi-variant analysis of cooperation between an electricity system and PV/WT/FC HPGS after long-term exploitation. This process should be taken into account in the long-term prediction of exploitation. Otherwise, the off-grid system might not be able to cover the demand for electricity and the on-grid system might have to be compensated to a greater extent by the electricity system. The analysis showed that after the seventh year of operation, the most preferred scenario is S-II, which replaced scenario S-I.
The sensitivity analysis showed that the most significant influence on the final results of the multi-criteria analysis of load distribution comes from a performance decline in the fuel cell stack. The sensitivity analysis did not show the impact of a decrease in the performance of the PV installation and electrolyzer on the simulation results. The fuel cell has the largest share in the results due to the shapes of the operational characteristics of the considered technologies. In the case of the photovoltaic installation, a linear efficiency decrease of 1% per year was assumed. Further assumptions were made whereby the PV installation was equipped with the maximum power tracking system and worked at the Maximum Power Point MPP. The obtained operational characteristics of PPV = f(E) can be approximated with a linear function. Hence, their displacement due to the performance decrease is relatively small.
The performance decrease in the photovoltaic installation only, with an assumption of constant operational characteristics of the fuel cell and electrolyzer, did not affect the final result of the load distribution analysis. The sensitivity analysis for this case shows that the first change of the S-I scenario to S-II takes place after 11 years for one case of weights distribution, with double overweighting of the k4 criterion. However, it did not affect the final result of the load distribution analysis.
The operational characteristics of the electrolyzer were obtained on the basis of its external characteristics (i.e., the voltage current characteristics—U = f(I)) [35]. It is commonly known that the electrolyzer operates in the linear part of the voltage current characteristic, above the threshold voltage. This affects the shape of the power curve of the electrolyzer. The power curve can be expressed as a P = f(I) or P = f(VH2) function. The power curve of the electrolyzer, similar to the case of the PV installation, can be approximated with a linear function. Therefore, a performance decline in the electrolyzer, caused by a decrease of the average stack voltage of 3 μV/h, does not entail a large displacement of the characteristic after seven years of exploitation in relation to year 0. The decrease in electrolyzer efficiency over one year of operation is 1%. In addition, the electrolyzer works only on the excess power generated by the PV and wind turbines. The nominal power values of the generation devices are optimally selected. Therefore, the electrolyzer operates in the lower range of hydrogen production performance, where the electrolyzer characteristics practically overlap with each other.
The operational characteristics of the fuel cell stack were obtained on the basis of the external characteristics of the fuel cell. The operational characteristic of the FC consists of a non-linear area of activation losses, a linear area of ohmic losses, and a non-linear area of mass transfer losses [36]. Only the first two areas were taken into account in the exploitation process. The non-linear characteristic, U = f(I), determines the non-linear shape of the P = f(VH2) characteristic of the fuel cell.
Even when using a hydrogen flow above 10 Nm3/h, the characteristics for different years of operation diverge. The fuel cell in HPGS often has to cover shortages of electricity production using stored hydrogen, and later on, hydrogen from an additional source. Although the value of the average voltage drop was assumed to be the same as for the electrolyzer, the performance decrease was greater by 1%. Annually, fuel cell efficiency decreases by 2%. The fuel cell is the weakest point of the hybrid power generation system considered. Consequently, it has the greatest impact on the change in the value of decision criteria and on the final result of the multi-criteria analysis of load distribution.

6. Conclusions

This article presented the results of research on the impact of degradation of PV/WT/FC HPGS devices on the final result of long-term scheduling of HPGS work in an electricity system. To solve the problem, an algorithm based on the energy analysis of HPGS components and a multi-variant method of decision making were used. The use of the compromise programming method allowed the energy, economic, and environmental aspects connected with the electricity production process to be taken into account. The obtained results confirmed the thesis assumed by the authors: A performance decline in HPGS devices has an impact on the final result of scheduling the work of HPGSs in an electricity system. After seven years of operation of the considered HPGS, the share of the electricity system covering load demand will need to be increased. Therefore, according to the authors, the development of mathematical models for technical and economic analyses of hybrid power generation systems requires taking into account a performance decrease in energy converters, especially electrochemical ones, during their lifetime. The next research of the authors will concern the determination of the profitability limit for HPGS operation. The authors’ research focuses on ways to improve HPGS energy reliability and determine the costs of this reliability.

Author Contributions

Conceptualization, B.C. and A.O.; Methodology, B.C.; Software, B.C.; Validation, B.C.; Formal analysis, B.C.; Investigation, B.C.; Resources, B.C.; Data curation, B.C.; Writing—original draft preparation, B.C. and A.O.; Writing—review and editing, A.O.; Visualization, A.O.; Supervision, B.C.; Project administration, B.C.; Funding acquisition, B.C.

Funding

This research was funded by the Ministry of Science and Higher Education, grant number 04/41/SBAD/4415.

Conflicts of Interest

The authors declare no conflict of interest.

Nomenclature

Indexes
mnumber of scenarios in multi-criteria analysis
nnumber of criteria in multi-criteria analysis
Parameters
mnumber of scenarios in multi-criteria analysis
nnumber of criteria in multi-criteria analysis
dH2specific energy consumption by an electrolyzer for production of 1 kg of hydrogen [kWh/kgH2]
mH2mass stream of hydrogen produced by an electrolyzer [kgH2/h]
ncoefficient of simultaneous operation of photovoltaic installation and wind turbines
kshape parameter (k > 0)
vwind speed [m/s]
xmm-th coordinate of ideal point
xnmvalue of assessment criterion
x’nmnormalized value of assessment criterion
αpower exponent equal to 1, 2 or ∞
λscale parameter (λ > 1)
ηELefficiency of electrolyzer
ηPVefficiency of photovoltaic panels
ηFC efficiency of fuel cell
wmweight factor of m-th criterion
CO2/H2amount of CO2 connected with production 1 kg of H2 [kgCO2/kgH2]
Esolar irradiance [W/m2]
EHPGSenergy produced by hybrid power generation system [kWh]
Eloadenergy consumption by consumer [kWh]
Esys energy from electricity system [kWh]
Etthermo-neutral voltage [V]
Kd costs of depreciation [PLN]
Ke hybrid system operating costs [PLN]
KO&MHPGS operating costs [PLN]
KH2costs of hydrogen for backup purposes [PLN]
KH2Ocost of water for the electrolysis process [PLN]
Lαmeasure of differences of the concerned Sn scenario from the ideal point
MH2 mass of additional hydrogen consumption for backup purposes [kgH2]
Pav_PVaverage value of power generated by PV panels [kW]
Pav_WTaverage value of power generated by wind turbines [kW]
PFCpower rating of fuel cell stack [kW]
PElnominal power of electrolyzer [kW]
Pmax_WT maximum power of wind turbine [kW]
Pmax_PV maximum power of PV panels [kW]
Pmin_load minimum load power [kW]
Pord maximum input power from electricity system [kW]
PLNcurrency in Poland
Stotal photovoltaic panels area [m2]
Sn n - scenario
Sn*the best scenario
Tatime of year [h]
Uavaverage voltage value of one cell [V]
VH2volumetric additional hydrogen consumption for backup purposes [Nm3H2/h]
WECO2indicator of carbon dioxide emissions in the electricity system [kgCO2/MWh]
Wkcoefficient of performance
Ww coefficient taking into account the inclination of PV installation
Variables
k1the unit use of additional hydrogen by HPGS [Nm3H2/kWh]
k2the unit cost of electricity production by HPGS [PLN/kWh]
k3the ratio of CO2 emission by HPGS and electricity system [kgCO2/kWh]
k4the degree of capacity utilization ordered from electricity system [kgCO2/kWh]
Functions
P(v)operational characteristics of wind turbine
f(v)Weibull distribution of wind speeds

References

  1. Shayeghi, H.; Shahryari, E.; Moradzadeh, M.; Siano, P. A Survey on Microgrid Energy Management Considering Flexible Energy Sources. Energies 2019, 12, 2156. [Google Scholar] [CrossRef]
  2. Polish Power Networks (In Polish: Polskie Sieci Elektroenergetyczne). Available online: https://www.pse.pl/web/pse-eng (accessed on 15 July 2019).
  3. Marcos, J.; de la Perra, I.; Garcia, M.; Marroyo, L. Control Strategies to Smooth Short-Term Power Fluctuations in Large Photovoltaic Plants Using Battery Storage Systems. Energies 2014, 7, 6593–6619. [Google Scholar] [CrossRef]
  4. Wang, W.; Mao, C.; Lu, J.; Wang, D. An Energy Storage System Sizing Method for Wind Power Integration. Energies 2013, 6, 3392–3404. [Google Scholar] [CrossRef] [Green Version]
  5. Rezk, H.; Dousoky, G.M. Technical and economic analysis of different configurations of stand-alone hybrid renewable power systems–A case study. Renew. Sustain. Energy Rev. 2016, 62, 941–953. [Google Scholar] [CrossRef]
  6. Jurasz, J.; Beluco, A.; Canales, F.A. The impact of complementarity on power supply reliability of small scale hybrid energy systems. Energy 2018, 161, 737–743. [Google Scholar] [CrossRef]
  7. Maleki, A.; Askarzadeh, A. Artificial bee swarm optimization for optimum sizing of a stand-alone PV/WT/FC hybrid system considering LPSP concept. Sol. Energy 2014, 107, 227–235. [Google Scholar] [CrossRef]
  8. Fathy, A. A reliable methodology based on mine blast optimization algorithm for optimal sizing of hybrid PV-wind-FC system for remote area in Egypt. Renew. Energy 2016, 95, 367–380. [Google Scholar] [CrossRef]
  9. Hatata, A.Y.; Lafi, A. Clonal Selection Algorithm for Optimum Sizing of WT/PV/FC Hybrid Renewable Power System. In Proceedings of the 1st International Conference on Computer Applications & Information Security (ICCAIS), Riyadh, Saudi Arabia, 4–6 April 2018. [Google Scholar]
  10. Maleki, A.; Askarzdeh, A. Comparative study of artificial intelligence techniques for sizing of a hydrogen-based stand-alone photovoltaic/wind hybrid system. Int. J. Hydrogen Energy 2014, 19, 9973–9984. [Google Scholar] [CrossRef]
  11. Al-falahi, M.D.A.; Jayasinghe, S.D.G.; Enshaei, H. A review on recent size optimization methodologies for standalone solar and wind hybrid renewable energy system. Energy Convers. Manag. 2017, 143, 252–274. [Google Scholar] [CrossRef]
  12. Anoune, K.; Bouya, M.; Astito, A.; Abdellah, A.B. Sizing methods and optimization techniques for PV-wind based hybrid renewable energy system: A review. Renew. Sustain. Energy Rev. 2018, 93, 652–673. [Google Scholar] [CrossRef]
  13. Nieto, A.; Vita, V.; Ekonomou, L.; Mastorakis, N.E. Economic analysis of energy storage system integration with a grid connected intermittent power plant, for power quality purposes. WSEAS Trans. Power Syst. 2016, 11, 65–71. [Google Scholar]
  14. Nieto, A.; Vita, V.; Maris, T.I. Power quality improvement in power grids with the integration of energy storage systems. Int. J. Eng. Res. Technol. 2016, 5, 438–443. [Google Scholar]
  15. Al Ghaithi, H.M.; Fotis, G.P.; Vita, V. Techno-economic assessment of hybrid energy off-grid system—A case study for Masirah island in Oman. Int. J. Power Energy Res. 2017, 1, 103–116. [Google Scholar] [CrossRef]
  16. Wang, C.; Nehir, M.H. Power Management of a Stand-Alone Wind/Photovoltaic/Fuel Cell Energy System. IEEE Trans. Energy Convers. 2008, 23, 957–967. [Google Scholar] [CrossRef]
  17. Bizon, N.; Oproescu, M.; Raceanu, M. Efficient energy control strategies for a Standalone Renewable/Fuel Cell Hybrid Power Source. Energy Convers. Manag. 2015, 90, 93–110. [Google Scholar] [CrossRef]
  18. García-Triviñoa, P.; Llorens-Iborraa, F.; García-Vázqueza, C.A.; Gil-Menaa, A.J.; Fernández-Ramíreza, L.M.; Juradob, F. Long-term optimization based on PSO of a grid-connected renewable energy/battery/hydrogen hybrid system. Int. J. Hydrogen Energy 2014, 21, 10805–10816. [Google Scholar] [CrossRef]
  19. Moghaddam, M.J.H.M.; Kalam, A.; Nowdeh, S.A.; Ahmadi, A.; Babanezhad, M.; Saha, S. Optimal sizing and energy management of stand-alone hybrid photovoltaic/wind system based on hydrogen storage considering LOEE and LOLE reliability indices using flower pollination algorithm. Renew. Energy 2019, 135, 1412–1434. [Google Scholar] [CrossRef]
  20. Garcia, P.; Garcia, C.A.; Fernández, L.M.; Llorens, F.; Jurado, F. ANFIS-Based Control of a Grid-Connected Hybrid System Integrating Renewable Energies, Hydrogen and Batteries. IEEE Trans. Ind. Inform. 2014, 10, 1107–1117. [Google Scholar] [CrossRef]
  21. Bukar, A.L.; Tan, C.W. A review on stand-alone photovoltaic-wind energy system with fuel cell: System optimization and energy management strategy. J. Clean. Prod. 2019, 221, 73–88. [Google Scholar] [CrossRef]
  22. Omazic, A.; Oreski, G.; Halwachs, M.; Eder, G.C.; Hirschl, C.; Neumaier, L.; Pinter, G.; Erceg, M. Relation between degradation of polymeric components in crystalline silicon PV module and climatic conditions: A literature review. Sol. Energy Mater. Sol. Cells 2019, 192, 123–133. [Google Scholar] [CrossRef]
  23. Liu, Z.; Castillo, M.L.; Youssef, A.; Serdy, J.G.; Watts, A.; Schmid, C.; Kurtz, S.; Peters, I.M.; Buonassisi, T. Quantitative analysis of degradation mechanisms in 30-year-old PV modules. Sol. Energy Mater. Sol. Cells 2019, 20, 110019. [Google Scholar] [CrossRef]
  24. Višniakov, N.; Kilikevičius, A.; Novickij, J.; Grainys, A.; Novickij, V. Low-cost experimental facility for evaluation of the effect of dynamic mechanical loads on photovoltaic modules. Maint. Reliab. 2015, 17, 334–337. [Google Scholar]
  25. Kilikevičienė, K.; Matijošius, J.; Fursenko, A.; Kilikevičius, A. Tests of hail simulation and research of the resulting impact on the structural reliability of solar cells. Maint. Reliab. 2019, 21, 275–281. [Google Scholar] [CrossRef]
  26. Yousfi-Steiner, N.; Moçotéguy, P.; Candusso, D.; Hissel, D.; Hernandes, A.; Aslanides, A. A review on PEM voltage degradation associated with water management: Impacts, influent factors and characterization. J. Power Sources 2008, 183, 260–274. [Google Scholar] [CrossRef]
  27. Ceran, B. The concept of use of PV/WT/FC hybrid power generation system for smoothing the energy profile of the consumer. Energy 2019, 167, 853–865. [Google Scholar] [CrossRef]
  28. Chandesris, M.; Vincent, R.; Guatez, L.; Roch, J.-S.; Thoby, D.; Quinaud, M. Membrane degradation in PEM fuel cells: From experimental results to semi-empirical degradation laws. Int. J. Hydrogen Energy 2017, 42, 8139–8149. [Google Scholar] [CrossRef]
  29. Ceran, B.; Szczerbowski, R. Energy cost analysis by hybrid power generation system. IOP Conf. Ser. Earth Environ. Sci. 2019, 214, 012001. [Google Scholar] [CrossRef]
  30. Szczerbowski, R.; Ceran, B. Technical and Economic Analysis of a Hybrid Generation System of Wind Turbines, Photovoltaic Modules and a Fuel Cell. E3S Web Conf. 2016, 10, 00090. [Google Scholar] [CrossRef] [Green Version]
  31. Chmielniak, T.; Lepszy, S.; Mońka, P. Hydrogen energy–Main problems. Polityka Energetyczna Energy Policy J. 2017, 20–23, 55–66. [Google Scholar]
  32. Verhage, A.; Gerits, J.; Manders, T. Duration Tests of PEM Fuel Cells in a 50 kW Pilot Power Plant. In Proceedings of the 18th World Hydrogen Energy Conference (WHEC), Essen, Germany, 16–20 May 2010; pp. 63–67. [Google Scholar]
  33. Renewable Electrolysis Integrated Systems Development and Testing. Available online: https://www.hydrogen.energy.gov (accessed on 15 July 2019).
  34. Ceran, B. The use of multi-criteria analysis to compare the operating scenarios of the hybrid generation system of wind turbines, photovoltaic modules and a fuel cell. E3S Web Conf. 2017, 22, 00028. [Google Scholar] [CrossRef]
  35. Ceran, B. A comparative analysis of energy storage technologies. Polityka Energetyczna Energy Policy J. 2018, 21–23, 97–110. [Google Scholar]
  36. Ceran, B.; Bernstein, P.A. Operational characteristics of proton exchange membrane (PEM) fuel cells. Przegląd Elektrotechniczny 2014, 10, 102–105. [Google Scholar]
Figure 1. HPGS configuration to optimize the size of the PV/WT/FC hybrid system: PV, WT—renewable (solar and wind) energy sources, El—electrolyzer, C—compressor, M—electric motor, FC—fuel cell stack.
Energies 12 03453 g001
Figure 2. Block diagram of the model used to determine HPGS and NPS load distribution taking into account performance decrease characteristics of the PV, FC, and El.
Energies 12 03453 g002
Figure 3. Aging characteristic over seven years for the PV—own study.
Energies 12 03453 g003
Figure 4. Decline of the average voltage of the PEM-type fuel cell stack [32].
Energies 12 03453 g004
Figure 5. Influence of the years of operation on the fuel cell power curve—own study.
Energies 12 03453 g005
Figure 6. Influence of the years of operation on the electrolyzer power curve—own study.
Energies 12 03453 g006
Figure 7. Influence of the years of operation on the specific energy consumption by an electrolyzer for the production of 1 kg of hydrogen—own study.
Energies 12 03453 g007
Figure 8. Energy profile of the consumer (S-I, S-II, S-III, S-IV—work scenarios)—own study.
Energies 12 03453 g008
Figure 9. Change in the value of decision criterion k1 for the S-I scenario.
Energies 12 03453 g009
Figure 10. Change in the value of decision criterion k2 for the S-I scenario.
Energies 12 03453 g010
Figure 11. Change in the value of decision criterion k3 for the S-I scenario.
Energies 12 03453 g011
Figure 12. Results of the multi-criteria analysis of load distribution taking into account a decrease in the performance of the photovoltaic installation, fuel cell, and electrolyzer.
Energies 12 03453 g012
Figure 13. Results of the multi-criteria analysis of load distribution taking into account a decrease in the performance of the fuel cell alone in the time of exploitation.
Energies 12 03453 g013
Table 1. Nominal power of generation devices in HPGS to supply the consumer according to a given scenario.
Scenarios
Devices in HPGSS-IS-IIS-IIIS-IV
Wind turbines [kW]2 × 802 × 801 × 801 × 80
PV panels 290 Wp467 × 290240 × 290328 × 290119 × 290
Fuel cell [kW]70605040
Electrolyzer [kW]18015010080
Table 2. Values of decision criteria determined for year 0 and year 7 of HPGS exploitation.
Scenarios
Devices in HPGSSISIISIIISIV
Year_0Year_7Year_0Year_7Year_0Year_7Year_0Year_7
k1 [Nm3/kWh]0.1190.2310.0900.1650.0720.1310.0470.083
Δk1[Nm3/kWh]+0.112+0.075+0.059+0.036
k2 [PLN/kWh]1.3001.4171.3201.4201.3311.4371.4541.549
Δk2[PLN/kWh]+0.117+0.100+0.106+0.095
k3 [kgCO2/kWh]0.3100.4470.4150.5080.5280.6010.6270.671
Δk3[kgCO2/kWh]+0.137+0.093+0.073+0.044
k4 [kWh/kWh]1.0001.0791.1251.159
Table 3. Results of the multi-criteria analysis of load distribution taking into account a decrease in the performance of PV, FC, and El during the exploitation.
Weight Ratios
w1:w2:w3:w4
Year 0,1,2Year 3Year 4Year 5Year 6Year 7
α = 1α = 2α = 1α = 2α = 1α = 2α = 1α = 2α = 1α = 2α = 1α = 2
1:1:1:1SIISIISIISIISIISIISIISIISIVSIISIVSII
2:1:1:1SIVSIVSIVSIVSIVSIVSIVSIVSIVSIVSIVSIV
1:2:1:1SIISIISIISIISIISIISIISIISIISIISIISII
1:1:2:1SISISISISISISISISIISISIISII
1:1:1:2SISISIISIISIISIISIISIISIISIISIISII
2:2:1:1SIVSIVSIVSIVSIVSIVSIVSIVSIVSIVSIVSIV
1:1:2:2SISISISISISISISISISISIISI
3:1:1:1SIVSIVSIVSIVSIVSIVSIVSIVSIVSIVSIVSIV
1:3:1:1SIISIISIISIISIISIISIISIISIISIISIISII
1:1:3:1SISISISISISISISISISISIISI
1:1:1:3SISISISISISISISISIISISIISI
3:3:1:1SIVSIVSIVSIVSIVSIVSIVSIVSIVSIVSIVSIV
1:1:3:3SISISISISISISISISISISISI
Table 4. Results of the multi-criteria analysis of load distribution taking into account a decrease in the performance of PV installation alone over the time of exploitation.
Weight Ratios
w1:w2:w3:w4
Year 0…10Year 11…12Year 13…20
α = 1α = 2α = 1α = 2α = 1α = 2
1:1:1:1SIISIISIISIISIISII
2:1:1:1SIVSIVSIVSIVSIVSIV
1:2:1:1SIISIISIISIISIISII
1:1:2:1SISISISISISI
1:1:1:2SISISIISISIISII
2:2:1:1SIVSIVSIVSIVSIVSIV
1:1:2:2SISISISISISI
3:1:1:1SIVSIVSIVSIVSIVSIV
1:3:1:1SIISIISIISIISIISII
1:1:3:1SISISISISISI
1:1:1:3SISISISISISI
3:3:1:1SIVSIVSIVSIVSIVSIV
1:1:3:3SISISISISISI
Table 5. Results of the multi-criteria analysis of load distribution taking into account a decrease in the performance of the electrolyzer alone, in the time of exploitation.
Weight Ratios
w1:w2:w3:w4
Year 0…6Year 7
α = 1α = 2α = 1α = 2
1:1:1:1SIISIISIISII
2:1:1:1SIVSIVSIVSIV
1:2:1:1SIISIISIISII
1:1:2:1SISISISI
1:1:1:2SISISISI
2:2:1:1SIVSIVSIVSIV
1:1:2:2SISISISI
3:1:1:1SIVSIVSIVSIV
1:3:1:1SIISIISIISII
1:1:3:1SISISISI
1:1:1:3SISISISI
3:3:1:1SIVSIVSIVSIV
1:1:3:3SISISISI
Table 6. Results of the multi-criteria analysis of load distribution taking into account a decrease in the performance of the fuel cell only in the time of exploitation.
Weight Ratios
w1:w2:w3:w4
Year 0…5Year 6Year 7
α = 1α = 2α = 1α = 2α = 1α = 2
1:1:1:1SIISIISIVSIISIVSII
2:1:1:1SIVSIVSIVSIVSIVSIV
1:2:1:1SIISIISIISIISIISII
1:1:2:1SISISIISISIISII
1:1:1:2SISISIISIISIISII
2:2:1:1SIVSIVSIVSIVSIVSIV
1:1:2:2SISISIISISIISI
3:1:1:1SIVSIVSIVSIVSIVSIV
1:3:1:1SIISIISIISIISIISII
1:1:3:1SISISISISIISI
1:1:1:3SISISIISISIISI
3:3:1:1SIVSIVSIVSIVSIVSIV
1:1:3:3SISISISISISI

