Article

Dynamic Viscosity, Surface Tension and Wetting Behavior Studies of Paraffin–in–Water Nano–Emulsions †

1
Université Rennes 1, LGCGM, EA3913, F-35704 Rennes, France
2
Institute of Construction Technologies, National Research Council, I–35127 Padova, Italy
3
Departamento de Física Aplicada, Universidade de Vigo, E–36310 Vigo, Spain
4
Institute of Condensed Matter Chemistry and Technologies for Energy, National Research Council, I–35127 Padova, Italy
*
Authors to whom correspondence should be addressed.
This article is an extended version of our paper published in 1st International Conference on Nanofluids (ICNf) and 2nd European Symposium on Nanofluids (ESNf), Castellón, Spain, 26–28 June 2019; pp. 118–121.
Energies 2019, 12(17), 3334; https://doi.org/10.3390/en12173334
Submission received: 23 July 2019 / Revised: 19 August 2019 / Accepted: 24 August 2019 / Published: 29 August 2019

Abstract

:
This work analyzes the dynamic viscosity, surface tension and wetting behavior of phase change material nano–emulsions (PCMEs) formulated at dispersed phase concentrations of 2, 4 and 10 wt.%. Paraffin–in–water samples were produced using a solvent–assisted route, starting from RT21HC technical grade paraffin with a nominal melting point at ~293–294 K. In order to evaluate the possible effect of paraffinic nucleating agents on those three properties, a nano–emulsion with 3.6% of RT21HC and 0.4% of RT55 (a paraffin wax with melting temperature at ~328 K) was also investigated. Dynamic viscosity strongly rose with increasing dispersed phase concentration, showing a maximum increase of 151% for the sample containing 10 wt.% of paraffin at 278 K. For that same nano–emulsion, a melting temperature of ~292.4 K and a recrystallization temperature of ~283.7 K (which agree with previous calorimetric results of that emulsion) were determined from rheological temperature sweeps. Nano–emulsions exhibited surface tensions considerably lower than those of water. Nevertheless, at some concentrations and temperatures, PCME values are slightly higher than surface tensions obtained for the corresponding water+SDS mixtures used to produce the nano–emulsions. This may be attributed to the fact that a portion of the surfactant is taking part of the interface between dispersed and continuous phase. Finally, although RT21HC–emulsions exhibited contact angles considerably inferior than those of distilled water, PCME sessile droplets did not rapidly spread as it happened for water+SDS with similar surfactant contents or for bulk–RT21HC.

1. Introduction

Phase change materials (PCMs) are substances that absorb/release large amounts of so−called “latent heat” when they undergo a phase change transition such as melting and freezing processes [1,2]. Thermal energy storage systems based on PCMs allow larger densities of energy storage within reduced temperature ranges, when compared to those reservoirs working with conventional thermal fluids (only based on sensible heat). Hence, phase change materials are considered potential energy saving materials to substantially improve the thermal energy storage capacity of a wide range of domestic or industrial facilities. However, an extended practical implementation of PCMs relies on their proper integration in thermal facilities. In this sense, phase change slurries have recently emerged as an interesting possibility [3]. PCM slurries are novel heat storage and transfer media that combine the latent capacity provided by the PCM and the good transport properties of the carrier fluid. Such slurries exhibit fluid–like behavior (they can be pumped) even when PCM droplets are solid or undergo phase transition. Therefore, these latent fluids may be directly integrated in thermal facilities without needing an additional thermal energy exchange [4]. Furthermore, PCM slurries allow higher heat transfer rates than only PCMs due to the large surface to volume ratio of the continuous phase [4].
Basically, there are three main types of phase changing slurries suitable for thermal management, namely hydrate slurries, micro–encapsulated/shape stabilized PCM suspensions and PCM–in–water emulsions [5]. Phase change material nano–emulsions (PCMEs) are formulated by directly dispersing fine droplets of a PCM into a carrier fluid with the assistance of appropriate surfactants. In this sense, PCMEs do not only avoid the supporting or coating materials necessary in micro–encapsulated/shape stabilized PCM suspensions, but they often exhibit lower rises in viscosity [4]. In addition, for phase change material emulsions, heat transfer is improved since there is a direct contact between the PCM and the carrier fluid (only separated by a thin surfactant layer) [6]. PCMEs have been investigated in the last years for different potential applications such as solar thermal facilities; heating, ventilation and air conditioning systems or increasing the thermal inertia of building components, among others [7,8]. An interesting approach to integrate PCM nano–emulsions is the use of capillary tube systems in cool ceiling and walls [6]. Thus, PCMEs with melting transitions on a temperature level of ~289–293 K can provide an additional density of storage energy in comparison to water normally utilized in such tubular mat systems. As an example, CryoSolplus20-in-water emulsions were developed by Huang et al. [9] for this kind of applications.
The evaluation of PCME thermal performance as storage and transfer media relies on an accurate characterization of the temperatures at which PCM nano–droplets undergo the phase change as well as the amounts of absorbed or released heat in those thermal events. However, the study of other thermophysical properties is also necessary to estimate the flow behavior and heat transfer performance of these materials. Thus, reliable viscosity data are essential for an appropriate selection and operation of equipment involved in formulation, storage or pumping of nano–emulsions. A revision of previous investigations on dynamic viscosity of PCM nano–emulsions or micro–encapsulated PCM suspensions shows that mass fraction of dispersed phase must usually be lower than 10–30 wt.% to ensure desired sample fluidity [5]. Inaba et al. [10,11] studied the dynamic viscosity of (n–tetradecane)–in–water emulsions at paraffin concentrations between 7.2 and 50.7 wt.%. Authors observed a pseudoplastic behavior and a slight change in viscosity when the PCM underwent liquid–solid phase change. Royon et al. [12] designed a paraffin–in–water emulsion containing a non–ionic surfactant and 50% of dispersed phase. In this case, dispersed phase droplets were ~2 μm in size and the melting point was 282.6 K. Studied sample showed a shear–thinning more pronounced when PCM droplets were solid. Also a slight jump in dynamic viscosity was observed during the solid–liquid transition of the dispersed phase.
Huang et al. [4,5] analyzed the rheological behavior of Rubitherm RT10–in–water emulsions prepared at paraffin loadings from 15 to 75 wt.% using a non–ionic surfactant (average PCM droplet sizes ~3–5 μm according to DLS measurements). In the flow curves (which cover the shear rate region up to 200 s−1), samples were observed to exhibit a pseudoplastic behavior, which was more noticeable as the paraffin concentration increased. The addition of the PCM droplets also leaded to important rises in viscosity and consequently nano–emulsion viscosities were several times greater than that of water, even for the lowest concentration (15 wt.%). Authors found considerable higher viscosity increases at low temperatures (when PCM droplets are solid) and attributed this behavior to less deformation of solid particles. Wang et al. [13] produced water–based PCM emulsions using a mixture of polyvinyl alcohol and polyethylene glycol as emulsifier, 20 wt.% of paraffin (melting point ~331–333 K) as dispersed phase (droplet size 2–8 μm) and 0.05–0.1 wt.% of graphite as nucleating agent. Dynamic viscosity slightly decreased with the increasing shear rate (up to 100 s−1). Agresti et al. [14] recently studied the dynamic viscosity of aqueous nano–emulsions containing either commercial RT55 (melting temperature ~328 K) or RT70HC (~343 K) and stabilized with sodium dodecyl sulfate. Authors observed a strong non–Newtonian behavior in the case of RT70HC(10 wt.%)/water sample.
Some rheological studies on PCM nano–emulsions [4,5,9,13,15,16,17] or suspensions containing micro–encapsulated PCMs [18,19,20,21] also analyzed changes in dynamic viscosity occurring during the solidifyication/melting of phase change material droplets/micro–capsules. Most of those investigations observed deformations in shear viscosity–temperature evolution at temperatures around solid–liquid transitions. Huang and coworkers determined µ(T) curves through temperature ramp tests from 303 to 273 K and at cooling rates of 2 K/min for Rubitherm RT10–in–water emulsions [4,5] or acqueous PCMEs of CryoSolplus6, CryoSolplus10 and CryoSolplus20 [9]. In those experiments, authors observed as emulsion viscosity rapidly increased once the dispersed paraffin began to solidify, especially at high PCM contents (>50% in mass). A similar change was found by Wang et al. [17] in heating shear rate–temperature sweeps performed in the temperature interval from 298 to 353 K for paraffin–in–water emulsions decorated with carbon nanomaterials. Such deformations in µ(T) curves were attributed to changes in the shape or volume of PCM droplets undergoing solid–liquid phase transition or to the creation to transient networks among neighboring droplets. In the case of micro–encapsulated paraffin slurries, Dutkowski and Fiuk [20] recently ascribed similar alterations in heating µ(T) sweeps to the chaotic movement of the non–molten core inside partially melted micro–capsules. Hence, non–uniformity in the solid/liquid state of paraffin droplets may increase internal friction resistance between carrier fluid layers.
Micro–structural rearrangements or spherical shape–restoration of emulsion droplets subject to shear stress can generate normal stresses [22]. Historically, changes in normal stresses were considered to the first evidence of elasticity in liquids [23]. Although elastic and loss moduli obtained from oscillatory tests are usually more appropriate to characterize changes in the structure of materials and these experiments have almost replaced shear normal stress measurements, these last analyses still provide useful information in certain situations. Thus, the study of first normal force difference (∆N1) has been found valuable in the characterization of polymers containing suspended particles [24,25], for example. When it comes to PCM slurries, an analysis of the temperature evolution of normal stress in shear flow could contribute to a better understanding of possible structural transformations occuring during solid–liquid phase change of PCM droplets/micro–capsules.
Nano–emulsions are kinetically–stable systems rather than thermodynamically–stable ones [26,27]. However, when emulsifier(s) and preparation conditions are appropriately selected, nano–emulsions can stay uniform for long periods of storage and so they are sometimes referred as “approaching thermodynamic stability” or “pseudo–stable” materials [28,29]. Despite main mechanisms involving emulsions stability being usually described by the “electric double layer model” and “DLVO” theory, surface tension is also considered as a possible factor influencing the stability of this kind of materials [26]. In addition, wetting behavior may also play a major role in the case of microfluidics systems such as the capillary tubes or micro–tubular configurations above mentioned. Thus, knowledge of surface tension is also required to understand the balance between viscous and surface tension competing forces that usually controls the actuation in micro–flows and is also likely to affect pressure–flow characteristics [30,31].
In this study, we analyzed the dynamic viscosity, surface tension and wetting behavior of RT21HC–in–water nano–emulsions prepared at 2, 4 and 10 wt.% dispersed phase concentrations. Experimental measurements were carried out at temperatures ranging from 275 to 303 K to evaluate whether the solid/liquid state of paraffin droplets had any effect on studied physical properties. With this work we intend to complete the characterization of this nano–emulsion system started in our recent publication [32], in which phase change transitions, thermal conductivities and volumetric behavior were analyzed.

2. Materials and Methods

2.1. Materials

Technical grade RT21HC paraffin (Tmelt.= 293–294 K, Δhmelt.= 152 J/g) and RT55 wax (Tmelt.= 328 K) were supplied by Rubitherm Technologies GmbH (Berlin, Germany). Water, W, (18.2 MΩ·cm at 298 K) was produced by a Millipore system (Billerica, MA, USA). Hexane (>98.5%) and sodium dodecyl sulfate, SDS, (98%) utilized in the emulsification process were purchased from Sigma Aldrich. A Sartorius analytical balance (Sartorius GmbH, Göttingen, Germany) with an uncertainty of 1 × 10⁻⁴ g was used to weigh reagents.

2.2. Nano–Emulsion Formulation

RT21HC–in–water PCMEs were formulated following the solvent–assisted method proposed in Agresti et al. [14]. First, two solutions, one of RT21HC in hexane (at a RT21HC: hexane mass ratio of 1:5) and the other of SDS in water, were joined at 318 K in a low–power ultrasonic bath. In a second step, obtained mixture was further sonicated using a VCX130 ultrasonic disruptor (Sonics & Materials, Inc., Newtown, CT, USA) working at 20 kHz and 65 W together with a 12 mm tip. The sample was then warmed up at 363 K and mechanically stirred for 2–3 h to completely evaporate the hexane. In this study, a surfactant:paraffin ratio of 1:8 was fixed to ensure fine emulsions with long temporal stabilities [14]. Thus, designed samples contained 2, 4 and 10 wt.% of RT21HC (dispersed phase) and 0.25, 0.5 and 1.25 wt.% of SDS (surfactant), respectively. An additional sample prepared using 3.6 wt.% of RT21HC and 0.4 wt.% of RT55 (nucleating agent) as dispersed phase and 0.5% of SDS was also studied for comparison.
The hydrodynamic sizes and ζ–potential values of paraffin droplets were determined at 298 K using a Zetasizer Nano–ZS90 (Malvern Instruments Ltd., Worcestershire, UK) based on Dynamic Light Scattering (DLS) method [33]. Figure 1a shows the size distributions obtained for the three emulsions designed without nucleating agent [32] just after PCME formulation.
At 2 and 4 wt.% paraffin contents, PCM droplets exhibited average hydrodynamic sizes around ~90–100 nm and polydispersity indexes (pdl) ~0.17–0.23. A wider size distribution (pdl~ 0.28) was observed for RT21HC(10 wt.%)/water sample, with two main droplet populations around ~25 and ~180 nm. ζ–potential measurements showed negative values larger than −80 mV, indicating that electrostatically repulsive charges among droplets are strong enough to prevent agglomeration and coalescence. A thoughtful study of stability throughout storage, after freeze–thaw cycles and under mechanical shear was performed for these PCM nano–emulsions in our previous work [32].
The PCM droplet morphology of RT21HC(2 wt.%)/Water emulsion was also examined under a JSM-7100F thermal field scanning electron microscope (JEOL USA Inc., Peabody, MA, USA) operating at 5 kV. A four month–old sample was 1:20 diluted in water and sonicated in a Transonic TI–H–5 ultrasonic bath (Fisher Bioblock Scientific, Illkirch-Graffenstaden, France) operating at 550 W and 35 kHz for 5 minutes. The dilution was then deposited on the top of a carbon support and dried under atmospheric conditions. A representative SEM image (Figure 1b) shows that even agglomerated (due to the solvent evaporation necessary to carry out SEM studies), it is possible to intuit the sub–globular nano–metric morphology of the paraffin droplets.

2.3. Rheological Behavior

Shear viscosity (μ) was studied on a Malvern Kinexus Pro rheometer (Malvern Instruments Ltd., Worcestershire, U.K.) working with a cone–plate geometry (60 mm in diameter, a gap of 30 μm and 1° in cone angle). Temperature was controlled to within ±0.1 K by Peltier elements placed below the lower plate. Declared uncertainty of shear viscosity measurements with this device is better than 4% [34]. Two different types of experiments were carried out. First, shear viscosity–shear rate flow curves were obtained for water, water+SDS mixtures utilized to formulate the nano–emulsions, bulk–RT21HC and the four PCM–in–water emulsions. These tests were performed at 278.15 and 303.15 K except for the bulk paraffin (only studied in liquid phase, at 303.15 K). Viscosity values were collected in steady–state conditions at shear stresses logarithmically increasing from 0.008 to 3.5 Pa with at least 10 points per decimal, necessary to cover the range of shear rates between 10 and 1000 s−1 for all samples. In a second experiment, shear viscosity– and normal force–temperature curves in the range from 278 to 303 K were obtained at 0.2 and 1 K/min heating/scanning rates for water and RT21HC(10 wt.%)/water nano–emulsion.

2.4. Surface Properties

Interfacial tension (IFT), surface tension (SFT) and contact angle (CA) were studied by means of a drop shape analyser DSA–30 from Krüss GmbH (Hamburg, Germany) [35]. IFT and SFT determinations are based on pendant drop technique while CA investigations utilized sessile drop method. A TC40 environmental chamber (also from Krüss GmbH) was used during surface tension and contract angle analyses to control the temperature with a precision of ±0.2 K. Interfacial tension between bulk–RT21HC and water or between bulk–RT21HC and each of the three water+SDS mixtures used as base to produce the nano–emulsions were measured at room temperature (T = 297 ± 1 K). Liquid bulk–RT21HC was introduced in a glass container with ~40 ml of either water or water+SDS mixture using a J–shaped stainless needle (2.090 mm in gauge). Surface tensions at the air–sample surface were determined for distilled water, three water+SDS mixtures (at surfactant concentrations of 0.25, 0.5 and 1.25 wt.%), bulk–RT21HC and the four designed nano–emulsions using a 15–gauge needle (external diameter of 1.835 mm). Surface tension measurements were carried out in the range between 275 and 303 K, both increasing and decreasing temperature with steps of 2–5 K. The contact angles of water and nano–emulsion droplets formed using a 15–gauge needle and deposited on a stainless steel substrate were analyzed at 278 and 298 K using Young–Laplace equation. This substrate was previously utilized in the framework of a round robin test [36] in which nine independent European research centers of the Cost Action NanoUptake program [37] took part. A thoroughly characterization of substrate roughness is presented in Hernaiz et al. [36]. Recommendations such as substrate cleaning proposed in [36] were followed in this study. For the three physical properties, values were determined within a few seconds after drops were formed (IFT and SFT) or deposited in the stainless substrate (CA). Air–water interfacial tension was determined at room temperature and the result showed a deviation lower than 2% with surface tension data reported for water in [38]. Experimental uncertainty in measurements performed with this device was estimated to be 1% (SFT) [39], while a maximum relative deviation of 0.52% was obtained in [36] for this DSA–30 device measuring sessile drop gauges of 30°, 60° and 120° in CA.

3. Results and Discussion

3.1. Rheological Studies

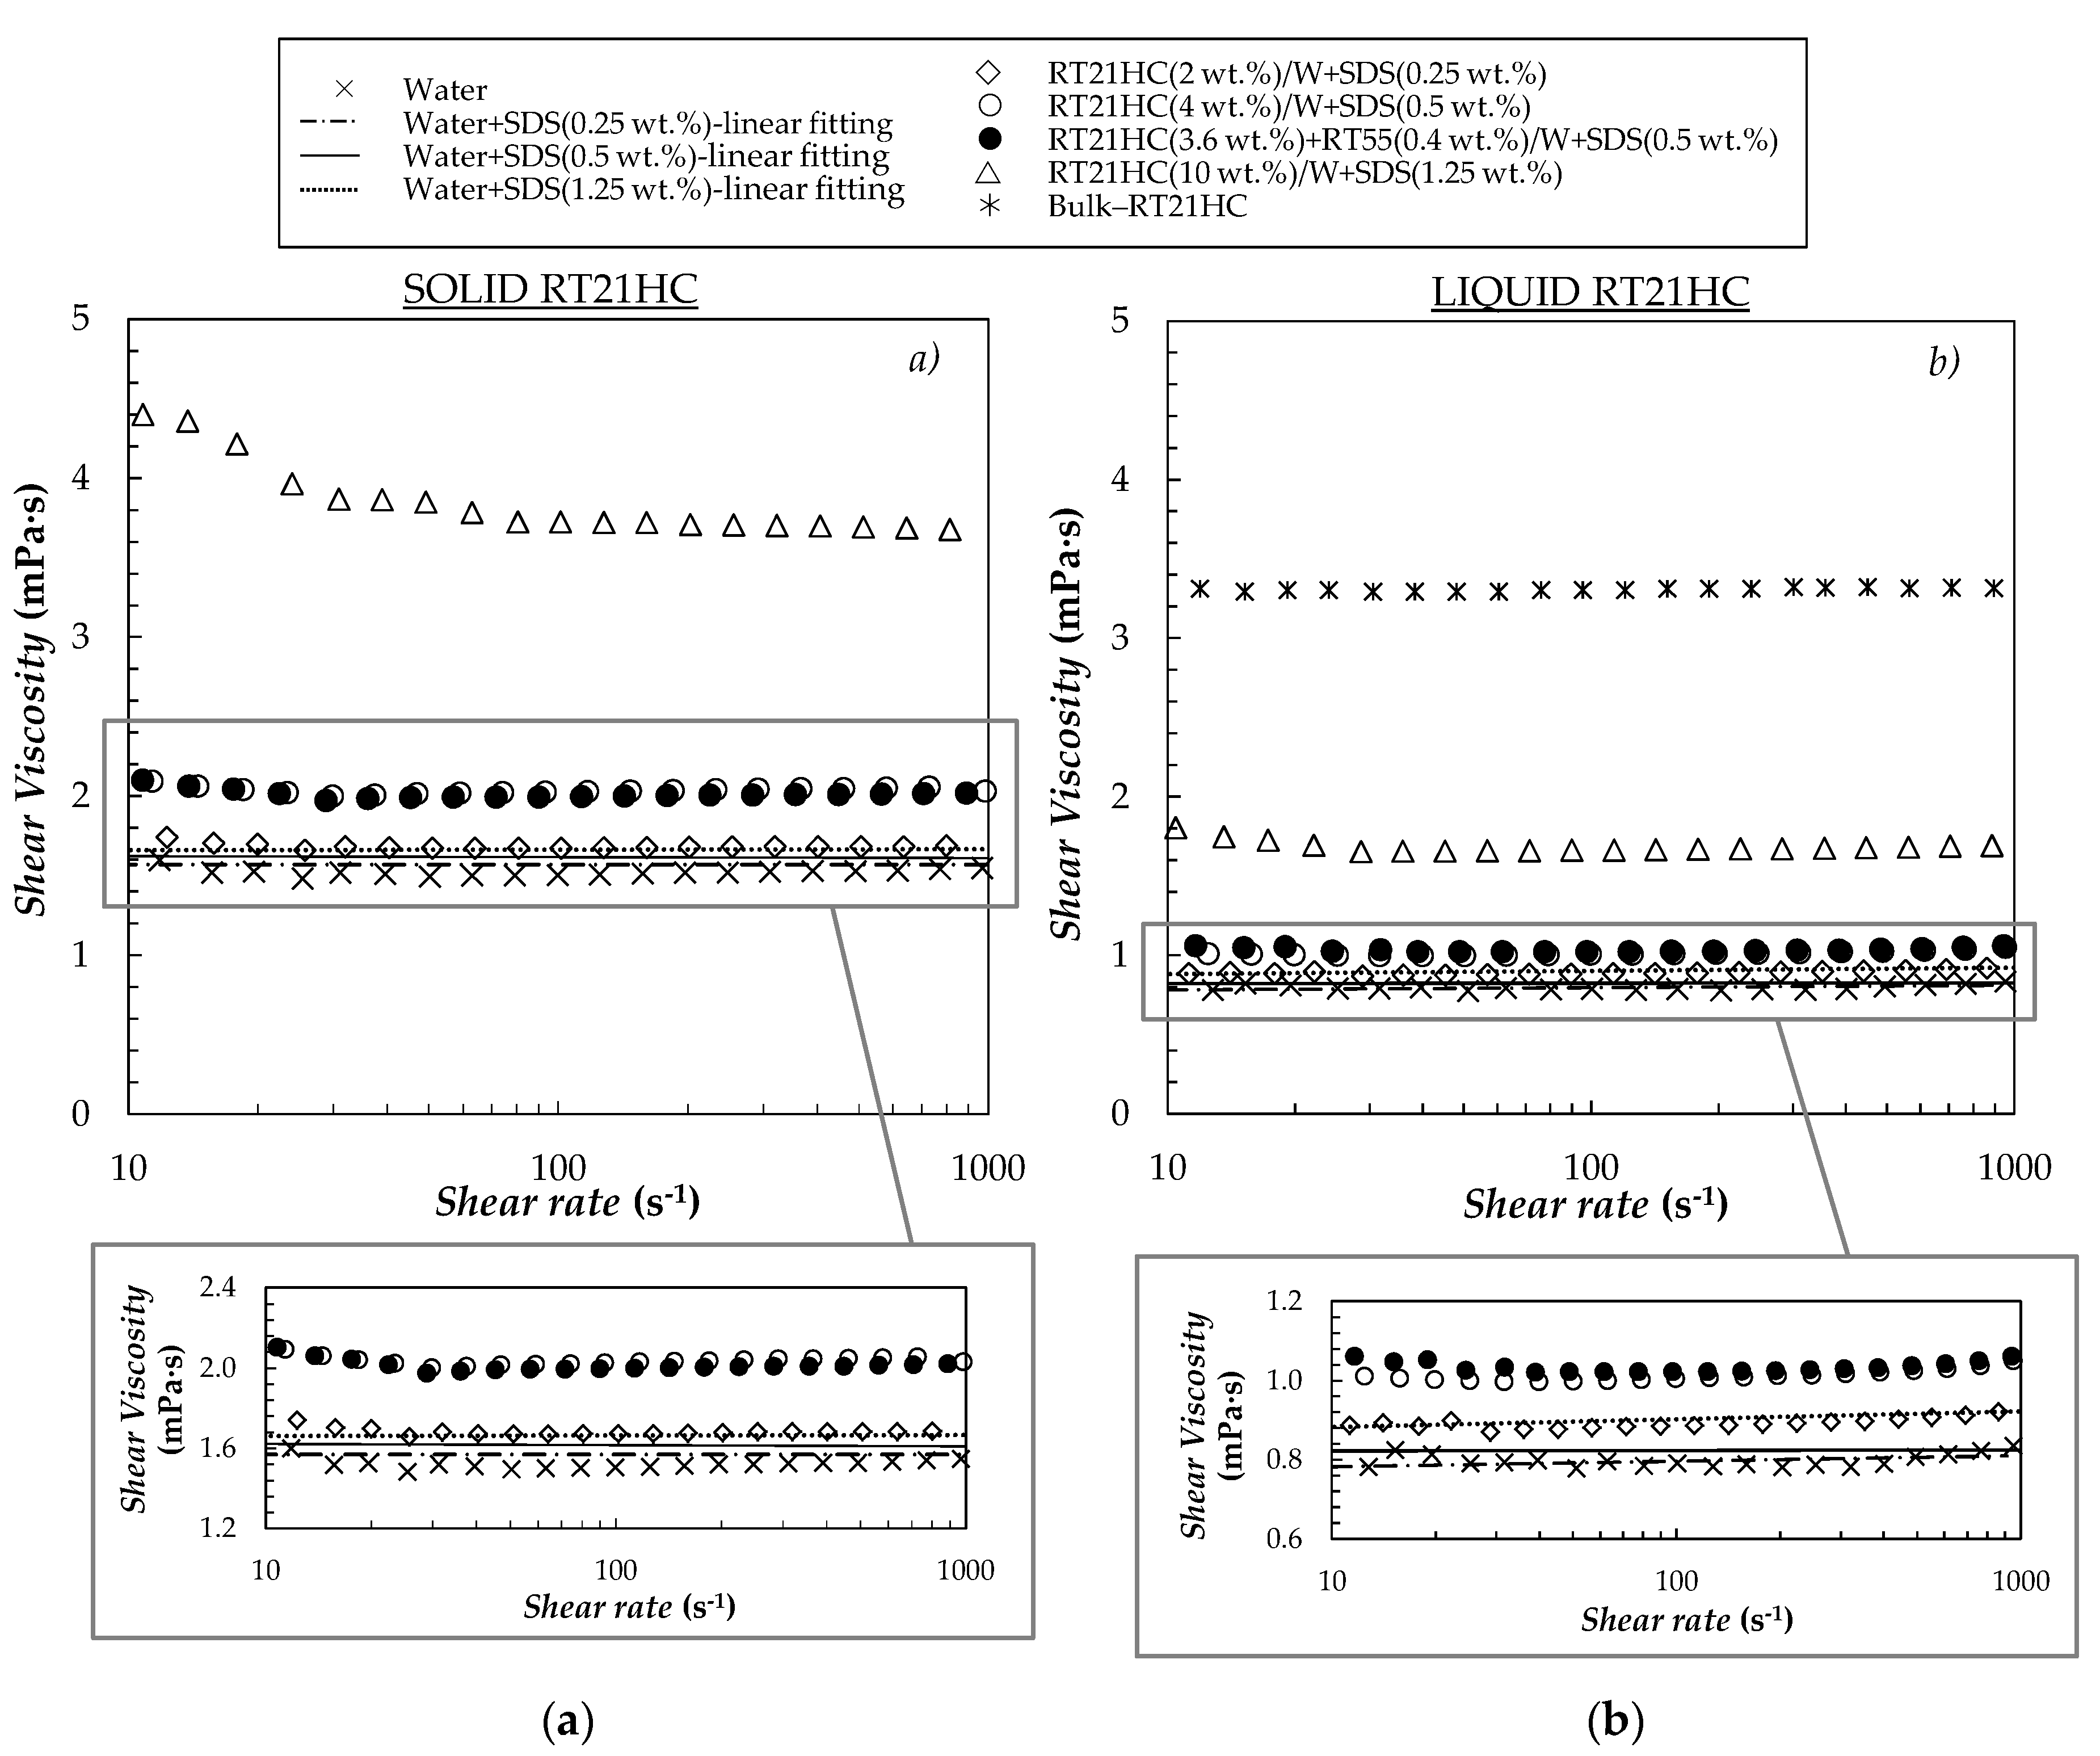
3.1.1. Shear Viscosity–Shear Rate Flow Curves

Figure 2 shows the shear viscosity dependence on shear rate obtained at 278.15 and 303.15 K for water, bulk–RT21HC and four nano–emulsions. Flow curves of water+SDS mixtures prepared at surfactant concentrations of 0.25, 0.5 and 1.25 wt.% are also presented for comparison. Viscosity results measured for distilled water showed average deviations lower than 1.9% with previous literature [40]. A good agreement was also found between the value of 3.32 mPa·s determined in this work at 303.15 K for bulk–RT21HC and the previous data of 3.16 mPa·s reported at the same temperature for bulk–RT21 (another commercial paraffinic PCM with similar melting point) by Ferrer et al. [41].
Like continuous and dispersed phases, nano–emulsions containing 2 and 4% mass concentrations of paraffin are mainly Newtonian within the studied shear rate range. However, a slight decrease in shear viscosity with increasing shear rate (pseudo–plastic behavior) was observed for the 10 wt.% paraffin loading in the region of low shear rates. As reviewed in the introduction, PCM nano–emulsions with shear–thinning behaviors were also reported in several studies [4,5,10,11,12,13,14]. Viscosity values and relative viscosities (defined as the ratio between sample and water viscosities at shear rates around ~100 s−1 (Newtonian region) are gathered in Table 1.
As can be observed, viscosity strongly rises with PCM+SDS loading, reaching increases up to 151% in the case of RT21HC(10 wt.%)/Water nano–emulsion. Larger viscosity increments were observed at 278.15 K (when the material of droplets is solid) than at 303.15 K (liquid droplets). This is more appreciable in the case of RT21HC(10 wt.%)/water sample, for which indicated difference reached 39%. A similar behavior was reported by Mikkola et al. [42] when the viscosity of studied paraffin–in–water emulsions using either a falling ball viscosimeter or a rotational rheometer. In that last investigation, authors reported μ/μwater ratios of 2.35 (at temperatures at which paraffin droplets were solid) and 1.95 (liquid paraffin droplets) for a dispersed phase concentration of 10 wt.%. Those viscosity ratios are close in value to the results presented here for the same PCM load.
Oil–in–water emulsions with micro– or macro–metric droplets are known to usually exhibit lower viscosity ratios (regarding base fluid) than solid–water suspensions with the same particle size. This fact can be attributed to three different causes. (i) When dispersed phase is liquid, material inside droplets tends to roll around in a “tank–tread–like” motion during sample flow [23]. The friction caused by relative movements between layers of dispersed material makes that the moment of rotation transmitted to the surface layers gets reduced as it moves towards the center of the drops. This internal circulation in liquid particles reduces resulting droplet rotation and, consequently, flow disturbance [20]. The higher the dispersed phase to continuous phase viscosity ratio (i.e., z = μPCMwater), the more deformed will get the streamlines (approaching the limit of droplet viscosity of rigid–sphere suspensions). However, given the nano–metric size of PCM droplets present in nano–emulsions, this phenomenon should have a much weaker impact than in the case of micro– or macro–emulsions. (ii) Liquid droplets are more easily deformable under a shear stress field. The influence of deformation rate on suspensions viscosity depends on μPCMwater as well as on drop relaxation time, λd, which can be calculated as follows [23]:
λ d = r · µ w a t e r Γ
where r is the radius of the PCM droplet, µwater is the viscosity of the surrounding media and Γ is the interfacial tension between droplets and base fluid. In our case, even in the nano–emulsion containing 10 wt.% of RT21HC, individual paraffin droplets exhibited average hydrodynamic sizes lower than ~160 nm (value measured 1 month after preparation) [32], while interfacial tension between RT21HC and water was ~0.042 N/m (Γ reduced to ~0.008 N/m when SDS was added to water, see Section 3.2.1). Thus, droplet relaxation times are expected to be very short, λd< 2×10⁻⁹ s, and drop deformation very small, even for relatively high shear rates [23]. iii) Elastic or non–elastic nature of collisions among neighboring PCM droplets, which will also depend on z = µPCMwater, or even among possible clusters of (solvated/swollen) droplets. We consider this last explanation as the most feasible, although more research is needed to deep in the complex behavior of this kind of nano–metric structures and confirm this fact.
Numerous attempts have been carried out in the literature to develop theoretical or empirical equations to describe the shear viscosity of emulsions or solid particle dispersions as a function of dispersed phase concentration [43,44,45]. The relative viscosity (μr = μ/μ0), which represents the ratio between dispersion viscosity (μ) and base fluid viscosity (we will consider that of corresponding water+SDS mixture used to produce the sample, μ0 = μwater+SDS), can be formally written as a virial of series:
µ r 1 + | η | · ϕ + k H · ϕ 2 +
where | η | is the intrinsic viscosity and kH is known as Huggins’ coefficient. Intrinsic viscosity is usually assumed to be | η | = 5/2 for dispersions of hard spheres, while for spherical liquid droplets it takes a value 1 ≤ | η | ≤ 5/2, which can be calculated as follows [46]:
| η | = 1 + 3 · z / 2 1 + z
where z the dispersed phase to continuous phase viscosity ratio (i.e., z = μPCMwater). In the case of non–interacting particles, Equation (2) can be reduced to the linear equation, μ r     1 + | η | · ϕ , first proposed by Einstein [47]. However, for dispersions with ϕ > 0.02 (in the case of spherical or non–interacting particles) viscosity increases more rapidly with concentration than predicted by that linear approximation and so other terms of Equation (2) must be considered.
When concentration overcomes the limit known as geometrical percolation threshold (pc), rises in viscosity with increasing particle load are usually more pronounced than those predicted by Einstein’s linear approximation or virial expansions of viscosity based on Equation (2) [27,44]. Beyond percolation concentration, samples start forming large contracting clusters consisting of a flocculated structure in which primary particles and base fluid are trapped [44]. Thus, although sample continues being fluid–like (the transition from viscous fluid to true solid happens at the concentration known as maximum packing volume fraction, ϕm, which is usually ϕm >> pc) motions are necessarily collective [48]. Thus, increases in viscosity can correspond to those values expected according to theoretical or semi–empirical equations at higher concentrations. In order to take into account the effect of solvation and/or aggregation of droplets, an effective volume fraction of dispersed phase can be defined as:
ϕ e f f = k a · ϕ s
ka is the aggregation coefficient and ϕs is the volume fraction of solvated or swollen droplets. Solvated volume fraction can be calculated as [27,49]:
ϕ s = ϕ · ( 1 + δ / r ) 3
where δ and r are the thickness of the solvated layer and the radius of individual nano–droplets, respectively. The aggregation coefficient usually depends on ϕs. Different equations have been proposed to calculate ka [49], in this work we have considered the three following expressions:
k a = ϕ e f f ϕ s = 1 ϕ m
k a = ϕ e f f ϕ S = 1 + ϕ S ( 1 ϕ m ϕ m ) [ 1 ( ϕ m ϕ S ϕ m ) 2 ]
k a = ϕ e f f ϕ S = 1 ϕ S [ 1 exp ( ϕ S 1 ( ϕ S ϕ m ) ) ]
Equation (6) assumes that ka coefficient is independent of the volume fraction of solvated droplets. Equation (7) was developed by Pal et al. [50] considering the constraints that k→ 1 when ϕs→ 0 and dk/dϕs → 1 when ϕsϕm. Equation (8) was considered in [51,52] for large micron–sized suspensions.
One of the most widely used models to predict the viscosity of emulsions or solid–liquid suspensions is that presented by Krieger and Dougherty (K–D) [53]. Derived by differential effective medium theory from a previous viscosity–concentration relationship proposed by Brinkman [54] and Roscoe [55], the K–D equation can be expressed as:
μ r = ( 1 ϕ ϕ m ) | η | ϕ m
In order to consider the effects of droplet solvation and aggregation in Krieger and Dougherty model, ϕeff was used instead of ϕ in Equation (9). Maximum packing volume fraction was assumed to be ϕm= 0.637 (spherical shape), while the thickness of the solvated layer was considered as a fitting parameter as proposed by Pal [49].
In the case of nano–emulsions stabilized with ionic surfactants (such as the SDS used in this work), effective/relative dynamic viscosity was observed to increase with dispersed phase volume fraction much more rapidly than for emulsions of larger droplets [27,56]. Figure 3 shows the effective viscosities of the studied PCMEs together with the values calculated with Einstein [47] and modified Krieger and Dougherty [53] models. It must be pointed out that a proper comparison between different nano–emulsions would require that all samples would contain the same amount of surfactant.
As can be observed, μr exhibits a rather non–linear dependence on volumetric fraction; something expected since ϕ > 0.02 for all studied samples. Neither the introduction of kH × ϕ2 improves the predictions of μr (not graphically presented in Figure 3. Better results (AADs < 6%) were obtained combining the KD [53] equation with equations (4–8) to consider the effect of droplet solvation and aggregation. In particular, equations (4, 5, 8, 9) combination described experimental results at 278.15 K (solid droplets with an AADs% of 4.2% (considering a solvated layer of δ ~ 7.5 nm), while this value reduced to 1.2% (δ ~ 4.8 nm) at 303.15 K (liquid droplets). Similar thicknesses of solvated layers were estimated by Pal [49] for nano–emulsions (δ ~ 2.6–5.6 nm) with droplet diameters in the range of 28–205 nm or solid–liquid suspensions (δ ~ 3.0–13.8 nm) with nanoparticle sizes of 29–146 nm using a similar approach.

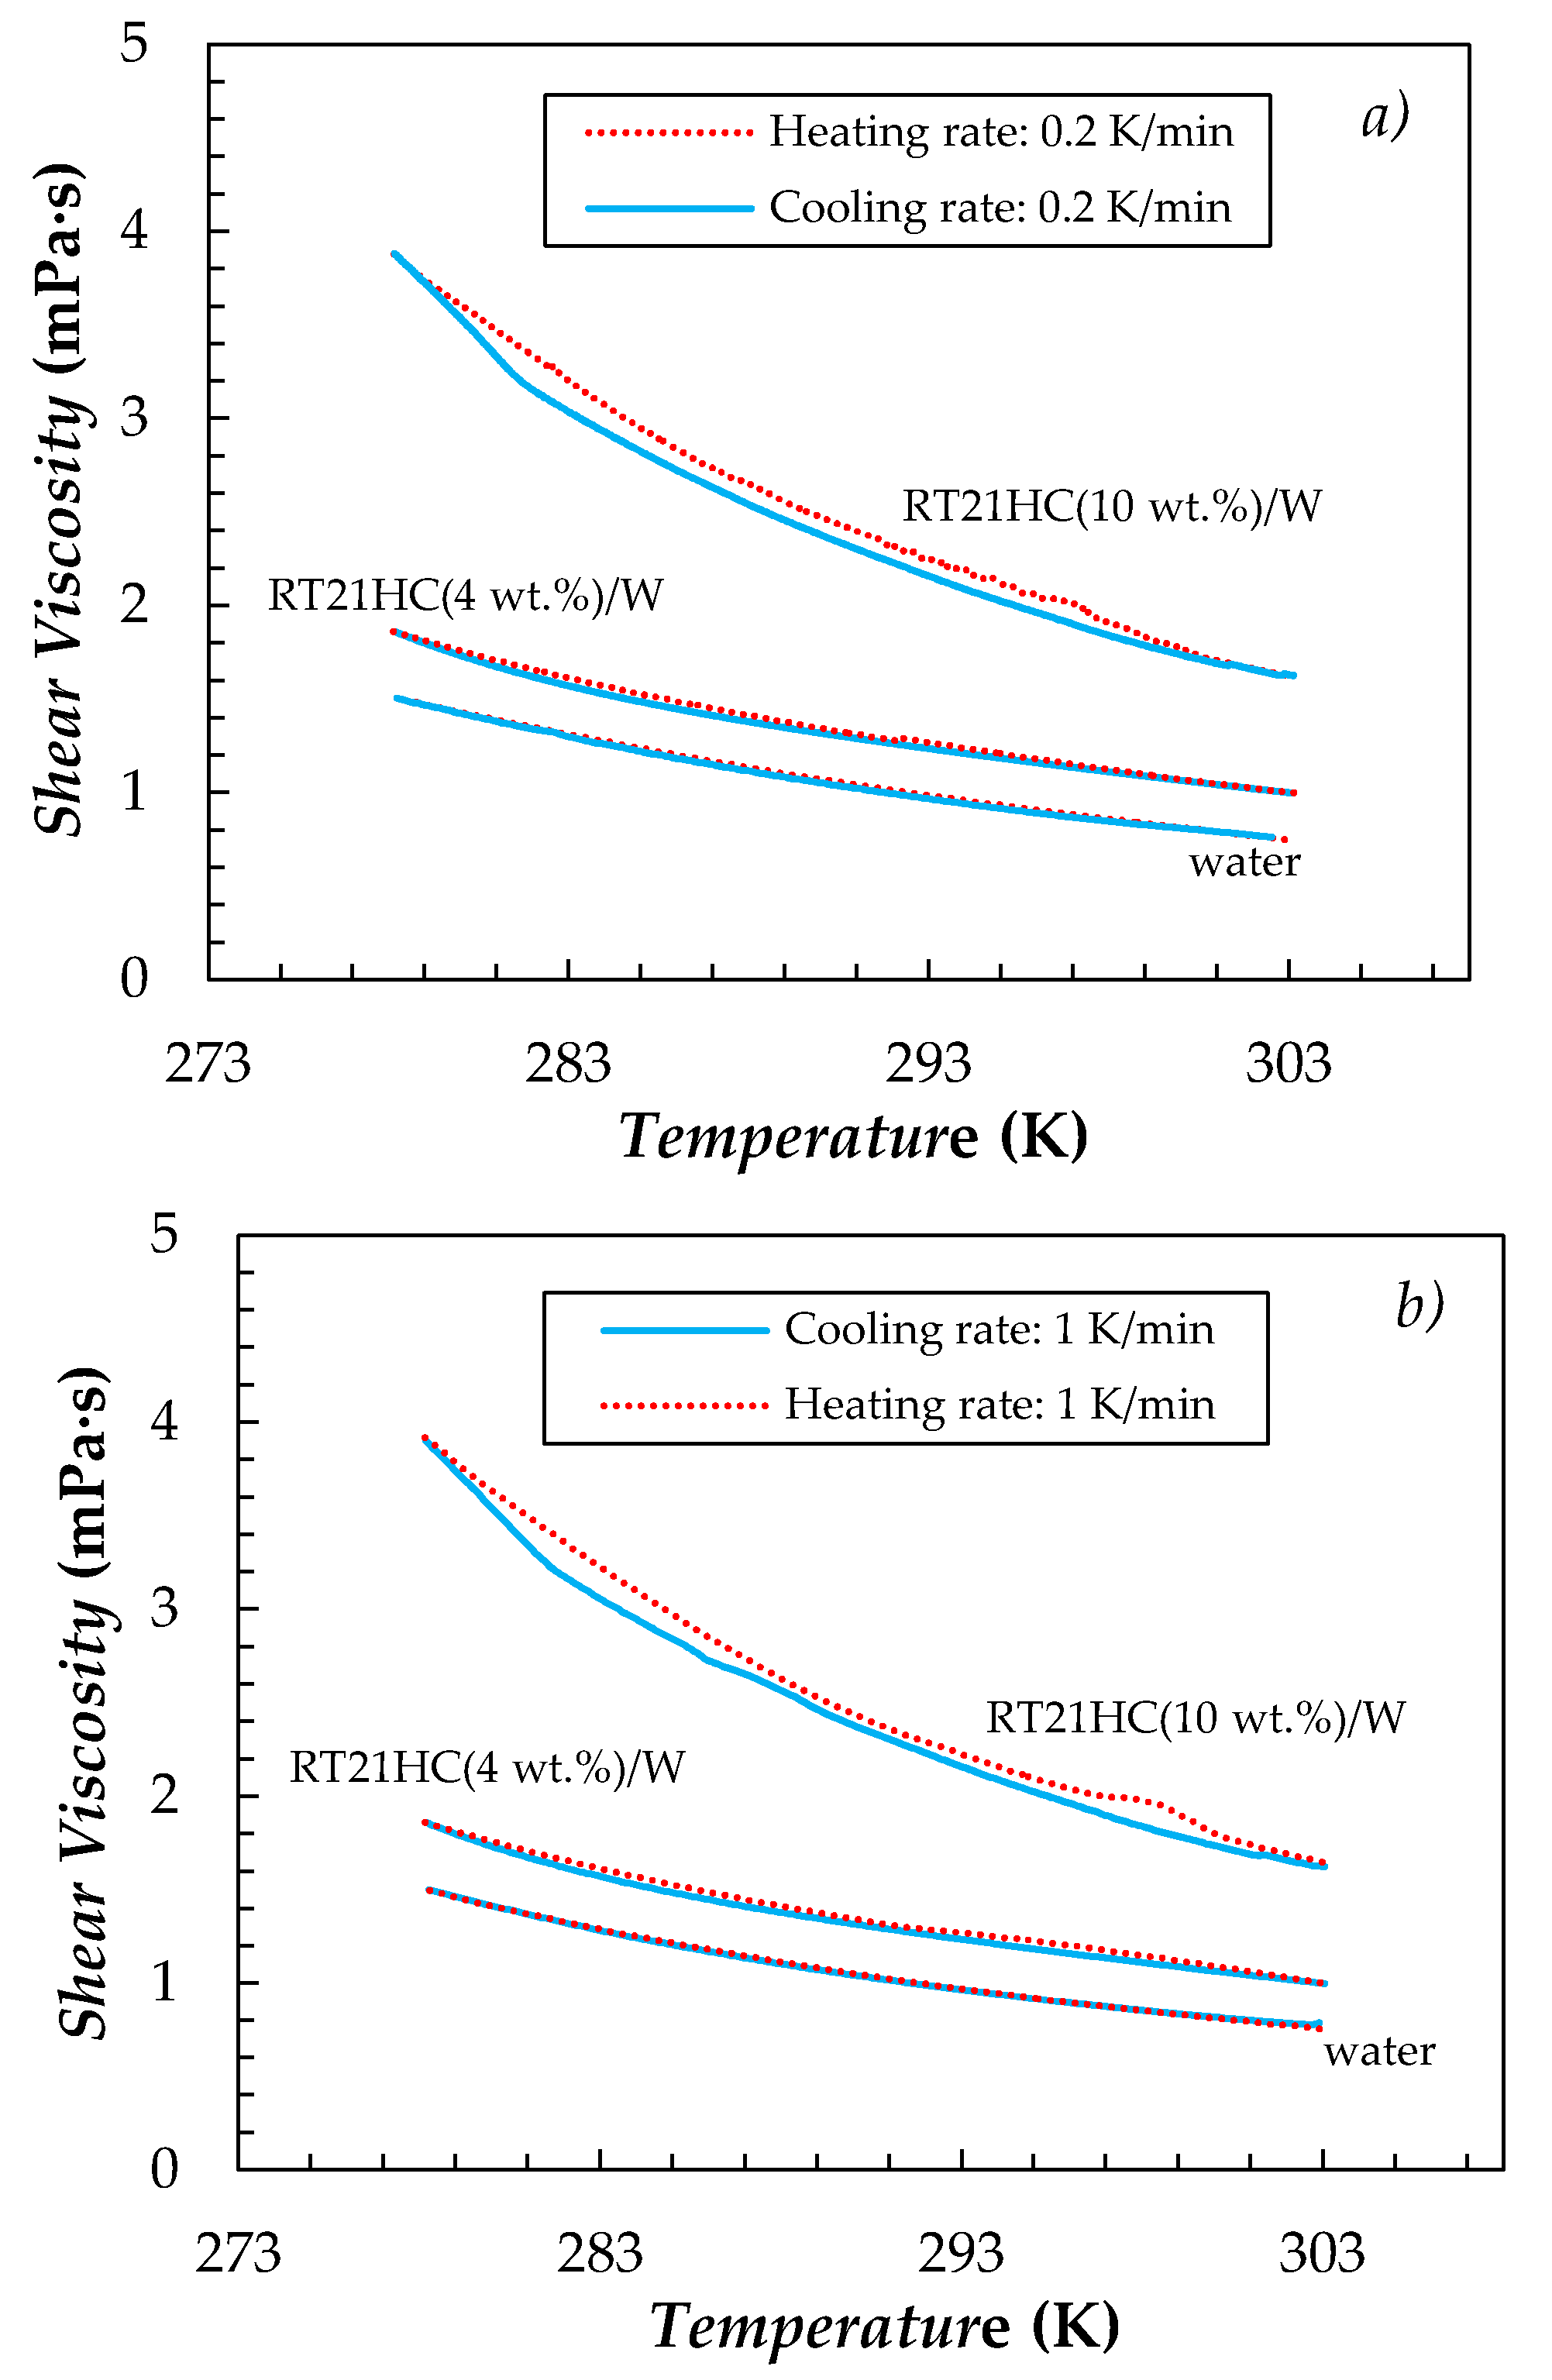
3.1.2. Shear Viscosity–Temperature Sweeps

With the objective of analyzing PCMEs viscosity during droplets phase change, temperature ramp tests were performed at constant shear stress for water as well as 4 wt.% and 10 wt.% RT21HC/Water nano–emulsions. Samples were heated/cooled between 278 and 303 K at scanning rates of 0.2 and 1 K/min. A shear stress of 0.4 Pa, which corresponds to shear rates ranging from ~100 s−1 (at 278 K) to 240 s−1 (at 303 K) in the case of RT21HC(10 wt.%)/Water, was applied to ensure that viscosity values were collected in the Newtonian region (see Figure 2). The temperature evolutions of viscosity for water and the two analyzed emulsions at the two scanning rates are shown in Figure 4.
Following the universal behavior of liquids, dynamic viscosity decreases with increasing temperature. At 278 and 303 K (extremes of temperature ramps), µ values determined from flow curve experiments and temperature sweeps are in good agreement. For RT21HC(4 wt.%)/water sample, differences in cooling and heating µ(T) sweeps are within experimental uncertainty. However, in the case of RT21HC(10 wt.%)/water sample, viscosities obtained in the range from 283 to 291 K are higher when paraffin droplets are solid (heating curve) than when they are liquid (cooling ramp). Minimum differences between the two µ values (for RT21HC(10 wt.%)/water in the mentioned temperature interval) are ~4–6%. In addition, and as previously reported in the literature for other PCM–in–water slurries [13,15,16,17,57], shear viscosity–temperature curves are affected by melting and recrystallization processes. Such deformations are only appreciated in µ(T) curves of the nano–emulsion with 10 wt.% of paraffin (due to higher content in droplets undergoing the phase change). Thus, as temperature increases in heating curves, a change in the exponential decreasing trend of viscosity of RT21HC(10 wt.%)/water sample is observed at temperatures ~292–300 K. A similar alteration in µ(T) curves is detected at temperatures ~278–283 K in cooling ramps. During the melting process of paraffin droplets (onset temperature melting transition is ~291.5 K according to [32]), an additional amount of energy is required so that the RT21HC contained in the sample undergoes the solid–liquid transition. This supplementary energy can be responsible (at least in part) for that deformation in µ(T) curve, since the temperature of the carrier fluid closer to paraffin droplets may rise at a slower pace than it does before the melting transition of dispersed phase. As a consequence, higher apparent viscosities are measured. A similar description could be used to explain the lower viscosities observed in the cooling sweeps. As reviewed in the introduction, other authors have also attributed these “peaks” in viscosity–temperature curves to changes in the shape or volume of PCM droplets undergoing solid–liquid phase transition. In our case, slight differences (within experimental uncertainty) were observed between the size distributions obtained for these same nano–emulsions in the temperature range from 276 K (solid paraffin droplets) to 303 K (liquid droplets) by DLS [32]. However, paraffin droplets are expected to expand when passing from solid to liquid (due to change in density of bulk–RT21HC). In fact, a volumetric study of this nano–emulsion system [32] showed as density of RT21HC(10 wt.%)/Water sample reduced by 1.1% when heated from 292 to 296 K, while pure water only exhibited a density reduction of 0.1% in the same temperature range. Another plausible explanation was recently proposed by Dutkowski and Fiuk [20,21] when the studied Micronal® DS 2039 X, an aqueous slurry containing paraffin micro–capsules coated with a highly cross–linked polymethyl methacrylate. Authors attributed similar deformations in heating µ(T) curves around phase change to the chaotic movement of the non–molten core inside partially melted micro–capsules. Thus, this non–uniformity in the solid/liquid state of droplets was assumed to be responsible for an increase in internal friction resistance between carrier fluid layers.
In order to further study possible structural rearrangements occuring during solid–liquid phase change transitions of PCM droplets, changes in normal stress during shear viscosity-temperature experiments were also analyzed. The temperature evolutions of first normal force difference for RT21HC(10 wt.%)/Water sample at the two scanning rates are shown in Figure 5. Heating and cooling thermograms at a scanning rate of 1 K/min obtained by differential scanning calorimetry in [32] are also shown for comparison (Figure 5c).
In our case, negative first normal force differences were observed. This is due to that, during the rotation of a Newtonian fluid without strong interactions among suspended particles, inertia forces cause sample to flow away from the center [22]. Experiments were performed at constant shear stress. Thus, as temperature rises, sample viscosity decreases allowing cone geometry to turn faster (shear rate increases) and, in turn, ∆N1 becomes more negative. Likewise, negative ∆N1 reduces (in absolute value) as temperature decreases. Two different changes are observed in heating and cooling curves around melting and recrystallization temperatures, respectively. In heating process there is a change in the slope of the curve at ~292 K. This value agrees quite well with the melting onset temperature of 291.5 K obtained in [32] for this same sample by Differential Scanning Calorimetry using scanning rates of 1 K/min (see Figure 5c). This slight change in ∆N1–trend may be due to the reduction in sample viscosity as consequence of the solid to liquid transition of paraffin droplets above described. A stronger change was observed at temperatures ~283 K, which agrees with the crystallization onset temperature of 282.2 K [32]. This more remarkable variation may be attributed to the super–cooling exhibited by the nano–emulsions. Thus, it is well reported that, after crystallization begins, temperature tends to rise and approach melting point [58].

3.2. Surface Properties

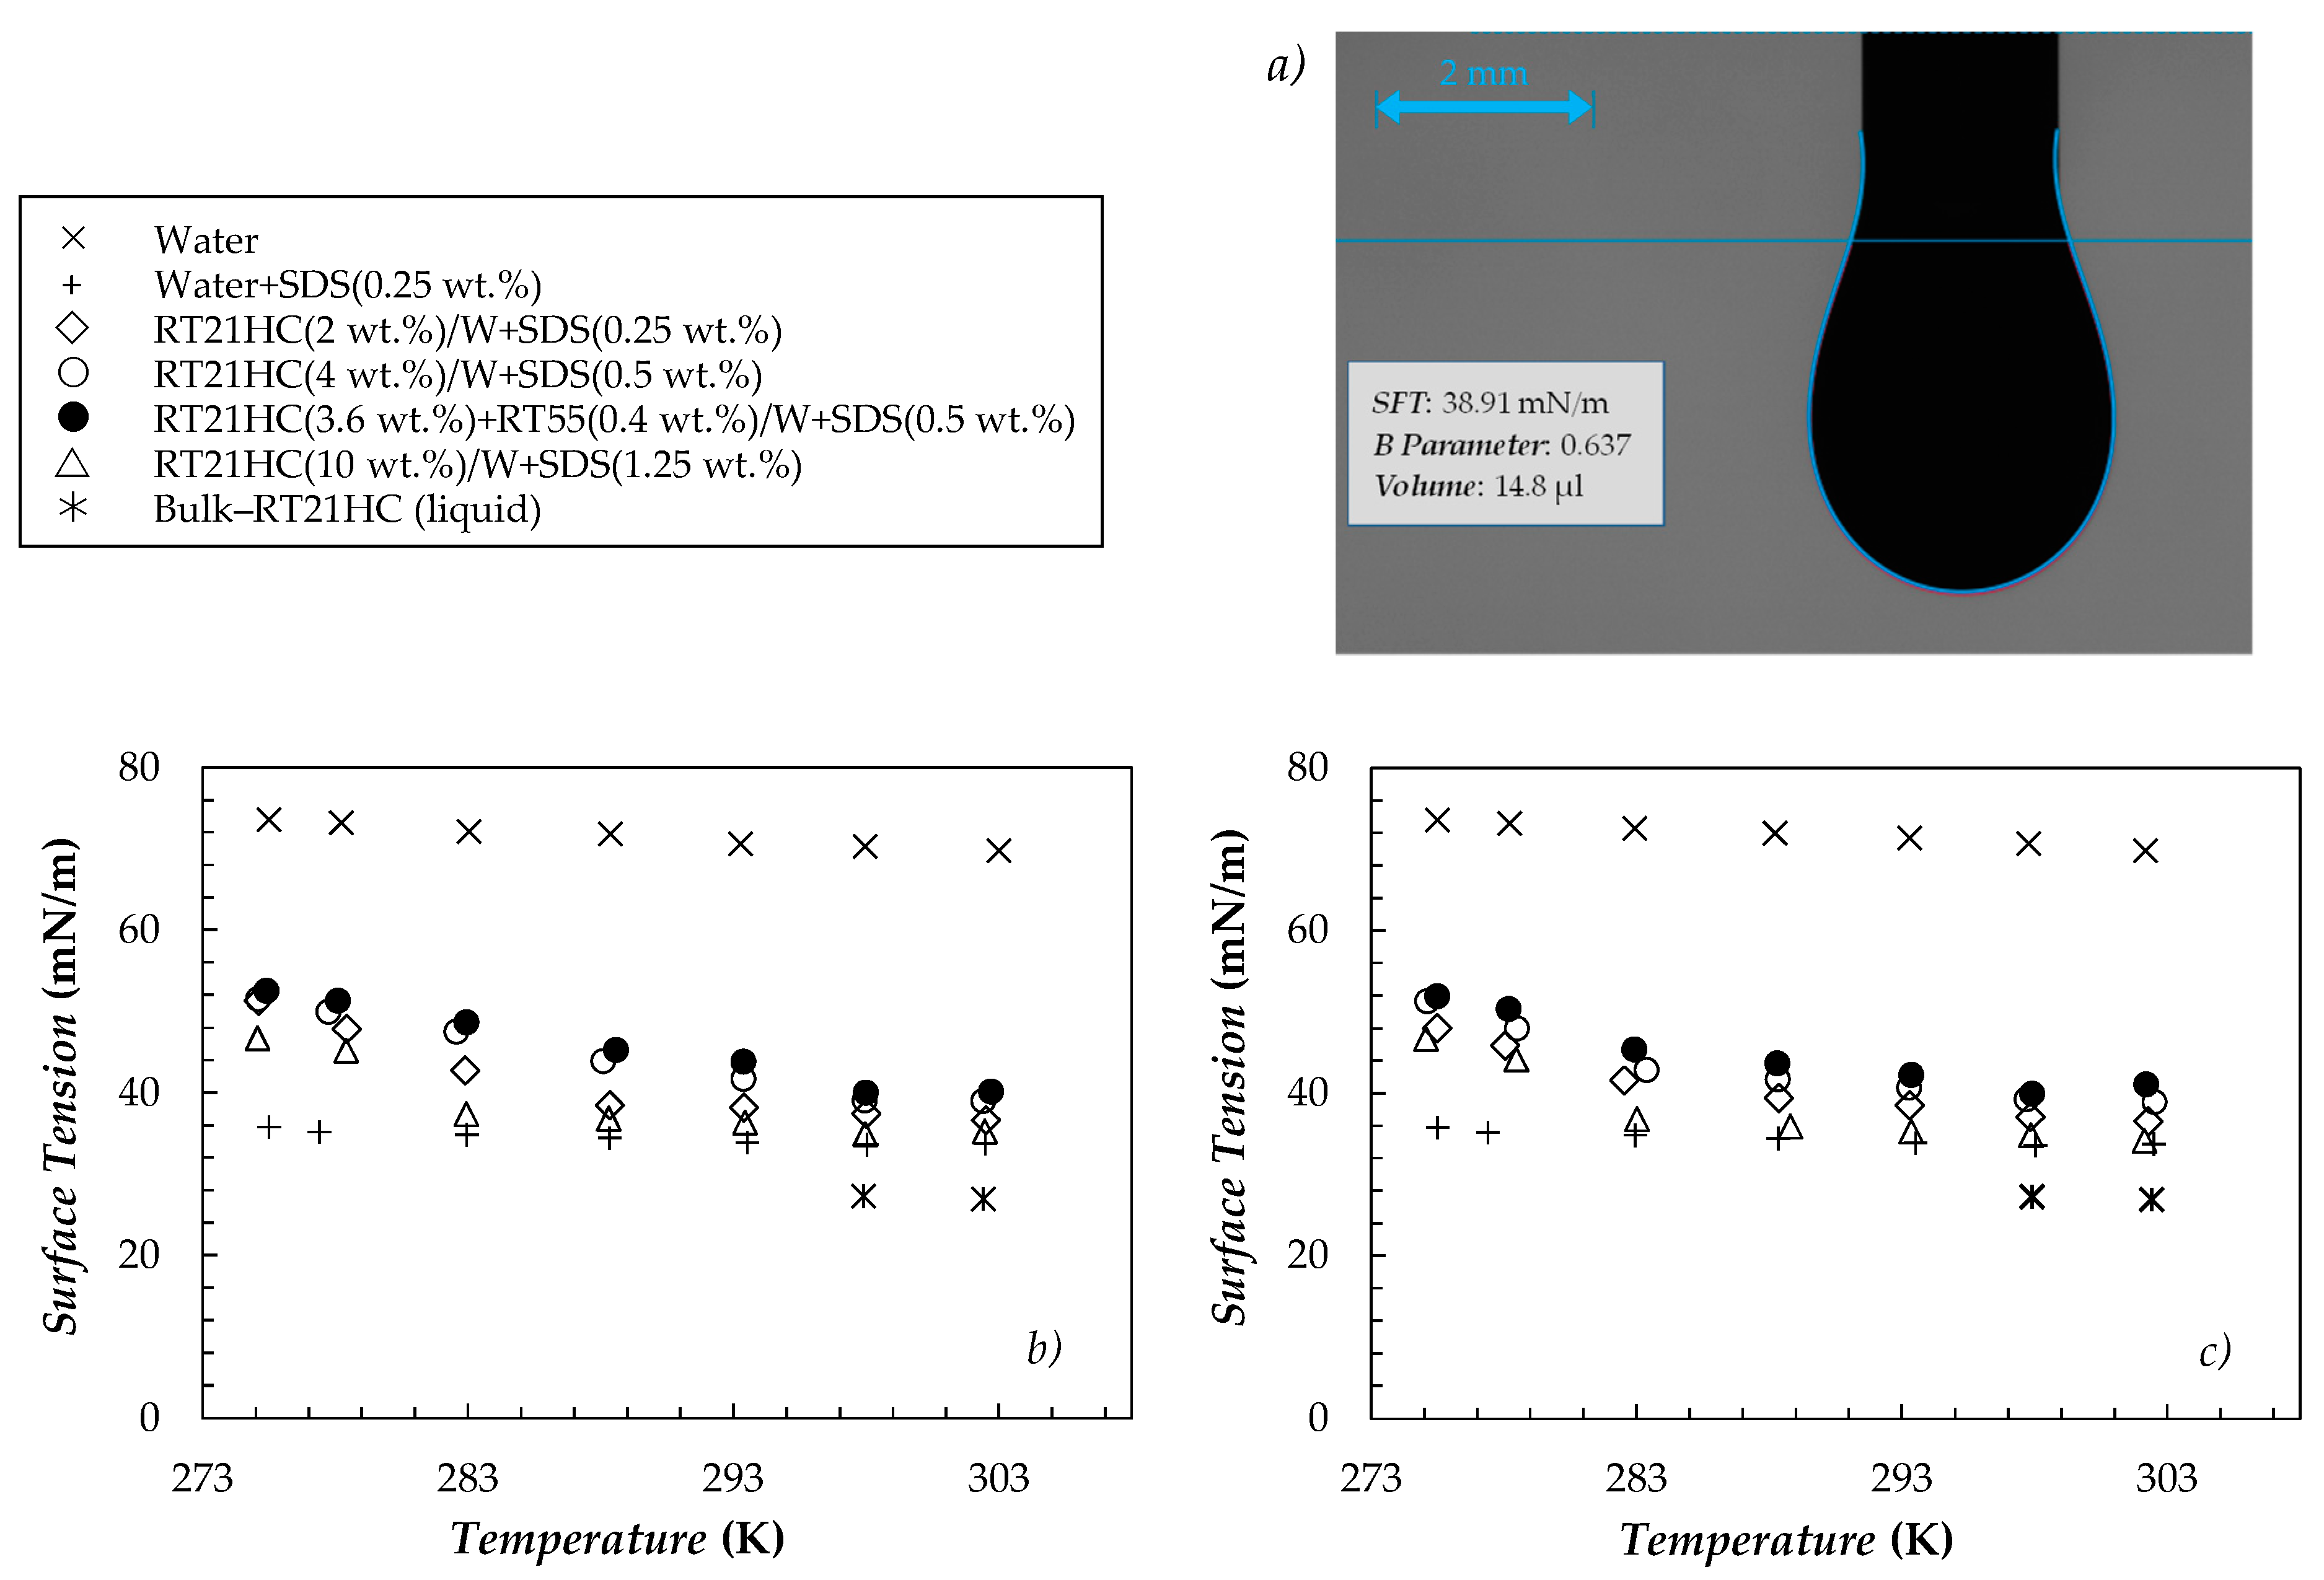
3.2.1. Interfacial Tension

Interfacial tensions (IFT) experimentally obtained at room temperature are gathered in Table 2. The ITF of 41.95 mN/m measured between bulk–RT21HC and water in this work was lower than the range of ~50–55 mN/m usually reported at 298 K for different alkane–water systems elsewhere [59]. An ITF< 42 mN/m was also obtained at 295 K between n–decane and water by Goebel and Lunkenheimer [60] when using the alkane as received (without any purification). However, the same authors found that ITF increased up to 53 mN/m after n–decane was purified. Those differences in ITF were attributed to unwanted amphiphilic residues from the oxidation process used during alkane separation and fractionation [60].
As it can be observed in Table 2, ITF between paraffin and water considerably reduced with the addition of SDS to the water. Our results ~8.2–8.3 mN/m were also lower than the ITF of 9.65 mN/m (298 K) reported by Oh and Shah [61] for IFT between n–hexadecane and water+SDS mixtures at surfactant concentrations larger than 8 mM (0.25 wt.% surfactant concentration studied in this work corresponds to ~8.6 mM).

3.2.2. Surface Tension

Surface tensions (SFTs) experimentally measured for water, the water+SDS mixture containing 0.25 wt.% of surfactant, bulk–RT21HC (in liquid phase) and the four PCMEs are plotted in Figure 6.
Water results showed an AAD% of 2.3% with previous surface tension data reported in [38]. As expected, the addition of SDS considerably reduced the surface tension of water. In our case, similar results were measured for the water+SDS mixtures at surfactant concentrations of 0.25, 0.5 and 1.25 wt.% (maximum deviations among the three systems were found at temperatures ~278 K and did not exceeded 3%). The critical micelle concentration of water+SDS system has been previously reported in literature to be around ~8 mM (corresponding to ~0.2–0.25 wt.%) [62] although certain authors reduced it to ~5 mM [26]. Bulk–RT21HC (in liquid phase) exhibited SFTs of 26.8–27.2 mN/m, which agrees well with the value of 27.2 mN/m reported by Goebel and Lunkenheimer [60] for n–hexadecane (an alkane with melting point at ~291 K).
Important reductions in surface tension (in comparison to water) were also observed for the PCMEs. Nevertheless, the SFTs of nano–emulsions were higher than the values obtained for the water+SDS mixtures with the same surfactant concentration. A similar behavior was found by Zhang et al. [26] when studied poly(butyl acrylate)–in–water emulsions at dispersed phase concentrations between 7 and 22% and droplets sizes in the range of 100–500 nm. In that study, authors observed that the minimum SFT value of ~31–33 mN/m obtained for water+SDS with surfactant loadings larger than ~5 mM (CMC), was not reached up to SDS concentrations of 60–80 mM in the case of an emulsion containing 22 wt.% of poly(butyl acrylate) droplets with average size of 115 nm. This was attributed to the fact that part of the surfactant is evenly absorbed by the droplets and also that dispersed phase droplets introduce additional surface to be covered by the surfactant. As a consequence of that, Zhang et al. [26] found that, for the same SDS concentration and before CMC was reached, SFT increased with increasing dispersed phase concentration and with reducing dispersed phase droplet size. This behavior agrees with what can be observed in Figure 6. Thus, despite RT21HC(4 wt.%)/water and RT21HC(3.6 wt.%)+RT55(0.4 wt.%)/water samples containing twice as much SDS as RT21HC(2 wt.%)/water emulsions, the two first samples exhibit slightly higher SFTs in comparison with 2 wt.% concentration. 2 and 4 wt.% emulsions have similar average paraffin droplet sizes (see Figure 1a). SFT measurements were performed at increasing and decreasing temperatures to analyze whether the solid/liquid state of paraffin droplets could have any influence on this physical property. Differences in SFT between PCMEs and water+SDS mixtures are higher at lower temperatures (when paraffin droplets are solid). In our opinion, such behavior may be due to the fact that during the solidification of the drops, part of the surfactant remains anchored or completely trapped by the paraffin. As a consequence, an additional surface is available to be covered by surfactant molecules.

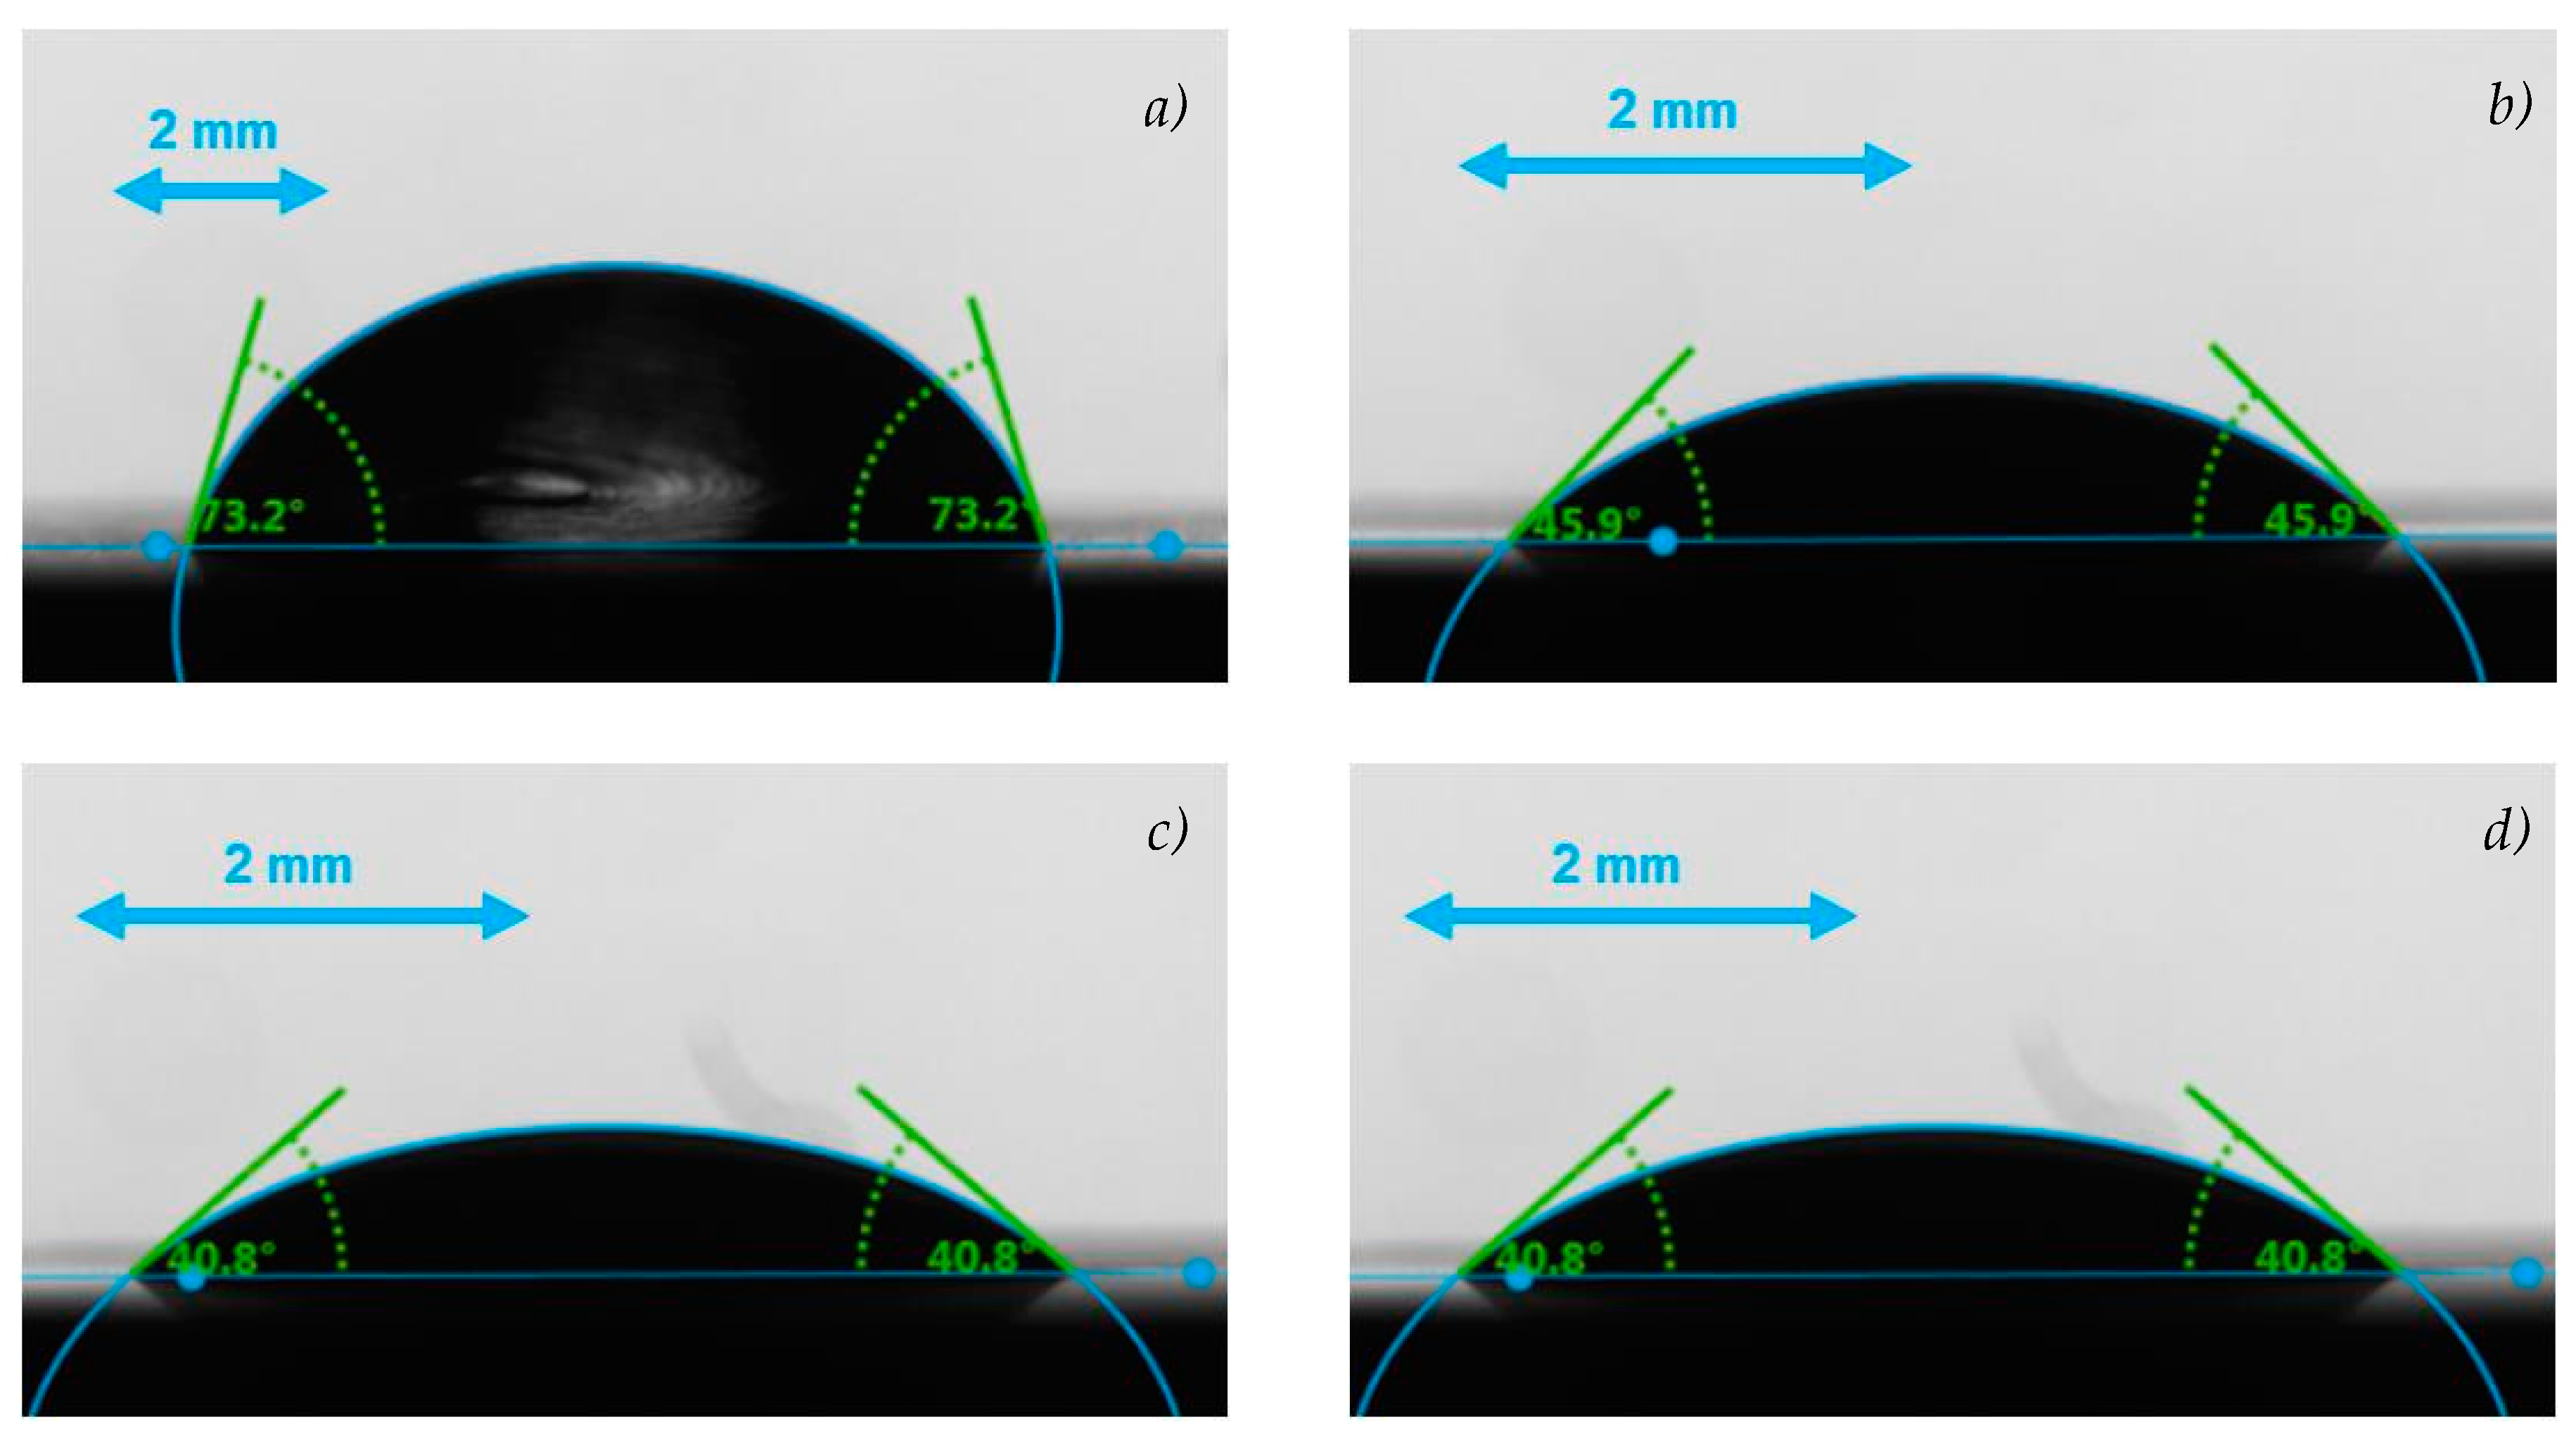
3.2.3. Wetting Behavior

Contact angle (CA) measurements were carried out for distilled water and the four nano–emulsions at two characteristic temperatures 278 and 298 K at which paraffin dispersed phase is solid and liquid, respectively. Analyzed PCME volumes were ~11–14 µL while they were ~24 µL (278 K) and 21 µL (298 K) in the case of water. Figure 7 shows some examples of sessile drops, while CA results are gathered in Table 3.
Water CA at 298 K is close in value to those CAs reported for sessile drops of similar volumes in Hernaiz et al. [36]. Unlike the water+SDS mixtures at surfactant concentrations of 0.25, 0.5 and 1.25 wt.% or bulk–RT21HC (whose CAs could not be measured since samples rapidly spread on stainless steel substrate), RT21HC–in–water emulsions exhibited CAs of 40–46° (278 K) and 33–37° (298 K). Although PCME values are up to 52% lower than those of water, it is clear that the presence of possible free surfactant in the emulsions did not overcome the cohesive forces in the RT21HC–SDS+water system. A comparison between the different nano–emulsions seems to show a slight decrease in CA with increasing paraffin concentration. However, differences in CA between most of the samples are within standard deviations. In this case, a stainless steel solid substrate [36] was selected as representative surface in industrial applications. Other substrates may be interesting depending on the particular use of the nano–emulsions.

4. Conclusions

Phase change material nano–emulsions produced following a solvent–assisted route were characterized in terms of dynamic viscosity and surface properties. A slight shear–thinning behavior was observed in the region of low shear rates (up to 30–60 s−1) for the nano–emulsion prepared at the highest concentration (10 wt.%), while the rest of studied samples exhibited a Newtonian behavior at studied conditions. As expected, dynamic viscosity strongly rose with dispersed phase+surfactant concentration. Within the Newtonian region, maximum µ increases (regarding distilled water) reached 151% for the paraffin concentration of 10 wt.% at 278 K. Larger increases in viscosity were observed when paraffin droplets are solid than when they are liquid. A good description (with deviations lower than 6%) was obtained when Krieger–Dougherty µ(ϕ) model was modified to include solvated/swollen and aggregation particle effects. Solidification and recrystallization temperatures determined from rheological temperature–sweeps for RT21HC(10 wt.%)/Water emulsion agreed with previous calorimetric analysis using DSC. Surface tension reduces up to 50% with the presence of paraffin droplets. However, these diminutions are lower than the decreases found for the corresponding water+SDS mixtures used to produce the nano–emulsions. PCME contact angles are up to 52% lower than those of water, but sample did not rapidly spread in stainless steel substrate as it happened to bulk–RT21HC or SDS+water mixtures without paraffin droplets. No significant effect on any of the three studied physical properties was observed when part of the dispersed phase was replaced by a nucleating agent.

Author Contributions

F.A. and S.B. (Simona Barison) defined PCME formulation, prepared studied samples and helped in data interpretation and writing. D.C. and S.H. measured rheological and surface properties and first drafted the manuscript. P.E., L.F. and S.B. (Sergio Bobbo) conceived the study, planned the experiments and took an active role in the preparation of the manuscript. All authors read and approved the final manuscript.

Funding

D.C.: S.H., F.A., S.B. (Simona Barison) and S.B. (Sergio Bobbo) acknowledge the EU COST Action CA15119: Overcoming Barriers to Nanofluids Market Uptake for financial support in the participation of the 1st International Conference on Nanofluids (ICNf) and the 2nd European Symposium on Nanofluids (ESNf) held at the University of Castellón, Spain during 26–28 June 2019. P.E. acknowledges the European Union through the European Regional Development Fund (ERDF), the Ministry of Higher Education and Research, the French region of Brittany and Rennes Métropole for the financial support related to the device used in this study for surface tension and contact angle measurements. D.C. is recipient of a postdoctoral fellowship from Xunta de Galicia (Spain).

Acknowledgments

This investigation is a contribution to the COST (European Cooperation in Science and Technology) Action CA15119: Overcoming Barriers to Nanofluids Market Uptake (NanoUptake). Authors acknowledge Francis Gouttefangeas from CMEBA (Université Rennes 1) for performing SEM studies.

Conflicts of Interest

The authors declare no conflict of interest.

Nomenclature

AAD%percentage absolute average deviations
CAcontact angle [°]
CMCcritical micelle concentration
∆N1first normal force difference [Pa]
| η | intrinsic viscosity
ϕvolume fraction
ϕeffeffective volume fraction
ϕmmaximum packing volume fraction
ϕssolvated/swollen droplet volume fraction
ITF, Γinterfacial tension [mN/m]
kaaggregation coefficient
K–DKrieger and Dougherty viscosity model
kHHuggins coefficient
pcgeometrical percolation threshold
PCMphase change material
PCMEphase change material emulsion
pdlpolydispersity index
rradius of PCM droplet [m]
RT21HCRubitherm RT21HC paraffin
RT55Rubitherm RT55 paraffin wax
SDSsodium dodecyl sulfate
SFTsurface tension [mN/m]
Ttemperature [K]
Wwater
zdispersed phase to continuous phase viscosity ratio (z = μPCM/μwater)
δthickness of solvated layer
λddrop relaxation time
μshear dynamic viscosity [mPa·s]
μrrelative viscosity of sample to corresponding water+SDS mixture (μr = μPCM/μwater+SDS)
Subscripts
melt.melting
PCMphase change materials
PCMEphase change material emulsion
sol.solidification

References

  1. Singh, S.; Gaikwad, K.K.; Suk, Y. Phase change materials for advanced cooling packaging. Environ. Chem. Lett. 2018, 16, 845–859. [Google Scholar] [CrossRef]
  2. Cabeza, L.F.; Castell, A.; Barreneche, C.; De Gracia, A.; Fernández, A.I. Materials used as PCM in thermal energy storage in buildings: A review. Renew. Sustain. Energy Rev. 2011, 15, 1675–1695. [Google Scholar] [CrossRef]
  3. Zhang, P.; Ma, Z.W.; Wang, R.Z. An overview of phase change material slurries: MPCS and CHS. Renew. Sustain. Energy Rev. 2010, 14, 598–614. [Google Scholar] [CrossRef]
  4. Huang, L.; Petermann, M.; Doetsch, C. Evaluation of paraffin/water emulsion as a phase change slurry for cooling applications. Energy 2009, 34, 1145–1155. [Google Scholar] [CrossRef]
  5. Huang, L.; Petermann, M. An experimental study on rheological behaviors of paraffin/water phase change emulsion. Int. J. Heat Mass Transf. 2015, 83, 479–486. [Google Scholar] [CrossRef]
  6. Youssef, Z.; Delahaye, A.; Huang, L.; Trinquet, F.; Fournaison, L.; Pollerberg, C.; Doetsch, C. State of the art on phase change material slurries. Energy Convers. Manag. 2013, 65, 120–132. [Google Scholar] [CrossRef]
  7. Tesfai, W.; Singh, P.; Shatilla, Y.; Iqbal, M.Z.; Abdala, A.A. Rheology and microstructure of dilute graphene oxide suspension. J. Nanoparticle Res. 2013, 15, 1989. [Google Scholar] [CrossRef]
  8. Delgado, M.; Lázaro, A.; Mazo, J.; Zalba, B. Review on phase change material emulsions and microencapsulated phase change material slurries: Materials, heat transfer studies and applications. Renew. Sustain. Energy Rev. 2012, 16, 253–273. [Google Scholar] [CrossRef]
  9. Huang, L.; Doetsch, C.; Pollerberg, C. Low temperature paraffin phase change emulsions. Int. J. Refrig. 2010, 33, 1583–1589. [Google Scholar] [CrossRef]
  10. Inaba, H.; Morita, S.; Nozu, S. Fundamental study of cold heat-storage system of phase-change-type emulsion having cold latent heat dispersion material. Trans. JSME 1993, 59, 2882–2889. [Google Scholar] [CrossRef]
  11. Inaba, H.; Morita, S. Flow and cold heat-storage characteristics of phase-change emulsion in a coiled double- tube heat exchanger. J. Heat Transf. 2016, 117, 440–446. [Google Scholar] [CrossRef]
  12. Royon, L. Physical properties and thermorheological behaviour of a dispersio having cold latent heat-storage material. Energy Convers. Manag. 1998, 39, 1529–1535. [Google Scholar] [CrossRef]
  13. Wang, F.; Liu, J.; Fang, X.; Zhang, Z. Graphite nanoparticles-dispersed paraffin/water emulsion with enhanced thermal-physical property and photo-thermal performance. Sol. Energy Mater. Sol. Cells 2016, 147, 101–107. [Google Scholar] [CrossRef]
  14. Agresti, F.; Fedele, L.; Rossi, S.; Cabaleiro, D.; Bobbo, S.; Ischia, G.; Barison, S. Nano-encapsulated PCM emulsions prepared by a solvent-assisted method for solar applications. Sol. Energy Mater Sol. Cells 2019, 194, 268–275. [Google Scholar] [CrossRef]
  15. Lu, W.; Tassou, S.A. Experimental study of the thermal characteristics of phase change slurries for active cooling. Appl. Energy 2012, 91, 366–374. [Google Scholar] [CrossRef]
  16. Wang, F.; Fang, X.; Zhang, Z. Preparation of phase change material emulsions with good stability and little supercooling by using a mixed polymeric emulsifier for thermal energy storage. Sol. Energy Mater. Sol. Cells 2018, 176, 381–390. [Google Scholar] [CrossRef]
  17. Wang, F.; Ling, Z.; Fang, X.; Zhang, Z. Optimization on the photo-thermal conversion performance of graphite nanoplatelets decorated phase change material emulsions. Sol. Energy Mater. Sol. Cells 2018, 186, 340–348. [Google Scholar] [CrossRef]
  18. Wang, Y.; Chen, Z.; Ling, X. A molecular dynamics study of nano-encapsulated phase change material slurry. Appl. Therm. Eng. 2016, 98, 835–840. [Google Scholar] [CrossRef]
  19. Kong, M.; Alvarado, J.L.; Terrell, W.; Thies, C. Performance characteristics of microencapsulated phase change material slurry in a helically coiled tube. Int. J. Heat Mass Transf. 2016, 101, 901–914. [Google Scholar] [CrossRef]
  20. Dutkowski, K.; Fiuk, J.J. Experimental research of viscosity of microencapsulated PCM slurry at the phase change temperature. Int. J. Heat Mass Transf. 2019, 134, 1209–1217. [Google Scholar] [CrossRef]
  21. Dutkowski, K.; Fiuk, J.J. Experimental investigation of the effects of mass fraction and temperature on the viscosity of microencapsulated PCM slurry. Int. J. Heat Mass Transf. 2018, 126, 390–399. [Google Scholar] [CrossRef]
  22. Frank, A.J. TA Instruments Normal Stresses in Shear Flow. Available online: www.tainstruments.com/pdf/literature/AAN007e_Normal_forces_in_Shear_flow.pdf (accessed on 24 August 2019).
  23. Macosko, C.W. Rheology. Principles, Measurements and Applications; Wiley-VCH: Weinheim, Germany, 1994; ISBN 1560815795. [Google Scholar]
  24. Chatterjee, T.; Van Dyk, A.K.; Ginzburg, V.V.; Nakatani, A.I. Formulation-controlled positive and negative first normal stress differences in waterborne hydrophobically modified ethylene oxide urethane (HEUR)-latex suspensions. ACS Macro Lett. 2017, 6, 716–720. [Google Scholar] [CrossRef]
  25. Aral, B.K.; Kalyon, D.M. Viscoelastic material functions of noncolloidal suspensions with spherical particles. J. Rheol. 1997, 41, 599–620. [Google Scholar] [CrossRef]
  26. Zhang, T.; Lu, Q.; Lü, Y.; Wu, G. Determination of critical micelle concentration of sodium dodecyl sulfate in butyl acrylate emulsions. Polym. Bull. 2015, 72, 2215–2225. [Google Scholar] [CrossRef]
  27. Helgeson, M.E. Colloidal behavior of nanoemulsions: Interactions, structure and rheology. Curr. Opin. Colloid Interface Sci. 2016, 25, 39–50. [Google Scholar] [CrossRef]
  28. Gutiérrez, J.M.; Solè, I.; Maestro, A.; González, C.; Solans, C. Optimization of nano-emulsion preparation by low-energy methods in an ionic surfactant system. Langmuir 2006, 22, 8326–8332. [Google Scholar]
  29. Tadros, T.; Izquierdo, P.; Esquena, J.; Solans, C. Formation and stability of nano-emulsions. Adv. Colloid Interface Sci. 2004, 108–109, 303–318. [Google Scholar] [CrossRef] [PubMed]
  30. Estellé, P.; Cabaleiro, D.; Żyła, G.; Lugo, L.; Murshed, S.M.S. Current trends in surface tension and wetting behavior of nanofluids. Renew. Sustain. Energy Rev. 2018, 94, 931–944. [Google Scholar] [CrossRef]
  31. Adzima, B.J.; Velankar, S.S. Pressure drops for droplet flows in microfluidic channels. J. Micromech. Microeng 2006, 16, 1504–1510. [Google Scholar] [CrossRef]
  32. Cabaleiro, D.; Agresti, F.; Barison, S.; Marcos, M.A.; Prado, J.I.; Rossi, S.; Bobbo, S.; Fedele, L. Development of paraffinic phase change material nanoemulsions for thermal energy storage and transport in low-temperature applications. Appl. Therm. Eng. 2019, 159, 113868. [Google Scholar] [CrossRef]
  33. Fedele, L.; Colla, L.; Bobbo, S.; Barison, S.; Agresti, F. Experimental stability analysis of different water- based nanofluids. Nanoscale Res. Lett. 2011, 6, 300. [Google Scholar] [CrossRef] [PubMed]
  34. Halelfadl, S.; Estellé, P.; Aladag, B.; Doner, N.; Maré, T. Viscosity of carbon nanotubes water-based nanofluids: Influence of concentration and temperature. Int. J. Therm. Sci. 2013, 71, 111–117. [Google Scholar] [CrossRef] [Green Version]
  35. Gómez-Villarejo, R.; Aguilar, T.; Hamze, S.; Estellé, P.; Navas, J. Experimental analysis of water-based nanofluids using boron nitride nanotubes with improved thermal properties. J. Mol. Liq. 2019, 277, 93–103. [Google Scholar] [CrossRef]
  36. Hernaiz, M.; Alonso, V.; Estellé, P.; Wu, Z.; Sundén, B.; Doretti, L.; Mancin, S.; Çobanoğlu, N.; Karadeniz, Z.H.; Garmendia, N.; et al. The contact angle of nanofluids as thermophysical property. J. Colloid Interface Sci. 2019, 547, 393–406. [Google Scholar] [CrossRef] [PubMed]
  37. COST Action NanoUptake Website. Available online: http://nanouptake.uji.es/ (accessed on 24 August 2019).
  38. Vargaftik, N.B.; Volkov, B.N.; Voljak, L.D. International tables of surface tension of water with air. J. Phy. Chem. Ref. Data 1983, 12, 817–820. [Google Scholar] [CrossRef]
  39. Żyła, G.; Fal, J.; Estellé, P. Thermophysical and dielectric profiles of ethylene glycol based titanium nitride (TiN–EG) nanofluids with various size of particles. Int. J. Heat Mass Transf. 2017, 113, 1189–1199. [Google Scholar] [CrossRef]
  40. Lemmon, E.W.; Huber, M.L.; McLinden, M.O. NIST Standard Reference Database 23: Reference Fluid Thermodynamic and Transport Properties (REFPROP), Version 9.0. Physical and Chemical Properties; 2010. Available online: https://www.nist.gov/programs-projects/reference-fluid-thermodynamic-and-transport-properties-database-refprop (accessed on 24 August 2019).
  41. Ferrer, G.; Gschwander, S.; Solé, A.; Barreneche, C.; Fernández, A.I.; Schossig, P.; Cabeza, L.F. Empirical equation to estimate viscosity of paraffin. J. Energy Storage 2017, 11, 154–161. [Google Scholar] [CrossRef] [Green Version]
  42. Mikkola, V.; Puupponen, S.; Saari, K.; Ala-Nissila, T.; Seppälä, A. Thermal properties and convective heat transfer of phase changing paraffin nanofluids. Int. J. Therm. Sci. 2017, 117, 163–171. [Google Scholar] [CrossRef] [Green Version]
  43. Murshed, S.M.S.; Estellé, P. A state of the art review on viscosity of nanofluids. Renew. Sustain. Energy Rev. 2017, 76, 1134–1152. [Google Scholar] [CrossRef]
  44. Bullard, J.W.; Pauli, A.T.; Garboczi, E.J.; Martys, N.S. A comparison of viscosity–concentration relationships for emulsions. J. Colloid Interface Sci. 2009, 330, 186–193. [Google Scholar] [CrossRef] [PubMed]
  45. Pal, R.; Rhodes, E. Viscosity/concentration relationships for emulsions viscosity. J. Rheol. 1989, 33, 1021–1045. [Google Scholar] [CrossRef]
  46. Taylor, G.I. The viscosity of a fluid containing small drops of another fluid. Philos. Trans. R. Soc. London Ser. A 1932, 138, 41–48. [Google Scholar] [CrossRef]
  47. Einstein, A. A new determination of molecular dimension. Ann. Phys. 1906, 19, 289–305. [Google Scholar] [CrossRef]
  48. Bicerano, J.; Douglas, J.F.; Brune, D.A. Polymer model for the viscosity of particle dispersions model for the viscosity of particle dispersions. J. Macromol. Sci. Part C 1999, 39, 561–642. [Google Scholar] [CrossRef]
  49. Pal, R. Modeling the viscosity of concentrated nanoemulsions and nanosuspensions. Fluids 2016, 1, 11. [Google Scholar] [CrossRef]
  50. Pal, R. A new model for the viscosity of asphaltene solutions. Can. J. Chem. Eng. 2015, 93, 747–755. [Google Scholar] [CrossRef]
  51. Pal, R. A new linear viscoelastic model for emulsions and suspensions. Polym. Eng. Sci. 2008, 48, 1250–1253. [Google Scholar] [CrossRef]
  52. Lewis, T.B.; Nielsen, L.E.; Company, M. Dynamic mechanical properties of particulate-filled composites. J. Appl. Polym. Sci. 1970, 14, 1449–1471. [Google Scholar] [CrossRef]
  53. Krieger, I.M.; Dougherty, T.J. A mechanism for non-Newtonian flow in suspensions of rigid spheres. Trans. Soc. Rheol. 1959, 3, 137–152. [Google Scholar] [CrossRef]
  54. Brinkman, H.C. The viscosity of concentrated suspensions and solutions. J. Chem. Phys. 1952, 20, 571. [Google Scholar] [CrossRef]
  55. Roscoe, R. The viscosity of suspensions of rigid spheres. Br. J. Appl. Phys. 1952, 3, 267–269. [Google Scholar] [CrossRef]
  56. Chiesa, M.; Garg, J.; Kang, Y.T.; Chen, G. Thermal conductivity and viscosity of water-in-oil nanoemulsions. Colloids Surfaces A Physicochem. Eng. Asp. 2008, 326, 67–72. [Google Scholar] [CrossRef]
  57. Xiang, N.; Yuan, Y.; Sun, L.; Cao, X.; Zhao, J. Simultaneous decrease in supercooling and enhancement of thermal conductivity of paraffin emulsion in medium temperature range with graphene as additive. Thermochim. Acta 2018, 664, 16–25. [Google Scholar] [CrossRef]
  58. Safari, A.; Saidur, R.; Sulaiman, F.A.; Xu, Y.; Dong, J. A review on supercooling of phase change materials in thermal energy storage systems. Renew. Sustain. Energy Rev. 2017, 70, 905–919. [Google Scholar] [CrossRef]
  59. Zeppieri, S.; Rodríguez, J.; López De Ramos, A.L. Interfacial tension of alkane + water systems. J. Chem. Eng. Data 2001, 46, 1086–1088. [Google Scholar] [CrossRef]
  60. Goebel, A.; Lunkenheimer, K. Interfacial tension of the water/ n-alkane interface. Langmuir 2002, 13, 369–372. [Google Scholar] [CrossRef]
  61. Oh, S.G.; Shah, D.O. Effect of counterions on the interfacial tension and emulsion droplet size in the oil/water/dodecyl sulfate system. J. Phys. Chem. 1993, 97, 284–286. [Google Scholar] [CrossRef]
  62. Fainerman, V.B.; Lylyk, S.V.; Aksenenko, E.V.; Petkov, J.T.; Yorke, J.; Miller, R. Surface tension isotherms, adsorption dynamics and dilational visco-elasticity of sodium dodecyl sulphate solutions. Colloids Surfaces A Physicochem. Eng. Asp. 2010, 354, 8–15. [Google Scholar] [CrossRef]
Figure 1. (a) Hydrodynamic droplet size distributions obtained by DLS [32] after PCME preparation and (b) SEM image of 4–month old RT21HC(2 wt.%)/water emulsion (1:20 diluted).
Energies 12 03334 g001
Figure 2. Shear viscosity–shear rate flow curves at (a) 278.15 K, when paraffin droplets are solid, and (b) 303.15 K, liquid paraffin droplets.
Energies 12 03334 g002
Figure 3. Volume fraction, ϕ, dependence of effective dynamic viscosity, μr = μ/μwater+SDS, at (a) 278.15 K and (b) 303.15 K.
Energies 12 03334 g003
Figure 4. Shear viscosity–temperature curves obtained for water as well as 4 wt.% and 10 wt.% RT21HC/Water emulsions at scanning rates of (a) 0.2 and (b) 1 K/min.
Energies 12 03334 g004
Figure 5. (a,b) First normal stress difference– temperature curves obtained for RT21HC(10 wt.%)/Water emulsion at scanning rates of (a) 0.2 and (b) 1 K/min. (c) Thermogram obtained by differential scanning calorimetry in [32].
Energies 12 03334 g005aEnergies 12 03334 g005b
Figure 6. (a) Droplet capture obtained at 303 K for the RT21HC(4 wt.%)/Water nano–emulsion. (b, c) Surface tension results of the different samples obtained from (b) increasing and (c) decreasing temperature experiments.
Energies 12 03334 g006
Figure 7. Examples of sessile drops analyzed at 278 K for: (a) water; (b) RT21HC(2 wt.%)/Water; (c) RT21HC(4 wt.%)/Water and (d) RT21HC(10 wt.%)/Water.
Energies 12 03334 g007
Table 1. Dynamic viscosities, µ, and viscosity increases regarding to water, µ/µwater, obtained for the different samples at ~100 s−1.
SampleT = 278.15 KT = 303.15 K
µ (mPa·s)µ/µwaterµ (mPa·s)µ/µwater
Water1.501.000.7911.000
Water+SDS(0.25 wt.%)1.551.030.8021.014
Water+SDS(0.5 wt.%)1.611.070.8131.028
Water+SDS(1.25 wt.%)1.671.110.8651.094
RT21HC(2 wt.%)/water+SDS(0.25 wt.%)1.701.130.891.13
RT21HC(4 wt.%)/water+SDS(0.5 wt.%)2.011.341.011.28
RT21HC(3.6 wt.%)+RT55(0.4 wt.%)/water+SDS(0.5 wt.%)2.051.371.041.31
RT21HC(10 wt.%)/water+SDS(1.25 wt.%)3.772.511.672.11
Bulk–RT21HC--3.32-
Table 2. Interfacial tensions, ITF, between bulk–RT21HC and water or between bulk–RT21HC and the three water+SDS mixtures experimentally measured at room temperature.
SystemT (K)ITF (mN/m)
RT21HC–Water297.06 ± 0.0441.95 ± 0.34
RT21HC–Water+SDS(0.25 wt.%)296.57 ± 0.078.32 ± 0.09
RT21HC–Water+SDS(0.5 wt.%)297.21 ± 0.038.20 ± 0.08
RT21HC–Water+SDS(1.25 wt.%)297.44 ± 0.028.19 ± 0.14
Table 3. Contact angles, CA, measured for distilled water and studied nano–emulsions on a stainless steel substrate [36]. Relative humidity: 50 ± 10%.
SampleCA (°)
T = 278 KT = 298 K
Water72 ± 269 ± 2
RT21HC(2 wt.%)/W+SDS(0.25 wt.%)46 ± 237 ± 2
RT21HC(4 wt.%)/W+SDS(0.5 wt.%)41 ± 235 ± 2
RT21HC(3.6 wt.%)+RT55(0.4 wt.%)/W+SDS(0.5 wt.%)41 ± 136 ± 2
RT21HC(10 wt.%)/W+SDS(1.25 wt.%)40 ± 233 ± 2

