1. Introduction
In June 2010, the North American Electric Reliability Corporation released a report to address high-impact low-frequency (HILF) risks to bulk power systems [
1]. Two primary HILF risks of concern were high-altitude electromagnetic pulses (HEMPs) and geomagnetic disturbances (GMDs). HEMPs are bursts of electromagnetic energy that result from man-made nuclear explosions at altitudes at or above 30 km, while GMDs are naturally occurring events caused by intense solar storms. These HILF events have the potential to significantly impact the operation of electric power systems; however, they are rare. The collapse of the Hydro-Quebec system during a GMD in March 1989 is the most well-known example [
2].
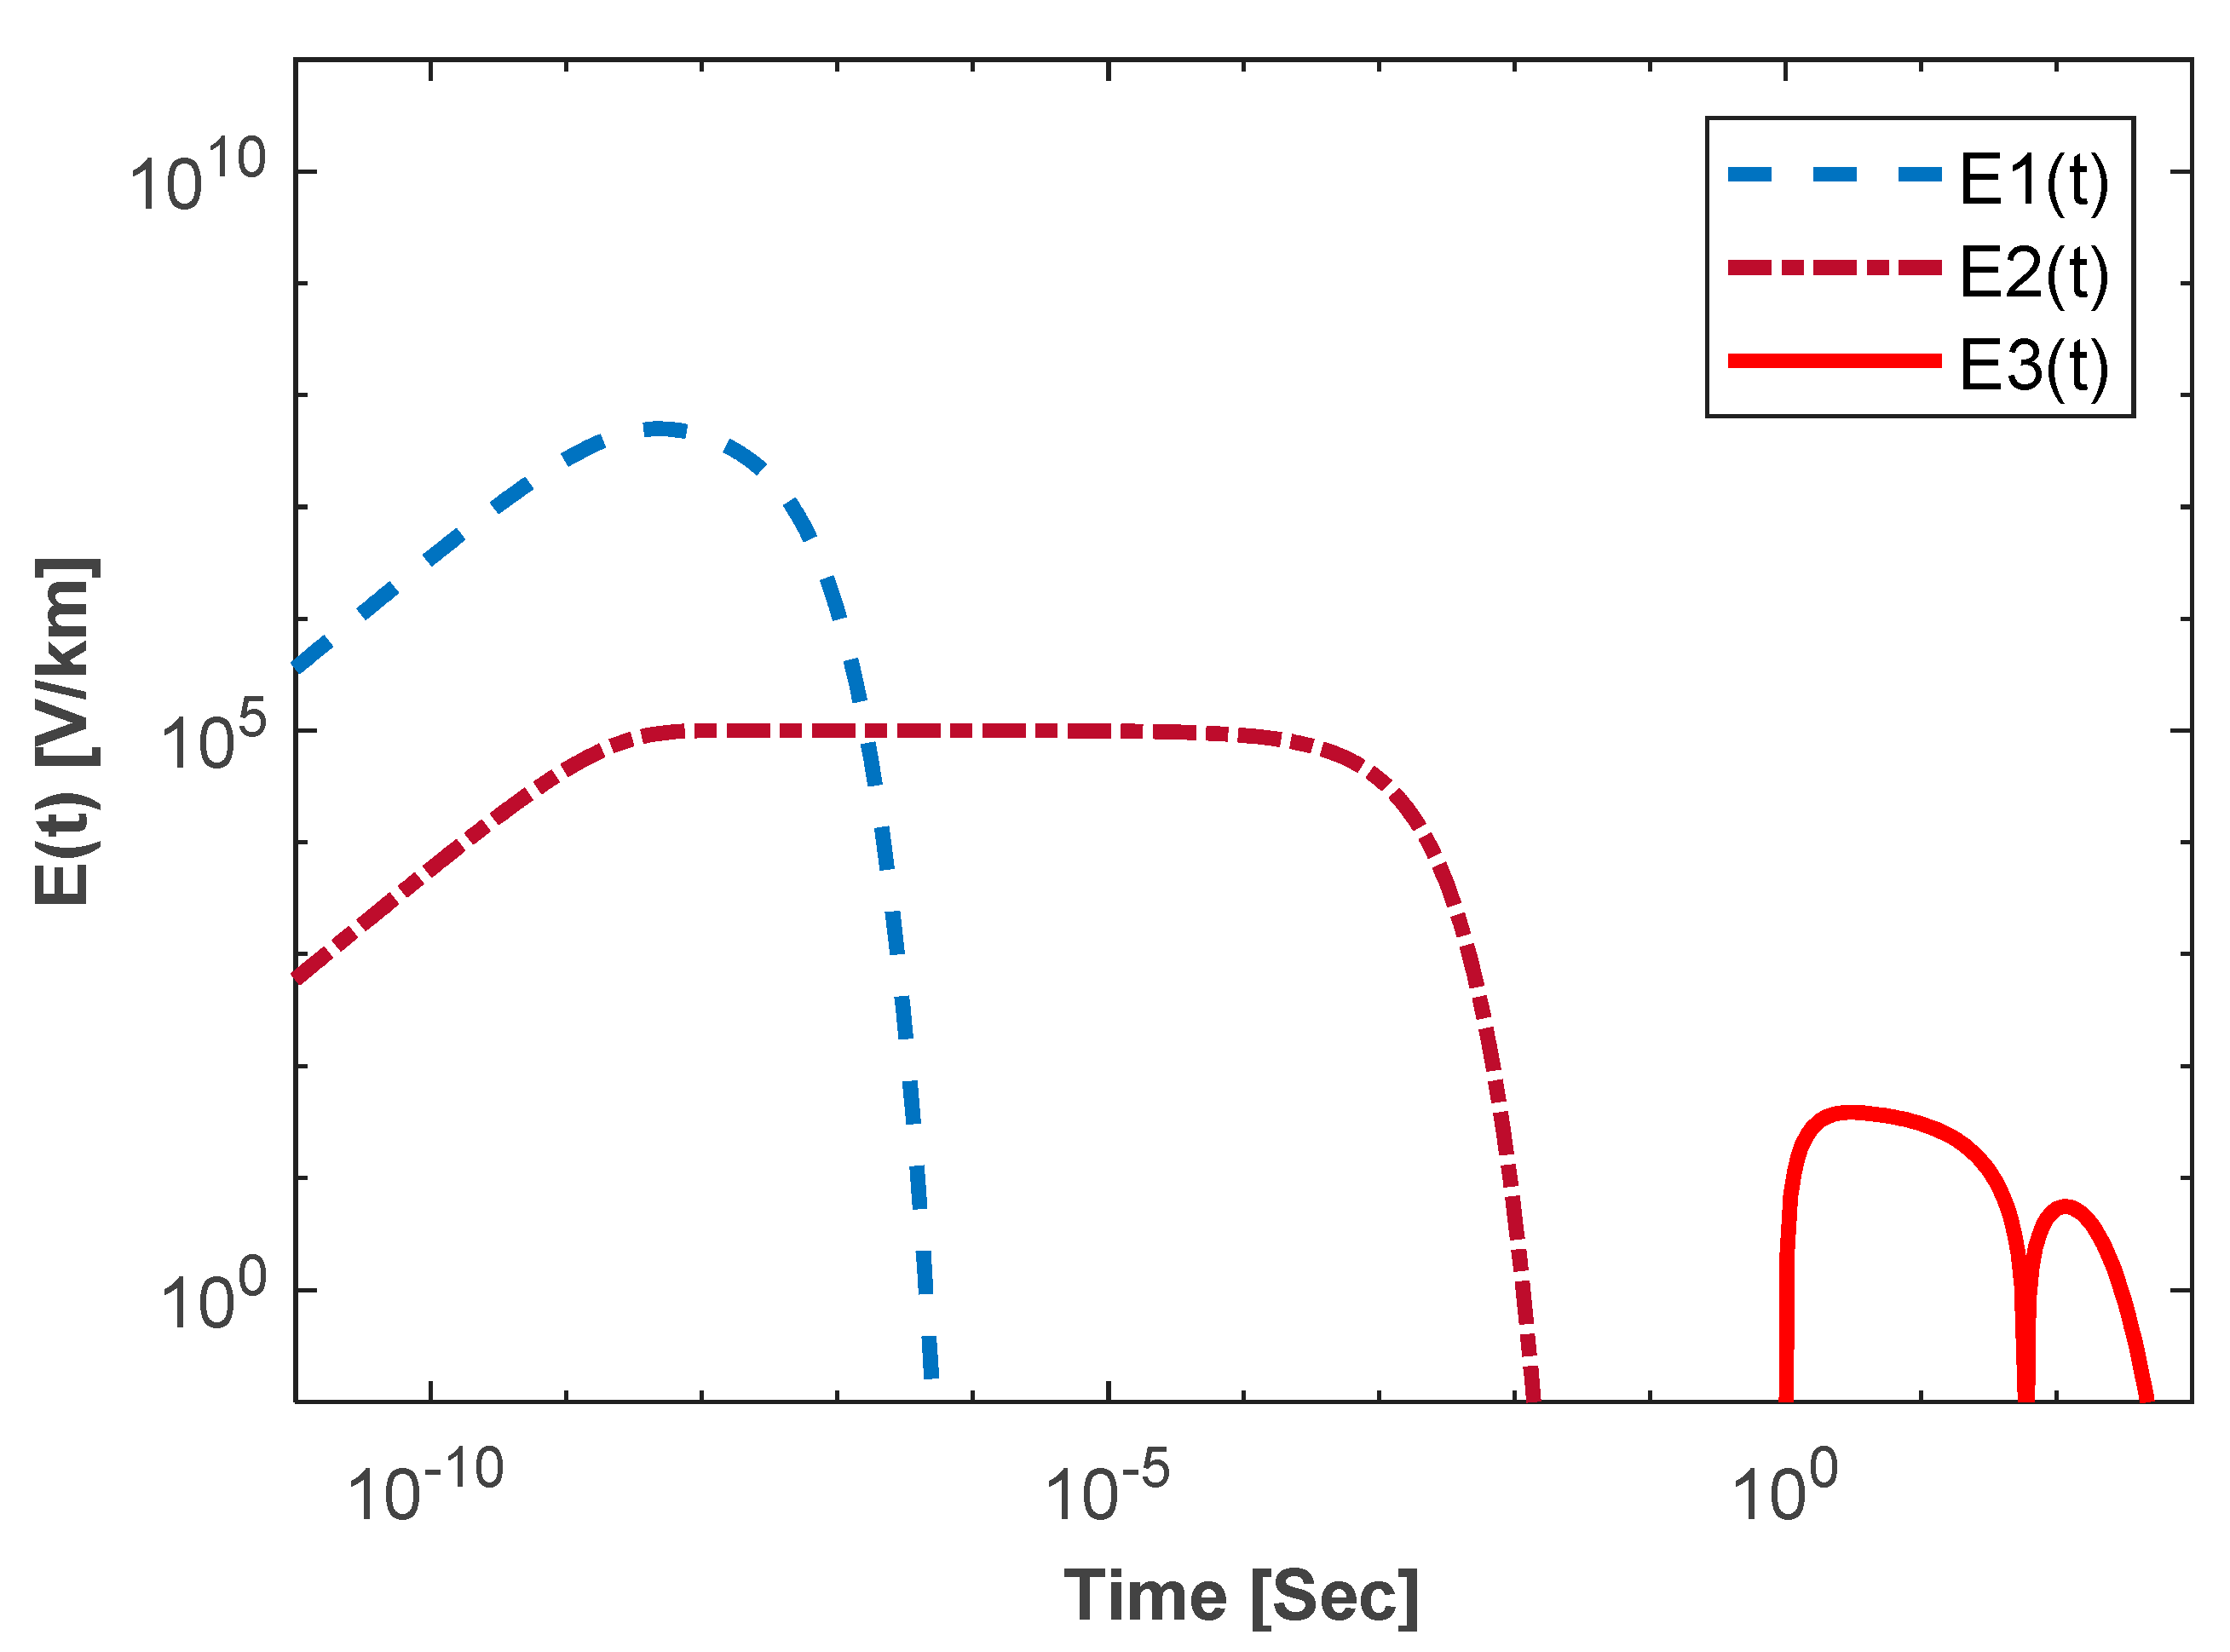
The geoelectric field generated by a HEMP consists of three different waveforms: E1, E2, and E3, as shown in
Figure 1 [
3,
4]. The E1 waveform is the fastest, has the shortest duration (in the order of nanoseconds), and its electric field intensity can reach millions of volts per kilometer. The E2 waveform has a duration in the order of microseconds and a peak magnitude of thousands of volts per kilometer. E1 and E2 cause considerable damage to electronic components and low- and medium-voltage electric infrastructure. The E3 waveform has a longer duration pulse, ranging from seconds to minutes, with a magnitude of tens of volts per kilometer. The early-time E1, intermediate E2, and late-time E3 have different time ranges and therefore impact power system assets differently. These different time durations mean each component is analyzed separately in power system studies. The adverse effects of the fast E1 and E2 components can be analyzed by performing an electromagnetic transient simulation, while the E3 component’s duration is similar to that of the transient stability [
4,
5].
The effect of the E3 HEMP is similar to that of a GMD [
6,
7]. Electric fields are induced during E3 HEMP and GMD events, which, in turn, generate geomagnetically-induced currents (GICs) in the power grid through transformer neutral grounding. In high-voltage power transformers, these slowly varying and quasi-DC GICs shift the operating point, which can lead to the half-cycle saturation of the transformer core. This saturation leads to harmonic currents, increased transformer heating, and additional reactive power consumption [
8,
9]. GMDs have a duration in the order of minutes to hours. Compared to GMDs, the E3 HEMP generates electric fields with higher magnitudes and shorter rise times.
The scope of this paper includes the impact of an E3 on Korean electric power systems, particularly the loss of reactive power support, which could potentially trigger voltage instability and power system collapse. In an earlier paper [
10], the authors presented an assessment of the impact of GMDs on Korean electric power systems by incorporating the increased reactive power demand into the steady-state power flow analysis. Here, the assessment is extended to a transient stability analysis in which the additional reactive power absorption of transformers during an E3 HEMP event is considered a large disturbance.
In this study, the vulnerability assessment consisted of the following steps. First, the magnitude, orientation and extent of the electric fields generated by the E3 HEMP were identified. Next, GIC flows over the entire Korean power grid were calculated by constructing a DC equivalent circuit based on the geographic locations of the power system components. Finally, the system security was studied by incorporating the reactive power demands into the static power flow analysis and the dynamic transient stability analysis. The maximum electric field that does not lead to power flow convergence problems was determined, and the capability of the Korean electric power systems to maintain synchronism and acceptable voltages in the transient stability time frame following an E3 HEMP event was evaluated. Furthermore, the effects of detonation at five burst locations were compared.
This paper is organized as follows.
Section 2 summarizes the literature on electric fields produced by the E3 HEMP, and
Section 3 describes the brief methodology used to assess the effect of the E3 HEMP on bulk power systems.
Section 4 discusses the evaluation of the impact of the E3 HEMP on the Korean electric power systems on based on the static and dynamic analyses. Finally, the conclusion is presented in
Section 5.
2. E3 HEMP Electric Fields
The electric fields generated by HEMPs can be characterized by their magnitude, orientation, frequencies, and spatial extent. All these parameters are affected by the weapon yield, detonation altitude, and earth conductivity structure beneath the surface. The behavior of E3 HEMP electric fields is quite complex, and they can have many different forms. This section presents two publicly available E3 HEPM electric fields that are used to analyze the potential impact of a HEMP on power systems.
2.1. Oak Ridge National Lab
An Oak Ridge National Laboratory (ORNL) publication in 1985 described the spatiotemporally varying electric field generated by an experimental nuclear bomb detonation [
11,
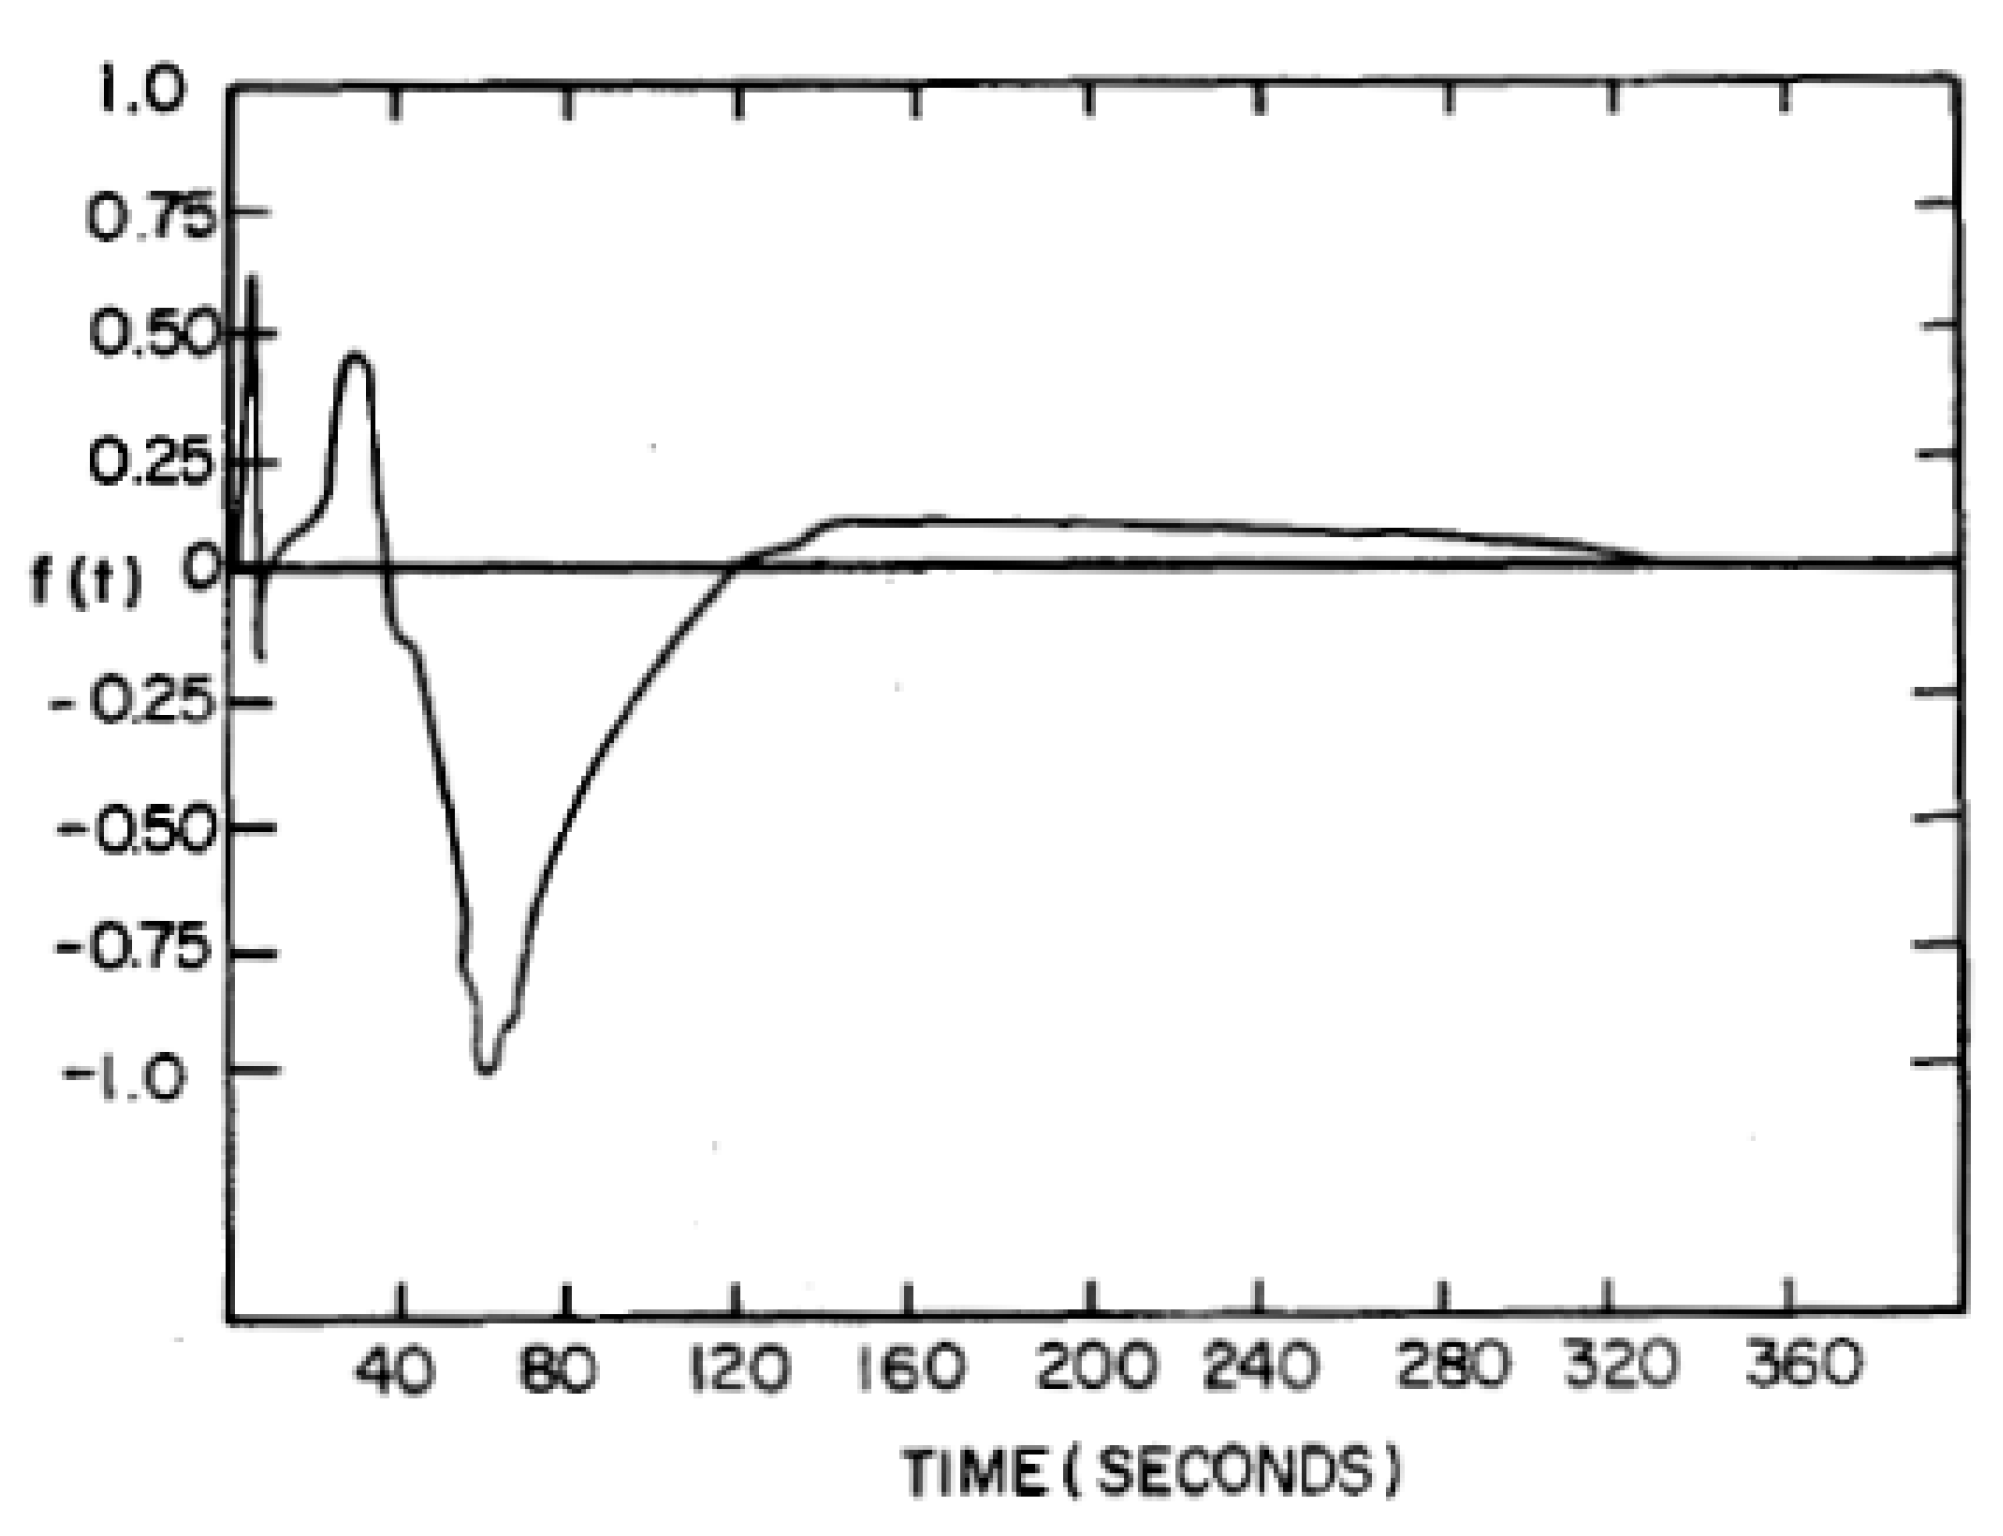
12]. In that publication, the electric field was expressed as the product of a spatially-independent time function—shown in
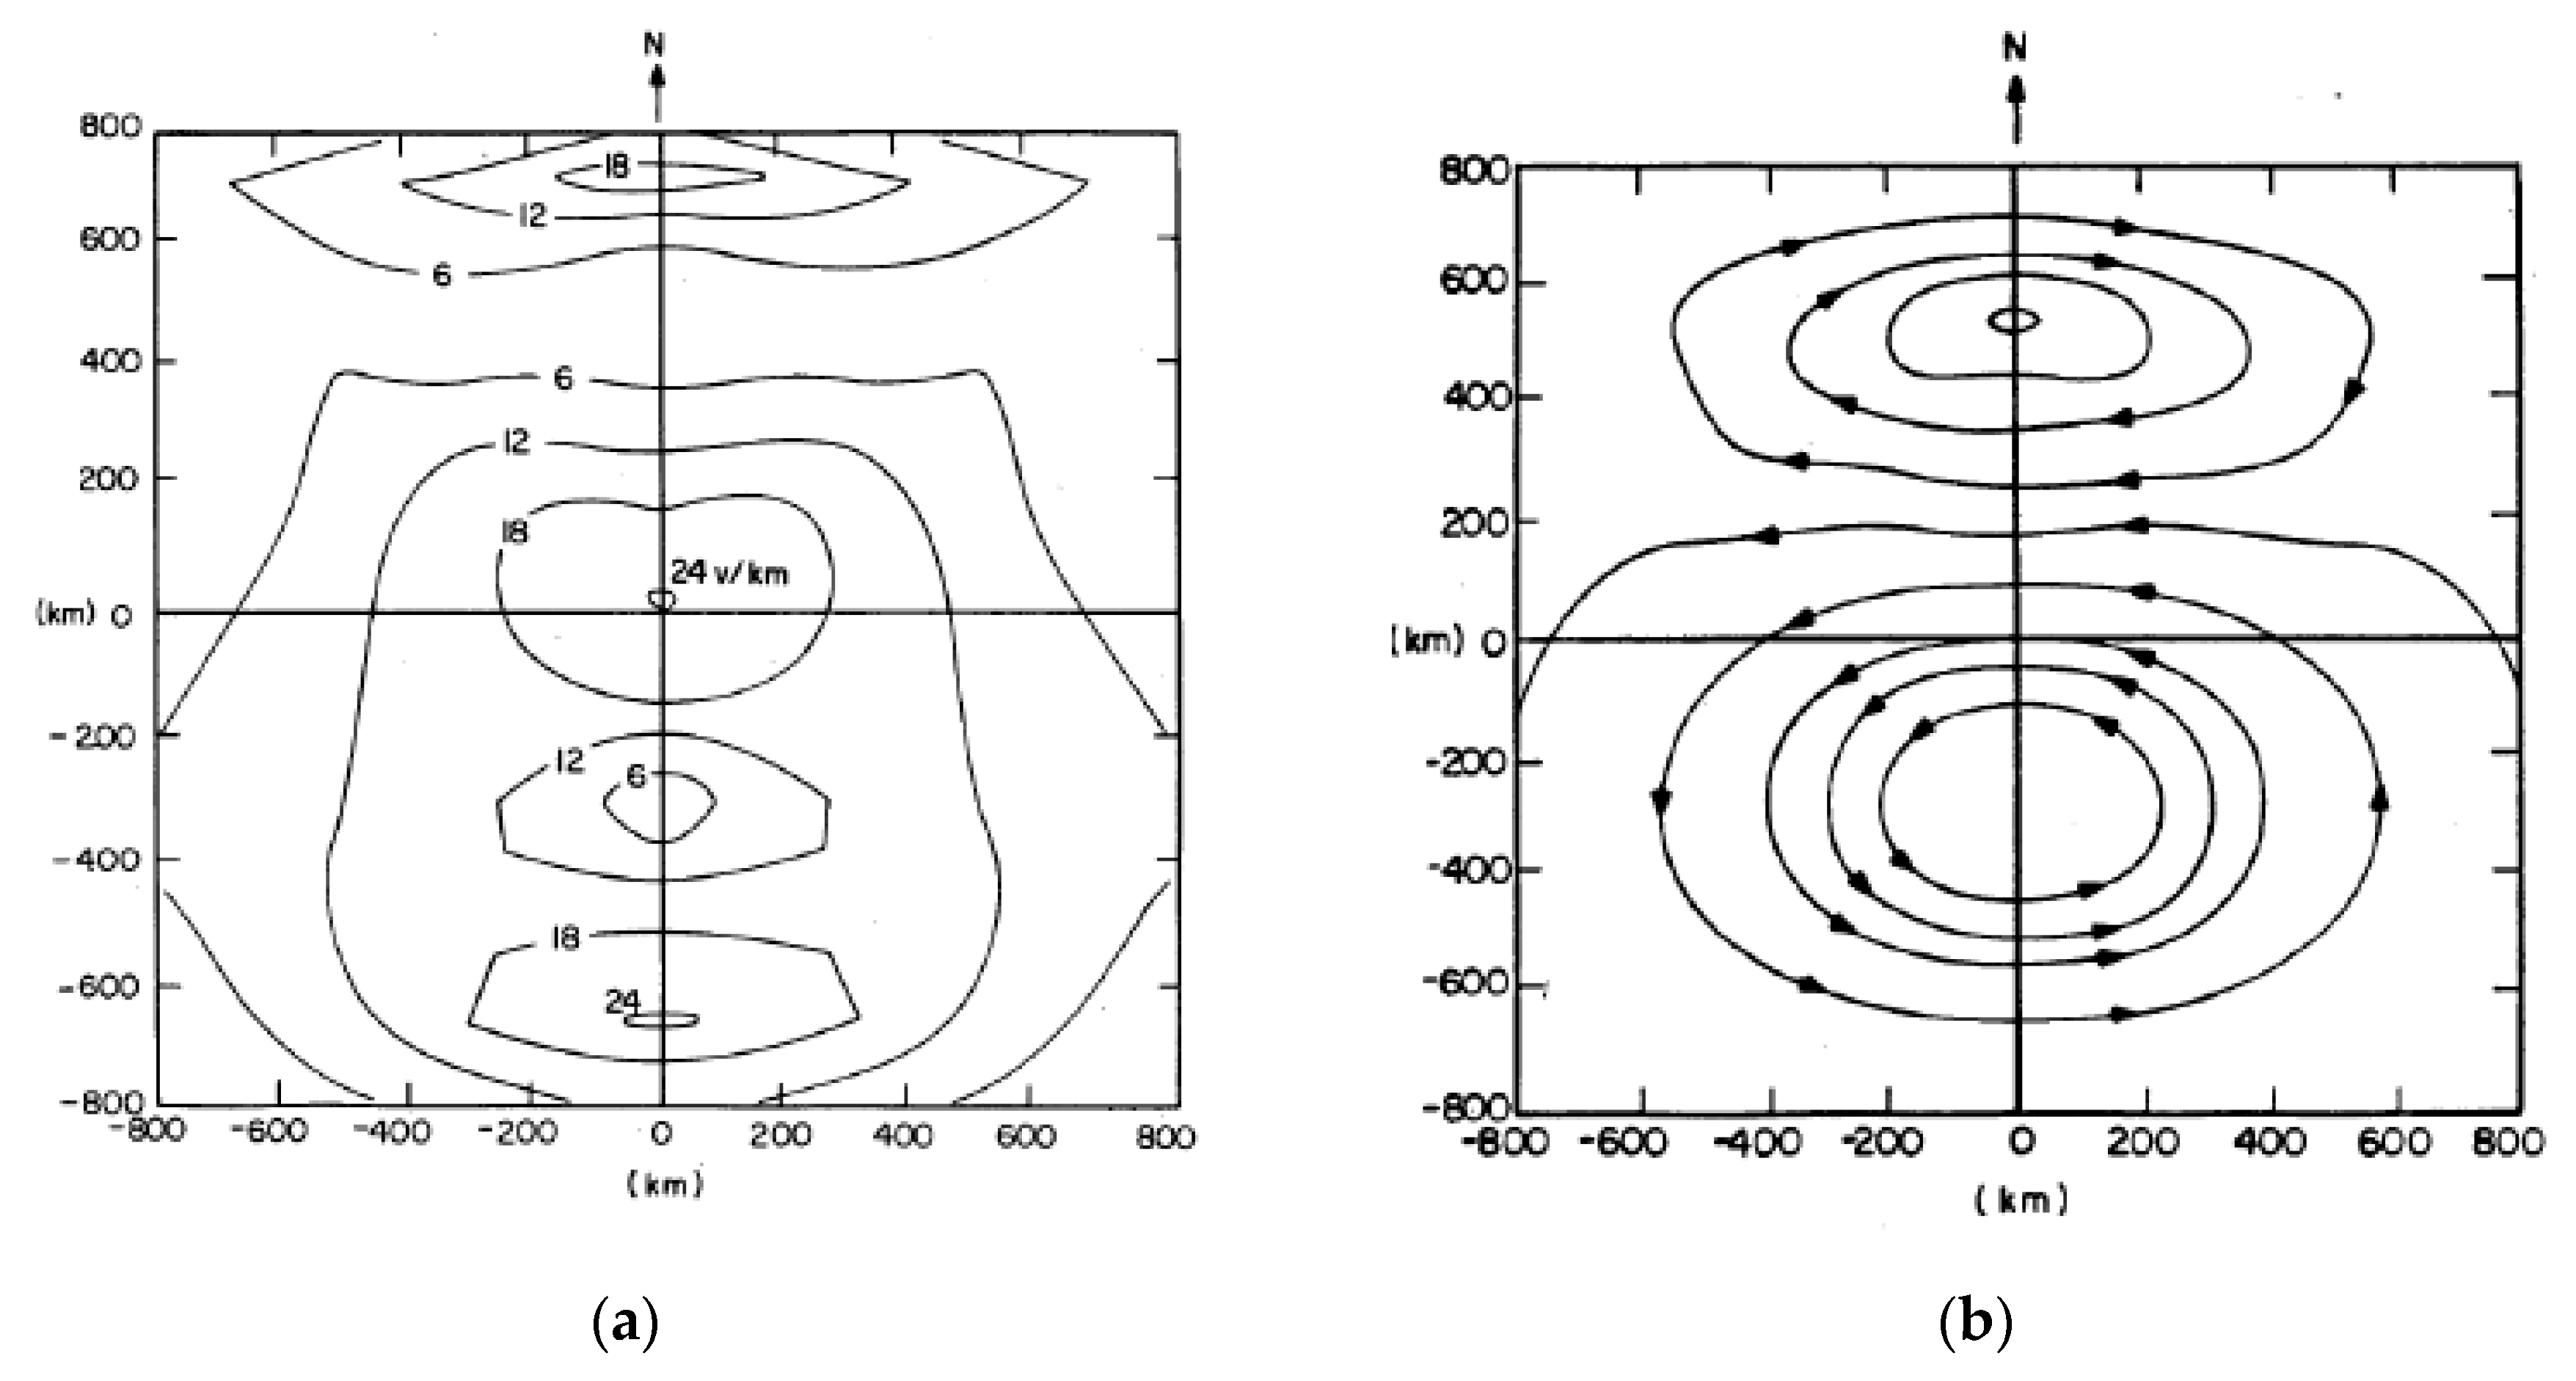
Figure 2—and time-independent spatially varying magnitude and direction functions, which are shown in
Figure 3a,b, respectively. The electric field model proposed by the ORNL is given by
where
represents the spatially-varying time-invariant electric field magnitude at the location defined by the coordinates
x and
y,
is a unit vector describing the spatially-varying time-invariant electric field direction at the location, and
is a time-varying, spatially-independent time scalar.
Figure 2 shows the time-dependent, spatially-independent behavior of the electric field and
Figure 3a,b shows the time-independent contour plots of the electric field magnitude and direction. The region approximately 1600 × 1600 km around the detonation location is affected.
The E3 HEMP can be further divided into E3A and E3B based on two distinct physical mechanisms. The E3A component represents the first 10 s of the waveform in
Figure 2, while the second component E3B starts at approximately 10 s and continues for the duration of the event, which is less than 400 s.
During the E3A period, it is commonly assumed that the electric field has a uniform magnitude and direction over a large area. In particular,
has a uniform value of 24 V/km, and
has a uniform direction of 90° with respect to the north direction. In contrast, the E3B electric field is strongly dependent on the geographic location. During the E3B period, as shown in
Figure 3a,b,
and
are considered non-uniform. The E3B electric field is strongly dependent on the target location. The function
f(
t) is common for both E3A and E3B periods [
12,
13].
From Equation (1) and the above assumptions, the largest amplitude of the E3 electric field is 24 V/km. The largest amplitude appears around the ground-zero location and at 60 s when the waveform in
Figure 2 has a negative peak value.
2.2. International Electrotechnical Commission
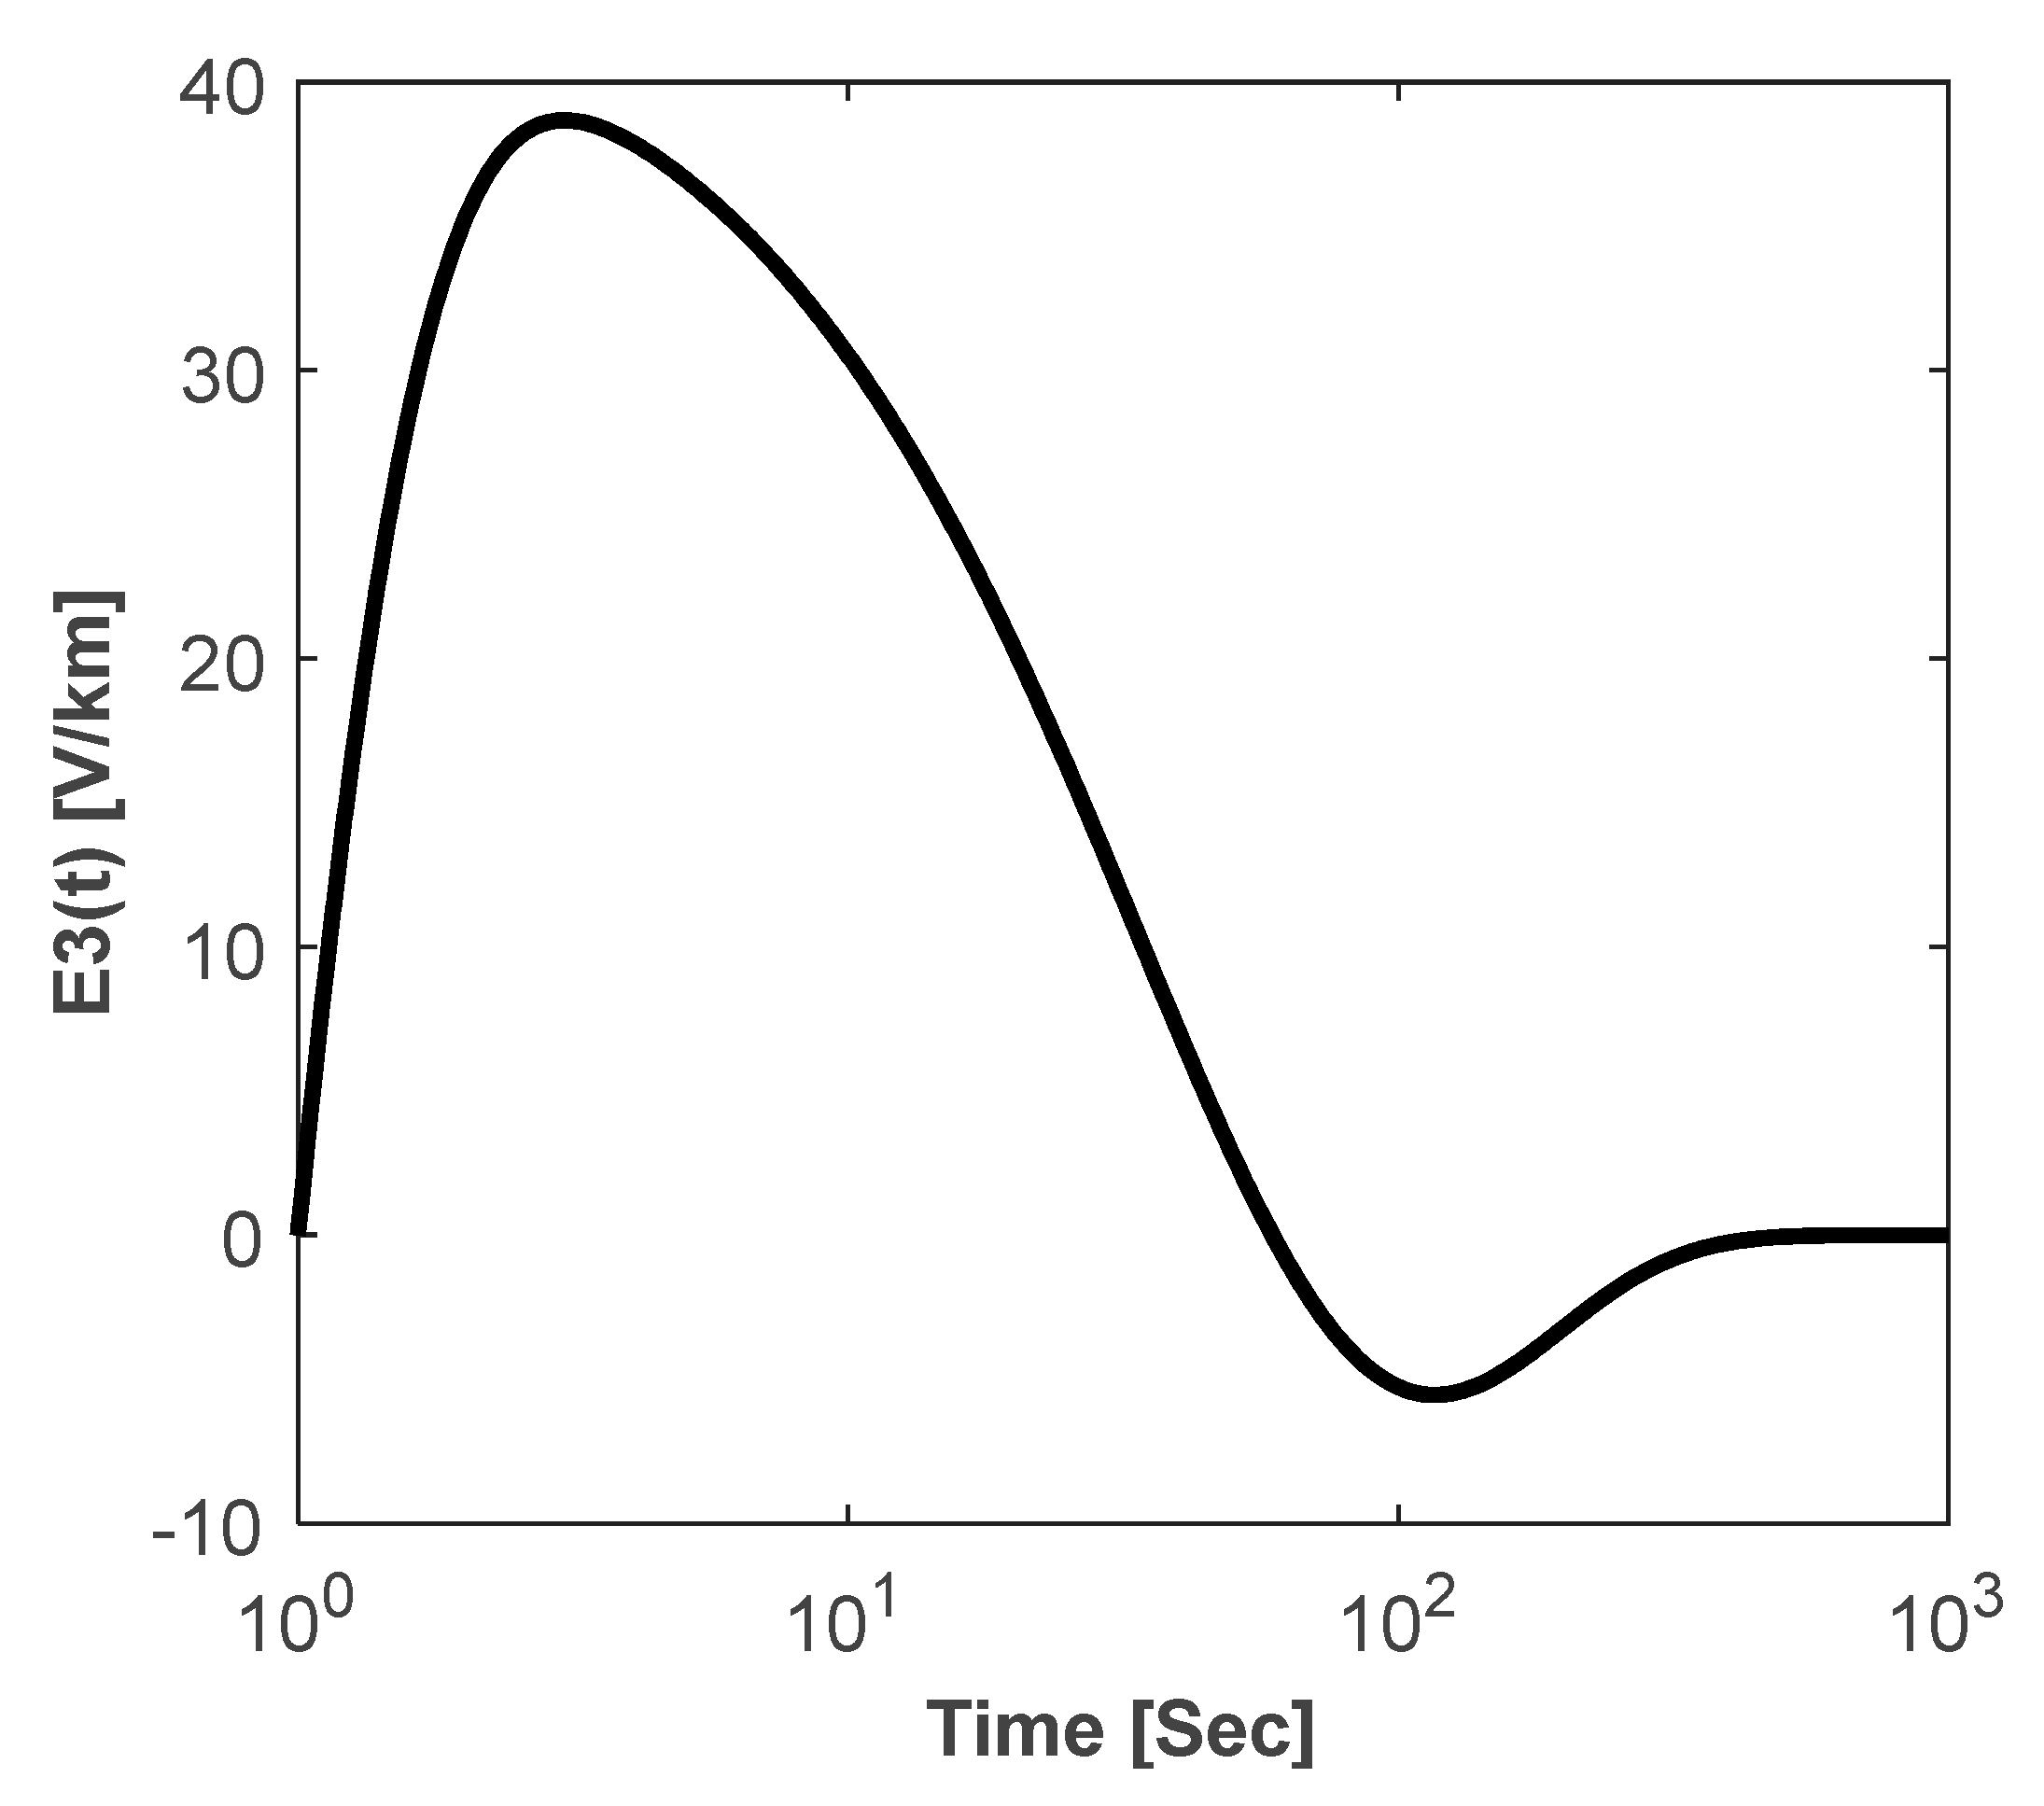
The International Electrotechnical Commission (IEC) developed a standard for the E3 HEMP, as shown in
Figure 4. The HEMP is not separated into E3A and E3B. Instead, a composite waveform is provided. The waveform describes a horizontal time-varying electric field, and there is no guidance regarding the spatial variations. The electric field has a peak value of 38 V/km, which is higher than the peak value of the ORNL model. The magnitude is obtained by assuming a uniform ground conductivity of 10
−4 S/m. More details about the IEC standard can be found in [
3].
3. Methodology to Assess E3 HEMP Effects
This section briefly presents the methodology used to evaluate the impact of the E3 HEMP on electric power systems. One of the electric fields defined in
Section 2 is used as the input in this methodology.
3.1. Calculation of GIC
The electric field at the Earth’s surface induces DC voltages in transmission lines. The first step in the analysis of the impact was to calculate the induced DC voltage using Faraday’s law, as follows:
where
is electric field and
is an incremental length along the transmission line.
The DC voltage sources were modeled as a series with the transmission lines. The induced DC line voltages were represented as injections of the Norton equivalent current
and the DC bus voltages
, which were calculated by solving the DC network equation:
where
is the Norton equivalent current vector of the DC voltage sources in (2),
is the augmented conductance matrix of the system including substation grounding resistance and substation neutral bus, and
is the voltage vector that combines the substation neutral DC voltages and the bus DC voltages.
The DC network was developed from the Alternating Current (AC) network information, and it included the transformer neutral resistance and substation grounding resistance. GIC flows were obtained from the calculated system DC voltages using Ohm’s law.
3.2. Calculation of Reactive Power Losses
Once the GIC flows were calculated, the next step was determining the transformer reactive power losses associated with the GICs. These reactive power losses vary linearly with terminal voltage and the amount of the GIC, and they depend on transformer configuration. The losses are expressed as [
14,
15,
16]:
where
QLOSS,pu is the GIC-related reactive power loss in per unit for transformer r,
K is a scaling factor that depends on the type of transformer core and number of phases and limbs,
Vpu,r is the high-side AC voltage in per unit for transformer
r, and
IGIC,r is the effective GIC in per unit flowing through transformer
r.
3.3. Incorporation of Additional Reactive Power Losses into Transient Stability Simulation
E3 HEMP rise times, particularly the E3A component, are in the order of seconds, which is similar to the time response of transient stability. Therefore, the impact of the E3 HEMP on power systems can be captured by performing a transient stability simulation. The additional reactive power loading because of the GIC-saturated transformers was incorporated into the transient stability models, and the additional reactive absorption was considered a large disturbance in the system.
To perform a transient stability simulation, the power system model was represented with the nonlinear differential and algebraic equations [
5,
17]:
Equation (5) represents the power system dynamics, with the x denoting dynamic state variables such as the generator rotor angle and speed. Equation (6) represents the stator and network algebraic equations, with y denoting algebraic variables such as the network bus voltage and angle.
The additional reactive power losses of Equation (4) were incorporated into the network algebraic equations of Equation (6), particularly the reactive power balance equations. During the transient stability solution process, the electric field strength changed continuously, and the GIC flows and reactive power losses were updated at each simulation time step.
4. Vulnerability Assessment of Korean Electric Power Systems to E3 HEMP
The impact of the HEMP was analyzed using the 2014 Korean electric power system model.
Table 1 presents the overall system information. The geographic coordinates of all system buses and components were entered and used to construct the DC equivalent circuit required for GIC calculation. Based on the substation design criterion at the Korea Electric Power Corporation [
18], the substation grounding resistance was assumed to be one ohm. All transformer neutral resistances were ignored, and larger GICs were expected accordingly. In the transformer configuration, 345 and 765 kV transformers were modeled as autotransformers, their core type was set to a single-phase transformer (three separate cores), and 154 kV transformers were modeled as three-phase five-legged transformers.
The PowerWorld Simulator was used to perform the vulnerability assessment, and it calculated the GIC flows over the network and additional reactive power losses in transformers [
19]. The simulator is capable of performing steady-state power flow and transient stability analyses for increased reactive power demands caused by GIC flows associated with the E3 HEMP.
4.1. Vulnerability Assessment on the Basis of Power Flow Analysis
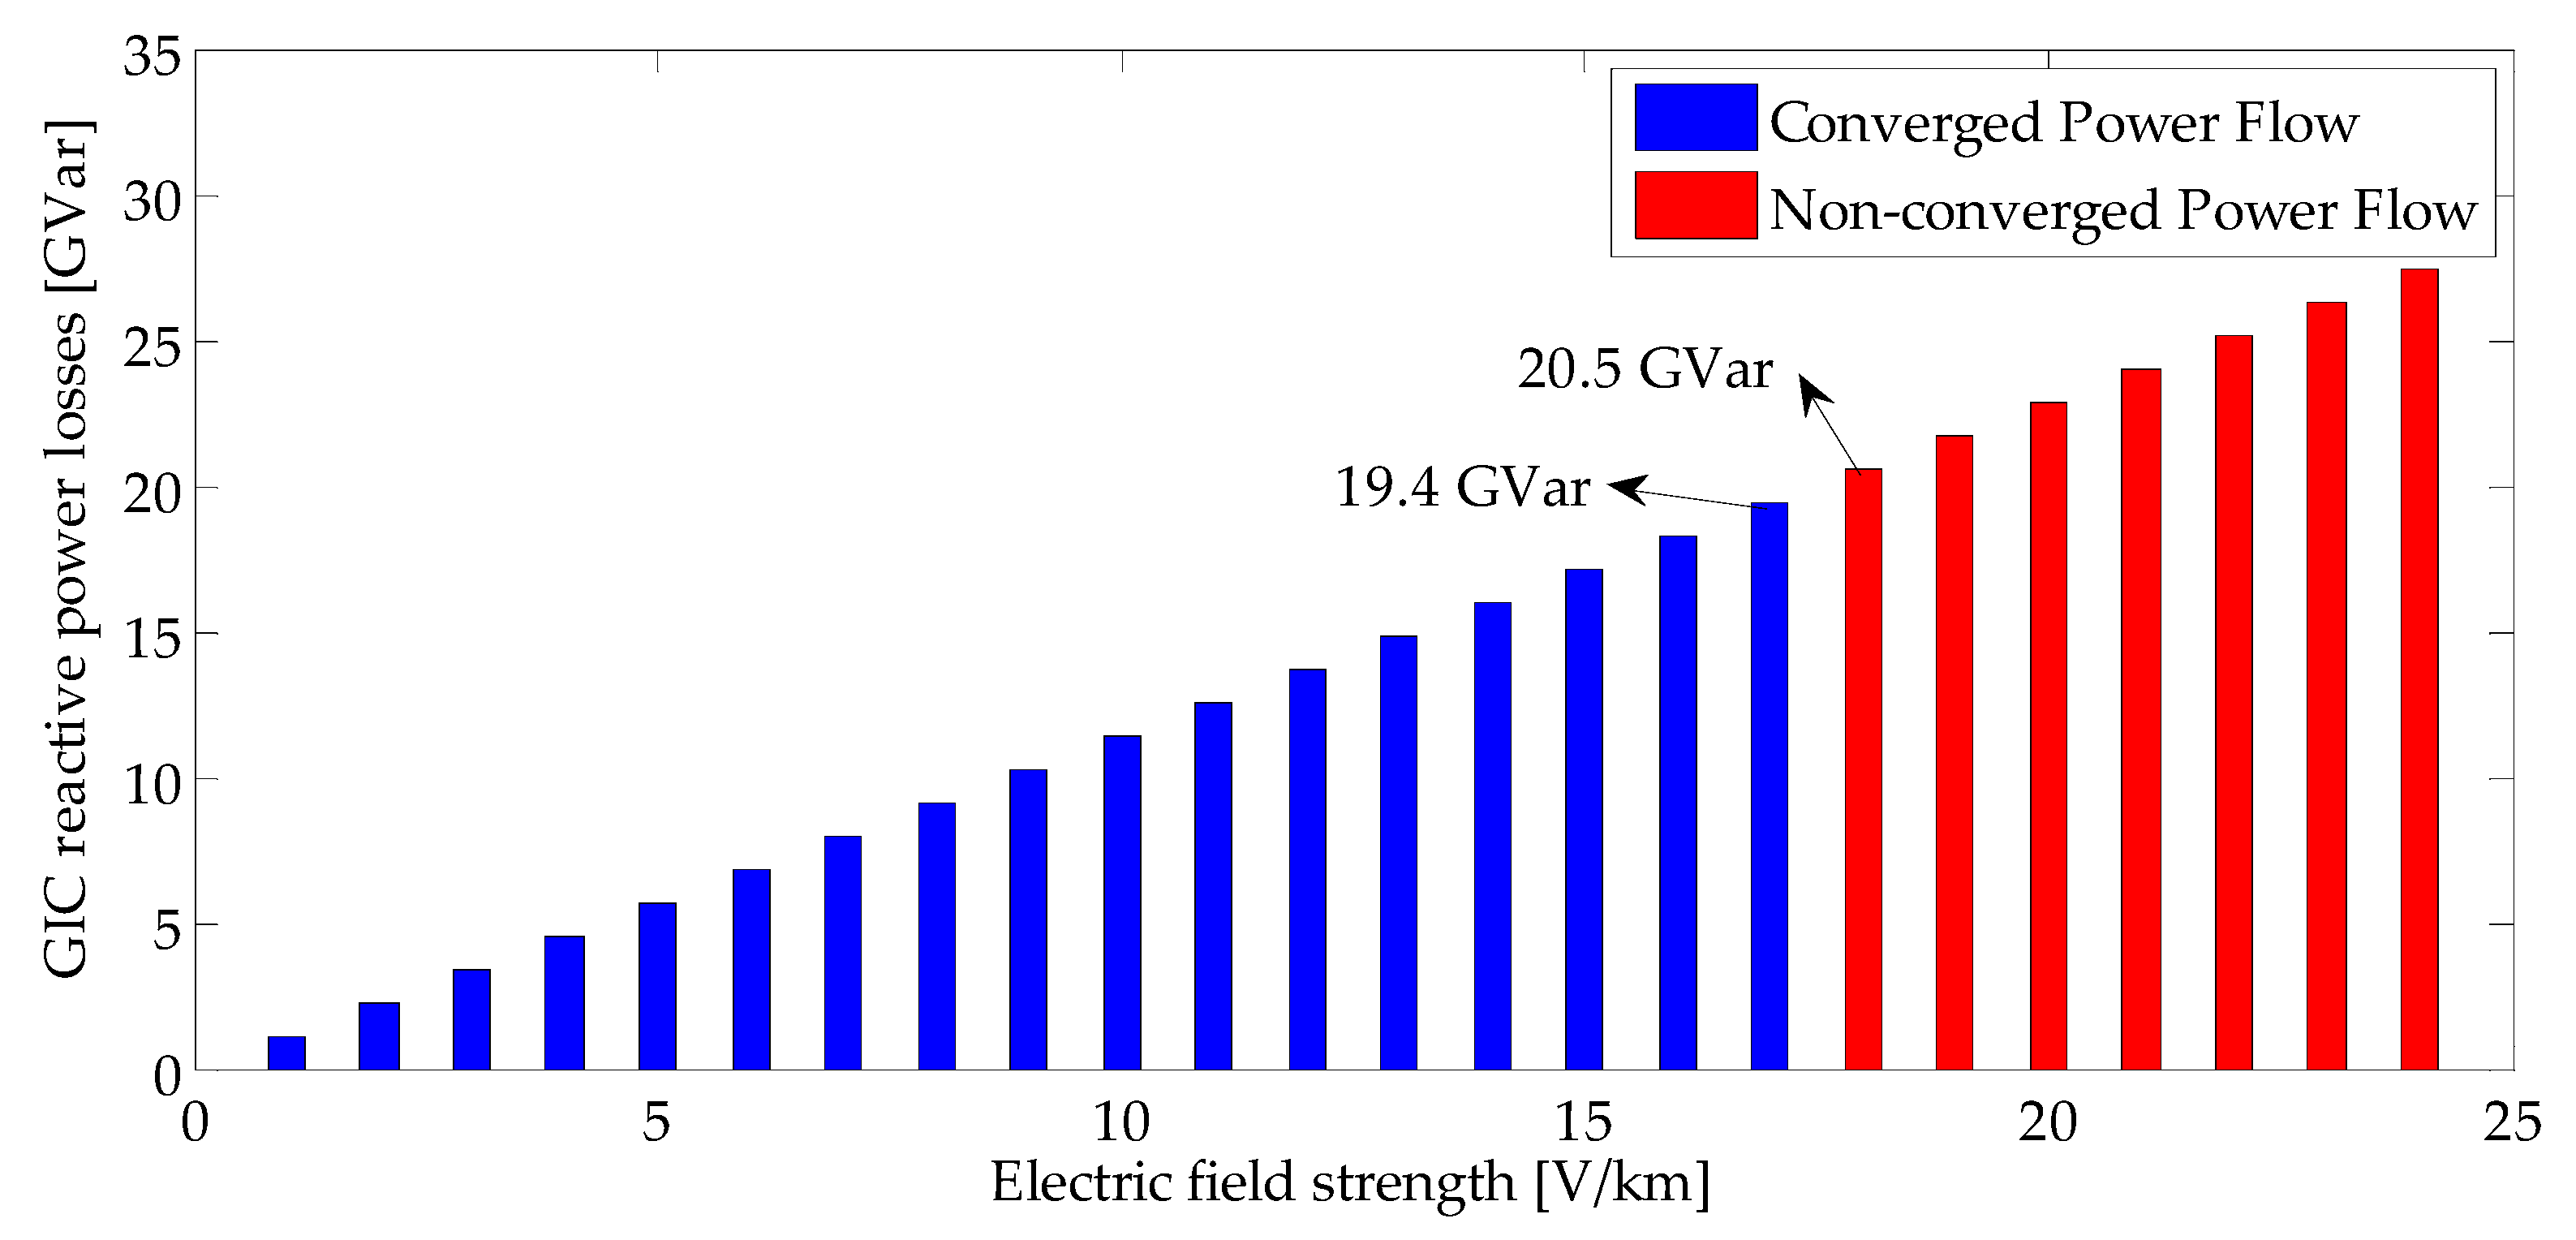
First, the vulnerability of the Korean electric power system was assessed by performing a steady-state power flow analysis under the assumption of a uniform geoelectric field over the entire grid. The geoelectric field strength was increased from 0 to 24 V/km in 1 V/km steps, and the orientation of the geoelectric field was fixed at 95° with respect to the north direction; this orientation corresponds to the maximum amount of reactive losses for the case considered here. As expected from Equations (2)–(4), an increase in the geoelectric field amplitude increased the reactive power losses of transformers in the system.
Figure 5 shows a linear relationship between the total GIC reactive power losses and the geoelectric field strength. Then, a power flow analysis was performed that included the additional reactive power demands. The blue bar indicates that the additional reactive consumption did not cause power flow convergence problems. In contrast, the reactive power addition, represented by the red bar, caused such problems. For a geoelectric field strength of 18 V/km, the addition of 20.5 GVar of total reactive power losses resulted in a system blackout, indicating the absence of power flow convergence. From a static security limit perspective, the geoelectric field amplitude should be lower than 18 V/km to avoid voltage collapse in Korean electric power systems.
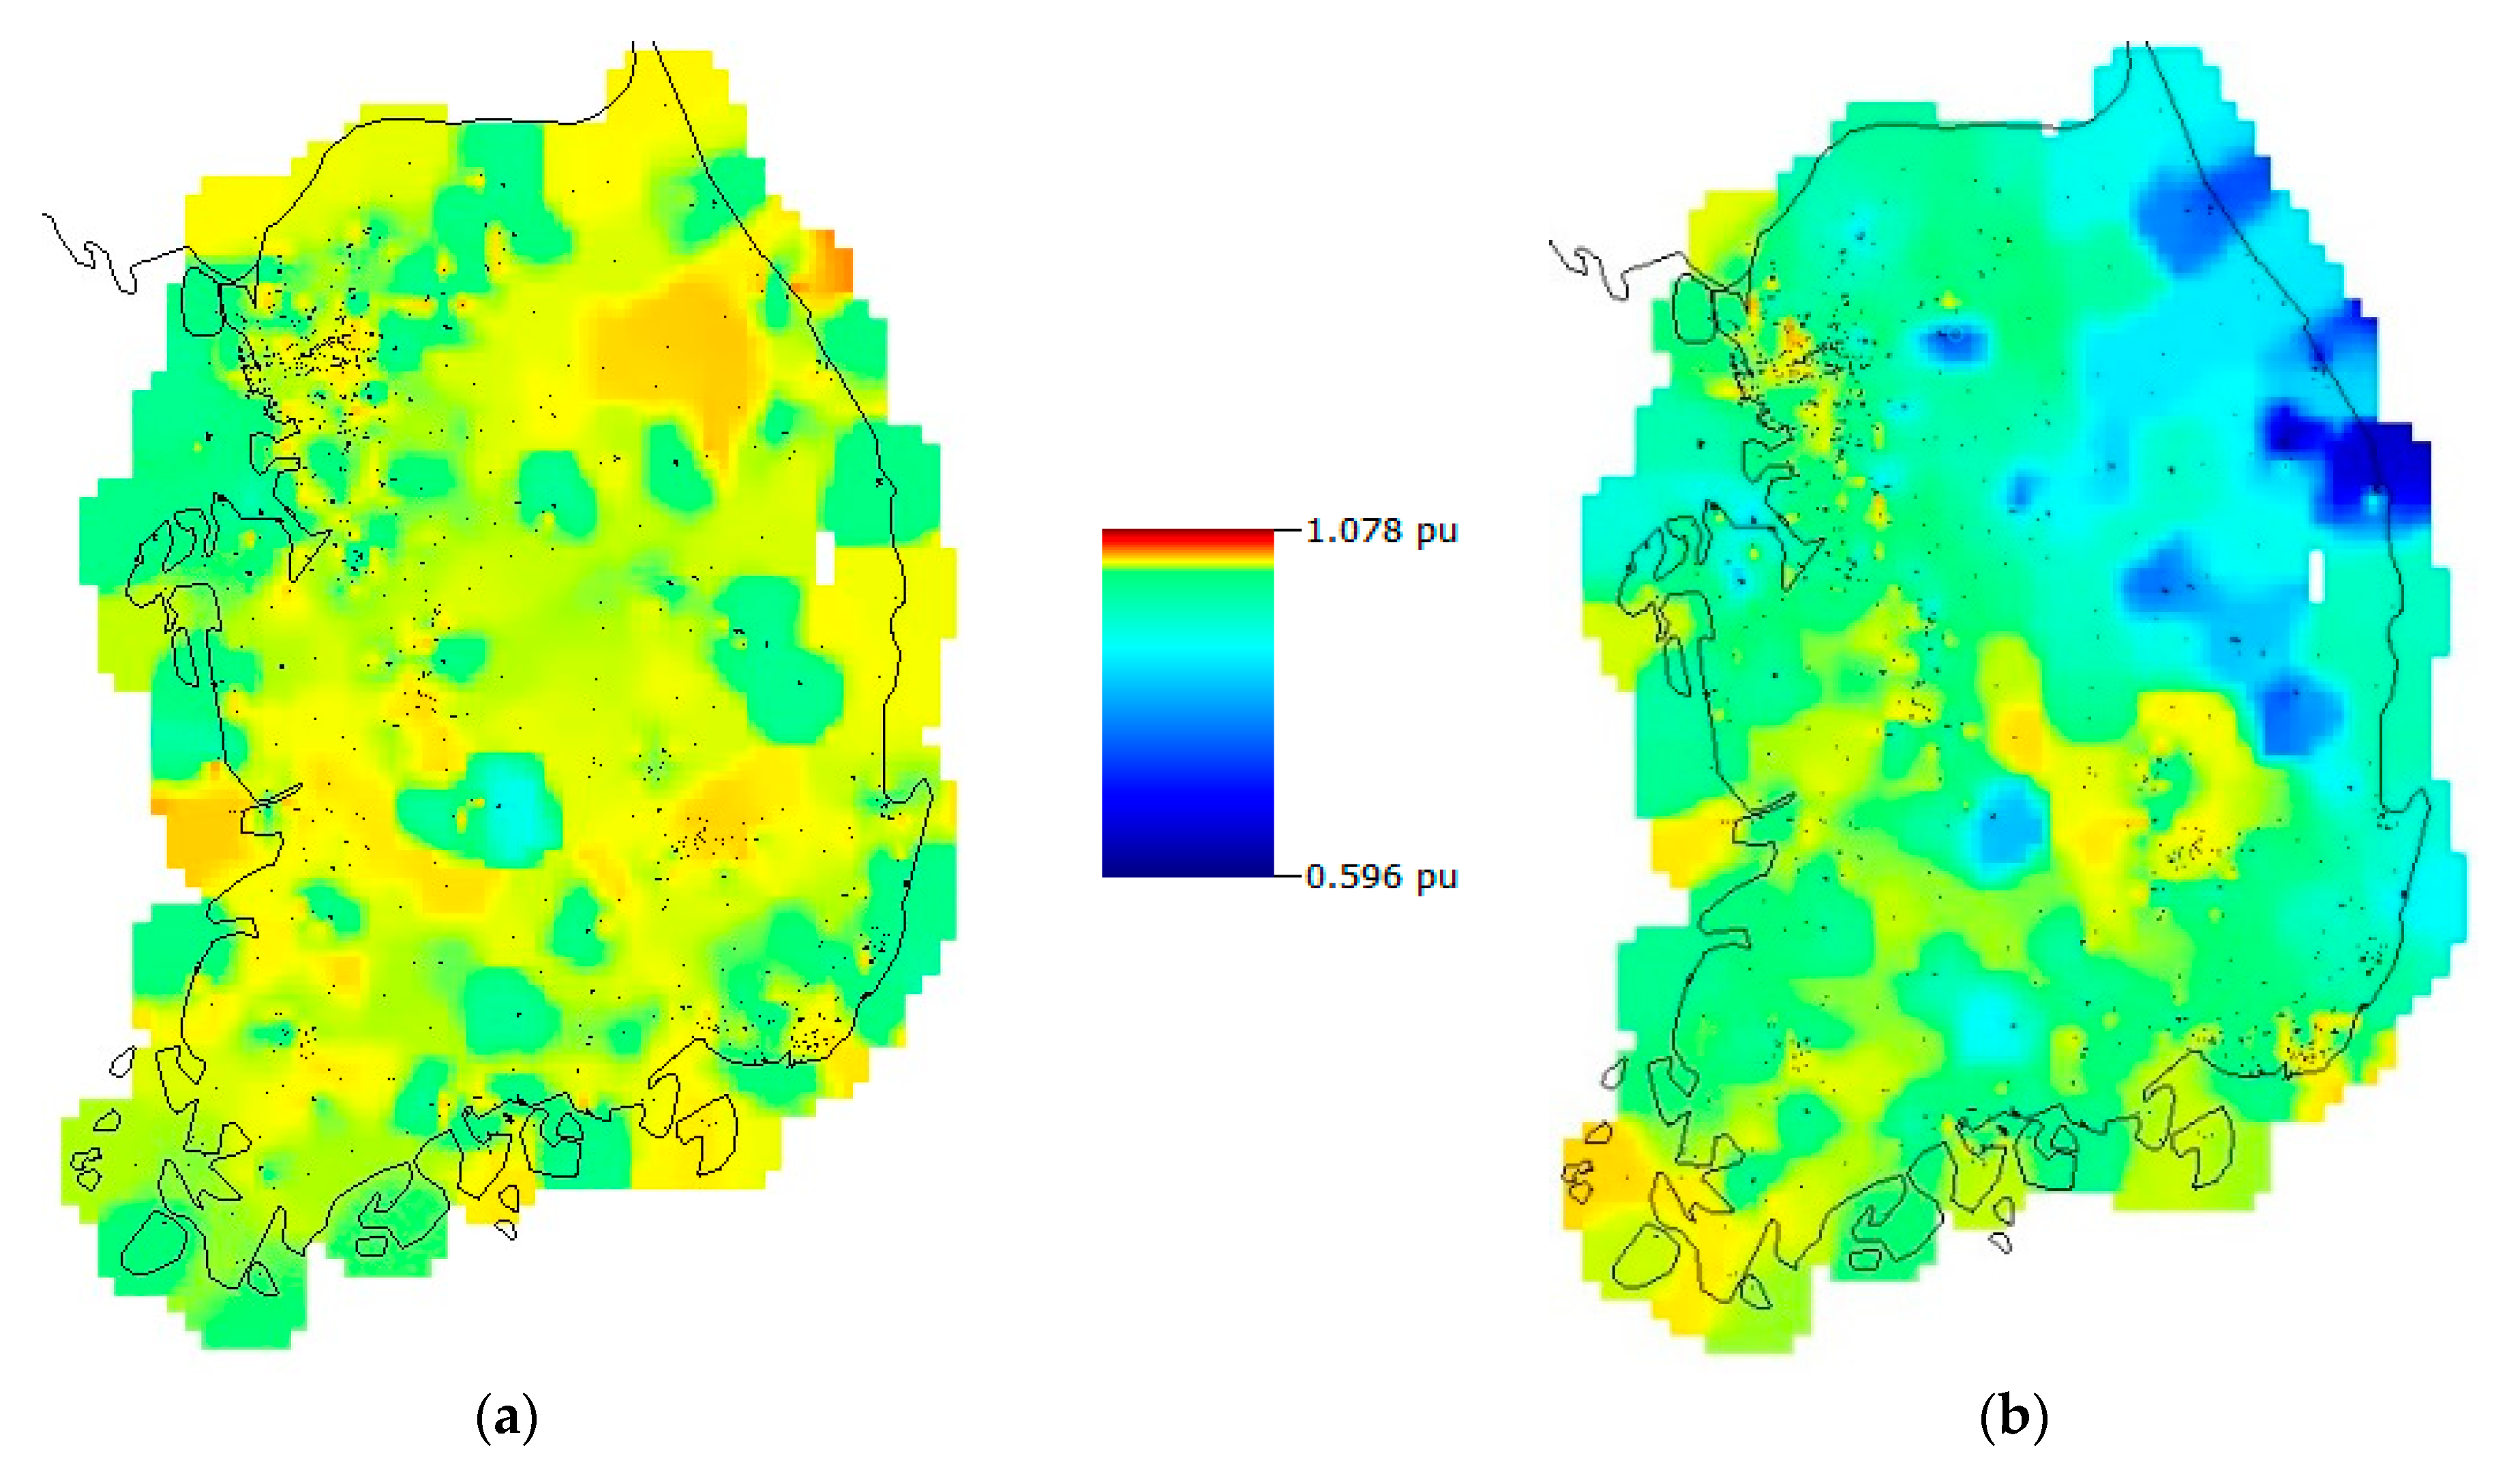
The change in voltage levels resulting from the addition of reactive power demands can be identified by comparing the contour plots shown in
Figure 6.
Figure 6a shows a contour plot of the voltage magnitude in the absence of the geoelectric field, and
Figure 6b depicts the voltage contour when a geoelectric field of strength 17 V/km and an orientation of 95° is present. An increased reactive loading of 19.4 GVar led to a voltage deviation between −0.4148 and 0.0125 p.u. Most of the system buses showed a reduced voltage magnitude. Though the reduced voltage magnitude in the east-coast region was high, even violating the Korean operation guidelines, the power system remained operational. A few buses showed an increased voltage magnitude because the switched shunt devices provided reactive power support to maintain a specific voltage level. The increased reactive power losses, which required more current flows from generators, increased the real power losses from 826.3 to 1120 MW.
4.2. Vulnerability Assessment on the Basis of Transient Stability Analysis
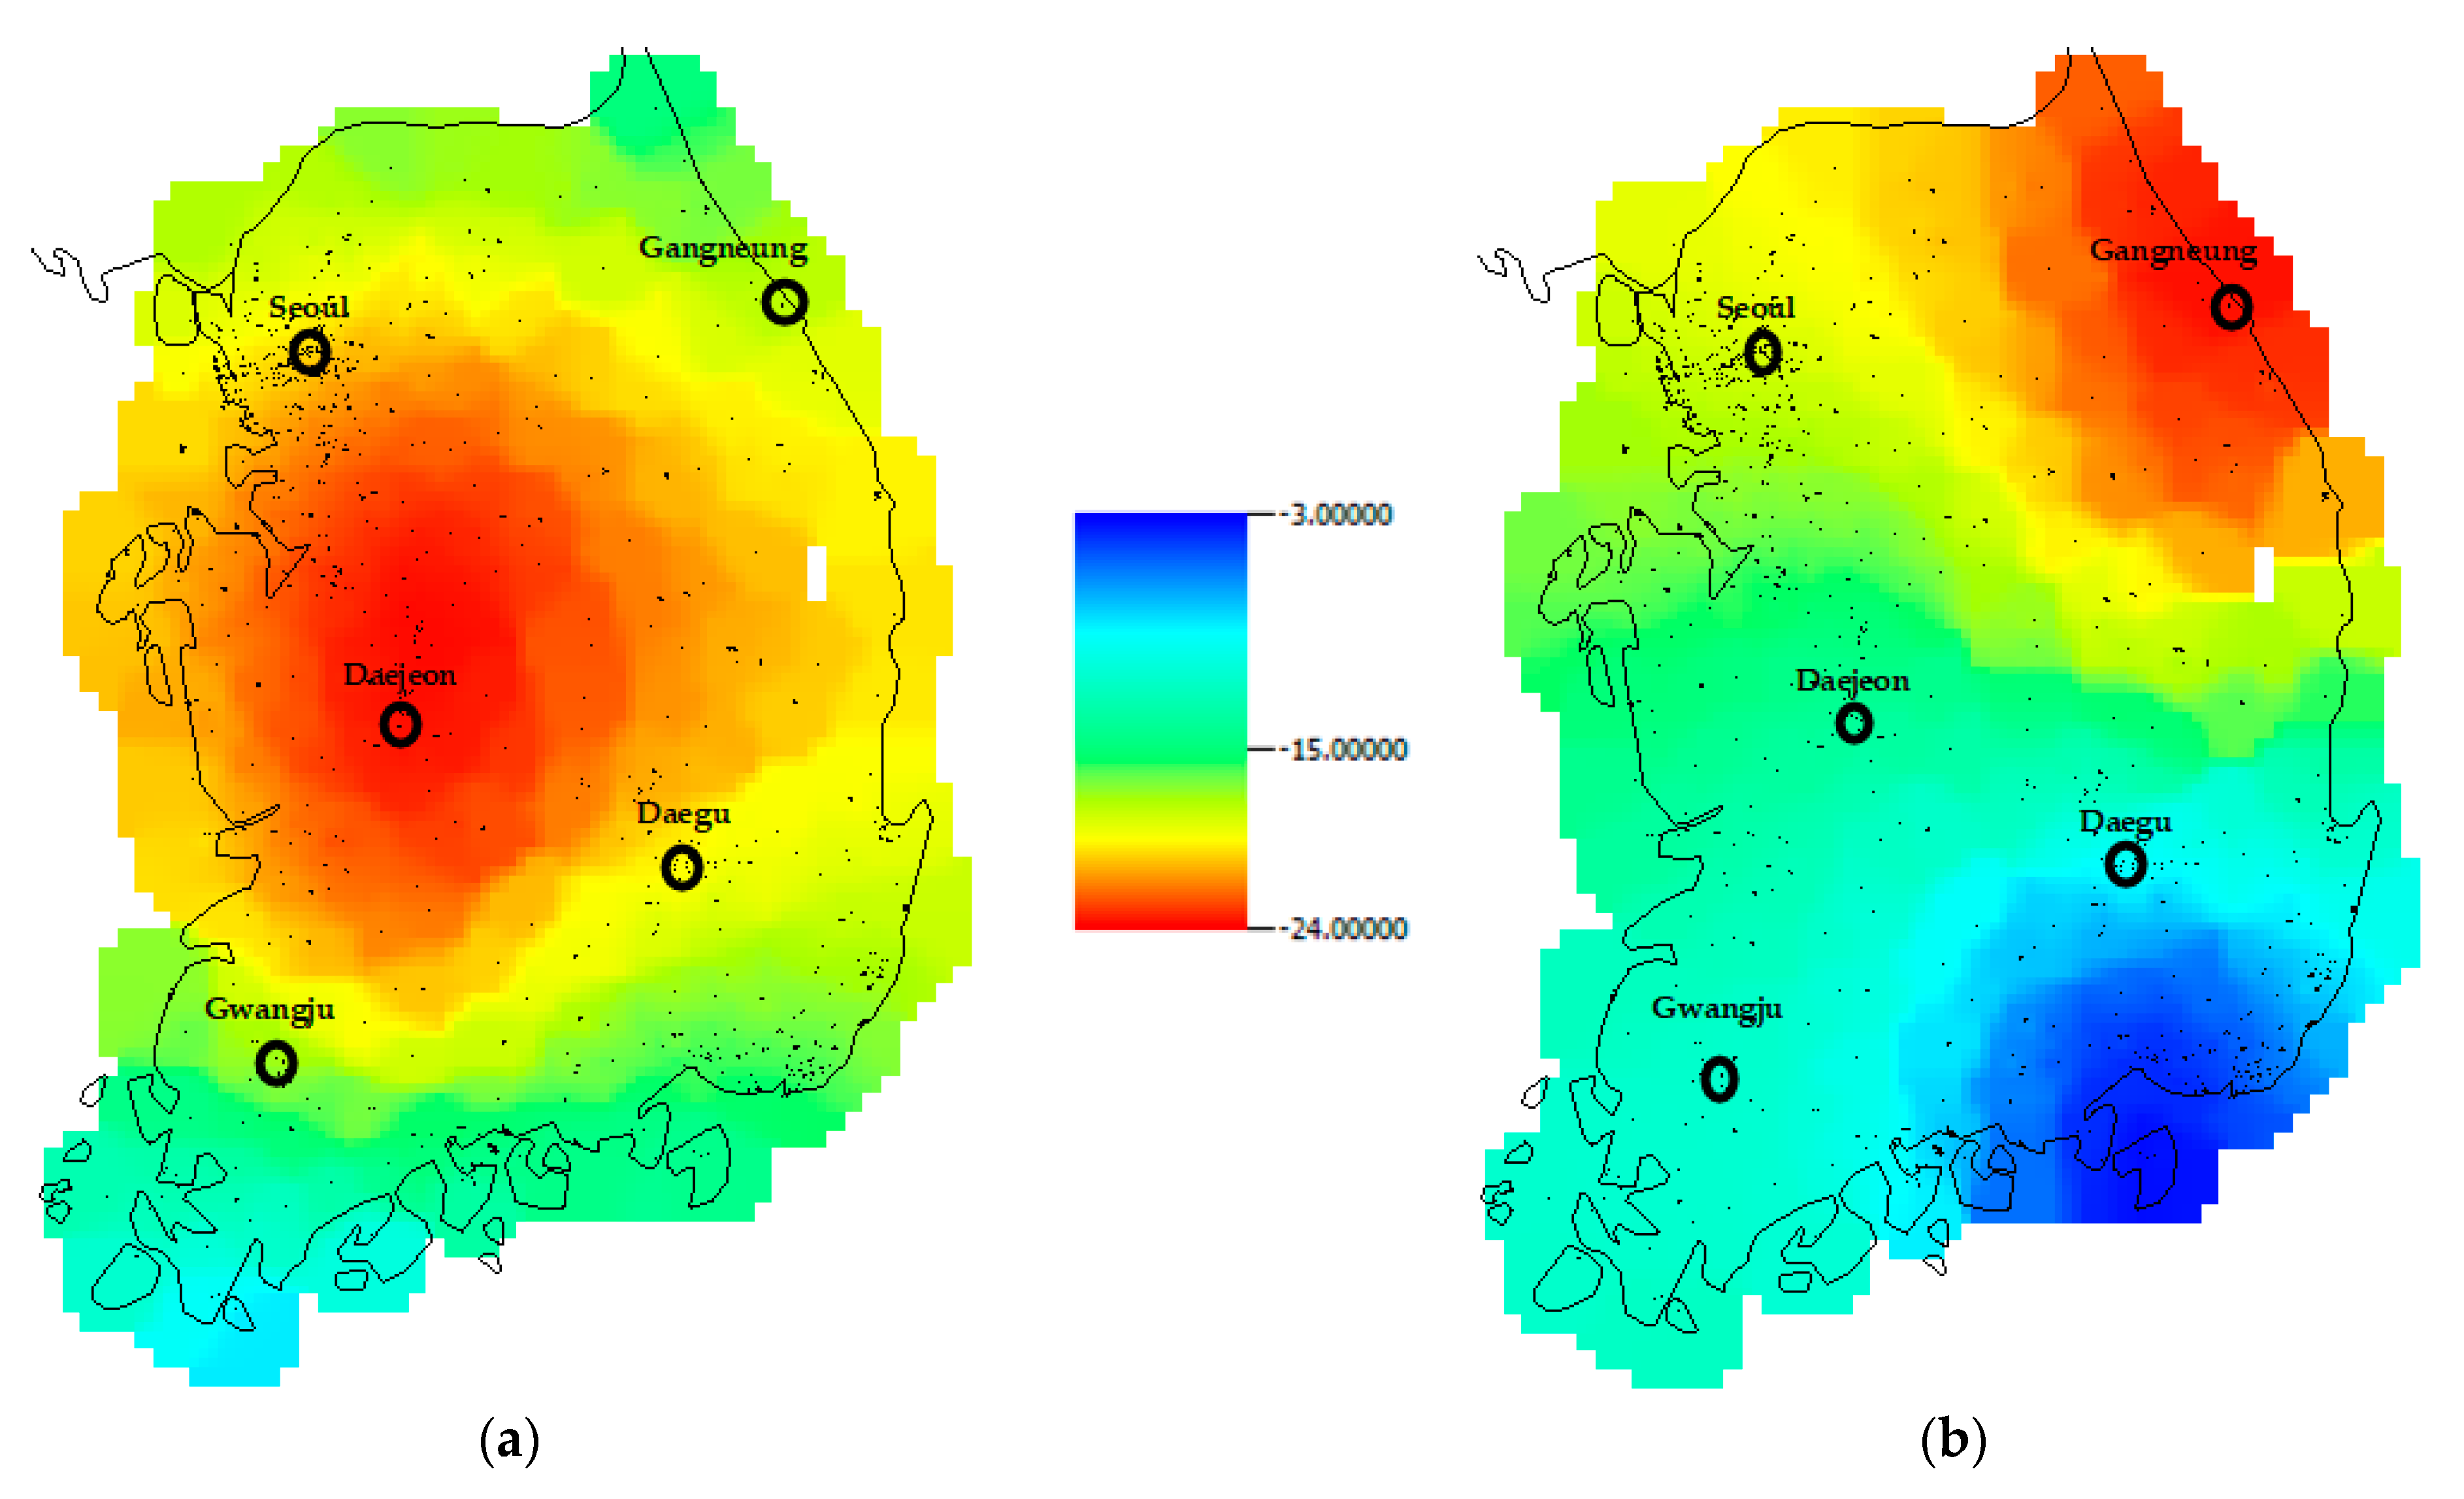
Transient stability simulations were also conducted to determine the potential of the E3 HEMP to impact the operation of power systems. The ORNL electric field model was chosen for the simulations. The strength of the geoelectric fields was lower in the ORNL model than the IEC standard, and a vulnerability assessment was therefore performed with relatively weaker impacts. The geoelectric field obtained from the ORNL model as time-series data was input into the PowerWorld Simulator. For comparison purposes, five cities were selected as ground-zero locations: Seoul, Gangneung, Daejeon, Gwangju, and Daegu.
Table 2 presents their geographic coordinates, and
Figure 7 shows their locations on a geographic map. The two plots in the figure show the geoelectric fields over the Korean power grid at 60 s after detonation, which occurred in Daejeon and Gangneung, respectively. Each ground-zero location was exposed to the largest geoelectric field strength of 24 V/km at 60 s.
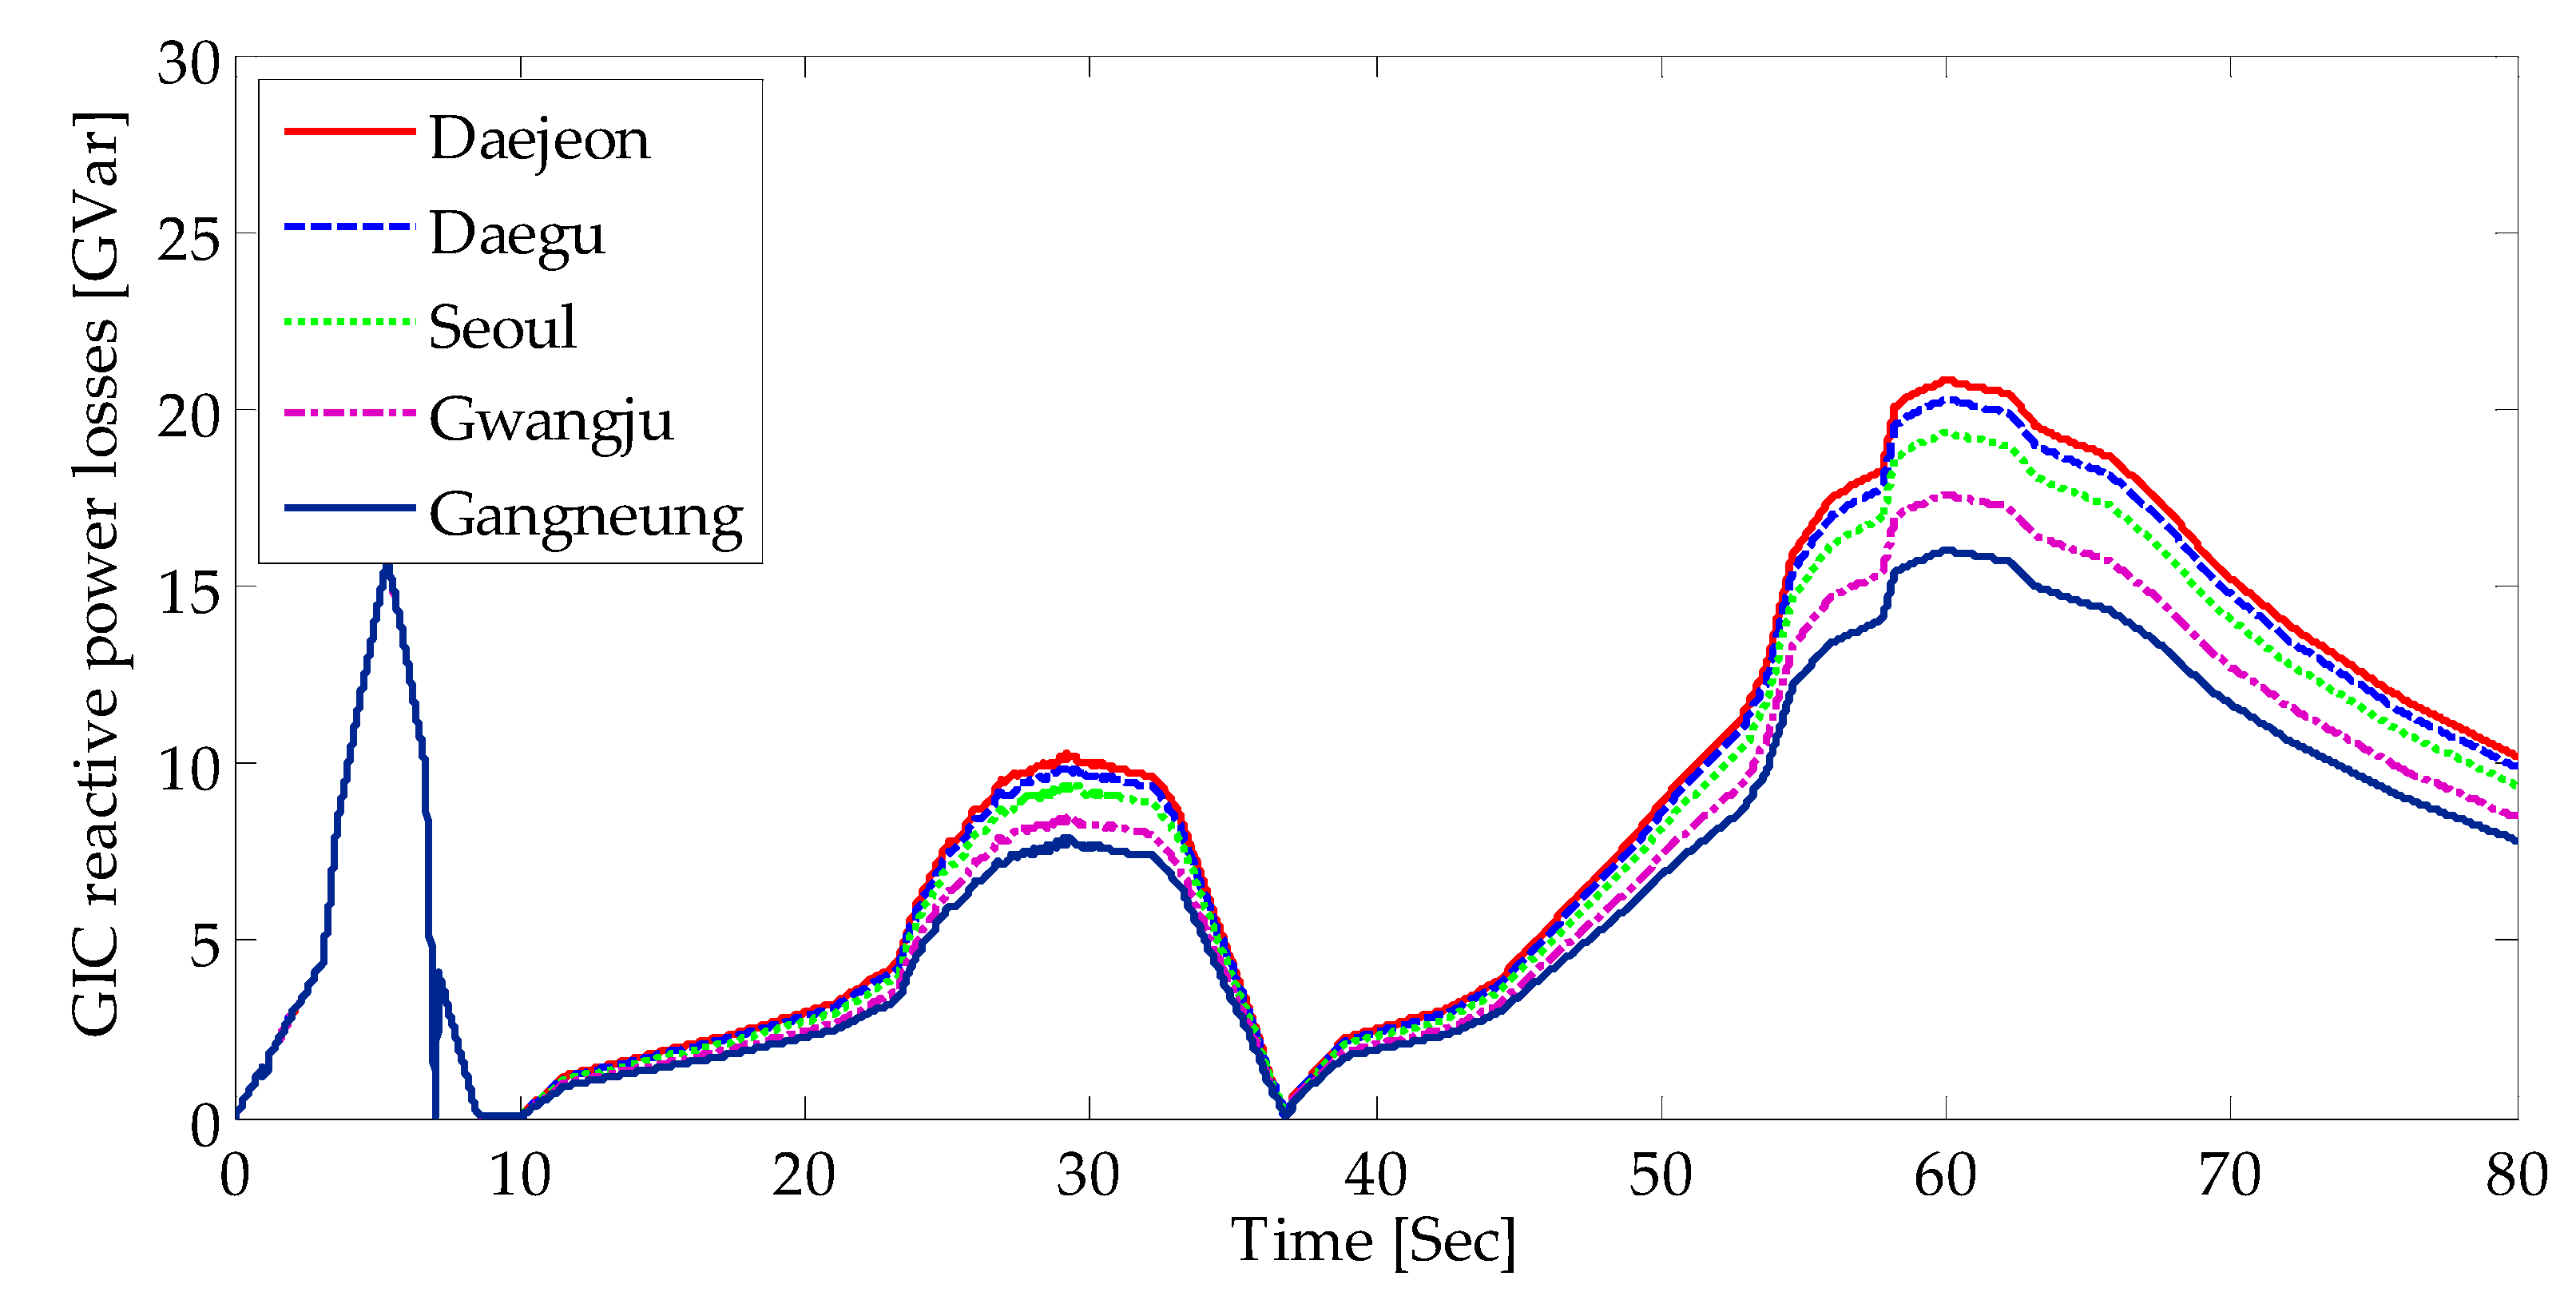
Using the ORNL model, GICs were calculated in the time domain, and the calculated values served as the input data for the computation of GIC reactive power losses.
Figure 8 shows the time variation for the total GIC reactive power losses over the entire Korean electric power system for different ground-zero locations.
Table 3 presents the maximum values of the additional GIC losses for each target location. The burst over Daejeon, located in the central region of South Korea, produced the largest GIC reactive power losses (20,830.1 MVar), while the burst over Gangneung, in the northeast part of South Korea, resulted in the least reactive power absorption (16,008.7 MVar).
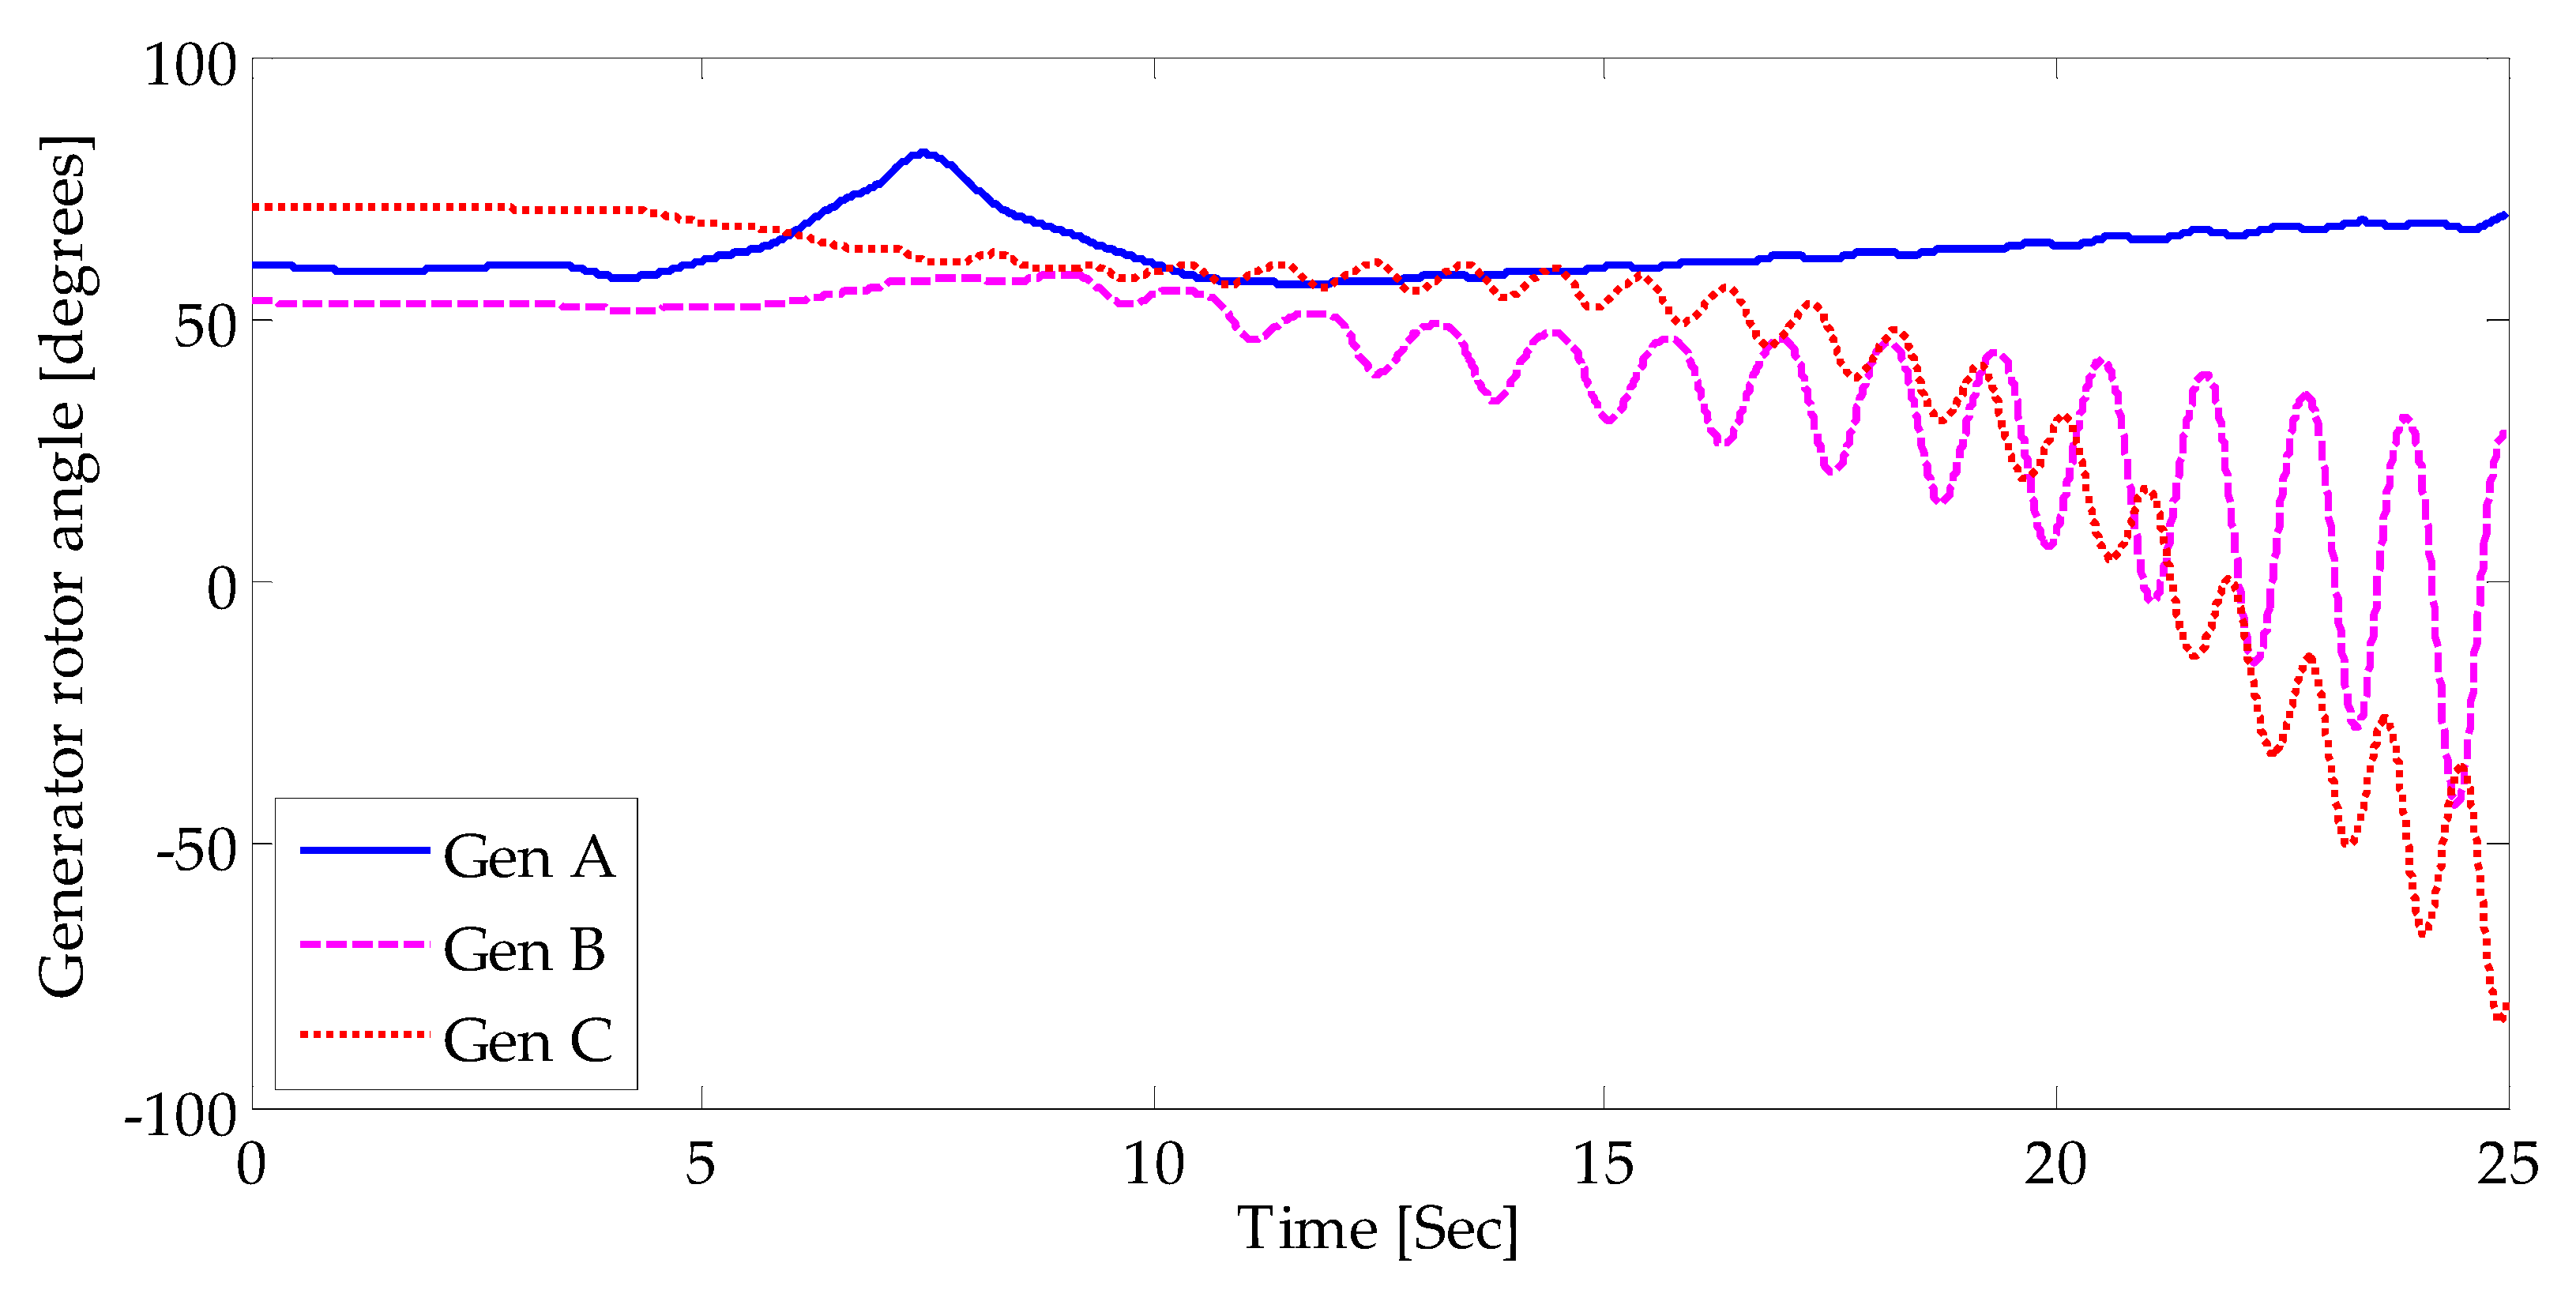
The time series of the total reactive power losses were integrated into the system dynamic models in the transient stability simulation.
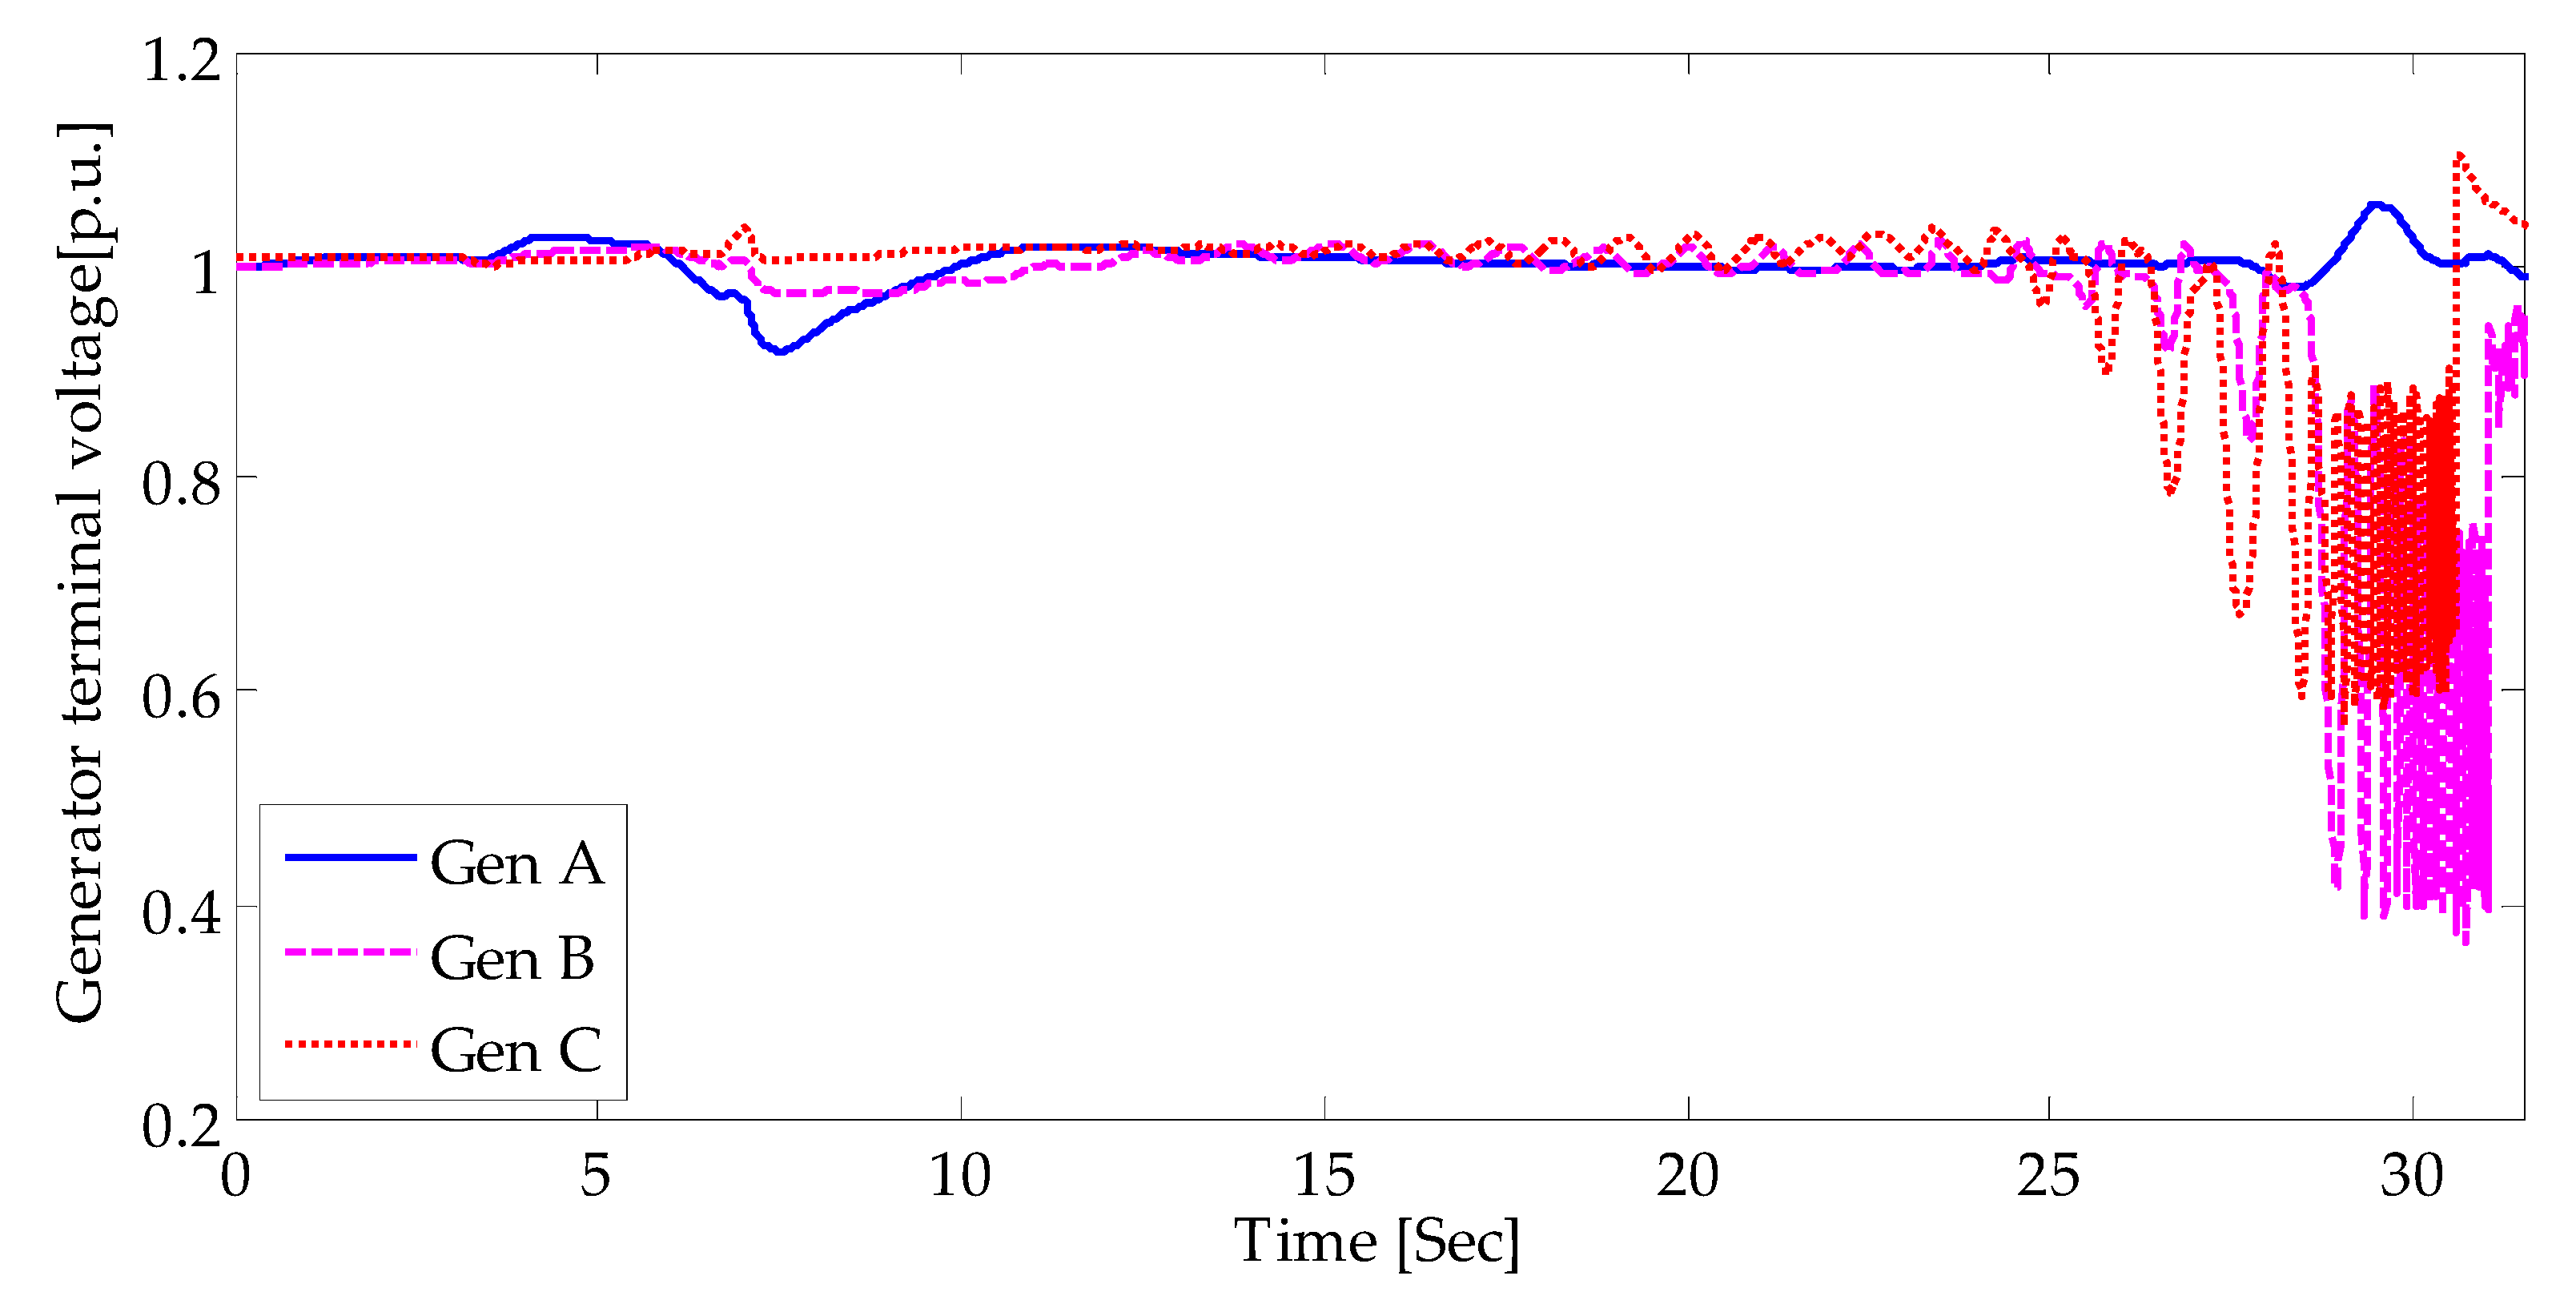
Figure 9 and
Figure 10 show the responses of the generator rotor angles and the generator terminal voltages, respectively. For around 10 s, the system appeared to be maintain dynamic stability. However, the cumulative impacts of the GIC flows caused by the E3 HEMP finally resulted in transient instability and voltage collapse.
Figure 9 shows that the generator rotor angles go out of step and Generators B and C did not maintain synchronism, implying that the disturbances caused by the E3 HEMP led to transient instability. In addition, as shown in
Figure 10, the system could not maintain the voltage magnitudes of the generator terminal buses, resulting in short-term voltage instability. It should be noted that the transient stability simulation was performed with the least impact of an E3 HEMP at the target location of Gangneung and was calculated with on a relatively weaker ORNL model. Thus, there is no necessity to study any more blast scenarios to evaluate the capability of the Korean electric power systems to withstand an E3 HEMP impact.
5. Conclusions
This paper presents a vulnerability assessment of Korean electric power systems to the late-time E3 HEMP. Two publicly available E3 HEMP electric fields were identified, and their impact was assessed using general procedures. These included the calculation of GICs and additional reactive power losses and the incorporation of the increased reactive power demands into the steady-state and transient stability analyses. When Korean electric power systems are exposed to a geoelectric field of strength 18 V/km and an orientation 95°, the total additional reactive power losses of transformers are estimated to be 20.5 GVar, which is conducive to the power system voltage stability. Thus, from a static security limit perspective, the geoelectric field amplitude should be lower than 18 V/km. In view of the dynamic nature of an E3 HEMP, which has a duration in the order of seconds to minutes, transient stability simulations were performed to characterize its impact on power systems. Five cities—Seoul, Gangneung, Daejeon, Daegu, and Gwangju—were chosen as the ground-zero locations, and these cities’ total reactive power consumptions were compared. The least impact of the E3 HEMP event, which was at Gangneung, resulted in transient instability and voltage collapse. Mitigation measures should be formulated to minimize the impact of an E3 HEMP and thereby maintain stable power system operations.
Author Contributions
Conceptualization, S.K.; Formal analysis, S.K. and I.J.; Investigation, S.K. and I.J.; Methodology, S.K. and I.J.; Supervision, S.K.; Writing–original draft, S.K. and I.J.; Writing–review & editing, S.K.
Funding
This research was supported by Basic Science Research Program through the National Research Foundation of Korea (NRF) funded by the Ministry of Education, grant number 2018R1D1A1B07043818.
Acknowledgments
This research was supported by Basic Science Research Program through the National Research Foundation of Korea (NRF) funded by the Ministry of Education (grant number: 2018R1D1A1B07043818).
Conflicts of Interest
The authors declare no conflict of interest.
References
- North American Electric Reliability Corporation (NERC). High-Impact, Low-Frequency Event Risk to the North American Bulk Power System; North American Electric Reliability Corporation (NERC): Atlanta, GA, USA, June 2010. [Google Scholar]
- North American Electric Reliability Corporation (NERC). 2012 Special Reliability Assessment Interim Report: Effects of Geomagnetic Disturbances on the Bulk Power System; North American Electric Reliability Corporation (NERC): Atlanta, GA, USA, February 2012. [Google Scholar]
- IEC 61000-2-9—Electromagnetic Compatibility (EMC)—Part 2: Environment—Section 9: Description of HEMP Environment—Radiated Disturbance; Basic EMC Publication; International Electrotechnical Commission: Geneva, Switzerland, 19 February 1996.
- Hutchins, T. Modeling, Simulation, and Mitigation of the Impacts of the Late Time (E3) High-Altitude Electromagnetic Pulse on Power Systems. Ph.D. Thesis, University of Illinois at Urbana-Champaign, Urbana-Champaign, IL, USA, 2016. [Google Scholar]
- Sauer, P.W.; Pai, M.A. Power System Dynamics and Stability; Prentice Hall: Upper Saddle River, NJ, USA, 1998. [Google Scholar]
- Foster, J.S., Jr.; Gjelde, E.; Graham, W.R. Report of the Commission to Assess the Threat to the United States from Electromagnetic Pulse (EMP) Attack: CRITICAL National Infrastructures; EMP Commission, April 2008; Available online: http://www.empcommission.org/docs/A2473-EMP_Commission-7MB.pdf (accessed on 26 August 2019).
- National Coordinating Center for Communcations. Electromagnetic Pulse (EMP) Protection and Resilience Guidelines for Critical Infrastructure and Equipment; National Cybersecurity and Communications Integration Center: Arlington, VA, USA, February 2019.
- Pirjola, R. Geomagnetically induced currents during magnetic storms. IEEE Trans. Plasma Sci. 2000, 28, 1867–1873. [Google Scholar] [CrossRef]
- Kappenman, J.G. Geomagnetic Storms and Their Impact on Power Systems. IEEE Power Eng. Rev. 1996, 16, 5. [Google Scholar] [CrossRef]
- Joo, B.-S.; Woo, J.-W.; Lee, J.-H.; Jeong, I.; Ha, J.; Lee, S.-H.; Kim, S. Assessment of the Impact of Geomagnetic Disturbances on Korean Electric Power Systems. Energies 2018, 11, 1920. [Google Scholar] [CrossRef]
- Legro, J.R.; Abi-Samra, N.C.; Tesche, F.M. Study to Assess the effects of Magnetohydrodynamic Electromagnetic Pulse on Electric Power System, Phase 1, Final Report; Martin Marietta Energy Systems Inc. Oak Ridge National Labs: Oak Ridge, TN, USA, 1985. [Google Scholar]
- Tesche, F.M.; Vance, E.F. Electromagnetic Pulse Research on Electric Power Systems: Program Summary and Recommendations; Oak Ridge National Laboratory: Oak Ridge, TN, USA, 1993. [Google Scholar]
- EPRI. Magnetohydrodynamic Electromagnetic Pulse Assessment of the Continental U.S. Electric Grid: Geomagnetically Induced Current and Transformer Thermal Analysis; EPRI: Palo Alto, CA, USA, February 2017. [Google Scholar]
- Marti, L.; Berge, J.; Varma, R.K. Determination of geomagnetically induced current flow in a transformer from reactive power absorption. IEEE Trans. Power Del. 2013, 28, 1280–1288. [Google Scholar] [CrossRef]
- Overbye, T.J.; Shetye, K.S.; Hutchins, T.R.; Qiu, Q.; Weber, J.D. Power grid sensitivity analysis of geomagnetically induced currents. IEEE Trans. Power Syst. 2013, 28, 4821–4828. [Google Scholar] [CrossRef]
- Lee, R.H.W.; Shetye, K.S.; Birchfield, A.B.; Overbye, T.J. Using Detailed Ground Modeling to Evaluate Electric Grid Impacts of Late-Time High-Altitude Electromagnetic Pulses (E3 HEMP). IEEE Trans. Power Syst. 2018, 34, 1549–1557. [Google Scholar] [CrossRef]
- Kundur, P.; Balu, N.J.; Lauby, M.G. Power System Stability and Control; McGraw-Hill: New York, NY, USA, 1994. [Google Scholar]
- Korea Electric Power Corporation. Substation Design Standard (DS-2601); Korea Electric Power Corporation: Naju, Korea, 2017. (In Korean) [Google Scholar]
- Powerworld Corporation. Available online: http://www.powerworld.com/ (accessed on 26 August 2019).
© 2019 by the authors. Licensee MDPI, Basel, Switzerland. This article is an open access article distributed under the terms and conditions of the Creative Commons Attribution (CC BY) license (http://creativecommons.org/licenses/by/4.0/).


