Article

Seasonal COP of an Air-to-Water Heat Pump when Using Predictive Control Preferring Power Production from Renewable Sources in the Czech Republic

Energy Institute, NETME Centre, Brno University of Technology, Technicka 2896/2, 61669 Brno, Czech Republic
*
Author to whom correspondence should be addressed.
Energies 2019, 12(17), 3236; https://doi.org/10.3390/en12173236
Submission received: 15 June 2019 / Revised: 2 August 2019 / Accepted: 21 August 2019 / Published: 22 August 2019
(This article belongs to the Special Issue Electricity Demand Side Management)

Abstract

:
The paper presents a parametric study evaluating the effects of various predictive controls on the operating parameters of heat pumps. The heat pump represents a significant power appliance in the residential sector. Its connection to the heat accumulator creates a system with considerable potential to control electricity consumption according to the needs of the electricity grid. The air-water heat pump is considered in this study. A predictive control is used for priority operation of the heat pump at periods of peak power production from renewable sources. The following were tested as the parameters of predictive control: outdoor air temperature, photovoltaic power production and wind power production. The combination of photovoltaic and wind power production was also tested. A parametric analysis considering different sizes for the thermal accumulator and the heating capacity of the heat pump were proposed. The benefits of predictive control are evaluated based on historical records of meteorological data from 2015 to 2018 in the city of Brno, Czech Republic. The data on the historical development of the real electrical energy production from renewable sources in the Czech Republic are used for regulation control in a monitored period. The main comparison parameter is the heat pump seasonal coefficient of performance (SCOP). From the carried out study results, an increase in SCOP by 14% was identified for priority operation of heat pump (HP) at periods with highest outdoor air temperature. Priority operation of HP at periods with peak photovoltaic (PV) production increased SCOP by 10.25%. A decrease in SCOP only occurred in case with priority operation of HP at peak production of wind power plants. Increasing the size of the accumulator contributes to an increase in SCOP in all assessed modifications of predictive control.

1. Introduction

The current worldwide trend is to increase the production of electrical energy from renewable energy sources (RES). In Europe, this is usually achieved by increasing the production of electrical energy from sources with unstable production, such as from wind and solar power plants. The European Union (EU) is taking active steps to decarbonise the power industry, which supports an increase in the proportion of RES, e.g. “Roadmap for moving to a competitive low carbon economy in 2050” [1]. Fluctuations in electrical energy production from RES are compensated within the distribution system with the flexibility of other sources, especially hydroelectric power plants and gas power plants. Despite the increasing number of various types of accumulators installed, the accumulation of electrical energy in the distribution system is not yet organized satisfactorily. The distribution system must currently use all of the available and economically acceptable technologies to compensate for the differences between the immediate production and consumption of electrical energy.
Another option with considerable potential is the application of demand-side management (DSM) of electricity to compensate for the mismatch between the production and consumption of electrical energy. DSM focuses on the control of regularly used electrical appliances. The appliance must allow for unplanned switching on and off without decreasing user comfort or compromising the safety requirements. In this context, the possibilities of using DSM in industrial applications are assessed. A considerable potential for the use of DSM may be found in the residential sector, namely by remote control of domestic heat pumps.
Energy consumption in the residential sector of EU countries corresponded to 25.4% of the total energy consumption in 2016 [2]. A significant portion of energy consumption is involved in hot water preparation and space heating. The average heating demand of residential space in EU countries is 160 kWh·m2·y−1 [3]. The European Heat Pump Association (EHPA) report shows that 1.25 million heat pumps (HPs) were sold in 2018 in the European market, which means an increase of 12% compared to 2017 [4]. Almost 10% of all residential houses in the EU currently use HPs as a source of heat energy [4].
The prediction of market developments in this field speaks about a progressive increase in installations in the coming years [4]. The previous studies show that Air-water heat pump (AWHP) installation at the individual level should give higher global performance than large scale installation (e.g., building installation, district installation) thanks to the system simplicity and minimal heat loss [5]. The number of HP installations is currently increasing in the area of heat recovery systems too, e.g. small-scale heat recovery from sewage water or city scale waste heat recovery in a sustainable city context [6]. Another prospective use of HPs is associated with increasing the capacity of large-scale heat storage tanks. The number of these installations will be related to the development of large capacity thermal storages in heating networks. In this context, HPs constitute one of the promising appliances for DSM [7] due to significant number of new installations in the coming years. The characteristic features of this appliance include its considerable electricity consumption and the significant amount of remote control. AWHPs represent a heat production technology that has had the most dynamic development throughout the EU [8]. The working parameters of HPs have been improving in the last few years [9]. Using inverter-driven compressors that enable the efficient functioning of HPs under full and partial loads has contributed to this trend. This is important for planning smooth changes in the output or consumption of an HP.
HPs enjoy considerable popularity in the Czech Republic. Number of installations have been increasing progressively in recent years, as shows Figure 1.
A simple version of the DSM in the form of ripple control has been used in the Czech Republic for decades. The ripple control has basically two functions. First, it is used for switching between tariffs on the consumption (demand) side. The tariffs in this context refer to electricity prices. In the time periods of high demand for electricity (usually during the day), the billing prices of electricity are higher than during the time periods of lower demand for electricity (usually at night). Electrical appliances, whose operation is permitted during the high demand periods, can be operated without restrictions, but at the penalty of higher electricity prices. The billing price of electricity during the high demand periods is the only incentive for the consumers to shift the operation of some of these appliances (dish washers, washing machines, cooking ovens, clothes iron, etc.) to the time periods of lower demand. The second function of the ripple control is the outright blocking of the operation of certain electrical appliances during certain parts of the high demand time periods. The typical appliances in this category are electric space heating systems, electric domestic hot water systems and heat pumps.
The effective implementation of DSM to heat pumps requires a complex approach. A significant component in this complex approach is energy storage. As the heat pumps deliver energy in the form of heat, thermal energy storage is the most feasible way of energy storage in this respect. The Czech Republic has implemented several incentives to decarbonise space heating of residential buildings. The main focus is on the replacement of coal with less polluting fuels. This policy translated into increasing number of heat pump installations as can be seen in Figure 1. However, as of now, the installation of thermal energy storage with a heat pump is neither required nor financially supported (incentivised). There are several ways this kind of incentives could be provided. The direct financial subsidies do not always produce the best effect. A better option might be flexible billing prices of electricity that would incentivize installation of energy storage in order to take advantage of lower prices of electricity. On the other hand, installations of heat pumps with thermal energy storage (usually water storage tanks) are relatively common even without incentives. That makes heat pumps a promising category for DSM.
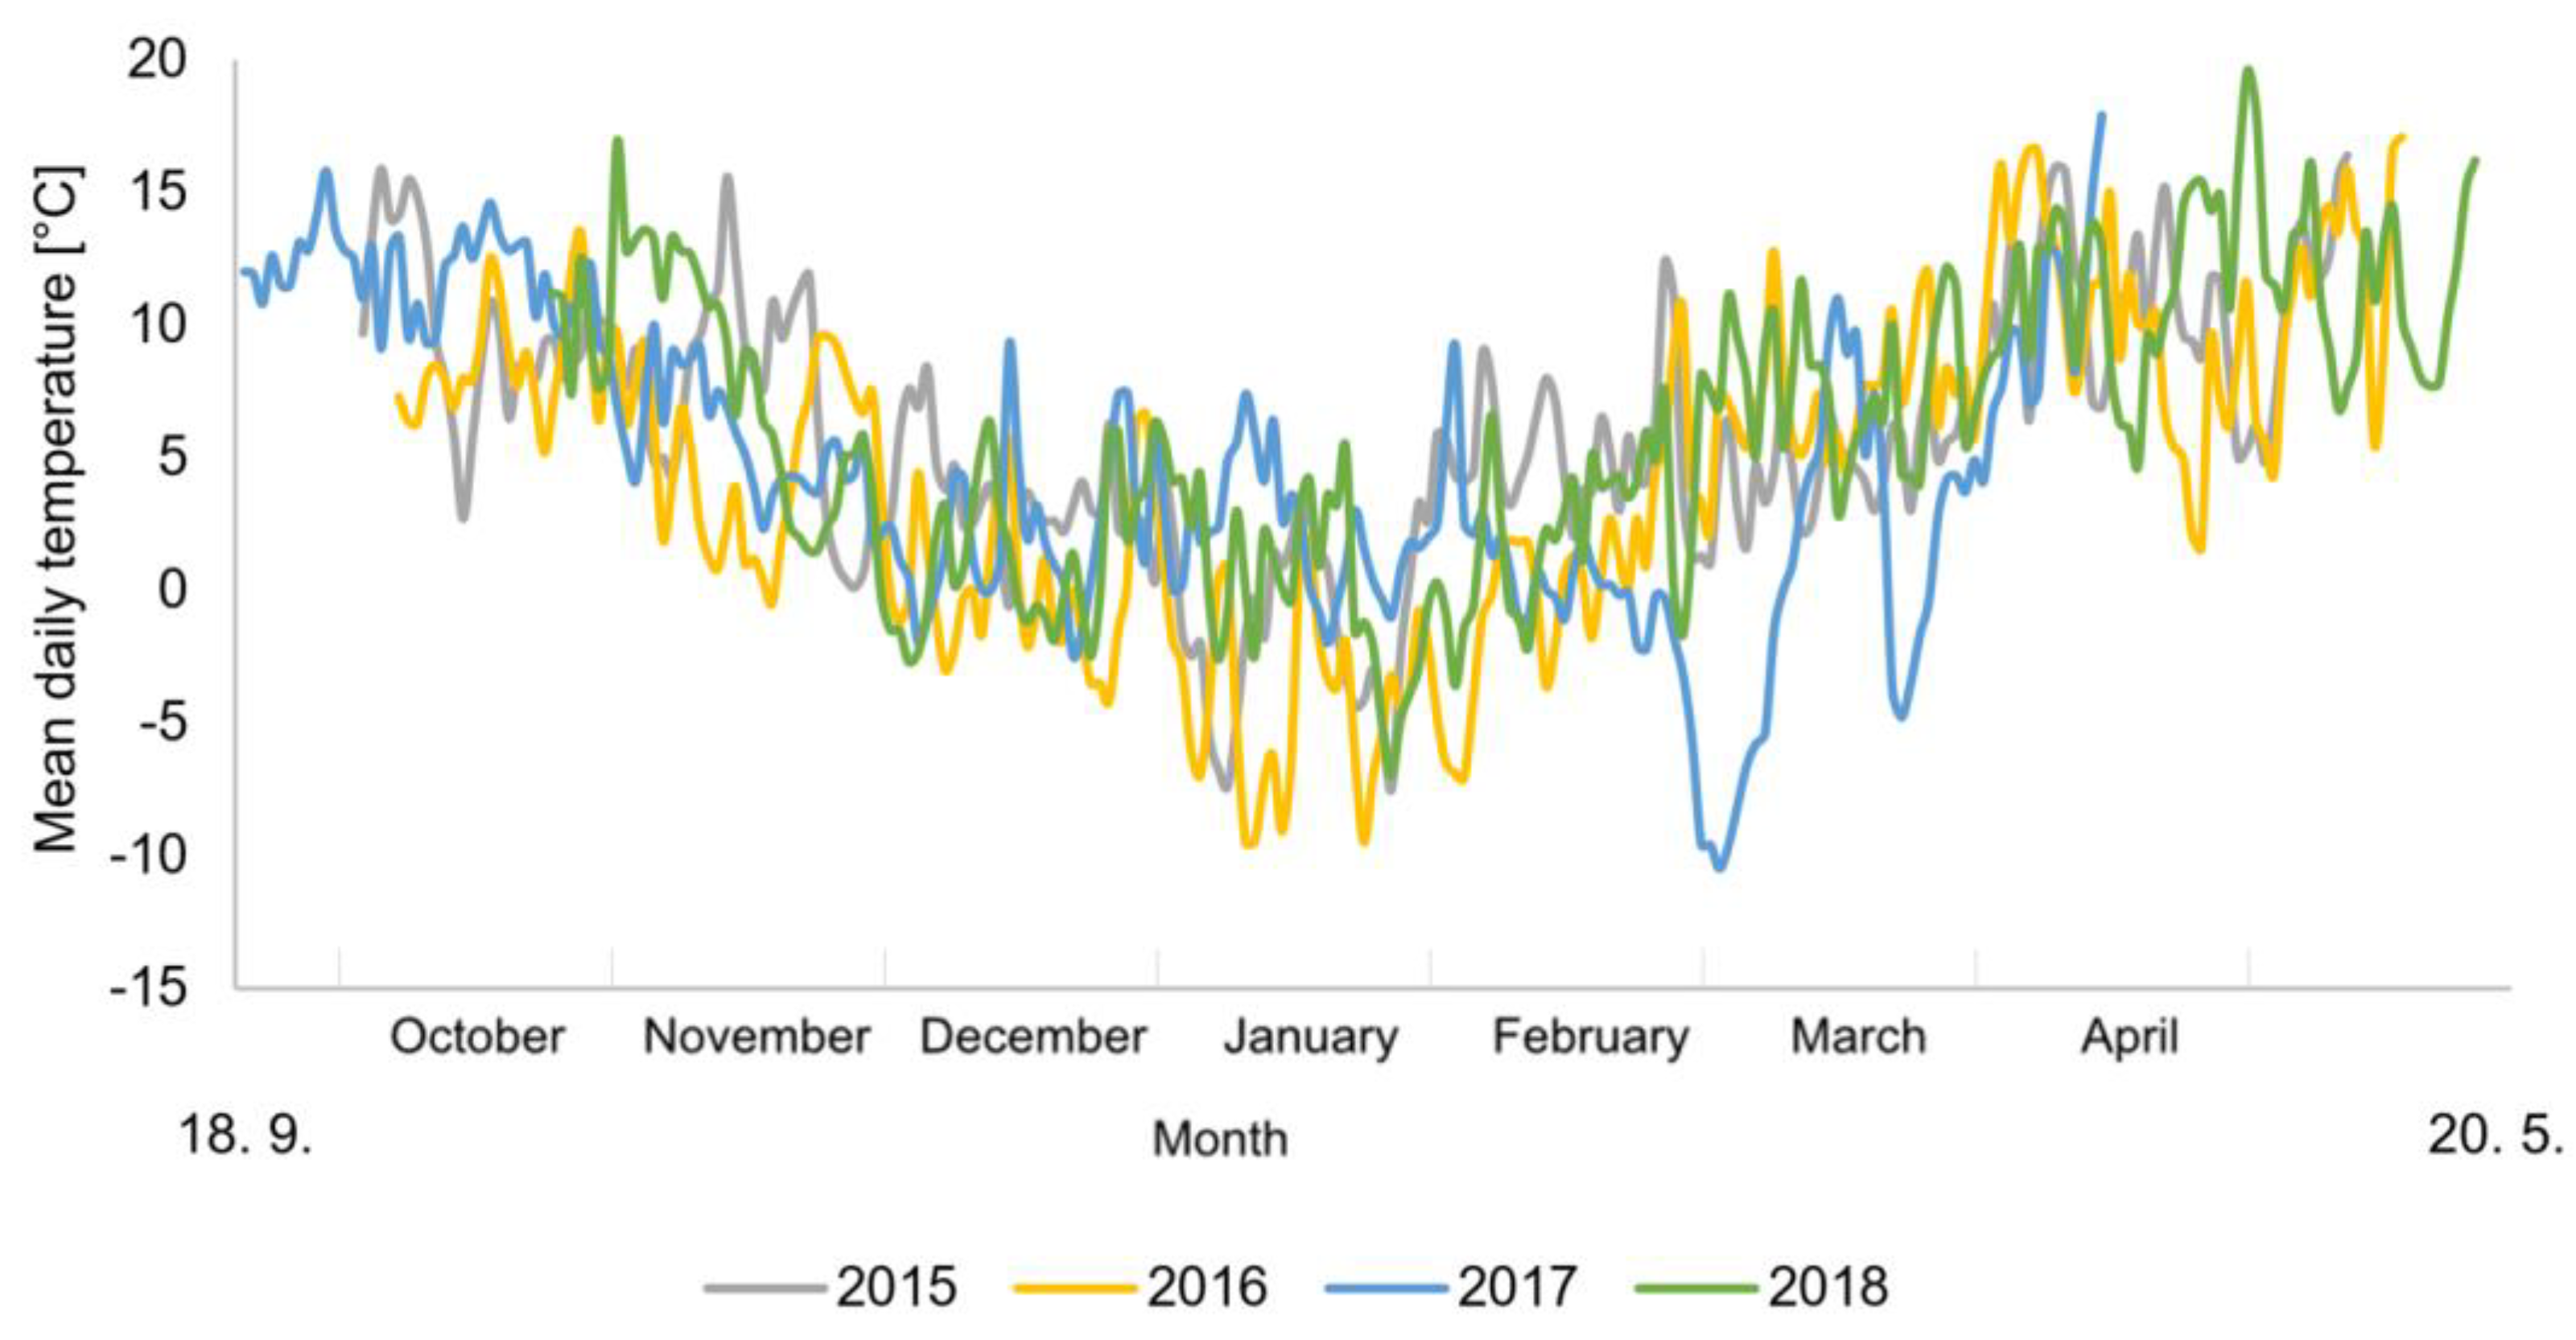
This study focuses on comparing several scenarios of predictive AWHP control, preferring operation in periods of peak electrical energy production from wind and photovoltaic (PV) power plants. For the evaluation, historical records of the outdoor air temperature in the city of Brno from 2015 to 2018 are used. Brno lies in the southeast part of the Czech Republic (CZ) (GPS: 49.2065331° N, 16.5923336° E). The evaluation also uses historical records of the electricity produced from renewable sources in the Czech Republic from the same period. The aim of comparing the different predictive control scenarios is the quantification of the impact of their use on the real seasonal coefficient of performance (SCOP) of the AWHPs. The results obtained for operation with predictive control are compared to AWHP operation parameters without predictive control. The study also presents the results of parametric studies evaluating the influence of heat accumulator size and AWHP heat output on the resulting SCOP. The results can be used to assess the potential of AWHP control for electrical energy consumption control in periods of peak electrical energy production from RES. Furthermore, the results can be used to consider further development of using RES for covering the electricity demand of AWHPs. All the conclusions reached are relevant for the conditions existing in the Czech Republic and are based on the real data from 2015 to 2018. However, the developed calculation procedure is applicable in other similar climates. Some general outcomes, such as preferable operation of air-to-water heat pumps during daytime, when the PV power plants produce electricity, and at the same time, the outdoor air temperature is higher, are valid in most climates and situations.
The target of this study is to present possible utilization of AWHPs as a suitable DSM remote control of electrical appliances with prior operation in periods of peak power production from RES.

2. Electrical Energy Production in the Czech Republic

Meteorological conditions and electricity production from RES are parameters relating to a specific location and the energy infrastructure of a specific country. This study was carried out with the specific conditions of the Czech Republic in 2018. The results of the study may not be generalised and may only be very cautiously compared with the conditions in other similar locations.
The Czech Republic is a landlocked country located in the centre of Europe. As of January 1, 2017, the population of the Czech Republic was 10.6 million inhabitants, the area was 78,870 km2 and the population density was about 134 inhabitants/km2 [11]. In the Czech Republic, nuclear and steam power plants produce 85 % of the electrical energy. As seen in Figure 1, RES produced 11% of electrical energy in 2018.
The latest available report on the operation of the Czech electrical grid [12] provides the following performance data. The total electrical energy production and consumption in the Czech Republic is constantly increasing, although in the last few years the rate of increase has been slowing. The total (gross) electrical energy production in the Czech Republic in 2018 was 88 TWh, while the total consumption was 73.9 TWh. It was the highest annual electrical energy consumption to be recorded. The Czech Republic is also a net exporter of electrical energy and the net export reached 13.9 TWh (25.5 TWh export and 11.6 TWh import) in 2018. The total electricity production from RES was 9.4 TWh in 2018 and the share of RES in the total electrical energy consumption in the Czech Republic was 12.7%. The total electrical energy production from RES has practically unchanged in the last 4 years.
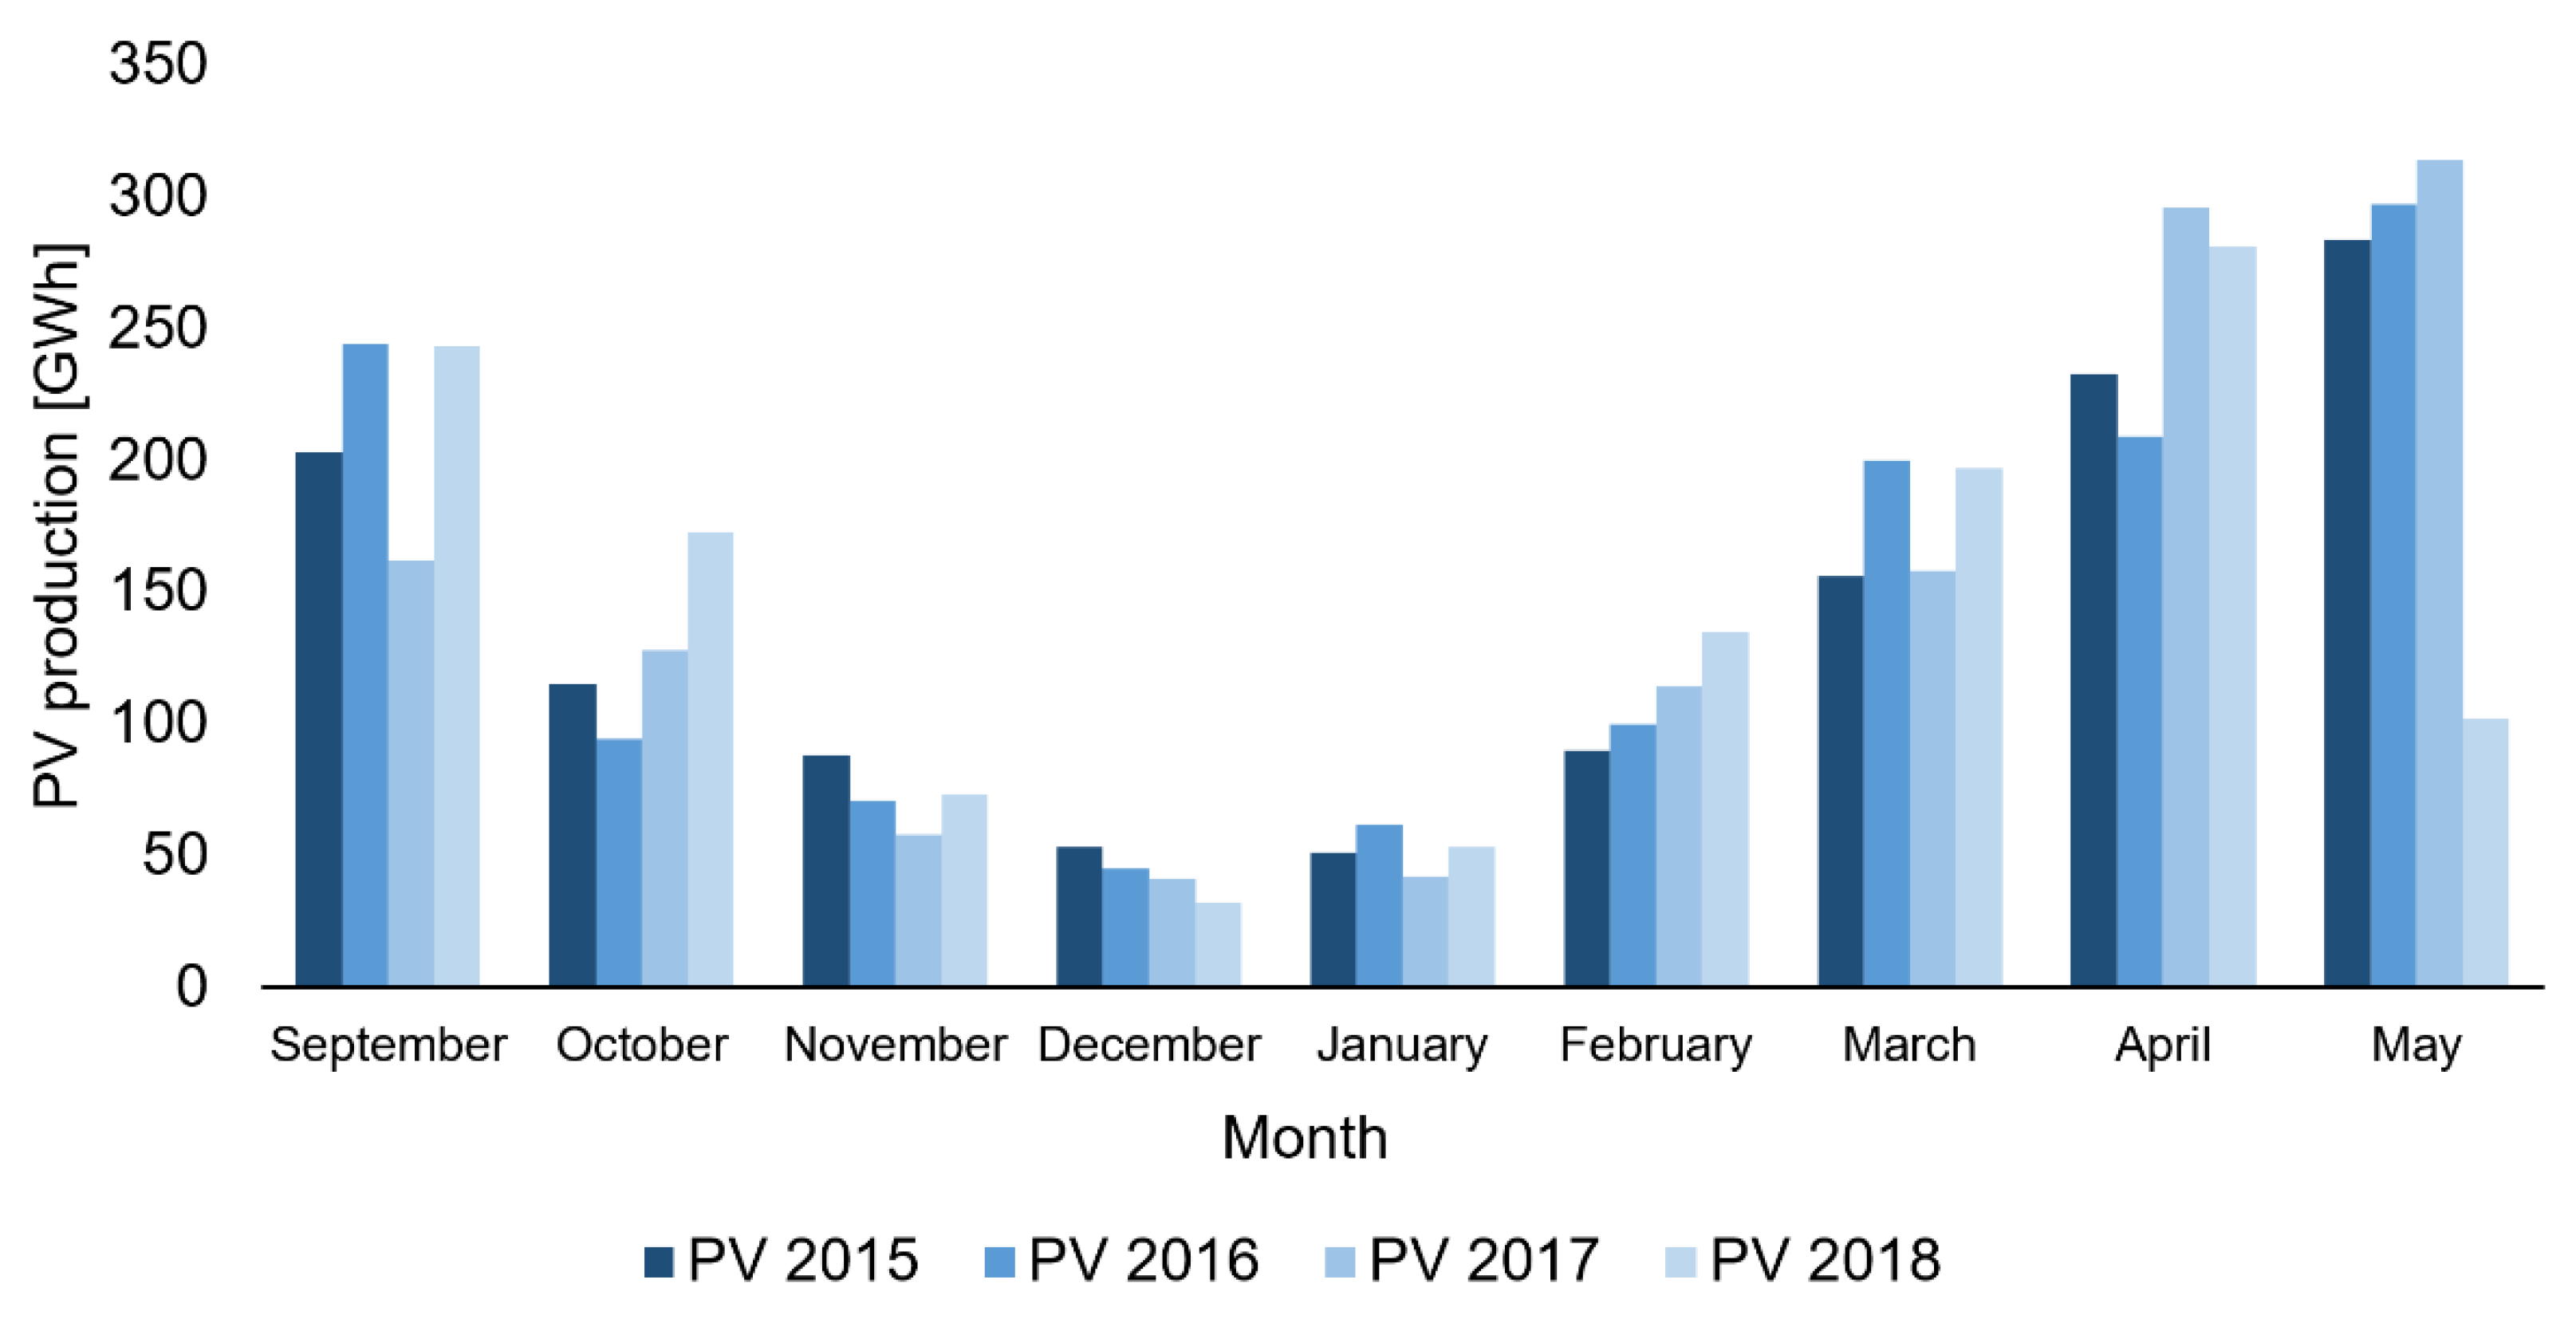
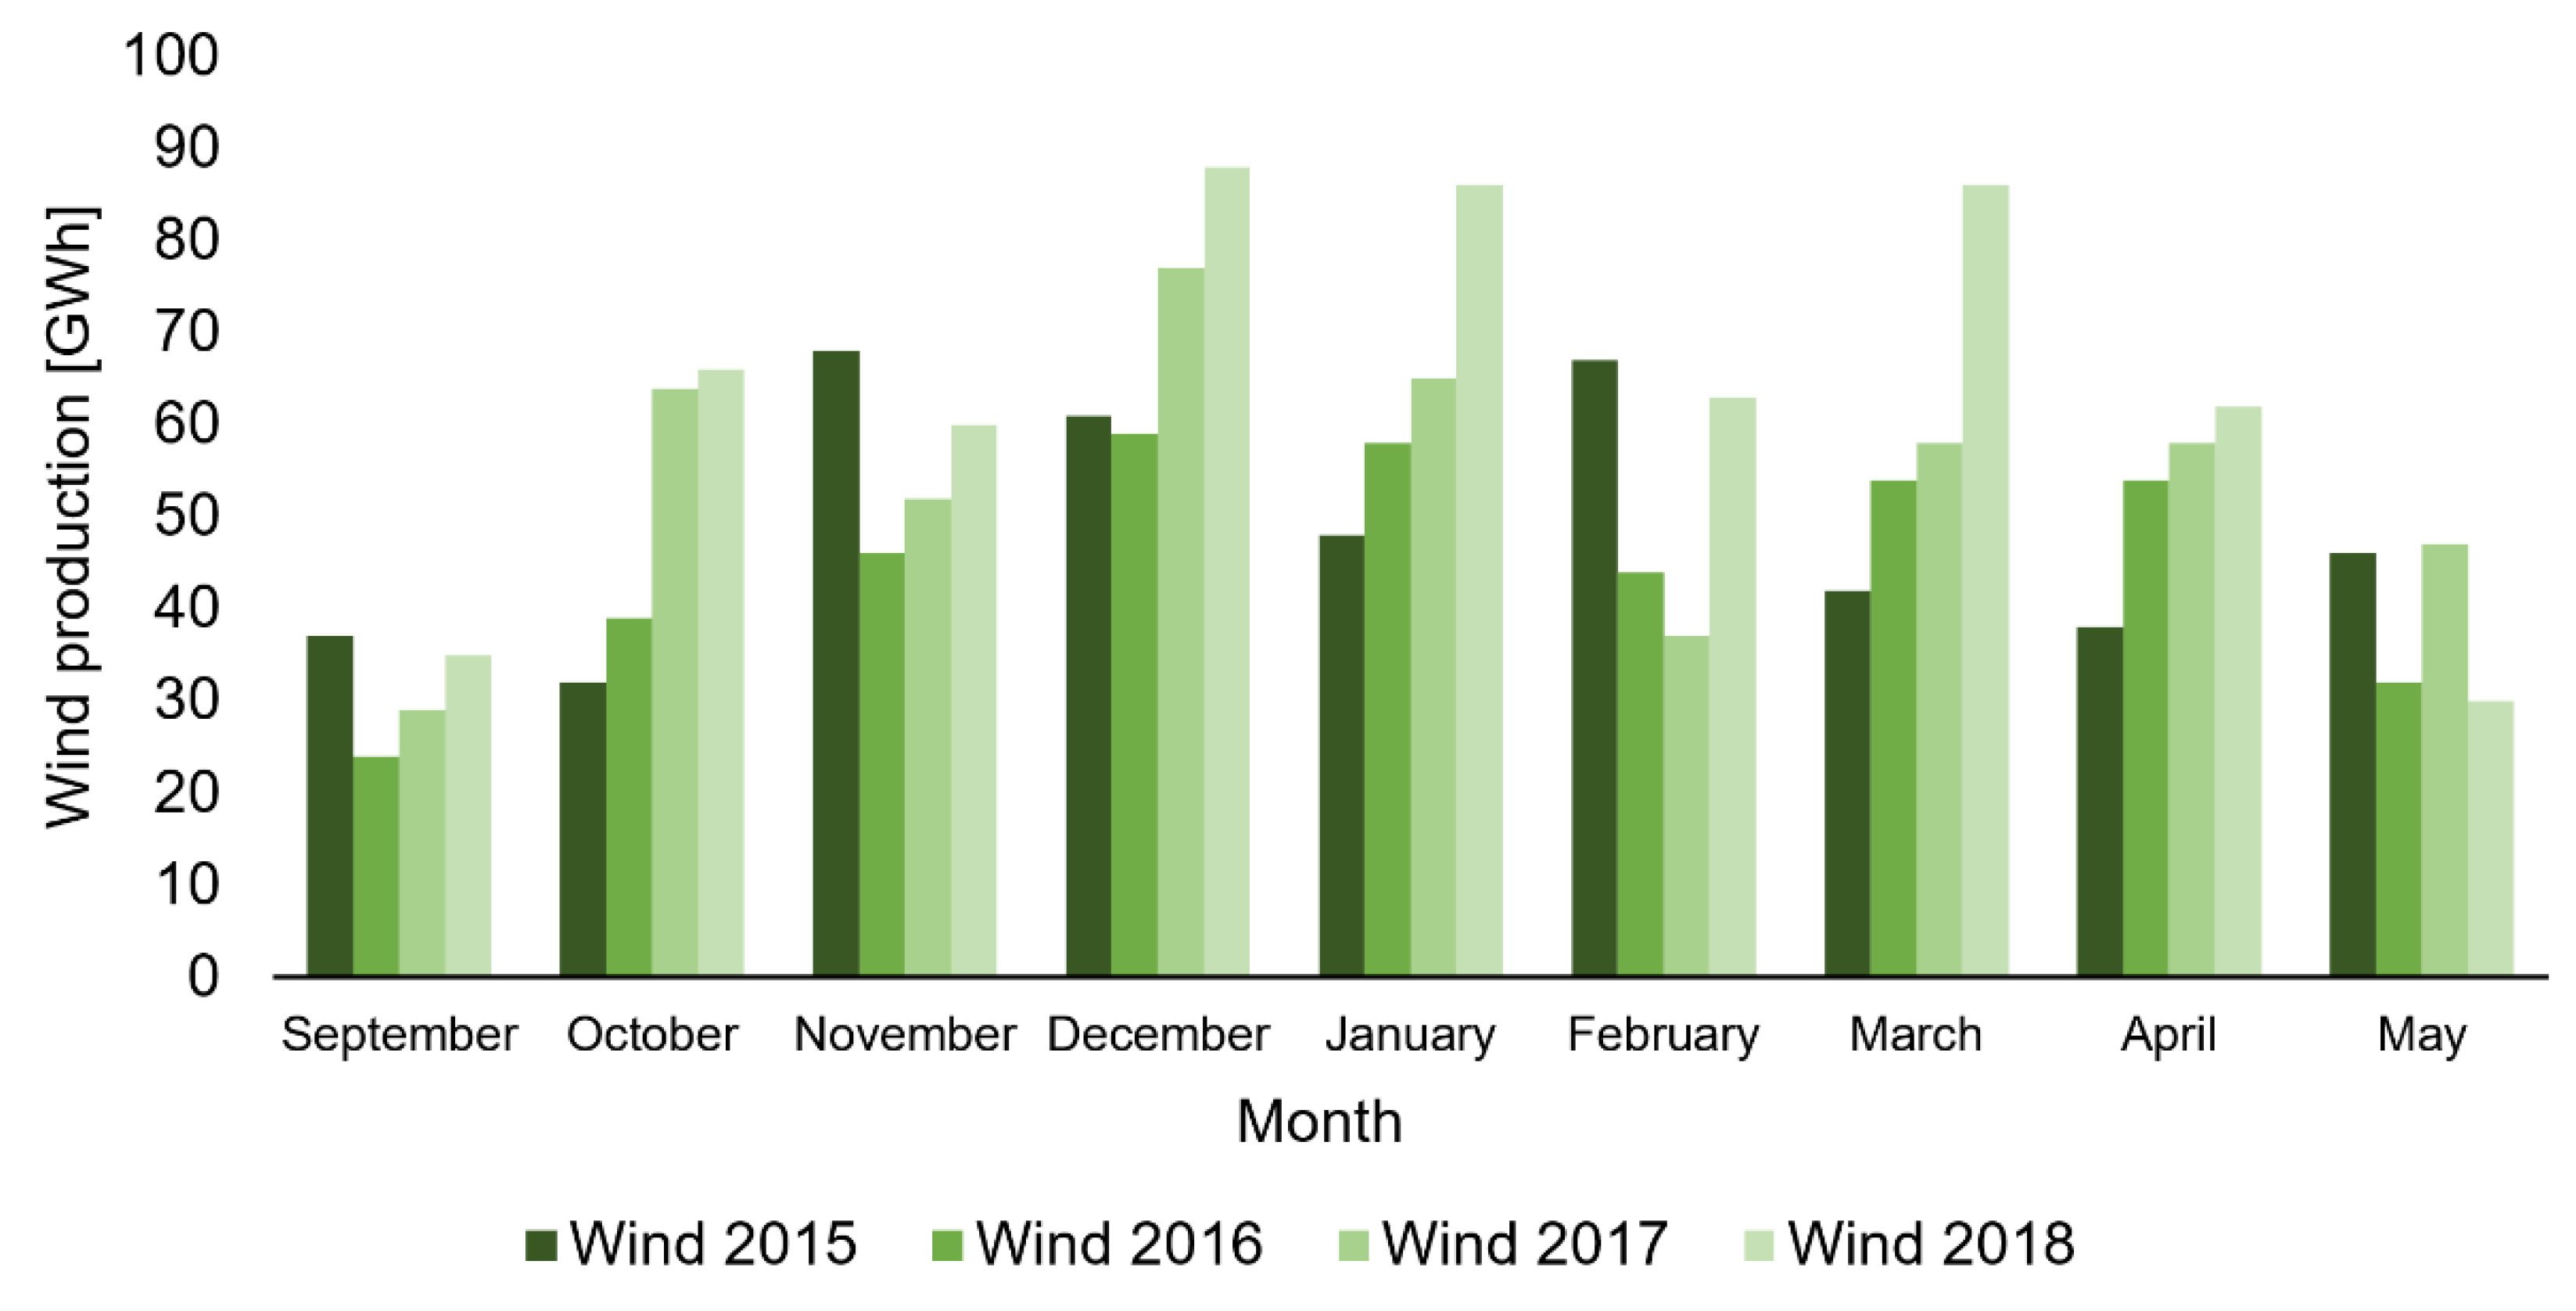
The installed capacity of PV power plants in 2018 was 2.057 GW and this capacity has not changed since 2015 due to low support for new PV power plants. The average capacity factor of PV power plants in 2018 was 0.13. However, there has been a gradual increase in the installed capacity and electricity production in wind power plants. The total installed capacity in 2018 was 316.2 MW and the capacity factor was 0.22. The installed capacity of wind and PV power plants is shown in Table 1.

3. Characteristics of the Location and the Heat Pump

3.1. Meteorology and Power Production from RES

Computational assessment of the various scenarios of predictive control of AWHPs was carried out on a model residential building located in the city of Brno. The heating season is defined as a time period with the mean daily outdoor air temperatures below 13 °C [13]. The real length of the heating season is different each year and usually ranges between 190 and 240 days [13]. The nominal heating season lasts from September 1 to May 31. Figure 2 shows historical records of mean daily temperatures during the heating seasons from 2015 to 2018.
During the heating season, electricity production from PV power plants is significantly limited due to small solar contribution in winter. Electricity production from wind power plants is considerably less influenced by the seasons in Central European conditions.
Figure 3 shows the relationship between the outdoor air temperature and electrical energy production from RES in the location monitored in the heating seasons of 2015–2018, obtained from the meteorological station at Brno University of Technology. The relationship shown is based on the historical development of electrical energy production from wind and PV power plants in the Czech Republic. The figure shows that electrical energy production from PV power plants in the heating seasons is significantly higher on days with an average air temperature above 0 °C. For days with lower average temperatures, the production from PV power plants is low and it is almost zero when the outdoor air temperature is below −10 °C. Figure 4 shows the amount of electrical energy produced from PV in each month of the heating season. A significant decrease in production is apparent in the coldest months of the year. Considerably more stable production is provided by wind power plants, as seen in Figure 5. The maximum production in the location monitored in the heating season was identified when the air temperature was approximately 10 °C, as seen in Figure 3. As the outdoor temperature drops below 10 °C, the production from wind power plants drops as well.
The relationships clearly show that during the transitional seasons (autumn and spring), electricity produced from RES can provide a significant amount of energy needed to drive AWHPs used in the climatic conditions of Central Europe. In the winter months, using RES production can only be considered to a very limited extent.

3.2. A model Building with a Heat Pump

A calculation study was carried out for a model building with the heat loss of 1 kW at the outdoor air temperature of −12 °C (the design outdoor air temperature in Brno). This approach makes it possible to scale the results to a real building by simply multiplying the results obtained for the model building by the heat loss (in kW) of the real building. It also needs to be pointed out that the design conditions (design heat loss) only occur during rather short periods of time (Figure 2). The mean air temperature during the heating season in Brno is about 4 °C.
An AWHP is the main and only source of heat energy in the model building. The basic output characteristic of AWHPs is the coefficient of performance (COP). COP is determined as the ratio of the heating capacity Q · HP and the power input P HP :
C O P = Q · HP P HP
The COP for an AWHP is strongly influenced by the difference between the outdoor air temperature and the temperature of the heating water produced [14]. For the purpose of this study, the relationship between COP and the air-water temperature difference was used. This relationship was established based on experimental measurements carried out in a testing laboratory of the Czech Republic branch of the EHPA. The measurements were carried out using AWHPs that were introduced to the market in 2015 and 2016. Refrigerant R410A was used in all compared AWHPs. The AWHPs were tested in a climatic chamber, where the air temperature was changed. The AWHPs were tested at air temperatures of −15 °C, −7 °C, 2 °C, 7 °C and 12 °C. To simulate the heating system the AWHP was joined to a hydraulic circuit. Temperature of heating water was 45 °C at the outlet of the condenser. Constant conditions were kept during the testing period.
The relationship between COP and the temperature difference is shown in Figure 6. Based on experimental data, the following polynomial expression of the relationship was formulated for calculation purposes [15]:
COP   =   0.0023 Δ T aw 2     0.2851 Δ T aw   +   10.677 ,
where Δ T aw is the difference between the temperature of water at the outlet of the condenser and the air temperature at the inlet of the evaporator.
Equation (2) was used for model evaluation of the power consumption of HP based on the historical records of outdoor air temperature in years 2015–2018, see Figure 7. The highest consumption of electrical energy in the model building is usually during January; however, in 2017, the maximum consumption of electrical energy was in February.

3.3. The Algorithm for Predictive Control

The calculation study uses predictive control of the AWHP in the model building (see Figure 8). Three modifications of predictive control are tested. The modifications differ in parameter that is preferentially used to control the heat pump. The tested parameters were outdoor temperature, PV power production, wind power production and PV and wind power production combined. All the modifications of predictive control were tested based on historical meteorological data from the location assessed and on historical records of the real production from RES in the Czech Republic [16].
This paragraph describes the predictive control algorithm for the modification preferring the operation of an AWHP during the day periods with the highest production of electrical energy from wind power plants. As Figure 9 shows, predictive control is based on a known prediction of the development of production from wind power plants and the development of the outdoor air temperature in the following 24 h. At the same time, the amount of heat accumulated at that moment in the heat accumulator is measured. The accumulator considered is a thermal storage tank with a capacity corresponding to the calculated 24-h heat demand of the model building. Based on the values given, the amount of heat that must be provided by the AWHP in the following 24 h is determined. The iterative algorithm then identifies the periods with the highest production from wind power plants, within which the AWHP will operate. The accumulator is used for supplying the heat energy to the heating system outside of the periods of the AWHP operation. After 1 h, there is a new reading of the prediction of the outdoor temperature and the production from wind power plants for the following 24 h. The entire predictive algorithm is repeated and new periods of the AWHP operation are identified. This “floating approach” enables a continuous correction of all the operating values. It also ensures that the heat accumulator does not discharge completely. The algorithm was processed in Microsoft Excel as an iterative calculation.
If in the preceding description of the predictive control algorithm, the prediction of electricity production from wind power plants is replaced with the prediction of electricity production from PV power plants, the predictive algorithm has been modified to prefer PV sources. Similarly, from the prediction of the outdoor temperature, we obtain a modification of predictive control preferring the operation of an AWHP in the periods with the maximum outdoor air temperature.

4. Results and Discussion

The modifications to predictive control were assessed by the parametric study of two different capacities of the heat accumulator (thermal storage tank). In the basic case (ACU 100), the overall heat storage capacity of the accumulator corresponded to a 24-h heat demand of the model building at the outdoor temperature of −12 °C. As the heat loss of the model building was 1 kW at −12 °C, the other accumulator (ACU 50) had the overall heat storage.
Another part of the parametric study focused on testing the impact of the heat output of the model HP. The heat output tested was 50%, 100% and 200%. The heat output of 100% corresponds to the heat output of 1 kW, including the calculated heat loss of the model building. The results obtained using predictive control of the AWHP were compared to the AWHP operation without predictive control, i.e., controlled only by the instantaneous heat demand without using a heat accumulator. The SCOP of the basic scenario was identified as 3.2. This value was used as basis for all following expression of relative changes of SCOP in particular scenarios.
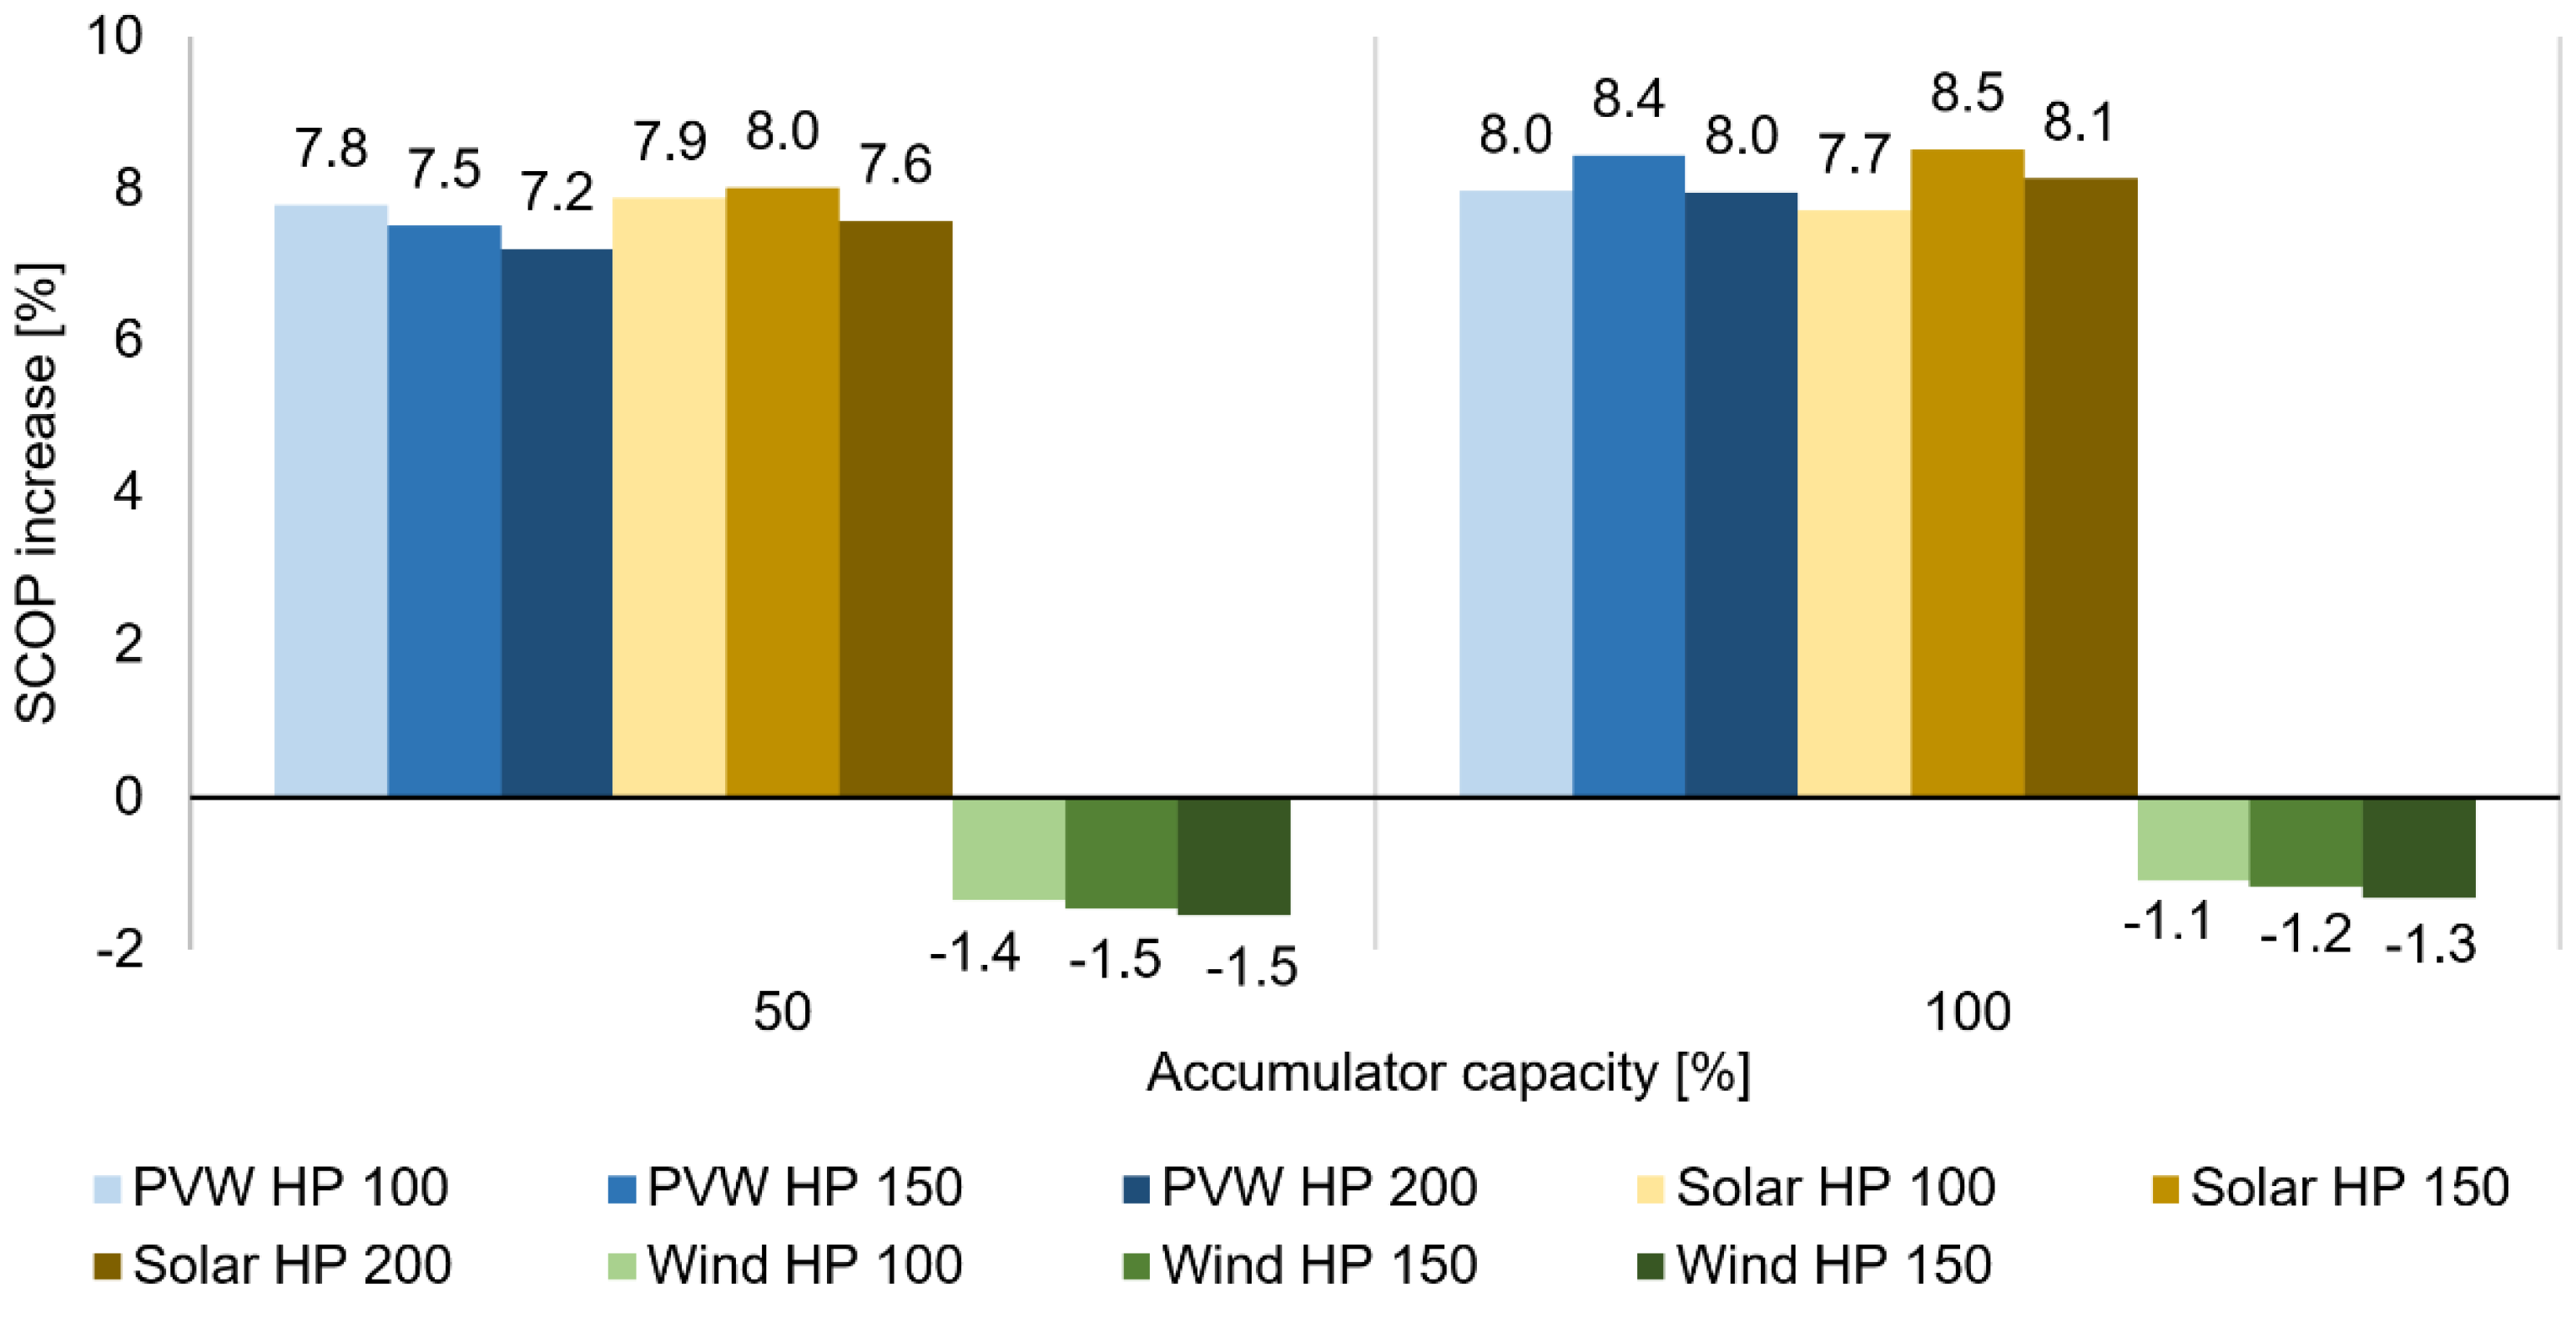
The results of the parametric study are summarized in Figure 10. The graph shows the relative increase or decrease in SCOP when predictive control is applied in relation to the basic condition.
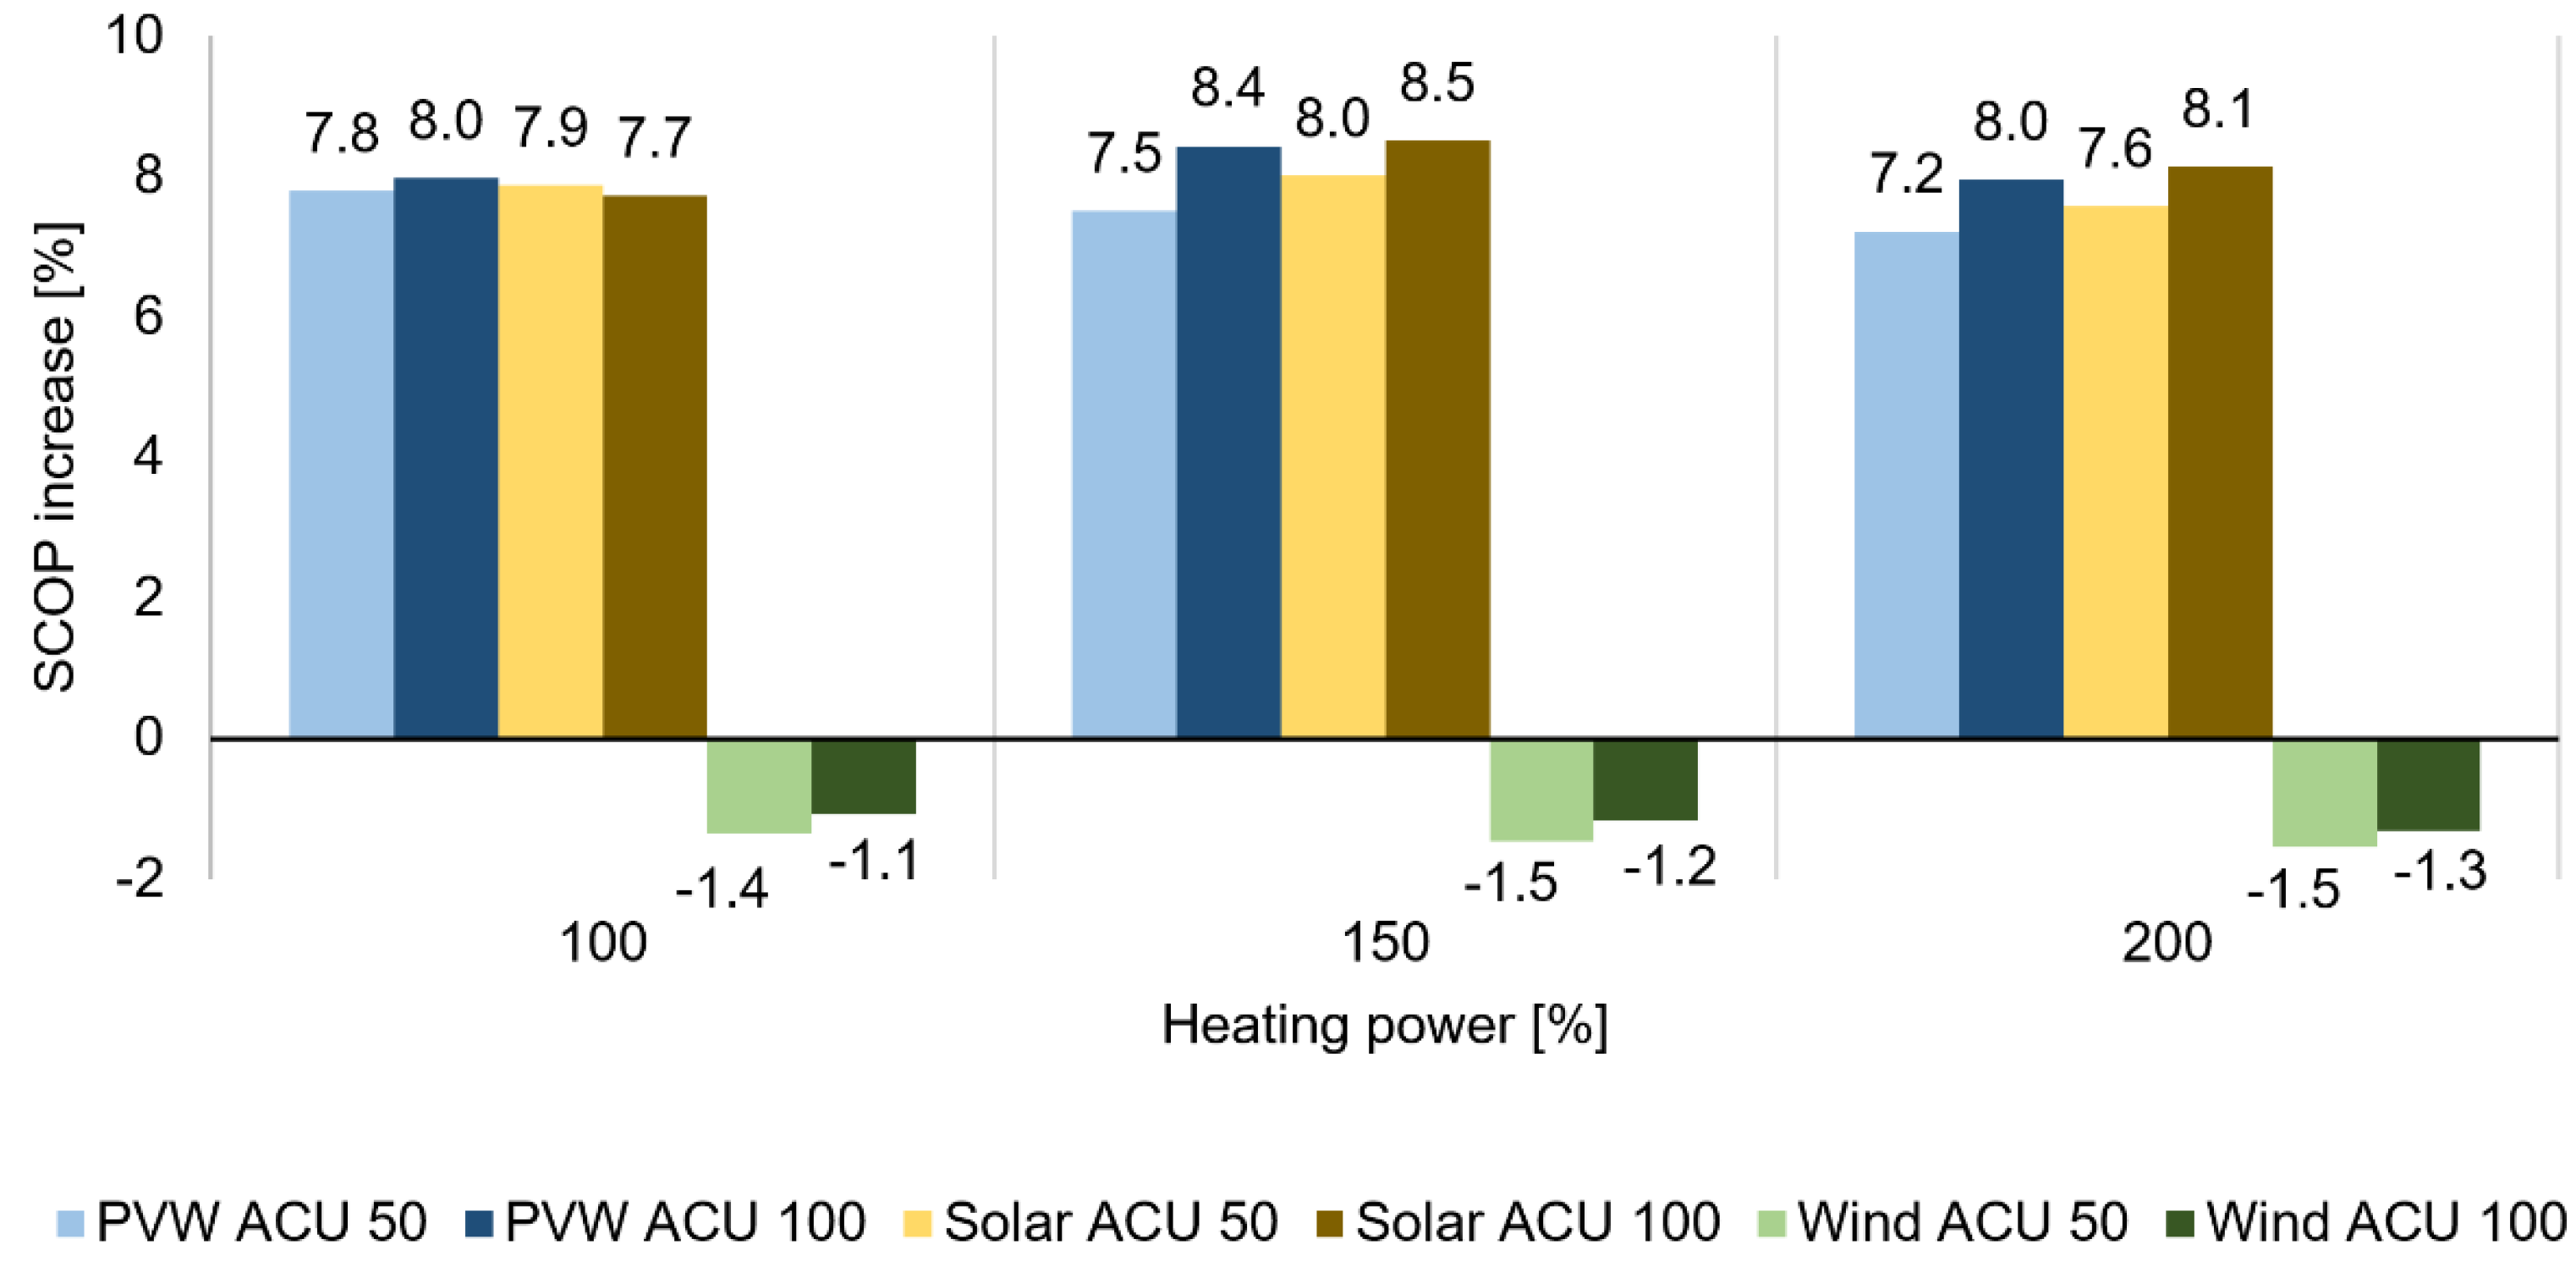
The relations presented in Figure 10 and 
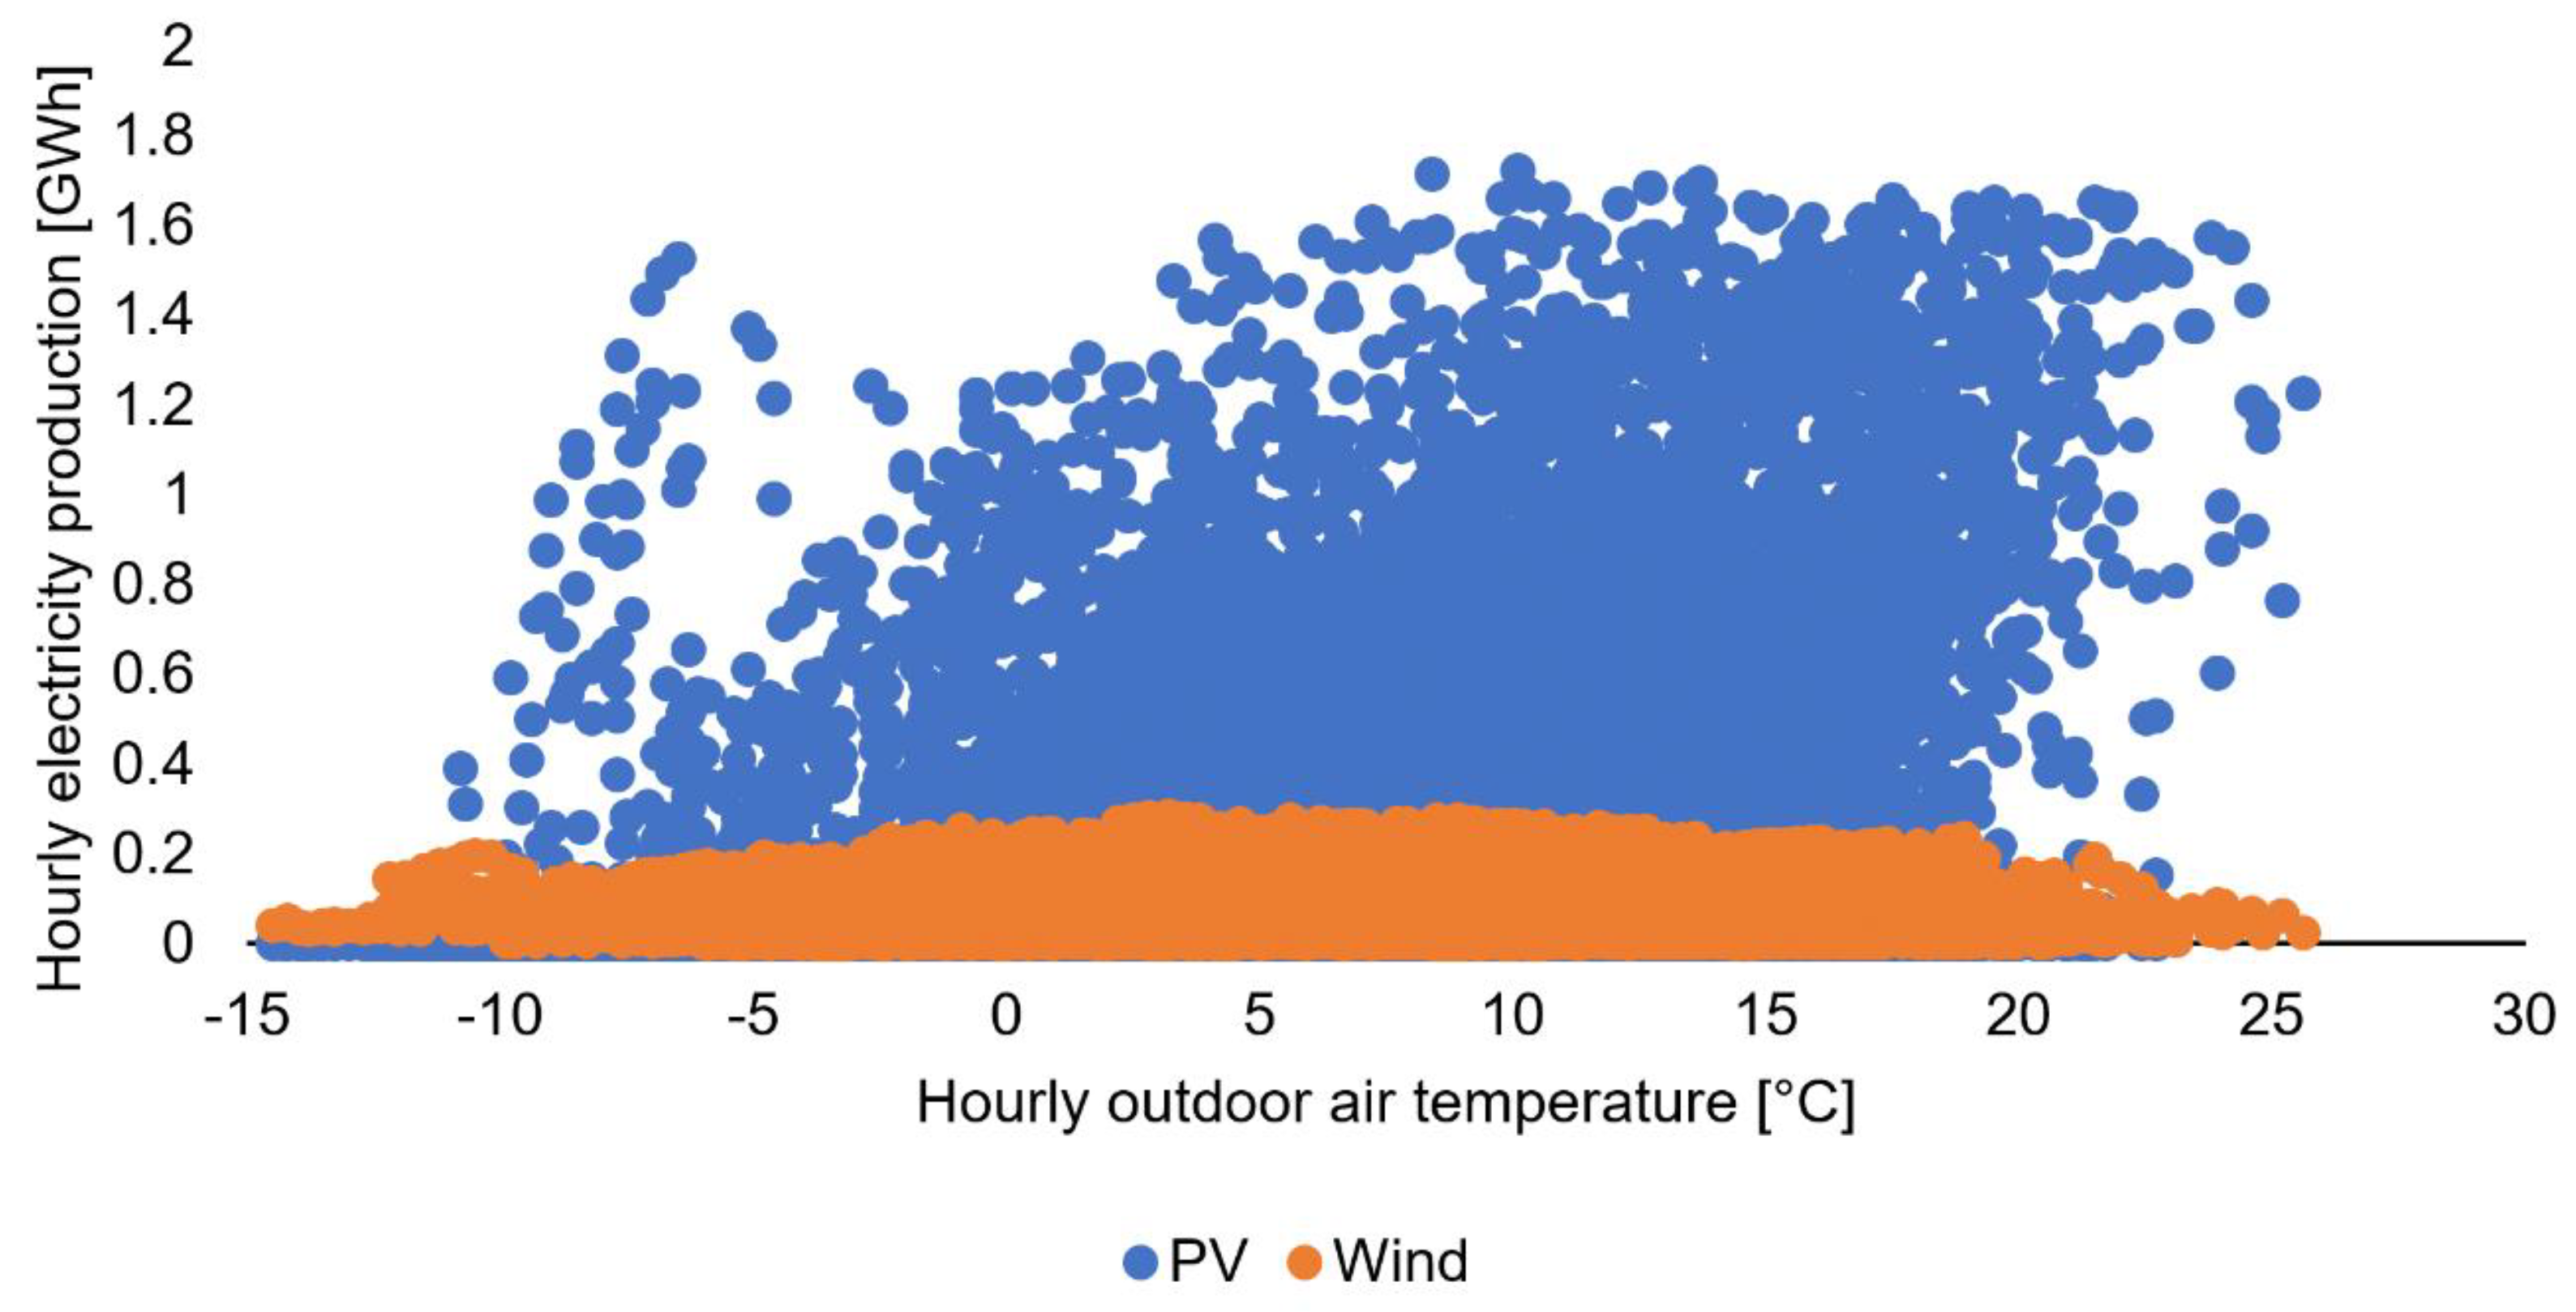
Figure 11 show that if the AWHP operation is preferred during the periods of production from PV power plants, there is an increase in SCOP of approximately 8%. This increase is related to the outdoor air temperature at the time of production from PV power plants. The daytime periods with an intensive solar contribution are characterized by the highest day air temperatures. Each curve related to PV production was obtained for an AWHP with different heat output, namely 100%, 150% and 200%. On the other hand, significant electricity production from wind power plants is most often observed during cold days and during parts of the day with a below-average temperature (night). The decrease in SCOP when the AWHP operation is preferred during periods of the highest production from wind power plants corresponds to approximately 1.4% compared to the condition without predictive control.
One of the limiting aspects of this approach is the size of the thermal storage vessel. To make sure the 1 kW heat losses are fully covered the accumulator needs 24 kWh thermal energy capacity. When considering 10 °C temperature difference between the higher and lower temperature of the space heating water with considered thermal capacity 4.18 kJ·kg−1·K−1, the water volume is equal to 2067 l.
Increasing the size of the accumulator (Figure 10) contributes to an increase in SCOP in all assessed modifications of predictive control; however, this increase is very small. The increase in the heat output of the AWHP (Figure 11) does not follow a clear trend within the scope of the parameters tested when the operation based on PV production is preferred. During regulation control based on production from wind power plants, there is a slight decrease in SCOP when the AWHP heating power increases.
The results clearly show that what influences the SCOP value the most is the parameter that controls the preference of AWHP operation. Increasing the capacity of the heat accumulator and increasing the output of AWHP influences the SCOP value only slightly.
Having this knowledge, other modifications of predictive control preferring AWHP operation in the day periods were assessed, including: (i) highest temperature and (ii) production from any RES (PV and wind). The calculation results are presented in Table 2. It presents relative change of SCOP compared to the AWHP operation without predictive control.
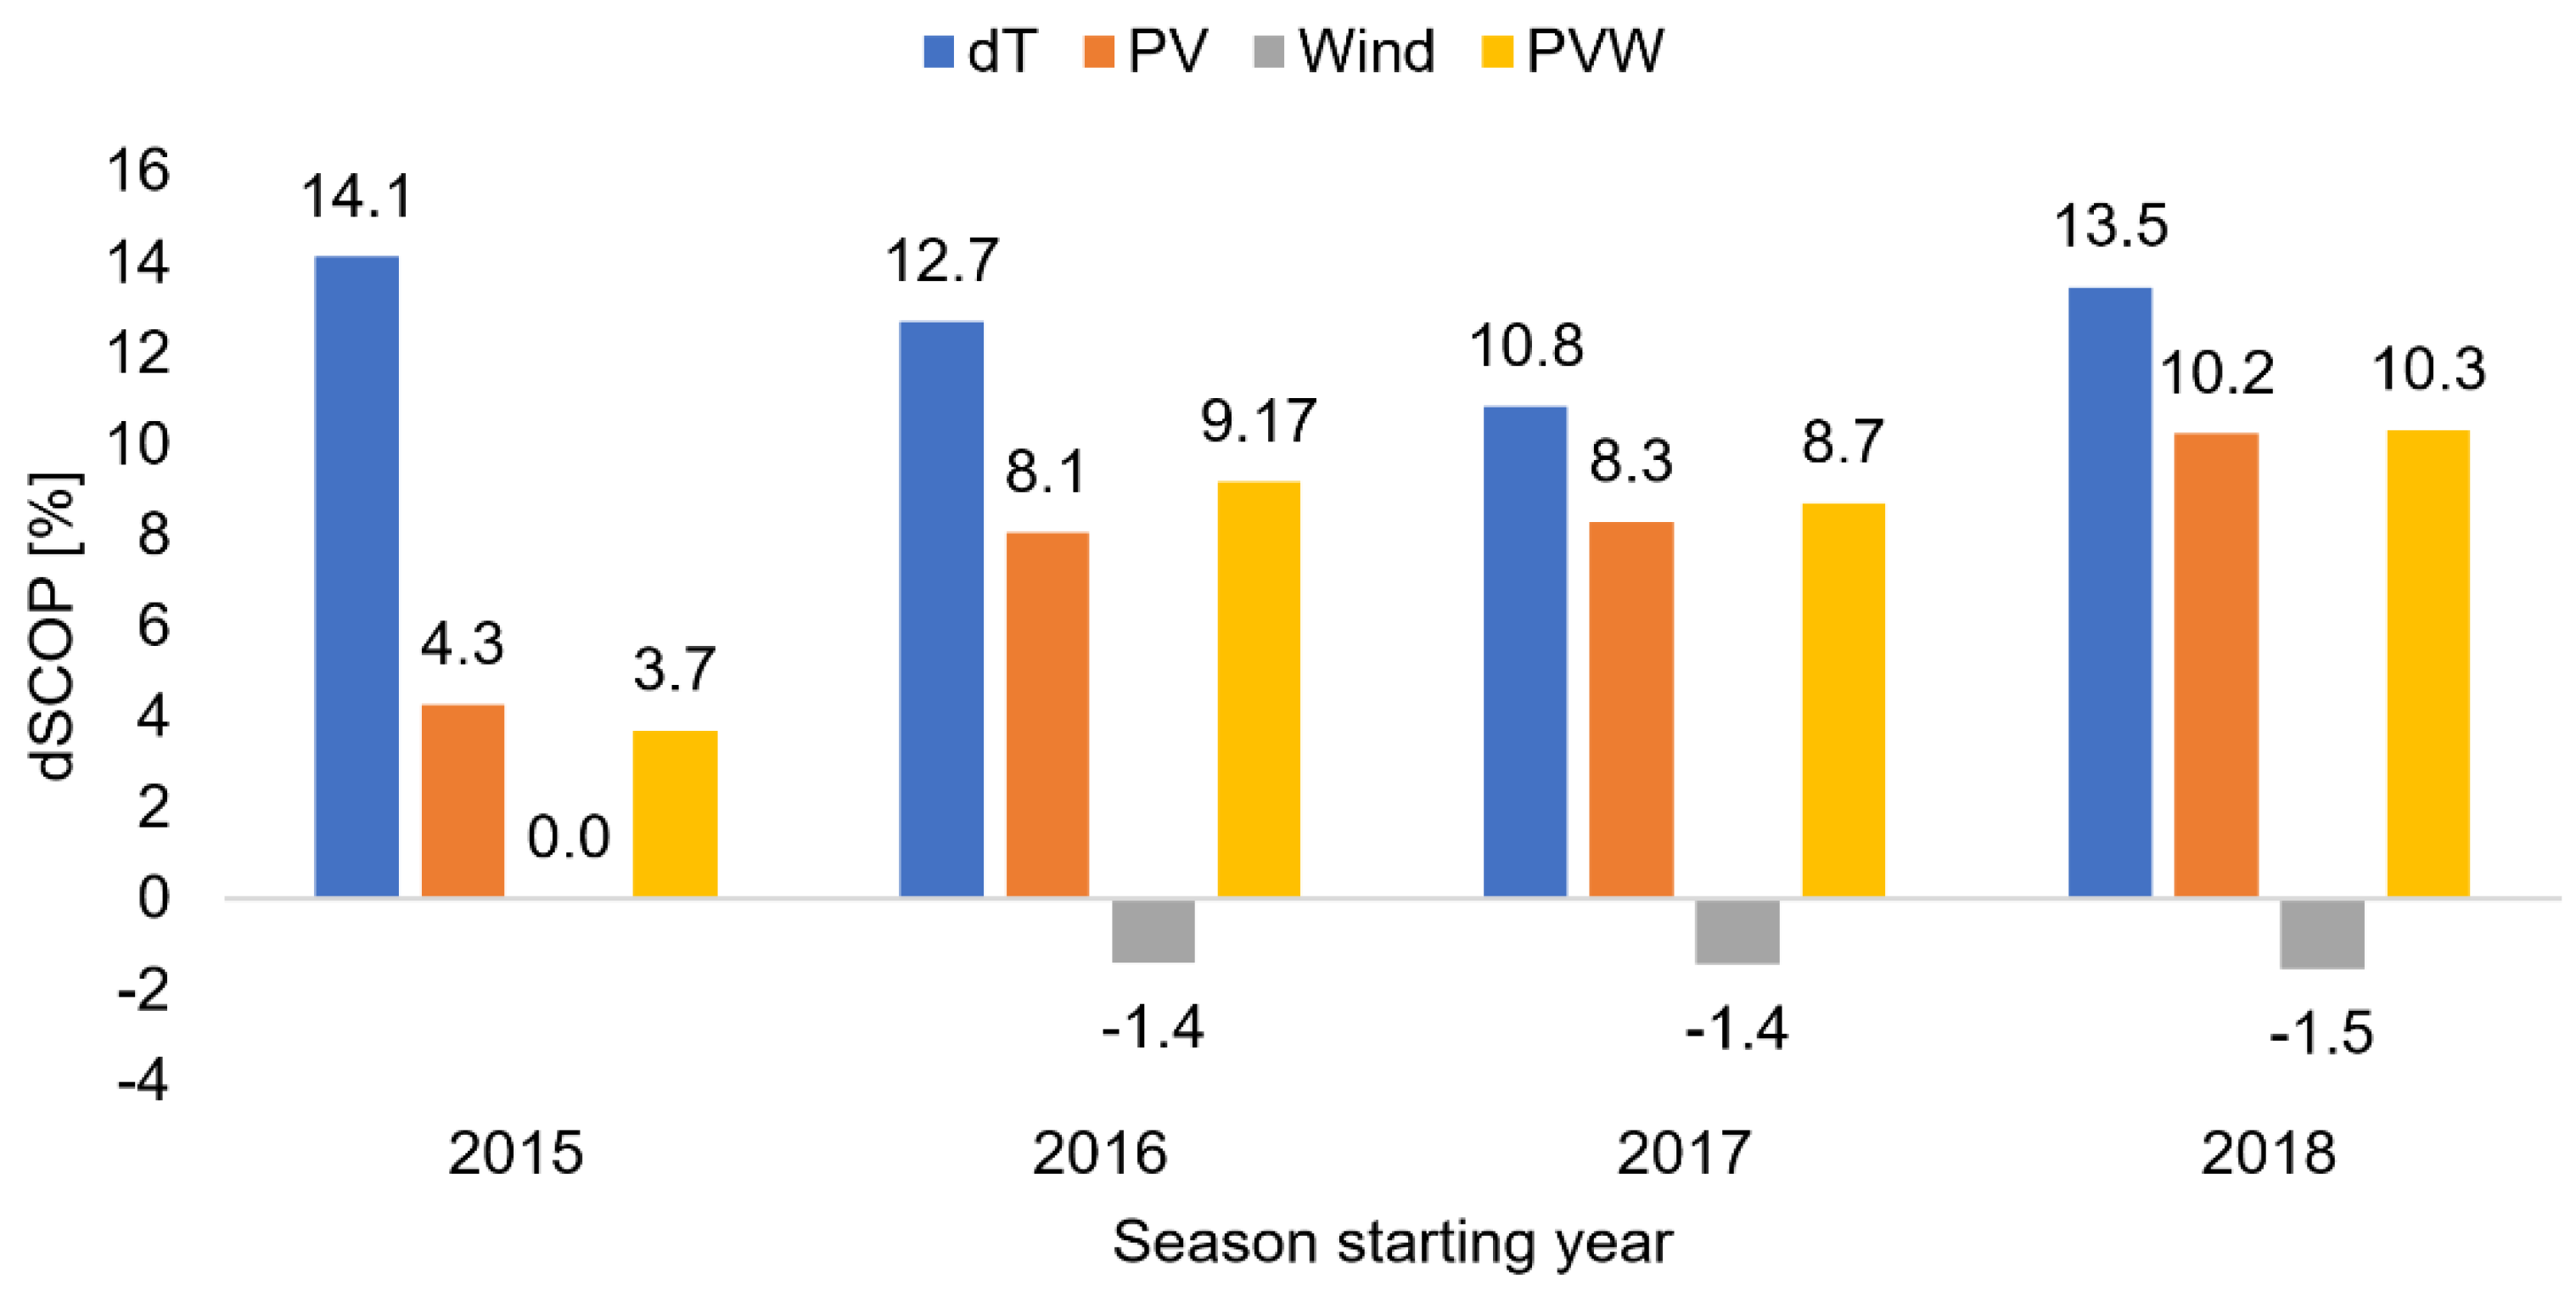
Figure 12 shows the results obtained for all the predictive control modifications tested. For all modifications of predictive control, the ACU 100% operation parameters and the heat output of 100% were assumed. The following were used as the predictive control parameters: outdoor temperature, PV power production, wind power production, and PV and wind power production combined. The results are presented as a relative increase or decrease of SCOP compared to the basic scenario without the use of predictive control. The highest relative increase in SCOP is achieved for the predictive control scenario ensuring AWHP operation in periods with the highest outside air temperature. In terms of the DSM concept, a relative increase in SCOP was achieved in the case of predictive control driven by the production of electricity from PV powerplants. This increase respects the fact that significant PV power plant production runs in periods with intense sunlight. At the same time, the highest outside air temperatures are achieved. In the case of the predictive control with wind power generation scenario, a relative decrease in SCOP was identified. This behaviour is because increased wind speeds occur mainly in periods with below-average outside air temperatures.

6. Conclusions

The study focused on comparing four modifications of predictive control used for operation control of an air-water heat pump (AWHP). The following variables were used as the predictive control parameters: outdoor temperature, PV power production, wind power production and PV and wind power production combined. The biggest increase in SCOP was found to be 14% and it was achieved when the AWHP operated during periods with the highest day temperature. This way of control is very promising due to its simplicity and easy feasibility. When the operation of the AWHP was controlled by the production from PV power plants, the maximum increase in SCOP was 10.25%. This SCOP increase is related to a good correlation between periods with intensive production from PV power plants and the highest day air temperature. Almost the same increase in SCOP of up to 10.33% was reached when the AWHP was controlled by the total production from PV and wind power plants. A decrease in SCOP only occurred in one case, which was when the AWHP operation was controlled only by production from wind power plants. In this case, the decrease in SCOP was 1.5%. All the values presented were compared against the heat pump SCOP without predictive control. The predictive control modifications were used in parametric studies monitoring the impact of the heat accumulator capacity and the heat output of the heat pump. These studies monitored predictive control modifications based on production from renewable energy sources. When the control was based on combined PV and wind power production, increasing the heat output of the pump showed no positive impact on the final SCOP value. Increasing the heat accumulator size enables longer storage of energy from the preferred periods of the heat pump operation. The testing of the modifications of predictive control showed that increasing the heat accumulator capacity causes an increase in the heat pump SCOP value. One of the limiting aspects of this approach is the size of the thermal storage vessel. To make sure the 1 kW heat loss is fully covered, the accumulator needs 24 kWh thermal energy capacity. When considering 10 °C temperature difference between the higher and lower temperature of the space heating water with considered thermal capacity 4.18 kJ·kg−1·K−1, the water volume is equal to 2067 l.
Further research should be focused on assessing the impact of different types of heat accumulators on the overall efficiency of the system. Furthermore, attention will should be focused on the possible improvement of the ripple control used today in the management of HPs.

Author Contributions

Conceptualization, J.P. and P.C.; Methodology, J.P. and M.Š.; Software, M.Š.; Investigation, J.P., M.Š. and P.C.; Resources, P.C. and M.Š.; Writing-Original Draft Preparation, J.P. and P.C.; Writing-Review & Editing, J.P., M.Š. and P.C.; Visualization, M.Š.

Funding

This paper has been supported by the project “Computer Simulations for Effective Low-Emission Energy Engineering” funded as project No. CZ.02.1.01/0.0/0.0/16_026/0008392 by Operational Programme Research, Development and Education, Priority axis 1: Strengthening capacity for high-quality research.

Conflicts of Interest

The authors declare no conflict of interest.

Nomenclature

AWHPAir-water heat pump
BDMWBiodegradable municipal waste
CZCzech Republic
COPCoefficient of performance
DSMDemand-site management
EHPAEuropean Heat Pump Association
EUEuropean Union
HPHeat pump
NGNatural gas
P HP Power input of the heat pump (W)
PSHPumped storage hydroelectricity
PVPhotovoltaics
PVWPhotovoltaics plus wind
Q · HP Heating capacity of the heat pump (W)
RESRenewable energy sources
SCOPSeasonal coefficient of performance
Δ T aw Temperature difference between the outdoor air and heating water (K)
T out Outdoor air temperature (K)
T w 2 Heating water temperature (K)

References

  1. Europe Commission. COM (2011) 112—A Roadmap for Moving to a Competitive Low Carbon Economy in 2050; Europe Commission: Brussels, Belgium, 2011. [Google Scholar]
  2. Eurostat. Complete Energy Balances—Annual Data 2016. Available online: https://ec.europa.eu/eurostat/statistics-explained/index.php (accessed on 1 October 2018).
  3. HotMaps. Hotmaps Report D2.3 WP2 Open Dataset for the EU28; HotMaps: Vienna, Austria, 2018. [Google Scholar]
  4. Yearly Report: The European Heat Pump Market Has Grown by 12% in 2018. European heat Pump Association (EHPA). Available online: https://www.ehpa.org/about/news/article/the-european-heat-pump-market-has-grown-by-12-in-2018/ (accessed on 12 June 2019).
  5. Guo, X.; Goumba, A. Air source heat pump for domestic hot water supply: Performance comparison between individual and building scale installations. Energy 2018, 164, 794–802. [Google Scholar] [CrossRef]
  6. Goumba, A.; Chiche, S.; Guo, X.; Colombert, M.; Bonneau, P. Recov’Heat: An estimation tool of urban waste heat recovery potential in sustainable cities. In Proceedings of the AIP Conference Proceedings 1814, 020038, Paris, France, 16–18 November 2016. [Google Scholar] [CrossRef]
  7. Bee, E.; Prada, A.; Baggio, P. Demand-Side Management of Air-Source Heat Pump and Photovoltaic Systems for Heating Applications in the Italian Context. Environments 2018, 5, 132. [Google Scholar] [CrossRef]
  8. Nowak, T.; Westring, P. European Heat Pump Market and Statistics Report 2016; Technical report; The European Heat Pump Association AISBL (EHPA): Brussels, Belgium, 2016. [Google Scholar]
  9. Chua, K.J.; Chou, S.K.; Yang, W.M. Advances in heat pump systems: A review. Appl. Energy 2010, 87, 3611–3624. [Google Scholar] [CrossRef]
  10. EHPA. European Heat Pump Market and Statistics Report 2017; EHPA: Brussels, Belgium, 2018. [Google Scholar]
  11. Czech Demographic Handbook. Czech Statistical Office, 2017. Available online: https://www.czso.cz/csu/czso/population (accessed on 5 July 2019).
  12. Yearly Report on the Operation of the Czech Electrical Grid (in Czech). Czech Energy Regulatory Office: Prague, 2019. Available online: http://www.eru.cz/documents/10540/4580207/Rocni_zprava_provoz_ES_2018.pdf/1420388b-8eb6-4424-9ad9-c06a57b5326c (accessed on 5 July 2019).
  13. National Standard ČSN EN 12831-1 Energy Performance of Buildings—Method for Calculation of the Design Heat Load—Part 1: Space Heating Load, Module M3-3; Swedish Standards Institute: Stockholm, Sweden, 2017.
  14. Hepbasli, A.; Kalinci, Y. A review of heat pump water heating systems. Renew. Sustain. Energy Rev. 2009, 13, 1211–1229. [Google Scholar] [CrossRef]
  15. Pospíšil, J.; Špiláček, M.; Kudela, L. Potential of predictive control for improvement of seasonal coefficient of performance of air source heat pump in Central European climate zone. Energy 2018, 154, 415–423. [Google Scholar] [CrossRef]
  16. ENTSOE Transparency Platform. Available online: https://transparency.entsoe.eu/generation/r2/actualGenerationPerProductionType/show (accessed on 1 June 2019).
Figure 1. Number of new heat pump installations in the Czech Republic [10].
Energies 12 03236 g001
Figure 2. Historical records of mean day temperature of the studied heating seasons from 2015 to 2018.
Energies 12 03236 g002
Figure 3. Relation between outdoor air temperature and power production from wind and PV (GWh per hour).
Energies 12 03236 g003
Figure 4. Amount of electrical energy produced from PV during the heating seasons.
Energies 12 03236 g004
Figure 5. Amount of electrical energy produced by wind power plants during the heating seasons.
Energies 12 03236 g005
Figure 6. Relation between the coefficient of performance and temperature difference of water at the outlet of the condenser and the air temperature at the inlet of the evaporator (adopted from [15]).
Energies 12 03236 g006
Figure 7. Electrical energy consumption needed to drive the air-water heat pump (AWHP) in the model building (scenario with preferred operation during peak PV production) (kWh·month−1).
Energies 12 03236 g007
Figure 8. System with predictive control and a heat accumulator.
Energies 12 03236 g008
Figure 9. Example of the identification of HP operation periods within a 24-hour interval (adapted from [15]).
Energies 12 03236 g009
Figure 10. Relative increase/decrease in seasonal coefficient of performance (SCOP) related to the heat accumulator capacity.
Energies 12 03236 g010
Figure 11. Relative increase/decrease in SCOP related to the AWHP heat output.
Energies 12 03236 g011
Figure 12. Relative increase/decrease in the SCOP of the predictive control modifications tested.
Energies 12 03236 g012
Table 1. Total installed capacity of wind power plants and solar photovoltaic (PV) power plants in the Czech Republic [12].
Year2015201620172018
Wind (MW)280.6282.0308.2316.2
Solar PV (MW)2074.92067.92069.52056.8
Table 2. SCOP and relative changes of SCOP for tested modifications of AWHP operation control.
Accumulator Capacity50%100%
AWHP Heat Output100%150%200%100%150%200%
SCOP (Relative changes of SCOP compared to scenario without accumulation (%))
PV20155.01 (3.4)4.97 (3.4)4.95 (3.5)5.05 (4.3)4.98 (3.5)4.92 (3.0)
20164.90 (8.3)4.92 (9.1)4.85 (8.1)4.91 (8.1)4.90 (9.7)4.82 (8.8)
20175.01 (9.0)4.96 (9.0)4.95 (8.8)4.99 (8.3)4.99 (9.7)4.94 (9.8)
20185.42 (10.9)5.39 (10.6)5.31 (10.0)5.37 (10.3)5.32 (11.3)5.22 (10.9)
Wind20154.79 (−0.5)4.76 (−0.8)4.76 (−0.5)4.84 (0.0)4.79 (−0.2)4.73 (−0.4)
20164.43 (−1.9)4.44 (−1.3)4.36 (−2.2)4.45 (−1.4)4.42 (−1.6)4.35 (−1.8)
20174.46 (−1.4)4.48 (−1.3)4.42 (−1.2)4.48 (−1.4)4.48 (−1.6)4.41 (−1.3)
20184.75 (−1.6)4.69 (−2.5)4.66 (-2.3)4.74 (−1.5)4.72 (−1.7)4.69 (−1.6)
PVW20155.02 (3.6)4.95 (3.1)4.93 (3.0)5.01 (3.7)4.94 (3.5)4.89 (2.7)
20164.93 (8.3)4.87 (8.5)4.85 (8.5)4.96 (9.2)4.90 (10.2)4.79 (9.3)
20175.01 (9.0)4.91 (8.4)4.89 (8.1)5.00 (8.7)4.92 (9.2)4.80 (8.2)
20185.38 (10.3)5.32 (10.0)5.24 (9.3)5.38 (10.3)4.29 (10.8)5.25 (11.7)

