Article

Flexibility-Based Energy and Demand Management in Data Centers: A Case Study for Cloud Computing

by
Robert Basmadjian
Chair of Sensor Technology, University of Passau, Innstrasse 43, 94032 Passau, Germany
Energies 2019, 12(17), 3301; https://doi.org/10.3390/en12173301
Submission received: 8 June 2019 / Revised: 18 August 2019 / Accepted: 23 August 2019 / Published: 27 August 2019
(This article belongs to the Special Issue Electricity Demand Side Management)

Abstract

:
The power demand (kW) and energy consumption (kWh) of data centers were augmented drastically due to the increased communication and computation needs of IT services. Leveraging demand and energy management within data centers is a necessity. Thanks to the automated ICT infrastructure empowered by the IoT technology, such types of management are becoming more feasible than ever. In this paper, we look at management from two different perspectives: (1) minimization of the overall energy consumption and (2) reduction of peak power demand during demand-response periods. Both perspectives have a positive impact on total cost of ownership for data centers. We exhaustively reviewed the potential mechanisms in data centers that provided flexibilities together with flexible contracts such as green service level and supply-demand agreements. We extended state-of-the-art by introducing the methodological building blocks and foundations of management systems for the above mentioned two perspectives. We validated our results by conducting experiments on a lab-grade scale cloud computing data center at the premises of HPE in Milano. The obtained results support the theoretical model, by highlighting the excellent potential of flexible service level agreements in Green IT: 33% of overall energy savings and 50% of power demand reduction during demand-response periods in the case of data center federation.

Graphical Abstract

1. Introduction

For the last couple of years, digitization of information has been pervasive in our daily lives, from normal business operations to private social activities. This required the development of an ubiquitous ICT (Information and Communications Technology) infrastructure with huge data centers consuming power in the magnitude of Mega Watts like the ones used by Google, Microsoft, Amazon, and Yahoo [1,2]. Due to the two strong trends of outsourcing support services and increasing communication needs, their importance in ICT has been booming, making data centers the fastest growing subsector of ICT [3,4]. However, an undesired side effect of this extensive computing activity is that it consumes an enormous amount of energy. A widely cited comparison is that the ICT sector worldwide uses as much energy as aviation [5], and continues to grow; thus contributing to a major share of the world’s CO2 emissions. It is estimated that ICT could use up to 50% of world’s electricity in 2030 and it could contribute up to 23% of CO2 emissions [6].
There are several starting points for energy management in a data center: (1) beginning with the decision of where to house it [7], (2) the choice of its primary energy source and cooling system, (3) via infrastructure and equipment, and (4) up to the operation phase of a date center. The good news is that even when the data center site is already constructed and all the equipment are in place, the operation phase offers various degrees of flexibilities to work in either an energy wasting or energy-efficient mode. To guarantee that no service level agreement (SLA) is breached, the ICT resources of a data center are overprovisioned most of the time. An option—and this is the focus the presented approach is considering—is the provision of intelligent energy and demand management systems that take adequate decisions based on corresponding situations. IoT devices (e.g., temperature sensors) are used in the data center industry to provide those management systems the necessary information (e.g., temperature set-points and utilization) for decision-making.
Thanks to the so-called “Energy Transition” [8], renewable energy sources such as solar panels, wind mills, etc. emerged into the distribution network (e.g., low voltage grid). This led to the evolution of the grid from huge, centralized and always available energy sources into small, decentralized, and intermittent ones. Due to the sporadic nature of renewable sources, the power generation planning becomes even more cumbersome, which increases the risk to the grid’s stability. Thus, the conventional paradigm of “supply follows demand” has shown its flaws as well as the potential to be replaced by the new paradigm of “demand-side management” [9].
Demand-response schemes were proposed as a form of demand-side management to partially mitigate the power grid’s stability problem due to peak power demand [10,11]. In short, those schemes define a list of actions that need to be taken by the power consumers to drastically reduce the electrical load during power shortage situations. Data centers, on one hand, due to their significant power demand (in the magnitude of up to 200 MW [1]) and, on the other hand, thanks to their fully automated frameworks that exploit flexibilities without human interventions, were shown to be excellent candidates for participating in the demand-response schemes [12,13,14].
In this paper, the main goals are (1) to demonstrate the possibility of realizing intelligent energy and demand management inside data centers and (2) to quantify the extent of savings by considering a real physical infrastructure and exploiting its flexibilities. To achieve those goals, the following research questions are posed.
  • With flexibility being the key enabler of demand and energy management, which mechanisms provide flexibilities in a data center and how those can be exploited?
  • What are the required fundamental changes needed to realize such types of management?
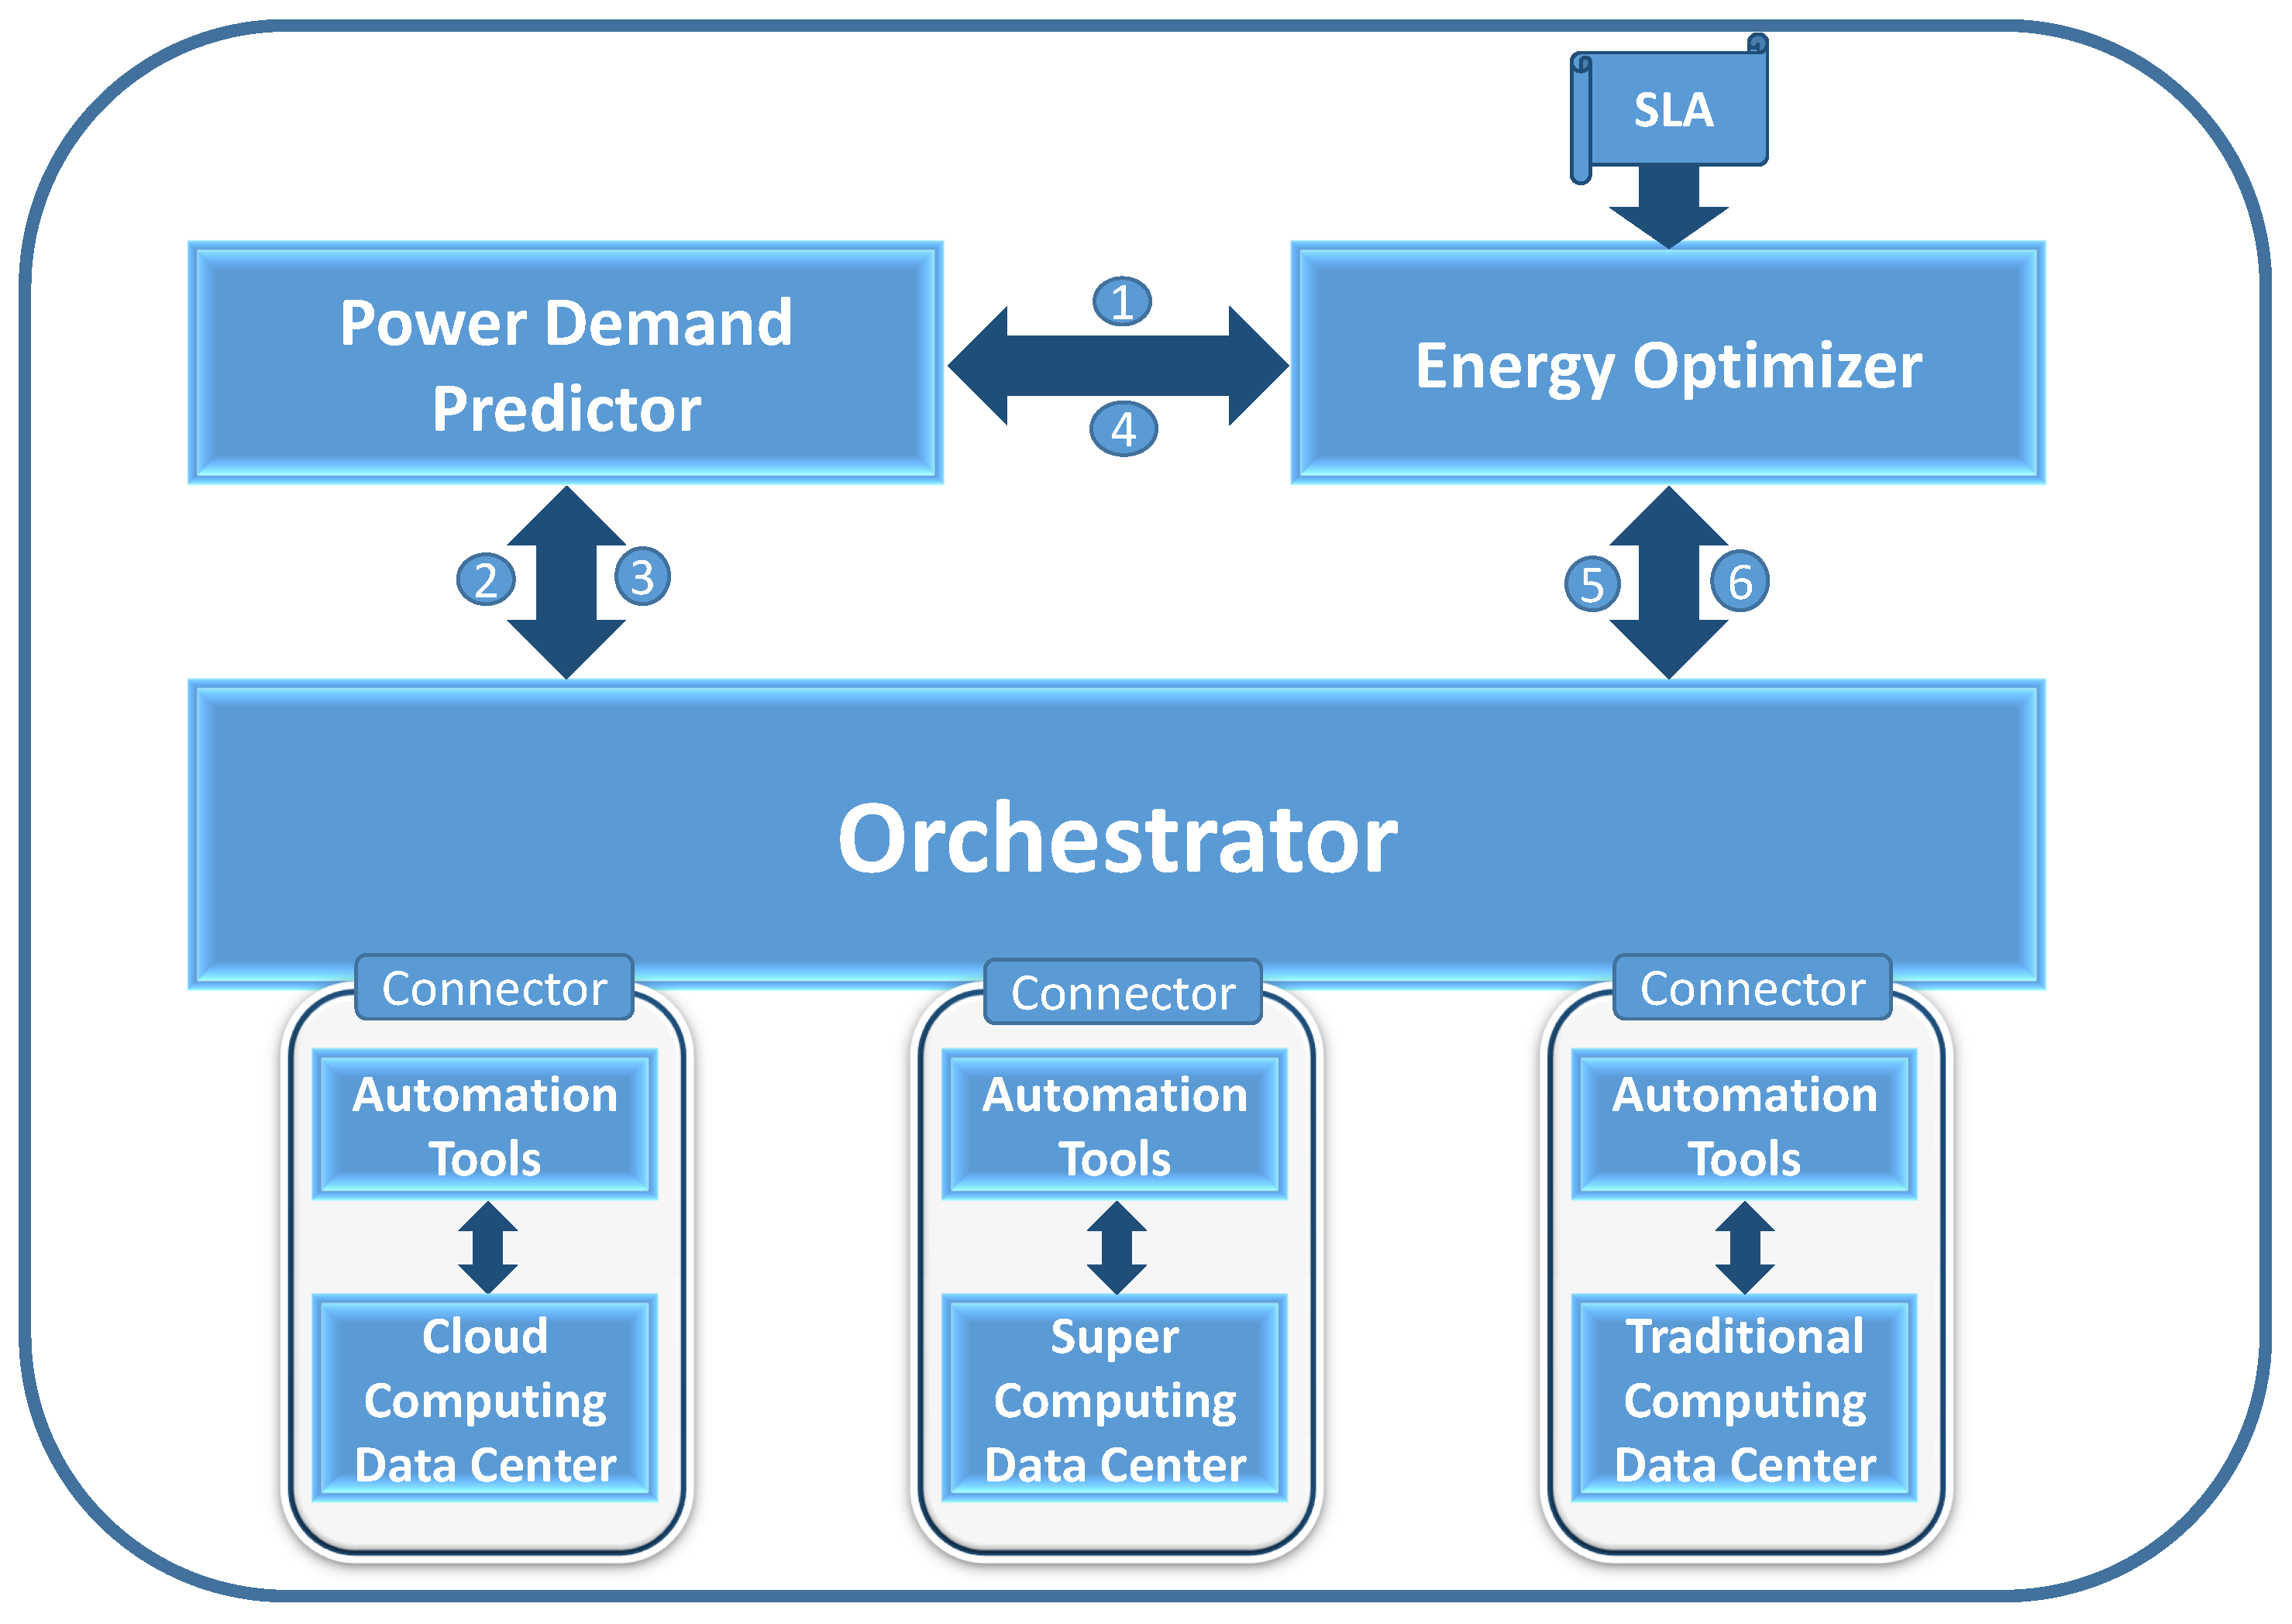
  • Which architectural building blocks are necessary for the implementation of intelligent demand and energy management systems?
This work provides answers to the aforementioned questions by presenting the methodological and conceptual foundations of realizing intelligent management in data centers. Such management facilitates the practical execution of data center operator objectives by (1) minimizing the overall energy consumption of data centers and (2) reducing data center’s peak power demand for the purpose of demand-side management. Both aspects are attractive to data center operators to reduce the operational expenditure (Opex) which is becoming more and more the prominent fraction of data center’s total cost of ownership (TCO) [15].
The proposed management systems rely on flexible mechanisms which are identified and categorized into two groups in this paper: with and without impact on SLAs. For the sake of exploiting those identified flexible mechanisms, a fundamental change is required from a conceptual perspective. To this end, flexible service level as well as supply-demand agreements together with the concept of federation of data centers are shown to be the key enablers which advance the state-of-the-art approaches. Unlike the existing contributions where simulations are considered for experiments of only one management system (e.g., either consumption or demand), a real-life cloud computing data center is set up in this paper which captures all the physical processes. For the two different management systems, experiments were carried out on the same physical infrastructure by executing a subset of the identified flexible mechanisms such as workload management (e.g., migration, shifting, and consolidation), hardware management (e.g., turning on/off servers and DVFS), as well as relaxing the corresponding SLAs. The obtained results show the significant relevance of intelligent management in cloud computing data centers either for minimizing their energy consumption or for reducing peak power demand to achieve demand-side management. Note that in this paper, we are considering techniques applicable at the low voltage grid level, and use the terms IT and ICT interchangeably.
Our work makes the following contributions.
  • Identify the most relevant flexibility providing mechanisms in a data center and specify each ones’ reaction time as well as the required IoT infrastructure.
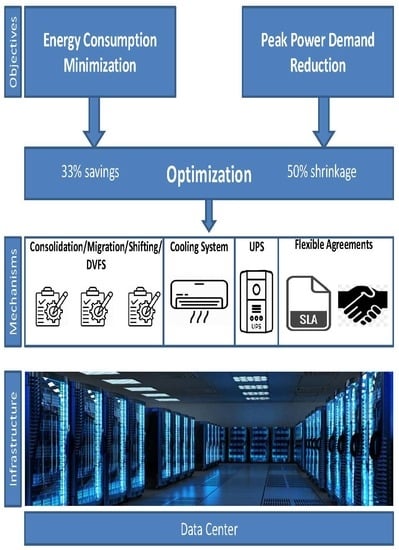
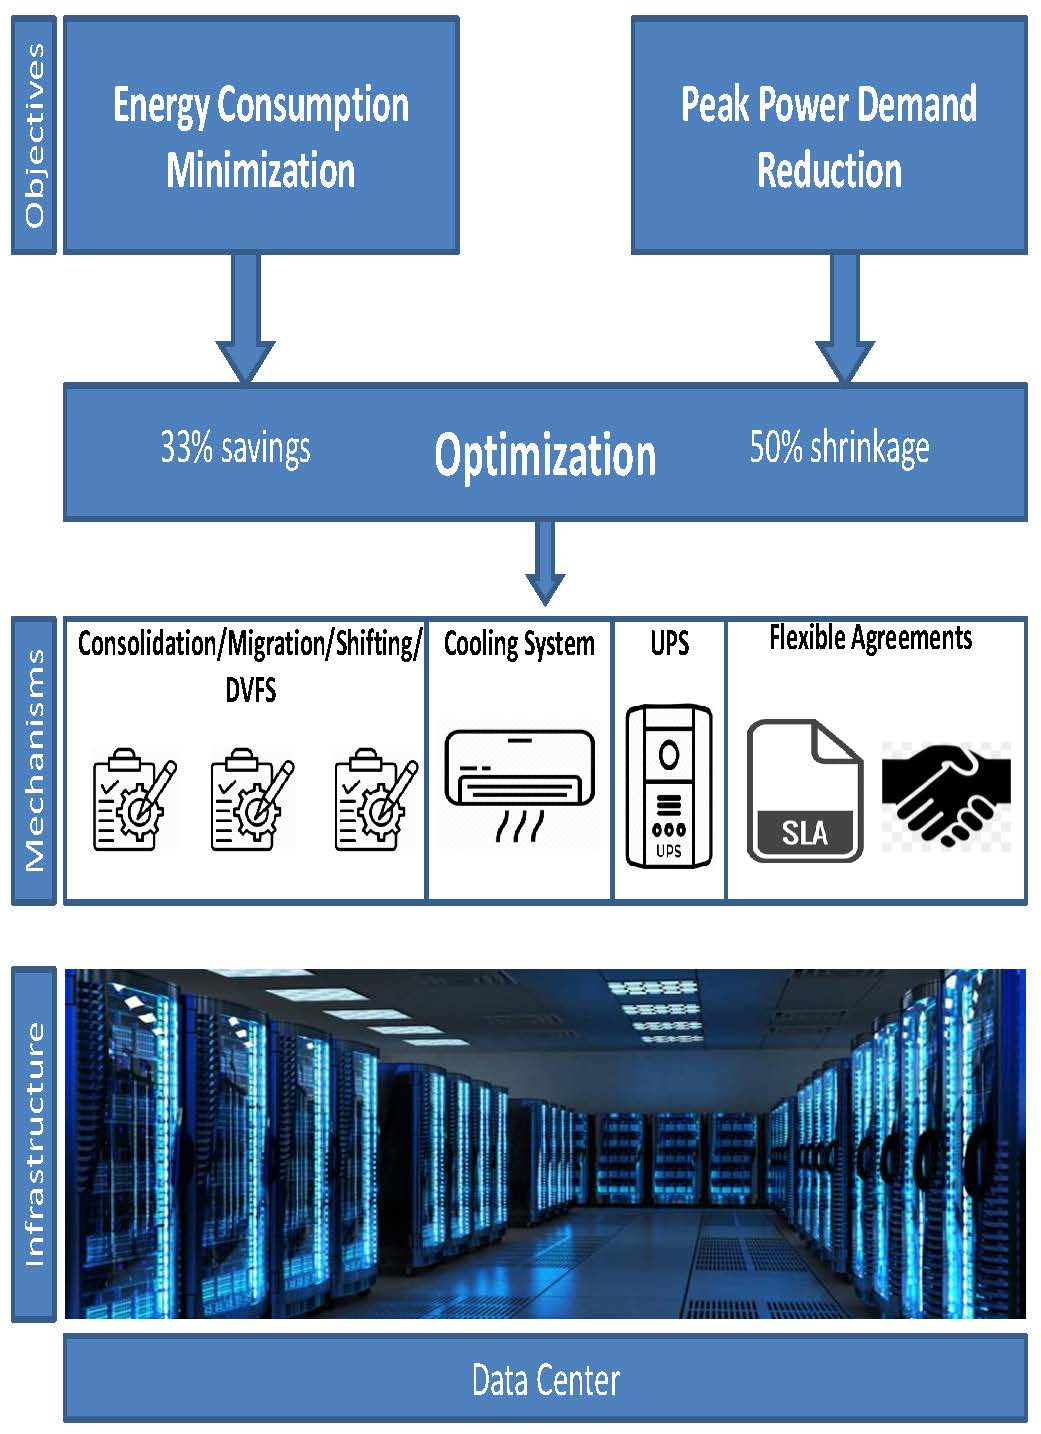
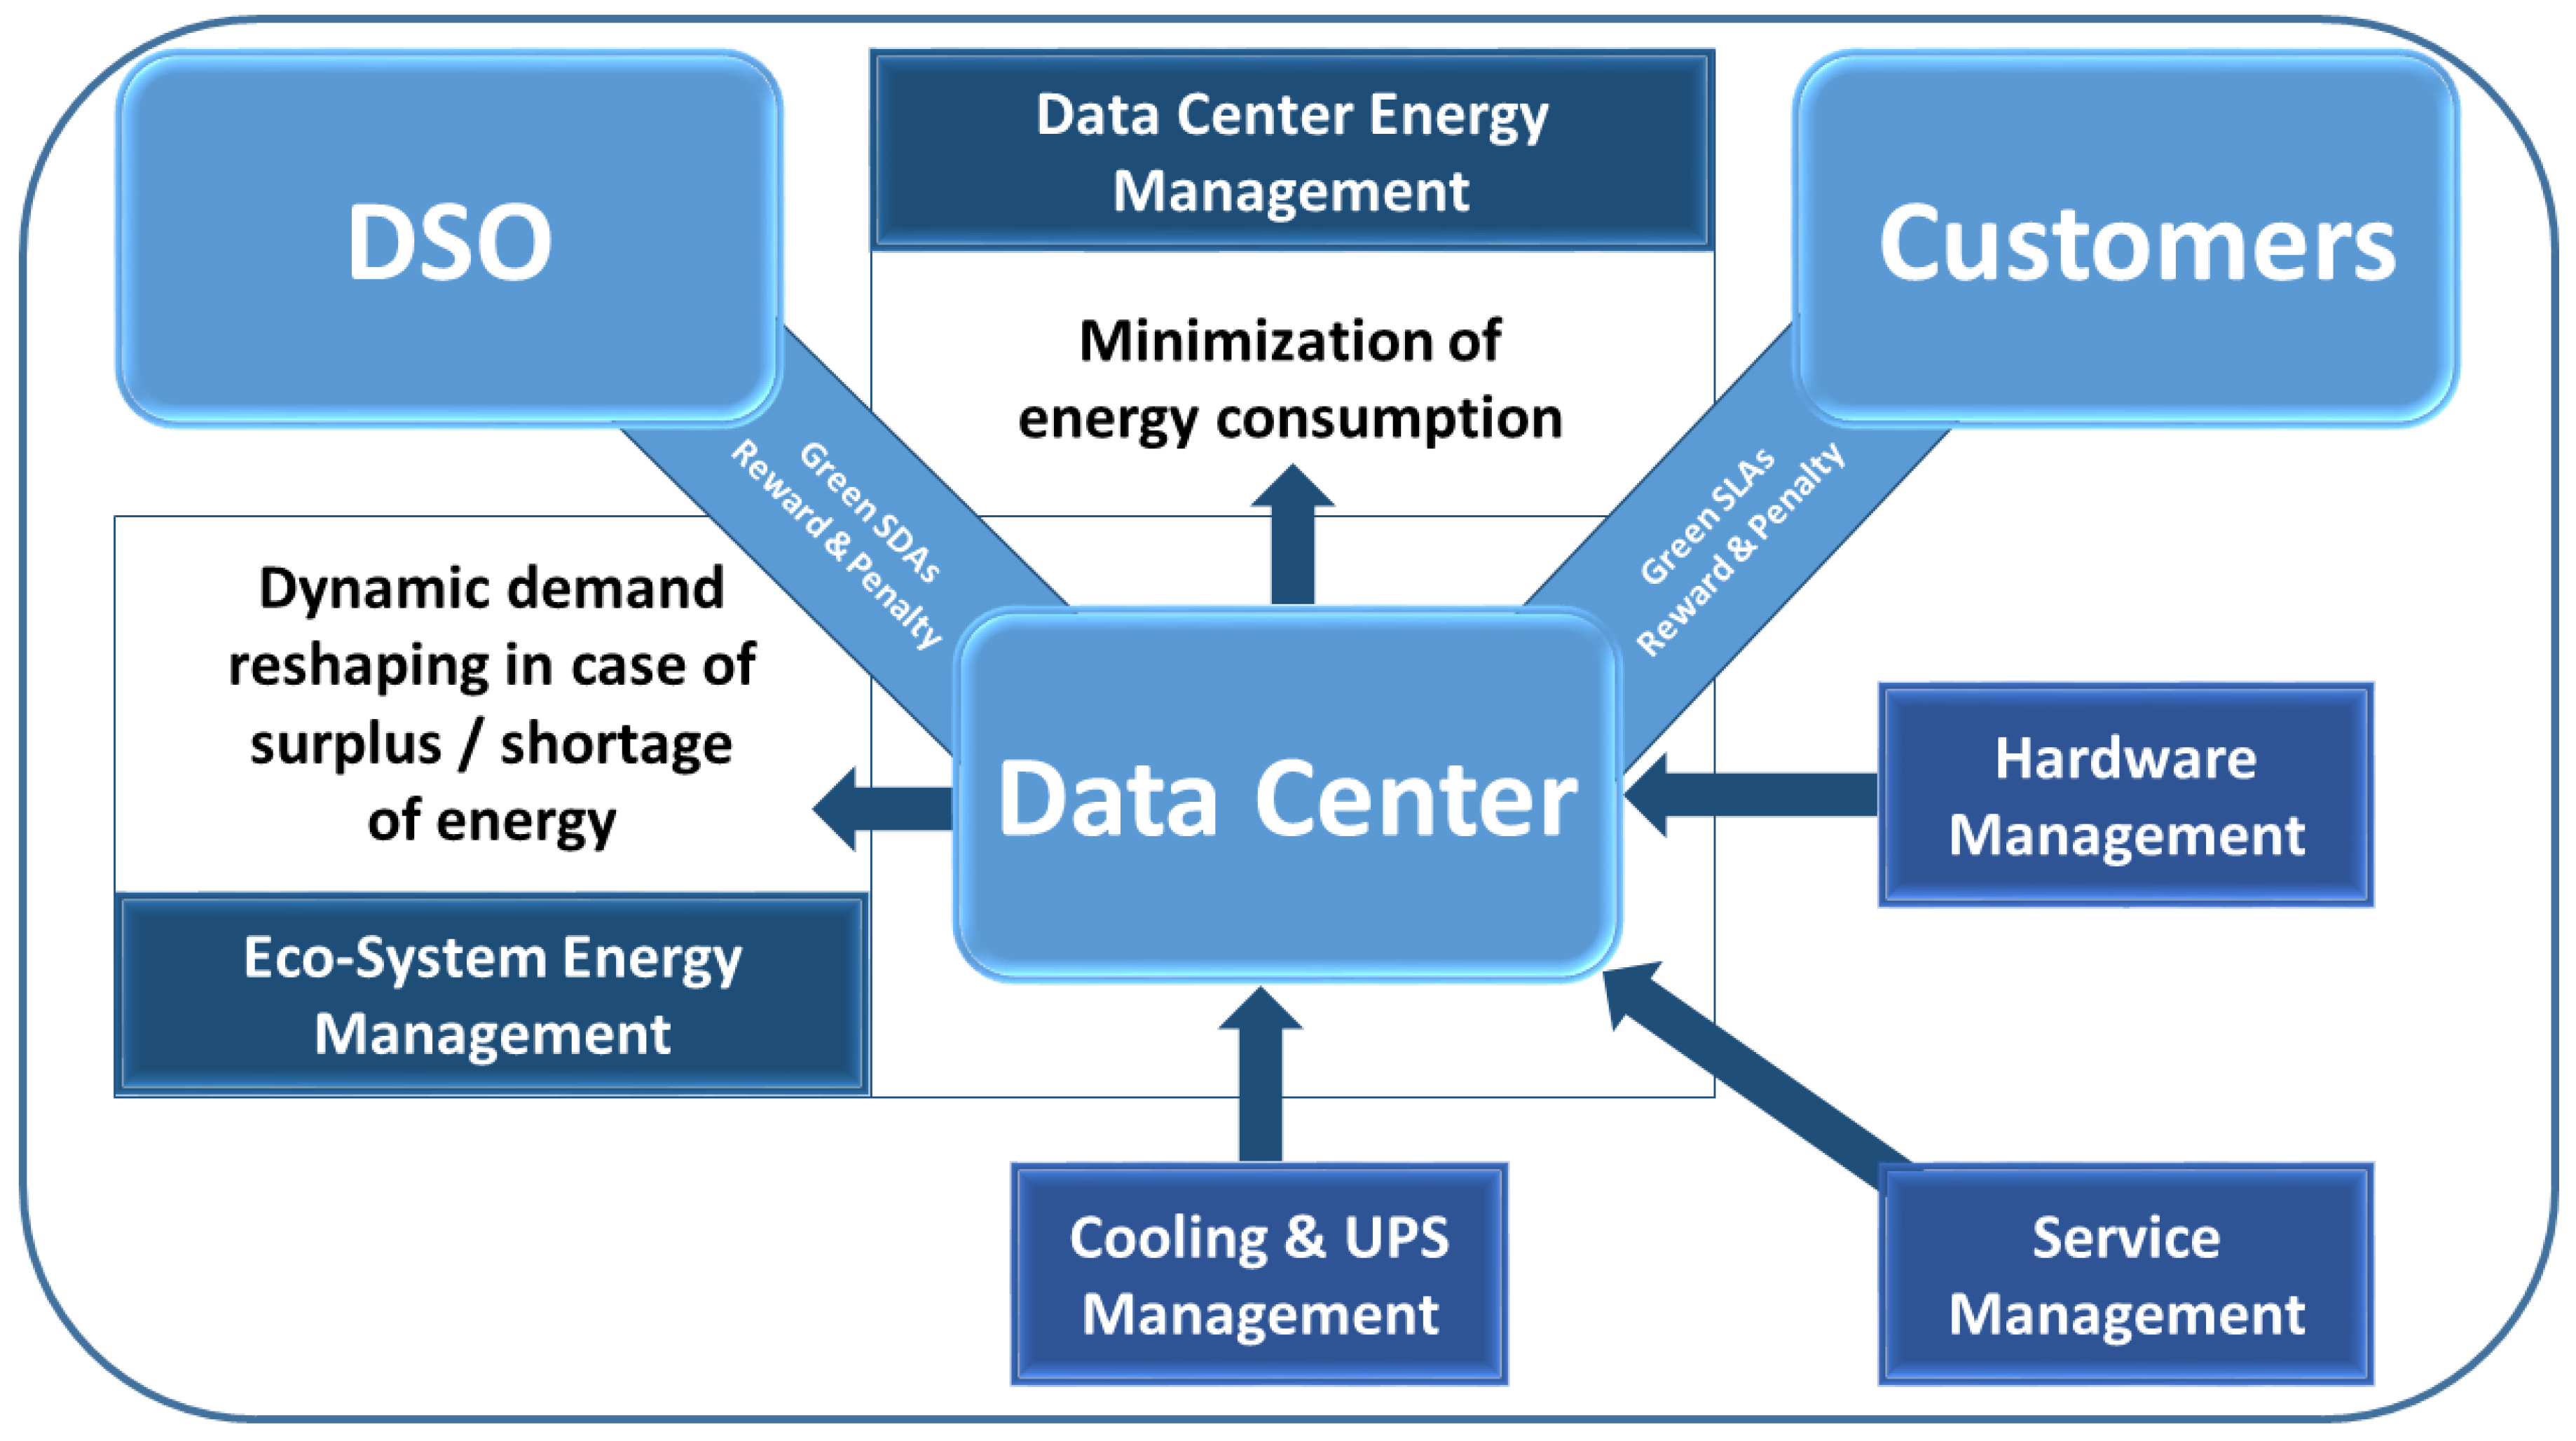
  • Describe the architectural building blocks for two different management systems: minimization of overall energy consumption (energy-efficiency) and reduction/increase of power demand (demand-response and demand-side management). The adopted modular description makes it easier to understand the complex processes that are involved.
  • Demonstrate the need for flexible service level (SLA) together with supply-demand agreements (SDA) to achieve demand-side management. The proposed agreements not only take into account power reduction but also the case for demand increase (e.g., excess of power from renewables). The presented case of federating several data centers showed additional optimization possibilities.
  • The experiments that are carried out show that the underlying concepts can be realized in real-life configurations in such a way that the findings provide “best practices” and insights to data center operators who are willing to achieve energy optimization and demand-side management.
The remainder of this paper is organized as follows: Section 2 provides an exhaustive review of flexibility providing mechanisms in data centers. In Section 3, we motivate and describe the form of flexible contracts between data centers and customers as well as between data centers and distribution system operator. Energy management systems of data centers for minimizing overall energy consumption and reducing peak power demand are presented in Section 4. Section 5 presents the obtained results of the setup proof-of-concept.

2. Flexibility Mechanisms in Data Centers

Fully automated IT infrastructure enables demand-side management inside data centers without any human intervention. This is an extremely desired requirement for any energy management system. Next, we present flexibility providing mechanisms in data centers that can be exploited by such management systems by categorizing them into two distinct subsets: having impact and no impact on SLAs.

2.1. Workload

Utilization of the underlying IT resources corresponds to the amount of workload that needs to be completed. Service level agreements (SLA) guarantee certain quality of service characteristics bound to a specific workload. Due to business interests (e.g., maximize the revenue), high-performance computing environments are utilized 95% of the time, hence leaving only a slight room of flexibilities without breaching SLAs. Consequently, energy savings within this context are achieved through efficient scheduling of the jobs, which is not the focus of this paper. The workload in typical cloud computing environments provides flexibilities in terms of SLAs. For instance, agreements of back-up services do not specify the exact time (e.g., at midday) when the operation should be carried out; however they determine the frequency (e.g., daily) of the back-up operation as well as its availability (e.g., 99.99%). Next, we describe four mechanisms to deal with such flexible workloads: consolidation, shifting, migration, and frequency scaling.

2.1.1. Consolidation

Is a mechanism that builds on virtualization technology of data center infrastructure. The main idea is to consolidate as many virtual machines as possible, each presenting a specific workload, onto a set of reduced IT equipment (e.g physical servers) so that the idle resources can be switched off [16,17]. It was shown that an idle server consumes up to 50% of its maximum power demand [18]. On one hand, this consolidation mechanism drastically reduces the overall power demand of IT equipment. On the other hand, it degrades the performance of running services especially in dense consolidation cases (e.g., ratio of 4:1 or more). The main disadvantage of this mechanism is the fact that its usage has impact on the underlying SLAs (e.g., performance degradation).
The reaction time for consolidation depends mainly on data center’s workload size as well as configuration. In the best case scenario, this might take a few minutes (e.g., 1–3 min). Traditional virtualization technologies implemented in data centers are either open source hypervisors, such as KVM [19] and XEN [20], or licensed ones like VMware.

2.1.2. Shifting

Is the rescheduling/postponing of workload to a future time period for the sake of reducing utilization of ICT resources and consequently lowering power demand. This requires that the corresponding SLA does not specify hard constraints on execution time of the workload: it may not determine the precise time of when the backup needs to be carried out (e.g., at noon or night) as long as the SLA guarantees 99.99% availability. This provides some flexibilities to shift the workload temporally. The most appealing advantage of load shifting is its instantaneous reaction time.

2.1.3. Migration

Refers to geographically moving IT workload (e.g., virtual machines) from one data center to another. For this mechanism to work, it is required that both the source and destination data centers be compatible technically. More precisely, both data centers need to be equipped with similar virtualization technologies and need to be capable of executing virtual machines (e.g., the migrated workload). Migration takes the burden from one geographical site and puts it on the hosting data center.
Its major drawback is the service downtime period and hence has an impact on the underlying SLAs. For instance, in live migration a downtime of only a few seconds is very common nowadays, whereas in the case of non-live migration this can take minutes to hours. The reaction time of this mechanism depends largely on several factors: the bandwidth of the network, the size of the workload, as well as the mode of migration (e.g., cold, warm, and live [21]).

2.1.4. Frequency Scaling

Is a hardware feature supported by most processor manufacturers (e.g., Intel and AMD) that allows clocking up and down the frequency and voltage of processors. This hardware feature is manipulated by a piece of software called “governor” which is implemented at the kernel level of the operating system. There are several types of governors (e.g., power save, performance, on-demand, and conservative) available for Linux OS where each alters the frequency of the processor based on a set of predefined rules. For instance, utilization-based governors (e.g., conservative and on-demand) scale to lower frequencies during low or medium utilization periods and hence reduce the power demand of servers drastically.
This mechanism requires the underlying physical resource to be equipped with Dynamic Voltage and Frequency Scaling (DVFS) technology [22], which most hardware vendors provide nowadays. Its main drawback is that by minimizing the power demand it also reduces the performance of the running services as well. Thus this mechanism also has an impact on the underlying SLAs (e.g., performance degradation). To capture the trade-off between performance and power savings, models as the ones proposed in the works by the authors of [23,24] are needed. Unlike consolidation, the reaction time of this mechanism is instantaneous, and in most cases it is executed through the governors of the operating system.

2.2. Cooling System

Generally, power supplied to ICT resources dissipates almost proportionally as heat. In data centers, which represent densely equipped environments, heat needs to be removed to keep ICT equipment from overheating. Overheating of resources may result in loss of availability (e.g., emergency shutdown), decreased performance (e.g., thermal throttling), or even hardware damages and hence premature system failure. To mitigate this problem, data centers are constantly operated under cooling systems, where energy consumption for cooling may amount up to 40% of the overall consumption of a data center [25]. The main objective behind this mechanism is to alter the temperature set points of the cooling system within the recommended limits of American Society for Heating and Air-Conditioning Engineers (ASHRAE) (https://tc0909.ashraetcs.org/documents/ASHRAE_TC0909_Power_White_Paper_22_June_2016_REVISED.pdf) to reduce its power demand and energy consumption.
Traditionally, two techniques for cooling exist [26]: Computer Room Air Conditioners (CRAC) and Computer Room Air Handlers (CRAH). These two techniques were later improved with free cooling mode which exploits the outside air. Recently, hybrid cooling gained attention: To take advantage of the perfect specific heat capacity of liquid coolant (e.g., water) compared to air, liquid-based cooling technology is often combined with air-based ones. Numerous optimization methodologies were considered in literature which exploit the energy-efficient usage of the cooling systems [27,28,29].
This mechanism requires a data center to be empowered by different cooling technologies (e.g., air- and liquid-based, free cooling) so that different optimization techniques could be exercised. To this end, ASHRAE for IT equipment recommends the operating temperature of data centers to be between 15 °C and 40 °C [30]. By exploiting those ranges, it is possible to reduce the power demand of data centers significantly. To analyze and demonstrate the potential of temperature range alteration, models like the one proposed in the work by the authors of [31] are needed. It is argued that data center operators can save up to 4% of energy costs by increasing the temperature set-point by 0.5 °C. Google increased the temperature set-points of its data centers which led to reduced energy consumption.
This mechanism could be also used as a virtual energy storage system. In times where there is an excess of energy (e.g., from renewables), it is possible to decrease the operating temperature set point and hence cool down the entire data center. This creates a thermal buffer, which can later be used to reduce cooling power demand by turning it off until critical set-point reaches. As the reaction time of this mechanism highly depends on data center’s size and its internal architectural choices, it can take up to five minutes to cool down or heat up a given data center. The main advantage of this mechanism is the fact that it can be used without having any impact on the underlying SLAs.

2.3. Uninterrupted Power Supply

Conventionally, uninterrupted power supply units (UPS) are used by data center’s IT infrastructure to cope with blackouts or power grid failures. Thus, most data centers are equipped with such units capable of feeding power to their ICT resources until either external sources of electricity are made available or the local diesel generator takes over and provides power.
Despite the above-mentioned traditional purpose of UPS, it could also be used to supply temporary power (e.g., between 5 and 10 min) to an entire data center. Additionally, UPS may be used as an energy storage system where its battery can be charged with the excess of energy from renewables.
The applicability of this mechanism in practice necessitates that the UPS to be controllable by the energy management system of the data center. More precisely, such a system sends control signals to the UPS for setting the most suitable operation mode. Also, battery capacity degradation models are required to capture the extra impact of charging/discharging the battery outside of its normal operation modes.
This mechanism reduces the peak power demand of data centers and in certain cases it allows a data center to be completely disconnected from the grid for short periods of time. The reaction time is instantaneous however its applicability is highly dependent on the capacity, actual state of charge and health status of the battery. Like the previous mechanism, this one has the advantage that SLAs are not impacted if such a mechanism is implemented.

3. Flexible Contracts

As illustrated in Section 2, there are flexibility providing mechanisms in data centers that have an impact on SLAs. The need for loosening the stringent constraints of SLAs for the purpose of reducing energy consumption and peak power demand necessitated drastic fundamental changes. Flexible contracts both from service level and supply-demand perspectives were proposed in the literature which are the topic of the coming sections respectively.

3.1. Green Service Level Agreement

Customers of data centers play an essential role in “Green IT” by being flexible themselves and accepting the degradation of the agreed upon quality of their running services during specific periods of time. SLAs traditionally specify the amount of quality of service guarantees that data centers commit to their customers in terms of reliability, availability, performance, etc. of their services. Recently, as an alternative, a novel Green SLA concept was introduced that provides additional flexibilities and has shown its high potential in supporting the “Green IT” initiatives [32].
The main idea behind Green SLA is that customers may not always need all the guaranteed commitments of the traditional rigid SLA. Hence, they could agree to its degradation during demand-response (e.g., peak power demand) periods. For instance, a Green SLA can be represented as: high performance during weekdays between 8 AM and 6 PM and medium performance for other times of the day as well as during weekends. This concept can be realized by well defined incentives that require data centers to reward their flexible customers through monetary discounts. Reward and penalty schemes need to be specified that grant monetary rewards/discounts to customers based on their provided flexibilities, and apply penalties in case any of the agreed terms of Green SLA is breached.

3.2. Green Supply-Demand Agreement

Green SLA is only one part of the chain covering the interaction between data center and its customers. The other part of the chain comprises the data center and the power grid (e.g., distribution system), and this interaction requires Green SDA. Briefly, what lacks in the conventional tariffs between distribution system of the grid and its customers is the notion of flexibility. In this case, large power consumers like data centers sign a yearly contract with the distribution system operator (DSO). Such a contract specifies a power charge varying with the maximum power required in the billing period, a fixed basic fee for the infrastructure utilization, and an energy cost for each consumed kWh regardless of the operational state of the power grid. Such stringent constraints at the contractual level are not appropriate for demand-side management.
Hence, Green Supply-Demand Agreement (Green SDA) was proposed to replace the legacy energy contracts [33]. It determines the constraints (e.g., contractual terms) under which the supply-side entity (e.g., DSO) could request power adaption collaboration from its consumers (e.g., data centers). The concept of Green SDA is generic and can be applied to any industry. For the use case of data centers, it is highly dependent on specific flexibility providing mechanisms (see Section 2). Similar to Green SLA, reward and penalty schemes need to be specified, that penalize the entities that breach the contractual terms of Green SDA and reward the flexibility providing ones. The amount of monetary rewards provisioned to data centers from DSOs is the starting amount of the monetary rewards for the customers of data centers. This can be considered as a chain of incentives.
The proposed contractual terms of Green SDA, which are on a monthly basis, can be found in [33]. Among others, these terms contain the amount of minimum and maximum power the demand-side (e.g., data centers) can adapt for a specified period of time. Also, it specifies the number of consecutive requests the supply-side (e.g., DSO) is entitled to send to the demand-side, and the number of times the latter can reject a request.

4. Energy and Demand Management in Data Centers

In this section, we present the methodological foundations of systems—we call those “EMS” in this paper—for the management of data centers’ power demand and energy consumption. As mentioned in Section 1, there are two different aspects that data center operators are interested in to diminish the operational expenditure (Opex):
  • Minimization of the overall energy consumption of data centers,
  • Reduction of peak power demand necessary for the participation in demand-response schemes, thus achieving demand-side management.
We describe the objectives of each of the above mentioned aspect and present the adopted methodological building blocks.

4.1. Energy Consumption Minimization

We first describe the problem statement, demonstrate the adopted methodology and then present the corresponding metrics.

4.1.1. Problem Statement

The main goal is to reduce the local energy consumption of data centers. This is achieved without the need for any orchestration with outside entities (e.g., DSO). Reduction of the entire data center’s energy consumption is attractive to its operator as it reduces total cost of ownership (TCO) through energy savings.
There are two different ways in implementing energy management locally: static and dynamic. Static (i.e., long-term) management deals with improving the entire data center’s energy efficiency. This consists of investments in extremely energy-efficient ICT resources, which minimize the energy consumption drastically while at the same time achieve the same performance as traditional hardware. Static energy management necessitates careful capacity planning and anticipating peak load as well as growth, while at the same time avoiding overprovisioning. In contrast, dynamic energy management—is the approach that this paper is considering—copes with adaptively optimizing operating parameters such as workload and temperature set-points of the cooling system, and hence improves energy efficiency during run-time of services. The amount of optimization is technically limited by ICT equipment and the SLA of running services (see Section 2).

4.1.2. Methodology

Figure 1 presents the architectural overview of an EMS specialized in locally reducing the overall energy consumption of a given data center. The “Orchestrator” component is the intermediate interface, which has the role of enacting the optimal decisions (e.g., turn on/off ICT resources) found by the “energy optimizer” into the corresponding ICT infrastructure of data centers. For this purpose, this component should be agnostic to the automation frameworks used by different data centers. Being agnostic to such frameworks helps in generalizing the concepts and methodologies so that the same generic mechanisms can be applied to different data centers types: cloud, super or traditional computing. Agnosticism can be achieved by developing customized connectors—the details are out of the scope of this paper. The “energy optimizer” component finds an optimal solution to the following situation.
  • Given a set of ICT equipment (e.g., servers) each having its properties in terms of energy-efficiency,
  • Given a set of services (e.g., applications) running on different ICT resources where each such service has its own quality related requirements determined by SLAs.
Details about the “energy optimizer” component can be found in the work by the authors of [34] and its implementation is available in github (https://github.com/Plug4Green/Plug4Green). Briefly, it identifies the minimum number of ICT equipment (e.g., servers) needed for those services to run such that no SLA is violated. Consequently, the main goals of the “energy optimizer” are as follows.
  • Consolidate as many services as possible onto minimal number of resources so that no SLA is breached. Also, in choosing those resources, the priority is given to most energy-efficient ones.
  • Shutdown unused or idle resources to save energy consumption.
To achieve those goals, the “energy optimizer” needs power demand predictions of the underlying ICT infrastructure of data centers. Hence, before finding the corresponding optimal solution(s), “energy optimizer” consults (e.g., sequence number 1) the “power demand predictor”. As its name indicates, the main goal of this component is to estimate the power demand of the ICT resources under different workload conditions. To this end, schemes based on standard ontology were proposed [35,36]. Those schemes provide detailed description of ICT resources of a data center by identifying the most relevant energy related parameters. Based on the proposed schemes, estimation models for the “power demand predictor” were developed by the authors of [18,35,37]. To obtain dynamic information (e.g., utilization of a specific server) from the monitoring system of the infrastructure, the “power demand predictor” sends a request to the “Orchestrator” and receives back a reply (e.g., sequence numbers 2 and 3, respectively). After having both dynamic and static parameters, the “power demand predictor” based on its models computes the power predictions and sends those to the “energy optimizer” (e.g., sequence number 4). Finally, after calculating the optimal decision(s), the “energy optimizer” enacts a list of actions (e.g., turn on/off a specific server, migrate a workload) to the “Orchestrator” (e.g., sequence number 5) so that the underlying infrastructure is reconfigured optimally and receives back a feedback from the infrastructure (e.g., sequence number 6). Note that this EMS can be run either periodically autonomously (e.g., every hour) or on-demand by the data center operator.
To achieve further optimization and reduction of energy, the case of federating different data centers is considered. To this regard, the “Orchestrator” component of each data center needs to communicate with its counterpart of the other data centers. Such a communication between the data centres is necessary to find a global optimized solution. The basic concept is to shift the workload through virtual machine migration of the running services from least energy-efficient data center to the most efficient one(s). The EMS takes the decision to migrate virtual machines from one data center to another by considering (1) the cost of migration in terms of energy and downtime periods, (2) the corresponding network’s bandwidth, and (3) the Power Usage Effectiveness (PUE) [38] of the data center to which virtual machines will be migrated.

4.1.3. Metrics

Without proper metrics in place, it is difficult to determine the effectiveness of changes made by EMS to improve data center’s energy efficiency. Several metrics were suggested to evaluate and qualify the energy efficiency within data centers. Among those, power usage effectiveness (PUE) and data center infrastructure efficiency (DCiE) proposed by Green Grid [38] have been the most prominent metrics so far. PUE describes the ratio of total power demand in a data center to the power usage of its IT resources and has an optimal value of 1 (i.e., nearly all of the power is used for computing). For instance, a PUE of 2 indicates that for every watt of IT power, an additional watt is consumed to cool and distribute power to the IT equipment. This additional overhead is desirable to be eliminated since data center operators at the end of each month pay for the total energy consumed by the data center, and not only by its IT resources. Reducing this overhead will lower the Opex (operational expenditure) of the data center.
The major drawback of PUE is the fact that decreasing the overall energy usage in the data center may result in a higher value for PUE. As a matter of fact, it must be used with care and understood that IT changes can have a dramatic impact on PUE. DCiE characterizes data center efficiency by reversing the values of PUE: ratio of total power demand of IT to the total power usage of the data center. The main difference between the two metrics is that DCiE is expressed as a percentage rather than a number greater than 1, where higher percentages indicate more energy-efficient data centers. To the best of our knowledge, it is best practice to analyze both metrics and use the generated spectrum to determine whether or not the EMS provided energy optimization.

4.2. Peak Power Demand Reduction

We first describe the problem statement, demonstrate the adopted methodology and then present the corresponding metrics.

4.2.1. Problem Statement

Unlike management to minimize energy consumption (see Section 4.1), management to reduce peak power demand requires a coordinated approach between different stakeholders: DSO(s), data center(s), and their customers. Thus, information exchange with a central entity governing the grid (e.g., DSO) is required to implement demand-side management. Such a DSO has access to current and predicted information regarding generation and demand in the power grid. This can lead to anticipating signals sent during peak power demand periods to reduce the corresponding demand for a specific duration (e.g., usually not more than 5 min).
In this aspect, the main objective of data centers is to react quickly to DSO’s signals by reducing peak power demand. This requires flexibility mechanisms (see Section 2) which can have an impact on the SLAs of the customers; thus the need for flexible contracts introduced in Section 3. From the aforementioned scenario, the chain of provisioned incentives starts at the DSO side (e.g., by reducing additional costs of paying to the larger energy utilities) and propagates to the other entities (e.g., data centers and their customers) of the ecosystem respectively.

4.2.2. Methodology

Figure 2 gives a generic overview of an EMS for reducing peak power demand of data centers that are willing to participate in demand-response schemes with DSOs. Such an EMS needs to be composed of two management subsystems: one local for data centers and another collaborative between DSO and data centers. The local management subsystem of EMS plays essentially the same role as the one presented in Section 4.1. Its main objective is to reduce the energy consumption of the ICT equipment (e.g., workload shifting/migration) as well as to exploit the additional power saving mechanisms such as cooling system and UPS (see Section 2.2 and Section 2.3). Green SLAs (see Section 3.1) coupled with well-defined reward and penalty schemes need to be specified.
The collaborative subsystem of EMS deals with power adaption collaboration between the DSO and data centers through the implementation of Green SDAs (see Section 3.2), coupled with reward and penalty schemes. For this collaboration to function properly, both bidirectional communication as well as data center allocation policies need to be enabled. Two-way communication is required to send/receive relevant information to/from the DSO and data center before or during demand-response periods. For this purpose, OpenADR was proposed as a standard communication protocol for implementing automated demand-response [39]. Data center allocation policies define specific rules (e.g., game theory-based) in ordering and selecting a set of data centers participating in demand-response schemes. The selection process is based on each data center’s Green SDA (see Section 3.2) implementation. Different allocation policies were studied and proposed, where it was shown through simulations that the “fair” approach shares evenly the burden of power adaption collaboration among the different participating data centers [40].

4.2.3. Metrics

Metrics to evaluate the effectiveness of changes made by the EMS for reducing peak power demand (e.g., demand-response scheme) are not trivial, because many stakeholders are involved in the ecosystem. Thus, the provisioning of one single metric to represent the concerns of DSO, data centers and their customers at the same does not seem realistic.
From the point of view of DSO, demand-response schemes are appealing to reduce (1) extra costs of infrastructure expansion to keep the grid stable and (2) additional costs for exceeding the agreed power cap. Therefore, a metric that reflects the amount of anticipated monetary investments is needed based on incentives created by Green SDA.
From data center perspective, two metrics were proposed to evaluate the amount of renewables of the energy sources: green energy coefficient (GEC) and green power usage effectiveness (GPUE). GEC is proposed by Green Grid, and is used to illustrate the amount of facility energy use provided by renewables. It is the ratio of the amount of green energy purchased or consumed to the total energy consumption. GPUE is an extension of PUE to compute the greenness of data centers and is computed by taking into account the percentage of energy source with some weighing factor together with PUE x where x is a value between 0–3 [41].
From data centers customers’ point of view, the most eminent metric related to Green SLA is how satisfied the customers stay with the degraded quality of the services and this can be captured by the well-known metric of quality of experience (QoE) [42]. The QoE metric was first defined in 2013 within the context of the COST Action QUALINET (http://www.qualinet.eu/): “The degree of delight or annoyance of the user of an application or service. It results from the fulfillment of his or her expectations with respect to the utility and/or enjoyment of the application or service in the light of the user’s personality and current state.”

5. Evaluation

We present the obtained results of the experimental analysis for a proof-of-concept carried out at Hewlett Packard Enterprise (HPE) cloud computing lab in Italy. The analysis covers the implementation of the presented two energy management systems (EMS) of Section 4.1 and Section 4.2, respectively.

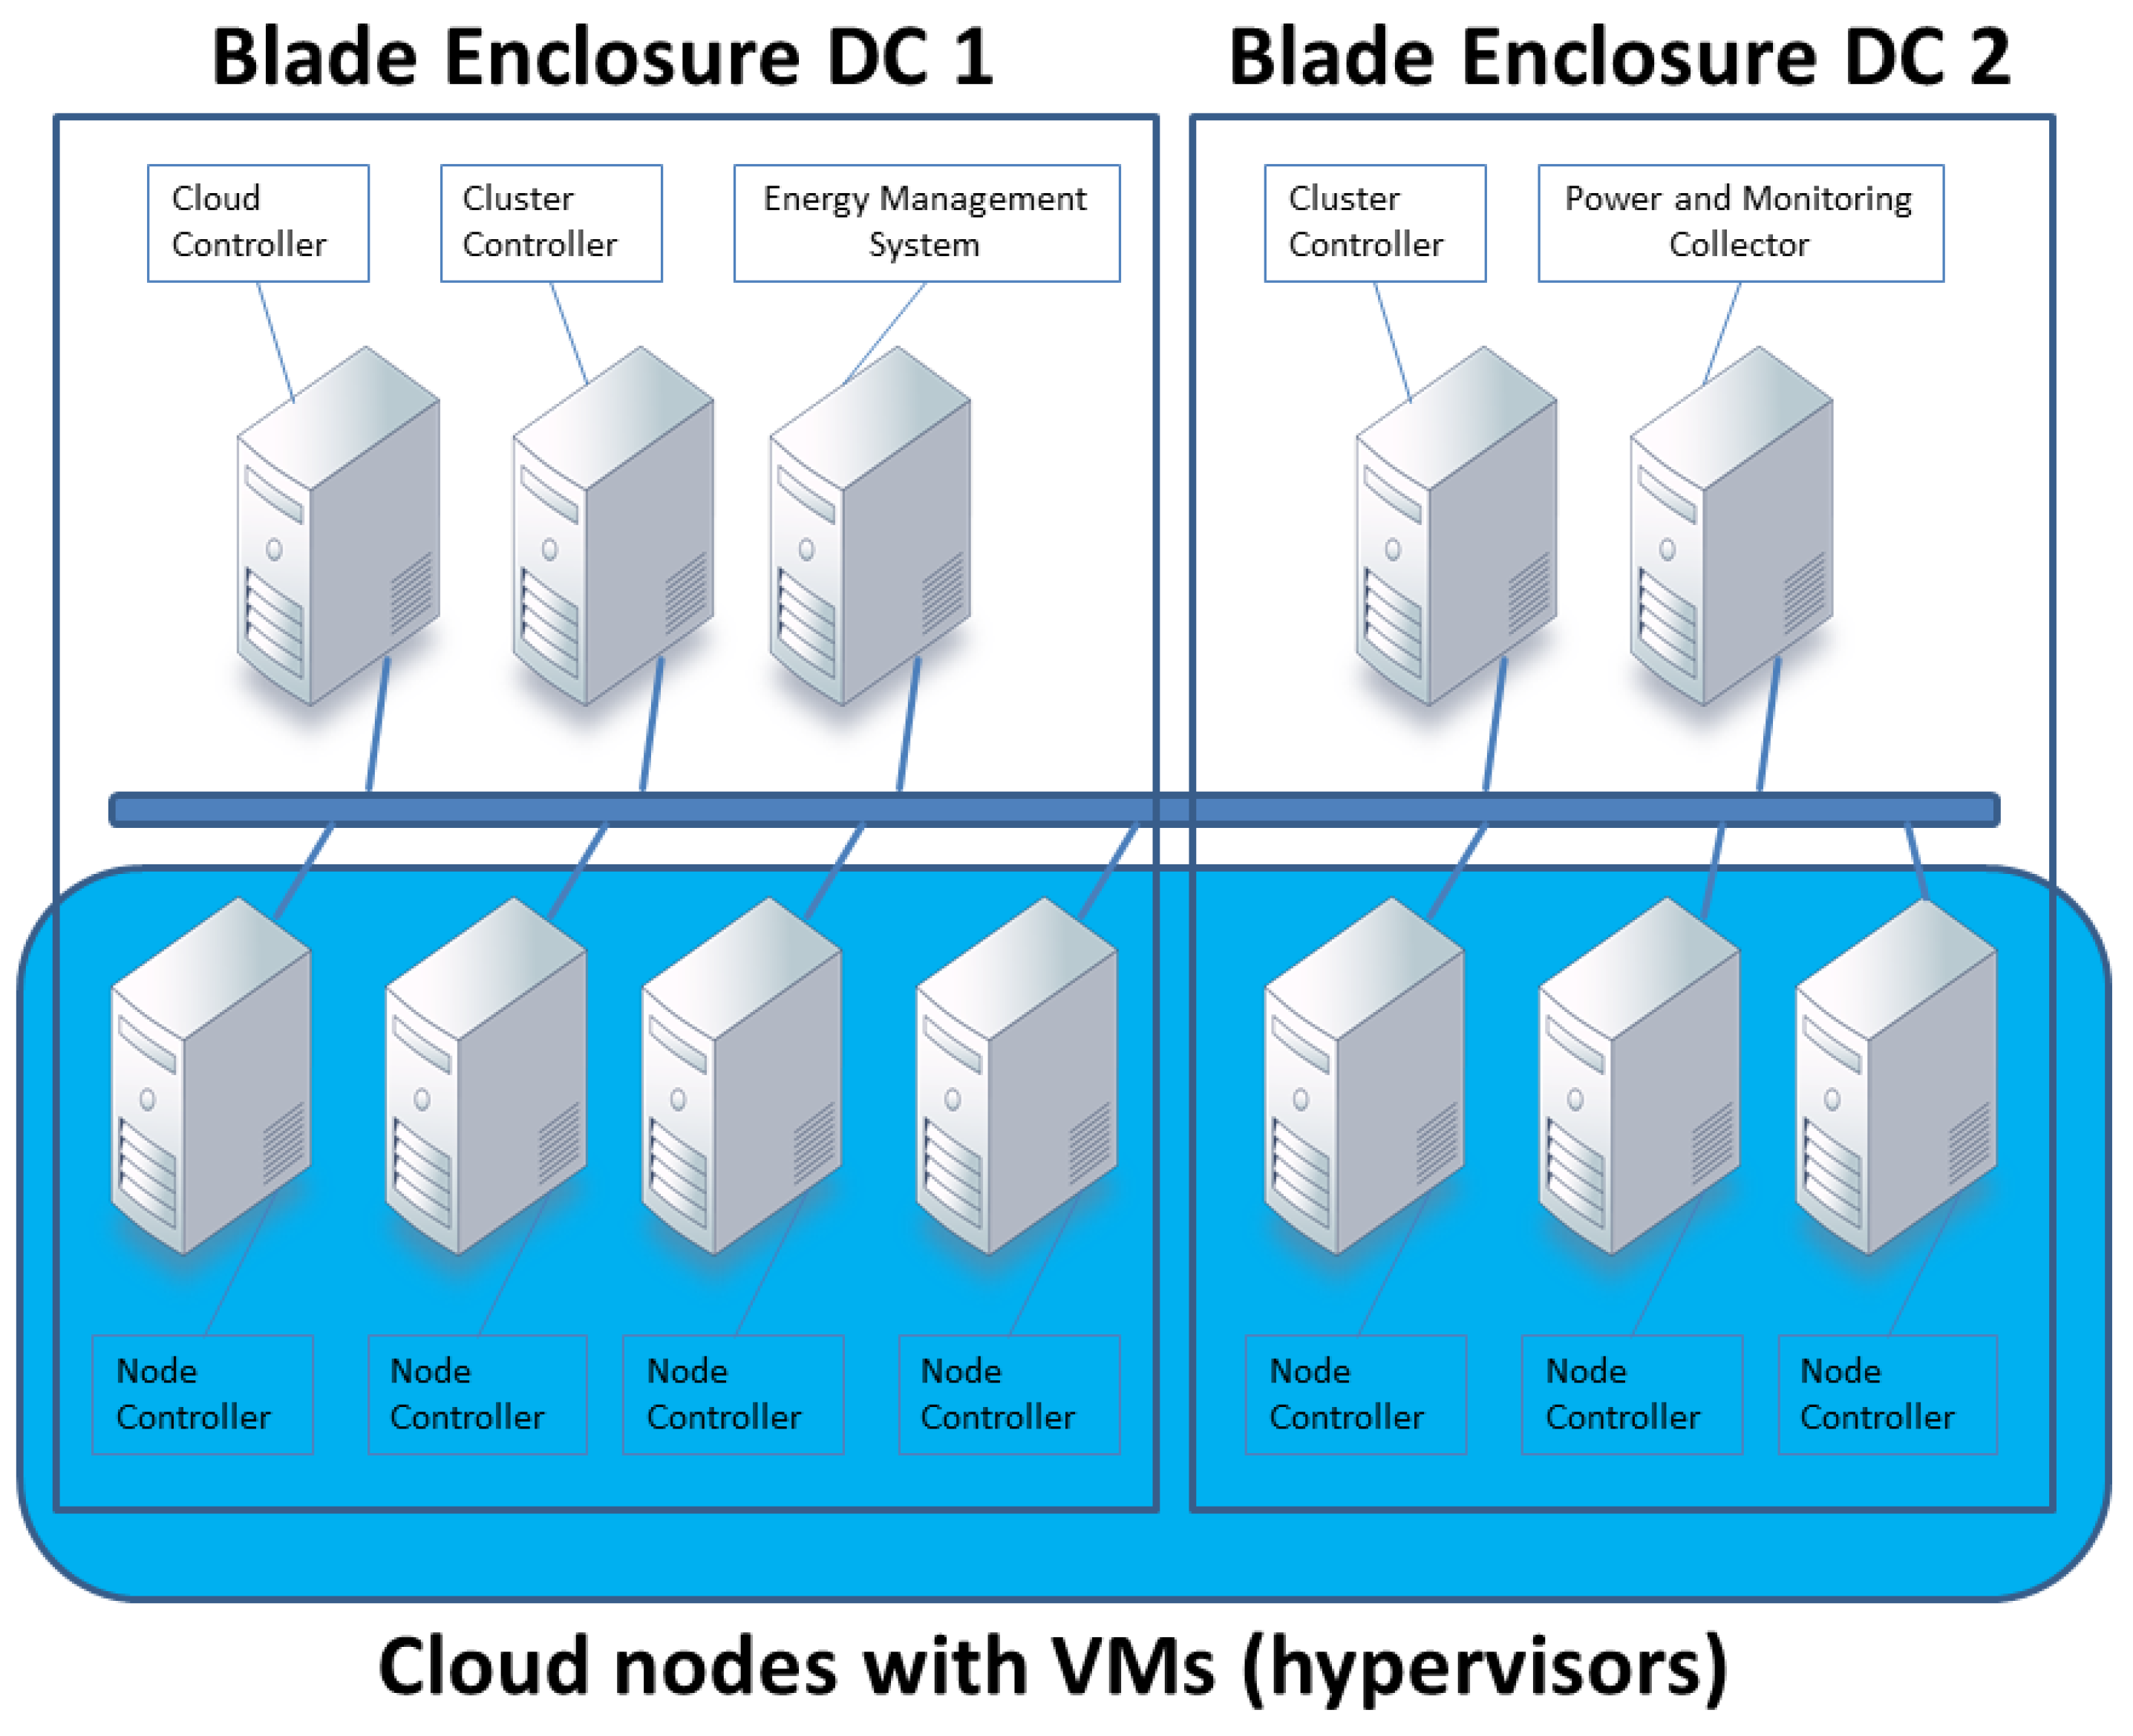
5.1. Setup Environment and Configuration

The considered lab-grade infrastructure fully resembled, though in a smaller scale, both the configuration and functional capabilities of an actual production-grade cloud computing data center. The setup configuration also considers the federated test cases by spanning two data centers geographically dispersed by 1 km from each other.

5.1.1. Hardware Configuration

The ICT infrastructure consisted of blade servers (equivalent Industry Standard Server) belonging to HPE ProLiant BL460c G6 (http://h10010.www1.hp.com/wwpc/us/en/sm/WF25a/3709945-3709945-3328410-241641-3328419-3884098.html) series configured as in Table 1. Those servers were mounted inside HPE Blade System C3000 enclosures (http://h18000.www1.hp.com/products/blades/components/enclosures/c-class/c3000/?jumpid=reg_R1002_USEN). Enclosures of data centers 1 and 2 (DC 1 and DC 2 in Figure 3) bear seven- and five-blade servers, respectively.
iLO (Integrated Lights-Out) (http://h18013.www1.hp.com/products/servers/management/ilo_table.html?jumpid=reg_R1002_USEN) was used for energy measurement. It can read real-time power demand down to single server level on a minute resolution, where peak and average power values were stored.

5.1.2. Software Configuration

Figure 3 demonstrates software configuration of the considered system. The Cloud Controller software, which acts as an automation framework, is deployed on a physical server. The cloud management system is an implementation of OpenStack platform (http://www.openstack.org).
The Node Controller software provides virtualization technology to cloud platform clients and runs itself on physical servers, on which virtual machines are created and instantiated. The Power and Monitoring Collector software, which is deployed on a physical server, is a customized version of collectd: an open source Linux daemon able to gather, exchange and save performance related information. The Energy Management System software, which is deployed on a dedicated physical server, is an EMS implementing the specific energy-aware aspect of Section 4.1 and Section 4.2. The simulated workload of the clients was deployed on virtual machines running an Ubuntu image. Details about this workload are given next.

5.2. Workload Description

HPE is constantly involved with real customers in cloud computing projects. For experimental purposes, like the one in this paper, a custom auditing system was implemented at the premises of those customers. This system captured and stored a detailed log of the transactions occurring among the end users, including all system parameters.
Once the specific project is closed, all stored logs were examined carefully and corresponding profiles of different usage patterns were identified. The profiles were chosen in such a way that they sufficiently presented dynamic changes in context, while spanning different time-frames (e.g., weekend, workdays) and utilization. To emulate the workload pattern, a custom workload generator tool was developed. This tool, which uses an open source scheduler (jobscheduler (http://sourceforge.net/projects/jobscheduler/)), generates a sequence of actions and directs them to the Cloud Controller.
Figure 4 depicts the overall number of parallel instances of running virtual machines for a typical Friday and Saturday. According to the statistical distribution of the identified usage profiles, the simulated workload had different sizes corresponding to the required virtual resources: small, medium and large. Furthermore, to model a different processing workload (e.g., constant low/medium/high utilization and fluctuations with numerous factors such as slope and period), numerous utilization patterns were created. Note that the workload pattern of Friday and Saturday in Figure 4 is representative of the workload pattern of a typical weekday and weekend, respectively.

5.3. Results

In this section, we present the results of the experiments carried out on the configured cloud computing data center by considering two different use cases of (1) minimizing energy consumption (kWh) and (2) reducing peak power demand (kW).

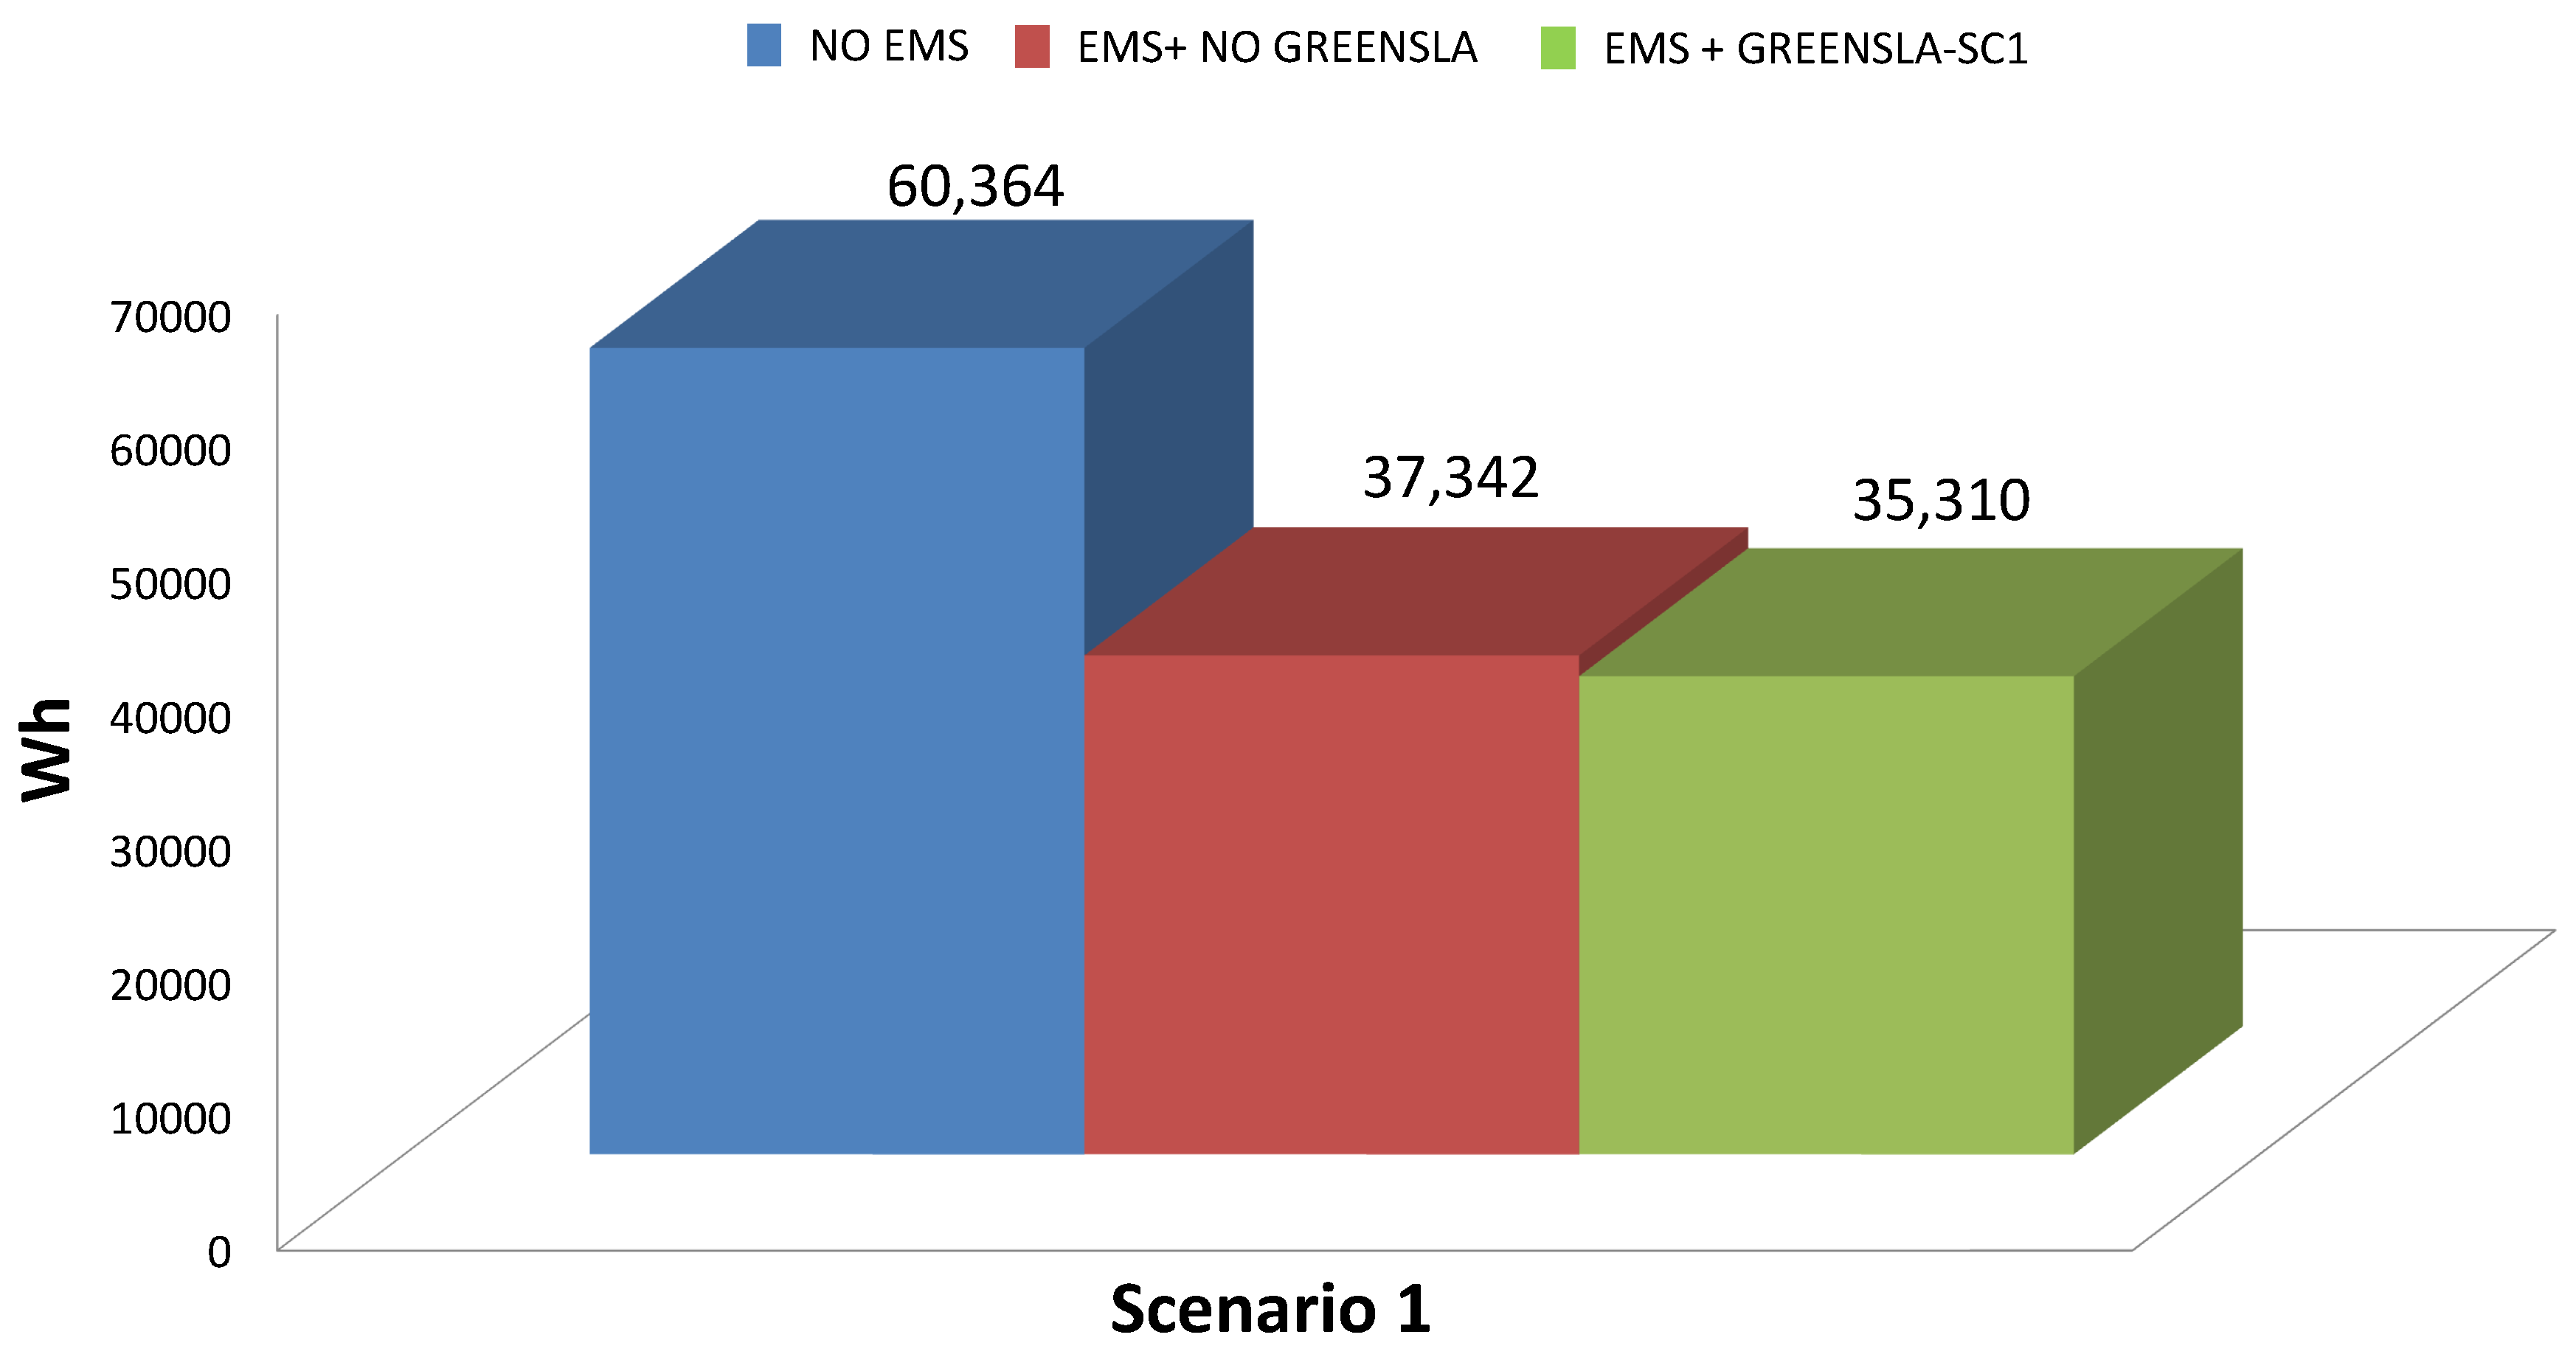
5.3.1. Energy Consumption Minimization

The results were obtained by analyzing the impact of EMS in saving energy consumption without breaching SLAs while running the workload of Section 5.2. The considered SLA is related to the performance of running virtual machines by taking into account the number of virtual CPU per physical core and is set to a ratio of 1.2.

Single Site Use Case

The experimental analysis for the single site use case was run on all nodes of the two enclosures (e.g., DC 1 and DC 2). The most challenging workload, from an energy-saving standpoint, was identified to be the one of the weekdays (see Friday in Figure 4). To reduce the test execution times, we compressed 24-h (e.g., full day) power profiles into 12-h ones, thus squeezing the execution time by half. Two scenarios were taken into account:
  • No energy management.
  • EMS is enabled where nodes can be turned on/off together with internode migration of virtual machines.
Table 2 shows the amount of savings that can be achieved by the EMS for the single site use case.

Federated Site Use Case

The experimental analysis for the federated site use case was run by considering two different data centers: DC 1 and DC 2. Like the previous use case, a typical weekday workload was simulated and run for 12 h. In this use case, the following two scenarios were taken into account.
  • No energy management.
  • EMS is enabled where optimization takes into account turning on/off nodes, internode migration of virtual machines as well as migration of virtual machines to the most energy-efficient data center using its PUE.
For this specific test, DC 1 and DC 2 were assigned a PUE of 1.5 and 2.5, respectively. Table 3 illustrates the added value of data centers’ federation.
We went one step further and analyzed the impact of relaxing the considered SLA on energy savings. The reason for this is to address the added value of considering Green SLA in energy savings. To this end, four cases of different vCPU/core ratio were configured whose values span from 1.2 to 2.5. Table 4 shows the excellent potential of Green SLAs in energy savings. More precisely, when we relax the constraint up to 2.5 vCPU/core, we get significant savings of almost 50%.

5.3.2. Peak Power Demand Reduction

Results were obtained by studying the EMS of Section 4.2 from data center and its customers perspective (e.g., Green SLAs). For this study, the following facts were considered.
  • The temperature set-point ranges were kept within those of ASHRAE recommendation for ICT equipment.
  • The considered workload of Section 5.2 was executed according to its Green SLA. SLA manager was used to validate the correctness of the implemented SLAs. This manager reported no SLA breaching, thus guaranteeing customers’ comfort and satisfaction.
In this case study, the considered Green SLA states the following.
  • High: 100% guaranteed performance during weekdays between 9:00 AM and 8:00 PM. Note that performance is measured as percentage of ECU (Amazon WS EC2 Compute Unit) where 1 ECU is the equivalent CPU capacity of a 1.0–1.2 GHz 2007 Opteron or 2007 Xeon processor.
  • Medium: 80% of performance during weekdays between 12:00 AM and 9:00 AM and 8:00 PM and 12:00 AM.
  • During weekends, the performance is Medium.
To cover several possibilities, we set up three scenarios: baseline and demand-response with and without federation.

Baseline Scenario

This scenario tackles the typical workload pattern of Friday-Saturday (see Figure 4). The main objective of this scenario is to demonstrate the potential of Green SLA with respect to normal SLA without shifting any workload and confirm the results that were obtained at the end of Section 5.3.1. To this end, three different cases are considered: (1) without any EMS and no Green SLAs (NO EMS), (2) with an EMS however still with no Green SLAs (EMS+NO GREENSLA), and (3) with an EMS as well as Green SLAs (EMS+GREENSLA–SC1). Note that the EMS part of the data center side (see Figure 2) has the same objectives as the ones in Section 5.3.1: (1) workload consolidation on minimal number and most energy-efficient ICT equipment, (2) shutting down unused resources, and (3) starting them again when the workload grows.
Figure 5 illustrates the obtained results (averaged) of several 2-day experiments. The time of the day, starting from Friday at 12 AM and ending up on Sunday at 12 AM, is given on the X-axis, whereas the power demand (in Watt) of the seven hypervisor nodes (the lower nodes in the blue region of Figure 3) is presented on the Y-axis. Figure 6 gives the results of the conducted 2-day experiments expressed in consumed energy (Wh). Thanks to the introduction of EMS, there is energy reduction of approximately 38% compared to the no energy management configuration. With the addition of Green SLA to the configuration, this contributed to further savings of 5.5% compared to the configuration with EMS (e.g., standard SLAs). This is achieved because of the extra flexibility that the Green SLA provided. The difference is graphically visible in Figure 5, where the green line drops during weekends and nights. Note that, in Figure 5, on Friday between 4 PM and 6 PM, the peak demand of 1450 Watt was not reduced when EMS is considered (e.g., green and red lines). This is due to the fact that during that period the data center exhibits the highest workload in terms of instances of VMs (see Figure 4). Consequently, no consolidation and turning off idle machines were possible, which hinder any further optimization with respect to the case when no EMS (e.g., blue line) is considered.

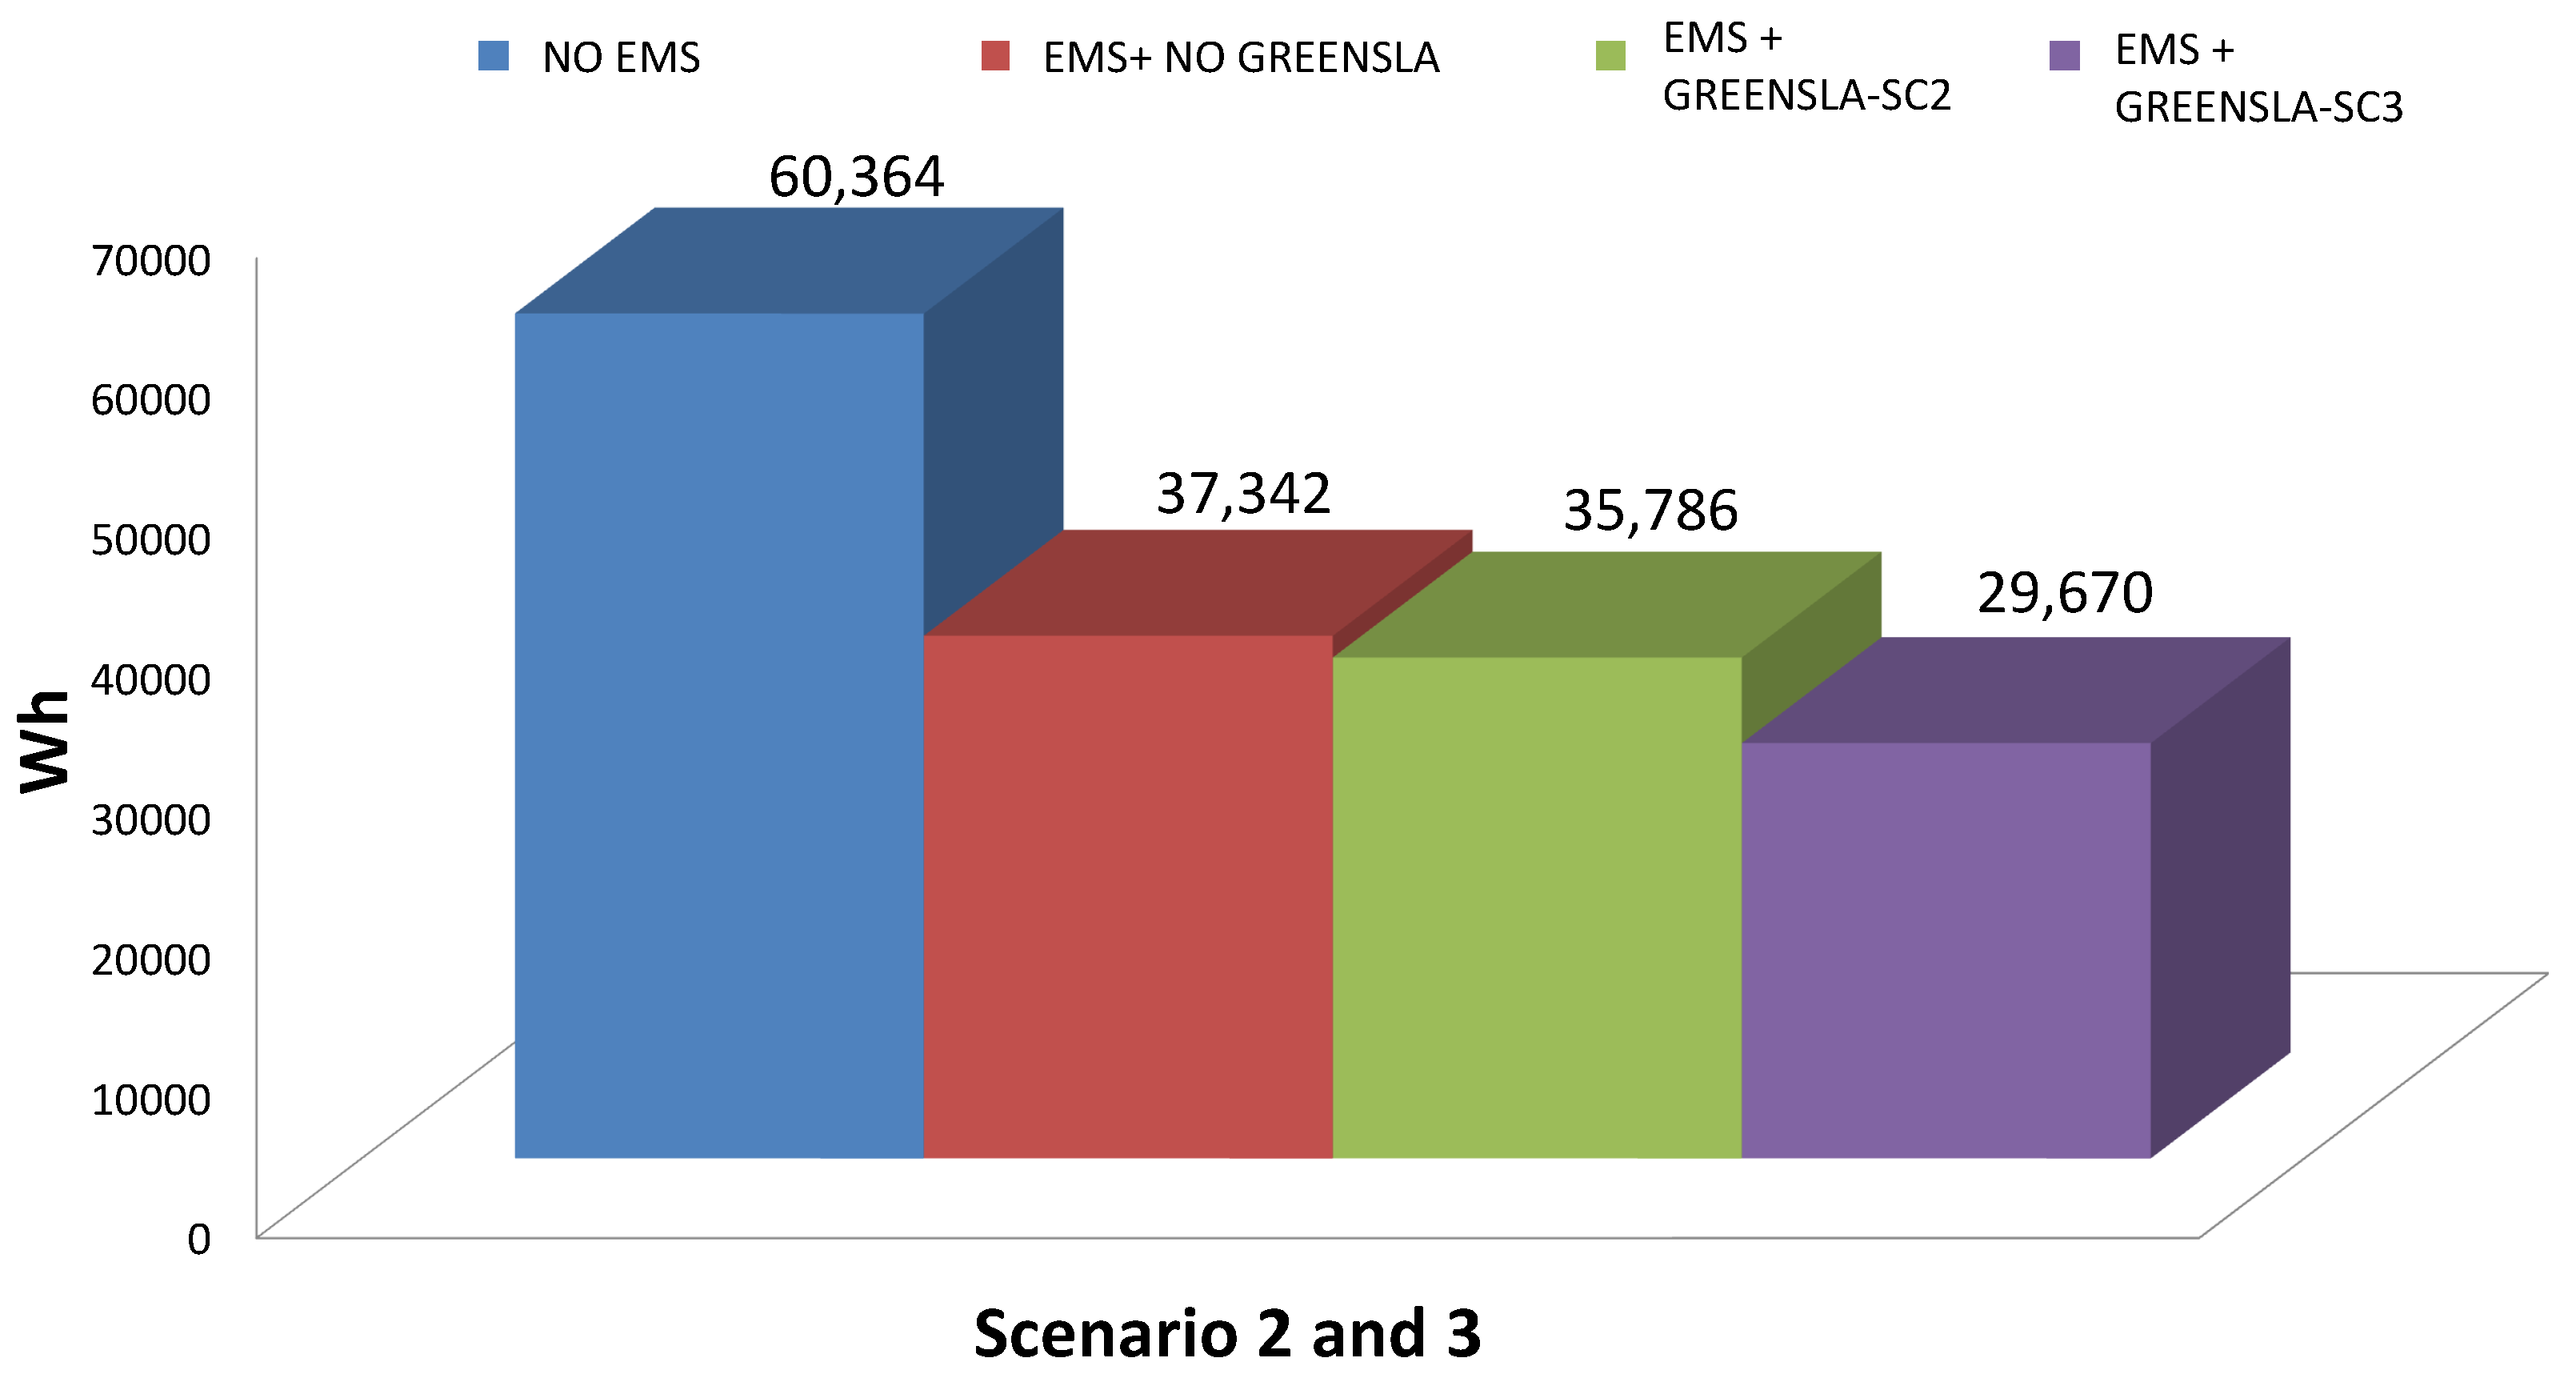
Demand-Response with and without Federation Scenarios

In the coming two scenarios, we consider the fact that there is a demand-response request sent by distribution system (e.g., DSO) to a data center at approximately 9:30 AM for a duration of 2 h. This necessitates the data center to change from high performance to power-saving mode thanks to the additional flexibilities provided by extended Green SLAs. Thus, flexible workload is delayed which results in shifting the corresponding power demand.
Figure 7 shows the obtained results (averaged) of several 2-day experiments. Both the X- and Y-axes have the same units as in Figure 5. The gray vertical bars represent the time (e.g., 2 h) during which the data center executes power saving optimization. In these scenarios, NO EMS and EMS+NO GREENSLA denote the same policy as in Figure 5. The third line shows the energy management with Green SLA and a nonfederated configuration (EMS+GREENSLA–SC2), while the fourth line is the federated (By federation, we mean migration of the workload (in this case virtual machines) to a more energy-efficient data center.) configuration (EMS+GREENSLA–SC3). The following can be noticed from the results of Figure 7.
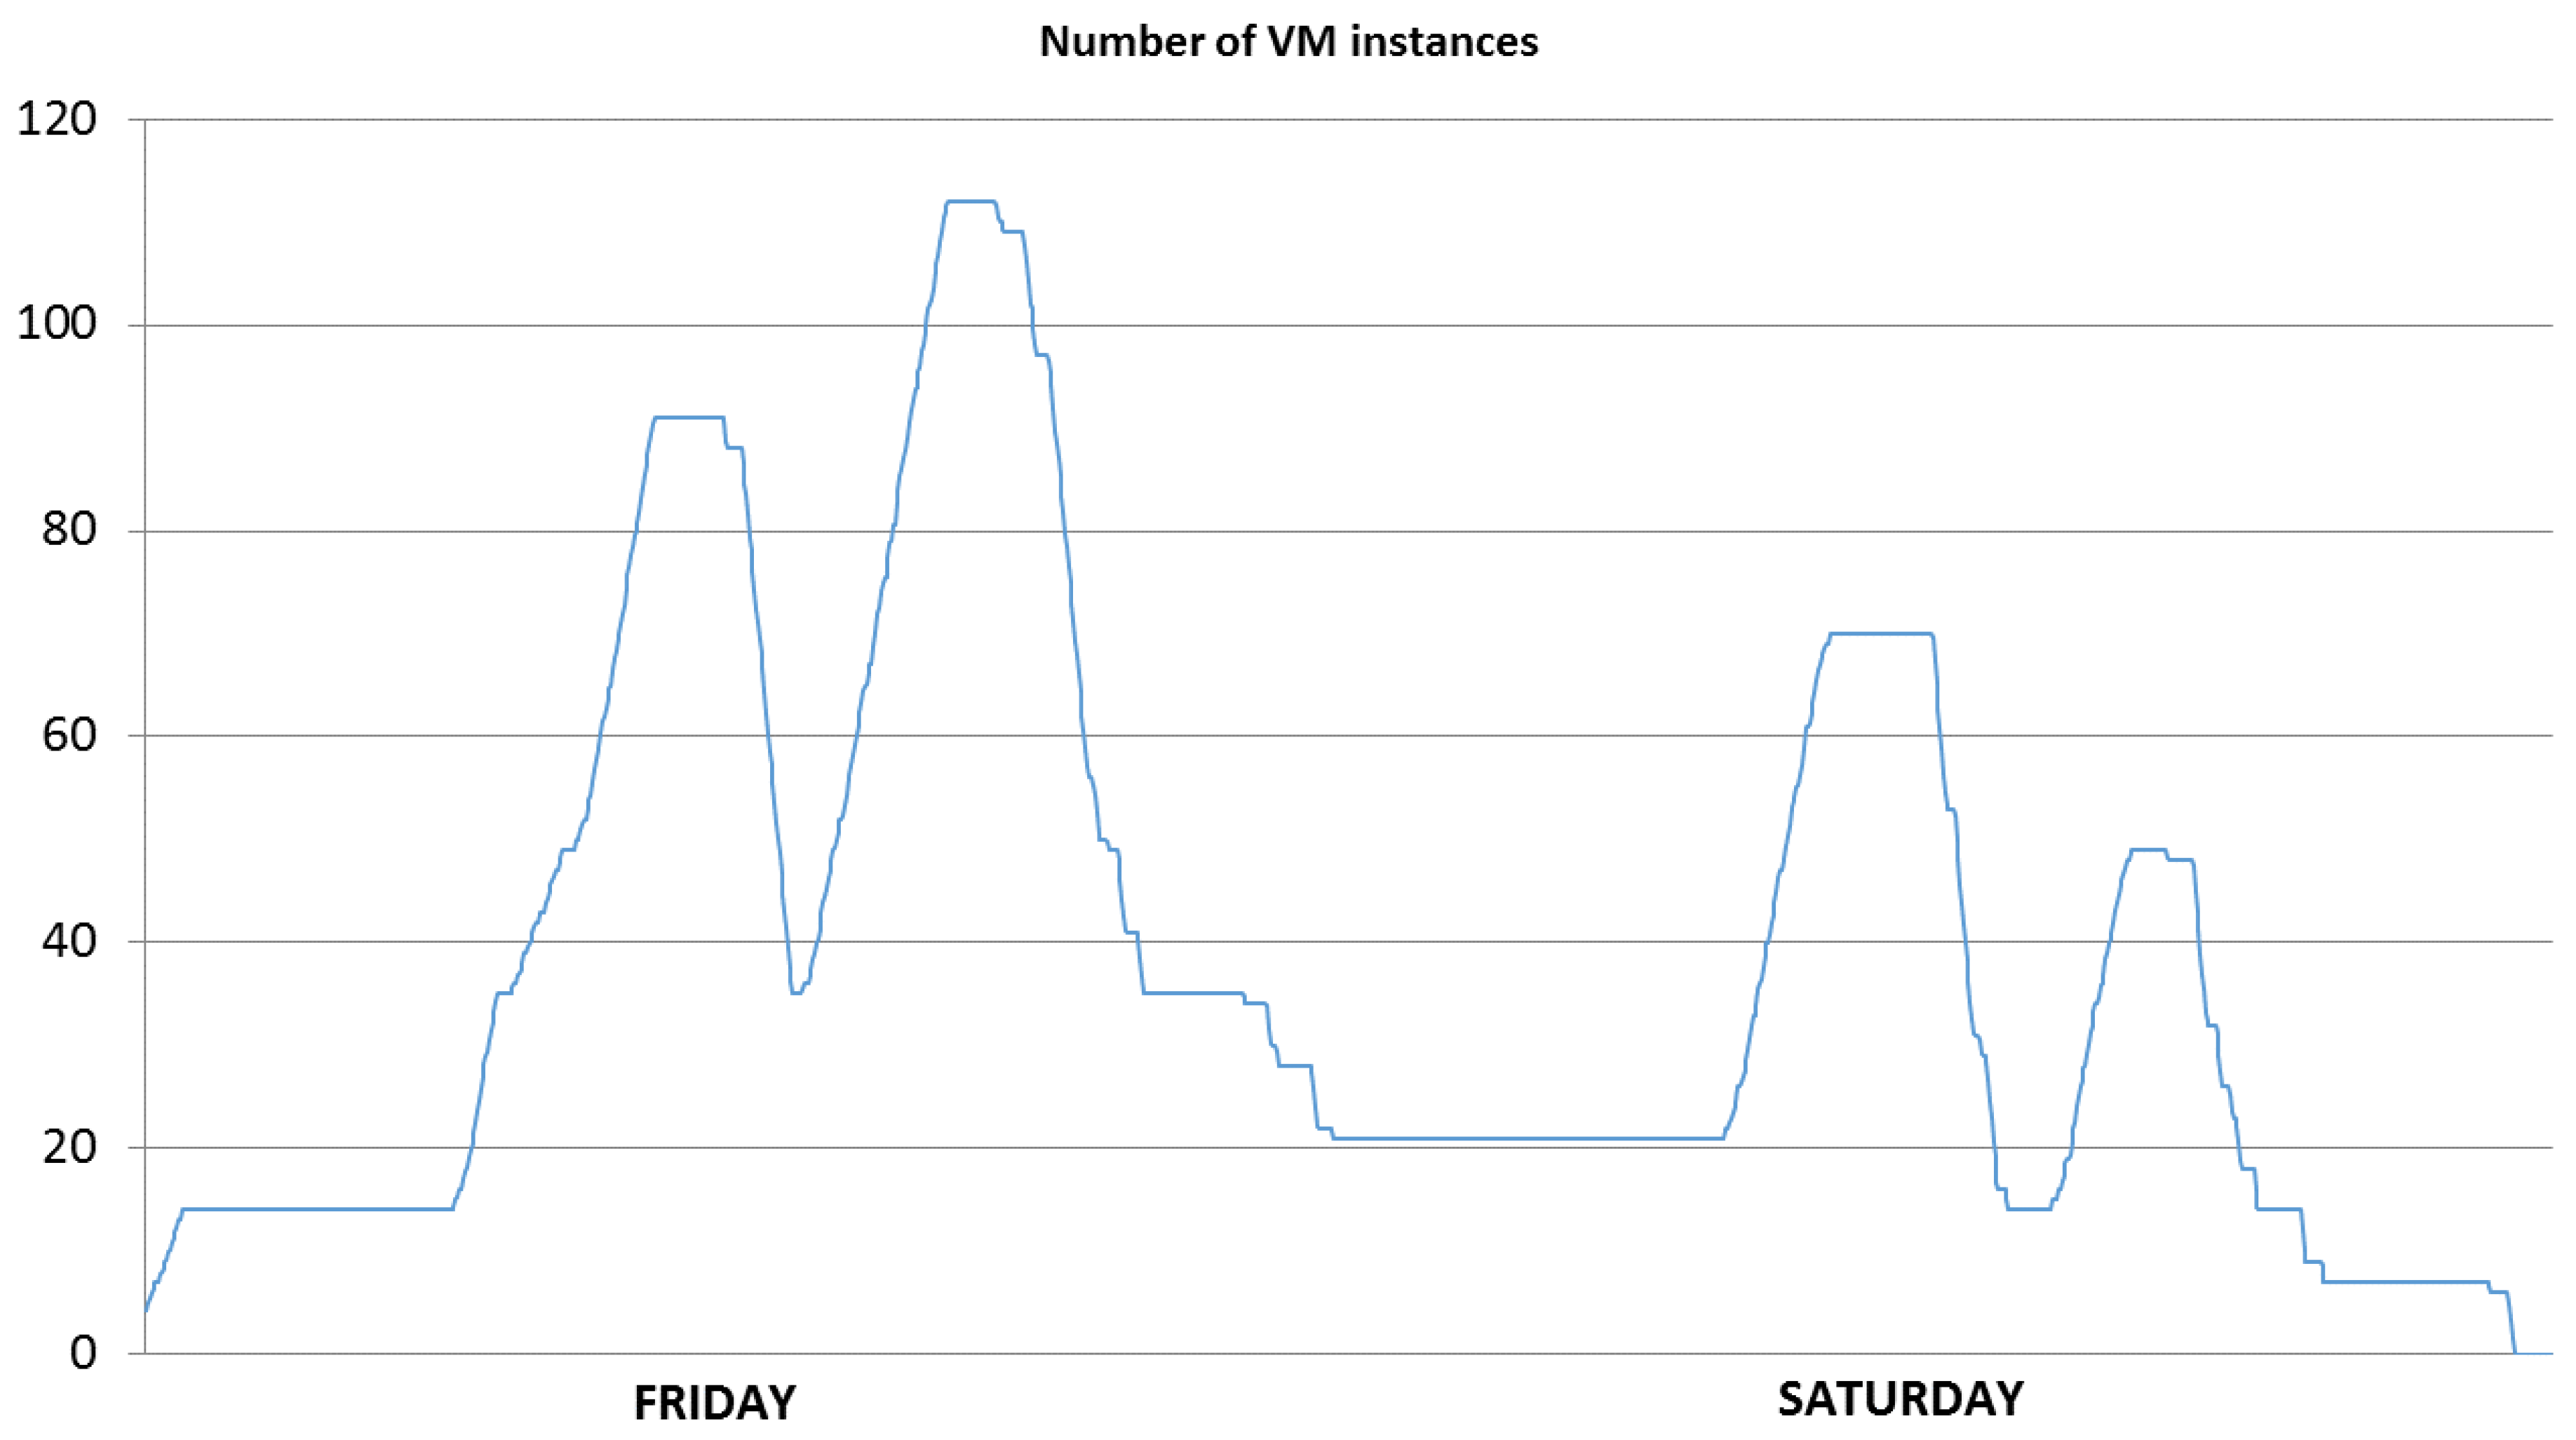
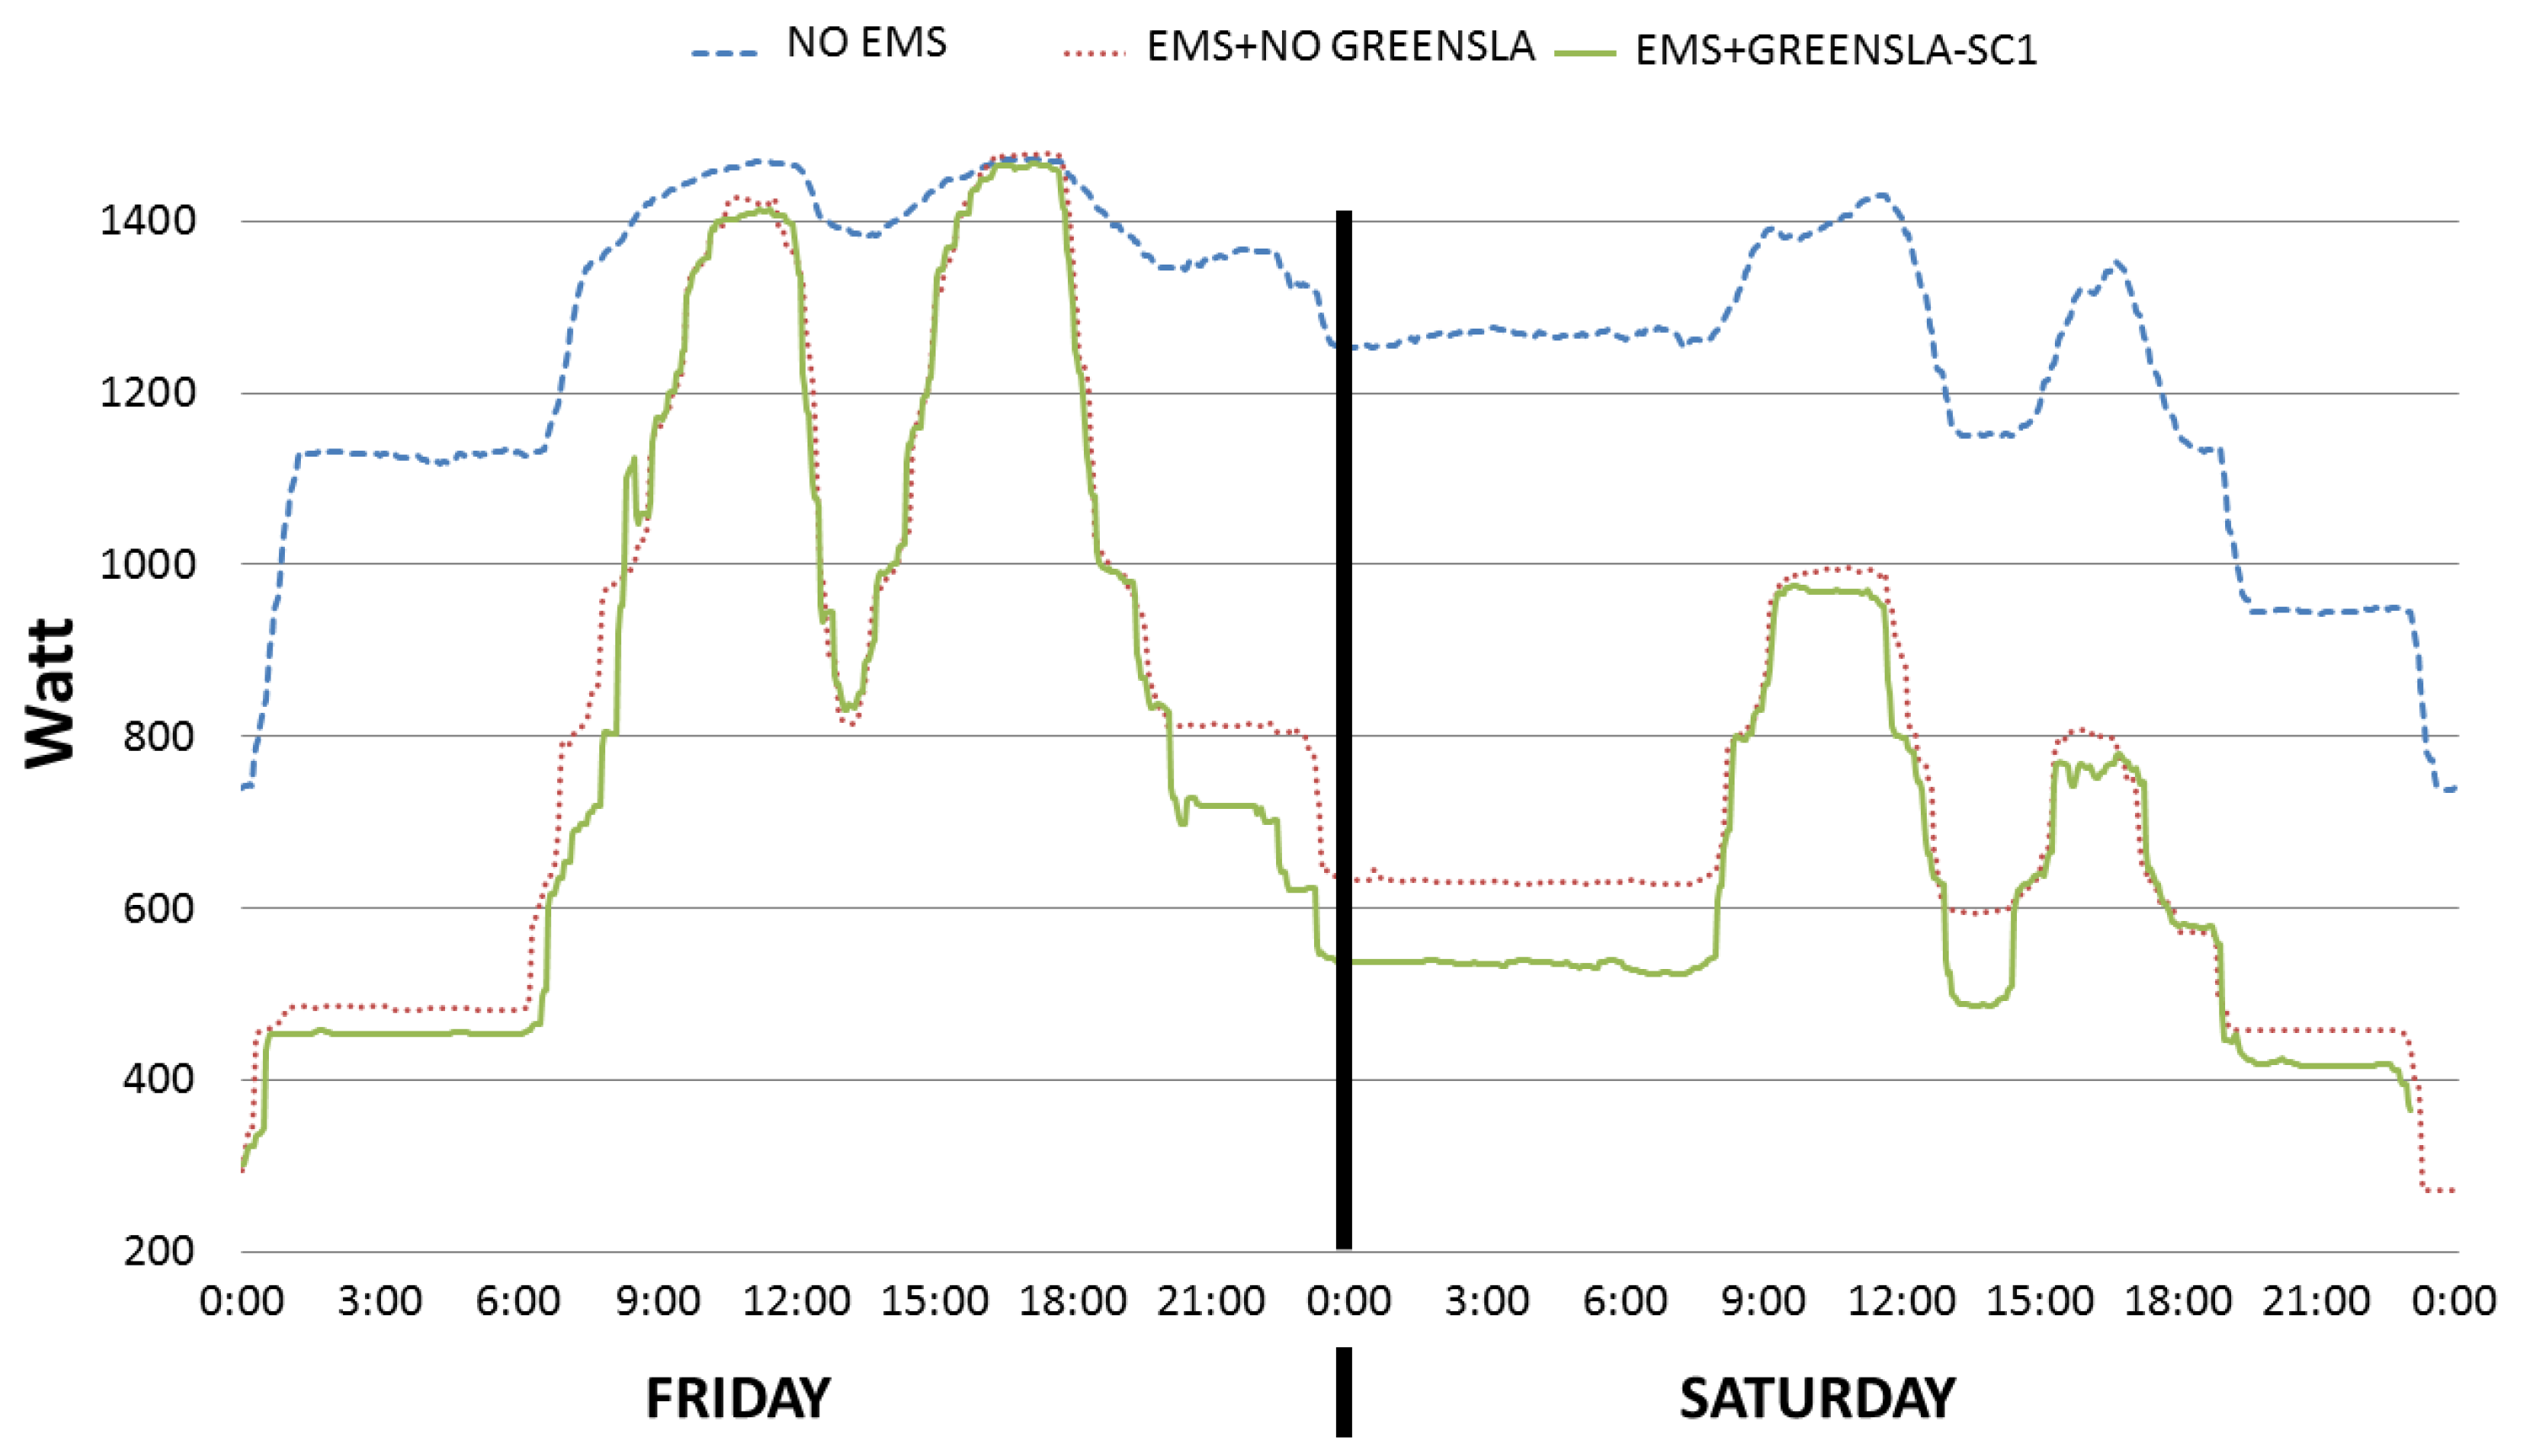
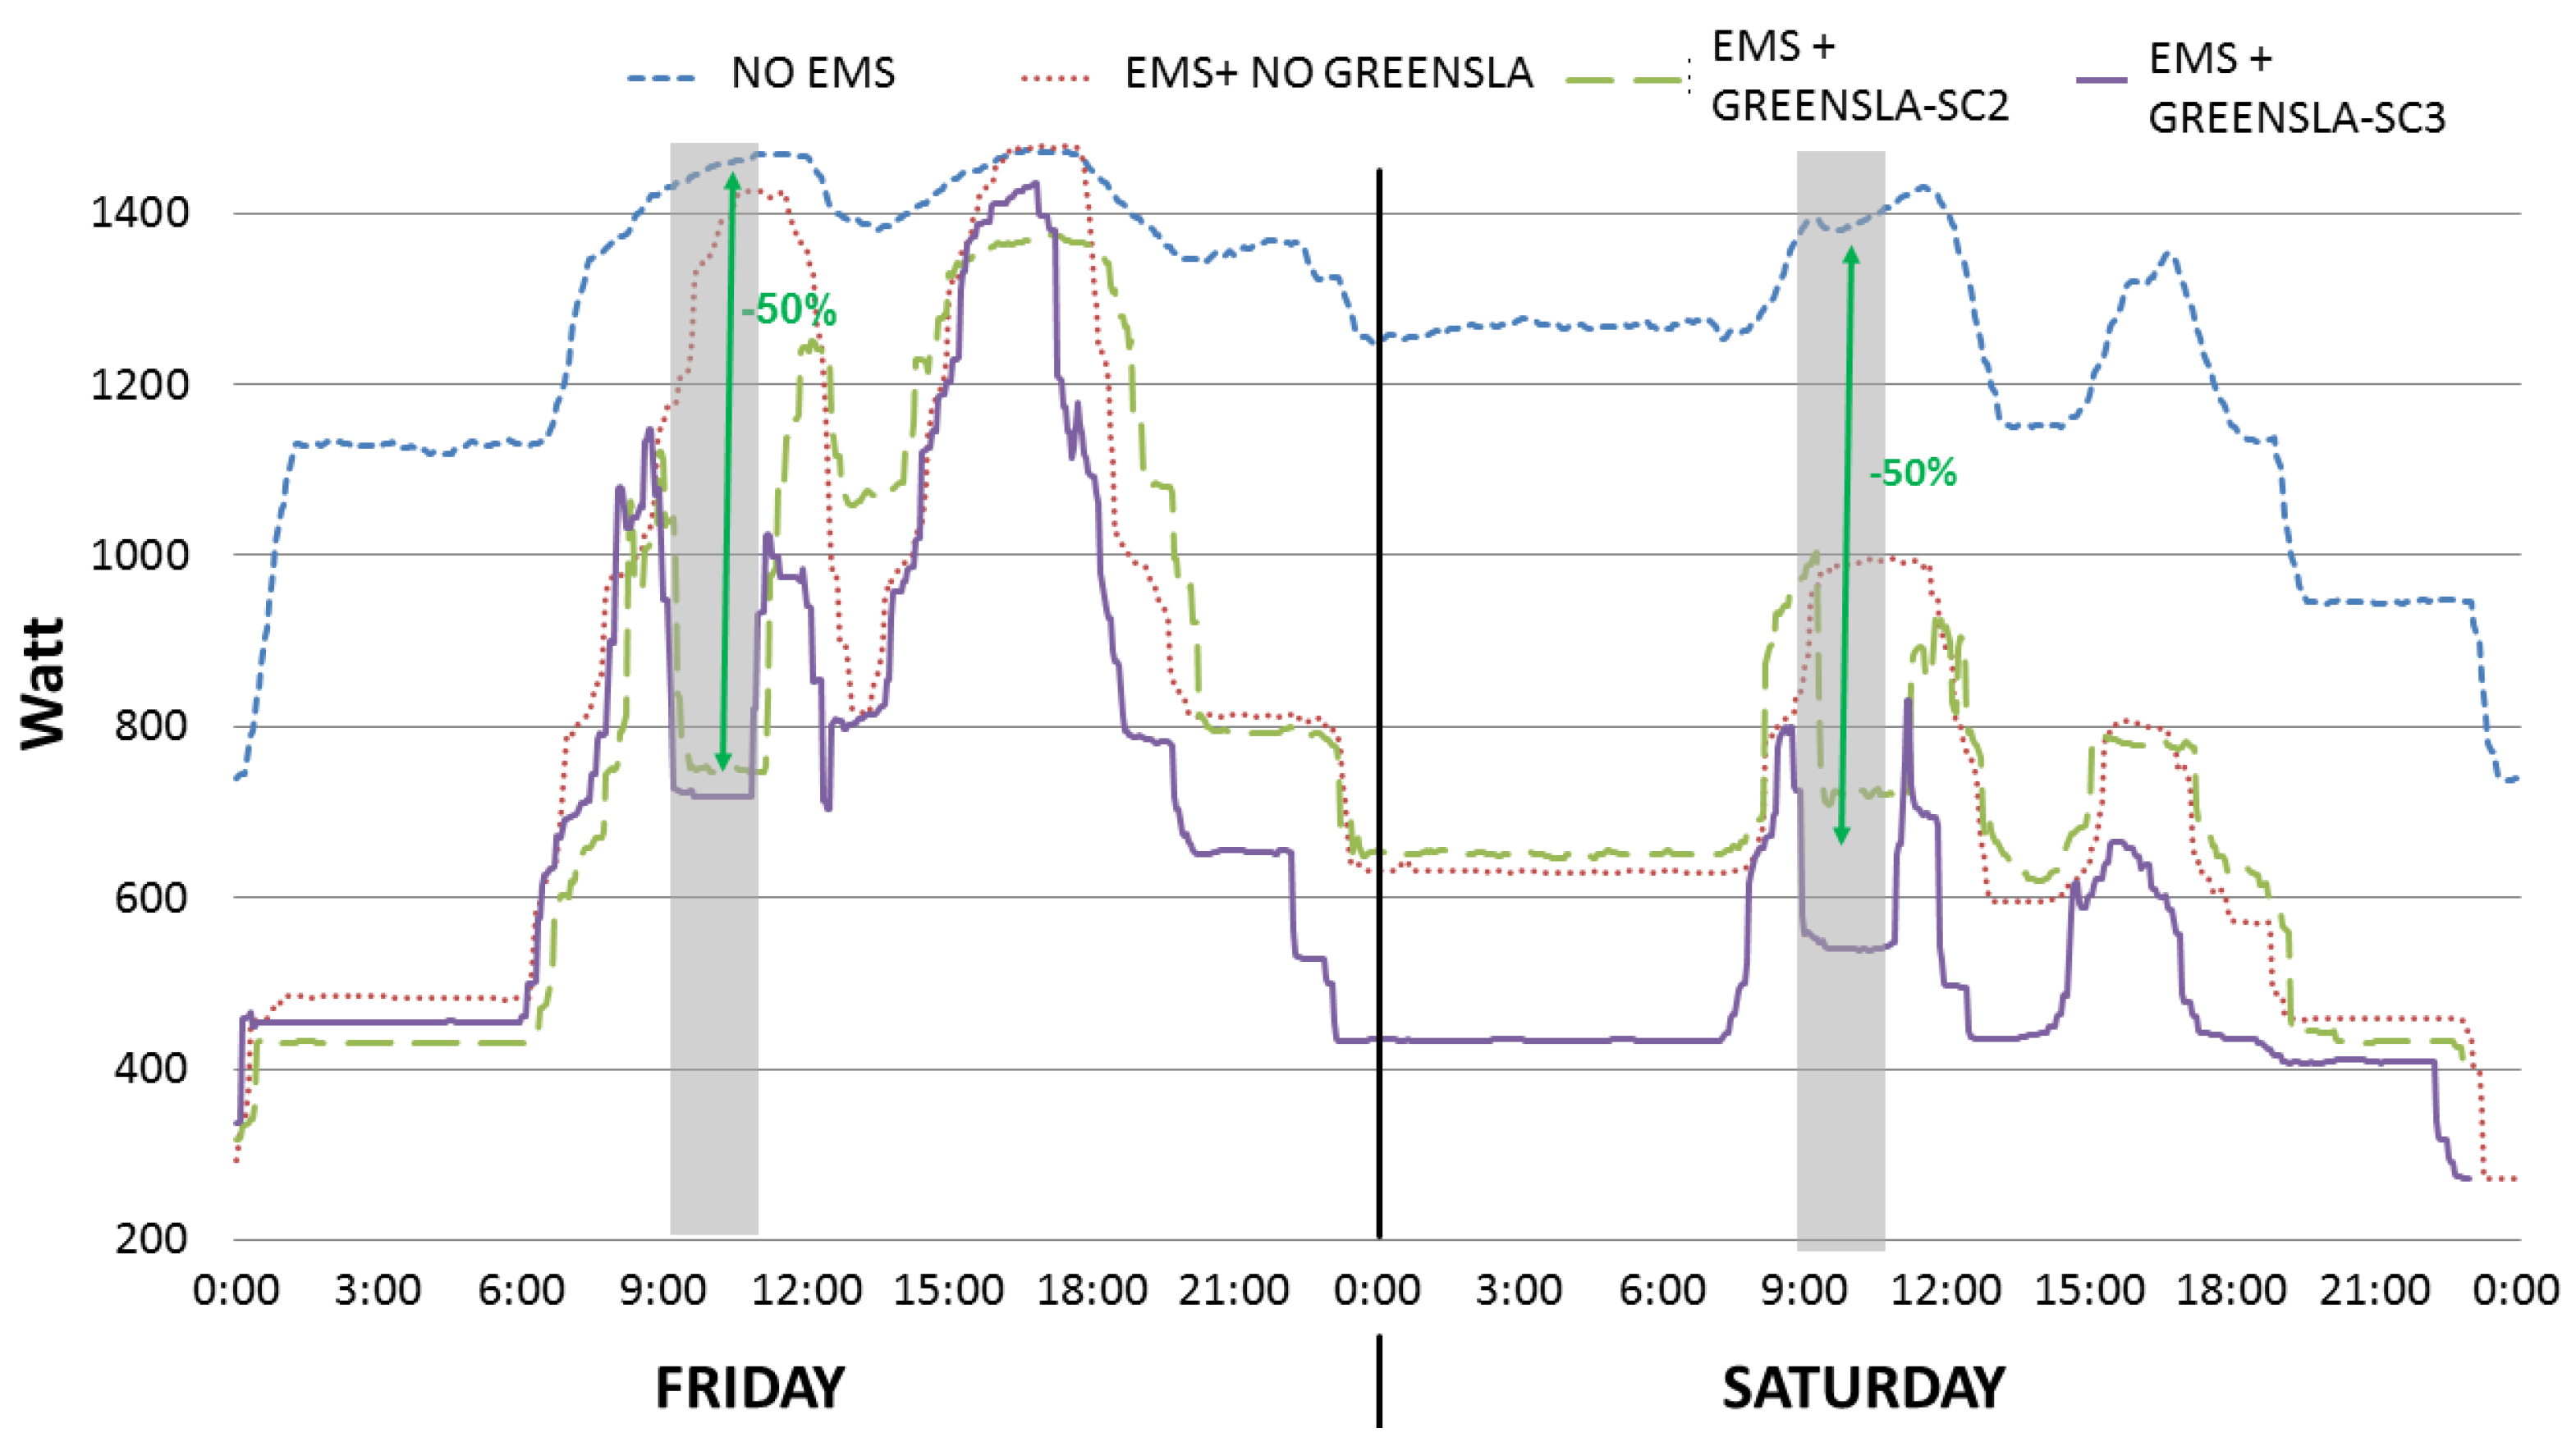
  • Because of flexible Green SLAs, there was a reduction of 50% in power demand (see the green arrow line) during the demand-response period (e.g., between 9:30 AM and 11:30 AM on Friday and Saturday), compared to the rigid SLAs.
  • In the nonfederated configuration (green long dashed line EMS+GREENSLA-SC2), due to the launching of delayed virtual machines together with the ordinary workload, there was a noticeable peak power demand after the end (e.g., at ~12 PM on Friday and Saturday) of the demand-response period.
  • In the federated configuration (purple line EMS+GREENSLA-SC3), no peak demand is occurring after the end (e.g., around 12 PM on Friday and Saturday) of the demand-response period, as was the case for the nonfederated configuration, simply because the virtual machines were allocated to a different (federated) data center.
  • On Friday between 4 PM and 6 PM, the peak demand of 1450 Watt was not reduced when EMS was considered (e.g., red, green, and purple lines). This is due to the fact that during that period the data center exhibited the highest workload in terms of instances of VMs (see Figure 4). Consequently, no consolidation and turning off idle machines were possible, which hindered any further optimization with respect to the case when no EMS (e.g., blue line) was considered. Note however that the peak demands for the last two cases (green long dashed line EMS+GREENSLA-SC2 and purple line EMS+GREENSLA-SC3) during the aforementioned period are lower than the ones of first two cases (NO EMS and EMS+NO GREENSLA) due to the shifting of workload happened after the end of the demand-response period (e.g., between 12 PM and 2 PM on Friday and Saturday).
Figure 8 illustrates the energy consumed during the 2-day experiments. We can notice that the extra savings in energy thanks to the Green SLAs are slightly lower (4.15%) due to the additional overhead of the secondary peak after the end of demand-response period. The federated configuration (right most blue bar) presents better savings in energy, as it does not incorporate the energy spent in the federated data center.

6. Conclusions

Reducing energy consumption (e.g., operational expenditure) and increasing performance of the running services (e.g., compliance with the SLAs) are two competing objectives that any data center operator faces. To cope with service level agreements (SLAs) of the running services, most of the time ICT resources in a given data center are over provisioned. This paves the way of optimization through intelligent energy management by either (1) minimizing the number of resources and thus finding the optimal mapping of resources to the services without violating SLAs or (2) introducing flexibilities on the customer side, and hence the implementation of flexible SLAs.
With the integration of renewables into the power grid and their extremely intermittent behavior, this necessitated a better planning of power generation from supply-side (e.g., DSO), so that the generation matches demand and hence preserves the power grid’s stability. Preserving the grid’s stability has been realized by the concept of demand-side management [43] and demand-response.
In this paper, we presented the results by implementing an energy management system (EMS) to a proof-of-concept cloud computing data center at HPE Italy. We tackled such an EMS from two different perspectives: (1) by minimizing the overall energy consumption of data centers and (2) by reducing peak power demand during demand-response periods (e.g., power shortage). Further, we described exhaustively the mechanisms that can be used in data centers to provide flexibilities. We identified that some mechanisms (e.g., DVFS) have impact on SLAs, whereas others (e.g., UPS and cooling system) have no influence on SLAs at all. We also described the methodological foundations of the two management systems. By considering a subset of the identified mechanisms (e.g., consolidation, migration, and flexible SLAs), we carried out experimental analysis on a cloud-based lab by setting up several scenarios. The obtained results show the significant potential of Green SLA: In certain cases, the peak power savings reached 50% and total energy reductions reached 25%.

Funding

This research received no external funding.

Acknowledgments

This work was realized within the context of EU FP7 Fit4green and All4green projects. The author of this paper would like to show his gratitude to Mr. Krikor Demirjian for his proofreading improvements and suggestions.

Conflicts of Interest

The author declares no conflict of interest.

Abbreviations

The following abbreviations are used in this manuscript.
ASHRAEAmerican Society for Heating and Air Conditioning Engineers
CPUCentral Processing Unit
DCData Center
DCiEData Center infrastructure Efficiency
DVFSDynamic Voltage and Frequency Scaling
DSODistribution System Operator
EMSEnergy Management System
GECGreen Energy Coefficient
Green SLAGreen Service Level Agreement
Green SDAGreen Supply-Demand Agreement
GPUEGreen PUE
HPEHewlett Packard Enterprise
ICTInformation and Communication Technologies
IoTInternet of Things
OpexOperational expenditure
OpenADROpen Automated Demand Response
OSOperating System
PUEPower Usage Effectiveness
SLAService Level Agreement
TCOTotal Cost of Ownership
UPSUninterrupted Power Supply

References

  1. Katz, R.H. Tech titans building boom. IEEE Spectr. 2009, 46, 40–54. [Google Scholar] [CrossRef]
  2. Jones, N. How to stop data centres from gobbling up the world’s electricity. Nature 2018, 561, 163. [Google Scholar] [CrossRef] [PubMed]
  3. GeSI. SMART 2020: Enabling the Low Carbon Economy in the Low Carbon Economy in the Information Age; Technical Report; The Climate Group: London, UK, 2008. [Google Scholar]
  4. Andrae, A.S.G.; Edler, T. On global electricity usage of communication technology: Trends to 2030. Challenges 2015, 6, 117–157. [Google Scholar] [CrossRef]
  5. ATAG. Air Transport Action Group (ATAG): Facts and Figures, 2018; ATAG: Dunfermline, UK, 2018. [Google Scholar]
  6. Lima, J.M. Data Centres Of The World Will Consume 1/5 Of Earth’s Power By 2025; Technical report, online article for Data Economy; Euromoney Institutional Investor PLC.: London, UK, 2017. [Google Scholar]
  7. Bittner, J. Data Center Location Considerations (Principles and Resources); Technical report; Exit Technologies: Naples, FL, USA, 2018. [Google Scholar]
  8. Hansen, K.; Mathiesen, B.V.; Skov, I.R. Full energy system transition towards 100% renewable energy in Germany in 2050. Renew. Sustain. Energy Rev. 2019, 102, 1–13. [Google Scholar] [CrossRef]
  9. Gellings, C.; Chamberlin, J.H. Demand-Side Management: Concepts and Methods; PennWell Books: Tulsa, OK, USA, 1987. [Google Scholar]
  10. OpenADR Alliance. OpenADR 2.0 Profile Specification B Profile; Technical report; OpenADR Alliance: San Ramon, CA, USA, 2013. [Google Scholar]
  11. Federal Energy Regulatory Commission. Assessment of Demand Response and Advanced Metering; Technical report; Federal Energy Regulatory Commission: Washington, DC, USA, 2013. [Google Scholar]
  12. Ghatikar, G.; Ganti, V.; Matson, N.; Piette, M.A. Demand Response Opportunities and Enabling Technologies for Data Centers: Findings from Field Studies; Technical report; Lawrence Berkeley National Laboratory: Berkeley, CA, USA, 2012. [Google Scholar]
  13. Ghatikar, G.; Piette, M.A.; Fujita, S.; McKane, A.; Dudley, J.H.; Radspieler, A. Demand Response and Open Automated Demand Response Opportunities for Data Centers; Technical report; Lawrence Berkeley National Laboratory: Berkeley, CA, USA, 2010. [Google Scholar]
  14. Basmadjian, R.; Botero, J.F.; Giuliani, G.; Hesselbach, X.; Klingert, S.; de Meer, H. Making Data Centres Fit for Demand Response: Introducing GreenSDA and GreenSLA Contracts. IEEE Trans. Smart Grid 2018, 9, 3453–3464. [Google Scholar] [CrossRef]
  15. Barroso, L.A.; Clidaras, J.; Hoelzle, U. The Datacenter as a Computer: An Introduction to the Design of Warehouse-Scale Machines; Morgan & Claypool: San Rafael, CA, USA, 2013; Chapter 6; p. 96. [Google Scholar]
  16. Alboaneen, D.A.; Pranggono, B.; Tianfield, H. Energy-aware virtual machine consolidation for cloud data centers. In Proceedings of the 2014 IEEE/ACM 7th International Conference on Utility and Cloud Computing; IEEE Computer Society: Washington, DC, USA, 2014; pp. 1010–1015. [Google Scholar] [CrossRef]
  17. Khani, H.; Latifi, A.; Yazdani, N.; Mohammadi, S. Distributed consolidation of virtual machines for power efficiency in heterogeneous cloud data centers. Comput. Electr. Eng. 2015, 47, 173–185. [Google Scholar] [CrossRef]
  18. Basmadjian, R.; Niedermeier, F.; de Meer, H. Modelling and analysing the power consumption of idle servers. In Proceedings of the 2012 Sustainable Internet and ICT for Sustainability (SustainIT), Pisa, Italy, 4–5 October 2012. [Google Scholar]
  19. Habib, I. Virtualization with KVM. Linux J. 2008, 2008, 8. [Google Scholar]
  20. Barham, P.; Dragovic, B.; Fraser, K.; Hand, S.; Harris, T.; Ho, A.; Neugebauer, R.; Pratt, I.; Warfield, A. Xen and the art of virtualization. SIGOPS Oper. Syst. Rev. 2003, 37, 164–177. [Google Scholar] [CrossRef]
  21. Clark, C.; Fraser, K.; Hand, S.; Hansen, J.G.; Jul, E.; Limpach, C.; Pratt, I.; Warfield, A. Live migration of virtual machines. In Proceedings of the 2nd Conference on Symposium on Networked Systems Design & Implementation—Volume 2; USENIX Association: Berkeley, CA, USA, 2005; pp. 273–286. [Google Scholar]
  22. Snowdon, D.; Ruocco, S.; Heiser, G. Power management and dynamic voltage scaling: Myths and facts. In Proceedings of the 2005 Workshop on Power Aware Real-Time Computing, Jersey, NJ, USA, 18–22 September 2005. [Google Scholar]
  23. Basmadjian, R.; Niedermeier, F.; de Meer, H. Modelling performance and power consumption of utilisation-based DVFS using M/M/1 queues. In Proceedings of the ACM Seventh International Conference on Future Energy Systems of e-Energy, Waterloo, ON, Canada, 21–24 June 2016; pp. 14:1–14:11. [Google Scholar]
  24. Basmadjian, R.; de Meer, H. Modelling and analysing conservative governor of DVFS-enabled processors. In Proceedings of the Ninth International Conference on Future Energy Systems; ACM: New York, NY, USA, 2018; pp. 519–525. [Google Scholar] [CrossRef]
  25. Meijer, G. Cooling energy-hungry data centers. Science 2010, 328, 318–319. [Google Scholar] [CrossRef] [PubMed]
  26. Evans, T. The Different Types of Air Conditioning Equipment for IT Environments; American Power Conversion: South Kingstown, RI, USA, 2004. [Google Scholar]
  27. Pore, M.; Abbas, Z.; Gupta, S.K.S.; Varsamopoulos, G. Techniques to achieve energy proportionality in data centers: A survey. In Handbook on Data Centers; Springer: Berlin, Germany, 2015; pp. 109–162. [Google Scholar]
  28. Patterson, M.K.; Fenwick, D. The State of Data Center Cooling: A Review of Current Air and Liquid Cooling Solutions; Intel Corporation: Santa Clara, CA, USA, 2008. [Google Scholar]
  29. Li, L.; Zheng, W.; Wang, X.; Wan, X. Coordinating liquid and free air cooling with workload allocation for data center power minimization. In Proceedings of the 11th International Conference on Autonomic Computing, Philadelphia, PA, USA, 18–20 June 2014. [Google Scholar]
  30. Kuusisto, O. Thermal Guidelines for data Processing Environments—Expanded Datacenter Classes and Usage Guidance; ASHRAE: Atlanta, GA, USA, 2011. [Google Scholar]
  31. Basmadjian, R.; Ghiassi-Farrokhfal, Y.; Vishwanath, A. Hidden storage in data centers: Gaining flexibility through cooling systems. In International Conference on Measurement, Modelling and Evaluation of Computing Systems; Springer: Berlin, Germany, 2018; pp. 68–82. [Google Scholar]
  32. Rincón, D.; Agustí-Torra, A.; Botero, J.F.; Raspall, F.; Remondo, D.; Hesselbach, X.; Beck, M.T.; de Meer, H.; Niedermeier, F.; Giovanni, G. A novel collaboration paradigm for reducing energy consumption and carbon dioxide emissions in data centres. Comput. J. 2013, 56, 1518–1536. [Google Scholar] [CrossRef]
  33. Basmadjian, R.; Niedermeier, F.; Lovasz, G.; Meer, H.D.; Klingert, S. GreenSDAs leveraging power adaption collaboration between energy provider and data centres. In Proceedings of the 3rd IFIP Conference on Sustainable Internet and ICT for Sustainability (SustainIT 2013), Palermo, Italy, 30–31 October 2013. [Google Scholar]
  34. Dupont, C.; Hermenier, F.; Schulze, T.; Basmadjian, R.; Somov, A.; Giuliani, G. Plug4Green: A flexible energy-aware VM manager to fit data centre particularities. Ad Hoc Netw. 2015, 25, 505–519. [Google Scholar] [CrossRef]
  35. Basmadjian, R.; Ali, N.; Niedermeier, F.; de Meer, H.; Giuliani, G. A methodology to predict the power consumption of servers in data centres. In Proceedings of the 2nd International Conference on Energy-Efficient Computing and Networking; ACM: New York, NY, USA, 2011; pp. 1–10. [Google Scholar] [CrossRef]
  36. Janacek, S.; Nebel, W. Expansion of data centers’ energetic cegrees of freedom to employ green energy sources. In Advances and New Trends in Environmental and Energy Informatics; Springer: Berlin, Germany, 2016; pp. 21–38. [Google Scholar]
  37. Basmadjian, R.; de Meer, H.; Lent, R.; Giuliani, G. Cloud computing and its interest in saving energy: The use case of a private cloud. J. Cloud Comput. Adv. Syst. Appl. 2012, 1, 5. [Google Scholar] [CrossRef]
  38. Belady, C.; Amd, A.R.; Dell, J.P.; Spraycool, T.C. The Green Grid Data Center Power Efficiency Metrics: Pue and DCiE; Technical report; The Green Grid: Beaverton, OR, USA, 2008. [Google Scholar]
  39. Piette, M.A.; Girish, G.; Sila, K.; Koch, E.; Hennage, D.; Palensky, P.; McParland, C. Open Automated Demand Response Communications Specification (Version 1.0); Technical report; LBNL: Berkeley, CA, USA, 2009. [Google Scholar]
  40. Basmadjian, R.; Mueller, L.; de Meer, H. Data centres’ power profile selecting policies for demand response: Insights of green supply-demand agreement. Ad Hoc Netw. Spec. Issue Energy-Aware Data Cent. Archit. Infrastruct. Commun. 2015, 25, 581–594. [Google Scholar] [CrossRef]
  41. Chowdhury, C.R.; Chatterjee, A.; Sardar, A.; Agarwal, S.; Nath, A. A comprehensive study on cloud green computing: To reduce carbon footprints using clouds. Int. J. Adv. Comput. Res. 2013, 3, 78–84. [Google Scholar]
  42. Varela, M.; Skorin-Kapov, L.; Ebrahimi, T. Quality of service versus quality of experience. In Quality of Experience: Advanced Concepts, Applications and Methods; Springer: Berlin, Germany, 2014; pp. 85–96. [Google Scholar]
  43. Kies, A.; Schyska, B.U.; Von Bremen, L. The demand side management potential to balance a highly renewable european power system. Energies 2016, 9, 955. [Google Scholar] [CrossRef]
Figure 1. An energy management system (EMS) for minimizing the energy consumption inside data centers.
Energies 12 03301 g001
Figure 2. An EMS for leveraging peak power demand reduction.
Energies 12 03301 g002
Figure 3. Testbed’s software configuration.
Energies 12 03301 g003
Figure 4. Workload’s shape expressed in terms of virtual machine instances.
Energies 12 03301 g004
Figure 5. Power consumption (Watt) of the tested “Baseline Scenario”.
Energies 12 03301 g005
Figure 6. Energy consumption (Wh) of the tested “Baseline Scenario”.
Energies 12 03301 g006
Figure 7. Power consumption (Watt) of the tested “Demand-Response without Federation Scenario”.
Energies 12 03301 g007
Figure 8. Energy consumption (Wh) of the tested “Demand-Response without Federation Scenario”.
Energies 12 03301 g008
Table 1. Testbed’s hardware configuration.
ComponentConfiguration
ProcessorQuad-core Intel Xeon E5520, 2.26 GHz
Memory24 GB (6 × 4 GB DIMMs) DDR3
Hard DiskTwo hot plug hard drives 2 × 300 GB
NetworkDual-port 10 gigabit Ethernet adapter NC532m
Power Rating120 W (idle) and 235 W (full load)
Table 2. Cloud computing data center’s single site energy saving results.
No EMSEMS Enabled
Measured ICT energy11.3 kWh8.474 kWh
% savingsreference25%
Table 3. Cloud computing data center’s federated site energy saving results.
No EMSEMS Enabled
Measured ICT energy21.720 kWh14.483 kWh
% savingsreference33.31%
Table 4. Impact of relaxing service level agreement (SLA) on energy savings.
EMS (1.2)EMS (1.5)EMS (2.0)EMS (2.5)
Measured ICT energy7.914 kWh6.879 kWh5.123 kWh4.125 kWh
% savingsreference13.07%35.25%47.87 %

