Article

Research on Double-Layer Optimal Scheduling Model of Integrated Energy Park Based on Non-Cooperative Game

1
Department of Electrical Engineering, North China Electric Power University, Baoding 071003, China
2
Technical and Economic Consultation Center for Electric Power Construction in China Electricity Council, Beijing 100032, China
*
Authors to whom correspondence should be addressed.
Energies 2019, 12(16), 3164; https://doi.org/10.3390/en12163164
Submission received: 8 July 2019 / Revised: 6 August 2019 / Accepted: 14 August 2019 / Published: 16 August 2019

Abstract

:
As the realization form of integrated energy system, integrated energy park is the key research object in the field of energy. Actual integrated energy parks are often partitioned internally. In order to take into account the interests of each zone in the optimal scheduling of integrated energy parks, a double-layer optimal scheduling model of integrated energy parks based on non-cooperative game theory is proposed. First, according to the operation of the integrated energy park, the output and cost model of the park is established. Second, with the minimum daily cost as the upper layer objective and the highest energy efficiency of the cogeneration system as the lower layer objective, a double-layer optimal scheduling model is established. Then based on non-cooperative game, the optimal operation strategy of each zone is obtained through the game among all the zones. An integrated energy park is taken as an example, the results show that the proposed model can make zones adjust their operation strategies more reasonably, thus helping to reduce the cost of the park and improve energy efficiency.

Graphical Abstract

1. Introduction

With the increasing demand for energy and the accelerating development of urbanization, the contradiction between the energy demand of human society and the endurance of the environment has become increasingly prominent. Seeking an energy operation mode which is characterized by energy interconnection, high efficiency, and low carbon has become the direction of future energy development [1,2,3]. In such a global environment, integrated energy system emerges as the times require, as the physical carrier of energy internet; it has been well known in academia and business circles [4,5]. In the Implementation Opinions on Promoting the Construction of Multi-energy Complementary Integration and Optimization Demonstration Projects, issued by the China National Development and Reform Commission in 2016, it is proposed that in the face of end-user demand for electricity, heat, cold, gas and other energy, the development of traditional and new energy resources should be tailored to local conditions and complementary utilization [6].
As a place where urban energy consumption gathers, the integrated energy park gathers several individuals with similar energy consumption characteristics. It has the characteristics of large energy demand, concentrated energy consumption, and gathering multiple loads of cold, heat, and electricity [7]. The day-ahead optimal scheduling of integrated energy system is an important link to ensure the optimal operation of integrated energy park. It is of great significance for energy saving, emission reduction, reducing the operation cost of integrated energy system and improving energy efficiency.
Nowadays integrated energy parks are often partitioned internally according to certain rules. As independent decision-makers, these zones exist in the integrated energy parks, which hope to maximize their own interests as far as possible. There are many researches on optimal scheduling of integrated energy system in the literatures. In literature [8], the economic emission scheduling of integrated energy system (IES) has been obtained using multi-objective optimization framework. Literature [9] presents the capabilities of the TBATS model which has no seasonality constraints, making it possible to create detailed, long-term forecasts. Literature [10] considers the characteristics of power to gas (P2G) facilities, power systems, natural gas systems, and heating systems. This paper presents an optimal dispatching model for a multi-energy system with P2G facilities. In literature [11], a two-stage stochastic mixed integer linear programming model for day-ahead energy dispatch in multi-carrier energy systems is established considering the time-varying and volatility of the renewable energy price signals. In literature [12], a new day-ahead optimal dispatching model for P2G storage and gas load management in power and natural gas markets is proposed to minimize the gas consumption cost of gas load. Most of these literatures have focused on the lowest operating cost, the best environmental protection, or other objectives, and have made in-depth studies on the day-ahead optimal scheduling of an integrated energy system. However, in the process of optimal scheduling, the interests of each zone in the integrated energy park are not considered in detail. Meanwhile, under the background of energy shortage, energy saving and emission reduction, the unit price of electricity and natural gas often changes with the increase of purchases. The unit price of electricity is affected by the relationship between supply and demand in the electricity market. The larger the quantity of electricity purchased, the higher the clearing price [13,14]. In order to reduce inefficient and unfair phenomena such as cross subsidies and inversion caused by low natural gas prices, natural gas also adopts the system that the higher the purchase volume, the higher the gas unit price [15,16]. Each zone in the integrated energy park hopes to pursue greater interests as far as possible. Because of the relationship between electricity price, gas price, and purchase volume, the interests of each zone are affected by the decision-making of other zones, so all zones constitute a non-cooperative game.
In summary, in order to take into account the interests of each zone in the optimal scheduling of integrated energy park, the dynamic model of electricity price and gas price is introduced, a double-layer optimal scheduling model of integrated energy parks based on non-cooperative game theory is proposed and used to obtain the optimal operation strategy of each zone in the park, so as to achieve Nash equilibrium solution beneficial to each zone. An integrated energy park is taken as an example, and the results show that the proposed model can make zones adjust their operation strategies more reasonably, thus helping to reduce the cost of the park and improve energy efficiency.

2. Operation Analysis of Integrated Energy Park

2.1. Typical Integrated Energy Park

Typical integrated energy parks are equipped with combined cool, heat, and power (CCHP) equipment, including combined heat and power (CHP) system, gas boiler, electric refrigeration unit, heat pump unit, absorption refrigeration unit, etc. CHP system includes gas turbine and waste heat boiler with supplementary combustion device. In addition, there are photovoltaic power generation and energy storage equipment in the park. The specific energy utilization framework is shown in Figure 1.
As can be seen from the figure above, the electric load sources of the park include power purchase from the power grid, gas turbine power generation, and photovoltaic power generation. The cold load of the park is provided by electric refrigeration units and absorption refrigeration units; as for the heat load, part of it comes from the waste heat generated by the gas turbine power generation, and the output of the waste heat can be adjusted by adding oil to the waste heat boiler. When the waste heat is insufficient, natural gas can be added to the gas boiler to supplement the heat. In addition, heat pump is also one of the sources of heat load. When the electricity price is low in the valley, the park reduces the gas purchase volume and purchases a large amount of electricity from the grid to meet the load demand and energy storage in the park; when the electricity price is high in the peak, the park purchases less electricity from the grid, and provides energy by increasing the output of gas turbines and discharging of energy storage equipment.

2.2. Equipment Output Model of Integrated Energy Park

One day is divided into 24 time periods, represented by t, t = 1, 2, …, 24. Each time period lasts one hour, time interval is represented by T.
1. CHP system
(1) Gas turbines. Natural gas is added to the gas turbine, expands after combustion to provide mechanical energy, and then converts it into electricity. The output power of a gas turbine is
P CHP e ( t ) = η CHP e · P CHP gas ( t )
P CHP e ( t ) —output electric power of CHP system during time period t, W.
η CHP e —generation efficiency of CHP system.
P CHP gas ( t ) —energy of natural gas input into the CHP system during time period t, W.
The symbol P in the paper represents the power of the equipment, the energy provided by gas or oil per unit time, and the amount of electricity purchased per unit time.
(2) Waste heat boiler. The waste heat boiler can output waste heat generated by gas turbine, and the heat power output by the waste heat boiler is as follows:
P CHP h ( t ) = P CHP e ( t ) · V CHP ( t )
P CHP h ( t ) —output electric power of CHP system during time period t, W.
V CHP ( t ) —thermoelectric ratio of CHP system during time period t.
Thermoelectric ratio is the ratio of the output heat power to the output electric power of the CHP system during time period t. The thermoelectric ratio of the CHP system can be changed by supplying oil to the waste heat boiler with a supplementary combustion device to adjust the supplementary combustion rate. The supplementary combustion device can be divided into external supplementary combustion and internal supplementary combustion. Because of the high investment cost and the inconvenience of operation and maintenance of the external supplementary combustion device [17], it assumes that the internal supplementary combustion device is used in the waste heat boiler in this paper. Literature [18] provides experimental data on supplementary combustion of waste heat boilers, which are fitted by Statistical Product and Service Solutions (SPSS), and the following linear relationships are obtained.
V CHP ( t ) = Y a · A ( t ) + Y b
A ( t ) = Y c · P oil ( t ) P CHP e ( t ) + Y d
A(t)—supplementary combustion rate during time period t.
Poil(t)—energy of oil supplied during time period t, W.
The following parameters are obtained by fitting: Ya = 2.589, Yb = 2.064, Yc = 0.381, Yd = 0.001, and the results show that the R^2 of the two fitting results are 0.9883 and 0.9727, respectively (more than 0.8 means that the fitting results are relatively good).
2. Gas boiler. When the waste heat from CHP system cannot meet the demand of the heat load, natural gas can be added to the gas boiler to supplement the heat. The output heat power of the gas boiler is as follows:
P GB h ( t ) = η GB · P GB gas ( t )
P GB h ( t ) —output heat power of gas boiler during time period t, W.
η GB —heat production efficiency of gas boiler.
P GB gas ( t ) —energy of the natural gas input into the gas boiler during time period t, W.
3. Electric refrigeration unit. Electric refrigeration units can convert electricity to provide cold load for the park. The operation model is as follows.
P e c ( t ) = η c e · P c e ( t )
P e c ( t ) —output cold power of electric refrigeration unit during time period t, W.
η c e —efficiency of electric refrigeration unit.
P c e ( t ) —input electric power of electric refrigeration unit during time period t, W.
4. Heat pump unit. Heat pump units can convert the electric energy to provide the demand for the heat load of the park. The operation model is as follows.
P e h ( t ) = η h e · P h e ( t )
P e h ( t ) —output heat power of heat pump unit during time period t, W.
η h e —efficiency of heat pump unit
P h e ( t ) —input electric power of heat pump unit during time period t, W.
5. Absorption refrigeration unit. Absorption refrigeration units can convert heat energy to provide cold load for the park. The operation model is as follows.
P h c ( t ) = η c h · P c h ( t )
P h c ( t ) —output cold power of absorption refrigeration unit during time period t, W.
η c h —efficiency of absorption refrigeration unit.
P c h ( t ) —input heat power of absorption refrigeration unit during time period t, W.

2.3. Daily Cost Model of Park

The daily cost of the park considered in this paper includes the daily operating cost of the park and the daily environmental value cost of the park. The daily operating cost of the park does not involve the initial investment cost of each equipment; it mainly includes the daily gas purchase cost, electricity purchase cost, oil cost and the operation and maintenance cost of each equipment. The unit price of gas and electricity is related to the quantity of gas purchased and the electricity purchased in the park, which means the more the purchased quantity, the higher the unit price. Oil is regarded as fixed price because it only plays a regulatory role and its purchases are relatively small. The daily environmental value cost of the park includes the treatment cost of pollutants caused by the daily use of gas turbines, waste heat boilers, and gas boilers in the park.

2.3.1. Daily Operating Cost of the Park

1. Gas purchase cost. The park purchases gas from natural gas suppliers for gas turbines and gas boilers. The cost of purchasing gas is as follows:
C gas ( t ) = c gas ( t ) · ( P CHP gas ( t ) + P GB gas ( t ) ) · T / ( λ gas · ρ gas )
Cgas(t)—gas purchase cost of park during time period t, USD.
cgas(t)—gas unit price during time period t, USD/m3.
T—time interval, h.
λgas—calorific value of natural gas, J/kg.
ρgas—density of natural gas, kg/m3.
The unit price of natural gas is positively correlated with the purchase amount of natural gas of the park
c gas ( t ) = A gas · ( P CHP gas ( t ) + P GB gas ( t ) ) · T / ( λ gas · ρ gas ) + B gas
Agas—gas price parameters, USD/(m3)2.
Bgas—gas price parameters, USD/m3.
2. Electricity purchase cost. The park purchases electricity from the power grid to meet the demand of electric load in the park and realizes the storage and conversion of power through energy storage equipment, electric refrigeration unit, and heat pump unit. The cost of power purchase is as follows.
C grid ( t ) = c grid ( t ) · P grid e ( t ) · T
C grid ( t ) —electricity purchase cost of park during time period t, USD.
c grid ( t ) —electricity unit price during time period t, USD/J.
P grid e ( t ) —electricity purchase of the park during time period t, W.
The unit price of electricity is positively correlated with the purchase amount of electricity of the park and is affected by the peak and valley period of electricity consumption.
c grid ( t ) = a ( t ) · P grid e ( t ) · T + b ( t )
a(t)—electricity price parameters during time period t, USD/(J)2.
b(t)—electricity price parameters during time period t, USD/J.
3. Oil purchase cost. Oil is used for supplementary combustion, and the thermoelectric ratio of CHP system can be adjusted by adding oil to the waste heat boiler. The cost is as follows:
C oil ( t ) = c oil · P oil ( t ) · T / λ oil
Coil(t)—Oil purchase cost during time period t, USD.
coil—oil unit price, USD/kg.
λoil—calorific value of oil, J/kg.
4. CCHP equipment cost. It includes the operation and maintenance costs of CHP system, gas boiler, electric refrigeration unit, heat pump unit, and the absorption refrigeration unit, as follows
C CCHP ( t ) = i = 1 5 c i · P i ( t ) · T
CCCHP(t)—total cost of operation and maintenance of CCHP equipment during time period t, USD.
ci—operational and maintenance cost per unit output power of the above five equipment, USD/J.
Pi(t)—output power of five equipment during time period t, W.
5. Energy storage cost. Operation and maintenance cost of electric energy storage equipment
C sto ( t ) = c sto · η sto · ( P char e ( t ) + P dis e ( t ) ) · T
Csto(t)—operation and maintenance cost of electric energy storage equipment during time period t, USD.
csto—operation and maintenance cost per unit charge and discharge volume of electric energy storage equipment, USD/J.
ηsto—charging and discharging efficiency of electric energy storage equipment
P c h a r e ( t ) —charging power of electric energy storage equipment during time period t, W.
P d i s e ( t ) —discharging power of electric energy storage equipment during time period t, W.

2.3.2. Daily Environmental Value Cost of the Park

1. Environmental value cost of gas turbine
C GT ( t ) = P CHP e ( t ) · T · i = 1 5 J GT i · K i
C GT ( t ) —environmental value cost of gas turbine during time period t, USD.
i—pollutants, including SO2, NOx, CO, CO2, TSP.
J GT i —emissions of various pollutants per unit output electric power from gas turbine, kg/J.
K i —environmental costs of various pollutants, USD/kg.
2. Environmental value cost of waste heat boiler
C WHB ( t ) = P CHP h ( t ) · T · i = 1 5 J WHB i · K i
CWHB(t)—environmental value cost of waste heat boiler during time period t, USD.
J WHB i —emissions of various pollutants per unit output heat power from waste heat boiler, kg/J.
3. Environmental value cost of gas boiler.
C GB ( t ) = P GB h ( t ) · T · i = 1 5 J GB i · K i
C GB ( t ) —environmental value cost of gas boiler during time period t, USD.
J GB i —emissions of various pollutants per unit output heat power from gas boiler, kg/J.

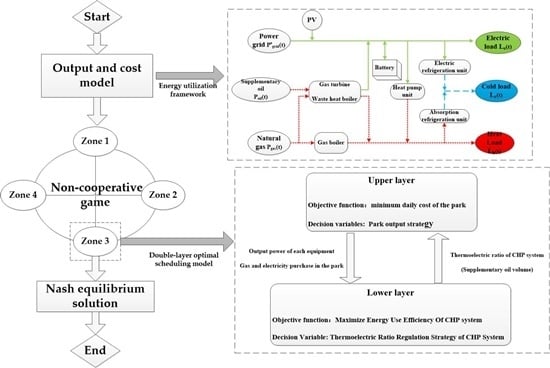
3. Double-Layer Optimal Scheduling Model Based on Non-Cooperative Game

Double-layer optimization is a system optimization problem with a double-layer hierarchical structure. The upper and lower layers have their own objective functions and constraints. The upper layer decision will generally affect the lower layer objective and constraints, while the lower layer will provide feedback to the decision of the upper layer, thus realizing the interaction between the decisions of upper and lower layers [19].
This paper considers a double-layer optimal scheduling model as shown in Figure 2. The upper layer aims at minimizing the daily cost of the park. The output strategy b(t) such as gas purchasing, electricity purchasing, and the output power of the equipment of the park is obtained. The lower layer aims at maximizing the energy efficiency of the CHP system in the park, and the thermoelectric ratio regulation strategy of the CHP system is obtained. The upper layer inputs the park output strategy to the lower layer, and the lower layer adjusts the thermoelectric ratio of the CHP system to optimize the energy efficiency of the CHP system, the upper layer re-optimizes according to the thermoelectric ratio adjustment strategy of the lower layer, and the upper and lower layers iterates repeatedly until the result is optimal.

3.1. Upper Layer Model

3.1.1. Objective Function

The upper-layer model takes the minimum daily cost of the park as the optimization objective, and the decision variables are as follows.
s n ( t ) = [ P GB gas ( t ) , P CHP gas ( t ) , P c e ( t ) , P h e ( t ) , P c h ( t ) , P grid e ( t ) , P char e ( t ) , P dis e ( t ) , V C H P ( t ) ]
The objective function of the upper layer model is
C sum = min t = 1 24 ( C o p ( t ) + C e n ( t ) )
C op ( t ) = C gas ( t ) + C grid ( t ) + C oil ( t ) + C CCHP ( t ) + C sto ( t )
C en ( t ) = C GT ( t ) + C WHB ( t ) + C GB ( t )
Csum—daily cost of park, USD.
Cop(t)—operation cost of park during time period t, USD.
Cen(t)—environmental value cost of park during time period t, USD.

3.1.2. Constraint Condition

1. Energy Conservation Constraints
(1) Electric load
P grid e ( t ) + P CHP e ( t ) + η sto · P dis e ( t ) + P PV e ( t ) = L e ( t ) + η sto · P char e ( t ) + P c e ( t ) + P h e ( t )
P PV e ( t ) —output power of photovoltaic power generation in the park during time period t, W.
L e ( t ) —electric load of the park during time period t, W.
(2) Heat load
P CHP h ( t ) + P GB h ( t ) + P e h ( t ) = L h ( t ) + P c h ( t )
L h ( t ) —heat load of the park during time period t, W.
(3) Cold load
P h c ( t ) + P e c ( t ) = L c ( t )
L c ( t ) —Cold load of the park during time period t, W.
2. Equipment output constraints
0 < P k < P k max
K—1, 2, …, 5, represents CHP system, gas boiler, electric refrigeration unit, heat pump unit, absorption refrigeration unit. Pk—output power of various kinds of equipment, W.
P k max —maximum output power of various kinds of equipment, W.
Some equipment such as gas turbine have the problem of low efficiency at low power levels, but the efficiency can be improved by preheating gas or combustion-supporting air when the equipment is at a low power level. So the efficiency can be approximately regarded as a fixed value when power constraints are valid from 0.
3. Energy storage constraints
{ 0 < P char e ( t ) < P char max 0 < P dis e ( t ) < P dis max P char e ( t ) · P dis e ( t ) = 0 t = 1 24 ( P char e ( t ) P dis e ( t ) ) 0
P char max —maximum charging power of electric energy storage equipment, W.
P dis max —maximum discharging power of electric energy storage equipment, W.

3.2. Lower Layer Model

3.2.1. Objective Function

The lower layer model takes the highest energy efficiency of CHP system (the ratio of output energy to input energy of CHP system) as the optimization objective, and the decision variable is VCHP of CHP system, and the objective function of the lower layer model is
η p = max t = 1 24 ( P CHP e ( t ) + P CHP h ( t ) + P GB h ( t ) ) t = 1 24 ( P oil ( t ) + P gas ( t ) )
η p —energy efficiency of CHP system.
Pgas(t)—the total energy of natural gas used in the park during time period t, W.

3.2.2. Constraint Condition

The CHP system in the park adopts the waste heat boiler with internal supplementary combustion device; its supplementary combustion quantity is less, thus the supplementary combustion rate constraint should be satisfied when oil is added to adjust the thermoelectric ratio [20]. The constraint is as follows.
0 < A ( t ) < A max
Amax—maximum supplementary combustion rate of internal supplementary combustion device, 1(%).

3.3. Non-Cooperative Game

Nowadays integrated energy parks are often partitioned internally according to certain rules, such as regional function administrative level, population, economic scale, and load density. When there are multiple zones in the integrated energy park, these zones act as decision-makers, and each of them formulates the most suitable operation strategy for itself. Because the unit price of gas and electricity is related to the total purchases of gas and electricity of the park, when the operation strategy of one zone changes, the other zones will also change accordingly. Therefore, the daily cost of each zone is not only related to its own operation strategy, but also affected by the operation strategy of the other zones, thus all the zones constitutes a non-cooperative game.
It is assumed that there are N zones in the integrated energy park, and the operation strategy of each zone is as follows:
s n ( t ) = [ P GB gas ( t ) , P CHP gas ( t ) , P c e ( t ) , P h e ( t ) , P c h ( t ) , P grid e ( t ) , P char e ( t ) , P dis e ( t ) , V C H P ( t ) ]
n represents the nth zone and sn(t) is operation strategy of the nth zone. The daily cost of each zone is Cn(sn(t), Sn(t)), Sn(t) represents the operation strategies of N − 1 zones except zone n.
All zones participating in the game expect to reach the minimum of their own costs. In the process of the game, each zone will reach an equilibrium point, now for each zone, its own operation strategy is the best, and the cost will increase if the strategy is changed. So, each zone has no motive to change its own operation strategy currently. This equilibrium state is Nash equilibrium. This moment s n * ( t ) of each zone is Nash equilibrium solution, and for each zone, there are operation strategy [21].
C n ( s n * ( t ) , S n * ( t ) ) C n ( s n ( t ) , S n * ( t ) )

4. Solution of the Model

The solving process of double-layer optimal scheduling model based on non-cooperative game is as follows:
  • Set the initial value of the operation strategies of N zones (sn(t)) and set the precision (ε).
  • For the nth zone, the operation strategies of the remaining N − 1 zones (S−n(t)) are regarded as fixed values, the optimal solution of output strategy (bn(t)) and daily cost of the zone (cn) are obtained by calculating formula (20).
  • The optimal solution of the output strategy is input to the lower layer, the optimal solution of the thermoelectric ratio regulation strategy ( V CHP n * ( t ) ) is obtained by calculating formula (28).
  • The upper objective function is recalculated according to V CHP n * ( t ) , and the new optimal solution of the output strategy (bn*(t)) and the daily cost of the zone (cn*) are obtained.
  • When | c n * c n | < ε , the currently operation strategy s n * = [ b n * ( t ) , V CHP n * ( t ) ] is the optimal strategy for the zone, otherwise repeat step 3.
  • Repeat steps 2–5 to find the optimal operation strategies of the remaining N − 1 zones.
  • Repeat steps 2–6 until the optimal operation strategies of N zones do not change, and then the operation strategy of each zone under Nash equilibrium solution is obtained.
The solution flow chart is shown in Figure 3.

5. Analysis of Examples

5.1. Basic Data and Assumptions

An integrated energy park is taken as an example, the park can be divided into four zones according to the load density. The park schematic diagram is shown in Figure 4.
The basic data of the example are as follows: Agas = 0.377 USD/(m3)2, Bgas = 4.35 × 10⁻⁵ USD/m3, λgas = 4.96 × 10⁷ J/kg, ρgas = 0.7174 kg/m3. Peak-valley mechanism is adopted for electricity price parameters: valley (1 a.m.~6 a.m., 11 p.m.~12 p.m.), a(t) = 1.57 × 10⁻¹⁹ USD/(J)2, b(t) = 1.5 × 10⁻⁸ USD/J; normal (7 a.m.~11 a.m., 2 p.m.~7 p.m.), a(t) = 2.35 × 10⁻¹⁹ USD/(J)2, b(t) = 2.94 × 10⁻⁸ USD/J; peak (12 a.m.~1 p.m., 8 p.m.~10 p.m.), a(t) = 3.13 × 10⁻¹⁹ USD/(J)2, b(t) = 4.72 × 10⁻⁸ USD/J, coil = 0.355 USD/kg, λoil = 4.4 × 10⁷ J/kg. The parameters of equipment efficiency and operation cost are shown in Table 1, the emission intensity and the environmental cost of various pollutants from gas turbines, waste heat boilers, and gas boilers are shown in Table 2 [22,23,24,25,26].
The electric, heat, cold load, and photovoltaic power generation of the park in a day are shown in Figure 5.

5.2. Results and Analysis of Examples

According to the proposed model and solution method, the Nash equilibrium solutions of four zones are solved. An example of a zone is presented; Figure 6 is the output optimization results of electric load, heat load, and cold load of the zone. The positive value in the figure represents the input energy, such as electricity purchasing, power generation, electric energy storage discharging, boiler heat generation, etc. The negative value represents the output energy, such as electricity, heat, cold load of the zone, electric energy storage charging, etc.
As can be seen from Figure 6, during late night and before dawn, the zone reduces the use of natural gas, and purchases a large amount of electricity from the grid. In addition to meeting the electric load of the zone, it also provides heat and cold loads for the zone through heat pump unit and electric refrigeration unit. In addition, excess electricity is stored by storage devices and then provides power to the zone during electricity peak. During the period from sunrise to sunset, the zone seldom purchases electricity from the grid. The energy needed is mainly from gas turbine power generation and photovoltaic power generation. The heat load of the zone almost entirely comes from the gas boiler and the waste heat boiler. As a result of the relatively large amount of heat generated at this time, the output of absorption refrigerant unit is also increased. During the period from sunset to night, the demand for electricity load increases sharply, and photovoltaic power generation almost no longer provides electricity; electricity generated by the gas turbines and stored by the electric energy storage equipment during electricity valley can provide the electric load demand of the zone.
The comparison of gas purchase and electricity purchase before and after the game is shown in Figure 7. It can be seen that the sum of gas purchase of each zone after the game is less than the gas purchase of the whole park before the game. With respect to the electricity purchase, the electricity purchase of each zone after the game are transferred from peak time and normal time to valley time, which can play the role of peak shaving and valley filling.
According to the proposed model and solution method, the daily total cost and the energy efficiency of CHP system of each zone are calculated respectively. The results are compared with those of the whole integrated energy park before the game, as shown in Table 3. The summary cost of the zones is the total cost of the four zones costs, the summary efficiency of the zones is the average efficiency of the four zones.
Table 3 shows that after the non-cooperative game, the total cost of each zone is approximately 1742 USD less than the cost of the whole integrated energy park before the game, and the average energy efficiency of CHP system in various zones is about 2% higher than that in the whole park before the game.

6. Conclusions

To take into account the interests of various zones in the optimal scheduling of integrated energy parks, a double-layer optimal scheduling model of integrated energy parks based on non-cooperative game is proposed, which enables each zone to reach a balance through mutual game and get Nash equilibrium solution, thus making the most appropriate operation strategy. The following conclusions are drawn from the analysis of examples:
(1)
The model proposed in this paper can make the zones adjust their operation strategies more reasonably. After the game, the total cost of all the zones is less than the cost of the whole energy park before the game, and the average energy efficiency of CHP system is improved.
(2)
After the game, the amount of natural gas used by each zone has been reduced, which meets the needs of energy saving and emission reduction in the current age. At the same time, the purchase of electricity from the power grid is concentrated in the electricity valley, which has a certain role in peak shaving and valley filling.

Author Contributions

The author F.C. carried out the main research tasks and wrote the full manuscript. Y.G. proposed the original idea, provided financial support, analyzed and double-checked the results and the whole manuscript. Y.Y. contributed to data processing and summarizing the proposed ideas. H.L. provided technical and financial support throughout, while Y.C. modified the English language.

Funding

The National Nature Science Foundation of China (51607068); The Fundamental Research Funds for the Central Universities (2018MS082); The Fundamental Research Funds for the Central Universities (2017MS090).

Acknowledgments

This work is supported in part by the National Nature Science Foundation of China (51607068), the Fundamental Research Funds for the Central Universities (2018MS082) and the Fundamental Research Funds for the Central Universities (2017MS090).

Conflicts of Interest

The authors declare no conflict of interest.

Abbreviations

The following abbreviations are used in this manuscript
IESintegrated energy system
P2Gpower to gas
CCHPcombined cool, heat and power
CHPcombined heat and power

References

  1. Qureshi, M.I.; Rasli, A.M.; Zaman, K. Energy crisis, greenhouse gas emissions and sectoral growth reforms: Repairing the fabricated mosaic. J. Clean. Prod. 2016, 112, 3657–3666. [Google Scholar] [CrossRef]
  2. Xiang, L. Energy network dispatch optimization under emergency of local energy shortage with web tool for automatic large group decision-making. Energy 2017, 120, 740–750. [Google Scholar] [CrossRef]
  3. Yang, Z.; Peng, S.; Liao, Q. Non-cooperative Trading Method for Three Market Entities in Integrated Community Energy System. Autom. Electr. Power Syst. 2018, 42, 32–39. [Google Scholar]
  4. Voropai, N.; Stennikov, V.; Senderov, S.; Barakhtenko, E.; Voitov, O.; Ustinov, A. Modeling of Integrated Energy Supply Systems: Main Principles, Model, and Applications. J. Energy Eng. 2017, 143, 04017011. [Google Scholar] [CrossRef]
  5. Tang, B.; Gao, G.; Xia, X.; Yang, X.; Bo, T.; Gangfeng, G.; Xiangwu, X.; Xiu, Y. Integrated Energy System Configuration Optimization for Multi-Zone Heat-Supply Network Interaction. Energies 2018, 11, 3052. [Google Scholar] [Green Version]
  6. Zeng, M. Key Support Technologies for the Future Development of Distributed Energy under the Background of Energy Internet. Electr. Age 2018, 1, 36–37. [Google Scholar]
  7. Chen, F.; Gao, Y.; Liang, H.; Duan, J. Energy Consumption Characteristic Evaluation Model and Energy Supply Partition Method of Integrated Energy Park Based on Geographical Partition. Electr. Power Constr. 2019, 6, 23–32. [Google Scholar]
  8. Patwal, R.S.; Narang, N. Optimal Economic Emission Scheduling of Integrated Energy Systems Using Heuristic Optimization Technique. In Proceedings of the 2018 2nd International Conference on Power, Energy and Environment: Towards Smart Technology (ICEPE), Shillong, India, 1–2 June 2018. [Google Scholar]
  9. Brożyna, J.; Mentel, G.; Szetela, B.; Strielkowski, W. Multi-Seasonality in the TBATS Model Using Demand for Electric Energy as a Case Study. Econ. Comput. Econ. Cybern. Stud. Res. 2018, 52, 229–246. [Google Scholar] [CrossRef]
  10. Yang, D.; Xi, Y.; Cai, G. Day-Ahead Dispatch Model of Electro-Thermal Integrated Energy System with Power to Gas Function. Appl. Sci. 2017, 7, 1326. [Google Scholar] [CrossRef]
  11. Ghasemi, A.; Banejad, M.; Rahimiyan, M. Integrated energy scheduling under uncertainty in a micro energy grid. IET Gener. Transm. Distrib. 2018, 12, 2887–2896. [Google Scholar] [CrossRef]
  12. Khani, H.; Farag, H.E.Z.; Farag, H.E.Z. Optimal Day-Ahead Scheduling of Power-to-Gas Energy Storage and Gas Load Management in Wholesale Electricity and Gas Markets. IEEE Trans. Sustain. Energy 2018, 9, 940–951. [Google Scholar] [CrossRef]
  13. Zhang, L. Analysis and Forecast of Market Clearing Price Law; North China Electric Power University: Beijing, China, 2007. [Google Scholar]
  14. Cao, J. Current Electricity Market and Generator Bidding; Xiamen University: Xiamen, China, 2001. [Google Scholar]
  15. Liu, Y. Improving the natural gas pricing mechanism for residential consumers in China. Nat. Gas Ind. 2018, 38, 130–141. [Google Scholar]
  16. Zhao, S.; Ying, G. On Natural Gas price mechanism given present context of China’s natural gas industry. In Proceedings of the 2008 International Conference on Management Science and Engineering 15th Annual Conference Proceedings, Long Beach, CA, USA, 10–12 September 2008; pp. 1873–1879. [Google Scholar]
  17. Yu, C.; Wang, J.; He, N. A Study of the Supplementary-firing Burner Unit for a Heat Recovery Steam Generator. J. Eng. Therm. Energy Power 2004, 19, 534–536. [Google Scholar]
  18. Li, P.; Zang, X.; Liu, Y.; Liu, L. Rational determination to heat and power ratio for distributed CHP Plant. Gas Turbine Technol. 2005, 4, 43–46. [Google Scholar]
  19. Colson, B.; Marcotte, P.; Savard, G. An overview of bilevel optimization. Ann. Oper. Res. 2007, 153, 235–256. [Google Scholar] [CrossRef]
  20. Shi, J.; Xu, J.; Zeng, B.; Zhang, J. A Bi-Level Optimal Operation for Energy Hub Based on Regulating Heat-to-Electric Ratio Mode. Power Syst. Technol. 2016, 40, 2959–2966. [Google Scholar]
  21. Fu, S.; Su, Z. Dynamic Power Strategy Space for Non-Cooperative Power Game with Pricing. In Proceedings of the 2017 IEEE 86th Vehicular Technology Conference (VTC-Fall), Toronto, ON, Canada, 24–27 September 2017; pp. 1–6. [Google Scholar]
  22. Wu, F.; Liu, X.; Sun, Y.; Chen, N.; Yuan, T.; Gao, B. Multi-Park Game Optimizing Strategy Based on CCHP. Autom. Electr. Power Syst. 2018, 42, 68–75. [Google Scholar]
  23. Yang, Z.; Zhang, F.; Liang, X.; Han, X.; Xu, Z. Economic Operation of Microgrid with Heat Pump and Energy Storage. Power Syst. Technol. 2018, 42, 1735–1743. [Google Scholar]
  24. Wang, H. Study on Optimum Configuration of Natural Gas Cogeneration System Based on Gas Turbine; Hunan University: Changsha, China, 2015. [Google Scholar]
  25. Mao, M.; Jin, P.; Zhang, L.; Ding, Y.; Xu, H. Optimization of Operation Strategies and Economic Analysis of PV Microgrid for Industries. Trans. China Electrotech. Soc. 2014, 29, 35–45. [Google Scholar]
  26. Bao, N.; Zhu, R.; Ni, W. Cost of electricity analysis of the hybrid power system combining wind farm with gas turbine. Gas Turbine Technol. 2006, 4, 1–5. [Google Scholar]
Figure 1. Energy utilization framework of a typical integrated energy park.
Energies 12 03164 g001
Figure 2. Double-layer optimal scheduling model.
Energies 12 03164 g002
Figure 3. Solution flow chart.
Energies 12 03164 g003
Figure 4. Schematic diagram of an integrated energy park.
Energies 12 03164 g004
Figure 5. Load and photovoltaic power generation of the park.
Energies 12 03164 g005
Figure 6. Optimal scheduling result of a zone. (a) Optimal scheduling result of electric load. (b) Optimal scheduling result of heat load. (c) Optimal scheduling result of cold load.
Energies 12 03164 g006aEnergies 12 03164 g006b
Figure 7. Comparison of gas purchase and electricity purchase of the park before and after the game. (a) Comparison of gas purchase. (b) Comparison of electricity purchase.
Energies 12 03164 g007aEnergies 12 03164 g007b
Table 1. Efficiency and operation cost of equipment in the park.
EfficiencyNumerical Value(%)Operation CostNumerical Value (USD/J)
ηeCHP35CHP system c11.37 × 10−9
ηGB90Gas boiler c28.7 × 10−11
ηec400Electric refrigeration unit c33.91 × 10−10
ηeh450Heat pump unit c41.05 × 10−9
ηhc70Absorption refrigeration unit c53.22 × 10−10
ηsto95Energy storage csto7.25 × 10−11
Note: In order to facilitate the calculation, the average efficiency of common types of equipment are chosen as the calculation data by consulting the relevant literatures.
Table 2. Pollutant emission intensity and environmental cost of pollutants in the park.
Pollutant SpeciesSO2NOxCOCO2TSP
Gas turbine (kg/J)6.4 × 10−133.4 × 10−1001.1 × 10−71.3 × 10⁻¹¹
Waste heat boiler (kg/J)2.4 × 10−91.1 × 10−93.4 × 10−112.3 × 10−75.3 × 10−11
Gas boiler (kg/J)2.6 × 10−131.6 × 10−1004.6 × 10−86.0 × 10⁻¹²
Environmental cost (USD/kg)0.871.160.1450.00330.319
Table 3. Comparison of cost and energy efficiency of combined heat and power (CHP) system in the park before and after the game.
ParameterTotal Cost Csum (USD)Efficiency (%)
Object
Zone 14795.474.14
Zone 24281.867.49
Zone 34210.870.79
Zone 44648.864.94
Summary of zones17,936.869.34
The whole park before game19,678.8267.33

