1. Introduction
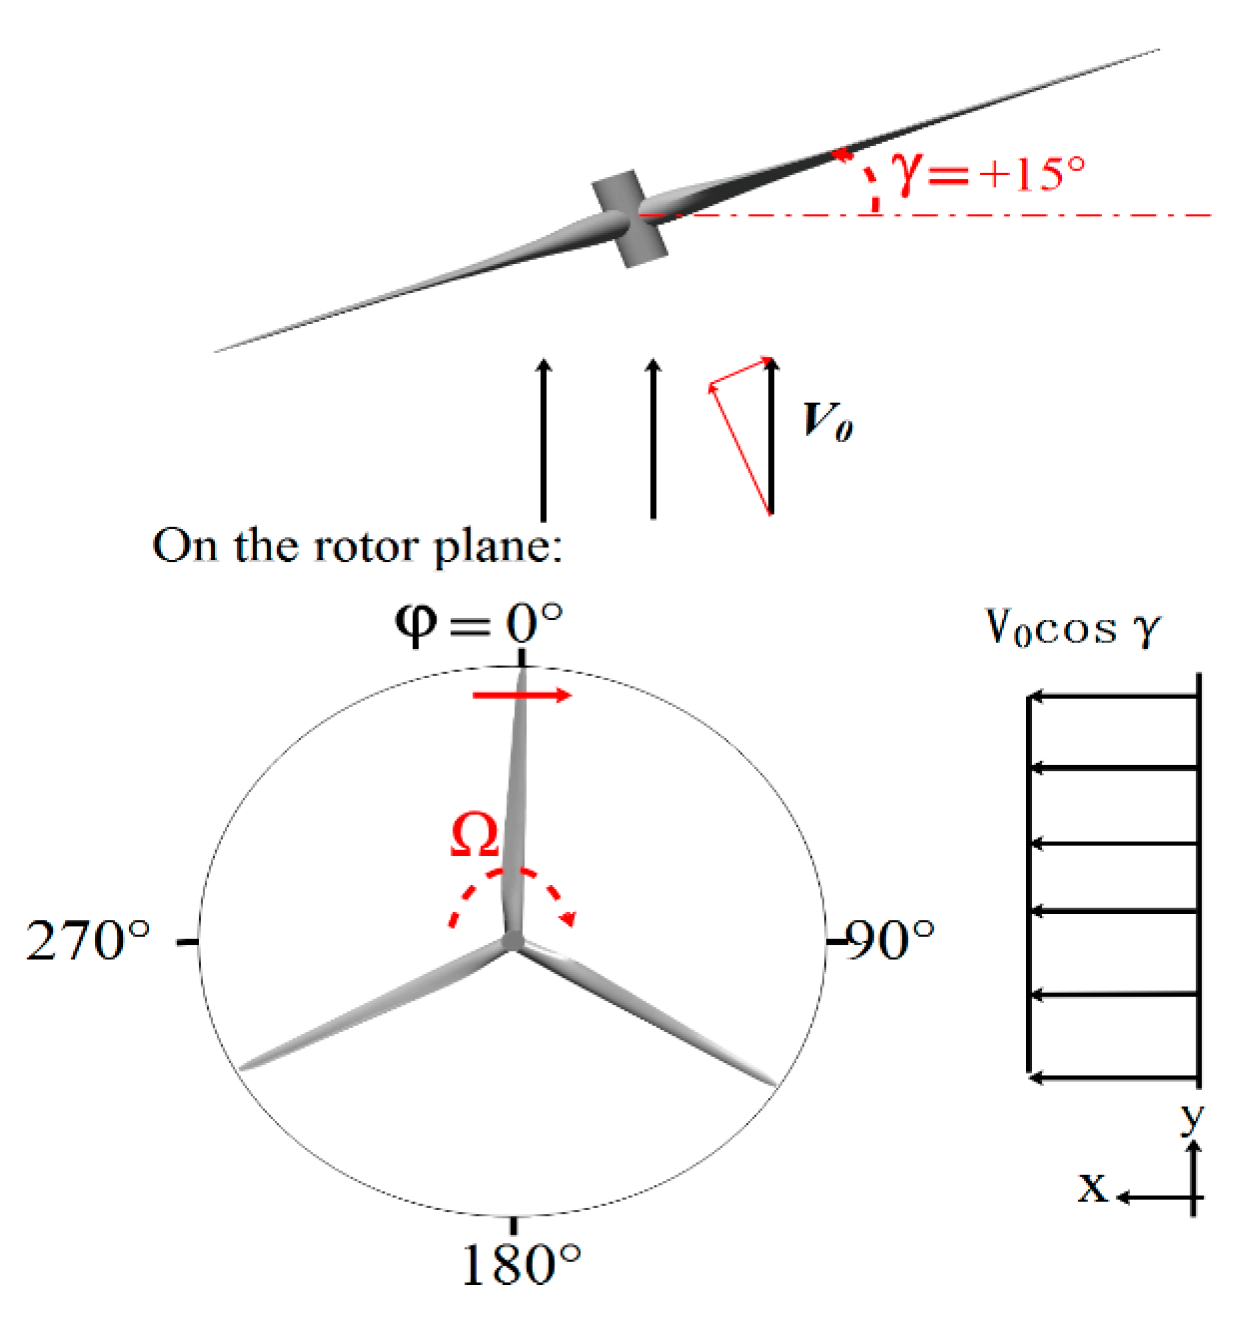
The use of wind power has grown rapidly over the past few decades. The aerodynamics of the wind turbine are a core subject of wind power generation. Owing to the intermittency of wind, the orientation of a wind turbine must be frequently adjusted, typically using the yaw mechanism, to ensure the rotor disk is perpendicular to the direction of the wind. Yaw control is one of the most important strategies for improving the efficiency of wind energy conversion. Under the yawed condition, velocity component of the upstream wind is parallel to the plane of rotation. Thus, the angle of attack of airfoil along blade spanwise exhibits periodic variation in one revolution [
1]. The aerodynamic performance of a wind turbine under yaw, as well as the surrounding flow, show highly unsteady characteristics, resulting in high fatigue loads that can dramatically reduce the operational life of a wind turbine. Therefore, understanding the unsteady aerodynamic characteristics of wind turbines under yaw is important for improving their design [
2]. In particular, accurate predictions of unsteady aerodynamic loads under yawed conditions are important for blade design and operational control.
Knowledge of complex three-dimensional (3D) flow phenomena over wind turbine blades and near wake under the yawing condition are still lacking. Thus, improved numerical models that consider the combined effects of stall delay, unsteady flow, and other significant effects such as the retreating & advancing effect and upwind & downwind effect are needed. The aim of present paper is to further elucidate the aerodynamic and 3D flow characteristics of yawed and yawing turbines.
The aerodynamics of wind turbines under yaw have been extensively investigated using both experiments and numerical simulations. Detailed aerodynamic performance measurements along the blade in combination with 3D flow field measurements have helped further our understanding of the flow mechanism. Wind tunnel experiments performed by Hand et al. [
3] on a two-blade wind turbine provide a benchmark for numerical simulations. In their study, Hand and colleagues obtained the pressure and aerodynamic force coefficients for an azimuthal distribution at different radial locations under five yawed cases: 0°, 10°, 30°, 45°, and 45°. The angle of attack was found to vary approximately with the blade azimuth angle according to a sinusoidal function. Further to this, Schepers et al. [
4] performed wind tunnel experiments on a three-bladed wind turbine, the MEXICO rotor, under three different yaw angles: 15°, 30°, and 45°. They obtained sectional aerodynamic forces and torques for different azimuth angles; however, the sinusoidal variation rule did not correlate well along the inner span of the blade owing to the velocities induced by root vortices. Sant et al. [
5] investigated the TUDelft reference rotor in an open jet wind tunnel under both axial and yawed conditions and assessed the blade element moment (BEM) method, which was found to be limited to the skewed wake under yawed conditions.
Based on the work of Schepers et al. [
6], Micallef et al., performed stereo particle image velocimetry measurements to study the blade aerodynamic performance and near wake development. Under yaw, flow in the windward region exhibited inboard motion due to rapid motion of the tip vortices away from the blade. In field tests, Ven et al. [
7] applied in-field measurements of a turbine to investigate the three dimensional stall phenomena under yawed inflow conditions. Imbalances in the crossflow fraction along the radial direction of the blade were observed between azimuth angles of 90° and 270°. The phenomenon is caused by yawed inflow leading to in-wash and outwash on the blade surface. Furthermore, Dai et al. [
8] provided a detailed investigation of the yaw effect based on Supervisory Control and Data Acquisition (SCADA), and presented characteristics of the power coefficient and rotor torque under yaw. Interestingly, many yaw error control solutions based on the smart prediction of the wind direction had been used to maximum power extraction of wind power [
9,
10]. Further to this, Saenz-Aguirre et al. [
11] claim that the drawbacks of the yaw control are the very large time constant and the strict yaw angle rate owing to the high mechanical loads, resulting that yaw control is less studied in the literature than that pitch and speed control. Furthermore, Munters et al. [
12] performed wind-farm control research with a new dynamic yaw control based on the large-eddy simulation, and found that with the consideration of the unsteady-control interacting with flow dynamics, dynamic yaw control for the given wind farm setup is better than induction control in the process of power extraction. In fact, the yawing operation of wind turbine is very common, and the aerodynamic characteristics of wind turbine under yaw had been extensively studied in the literature with numerical simulation.
Numerical methods to evaluate the aerodynamic performance of wind turbines mainly include BEM, vortex theory, and computational fluid dynamics (CFD). The most commonly used method is BEM, which is fast with low computational costs. Ryu et al. [
13] developed a successive under-relaxation technique based on the classical BEM to compute specific radial locations of the blade and found that yawed inflow leads to periodic changes in the angle of attack on different spanwise sections. Jimenez et al. [
14] firstly established an analytical wake model with a simple formula to predicit the wake skew effect based on the momentum conservation and top-hat model offered by Jensen [
15] for the velocity deficit effect. However, the experimental validation was not sufficient as mentioned by the author and the model overestimate the wake deflection of wind turbine, owing to the inaccurate top-hat model for velocity deficit. With the goal of optimize the yaw angles of the wind turbines, Gebraad et al. [
16] presented a new flow redirection and induction in steady-state model based on internal parametric model for wake effects, which demonstrate the optimization control for increasing the energy production of the wind plant. Recently, Bastankhah and Porte-Agel [
17] developed a new analytical model on the assumption of the Gaussian distribution to predict the wake deflection and far wake velocity deficit, which showed a good agreement with the experimental data. However, some parameters of that model have not specified which is needed to be researched. Based on the works of them, Qian Guo-Wei et al. [
18] presented a new analytical wake model with Gaussian distribution function of velocity deficit and momentum conservation in the lateral direction, considering the ambient turbulence intensity, thrust coefficient and yawed effect, which enables the model to have good application under various conditions. Yaw not only influences the wake flow behind the wind turbine, but also flows on the surface of the blade and 3D aerodynamic characteristics of the rotor [
19]. Castellani [
20] analyzed a small three-blade wind turbine and investigated the effects of large yaw angles, using numerical and experimental methods, and found that the 3P blade frequency is clearly visible. In addition, non-uniform flow around the blades was modeled using a simplified wake model modified by Prandtl’s tip loss factor.
The time constant used in dynamic inflow models results in an unrealistic drop at the tip region, and therefore, cannot accurately model for the dynamic conditions of wind turbines. For instance, both the tip loss model and dynamic inflow model have several shortcomings when used for non-design load cases but can possibly be improved by free vortex methods (FVM), which combine the blade aerodynamics with wake flow computational models. Qiu et al. [
21] investigated the dynamic variation of loads on a wind turbine blade during the yaw process using an improved lift line method and proposed a wake model comprised of the vortex sheet model and tip vortex model. Further, the yaw rate and dynamic wake were shown to significantly influence the shaft thrust and torque of the wind turbine. Micallef et al. [
22] performed both experimental and numerical investigations based on an FVM to investigate the tip vortex generation of a horizontal-axis wind turbine (HAWT) under yaw. Vorticity on the suction side under non-yawed conditions was shown to be more concentrated than for the yawed condition, in which vorticity spreads over a small region at the tip of the turbine blade.
Several aerodynamic correction models have been proposed and widely used, including Pitt and Peter’s yaw correction [
23,
24], Suzuki’s dynamic inflow model [
25], Prandtl’s tip loss function [
26], Du and Selig’s 3D stall delayed model [
27], and Buhl’s wake correction [
28]. Nonetheless, classical BEM and FWM are still not sufficiently reliable for predicting the aerodynamic load distributions on wind turbine blades, especially for the yawed and stalled rotor conditions. Investigations were performed on the complicated yaw aerodynamic problem of wind turbines using more accurate CFD simulations using detailed visualization of the 3D flow [
29]. Tongchitpakdee et al. [
30] investigated the aerodynamic characteristics of the National Renewable Energy Laboratory (NREL) Phase VI wind turbine modeled by an unstructured grid under different wind speeds and yaw angles using the BL model. At low wind speeds (<7 m/s) and under low yaw angles, the flow remains attached over most regions of the rotor. Further to this, Yu et al. [
31] performed time-accurate aerodynamic simulations of the NREL Phase VI wind turbine under yawed flow conditions, which was also modeled with an unstructured mesh, along with the
k-
ω shear stress transport (SST) turbulent model. They found that the retreating side shown aerodynamic loads (
Cn,
Ct) higher magnitudes of loads than on the advancing side. However, the three-dimensional unsteady stall effect at different yaw angles was not studied. Schulz et al. [
32] modeled and analyzed a generic 2.4-MW wind turbine with over-set structured grids and yaw angles ranging from −50° to 50° using the FLOWer CFD solver. The simulation was performed using a detached eddy simulation method and revealed azimuthal non-uniformity of the load variation along spanwise sections of the blade due to the retreating & advancing effects of the blade. Furthermore, the deformation characteristics of the blade were considered in the yawed case of the wind turbine simulation. Jeong et al. [
33] investigated the effects of yaw errors on the aerodynamic and aeroelastic behaviors of NREL 5-MW HAWT blades, and showed how yaw misalignment adversely affects the dynamic aeroelastic stability of the blade. Dai et al. [
34] performed an aeroelastic analysis on the Tjæreborg wind turbine under yaw, and found that fluid-solid coupling results in higher averaged power and thrust, as well as violent oscillation amplitudes.
Yaw is a continuous rotation process with a constant or variable velocity of rotation. Qiu et al. [
21] investigated the shaft torque of the blade and instantaneous wake flow under the dynamic yawing process with a yaw rate between 5 and 20°/s for the NREL Phase VI wind turbine. For larger wind turbines, such as the NREL 5-MW et al., these yaw rate seem to be impossible owing to the larger moment of inertia of the rotor-nacelle subsystem due to enlargement of the blade and tower length. Leble et al. [
35] carried out a series of CFD simulations to investigate the performance of the DTU 10-MW wind turbine and modeled the turbine as a structured grid with moving boundaries. Simulations were performed with a yaw rate of 0.3°/s and 3° yaw angle and the results showed that overall power under the dynamic yawing condition was much larger than for the yawed case. Then, Wen et al. [
36] investigated the NREL 5-MW yawing dynamic sinuous motion with an averaged yaw rate of 1.2°/s and 2.4°/s for the case of
f = 0.1 Hz and
f = 0.2 Hz, respectively. The dynamic yaw motion induced the upwind & downwind yawing effect, which considerably influenced the AOA of blade sections. As the blade is yawing upwind, the AOA increases and vice versa. In summary, the unsteady aerodynamic characteristics of wind turbine blades under yaw considering full 3D rotational effects are still unclear. In the present paper, unsteady dynamic CFD simulations were performed to investigate the aerodynamic characteristics of a wind turbine blade during the rotational revolutions using a full 3D wind turbine model. With the assumption of the rigid body, the main contribution of this paper is the proposal of a new grid methodology for analyzing the overall performance using URANS simulation, aerodynamic loads, and flow field of wind turbines in the yawed and yawing processes. The method can be used to analyze interactions between transient aerodynamic phenomena associated with the wind turbine control system. The other main objective of this study was to investigate the effects of yaw on the dynamic output power, rotor thrust, and the blade sectional aerodynamic characteristics caused by continuous changes in the yaw angle. The main novelty of the current work is the inclusion of the dynamic yawing simulation of wind turbine with the multiple structured domain sliding mesh. The rest of this paper is organized as follows:
Section 2 describes the geometry model and computational method. In
Section 3, simulation results under several yaw angles are compared to experimental data to validate the model. The discussion mainly focuses on the sectional azimuthal variations of aerodynamic force coefficients, as well as the pressure distribution on the blade. Finally, the conclusions are summarized in
Section 4.
3. Analysis of Results
The NREL 5-MW reference wind turbine (RWT) was studied [
28]. The yawed and yawing wind turbines were considered. The parameters used in the simulation are listed in
Table 1 for each case. Two of the cases assumed uniform inflow and the blades were assumed to be rigid in the model.
Physically, the flow-field around a rotating HAWT is significantly influenced by the existence of wind shear, turbulence, gust, and yaw motion of the nacelle. For a yawing wind turbine, flow characteristics are more complex than those of a static yawed wind turbine, and the additional wind contribution effects transmitted to the rotor due to the nacelle motion must be considered. Therefore, accurate prediction of the unsteady aerodynamics calculated by many conventional numerical approaches is still questionable for a yawing wind turbine. In this study, unsteady CFD simulations based on the sliding structure mesh technique were performed to analyze the yawing motion of the wind turbine due to the nacelle motion. Thus, to investigate the effects of vortex-wake-blade interactions on the aerodynamic performance of the wind turbine, the yawing motion of the rotating turbine blades due to the nacelle motion was considered.
The CFD method was first verification with grid independence, turbulent model studies and time step studies. Then the computational results are validated using both fixed yaw and yawing of the NREL 5-MW wind turbine. The unsteady aerodynamic loads of the yawing wind turbine were more sensitive to change as the yaw angle was varied. Nine simulation conditions were performed based on a fixed yaw angle of 0°, 5°, 10°, 15°, 20°, 25°, and 30°.
Next, the total aerodynamic performance, which was used to validate the results of the simulation, will be discussed. Thereafter, aerodynamic characteristics and three-dimensional stall characteristics at different span sections will be investigated. Finally, the results of two separate simulations of the yawing start-stop stage will be used to examine the mechanism of the yawing effect.
3.1. Verification of the Computational Results
3.1.1. Grid Independence
Table 2 shows the different torques calculated for five different numbers of cells. Every mesh was refined along the airfoil circumferential direction. The grid numbers were computed in the T-SST turbulent mode and simulations were performed with the following grid numbers: 1.6 million, 3.09 million, 3.67 million, 5.31 million, and 6.05 million. In addition, two grid numbers (1.6 million and 3.67 million) were investigated under different yaw angles (10° and 20°), as shown in
Table 2. For non-yaw condition, the design torque at 11.4 m/s is about 4.08 × 10
6 N·m, which is taken as a reference value. The relative errors for the results using other four mesh are 1.9~0.49%. The relative error for mesh of 3.67 million cells is smaller than 1% and the computational cost using this mesh is moderate. Thus this mesh was selected for further investigation.
3.1.2. Turbulent Model Studies
In this section, we present results of the unsteady independence study based on four turbulent models: SST,
k-
kl-
, Reynold stress, and T-SST. The rotor torque under axial flow obtained for each turbulent model is presented in
Table 3. The computed torque was similar for each of the four turbulent models. The simulation cases using the SST model and Reynold stress model were used to interpret the fully developed flow mechanism without transient processes, resulting less torque compared to using Transient SST turbulent model. When the wind turbine operates under low wind speeds, transient phenomena occur on the suction side of the blade; therefore, the T-SST turbulent model was selected for static and yawing process studies.
3.1.3. Time Step Studies
In the unsteady numerical simulation, the time step could influence the overall performance of the model, therefore, it is necessary to investigate time-step independence.
Table 4 lists the averaged rotor torques during one revolution for non-yawed case obtained using the T-SST turbulent model with three different time steps (72, 144, and 360). The comparisons show slight differences among the results (less than 3%). The result using 72 time steps in one revolution gave a better agreement comparing to the designed value. Considering the computational cost, a time step of 72 during one revolution was selected for subsequent simulations.
3.2. The Validation of Numerical Simulation Results for Yawed Wind Turbine
After the verification of the simulation, the subsections below will show some aerodynamic analysis of wind turbine under yawed and yawing simulation.
3.2.1. Overall Performance Analysis for Different Yaw Angles
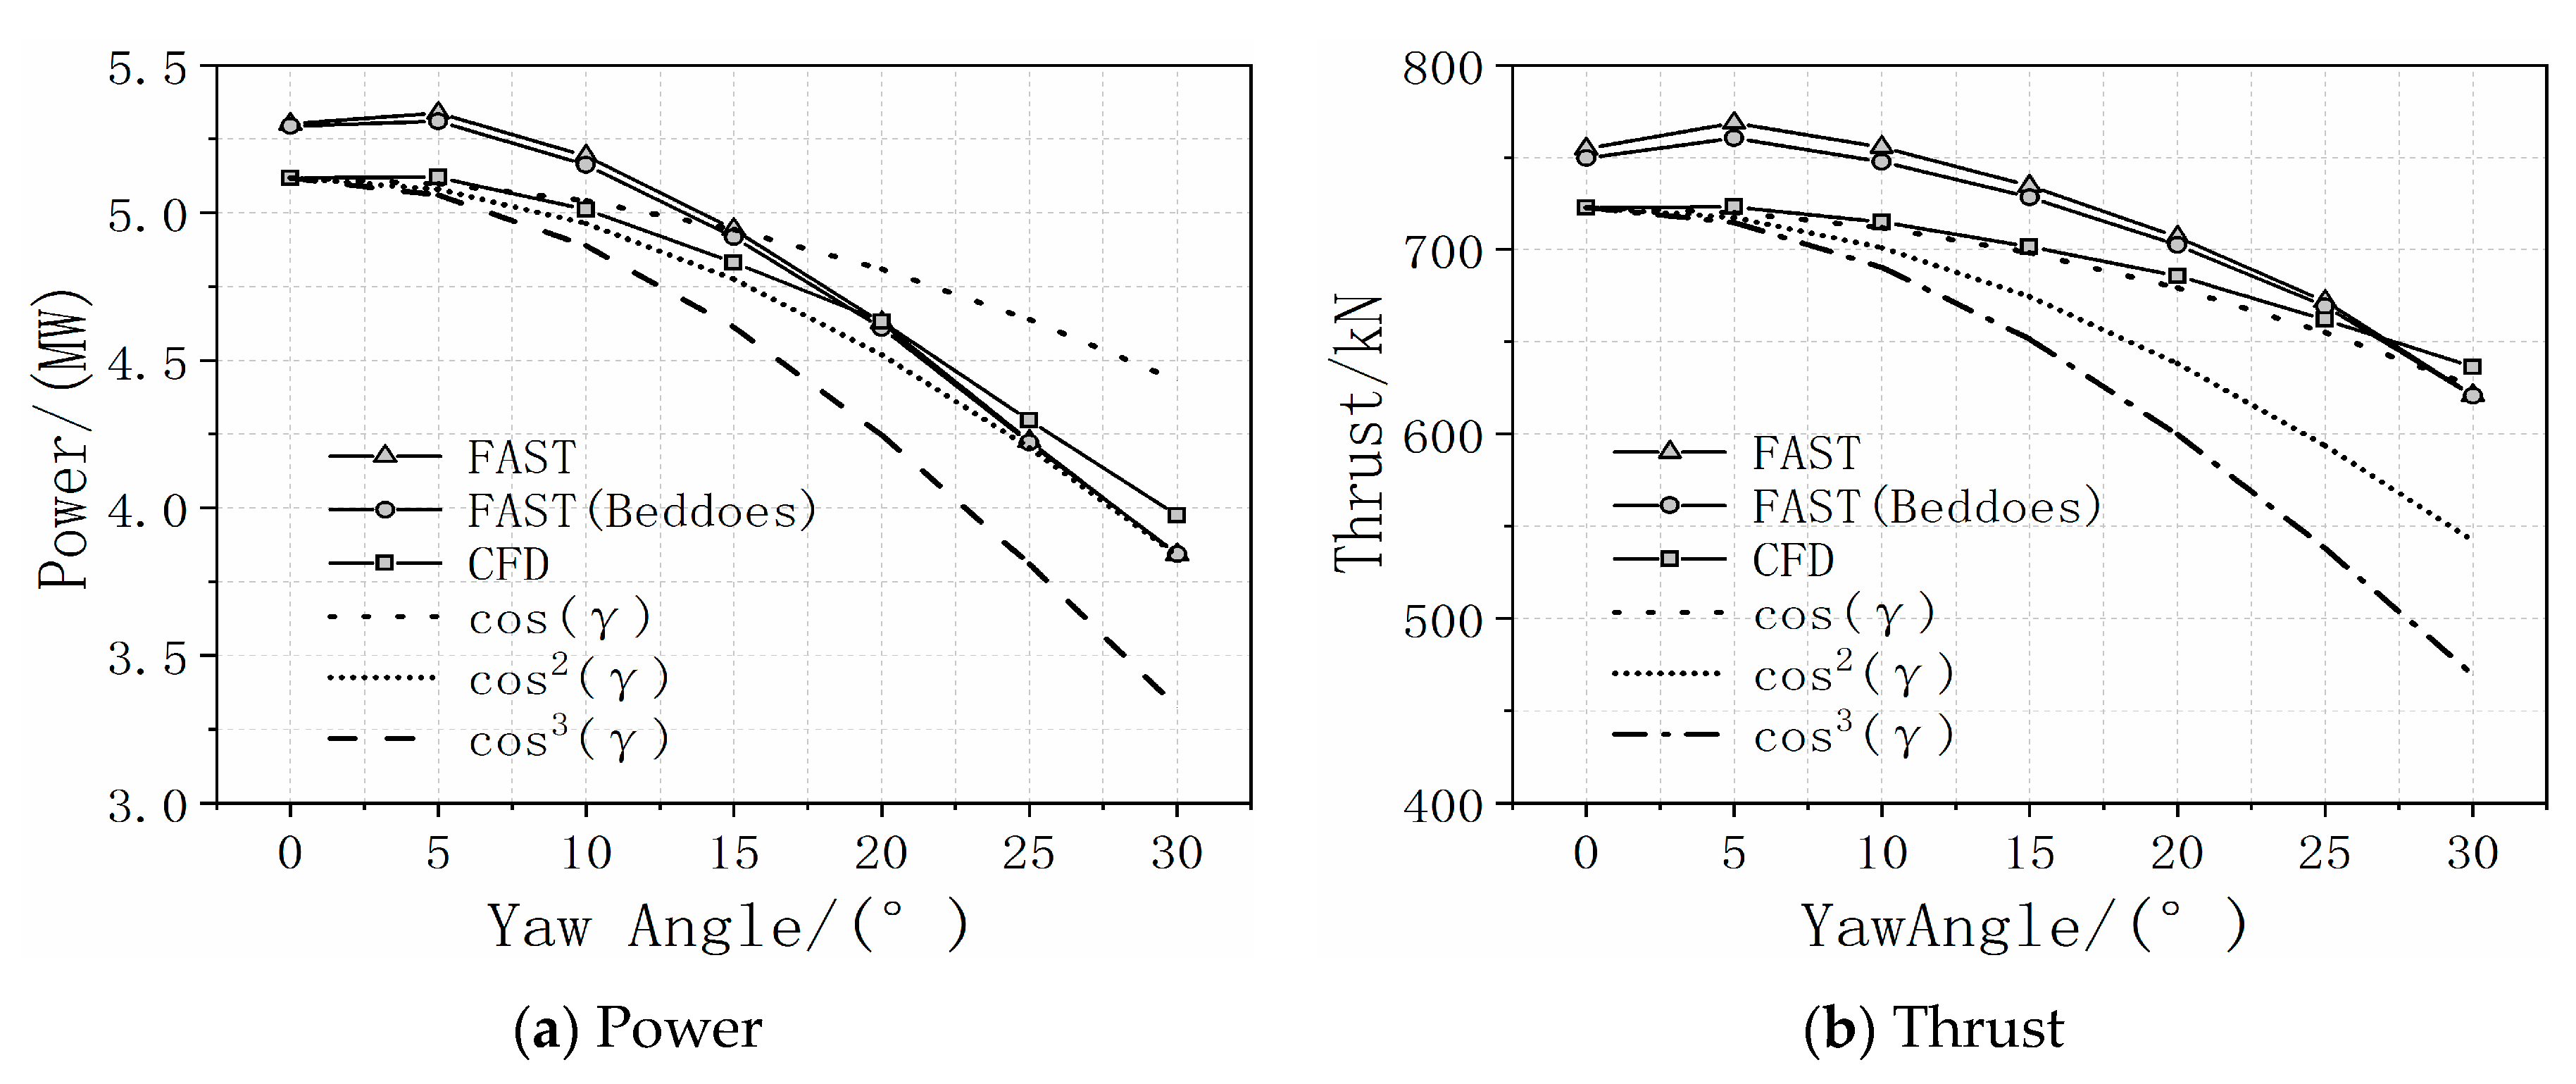
Figure 7 shows the overall performance of the rotor under yaw. As shown in
Figure 7a, only a small amount of variation in rotor power can be observed under small yaw angles (≤5°). When the yaw angle exceeds 5°, the rotor torque significantly decreases as the yaw angle increases. The torque value computed using the BEM method, with or without the Beddoes stall model, is higher than the value computed by CFD since the BEM computation does not consider flow separation and flow transient phenomena. Zhu [
39] extensively investigated the combined effects of rotational augmentation and dynamic stall, and found that the hysteresis loop of aerodynamic load is much larger compared to 2D simulations. In fact, for the NREL 5-MW wind turbine and a wind speed of 11.4 m/s, flow separation and 3D radial flow mainly occur on the inner board region, resulting in a lower torque and lower thrust. The deviation in the power and thrust between CFD and BEM was 4.1% and 5.91%, respectively. Compared with the axial free inflow, the three functions on cos(
γ), cos
2(
γ), cos
3(
γ) of the power and thrust are shown with dashed, dotted and dash-dotted line, respectively. The variation of averaged power in yaw conditions will decrease by cos
2(
γ); the averaged thrust agrees well with cos(
γ).
3.2.2. Aerodynamic Load Analysis along the Span of the Blade
Theoretical analysis is necessary to determine the mechanism behind the yawed effect.
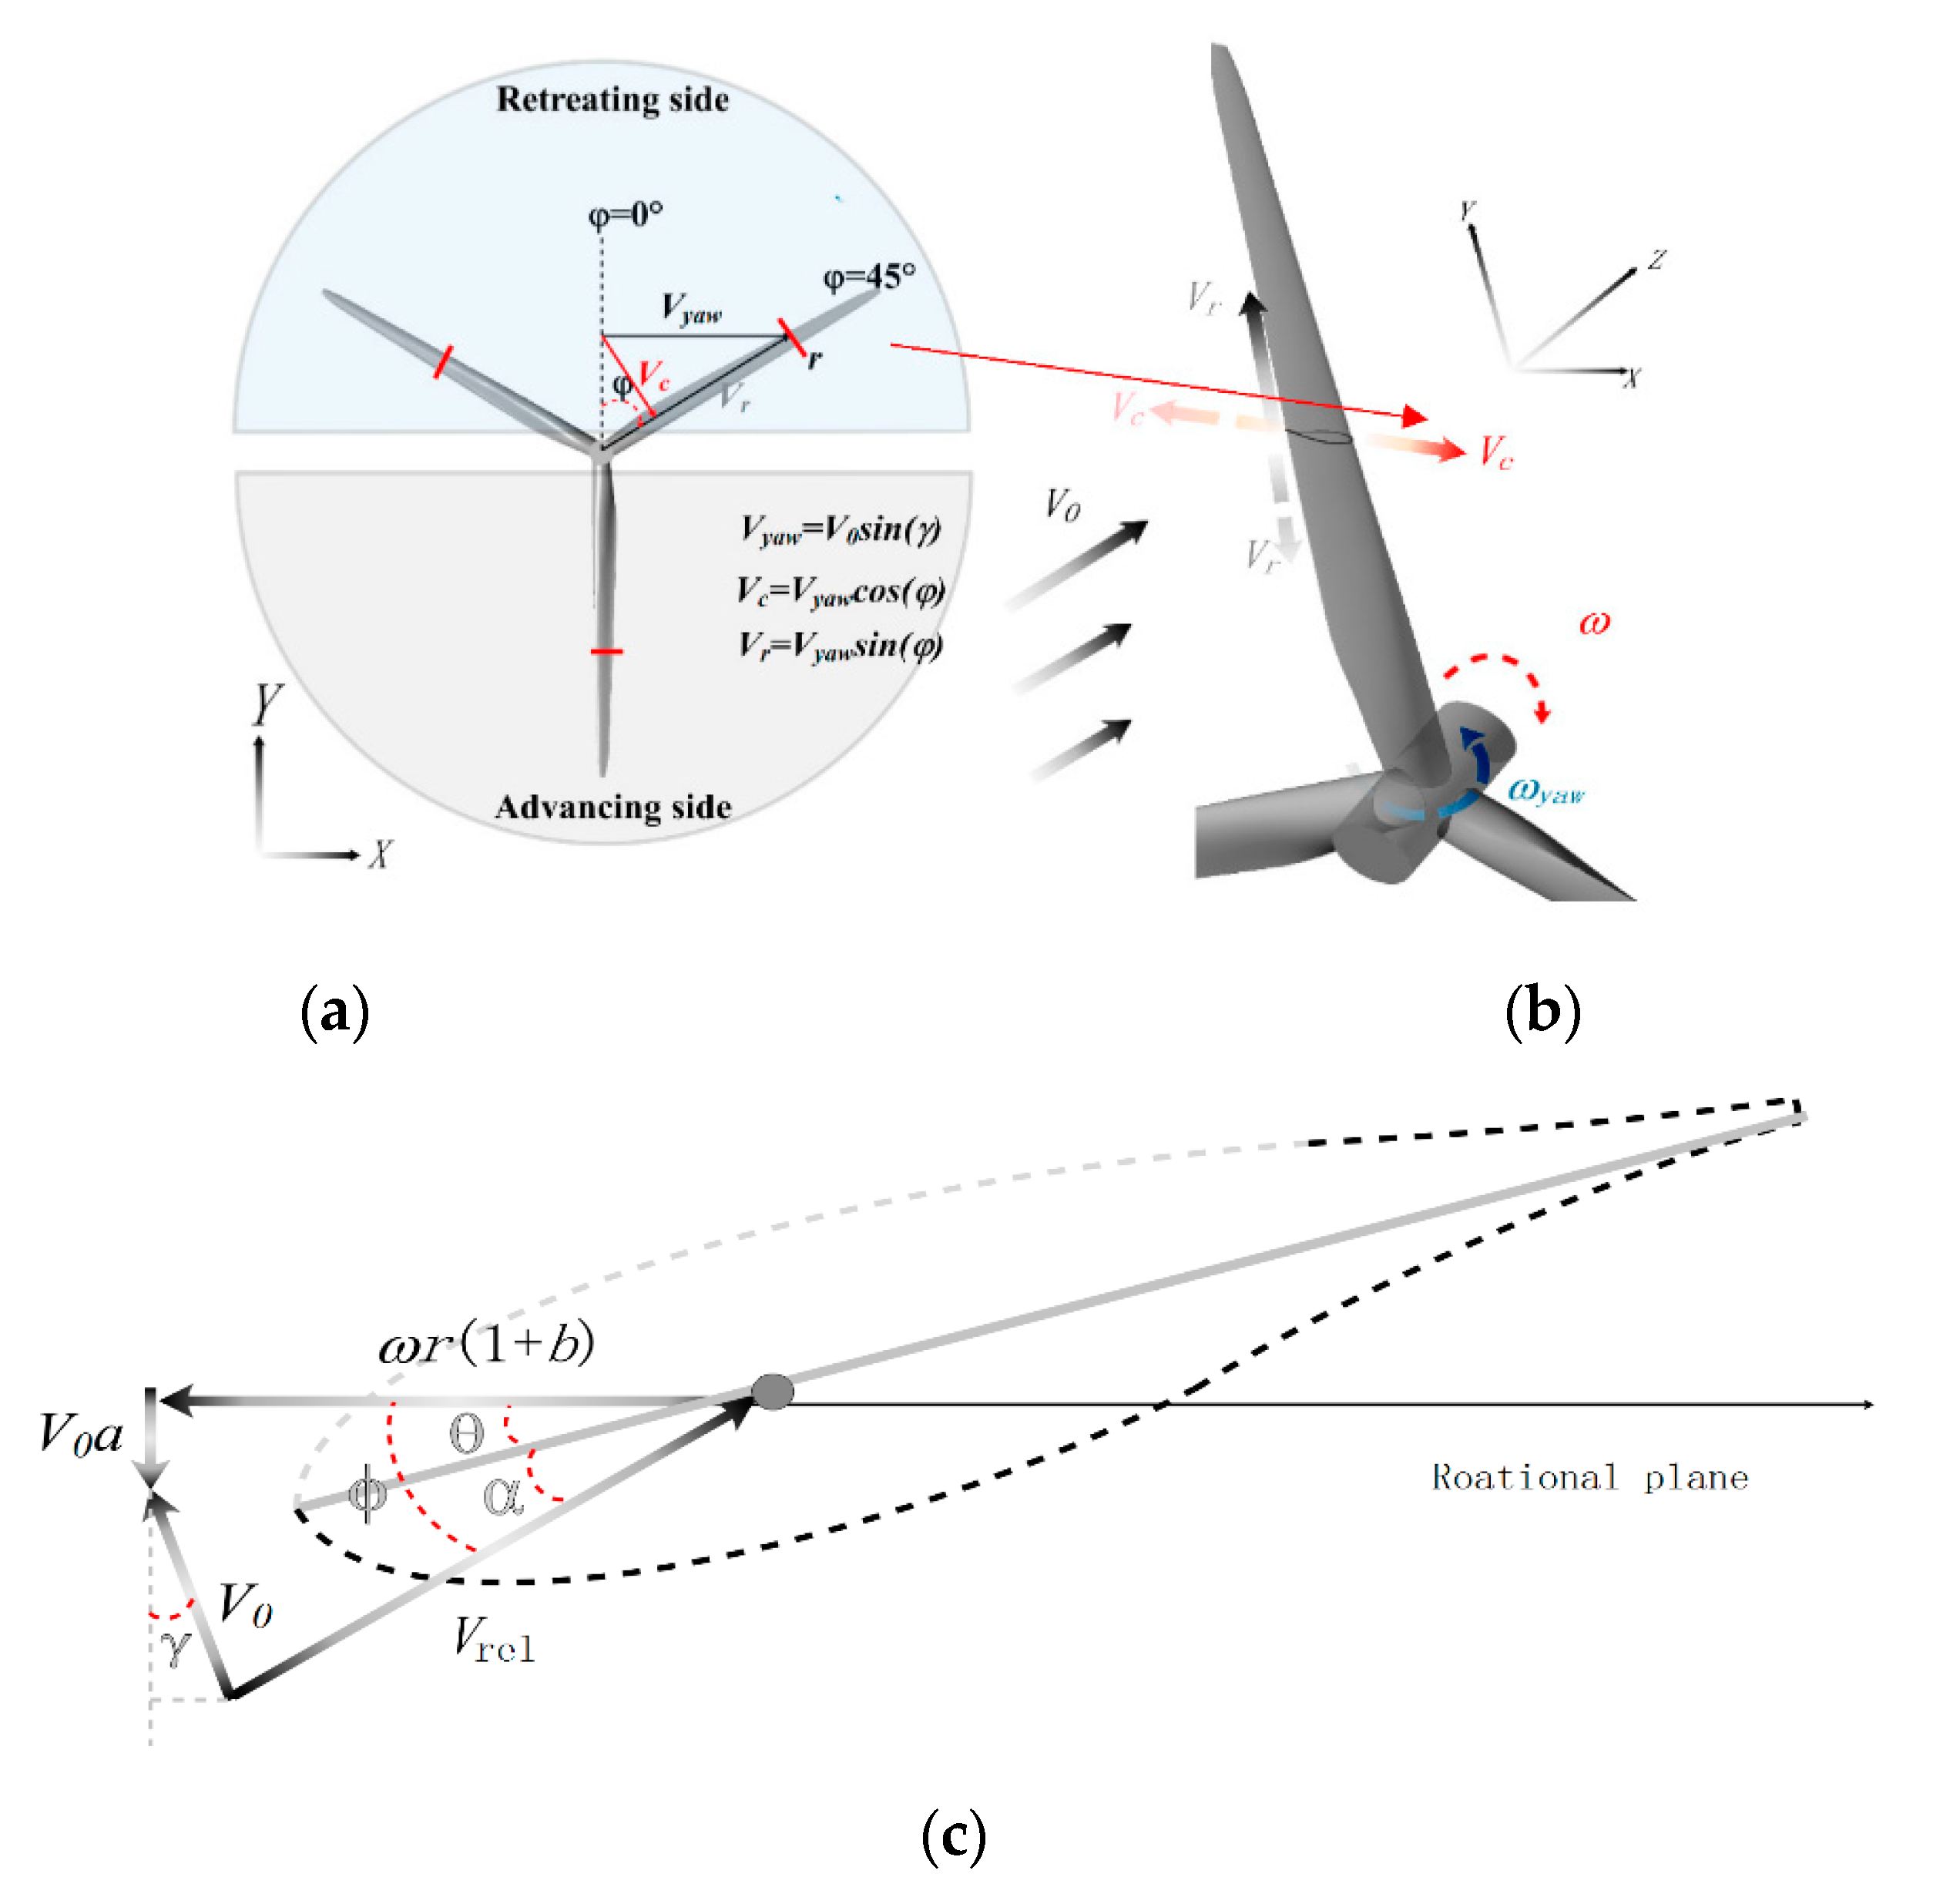
Figure 8 shows the velocity diagram under the yawed condition. A velocity component exists in the blade revolution plane and can be projected into radial and chordwise components denoted
Vr and
Vc, as shown in
Figure 8a. The retreating and advancing effects occur because of
Vc, which causes the sectional load and AOA to fluctuate periodically. The maximum AOA and maximum load occur when the blade is in the 12 o’clock direction in the current simulation setup. Additionally, loads on the retreating side are much larger than on the advancing side.
Figure 9b,c quantify the influence of
Vc, which is calculated by:
(1) Time-averaged load analysis on spanwise section under yawed condition
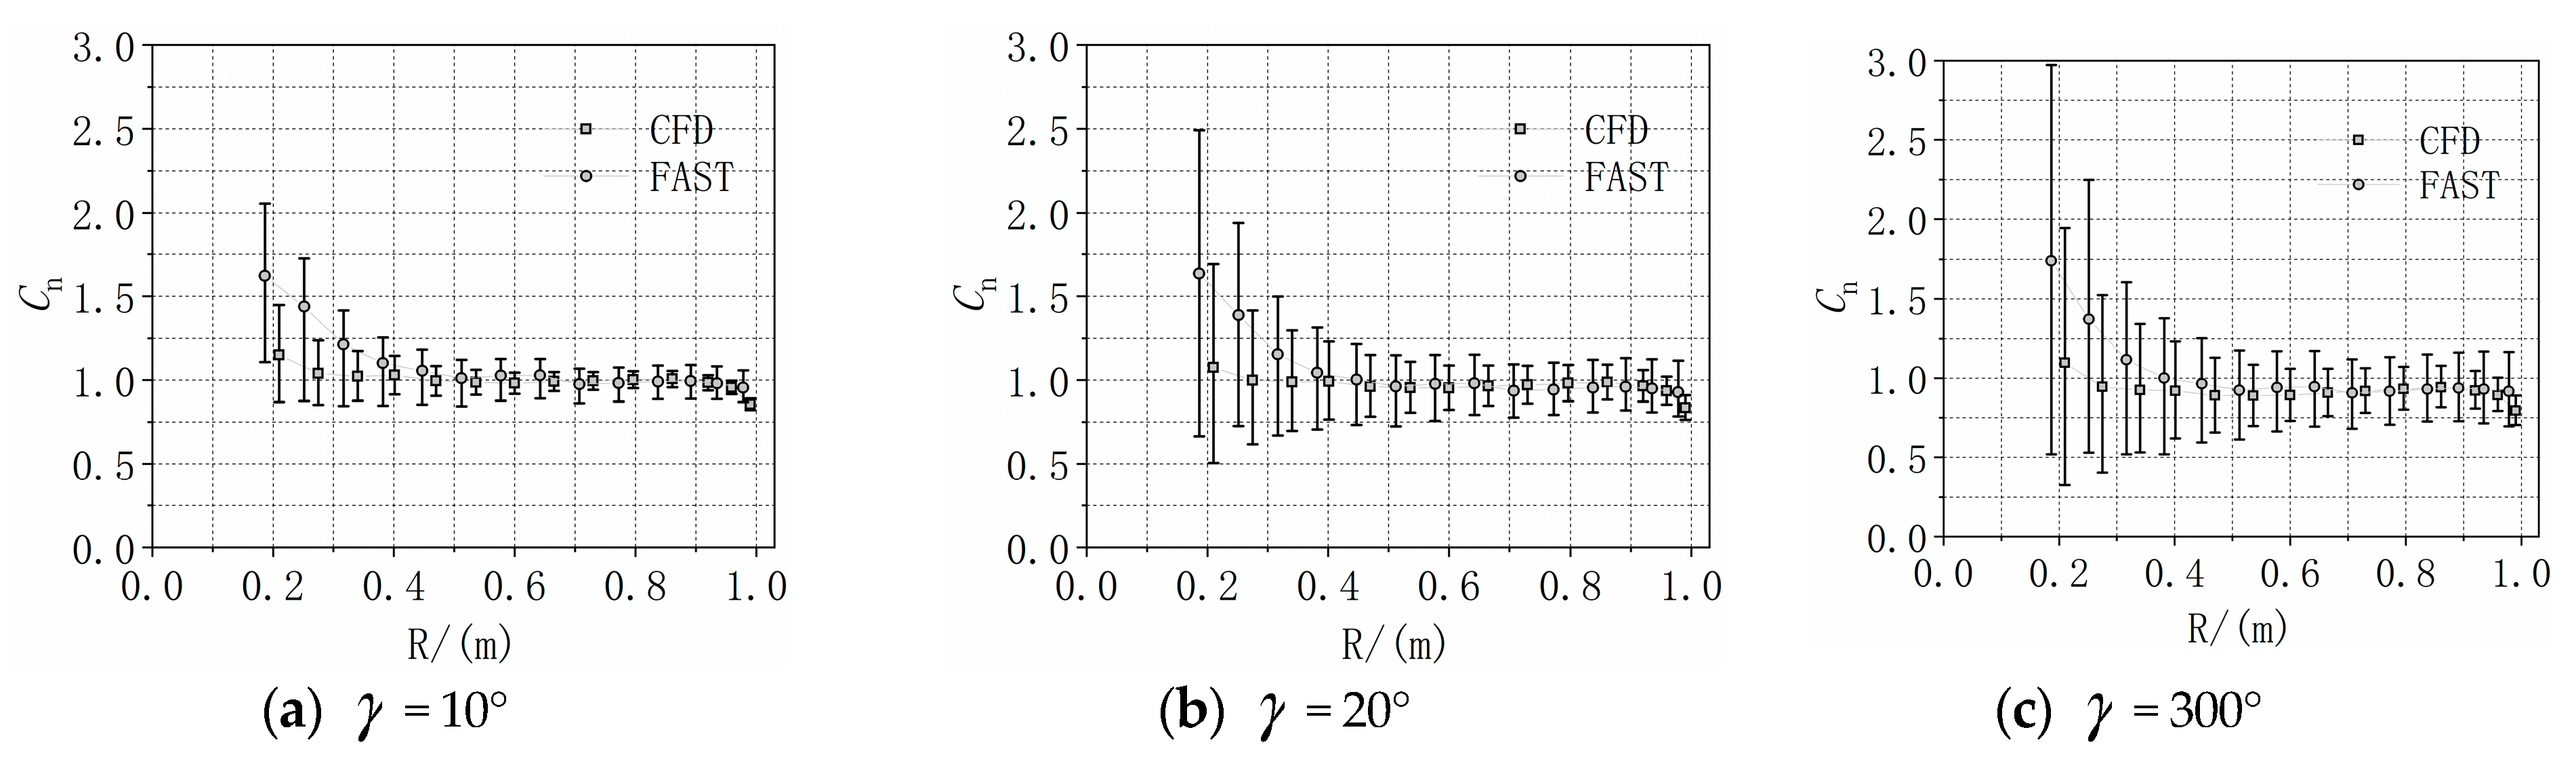
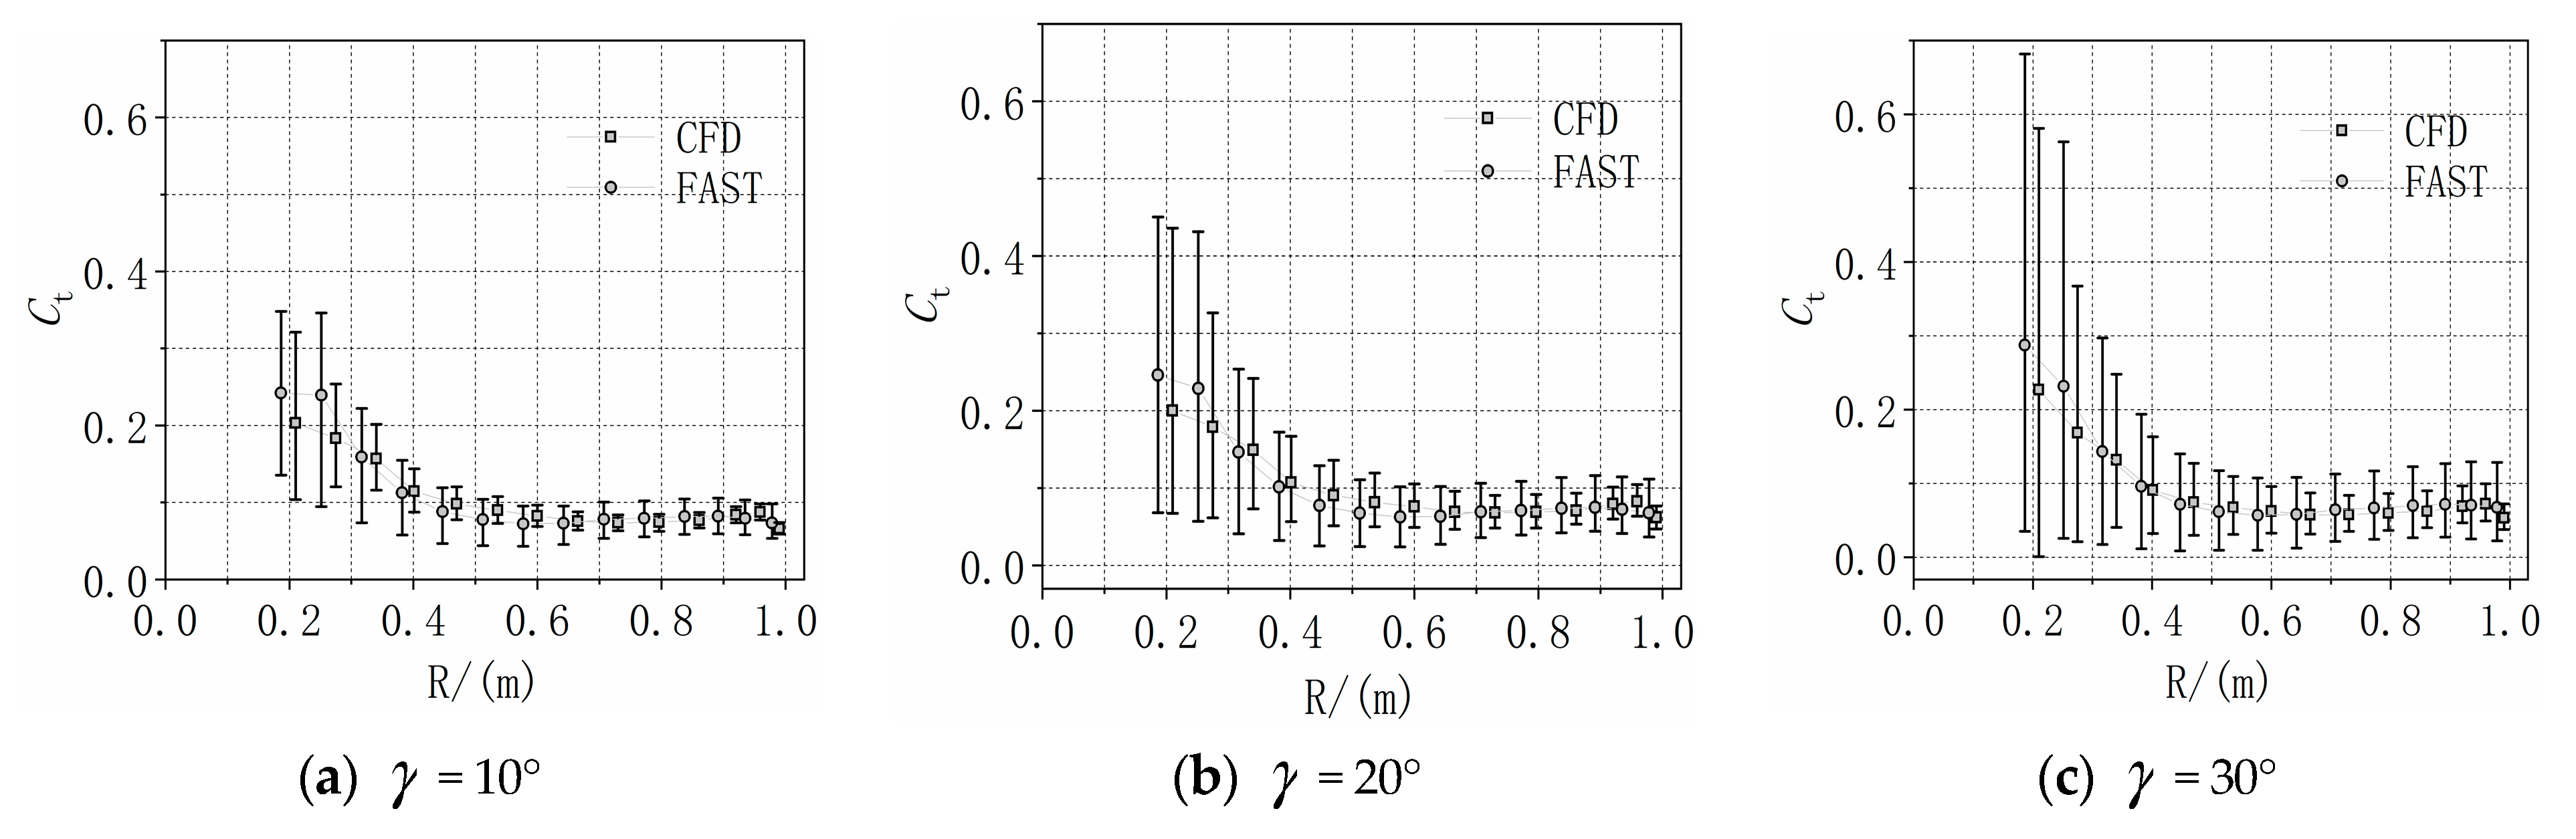
Figure 9,
Figure 10 and
Figure 11 show the analysis of the variation of averaged AOA,
Cn, and
Ct under one rotor revolution. The value of
Cn and
Ct is calculated by:
where
Cp-up and
Cp-down denote the pressure coefficients in the upper and down side of the airfoil, respectively;
y0 and
y1 mean the leading edge position and trailing edge position of the airfoil.
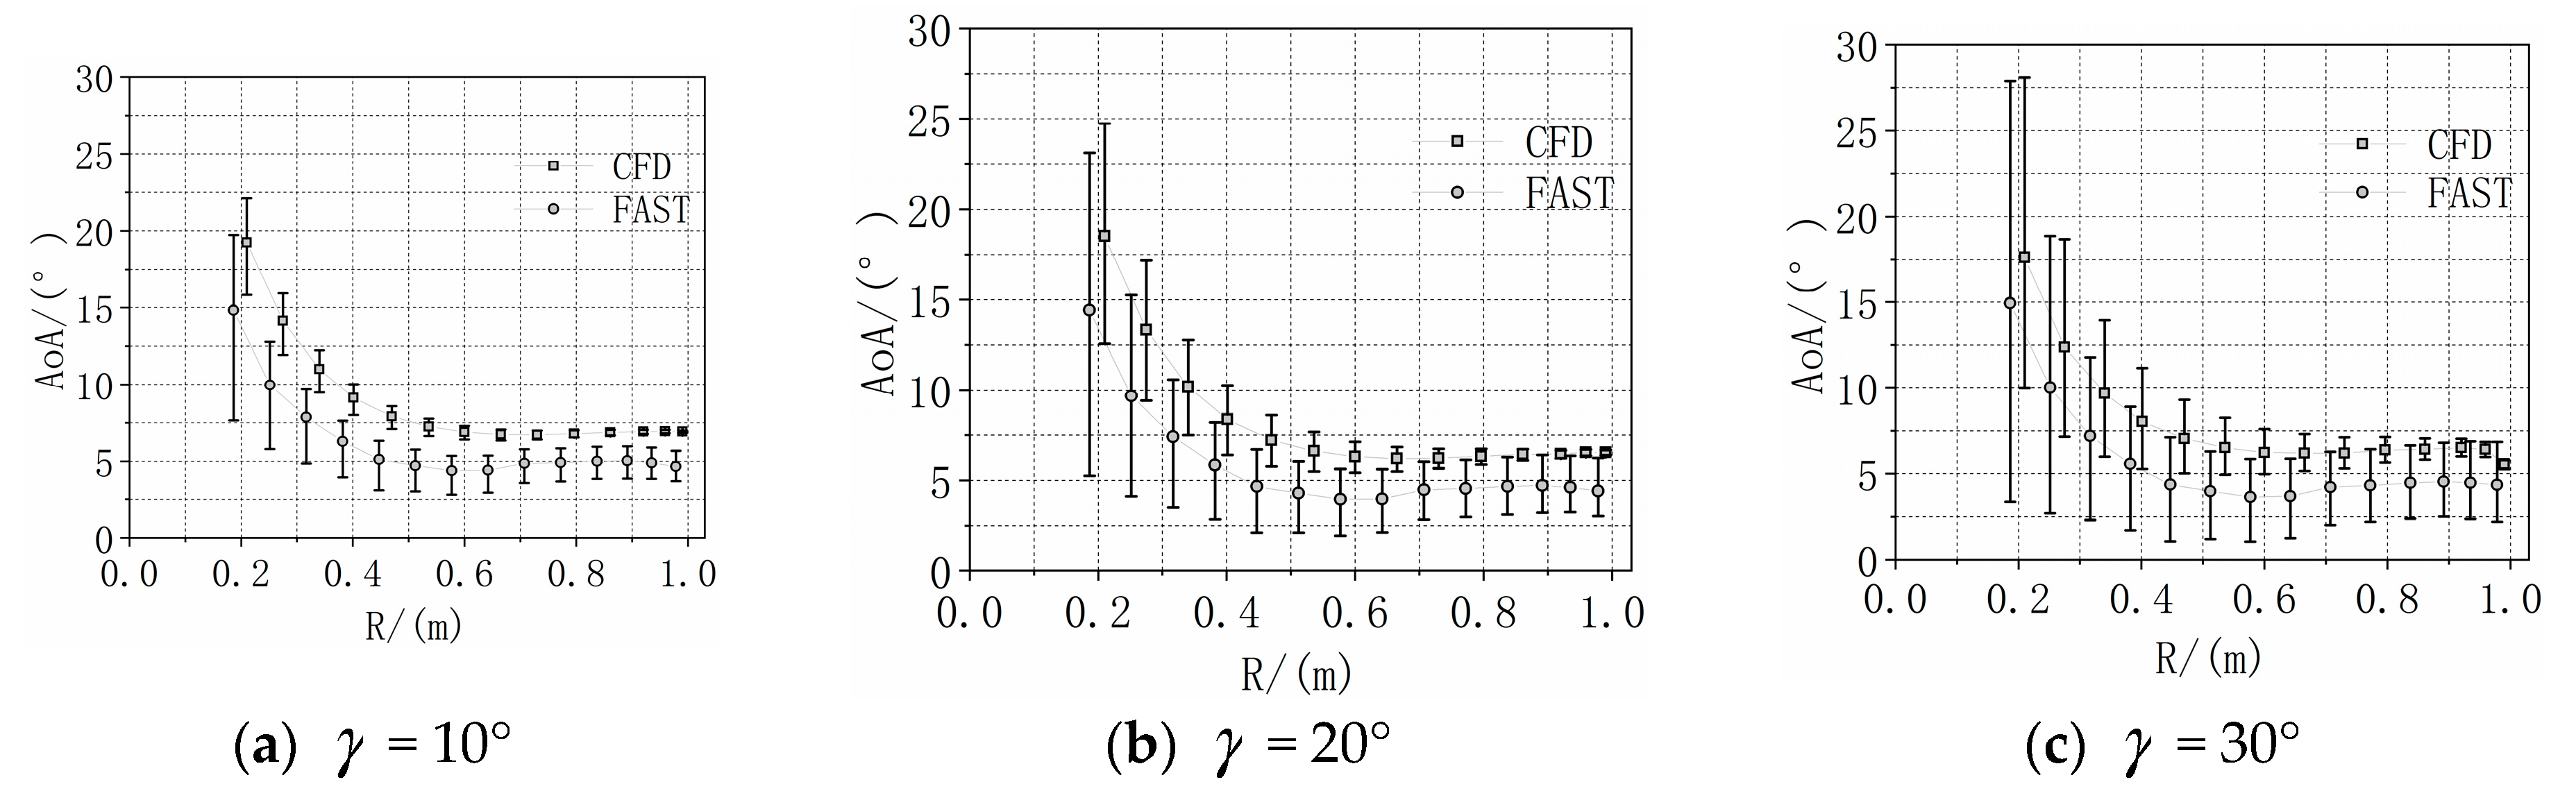
The AOA distribution presented in
Figure 9 takes into account the advancing and retreating effects, as previously shown by Castellani [
20] in the yawed simulation of a HAWT using the BEM model. Comparing the simulation results for CFD and FAST, the same trends can be observed along the blade span, whereas the AOA value is much larger than the FAST result.
Figure 10 and
Figure 11 show the variation of aerodynamic load spanwise along the blade. For the axial flow, some large abnormal fluctuations in the AOA and aerodynamic loads can be observe d. Differences in the results of the CFD and FAST methods mainly occur along the inner board, owing to flow separation, which lead to smaller aerodynamic loads compared to those computed by the BEM model that does not consider flow separation.
(2) The spanwise section aerodynamic load analysis under yawed conditions
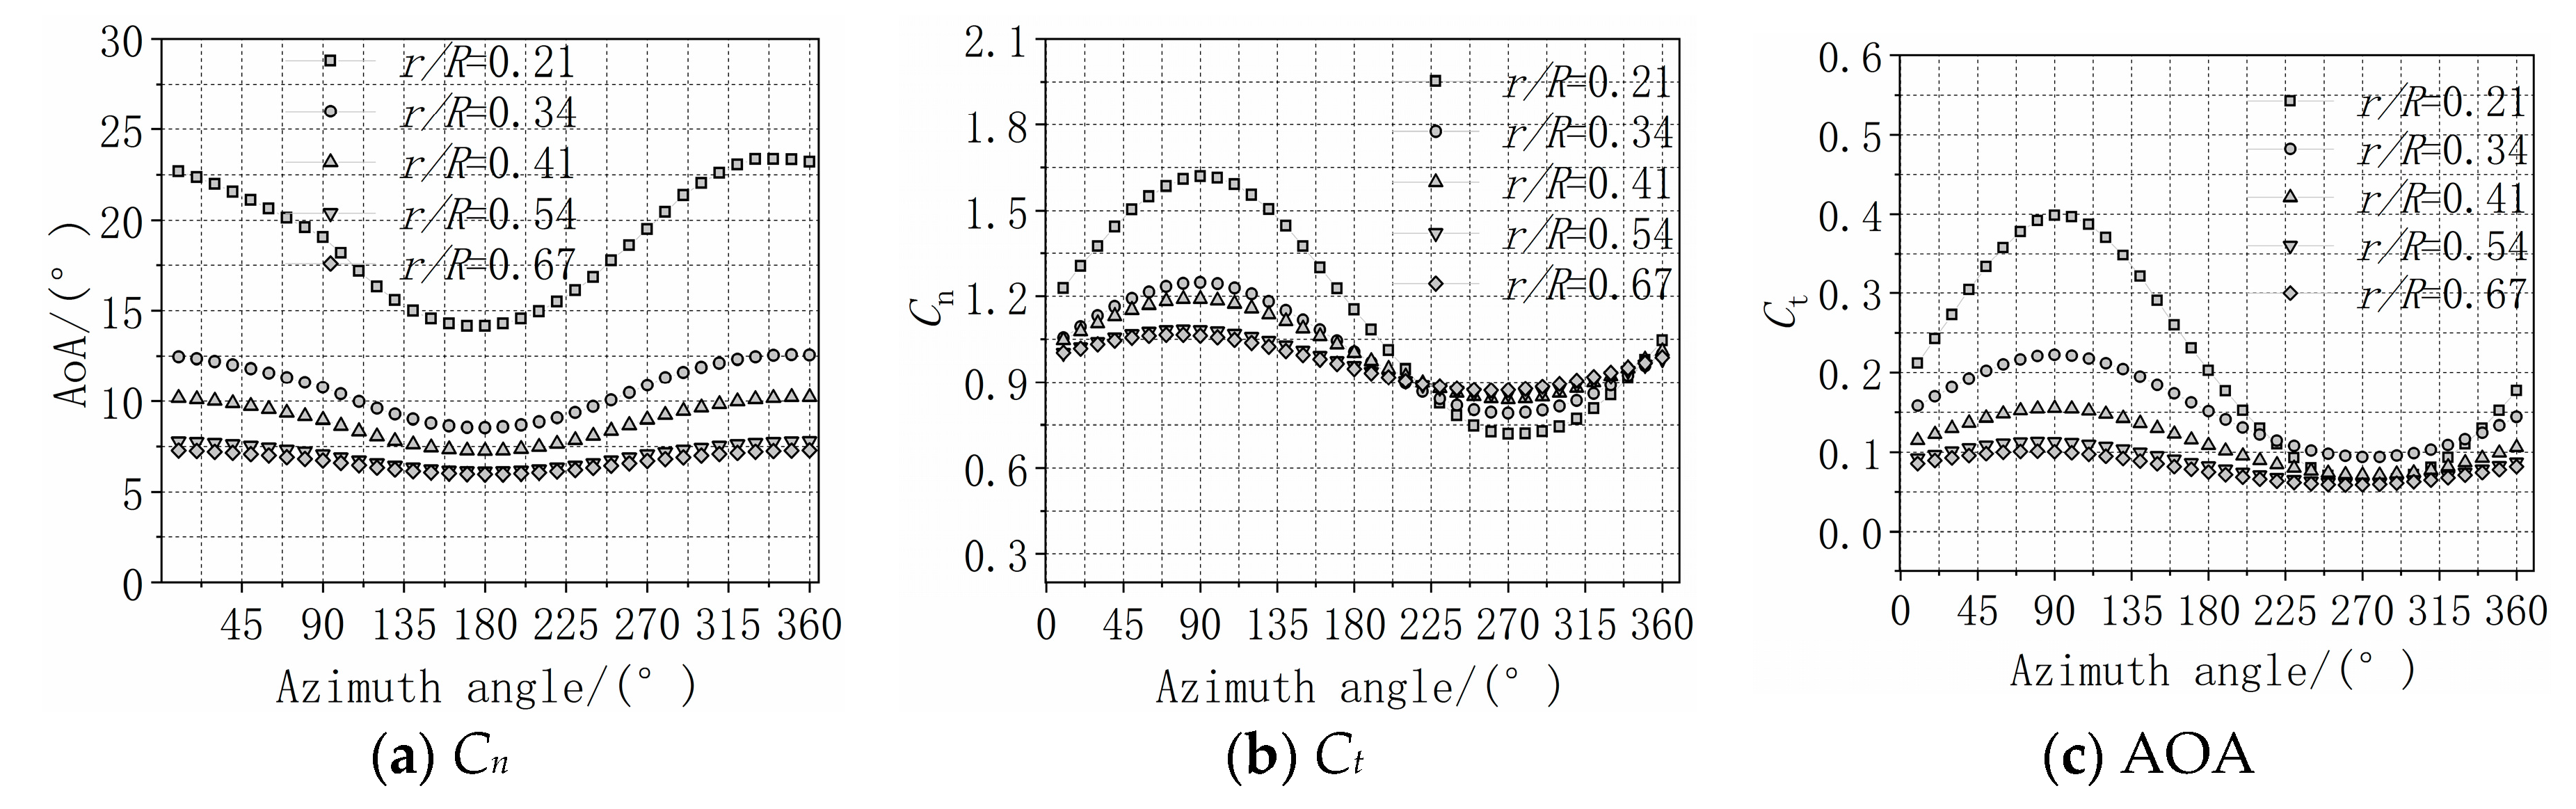
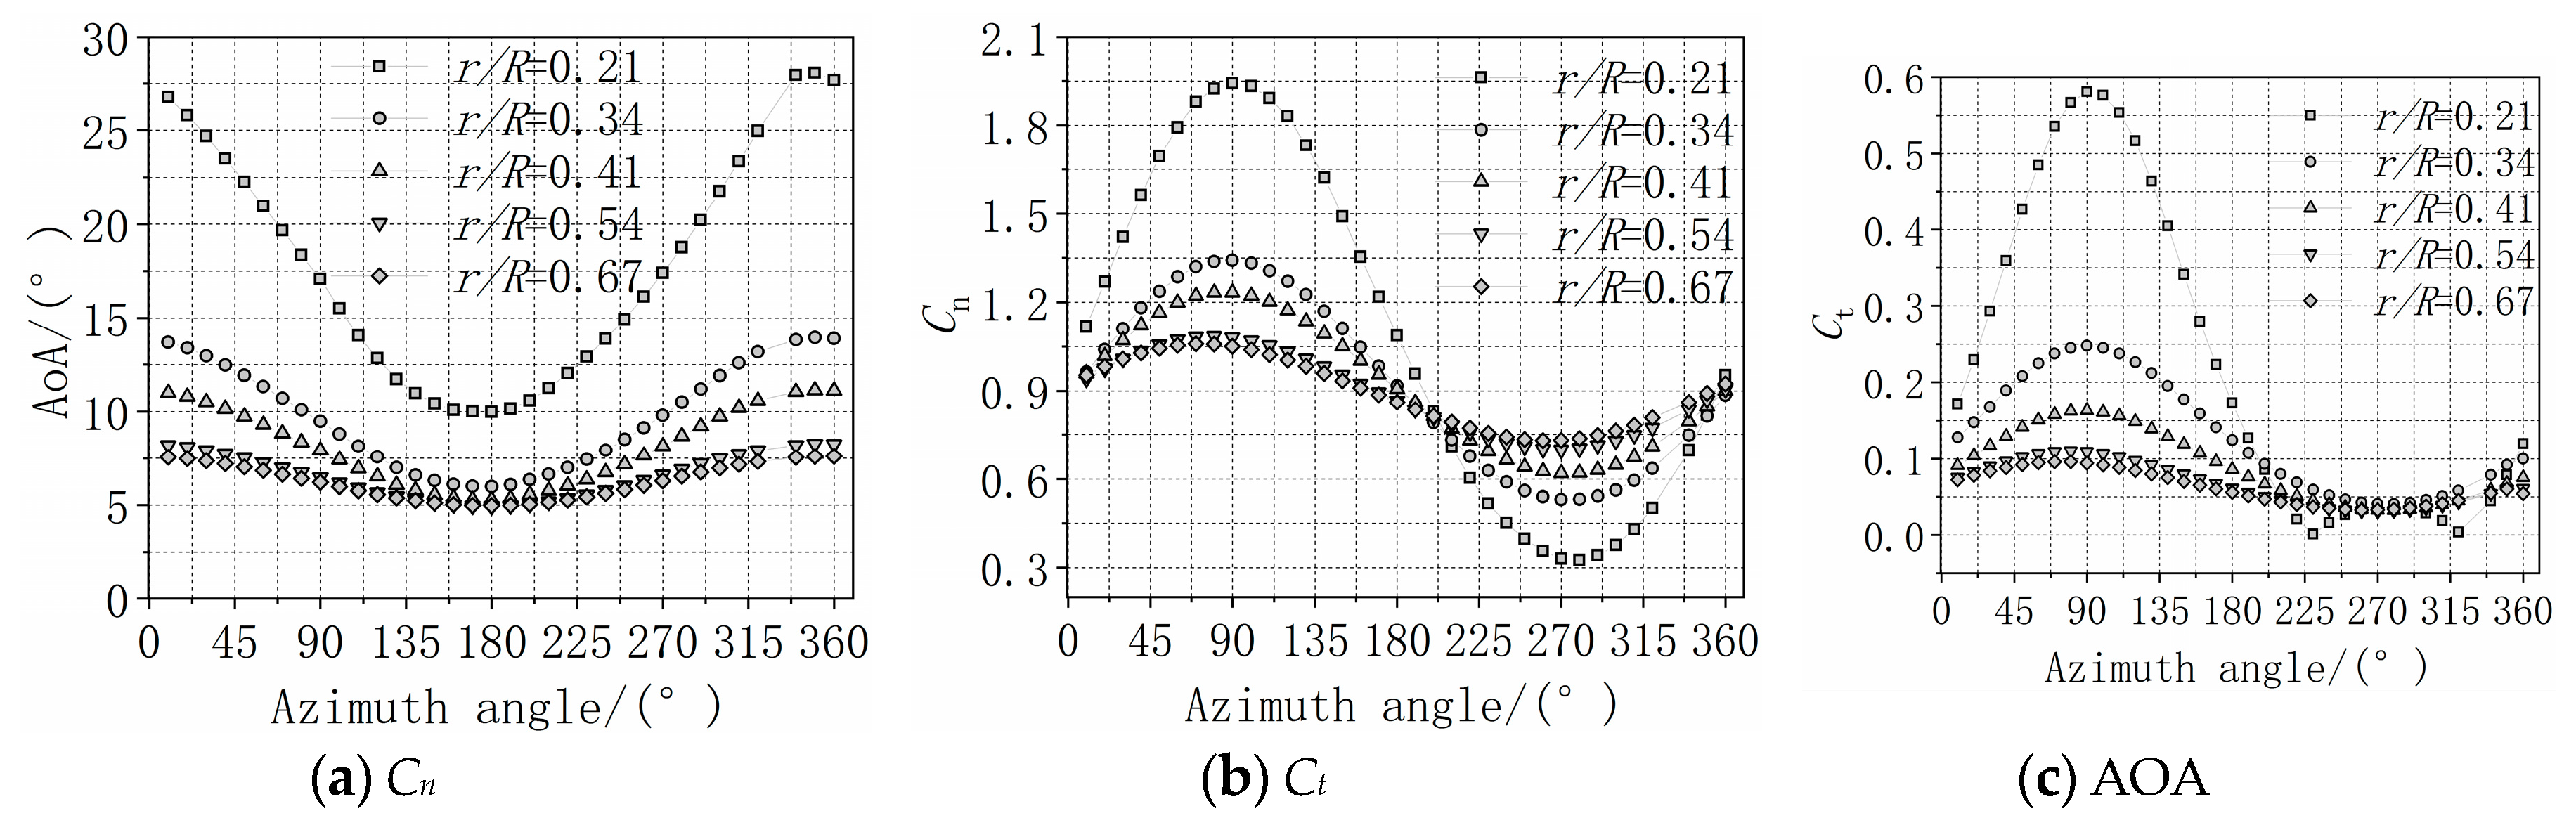
Figure 12 and
Figure 13 show the distribution of the AOA with respect to the azimuth angle under a yaw angle of 15° and 30°. Fluctuations become larger as the yaw angle increases due to the advancing and retreating effect, which is partly caused by the inflow velocity component under yaw. After post-processing, the AOA using the combination of the CFD sectional airfoil aerodynamic loads and the BEM method, the maximum and minimum AOA during one revolution occur at an azimuth angle of 0° and 180°, respectively. Wen [
36] found that under the impact of non-uniform effects (due to variations of the induced factor caused by the radial position and azimuth angle in the rotational plane), the maximum AOA tends to occur at 90° for inboard airfoils. The maximum and minimum aerodynamic loads occur at an azimuth angle of 90° and 270°, respectively. Thus, future computations of the AOA should consider non-uniform effects.
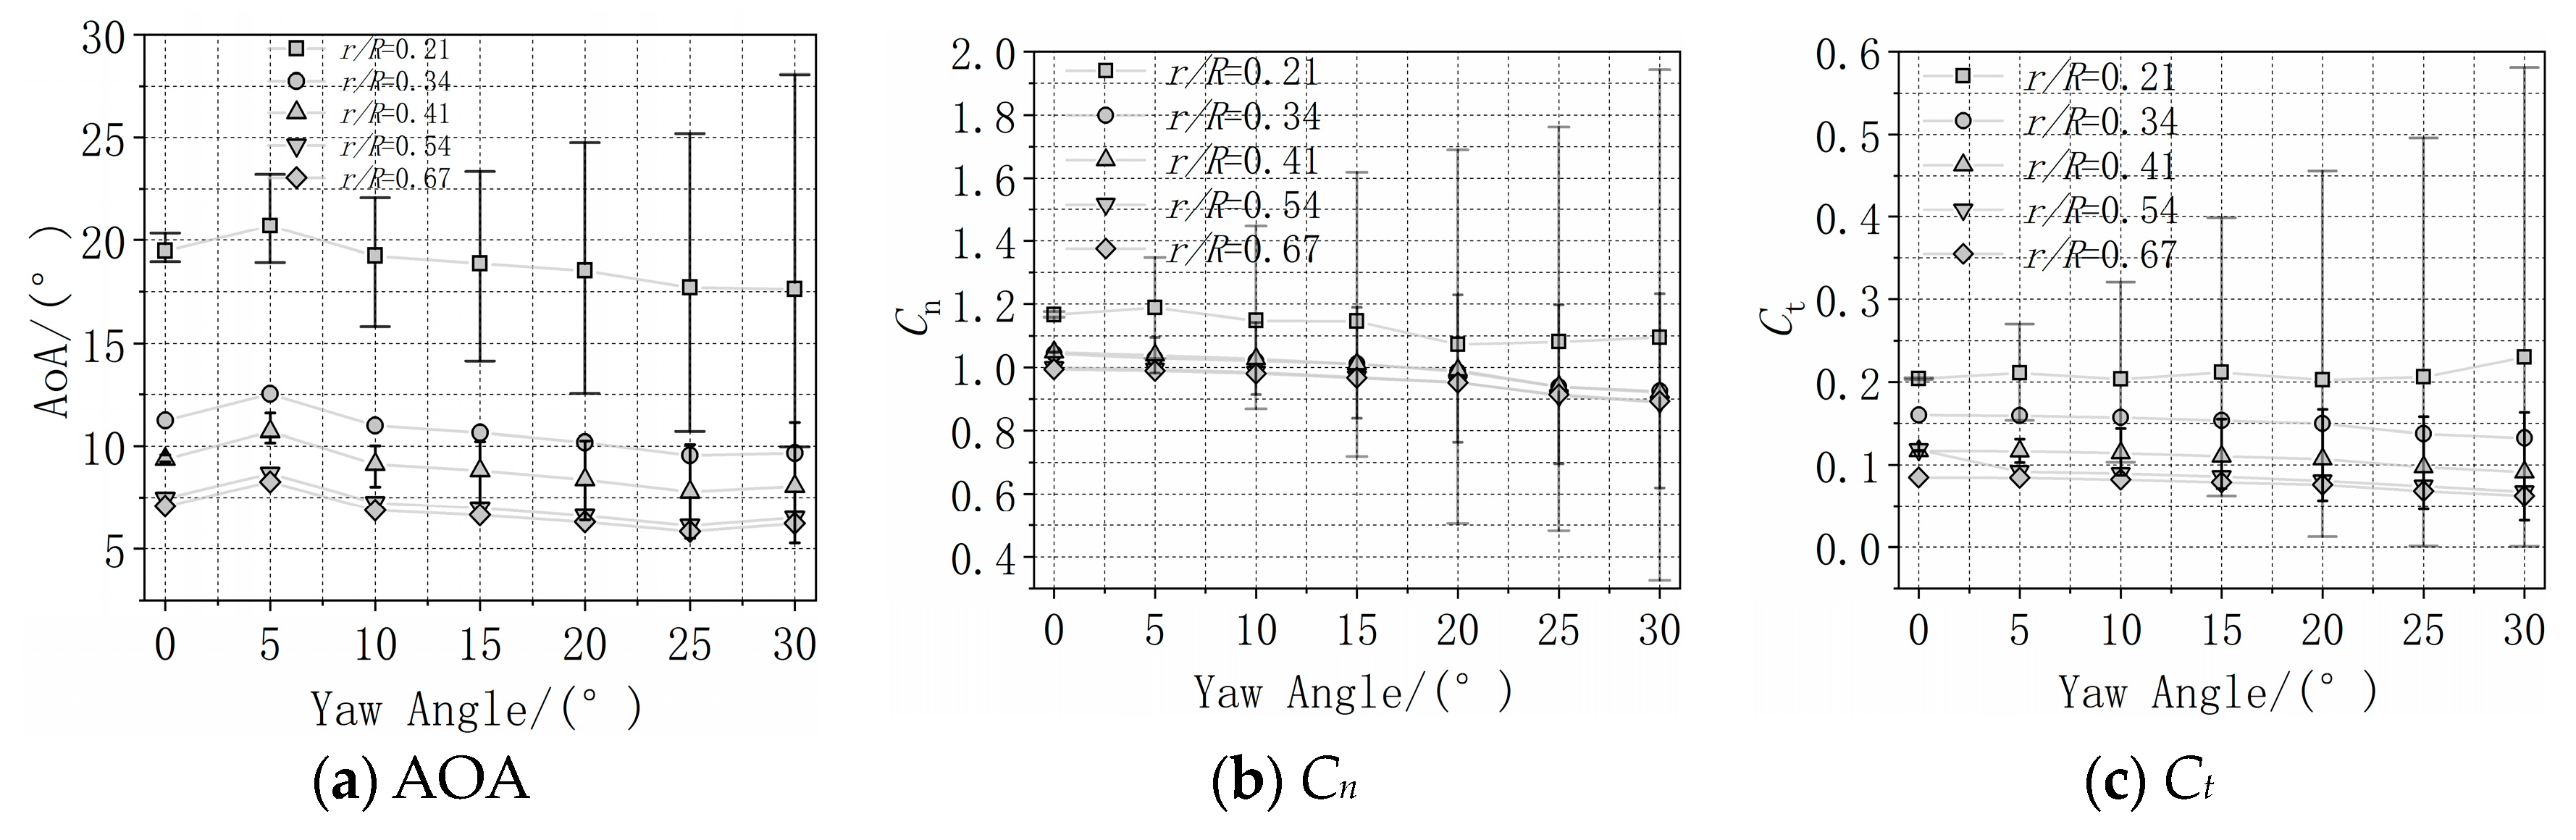
Figure 14 shows the variation of the averaged AOA with aerodynamic load at five typical spanwise sections with respect to yaw angle. Fluctuations of the aerodynamic performance are clearly observed and become larger as the yaw angle increases.
The mean aerodynamic performance remains relatively constant with less decrease due to the yaw effect. Variation of the AOA and aerodynamic loads exhibit much higher fluctuations in the inner board compared to the middle and outer board. With the increasing of the yaw angle, the circumferential loads and AOA also cause higher maximum loads.
3.3. Numerical Simulation of Dynamic Yawing Wind Turbine
This section presents results of the numerical analysis of the NREL 5-MW RWT under the dynamic yawing process.
3.3.1. Torque Characteristics of Wind Rotor
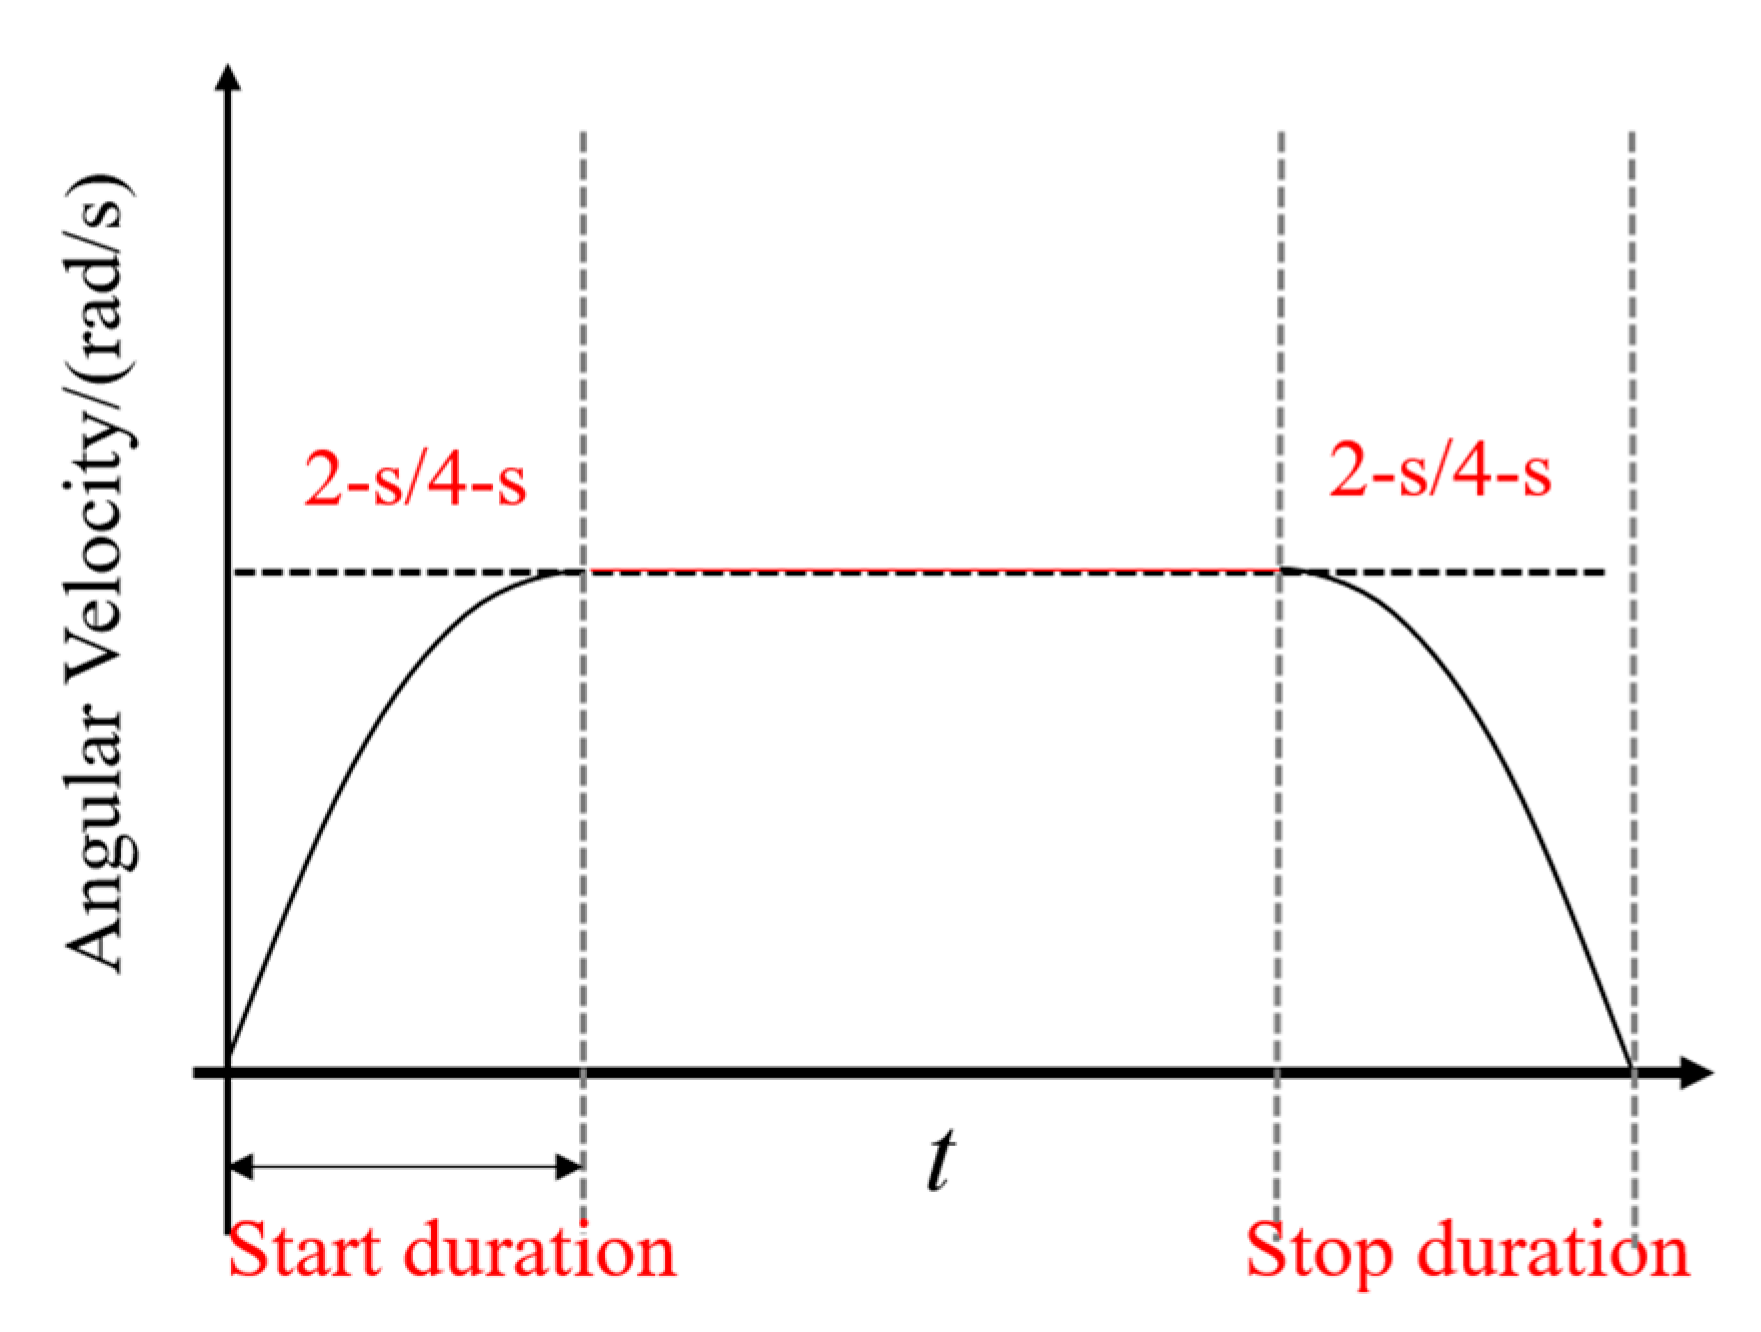
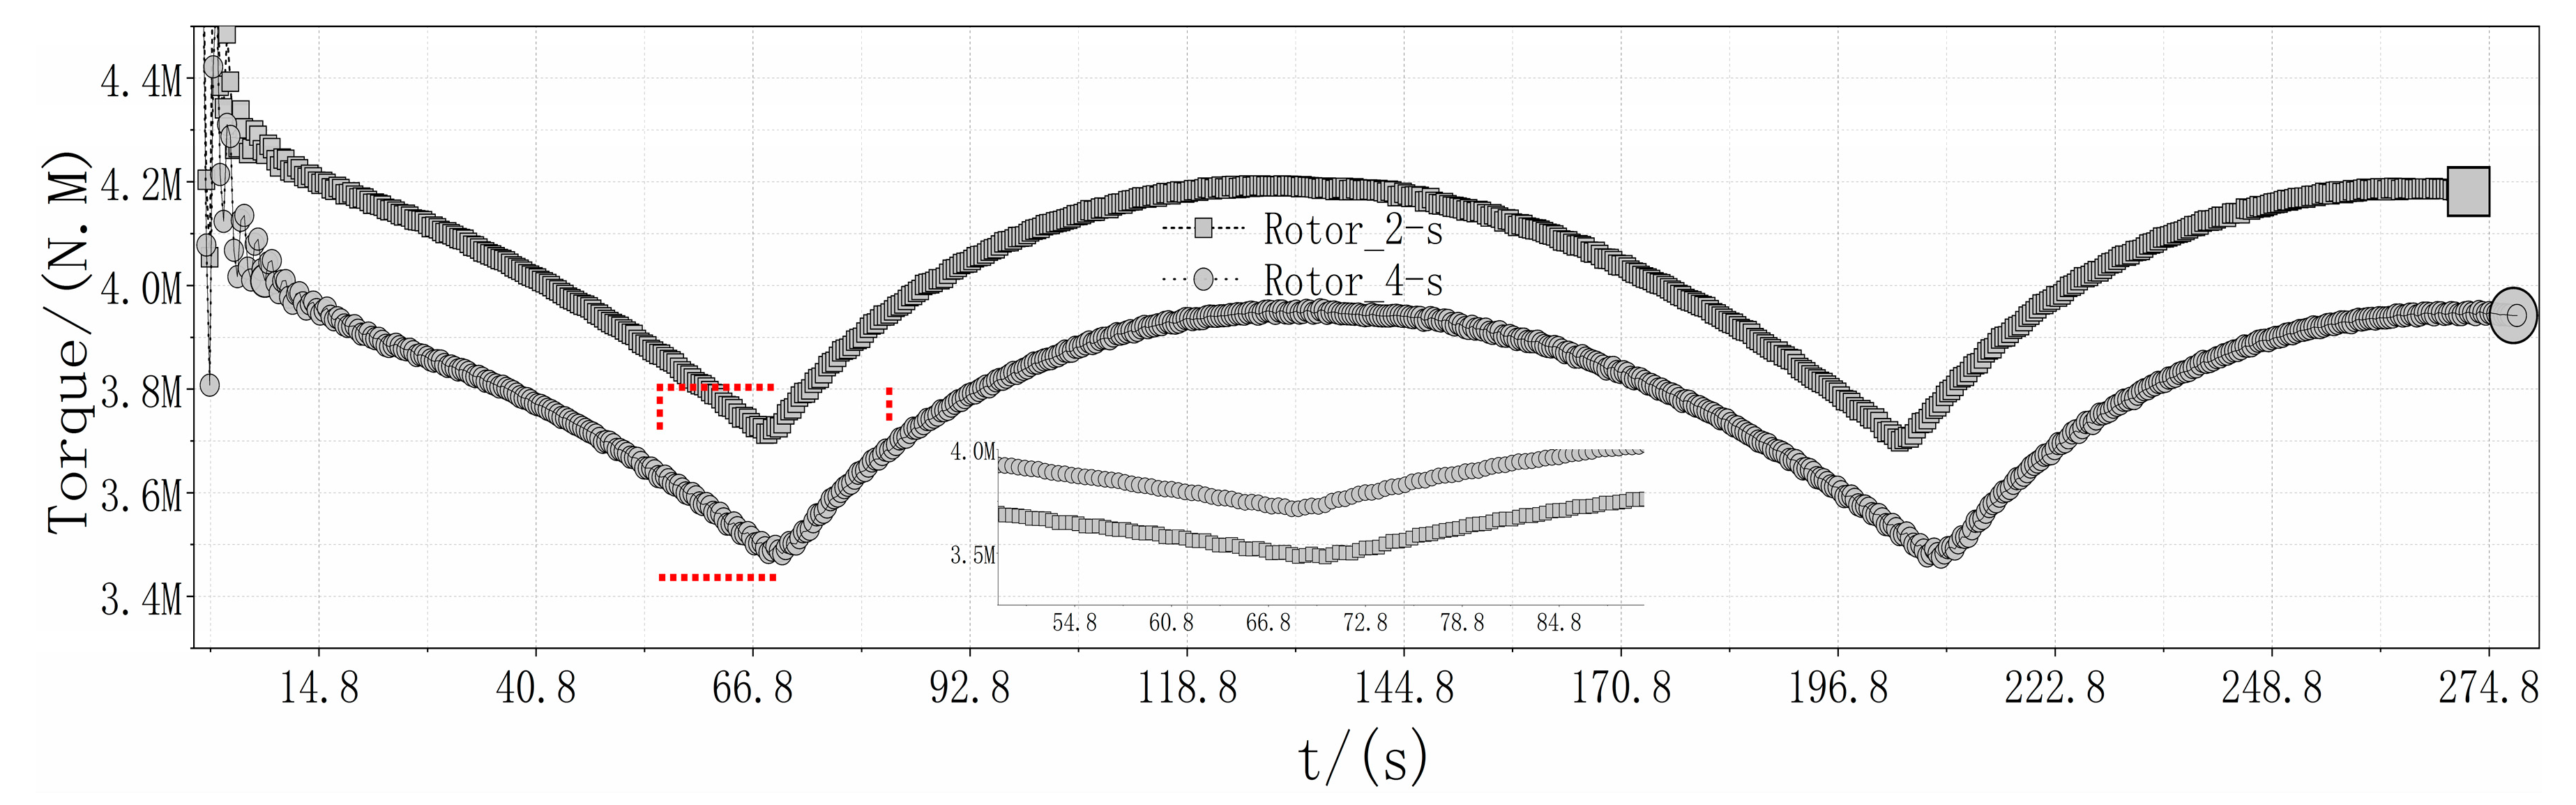
Figure 15 shows the distribution of the wind rotor torque under different start-stop yaw velocities. During the yawing process, fluctuation of the wind rotor torque is small. At the beginning of dynamic yaw, larger torques occur due to changes in the rotor position. As the yaw angle increases, the torque gradually decreases and is 5 × 10
5 N·m larger in the case of the 2-s duration compared to the 4-s duration. The 2-s duration may induce a larger rotor torque since the yaw angle changes more quickly than with 4-s duration. The reasons are given below. At the start and stop stage, the yaw velocity is changed with the sinusoidal variation law related to the frequency, the higher frequency of yaw velocity caused much larger of the power and thrust, which is similar to the variation of power under platform pitching [
38,
40]. When the wind turbine is yawing with the constant yaw velocity, the additional velocity inducing by yawing is the same, and the power is only decreased with the square cosine of yaw angle. When wind turbine yawed to the stage of stop, the power under the 2-s case decrease much faster than under 4-s cases, which is similar to the yaw start period.
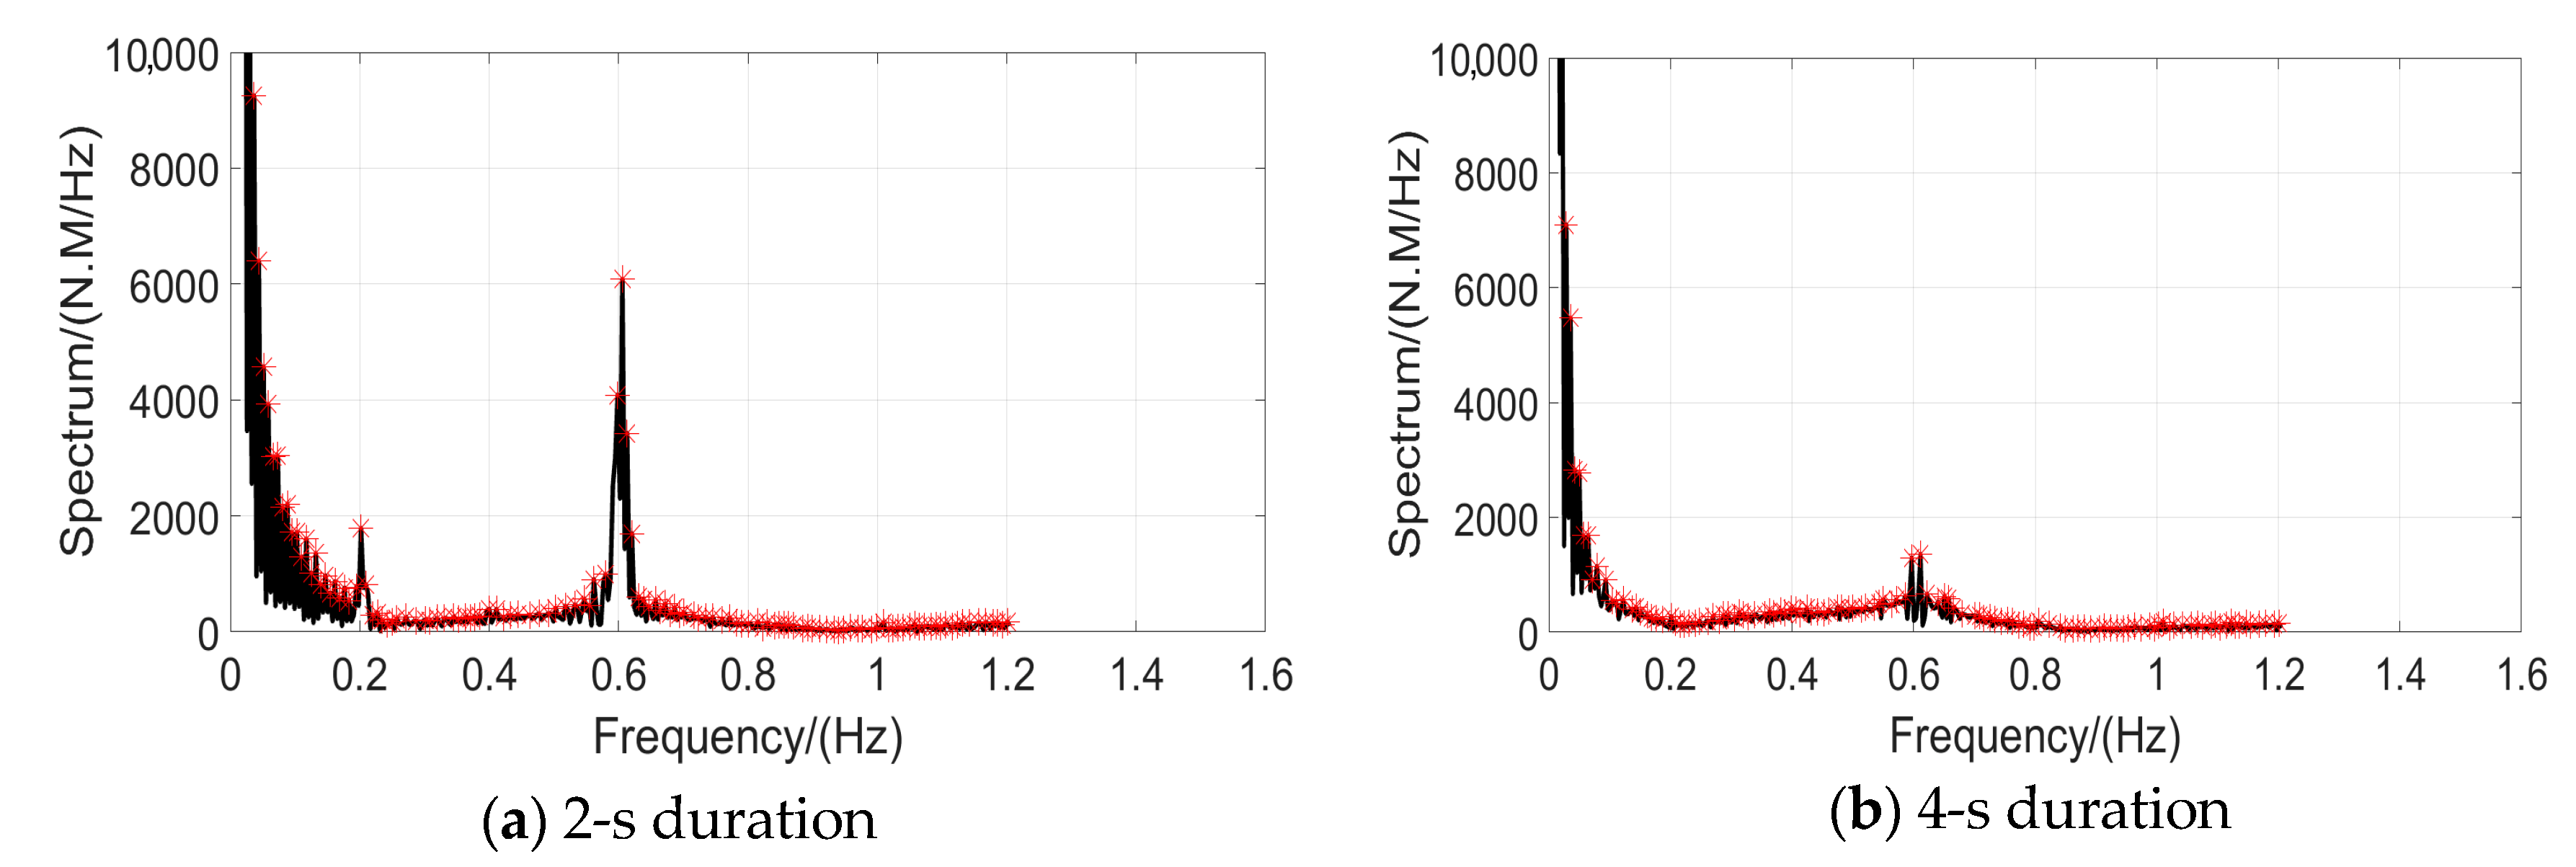
The results of 58 rotor revolutions were analyzed. During each revolution, 12 torque measurements were collected. Then, the fast Fourier transform was used to obtain the rotor aerodynamic frequency.
Figure 16 shows the torque power spectra of the rotor under 2-s and 4-s duration yawing process. The blade passing frequency of the NREL 5-MW turbine is about 0.2017 Hz (1P fluctuation), and is clearly the main frequency of the two yawing processes. Both are 0.6 Hz (which is approximately a 3P rotor fluctuation), which is similar to results presented by Castellani [
20].
Figure 16a shows a secondary frequency of 0.2 Hz (1P fluctuation). Due to the less sampling data in the sinusoidal stage, the yawing start-stop frequency (2-s and 4-s duration with a corresponding main frequency of 1/8 Hz and 1/16 Hz, respectively) cannot be captured in the computation of the torque power structure.
3.3.2. Torque Characteristics of Blade
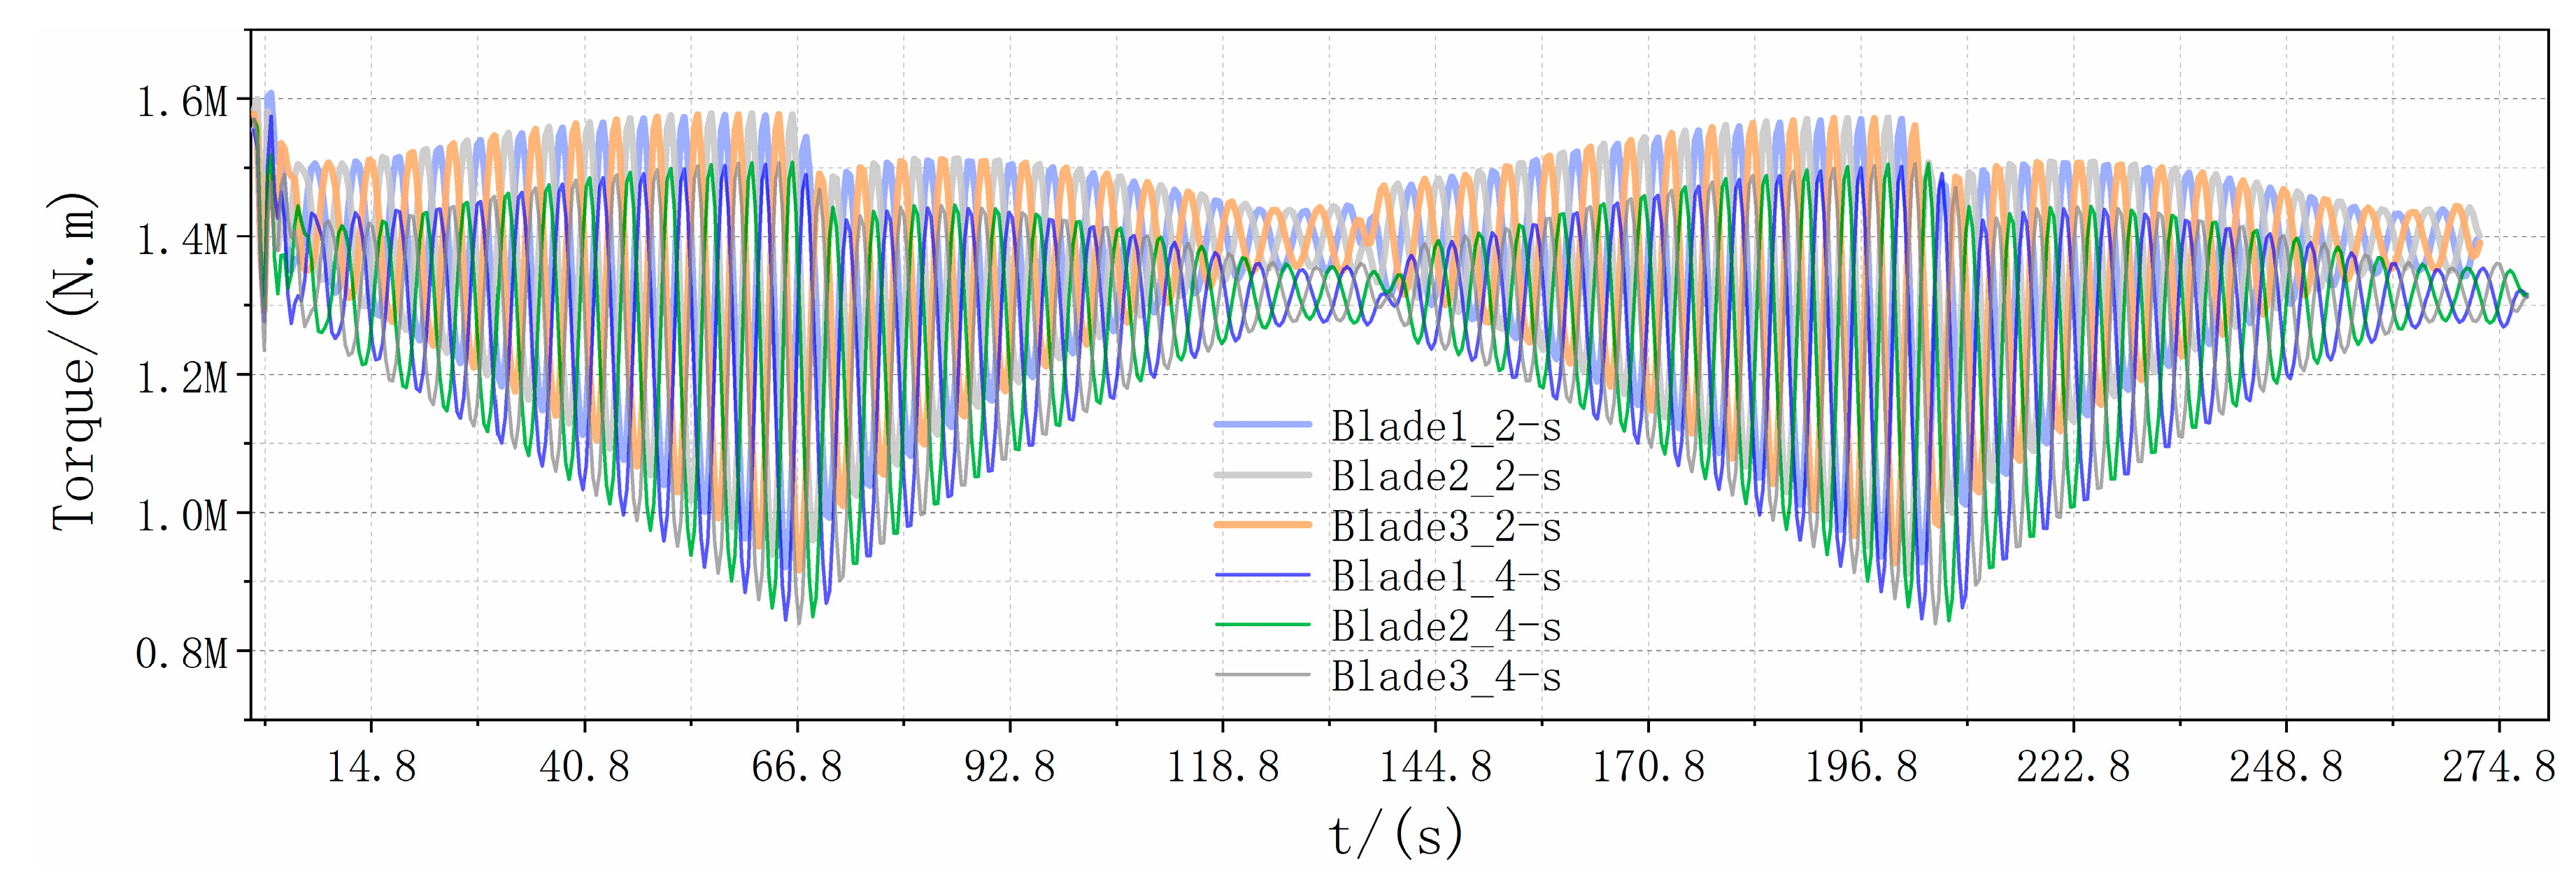
Figure 17 shows the variation of torque under different yaw rates in two periodic processes of start-stop yawing. Similarly, the torque of the blade under a 2-s duration is larger than the torque of the 4-s duration. Interestingly, the torque of the blade in the forward yaw stage (shown in
Figure 18 within 0~66.8 min, yaw angle from 0° to 20°) is larger than that of the backward yaw stage (shown in
Figure 18 within 66.8~133.6 min, yaw angle from 20° back to 0°) since the dynamic yawing effect, which generates the dynamic velocity, reduces the relative velocity.
3.3.3. Wake Flow Characteristics
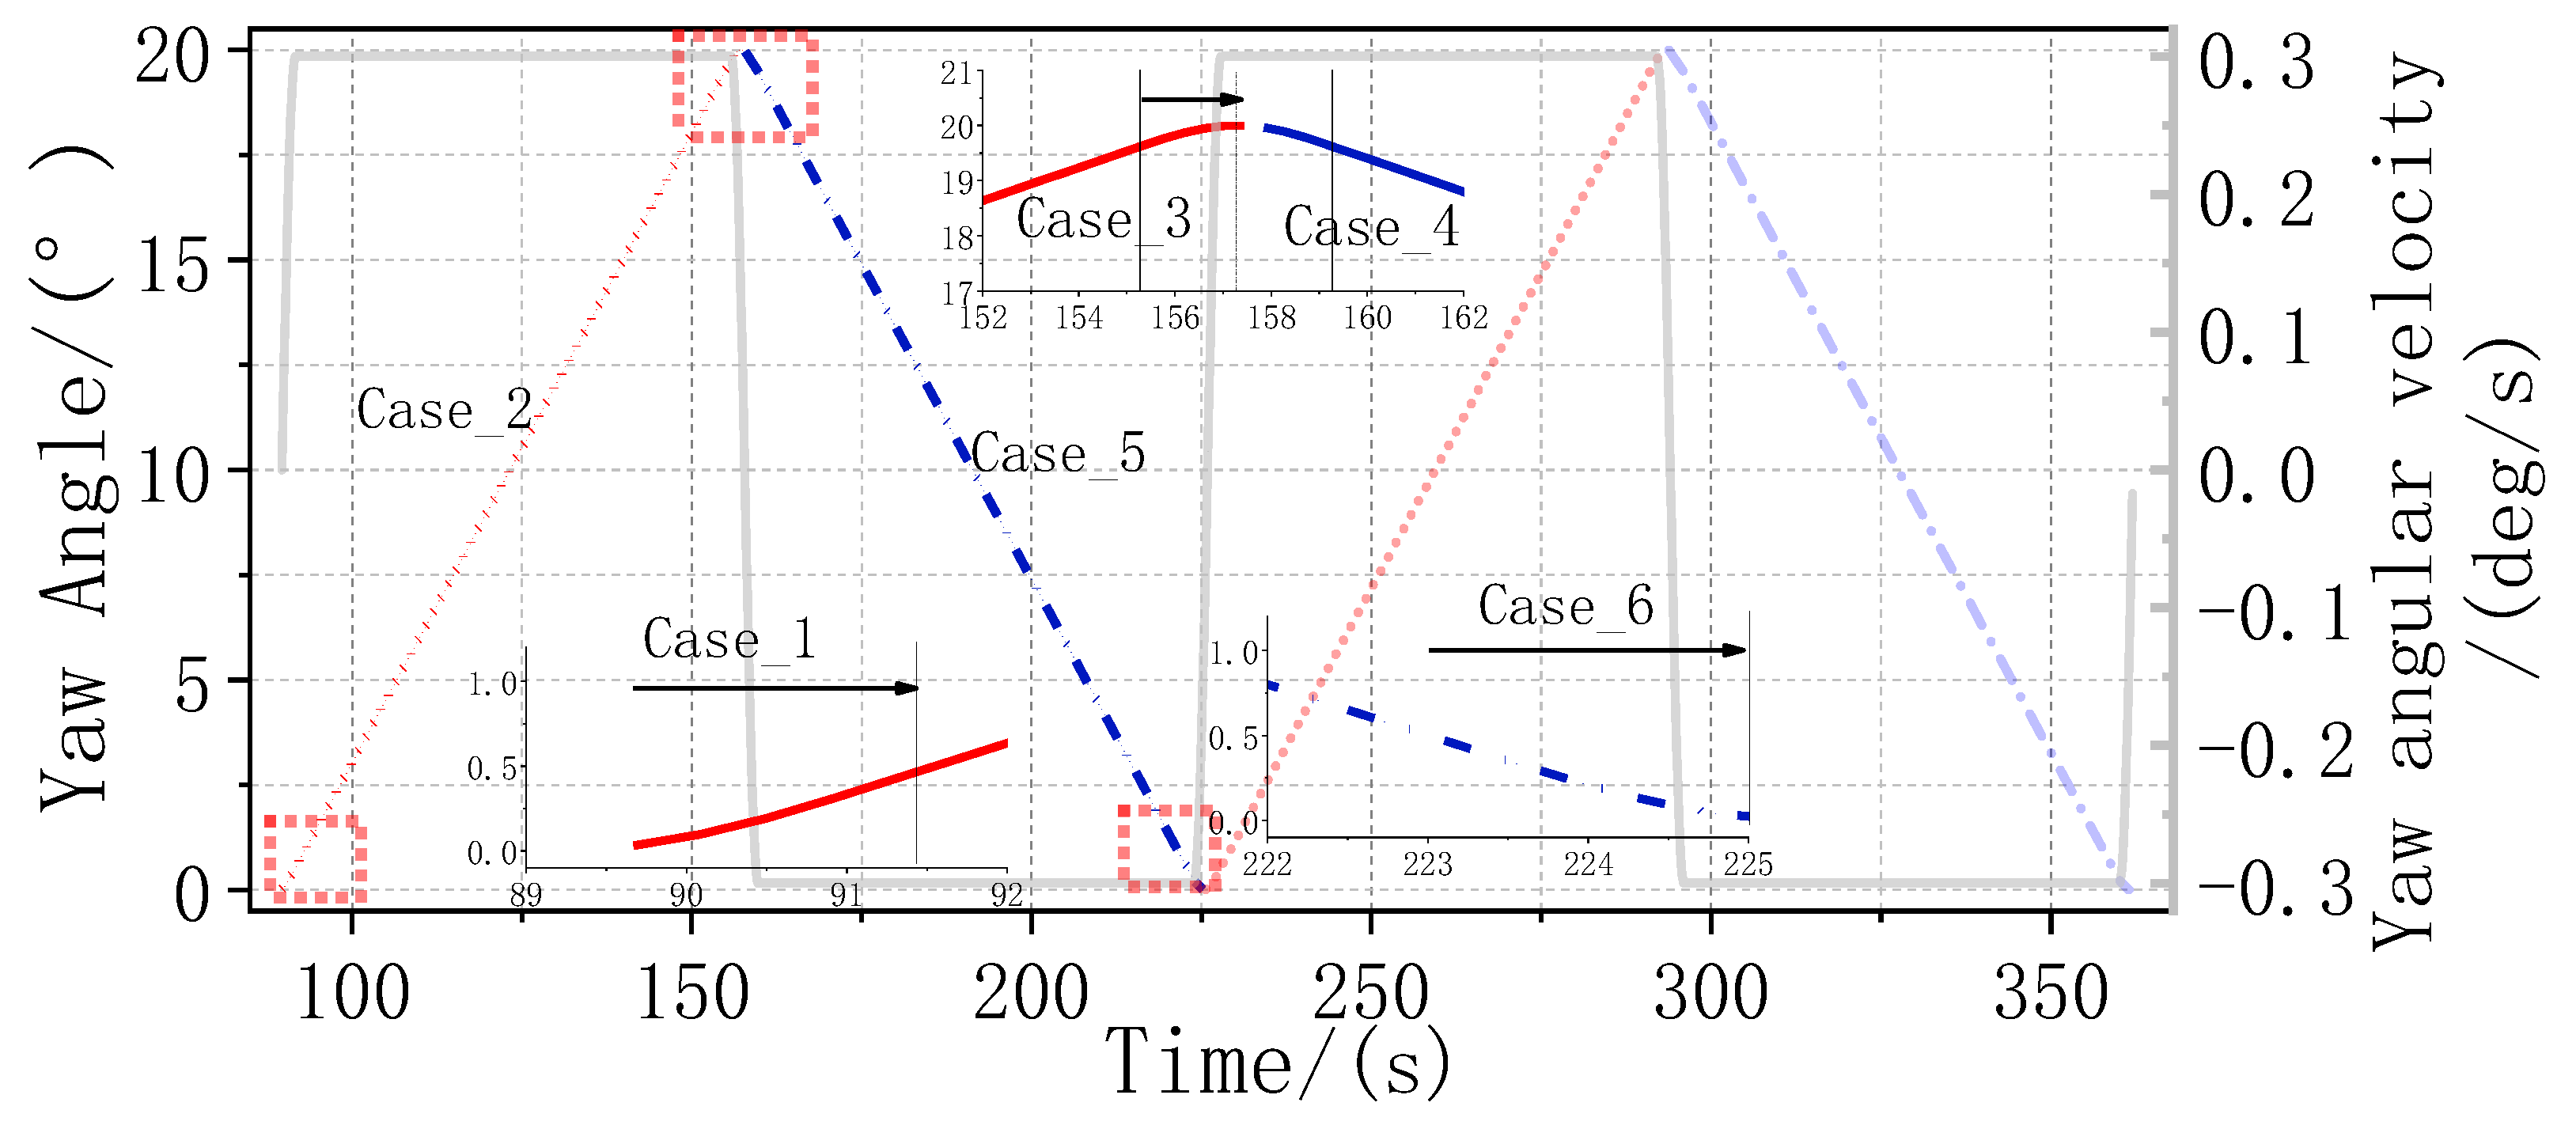
Wake effects are important in analyzing wind turbine aerodynamics. For convenience, the dynamic yaw was classified into six cases, as illustrated in
Figure 18. Cases 1,3,4,6 include the forward-start yaw, forward-stop yaw, backward-start yaw, and backward-stop yaw, respectively. For Cases 2 and 5, the yaw angle is 10° and they represent forward yaw and backward yaw, respectively. The grey line in the figure illustration the variation of yaw angular velocity during the simulation, and shows that except the Cases 2 and 5, other cases are all in the simulation about the variation of yaw angular velocity.
- (1)
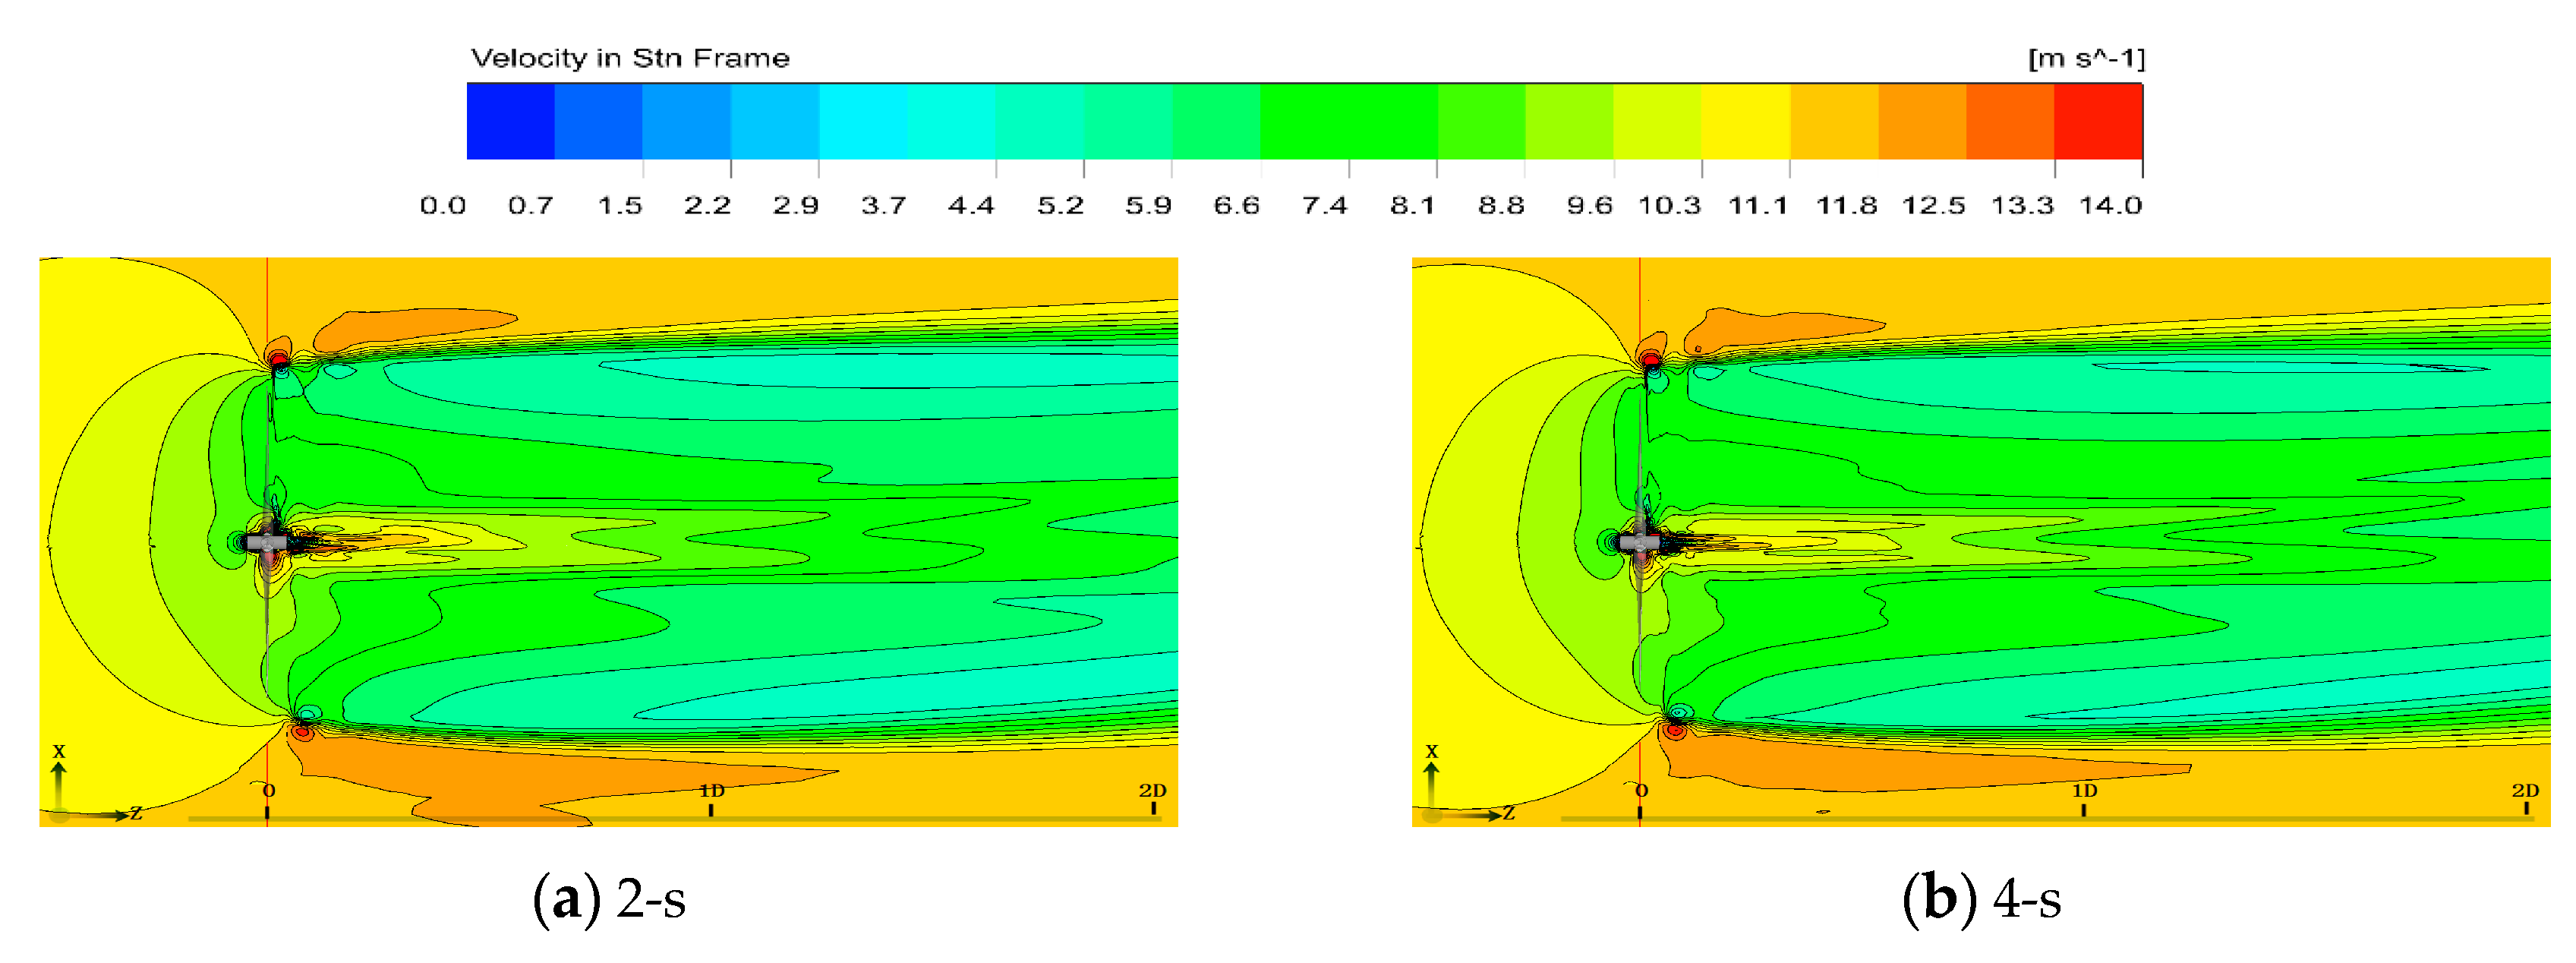
Forward yaw-start stage (Case 1). The velocity contours at t = 1/8T (T = 8 s or 16 s) at the beginning of dynamic yaw are shown in
Figure 19. The near wake velocity flow structure shows the same status at the beginning of the yawing process for both the 2-s and 4-s start-stop duration. The different yaw velocities have very little influence on the velocity distribution in the 2D range downstream.
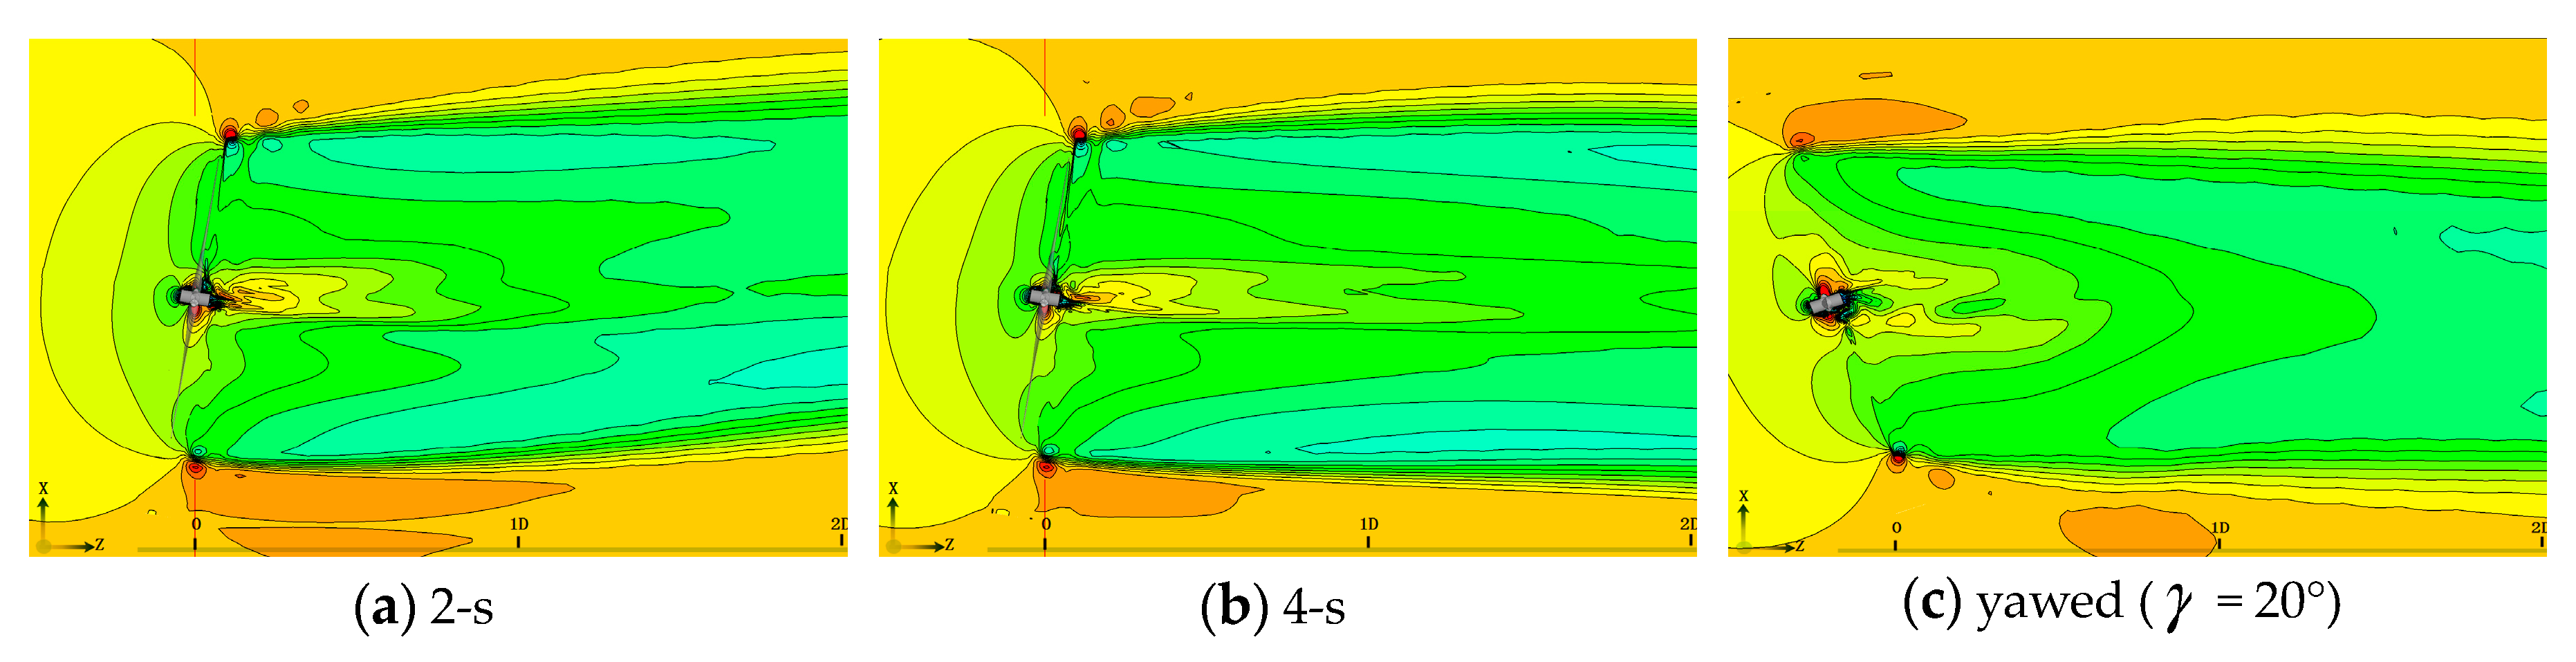
- (2)
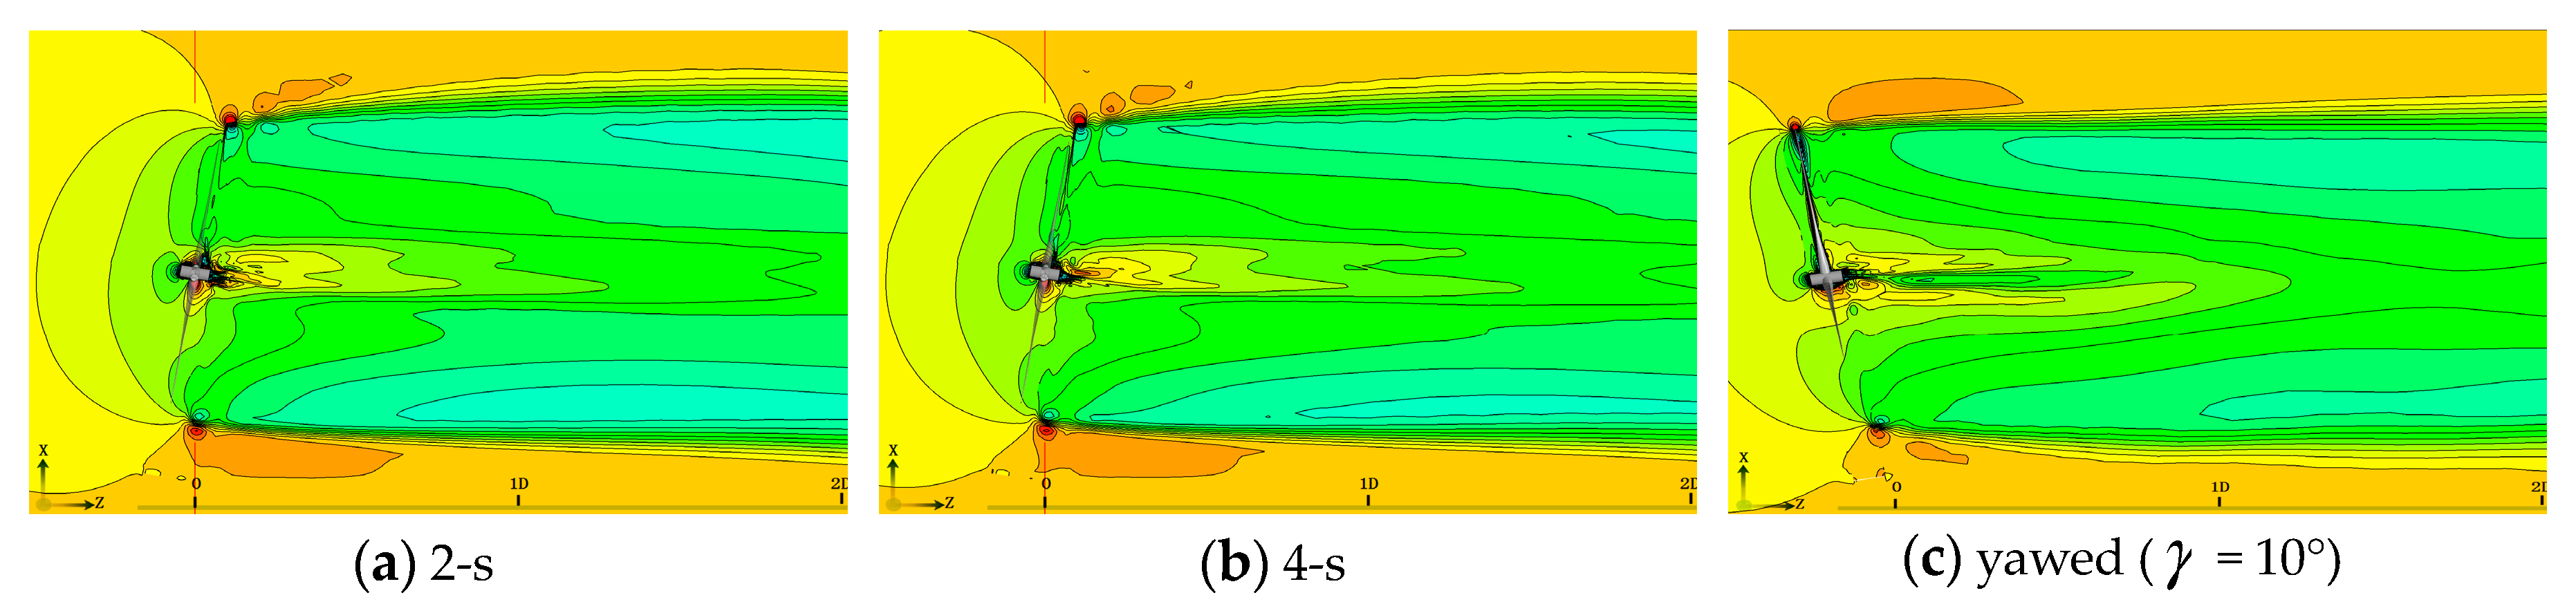
Yaw angle of 10° under forward yawing stage (Case 2). Sketches of the velocity streamlines of the two dynamic yawing processes (yaw angle of 10°) are shown in
Figure 20a,b are similar to those obtained for the yawed case, as shown in
Figure 20c. The dynamic yaw rotates with a fixed yaw velocity of 0.3°/s, and similar results are observed for the dynamic process. More energy intermediate effects can be observed between the wake zone and the main flow zone than in the yawed case. This may be due to the effects of dynamic stall.
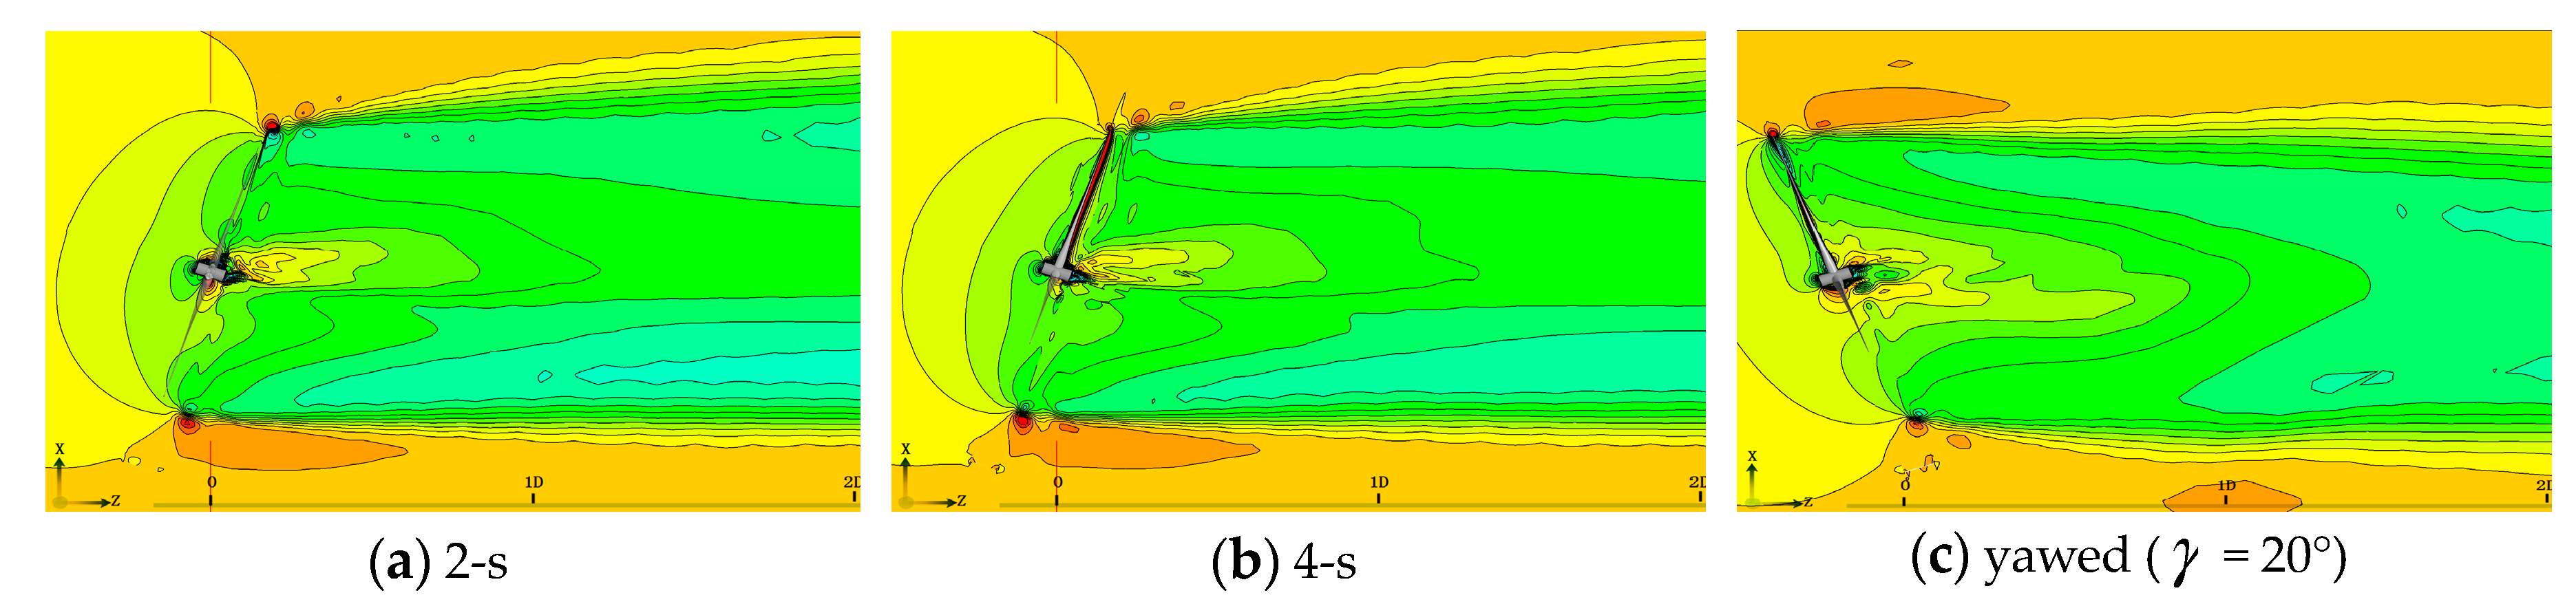
- (3)
Forward-yaw-stop stage (Case 3).
Figure 21 shows the instantaneous velocity contours for the dynamic yawing and yawed cases. Both dynamic yawing processes result in a much larger wake zones than under the yawed case. Meanwhile, some deflection occurs in the velocity wake, which is similar to the wake deflection effect reported in the work of Qian [
18], which took into account the velocity deficit and turbulent intensity using a Gaussian-based wake model.
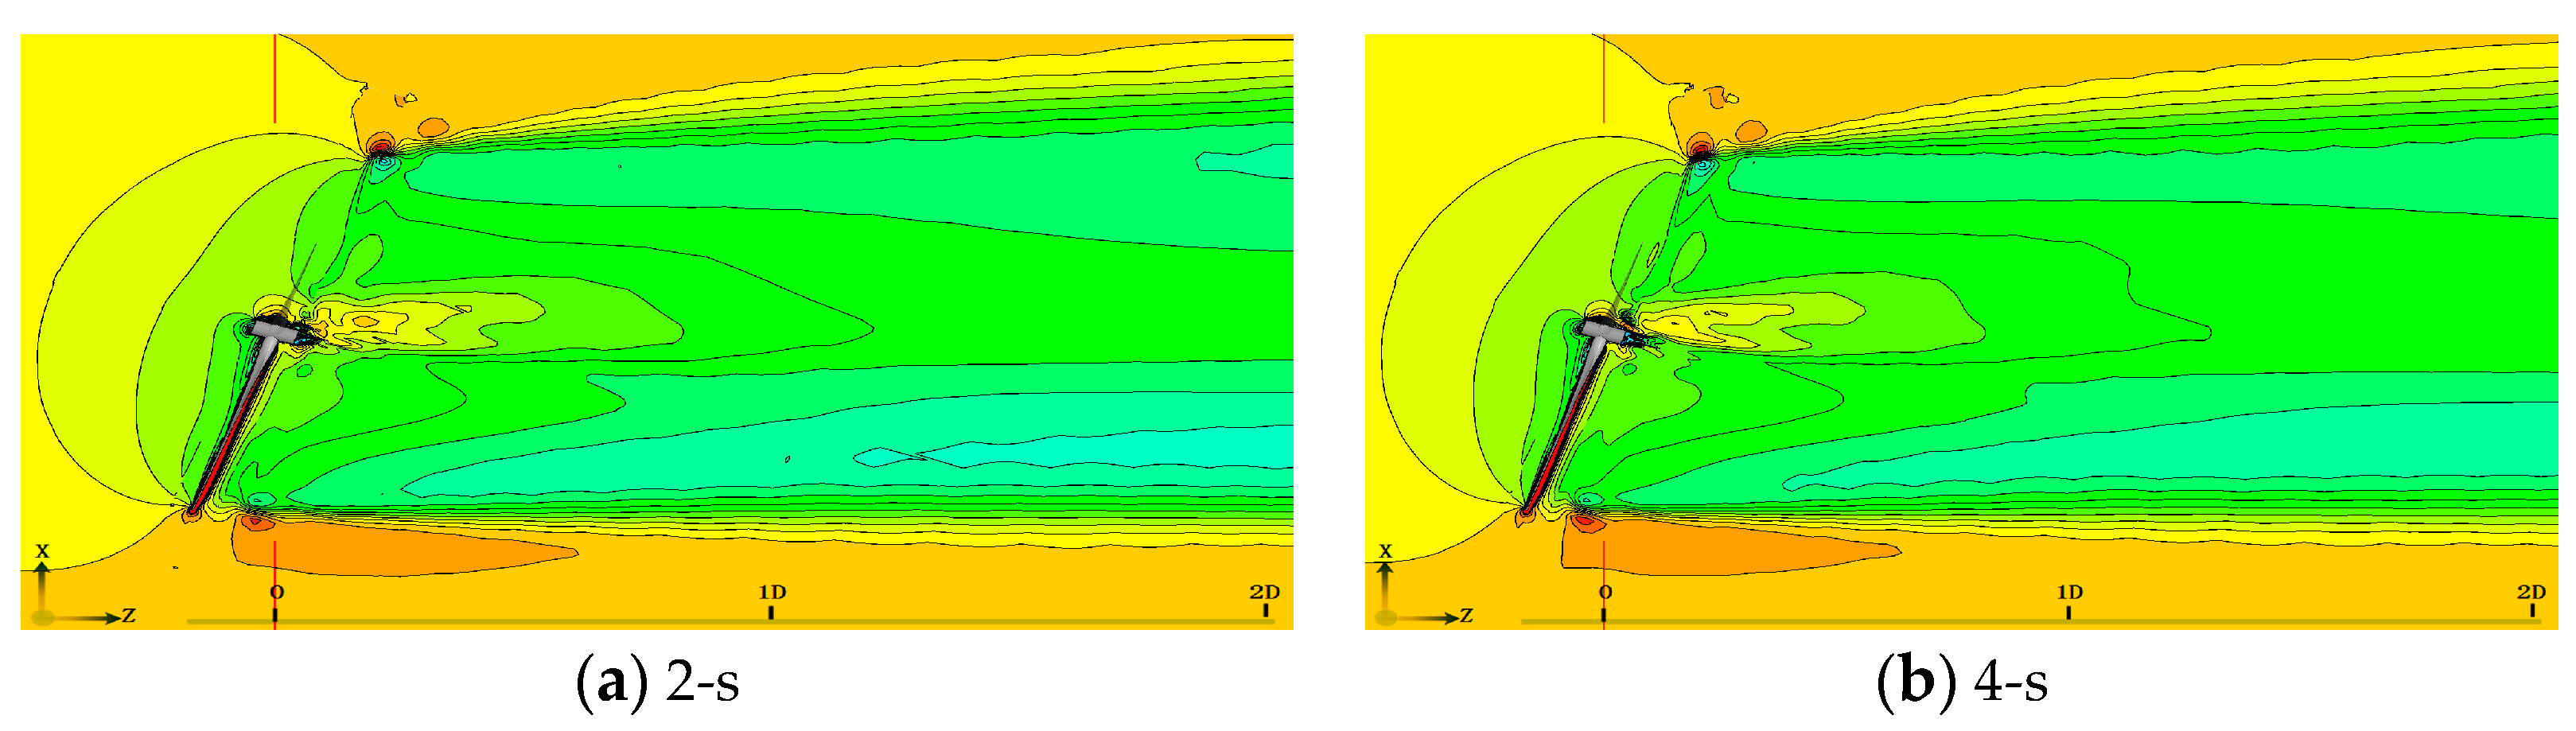
- (4)
Backward-yaw start stage (Case 4).
Figure 22 illustrates the velocity wake in the backward-yaw start stage. The wake zone velocity field retains almost the same flow structure. To refine the simulation results, large eddy simulations can be used to improve the interpretation of the flow process.
- (5)
Yaw angle of 10° under backward yawing stage (Case 5). When the wind turbine rotates about the Y-axis with a yaw angle of 10°, the velocity wake gradually become symmetrical and the 4-s duration simulation recovers to the symmetry state faster than 2-s duration simulation, as shown in
Figure 23.
- (6)
Backward-yaw stop stage (Case 6). As shown in
Figure 24, the wind turbine returns to its initial state, the wind direction is normal to the rotor rotational plane, and the three-dimensional flow structure is symmetrical in streamwise.
In summary, dynamic yawing based on two start-stop durations shows the approximate flow structure, and the upwind and downwind effect induced by yawing process expands the wake zone earlier and much larger than the yawed condition.
3.3.4. Aerodynamic Characteristics along Blade Spanwise Section
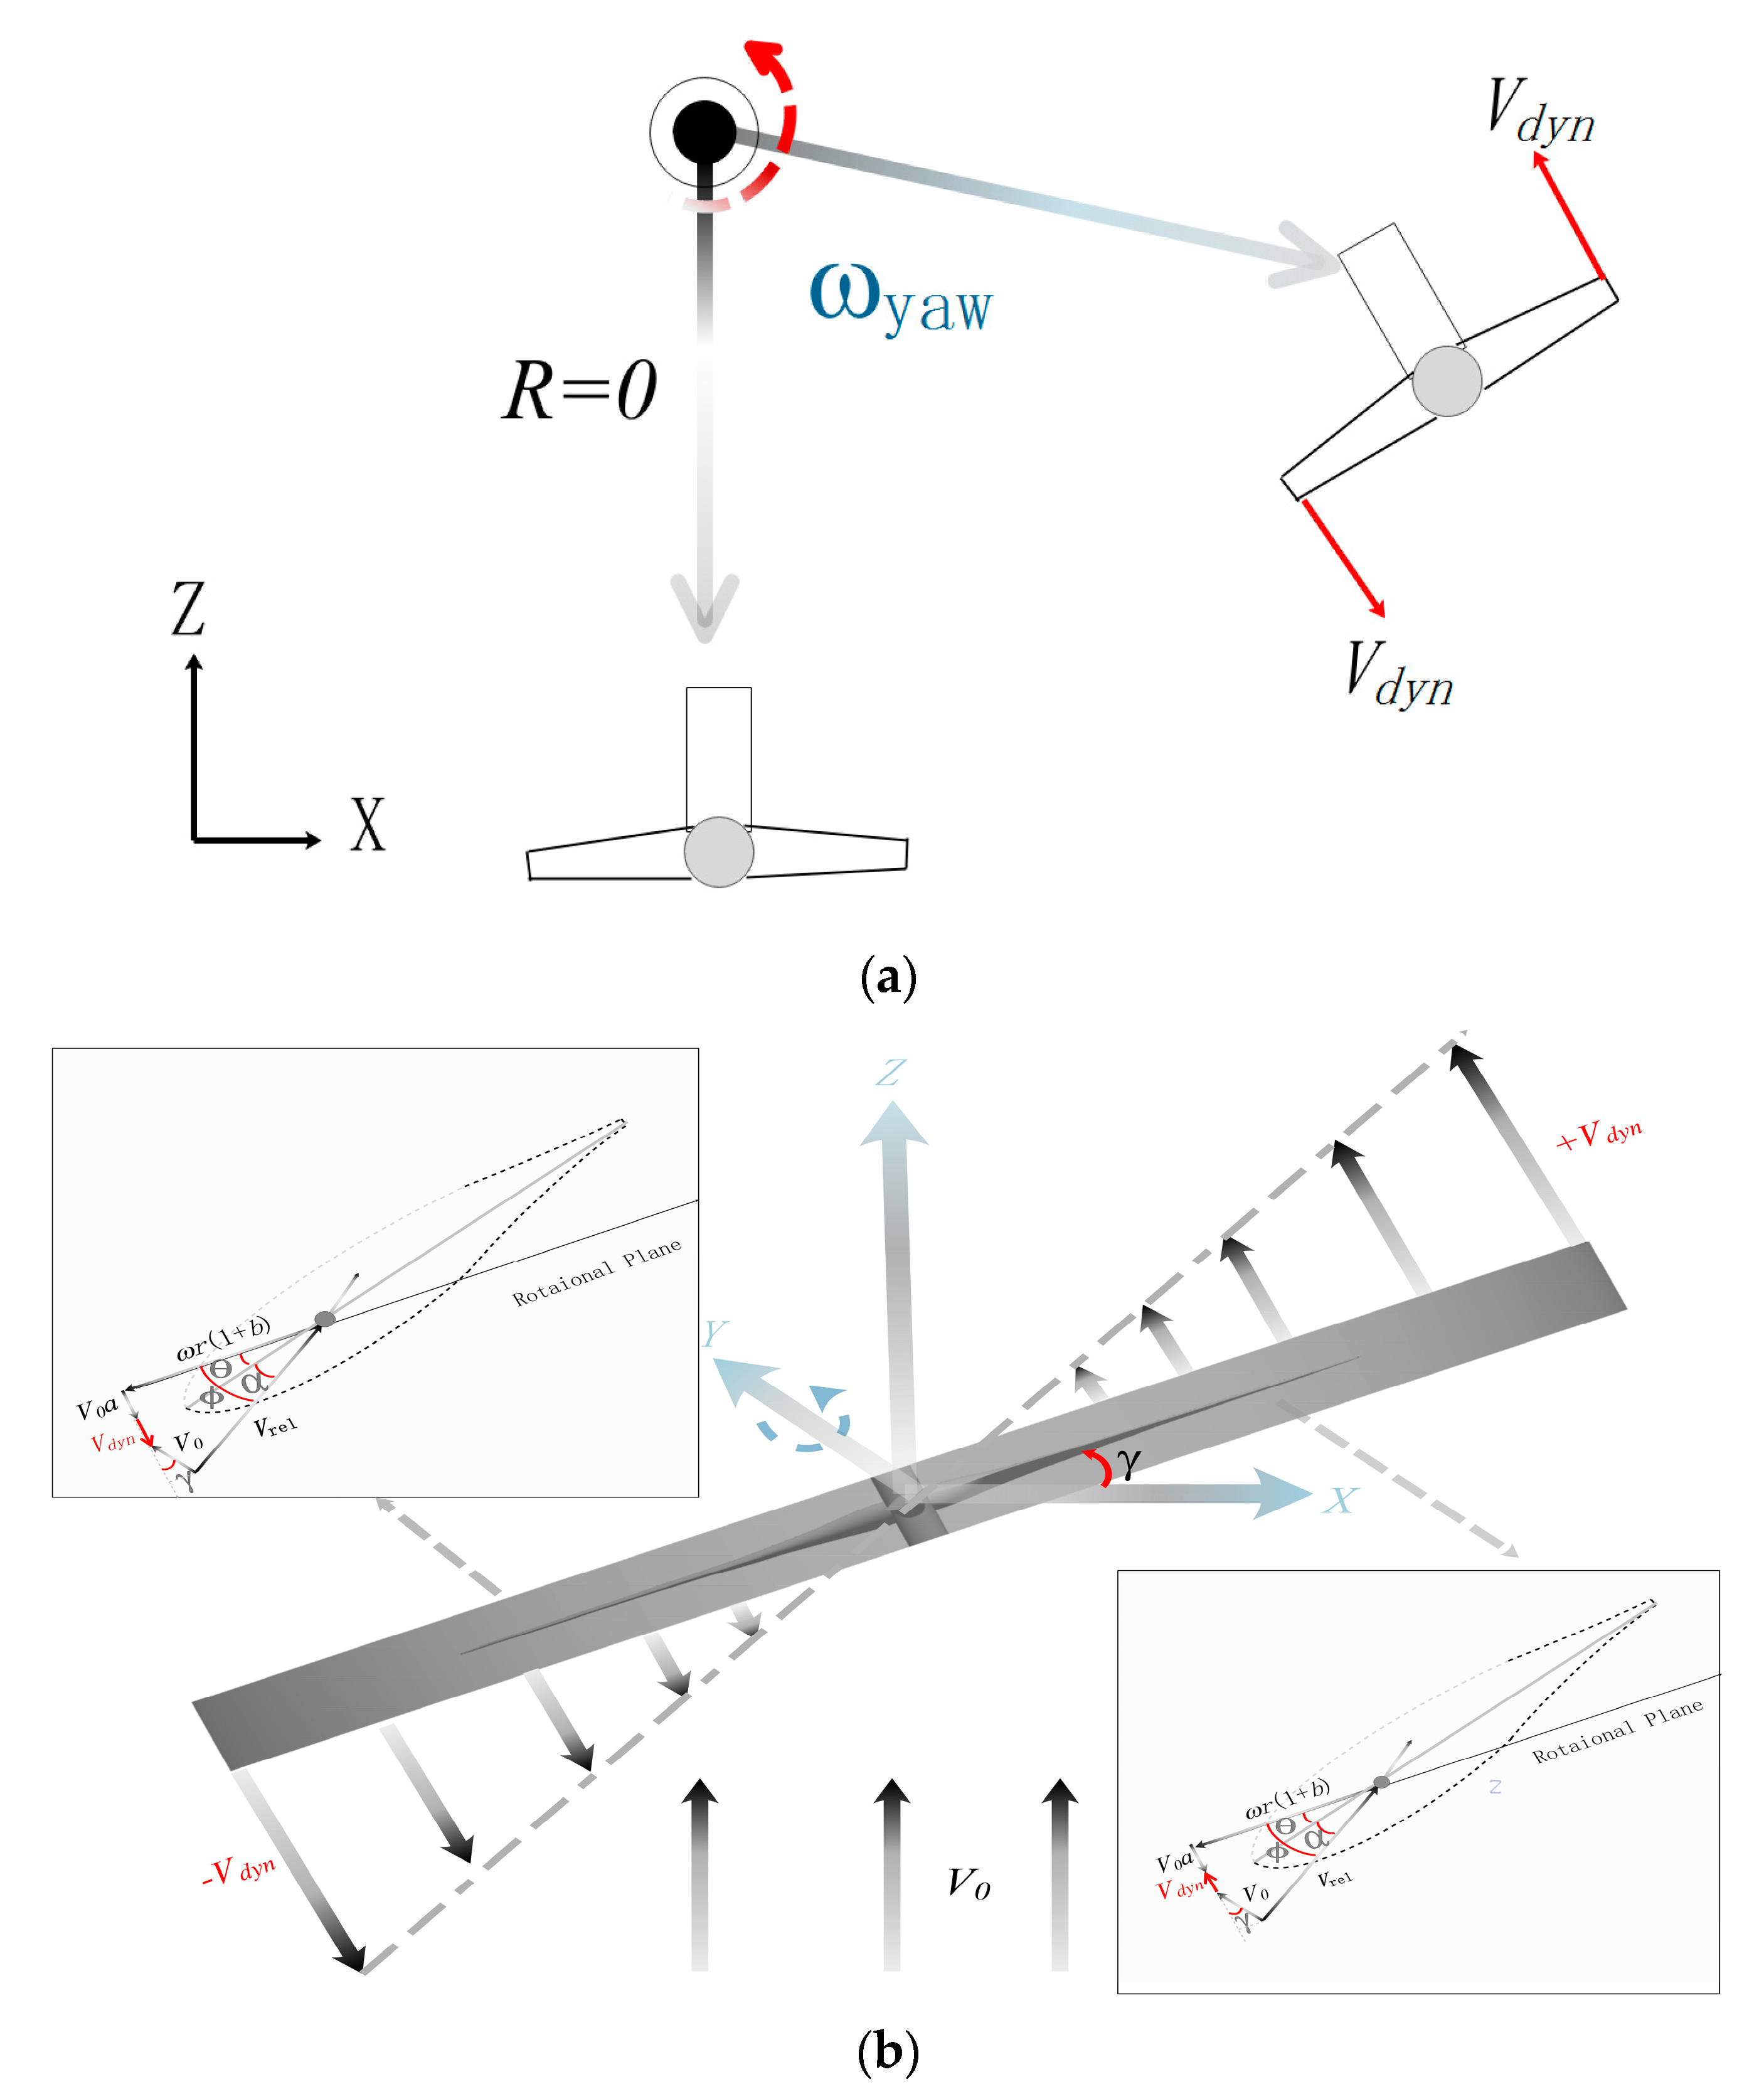
To investigate the yawing effect, additional velocity induced by the yawing wind rotor should also be examined.
Figure 25 illustrates the velocity triangle along the span of the blade under dynamic yawing. The dashed line of the yawing zone indicates positive yaw (negative yaw was not investigated in the present simulation). Four process variations can be extracted according to the dynamic yawing stage. Note that
R = 0 means that initial position of the rotational axis of the wind turbine is the rotor hub position, which is different from the platform yawing process used for the offshore wind turbines. The direction of
Vdyn is different on both sides of the yaw axis. In the process of yawing counterwise,
Vdyn and the inflow wind speed create an acute angle in the right side of yaw axis, while
Vdyn and the inflow wind speed create an obtuse angle in the left one of yaw axis, as shown in
Figure 26a. The process of yawing clockwise is just the contrary to the case of yawing counterwise. The absolute formulation of
Vdyn can be written as:
where,
Vdyn become zero at the azimuth angle of 0° and 180° in the current setup of wind turbine.
The relative velocity of the section under dynamic yawing can be defined as:
where
η = 1 if the direction of
Vdyn and inflow wind velocity creates an acute angle and
η = −1 when the direction of
Vdyn and inflow wind velocity creates an blunt angle. In the present yawing simulation, if the wind turbine is rotating in the positive yaw direction,
β = 1.
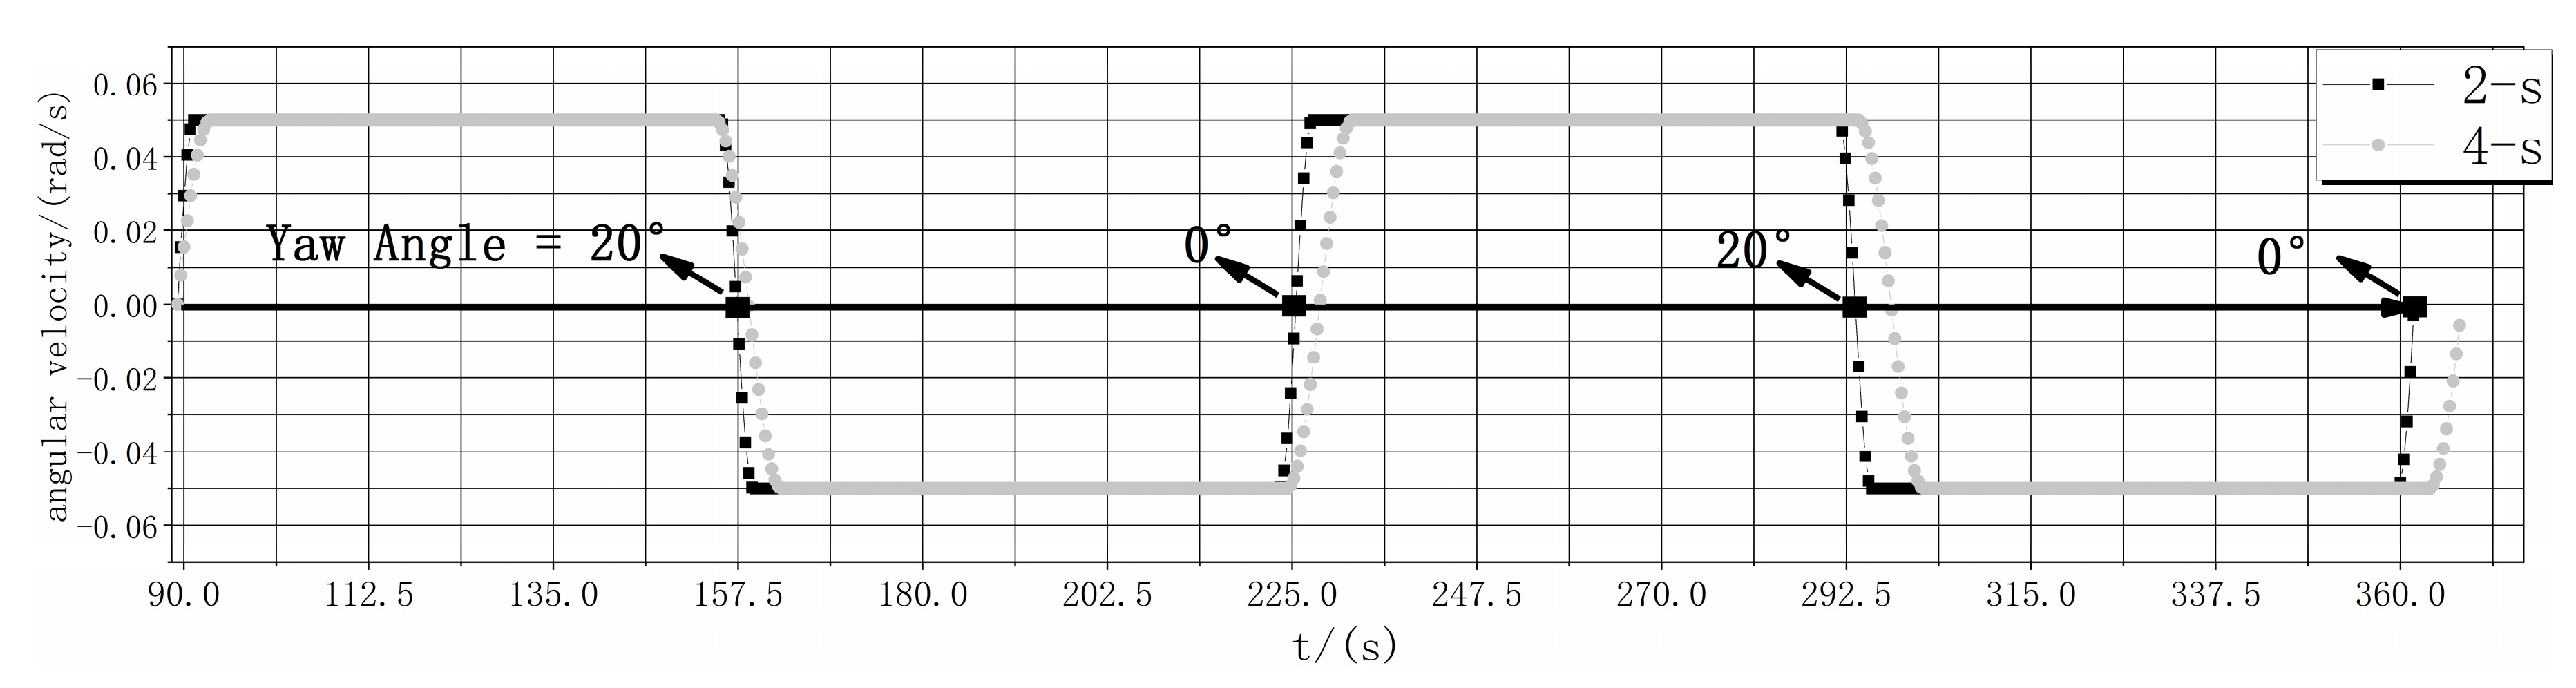
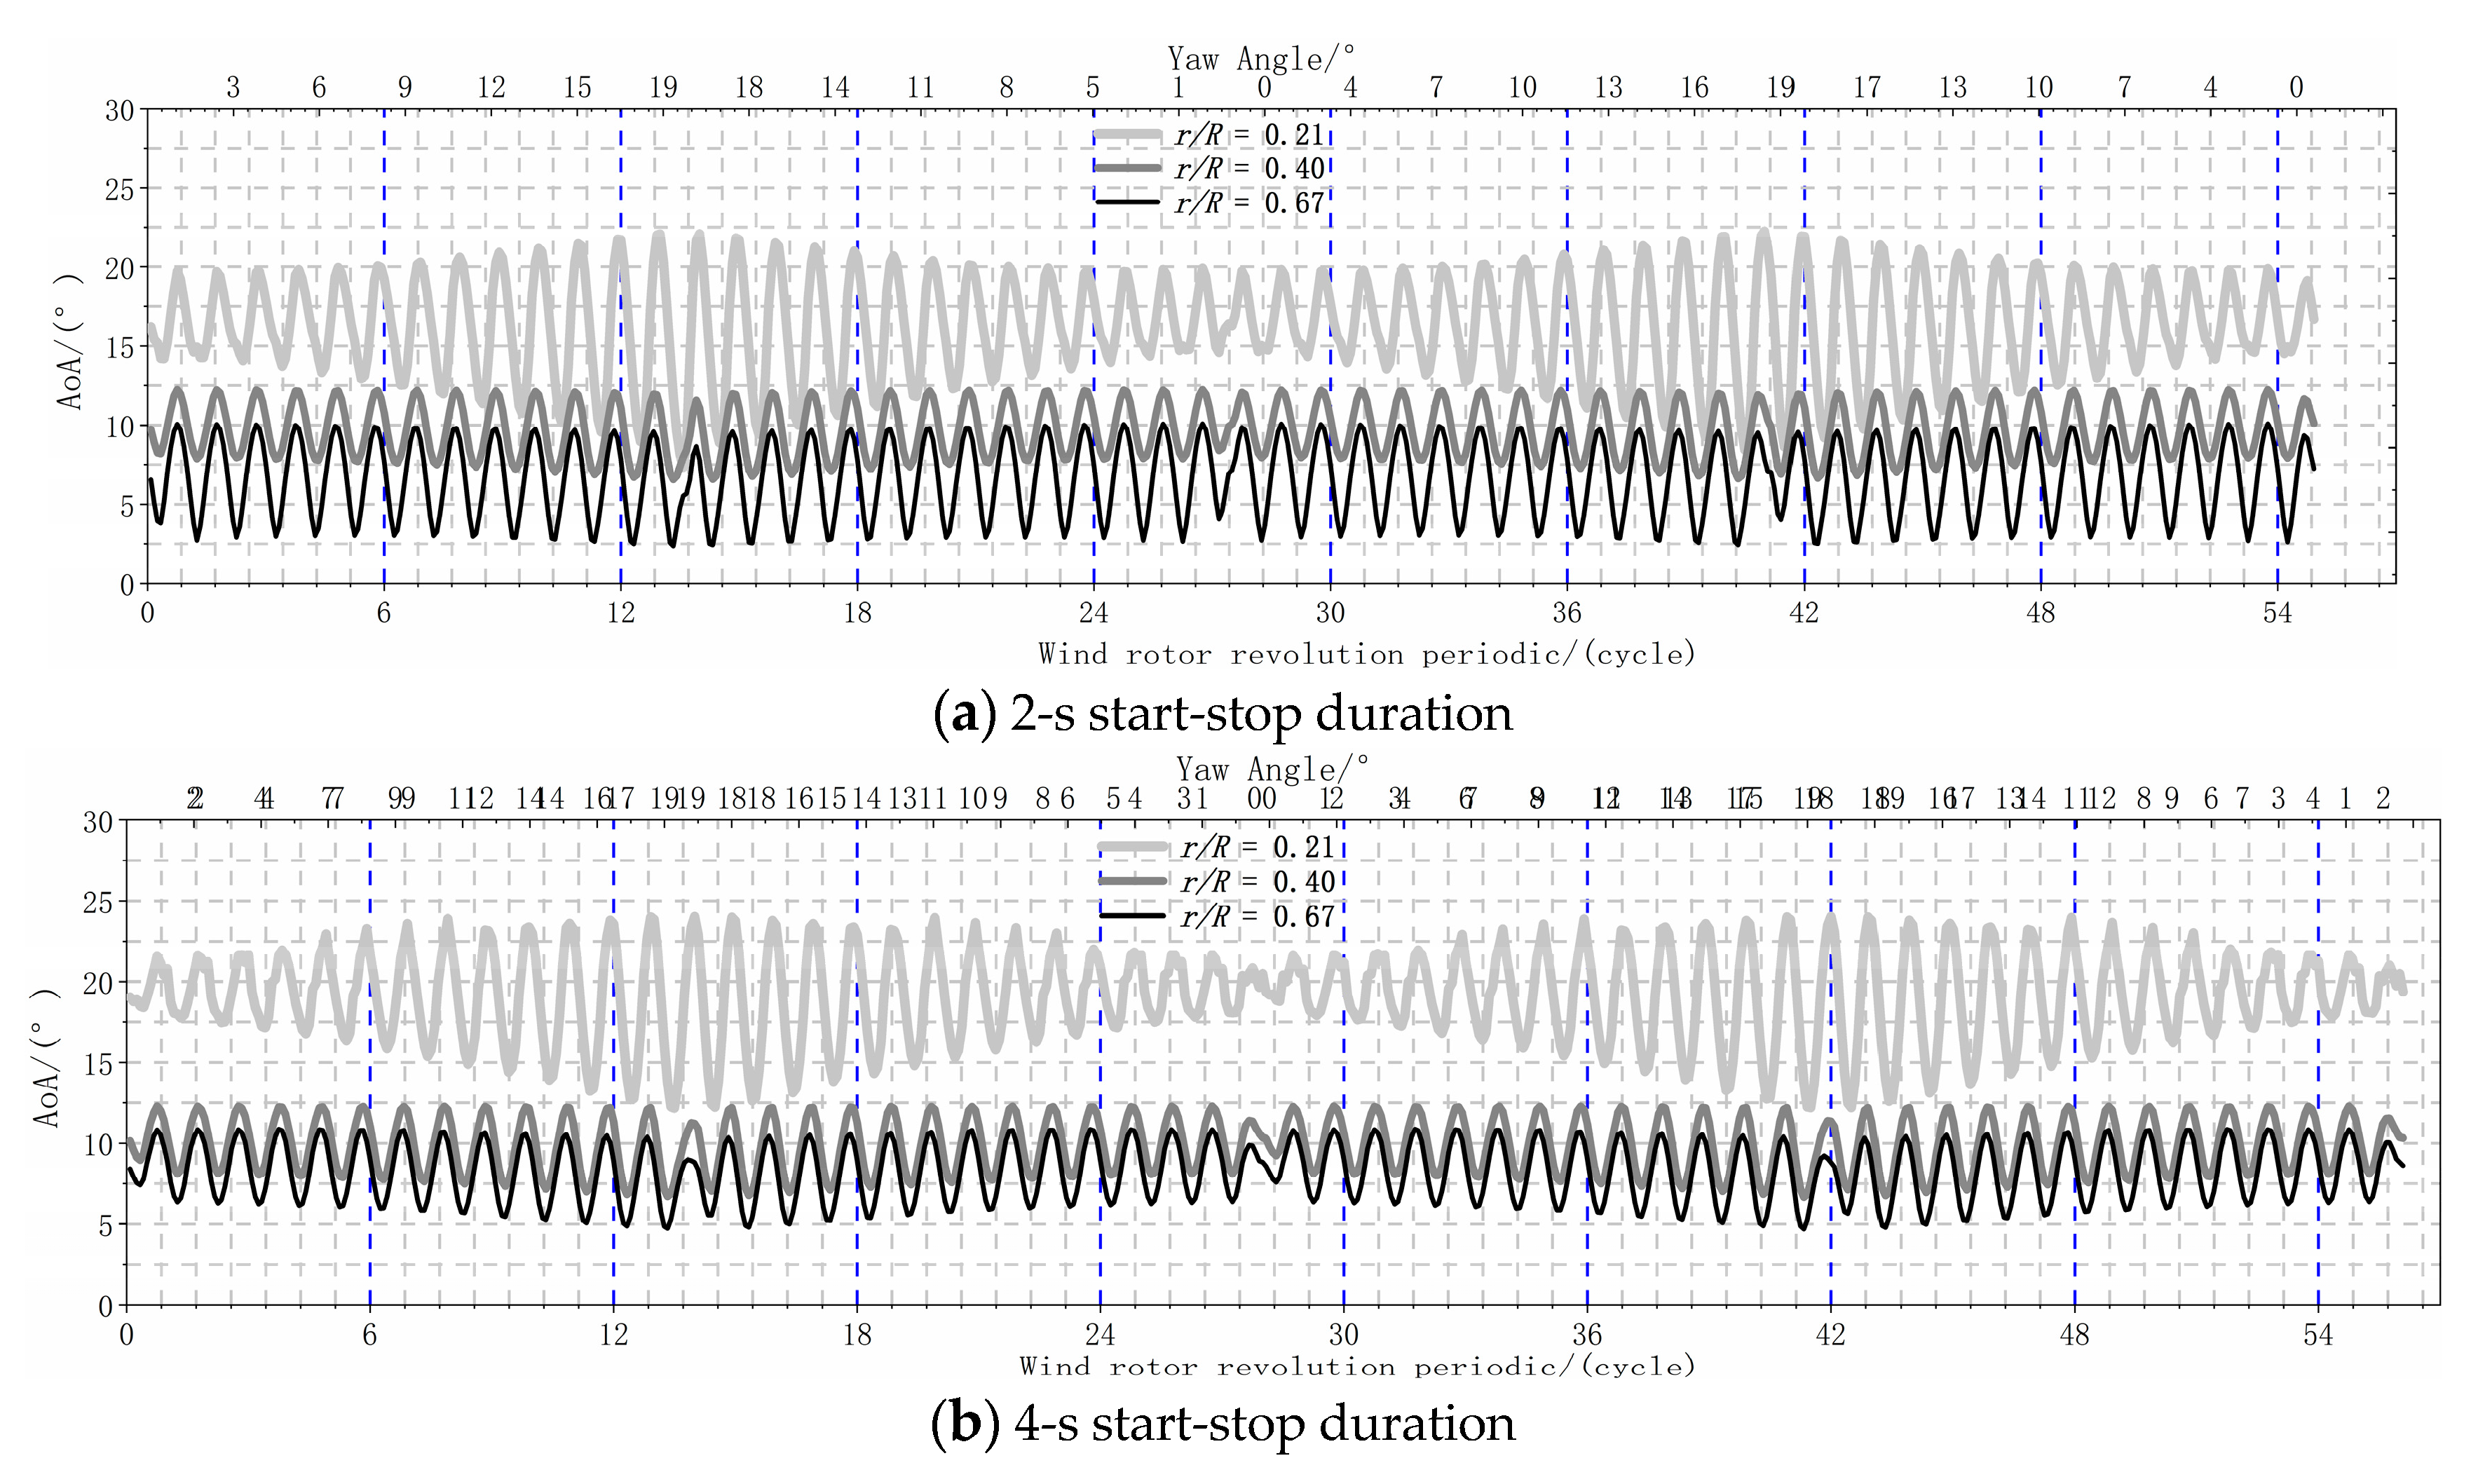
Figure 26 shows the variation of the AOA in three typical section (
r/
R = 0.21, 0.4, or 0.67), with respect to yaw angles 0–20–0–20–0°. The upper abscissa is the wind rotor yaw angle, while the bottom abscissa is the wind turbine rotational cycle. The vertical coordinate indicates the AOA distribution along the radial direction of the blade. The three sections are indicated by solid lines of different thickness of airfoil. Inner board airfoils are the thickest and outer board one are thinnest.
The AOA gradually decreases along the span of the blade. Due to the effect of dynamic yawing, the AOA oscillates during the rotational period of the rotor, with the combined effects of both retreating & advancing and upwind & downwind.
Figure 26a shows the calculated results of 2-s start-stop yaw rate. In this case, the start-stop velocity is faster, and the overall fluctuation are larger than those in the 4-s scenario. The start-stop effect mainly affects the AOA near the outer board but has less influence on other areas. In addition, the start-stop process leads to changes in the AOA.
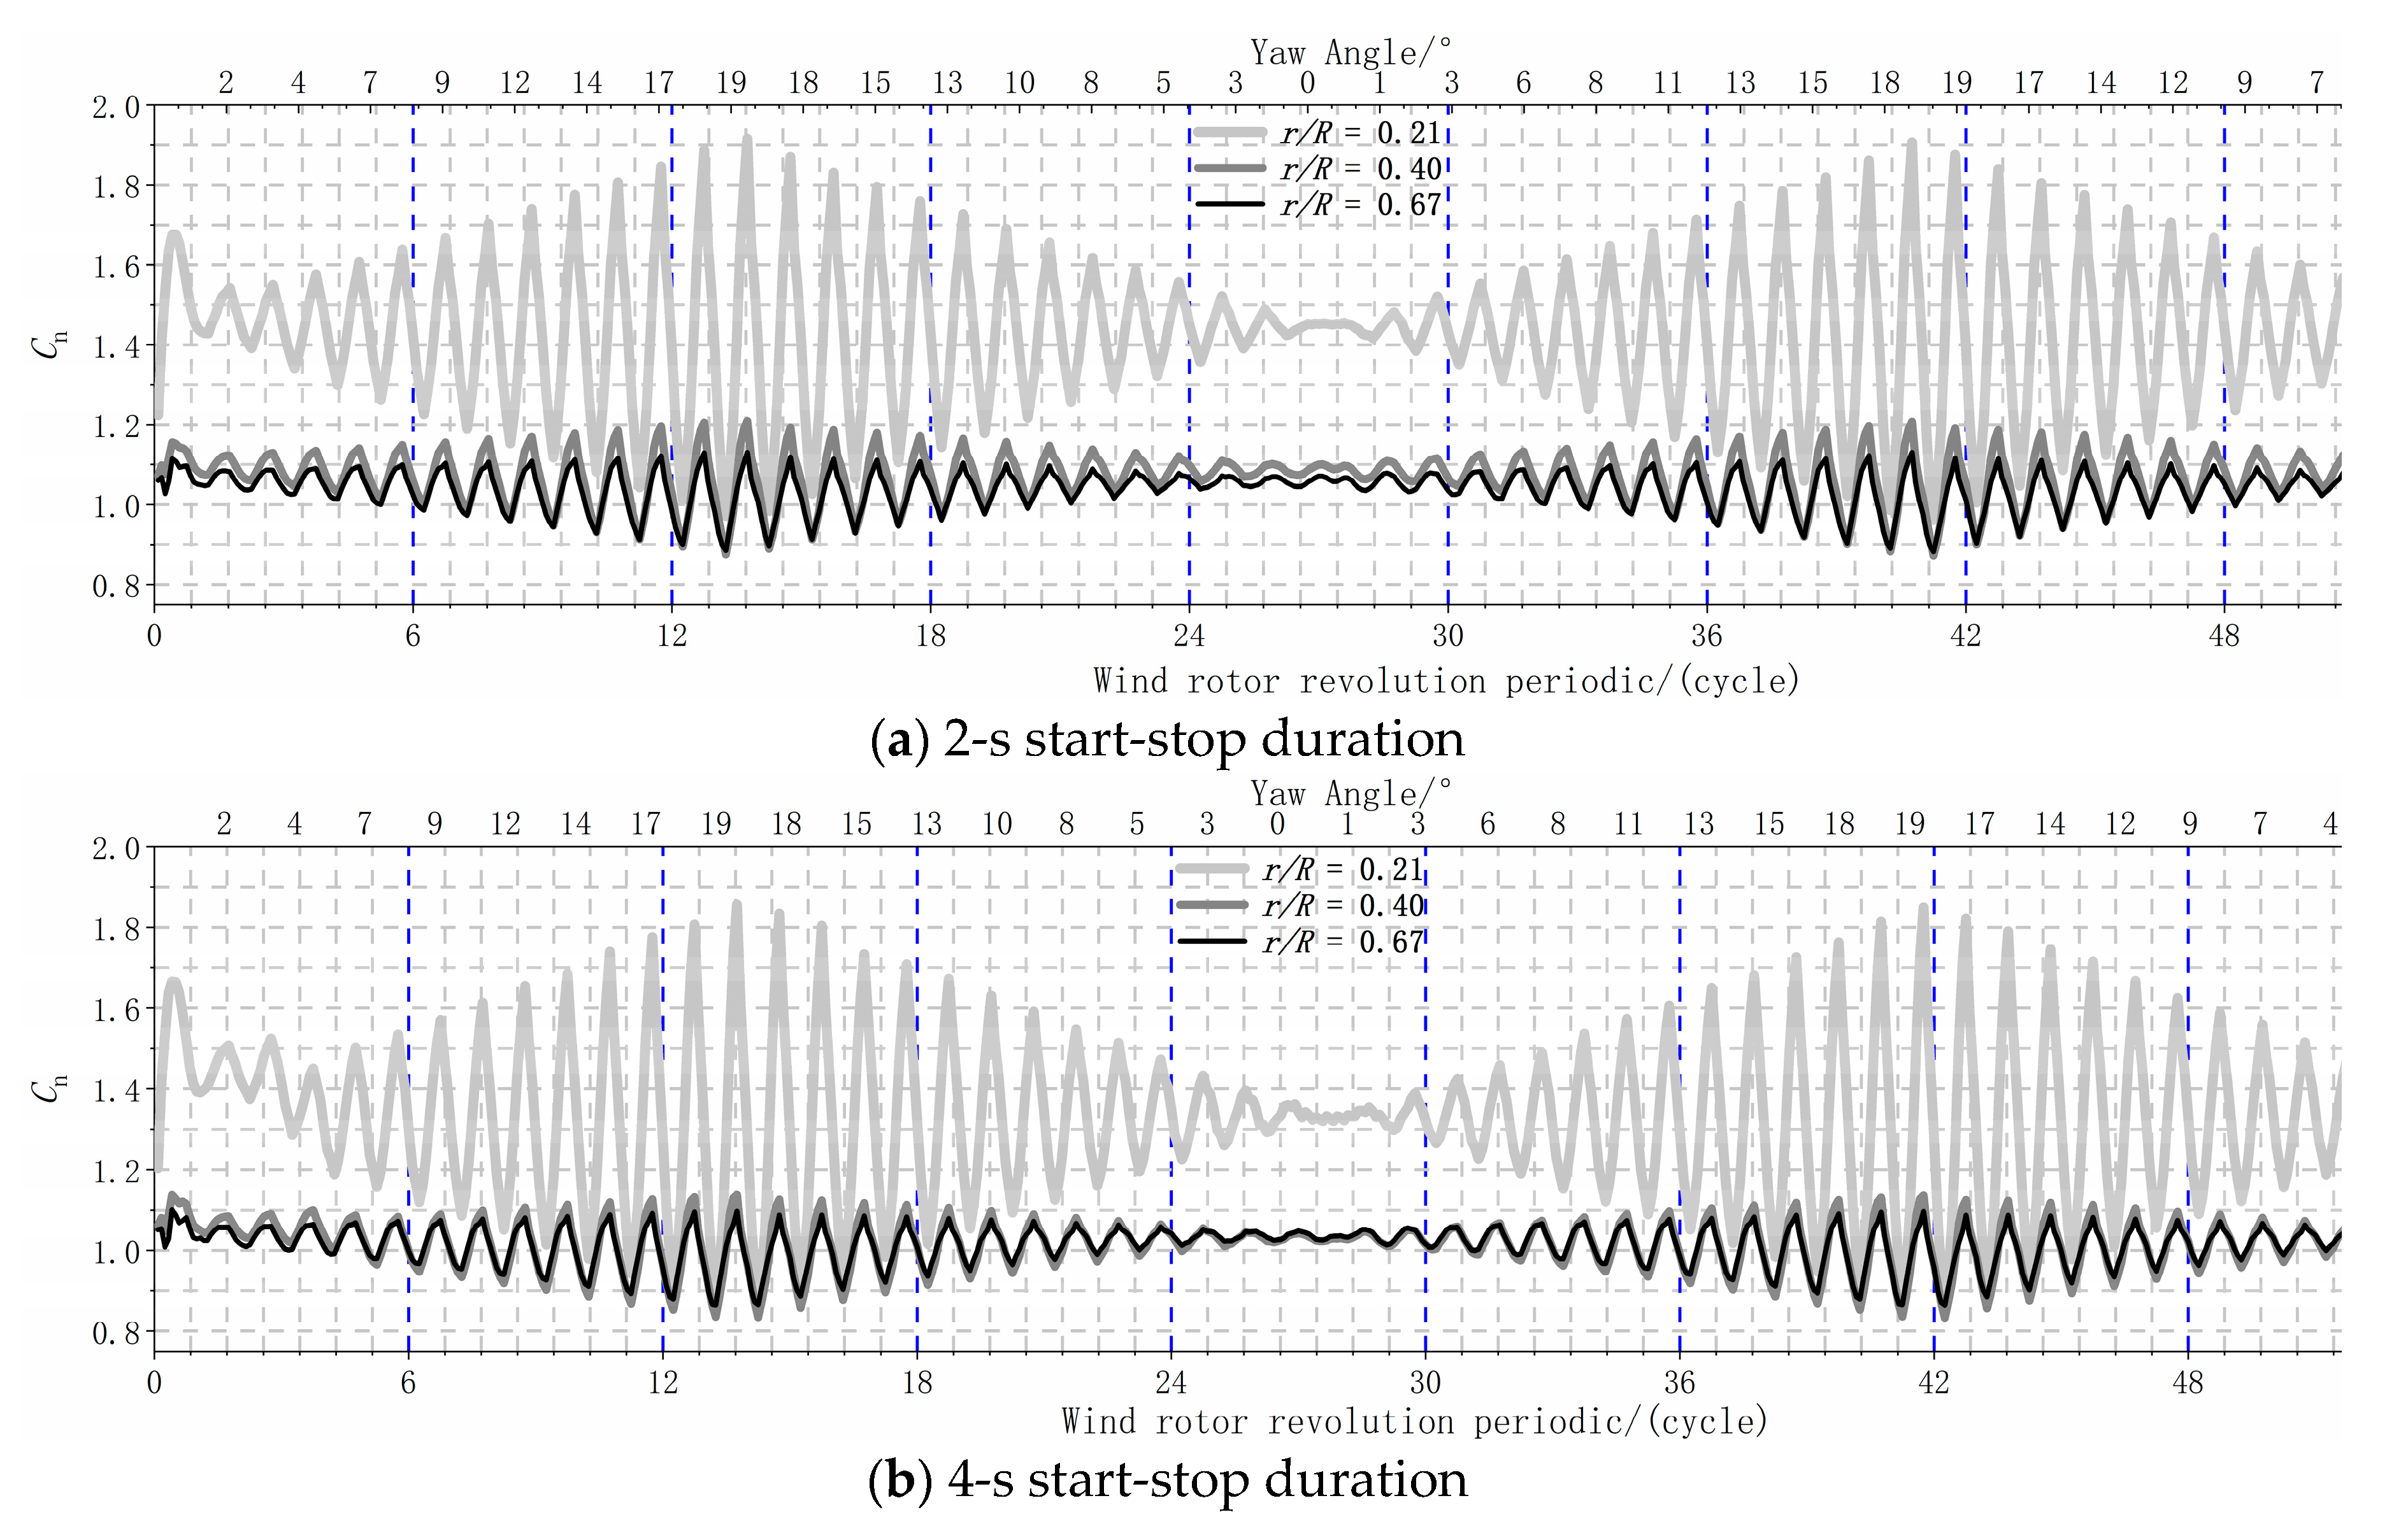
Figure 27 show the distribution of the normal force coefficient at three typical sections (
r/R = 0.21, 0.4, 0.67) within the dynamic process, including two forward yawing and backward yawing states with a yaw angle of 20°. Variation of
Cn under dynamic yawing with a 2-s duration causes larger differences at the radial position (
r/
R = 0.4) than the 4-s duration. Under the yawed case, the average normal force coefficient of the
r/
R = 0.21 section with a yaw angle of 20° is 1.1, and the maximum and minimum load coefficients are 1.7 and 0.5, respectively (see
Figure 14). In the current yawing case, the maximum and minimum load factors are 1.9 and 1.0, which are due to the downwind and upwind effects of the yaw dynamics, similar to the horizontal wind shear effect, but more pronounced than typical horizontal wind shear effects. In the start and stop duration of yawing, the yawing velocity of 2-s case has much higher frequency than 4-s case, resulting to much higher additional velocity and aerodynamic loads. Thus the overall performance of 2-s yawing presents much larger fluctuation in the process of yawing.
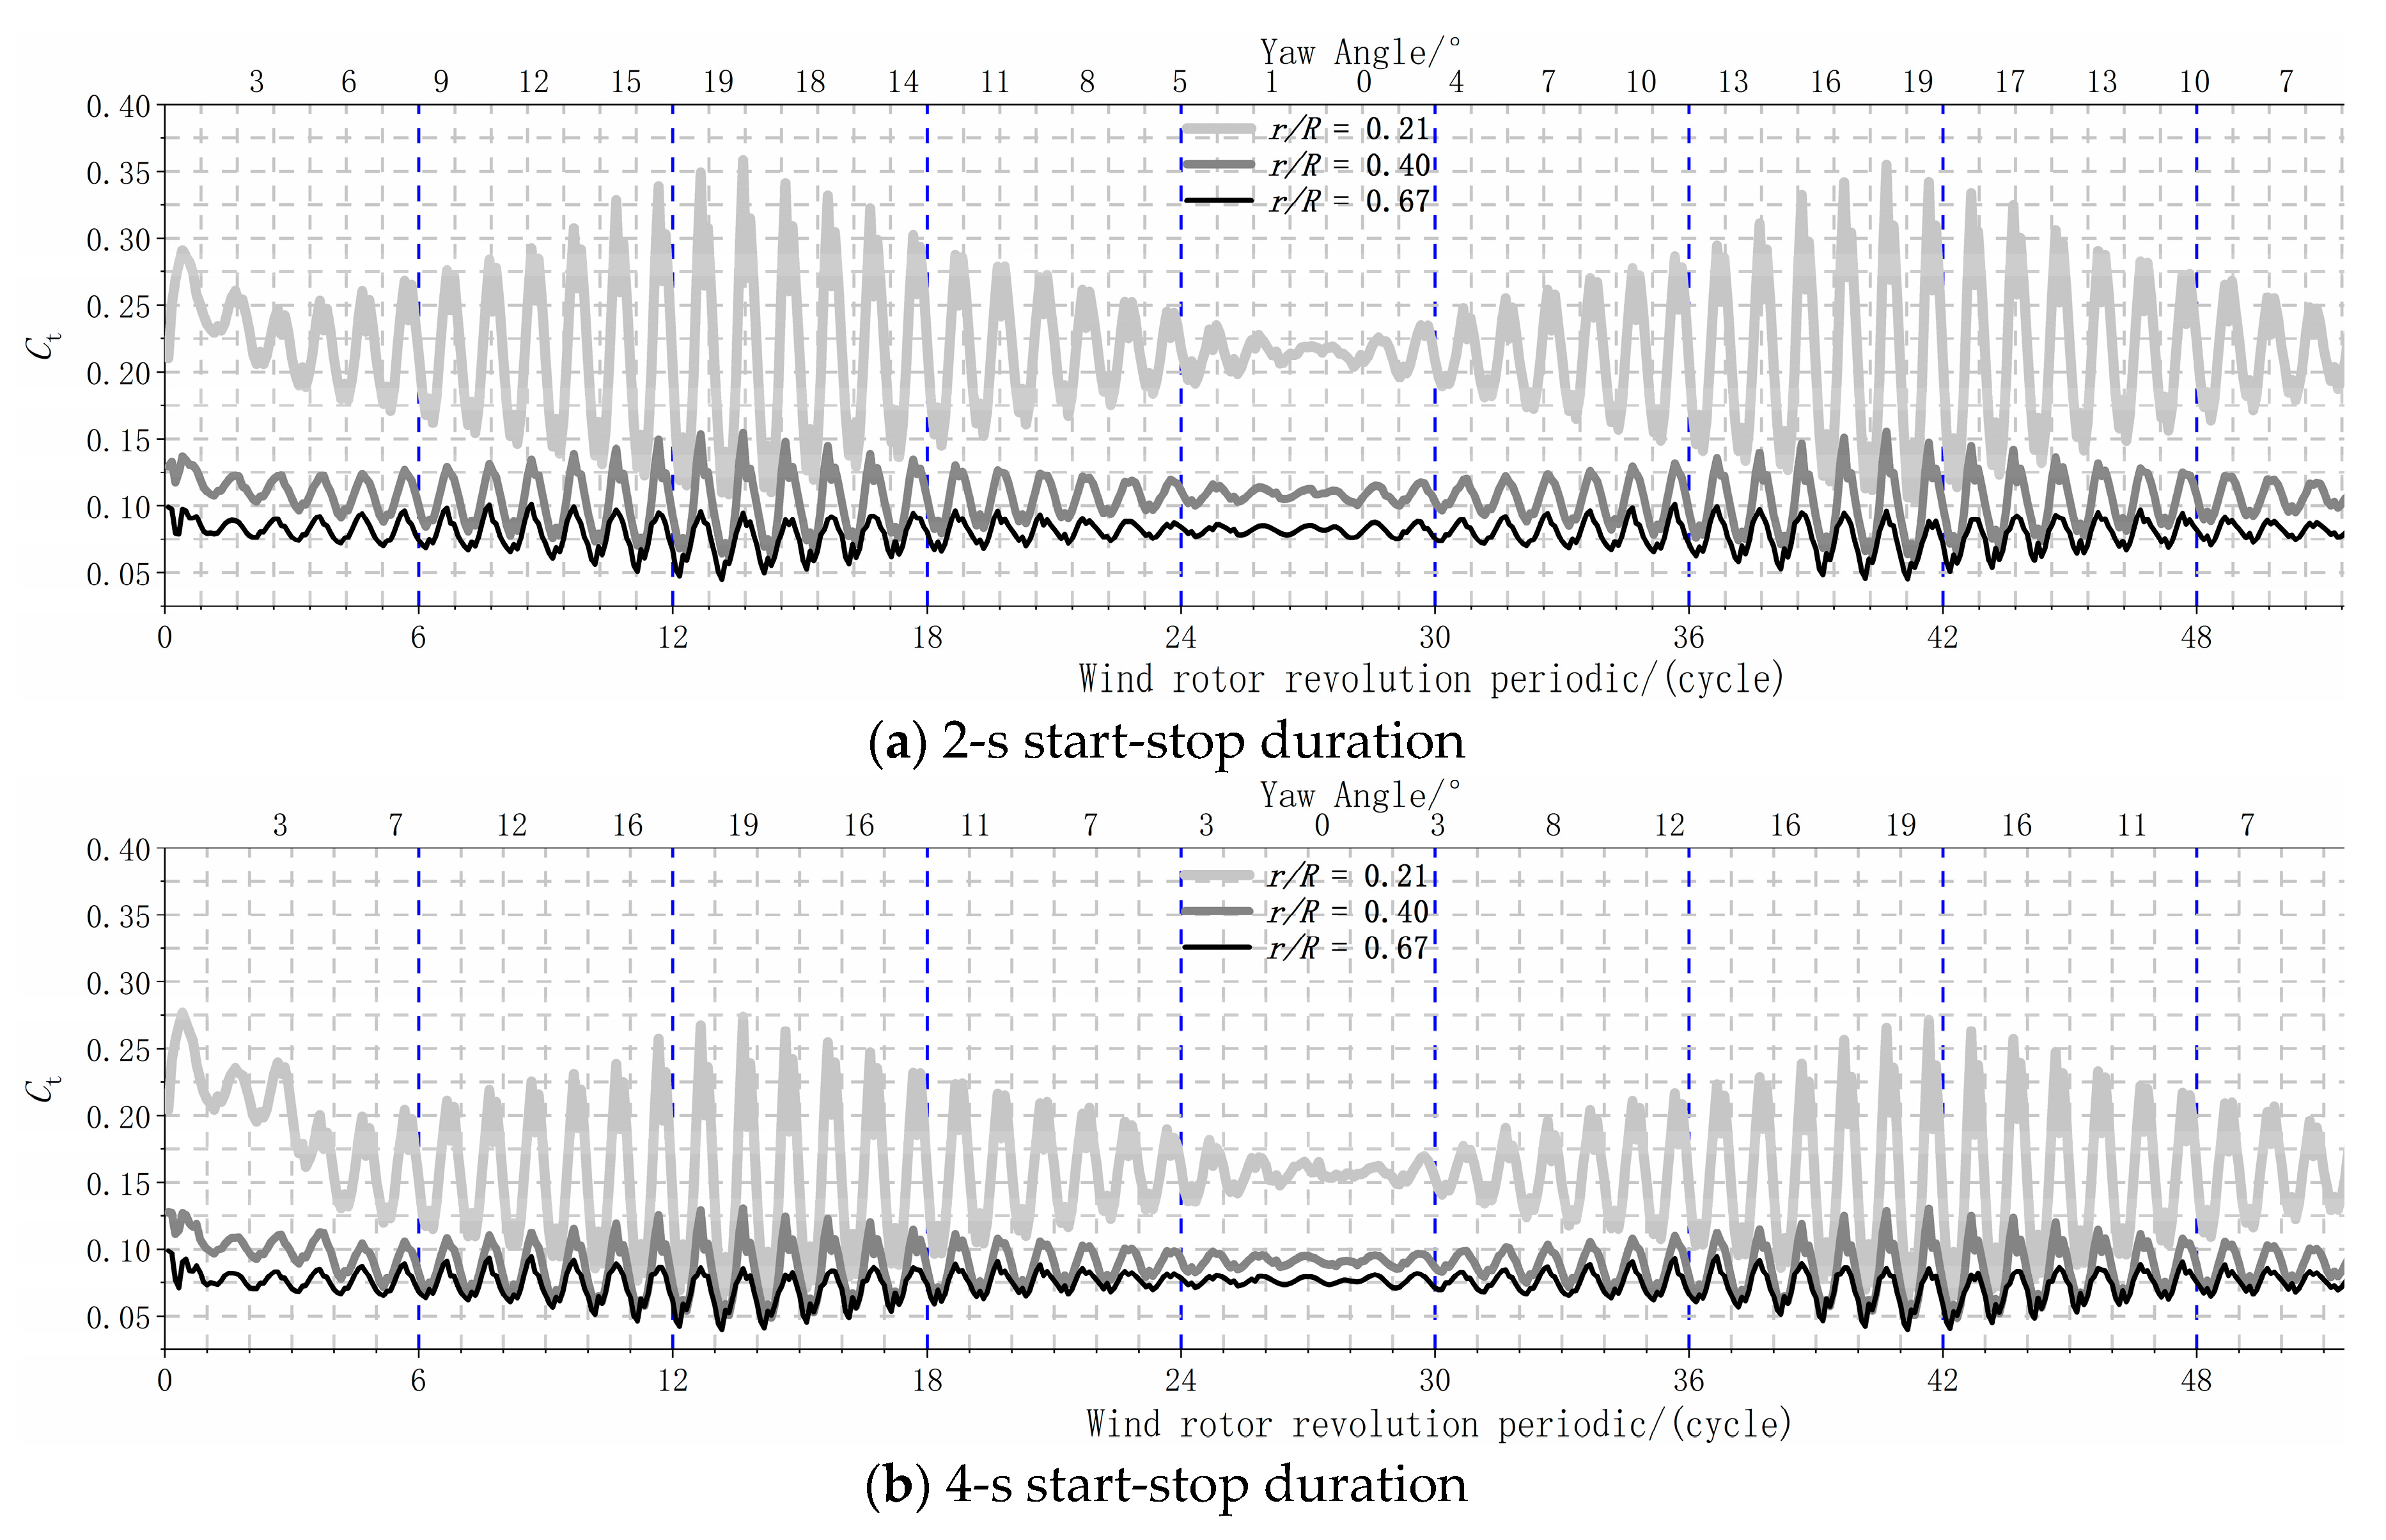
Figure 28 shows how the tangential force coefficient varies with simulation time at three typical sections (
r/R = 0.21, 0.4, and 0.67). The results suggest the aerodynamic load inside the inner board is more influenced under dynamic yawing with the 2-s during than the 4-s duration. Fast shifts of the yaw angle under the yawing start-stop stage influence the aerodynamic load along the inner and middle blade span.


