1. Introduction
Electric vehicles run efficiently with zero emissions, benefit sustainable development, and grow rapidly. In China, the sales of battery electric vehicles reached 652,000 in 2017, which is an increase of 59.4% compared to 2016. The onboard lithium-ion battery (LIB) capacity exceeded 37 GWh, of which average capacities of electric cars and buses, respectively, were 30 kWh and 60 kWh. Among them, the proportions of the prismatic, the cylinder, and the pouch cells were about 59%, 28%, and 13%, respectively. Today, millions of battery electric vehicles run on the road. Their safety has always been considered because LIBs can have thermal runaway due to abuse [
1].
The overheated LIBs can catch fire or even explode and cause a lot of property damage or personal jury. Smart phones are usually powered by one LIB. If the LIB is abused mechanically, its phone can be on fire. In the second half of 2016, millions of the Galaxy Note 7 were recalled from the spontaneous combustion of LIBs with internal short circuit (ISC) by either squeezing the batteries or puncturing the separators at the solder joints. Compared to smartphones, one electric vehicle is powered by hundreds of thousands of LIBs so that its thermal runaway should be more prone to occur. On 4 March 2017, one Tesla Model S burned out due to its battery part being on fire while charging at one super charge station in Shanghai, China. It was reported that there were at least 14 pure electric vehicles to ignite spontaneously while they were in operation, charge, and park from June to August of 2018 in China. These battery runaway hazards can be attributed to the severe exothermic reactions inside the LIBs caused by mechanical, electrical, and thermal abuses [
2].
The thermal runaway mechanism of one LIB was systematically summarized in several reviews [
3,
4,
5,
6,
7,
8]. For an example, the energy release diagram was proposed to quantify the chain-reaction kinetics for cell materials in the uncontrolled process [
8]. However, the thermal propagation behavior and mechanism of battery modules or packs needs to be further investigated due to the complex thermal interactions among cells. During thermal runaway, a large amount of heat is released in a short time in the battery module, the extension of which can be influenced by abuse types, module structures, shell shapes, electrical connections, energy levels, and heat dissipation modes.
The series-parallel structure of cells affects the thermal runaway propagation behaviors of battery modules. When thermal runaway is triggered by the external short circuit, the propagation of cells in parallel is more intense than that of the batteries in series. Under the condition of needling the central cell of 18,650 modules, Lamb et al. [
9] found that each cell in parallel underwent thermal runaway in an 1S10P module and only the penetrated cell initiated runaway in a 10S1P module. Even if cells are in parallel, their pole connection modes also have effects on the thermal propagation in battery modules. Lopez et al. [
10] validated that the electric connection of the M-type could reduce thermal hazards compared with that of the S-type when overheating the central cell in a 1S9P 18,650 module.
If the heat transfer area between cells is large, the pole connection types have little influence on the thermal propagation in a module. For instance, the cells were arranged tightly and contacted with a large area in both 1S5P and 5S1P pouch modules. The central cell was punctured to cause similar results in these two modules. All cells underwent thermal runaway and eventually charred [
9]. Jeevarajan et al. [
11] investigated an external short circuit test of an 8 × 8 18,650 module and found that the matrix configuration prevented the lateral propagation of fire even though some cells caught fire and exploded.
The energy level of the cell is one of several important factors of the thermal propagation in battery modules and is often characterized by a state of charge (SOC). Additionally, it is characterized by higher SOC, more energy, and easier to trigger thermal runaway. In the 2 × 2 matrix configuration of an 18,650 module, Ouyang et al. [
12] set up a round rod heater with the same size as the cell. It was found that the higher the SOC is, the earlier the thermal runaway of the battery module is, the faster the heat spread is, and the higher the surface temperature of cells is. Zhong et al. [
13] conducted the thermal abuse experiment of battery modules with the 3 × 3 matrix structure of 100%, 50%, and 0% SOC. By using the same 100 W heating power, the higher the SOC became and the more intense the thermal runaway of the module became. Clearly, when a module has more cells, it can lead to more intense thermal runaway. Additionally, a model simulation showed that the whole module could be thermal runaway when the exothermic reaction heat of one runaway cell increased slightly [
14].
Spacing increase and heat insulation materials can lessen heat transfer between cells, which inhibits the thermal runaway propagation in a module. For example, the cell gap increased from 0 mm to 2 mm to reduce the risk of thermal runaway propagation in a module [
10]. By comparing the thermal propagation process of 3 × 3 18,650 cylindrical battery modules with two kinds of spacing, it was found that the surface temperature of cells near the runaway cell in the batteries with 0 mm gap rose more rapidly than that with 4 mm gap [
13]. Furthermore, one kind of heat-resistant fiber material with a multi-layer high reflective metal foil was also used as the thermal radiation barrier to block the thermal transmission of high temperature explosives and flames to adjacent cells [
10]. In addition, other researchers investigated the inhibitory effects of integrated aluminum radiators, micro-porous coolers, and phase change materials on the thermal runaway propagation in battery packs [
15,
16,
17].
By the available literature, the thermal runaway propagation of large prismatic cells was studied less than that of cylindrical and pouch cells in modules. Feng et al. [
18] investigated the thermal runaway propagation mechanism of prismatic battery modules by penetrating the first large format cell on the side, including temperature responses and heat transfer passages of six batteries in series. By overheating the first side cell, Li et al. [
19] carried out the thermal abuse tests of the module composed of five prismatic cells with different SOC levels and validated that the module with 100% SOC had more intense combustion behavior and shorter average propagation time than that with 50% SOC. In battery modules, the heat released from the side cell in thermal runaway should be transferred to other cells than that from the central cell.
In onboard battery packs, prismatic cells are arranged face-to-face and their poles interconnect through aluminum or copper bars. The group mode of prismatic cells is simple, sturdy, and durable, which makes them load greatly on electric vehicles. However, it is difficult for the central cells to dissipate heat because of the long distance of the heat transfer inside a battery module. Thus, compared to the side cells, the central cells can be overheated into thermal runaway to cause the most intense thermal runaway propagation in a battery module. Due to high cost, risk, and difficulty, there is little literature to investigate the central thermal abuse of a large format LIB module. In this work, the central cell overheated on both sides in a 12S1P LIB module sample, which was used to explore the phenomena, triggered sequence, and characteristics of thermal abuse cells for evaluating the thermal isolation capability and early warning of prismatic battery packs for electric vehicles.
2. Experimental Setup
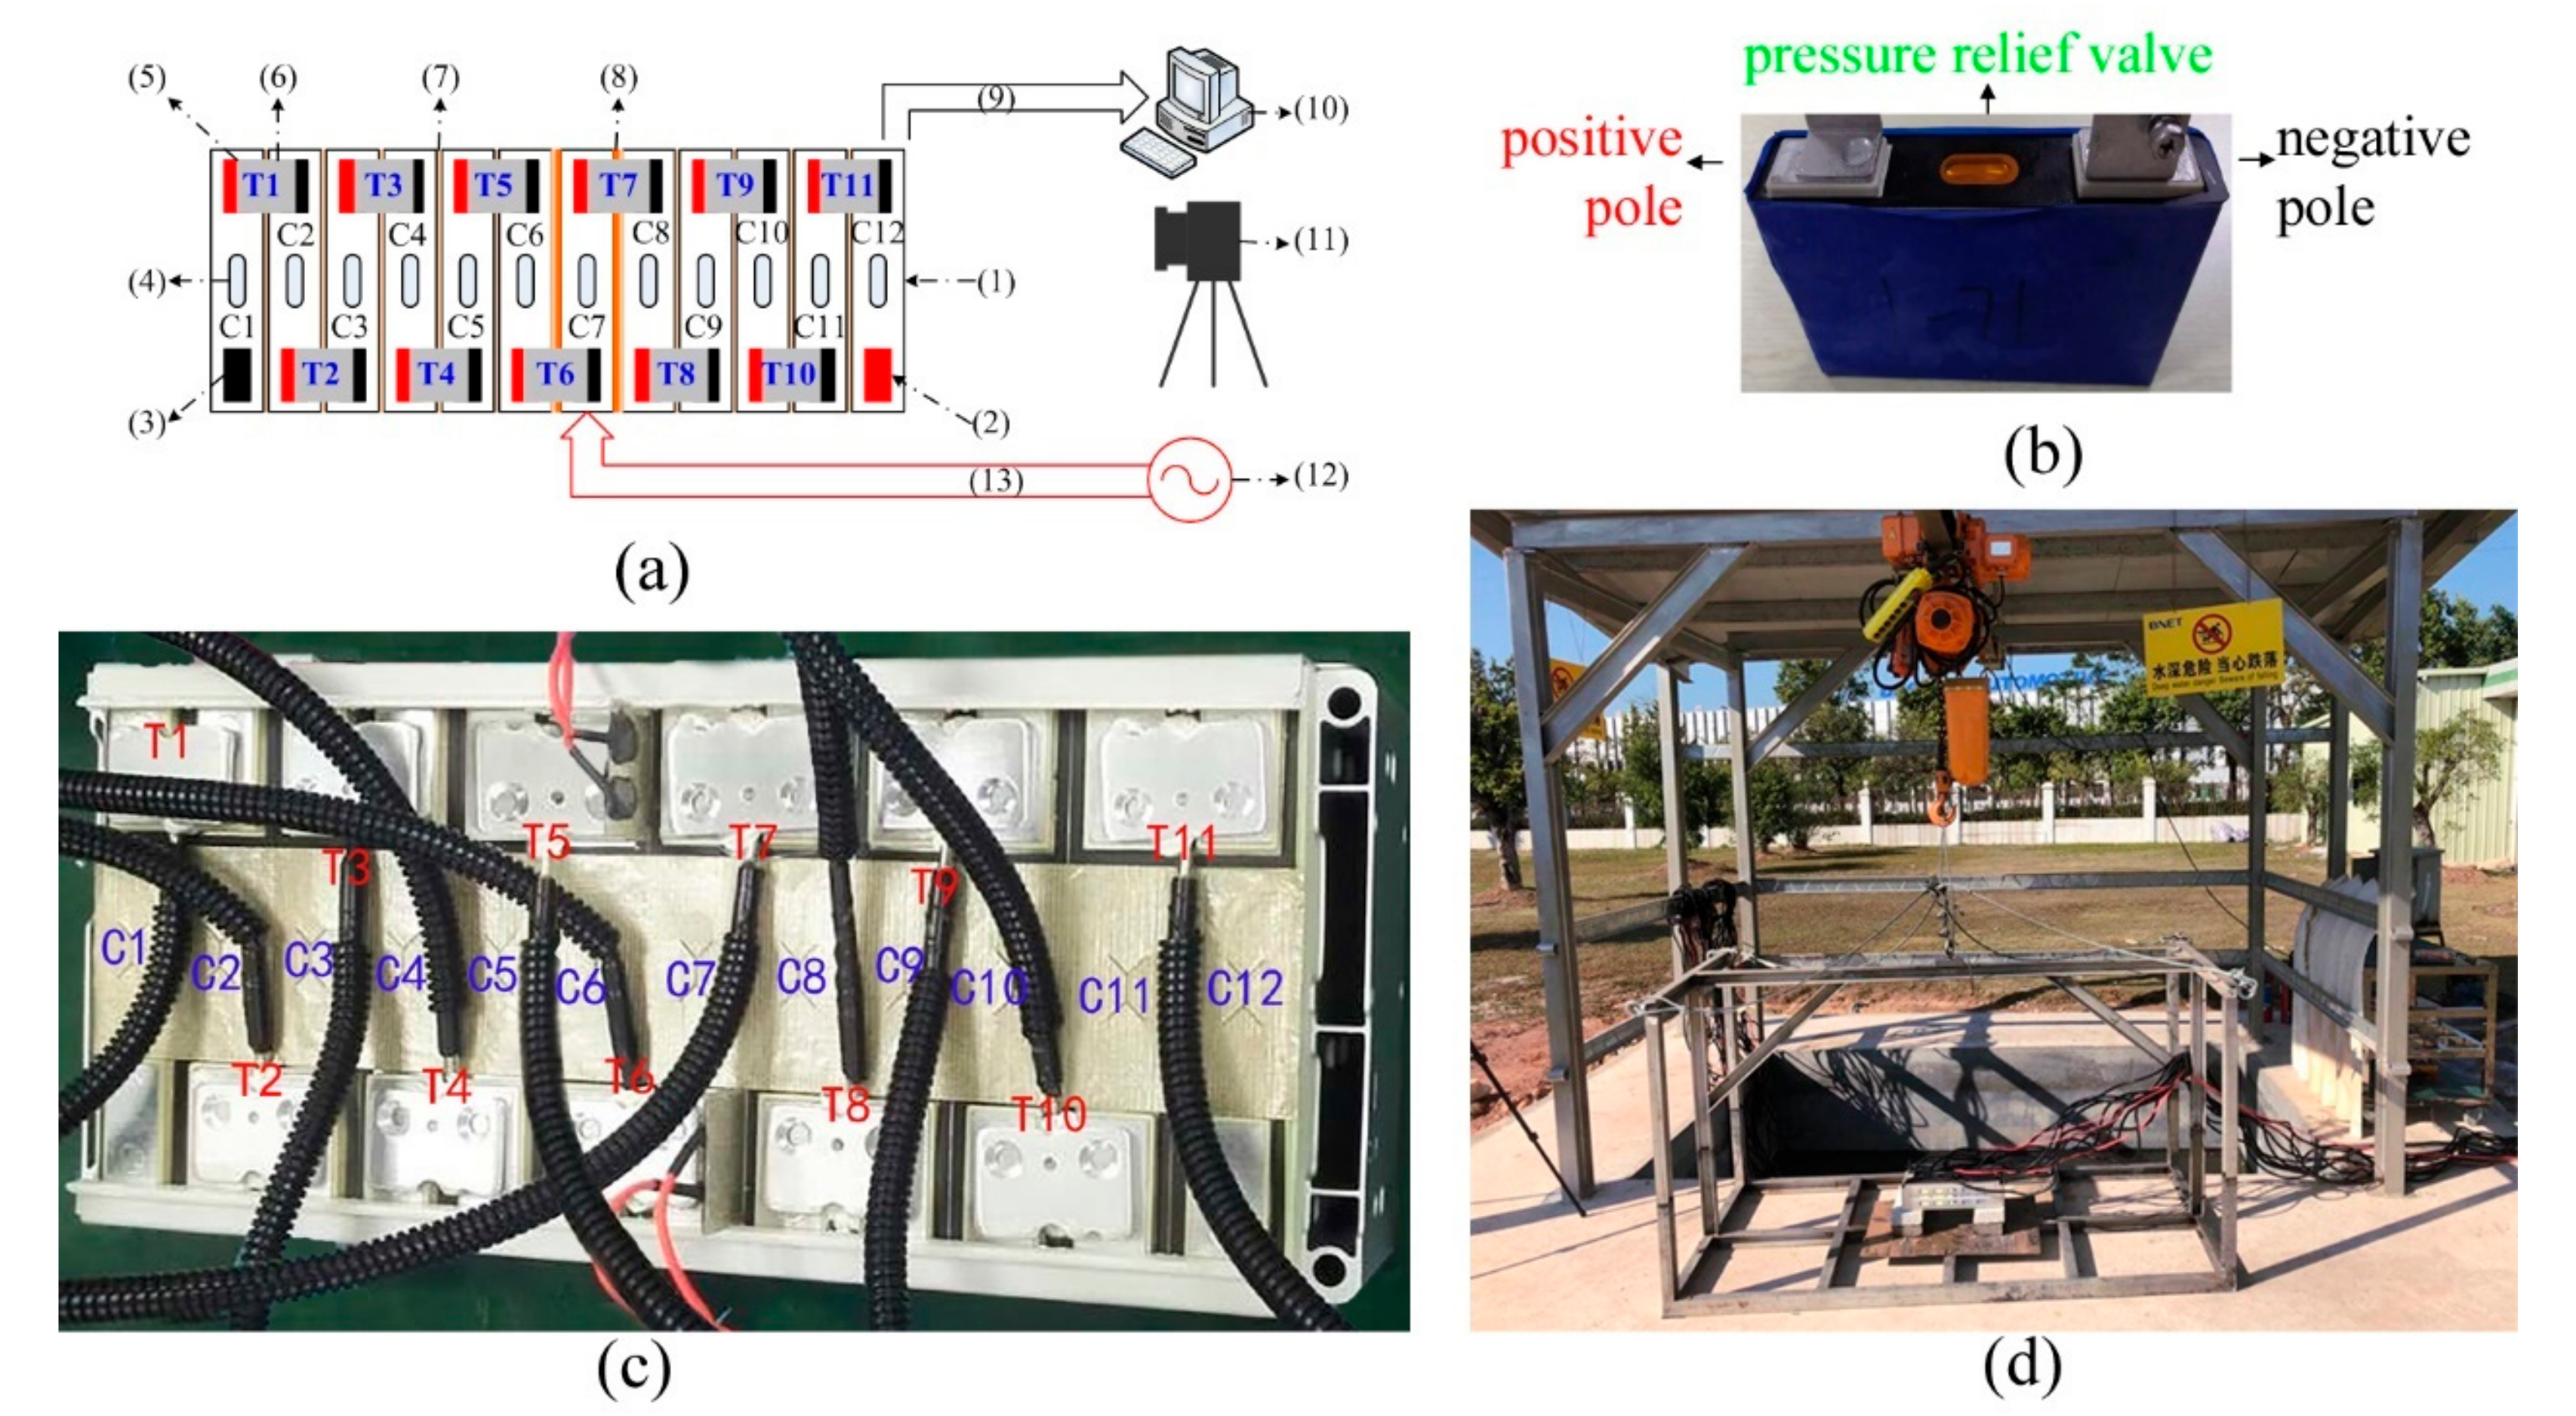
In this experiment, the battery cell is a commercial 37 Ah energy-power prismatic LIB with the lithium nickel cobalt manganese oxide (NCM) cathode, the graphite anode, and the polypropylene (PP) separator. It is 26.5 mm thick, 148 mm long, 92.4 mm high, and about 805 g. The aluminum shell of the battery is 0.7 mm thick, coated with an electricity insulation layer, and electrically connected with its positive pole. There is a vent covered with an aluminum foil pressure relief valve in the middle of the shell top. When the internal gas pressure is too high, the aluminum foil can be broken to release the pressure inside the battery. Before grouped, new cells discharged down to 2.8 V through 1C current for a safe package.
Figure 1a illustrates the block diagram of the thermal abuse test of the LIB module. It consists of electric connection bars, thermocouples, aerogel interlayers, mica film heaters, temperature, power harnesses, a 220 V AC power supply, a data acquisition computer, a digital camera, and LIB samples, as shown in
Figure 1b.
Figure 1c shows the module sample composed of 12 cells in series. The positive and negative terminals between adjacent cells are connected by a laser welded aluminum bar. A layer of 0.3-mm thick mica is laid between the terminal interconnection bars, with which vents are covered. Additionally, the 12S1P module is packed in a steel alloy box without a top cover.
In order to block the thermal runaway spread, the 0.8-mm thick aerogel were placed between adjacent cells to reduce the heat transfer between cells. On both sides of the central cell C7, a customized mica heater of 0.3-mm thickness and 400 W was installed. Four red wires powered these two heaters. Under every terminal connector, one thermocouple was installed. Eleven thermocouple wires with black bellows connected to a data acquisition computer.
The experimental site for battery packs is a ventilated outdoor building, whose flat roof is supported by four steel columns. Under this building, there is a 2 m × 2 m × 1 m water tank with a depth of about 300 mm, as shown in
Figure 1d. The battery pack sample was supported by cement bricks placed on a plank on a steel frame. Before the test, the steel frame was hoisted on the water tank and was 100 mm above the water surface. Before the test, the 12S1P battery pack was charged fully by using the 1 C current. On a bright day, the initial ambient temperature was about 19 °C. Once the pole temperatures measured by either T6 or T7 reached 300 °C, the external heaters were powered off. For the tested battery samples, the NCM cathode materials can have the highest decomposition temperature close to 300 °C [
8]. Therefore, the central cell was heated on both sides up to the pole temperature of 300 °C to activate a complete thermal runaway process.
In the tested battery module, each sample cell has the operation voltage range of 2.8~4.2 V, the operation temperature range of −20~60 °C for discharging, and 0~60 °C charging, and the current rates up to 6 °C for discharging and charging. During the test, the pole temperatures are only detected by 11 thermocouples in an accuracy of ±1 °C for the battery temperature responses.
3. Results and Discussion
After C7 was heated for about 9 min, either gas eruption or flame burning appeared one by one cell from the central to both sides of the 12S1P battery module. The process of the thermal abuse of batteries lasted nearly one hour. During thermal runaway, the battery module occurred four typical phenomena including the smoking, gas eruption, fire ejection, and flame combustion. All 12 battery cells burned. Among them, C7 was the first cell to start thermal runaway at 552 s after the test began. Then, the whole module underwent thermal runaway from cell to cell. The C1 flame was the last to die.
3.1. Gas Eruption
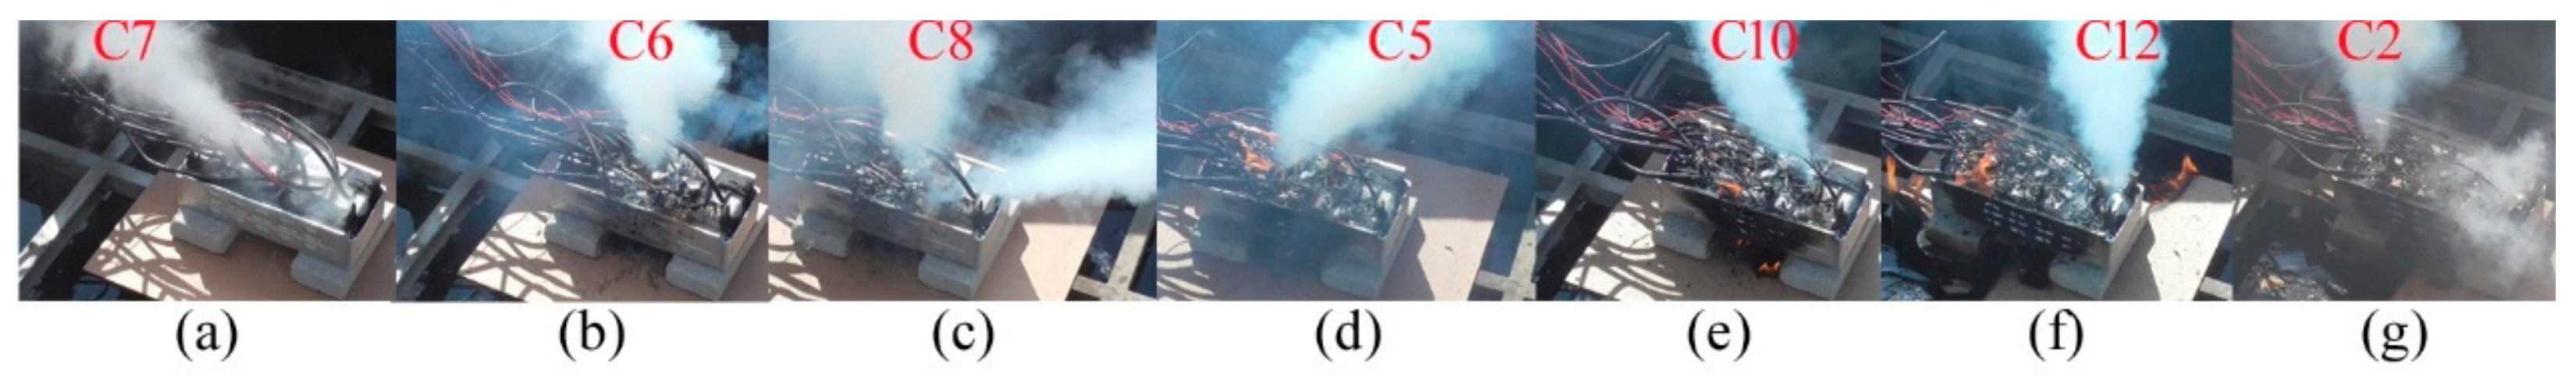
After the battery module was thermally abused, the short gas eruption of C7 became the first phenomenon for about 200 s before ignition. In addition to C7, there are six cells including C6, C8, C5, C10, C12, and C2 to first vent gas, as shown in
Figure 2.
The colors, directions, and shapes of these jet gases are different. The jet gas color is either pink, white, or cyan white. The four cells of C7, C6, C8, and C2 spouted out the pink white gas in
Figure 2a–c,g. Others did the cyan white gas in
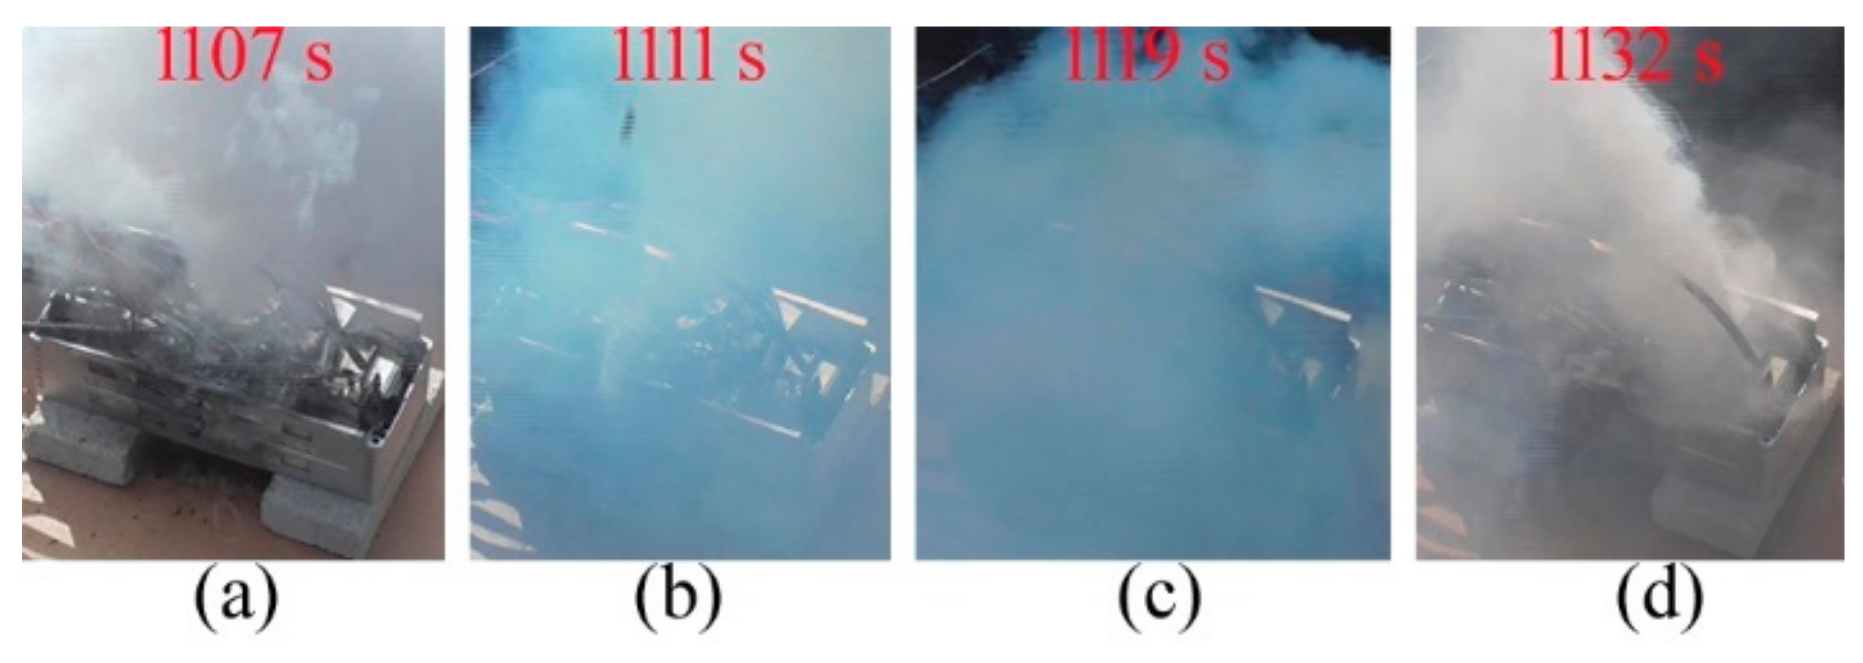
Figure 2d–f. During thermal runaway, the cells could change the vent gas colors. Venting from C6 between 1107 s and 1132 s, the gas changed colors from white to cyan and from cyan to white, as illustrated in
Figure 3. The change of gas colors should result from its composition and temperature.
Table 1 lists the pole temperatures of C6 while venting. Meanwhile, the pole temperatures of T5 was much lower than that of T6. However, the pole temperature of T5 had a high rise of 136.5 K, which is more than four times of that of T6. As for the gas eruption direction, it can be influenced by the wind direction and the mica cover on the relief valve.
At the time of the gas eruption of above seven battery cells, the pole temperatures varied between 94.7 °C and 444.6 °C. The jet gas mainly comes from the following aspects. First, the gas originates from the solvent vaporization due to the boiling points of 90~130 °C for DMC, EMC, and DEC. The LiPF6 salt decomposes from room temperature and aggravates solvents to generate gas beyond 160 °C [
20,
21]. Second, the SEI layer decomposes to around 100 °C [
22,
23,
24]. The SEI layer renews with incomplete passivation from 120 to 170 °C, and the litigated graphite and electrolyte reacts under 200 °C. Additionally, the graphite-lithium-organic molecule intercalation compounds decompose above 230 °C with gas evolution [
25]. Third, the NCM cathode material of Li
0.33Ni
1/3Co
1/3Mn
1/3O
2 in electrolyte can decompose to generate oxygen above 236 °C [
26]. The venting gas of 51 NCM cells in thermal runaway is mainly composed of CO
2, CO, H
2, CH
4, and C
2H
4 with an average concentration of 36%, 28%, 22%, 5%, and 5%, respectively, where the volume is influenced by both cell capacity and energy density [
27]. In other studies, the toxic ingredients of HF and POF
3 has been detected in the venting gas [
28]. Once the combustible conditions of the venting gas are all attained, it will ignite. Therefore, the gas eruption of a cell would indicate fire in near real-time. The experimental results show that these cells spent different time periods from gas eruption to ignition. The maximum, average, and minimum intervals between these two phenomena are 218 s, 125 s, and 1 s, respectively.
3.2. Flame Combustion
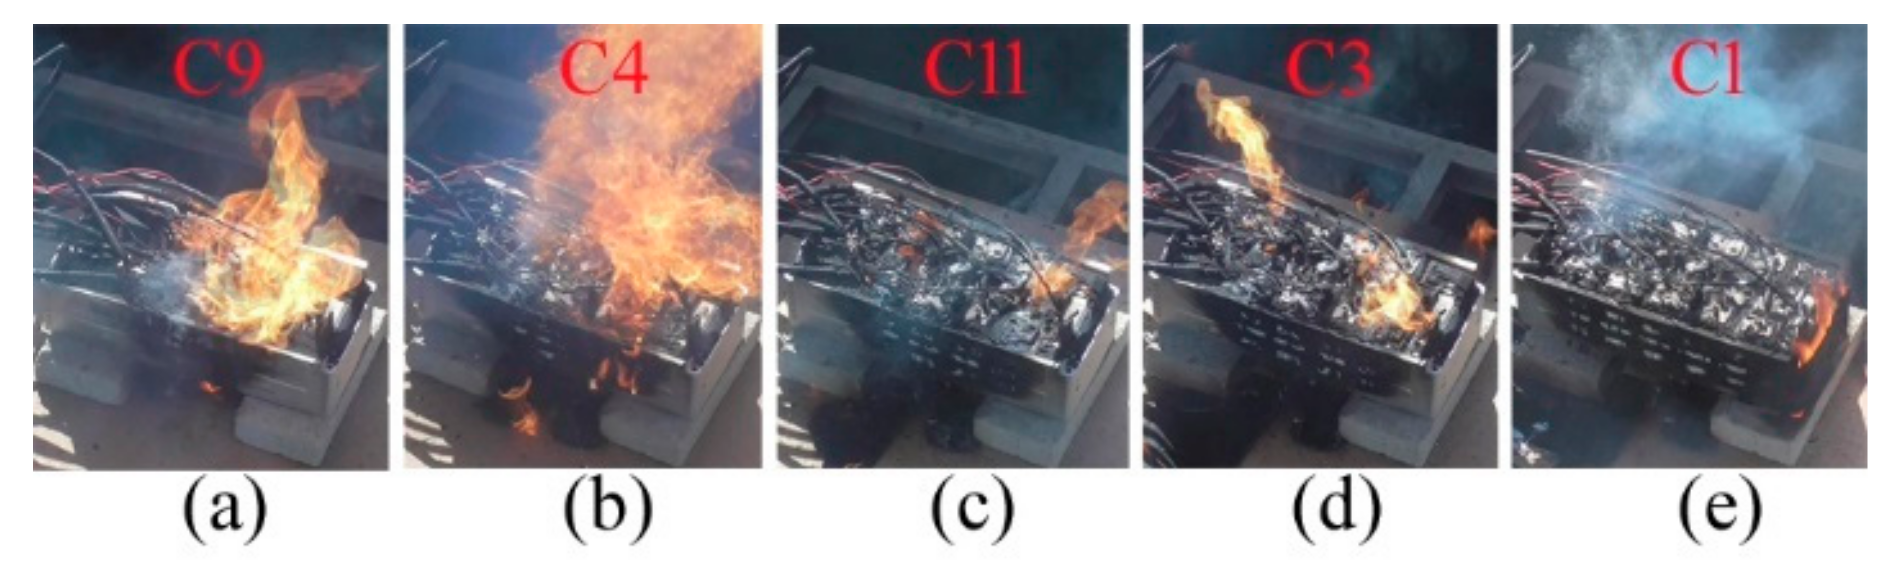
Ahead of gas eruption, the five cells of C9, C4, C11, C3, and C1 burned first, as shown in
Figure 4a–e. The onset pole temperatures had the minimum value of 127.7 °C and the maximum value of 500 °C. Among them, the jet gases of C9 and C4 were ignited to form a large fire by the flames of C8 and C10, respectively. However, C11, C3, and C1 self-ignited with a small fire. C11 burned at its vent, which is the same as C9 and C4. Both C3 and C1 were on fire on the shell sides. It was possible for the welding seam between the top cover and shell body to breach for the internal fire venting by using a high temperature and pressure.
It is probable for the high temperature venting gas to ignite due to the combustible ingredients of CO, H
2, and hydrocarbons [
27,
28]. Inside a battery, the ISC causes the internal temperature to move beyond 1000 °C [
29]. A tiny amount of debris of the aluminum collector can be mixed with the gas stream, eject, and spark in air. When the concentration of one combustible gas stays between the lean flammability limit (LFL) and the rich flammability limit (RFL), it will ignite by sparks [
30]. Naturally, the venting gas will catch fire by flames, and burns spontaneously when its temperature exceeds the ignition points.
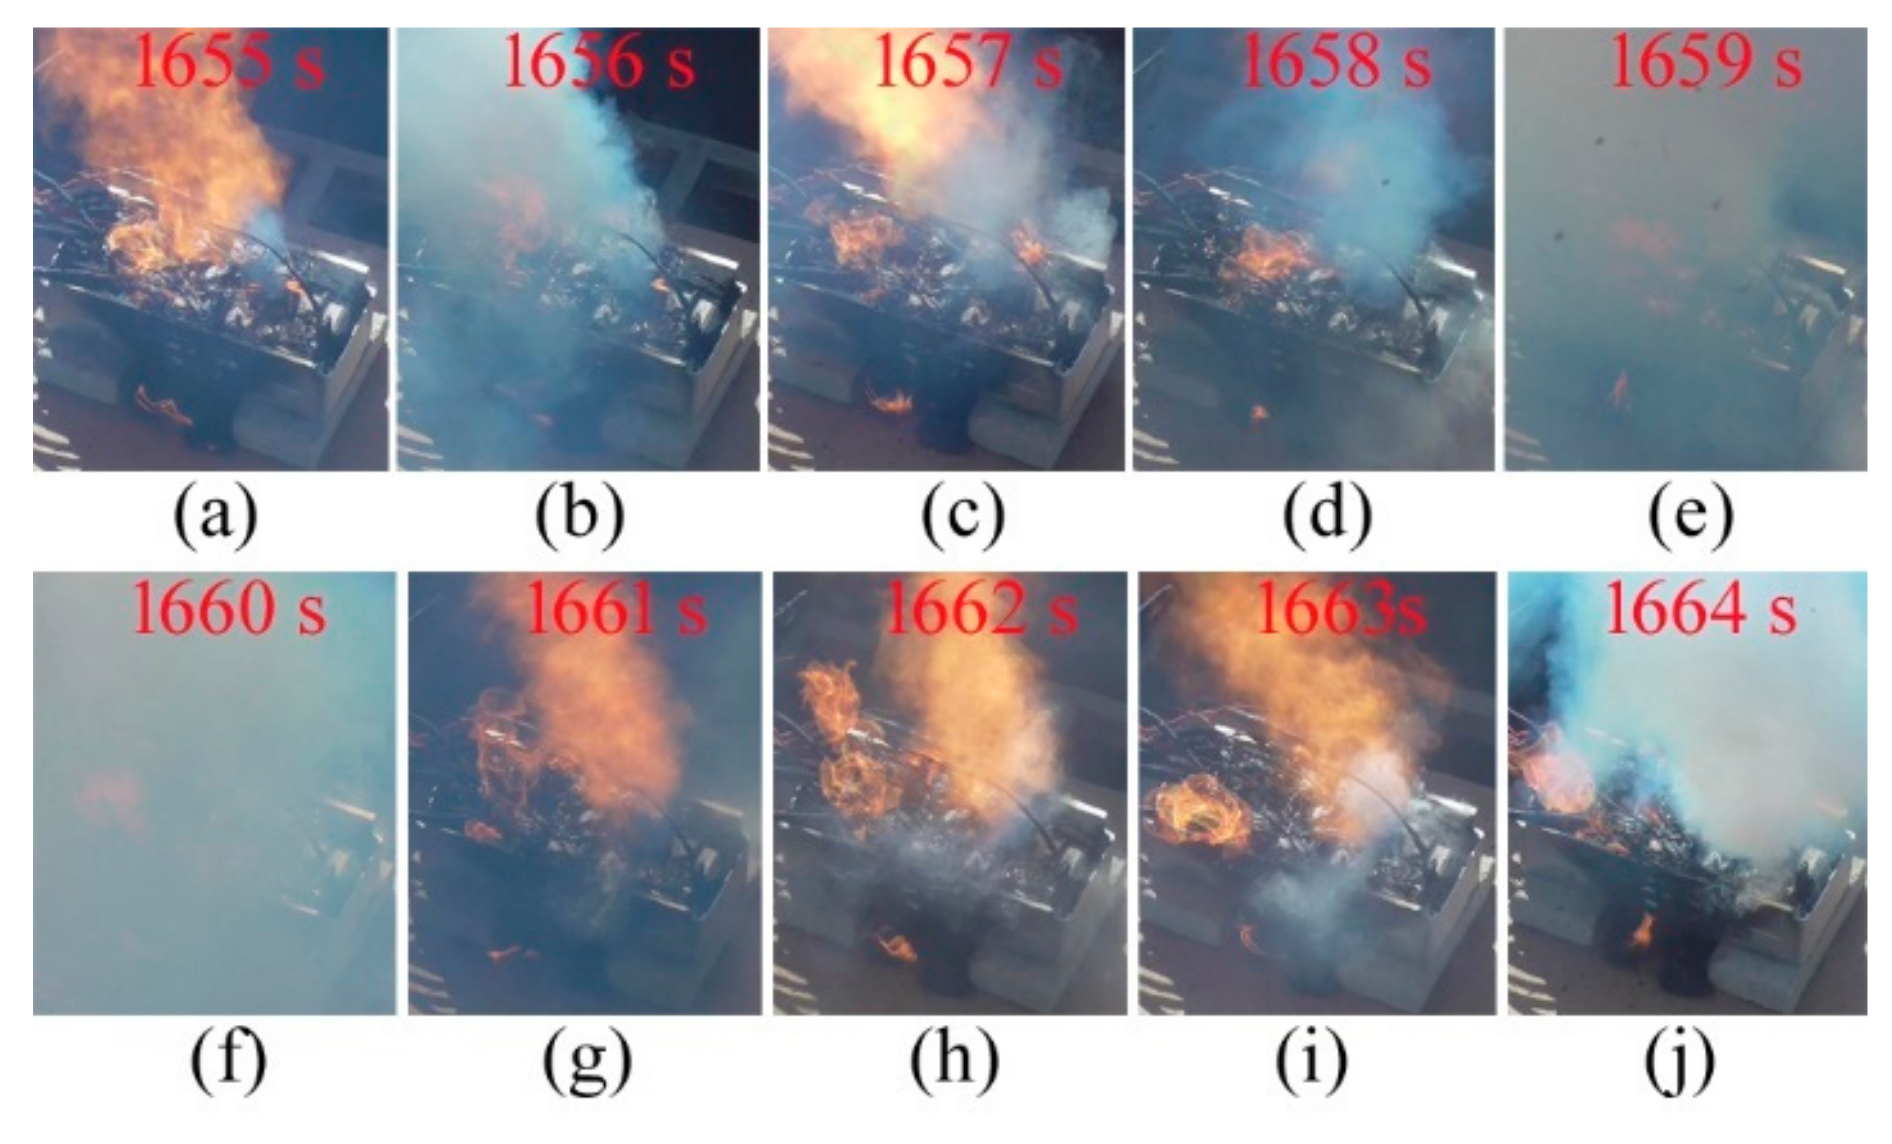
It was observed that once one cell entered thermal runaway, it could burn either continuously or interstitially. After its flame was blown out, the jet gas could catch fire again. The maximum, average, and minimum values of combustion time are 517, 291, and 100 s. In addition, there were four cells including C8, C4, C10, and C3 to erupt fire and gas alternately, in which the lasting time could exceed 10 s.
Figure 5a–j exemplify this behavior of C10 from 1655 to 1664 s. In this period of 10 s, the jet flame and gas occurred three times alternately. The lasting time of each eruption was between 1 s and 3 s. Both the pole temperatures of T9 and T10 rose from 444.2 °C to 465.4 °C and from 158.3 °C to 169.5 °C, respectively.
Before the alternate eruption of both fire and gas, C10 sustained combustion. At 1637 s, the flame became large again and the pole temperatures of T9 and T10 were 419 and 148.9 °C, respectively. Although the battery separator of a monolayer PP melts and shuts down around 165 °C [
31], it starts to shrink above 60 °C, and the shrinkage increases nonlinearly and rapidly with a rising temperature. The shrinkage of a monolayer PP in the machine direction reaches 6.6%, 38.7%, and 73.6% for 130 °C, 160 °C, and 180 °C, respectively [
32]. Consequently, the internal high temperatures made the PP layer contract to form the ISC between the positive and the negative electrodes. A large amount of joule heat was released to elevate internal temperature [
33], and further provoked chain exothermic reactions among battery materials [
8]. In the highly thermal cave, the electrolyte vaporized, decomposed, and reacted with electrodes to form gas. Plenty of gases with combustible components were produced inside the cell. After 18 s, the fire spewed out from the safety vent and underwent the alternate fire and gas eruption. Then, the flame smoothly combusted until it was extinguished.
This is an explanation for the alternate fire and gas eruption. The exothermic reactions continue to occur under the high temperature inside the battery cell. When the gas production rate is much higher than the exhaust rate, the gas pressure inside the cell increases rapidly beyond the air pressure outside. As a result, the gas bursts out at the safety valve. If the jet gas contains enough combustible ingredients with an ignition point temperature, it will catch fire at the valve in air. When its concentration is between the LFL and RFL, the combustible gas deflagrates into fire ejection. The short fire ejection reduces the internal gas pressure when the consumption rate of the flammable gas is greater than its production rate. On one hand, with the combustible gas concentration on the decrease in the jet gas, the jet flame can die so that the gas ejects without fire. On the other hand, the high-speed jet gases can form turbulence around them and lack oxygen to extinguish flames [
30]. Furthermore, it is also probable for little flames to be blown out.
After the flame is extinguished, the combustible gas continues increasing until ignition or deflagration again. When both the consumption and production rates of flammable gas balances, and the pressure inside and outside balances, the gas can vent and burn smoothly until the end of exothermic reactions inside the battery cell. Meanwhile, the balanced pressure brings air into the battery cavity. It is possible for the flammable gas to burn with the adequate oxygen inside the cell. It can be concluded that whether the venting gas burns in air depends on its content of combustible ingredients, temperature, velocity, and density.
In addition, it was easy for the outer insulators of signal harnesses to ignite when the big fire erupted on the battery pack.
3.3. Temperature Responses
A pole connects the collector of a LIB cell, on which a temperature sensor can be integrated more easily and reliably than in other positions. In engineering applications, thermocouples are usually installed on battery poles to measure the temperature.
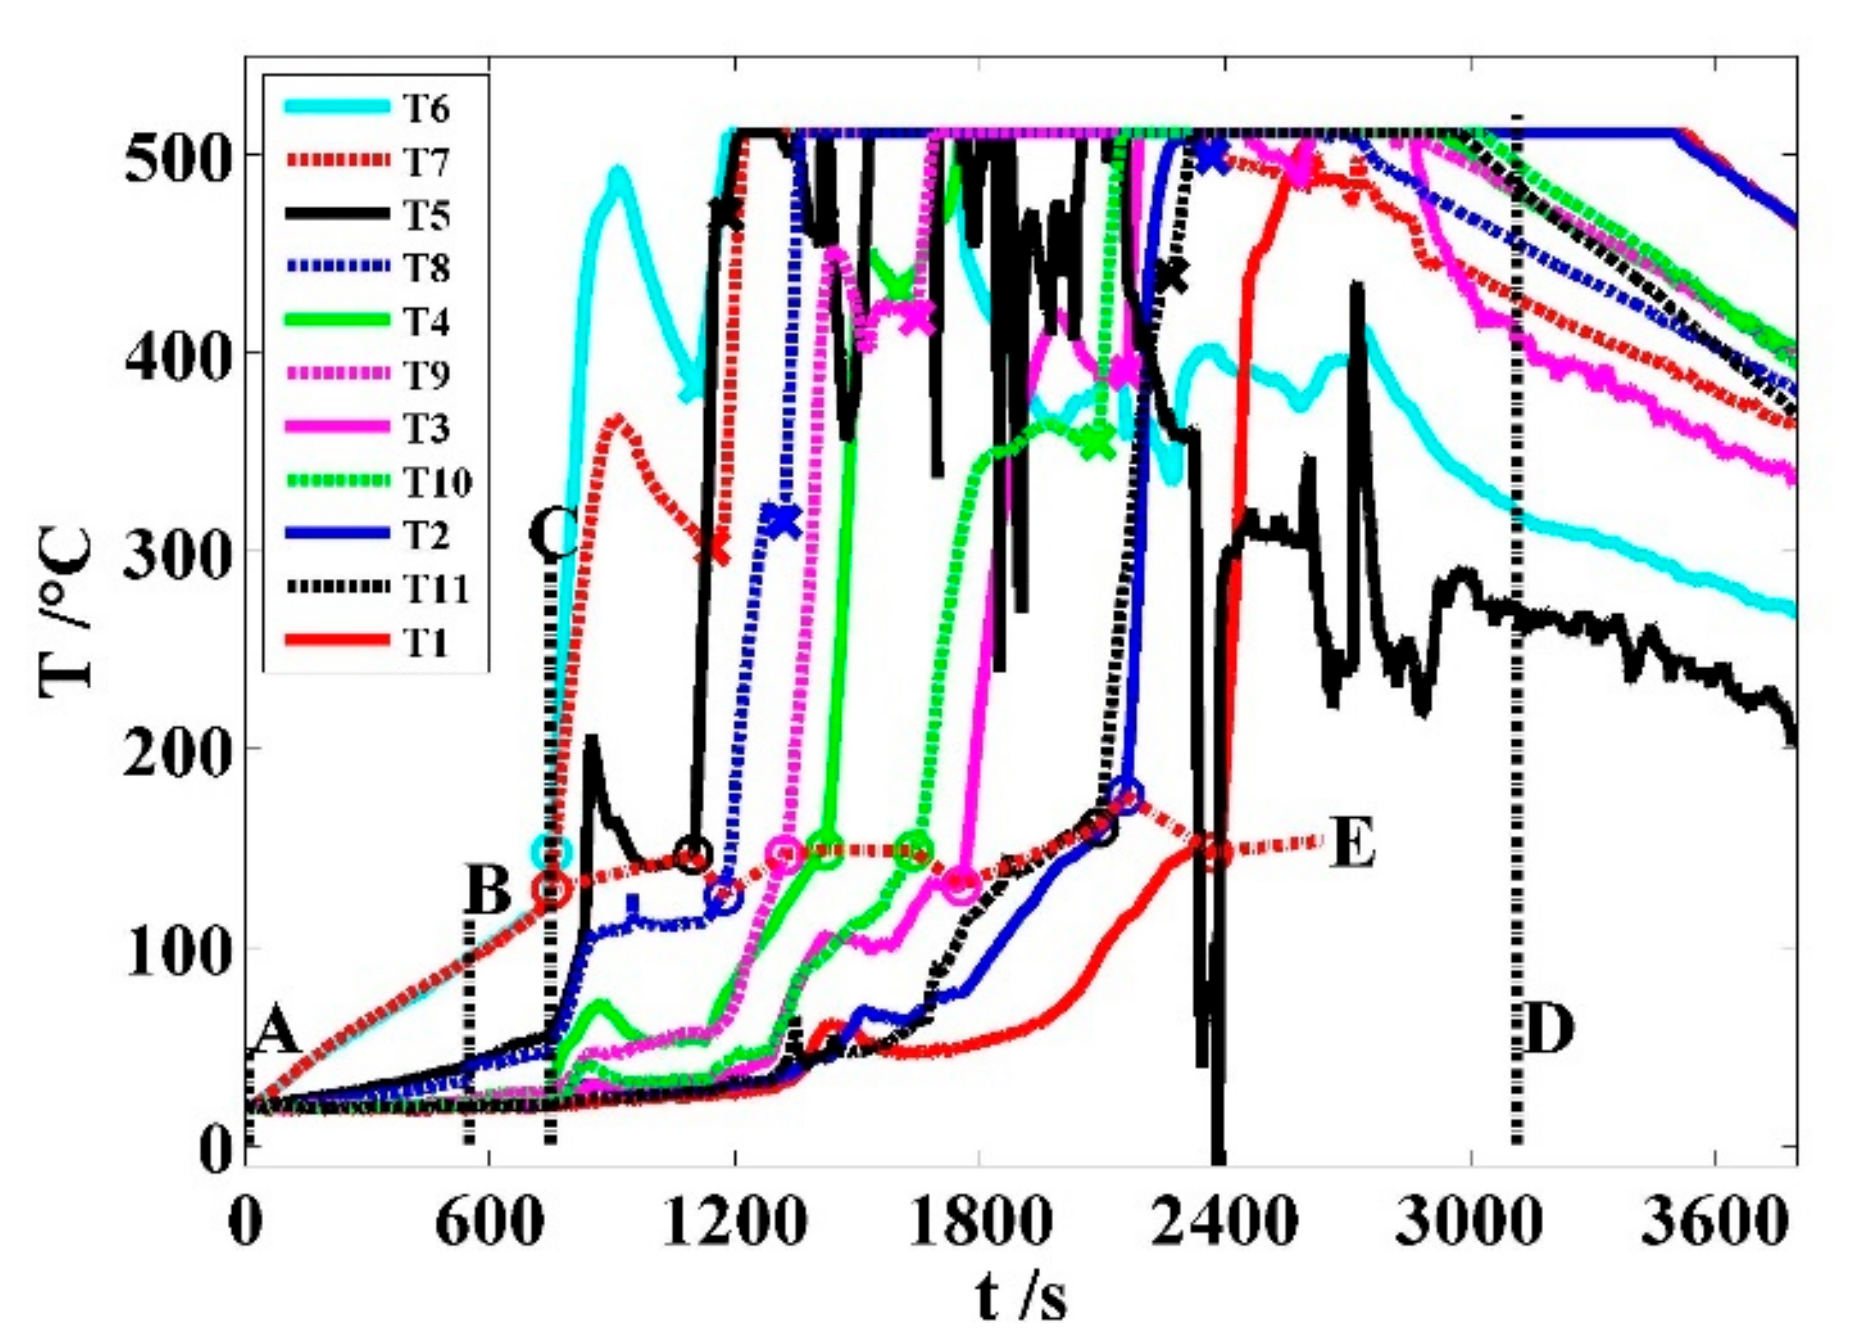
Figure 6 illustrates the pole temperature response, which is divided into four phases by four straight lines A, B, C, and D. The stage I, II, III, and IV, respectively, denote the initial heating of the interval AB, the thermal runaway germination of the interval BC, the intense thermal runaway propagation of the interval CD, and the natural cooling of the battery debris after line D. The corresponding pole temperatures are listed in
Table 2.
Stage I: A~B. At time A, the pole temperatures are 19 ± 1 °C. From A to B, they rose almost linearly and decrease from the central to both sides of the battery module. Among them, both C7 poles have the maximum average temperature rate of 0.137 K/s. At time B, C7 abruptly vented a white smoke column with the highest temperature of 95 °C, where the thermal condition can make its SEI decompose [
24]. Other pole temperatures are less than the upper limit of 60 °C of the LIB operation temperature.
Stage II: B~C. At time C, C7 spouts flame at its vent and its pole temperatures reaches 167.8 and 141.1 °C respectively, both temperatures of which cause ISC from the separator collapsing [
32]. Other pole temperatures are still less than 60 °C. During the interval of 199 s, every pole temperature almost linearly increases. Except T6 and T7, the temperatures of T5 and T8 rise more rapidly than that of others. The temperature rates of T6 and T7 are about twice and 1.3 times that of the phase I, respectively. Under the same thermal condition of both C7 sides, it may show that the exothermic reaction of its anode is more intense than that of its cathode.
Stage III: C~D. At time D, the battery module kept fireless and smokeless after all cells underwent thermal runaway. The interval is 2363 s between C and D. During this period, all 12 cells initiated thermal runaway, vented, burned, and extinguished, whose pole temperatures wildly fluctuated due to the heat generation of intermittent exothermic reactions from cell to cell. Because the pole thermocouples measure temperature with the upper limit of 510 °C, all pole temperature curves have flat tops. Hereafter, these curves tend to decline.
Except for C2 and C12, other cells have two pole thermocouples. Because C7 is the first thermal runaway cell, its runaway temperatures are together measured by T6 and T7. However, the thermocouple saturation at high temperature makes the runaway temperatures of other cells only detected by one pole thermocouple. Hereinafter, the thermocouples T1~T5 and T8~T11 are matched one by one with C2~C6 and C8~C11, respectively.
The violent phenomena such as dense smoke eruption, fire spewing, and big fire could occur during one cell that went through ISC in the module. According to the cell positions, pole temperature data, and observed phenomena, the ISC trigger points of battery cells are plotted in circles in
Figure 6.
Table 3 lists the ISC data. The onset temperature range is 121 °C to 177 °C, in which the changes have been validated by other researchers [
18,
19]. In each ISC interval, the pole temperature has a maximum value between 324 °C and 508 °C. The variable onset temperatures stem from differential thermal conditions of each runaway cell.
In
Figure 6, the order of circles from left to right on the curve E can indicate the ISC sequence of battery cells in C7→C6→C8→C9→C5→C10→C4→C11→C3→C2. This coincides with the sequence of the thermal runaway initiation from cell to cell C7→C6→C8→C9→C5→C10→C4→C11→C3→C12→C2→C1 by the observed phenomena. When C1 and C12 triggered ISC, their pole thermocouples T1 and T11 had been over 500 °C and almost output in saturation. Hence, it is difficult for the thermal runaway processes of C1 and C12 to be detected through their own pole temperatures of T1 and T11. Each cross point in
Figure 6 shows a valley bottom of a pole temperature. On one temperature curve, the maximum temperature position is sited between the cross and trigger points and indicates the ISC end of the corresponding cell.
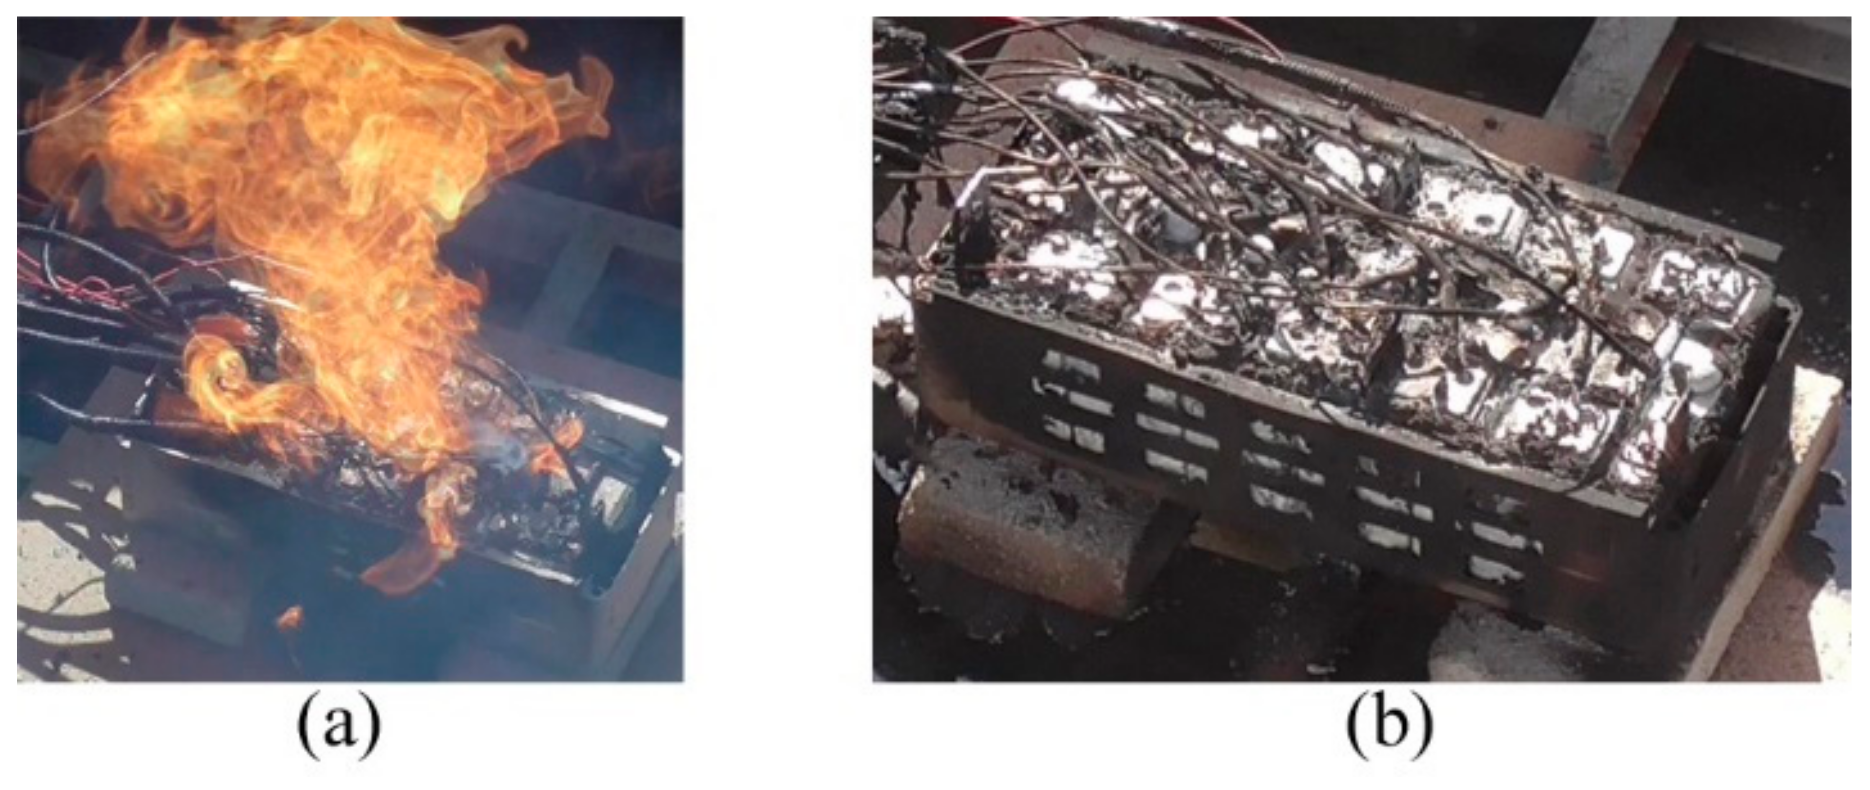
In this stage, all 12 battery cells generated fierce exothermic reactions resulting in flame burning, including a big mushroom fire of which ignited the black corrugated pipes of the temperature signal wires over the module shown in
Figure 7a.
Stage IV: D ~. After the module terminated thermal runaway, all cells cooled naturally in the field and their pole temperatures went down.
Figure 7b shows the module debris. Over this pack, the insulation layers of all harnesses almost burned out and blackened wires are bare. Compared to the white aluminum terminal bars and battery shells, the box was blackened in fire. After burning, 12 cells do not collapse and are still visible in shapes.
3.4. Temperature Rates
At time of the circles of the curve E in
Figure 6, the corresponding ISC of battery cells occurred to generate fierce exothermic reactions, which results in their own pole temperatures rising abruptly and thermal propagation to elevate adjacent pole temperatures for probable runaway. Before triggering our own ISC, one cell was impacted by a lot of heat released from other ISC batteries. In the experiment, the 12 cells in the battery pack initiated thermal runaway one by one. Thus, the pole temperature curves rose in fluctuation between C and each circle of the curve E in
Figure 6.
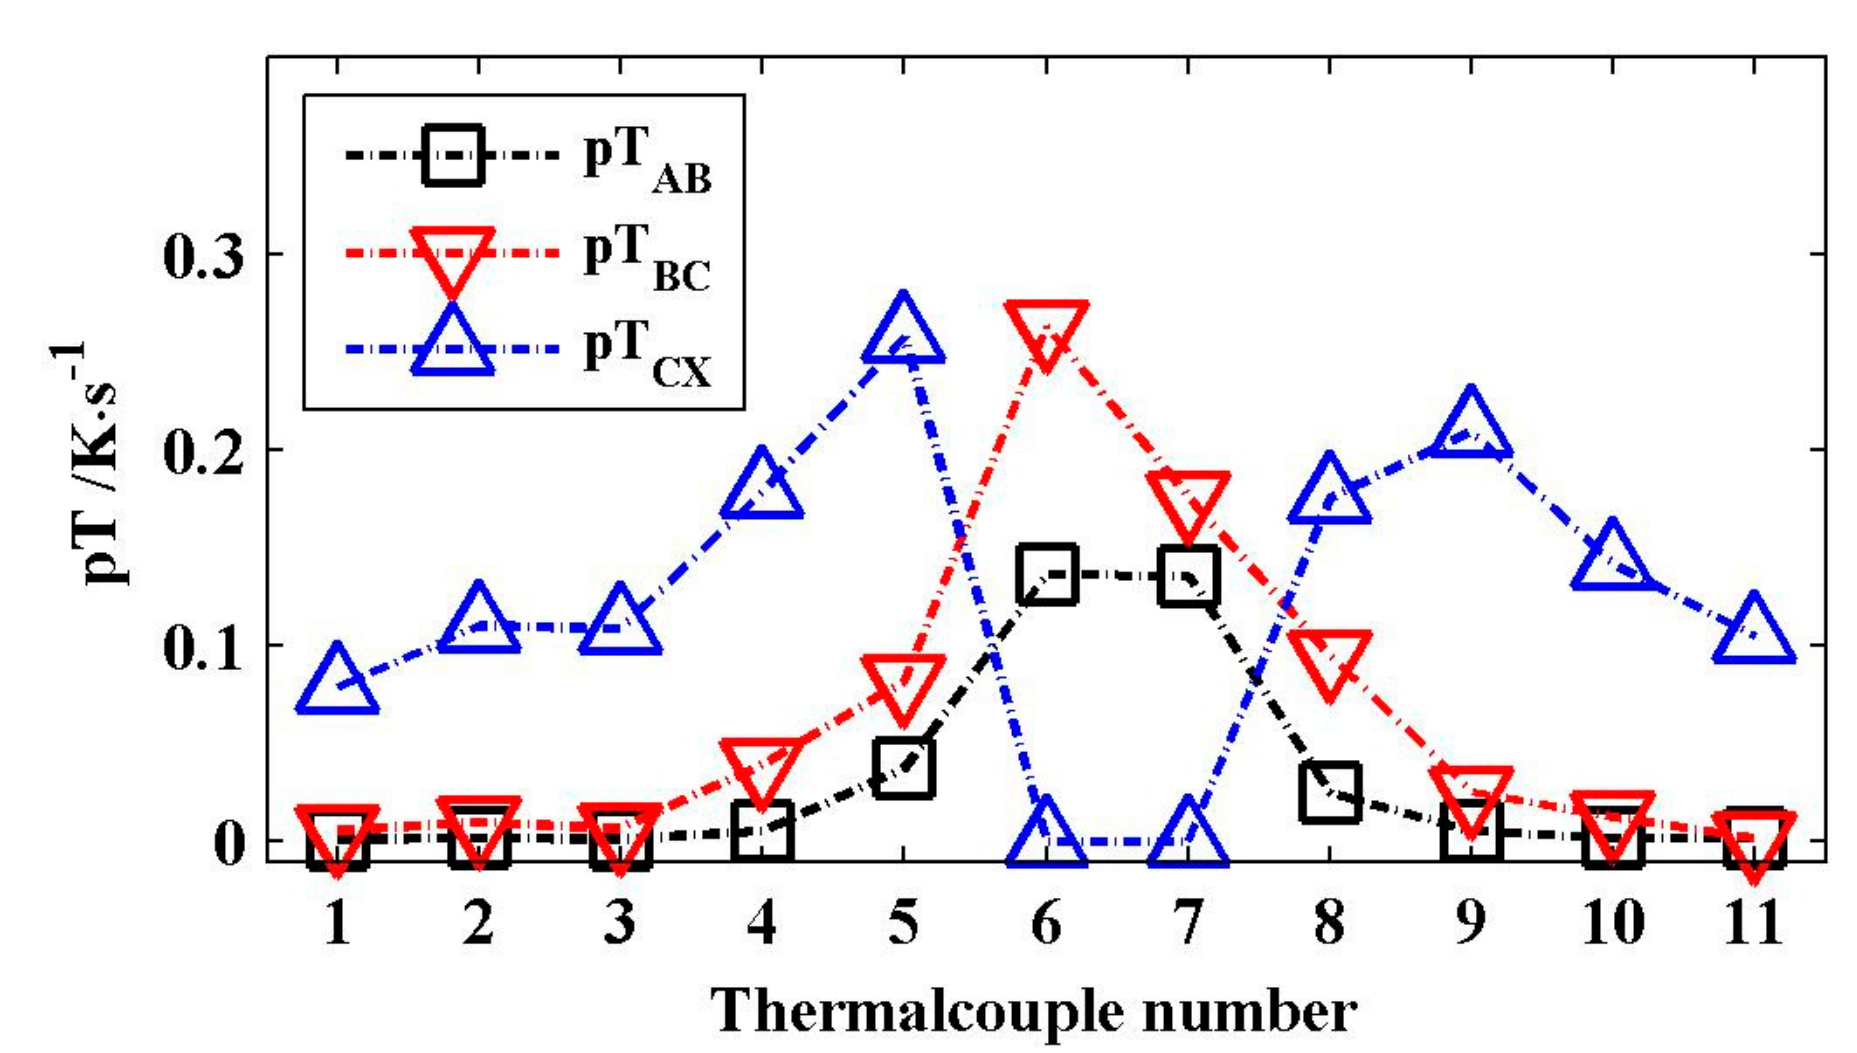
Figure 8 shows the total average values of pT
AB, pT
BC, and pT
CX about 0.0321, 0.0652, and 0.1358 K/s, respectively. They increase progressively by approximately two times. Under the same external heat, the released heat in the module increased in turn in the stages I, II, and III.
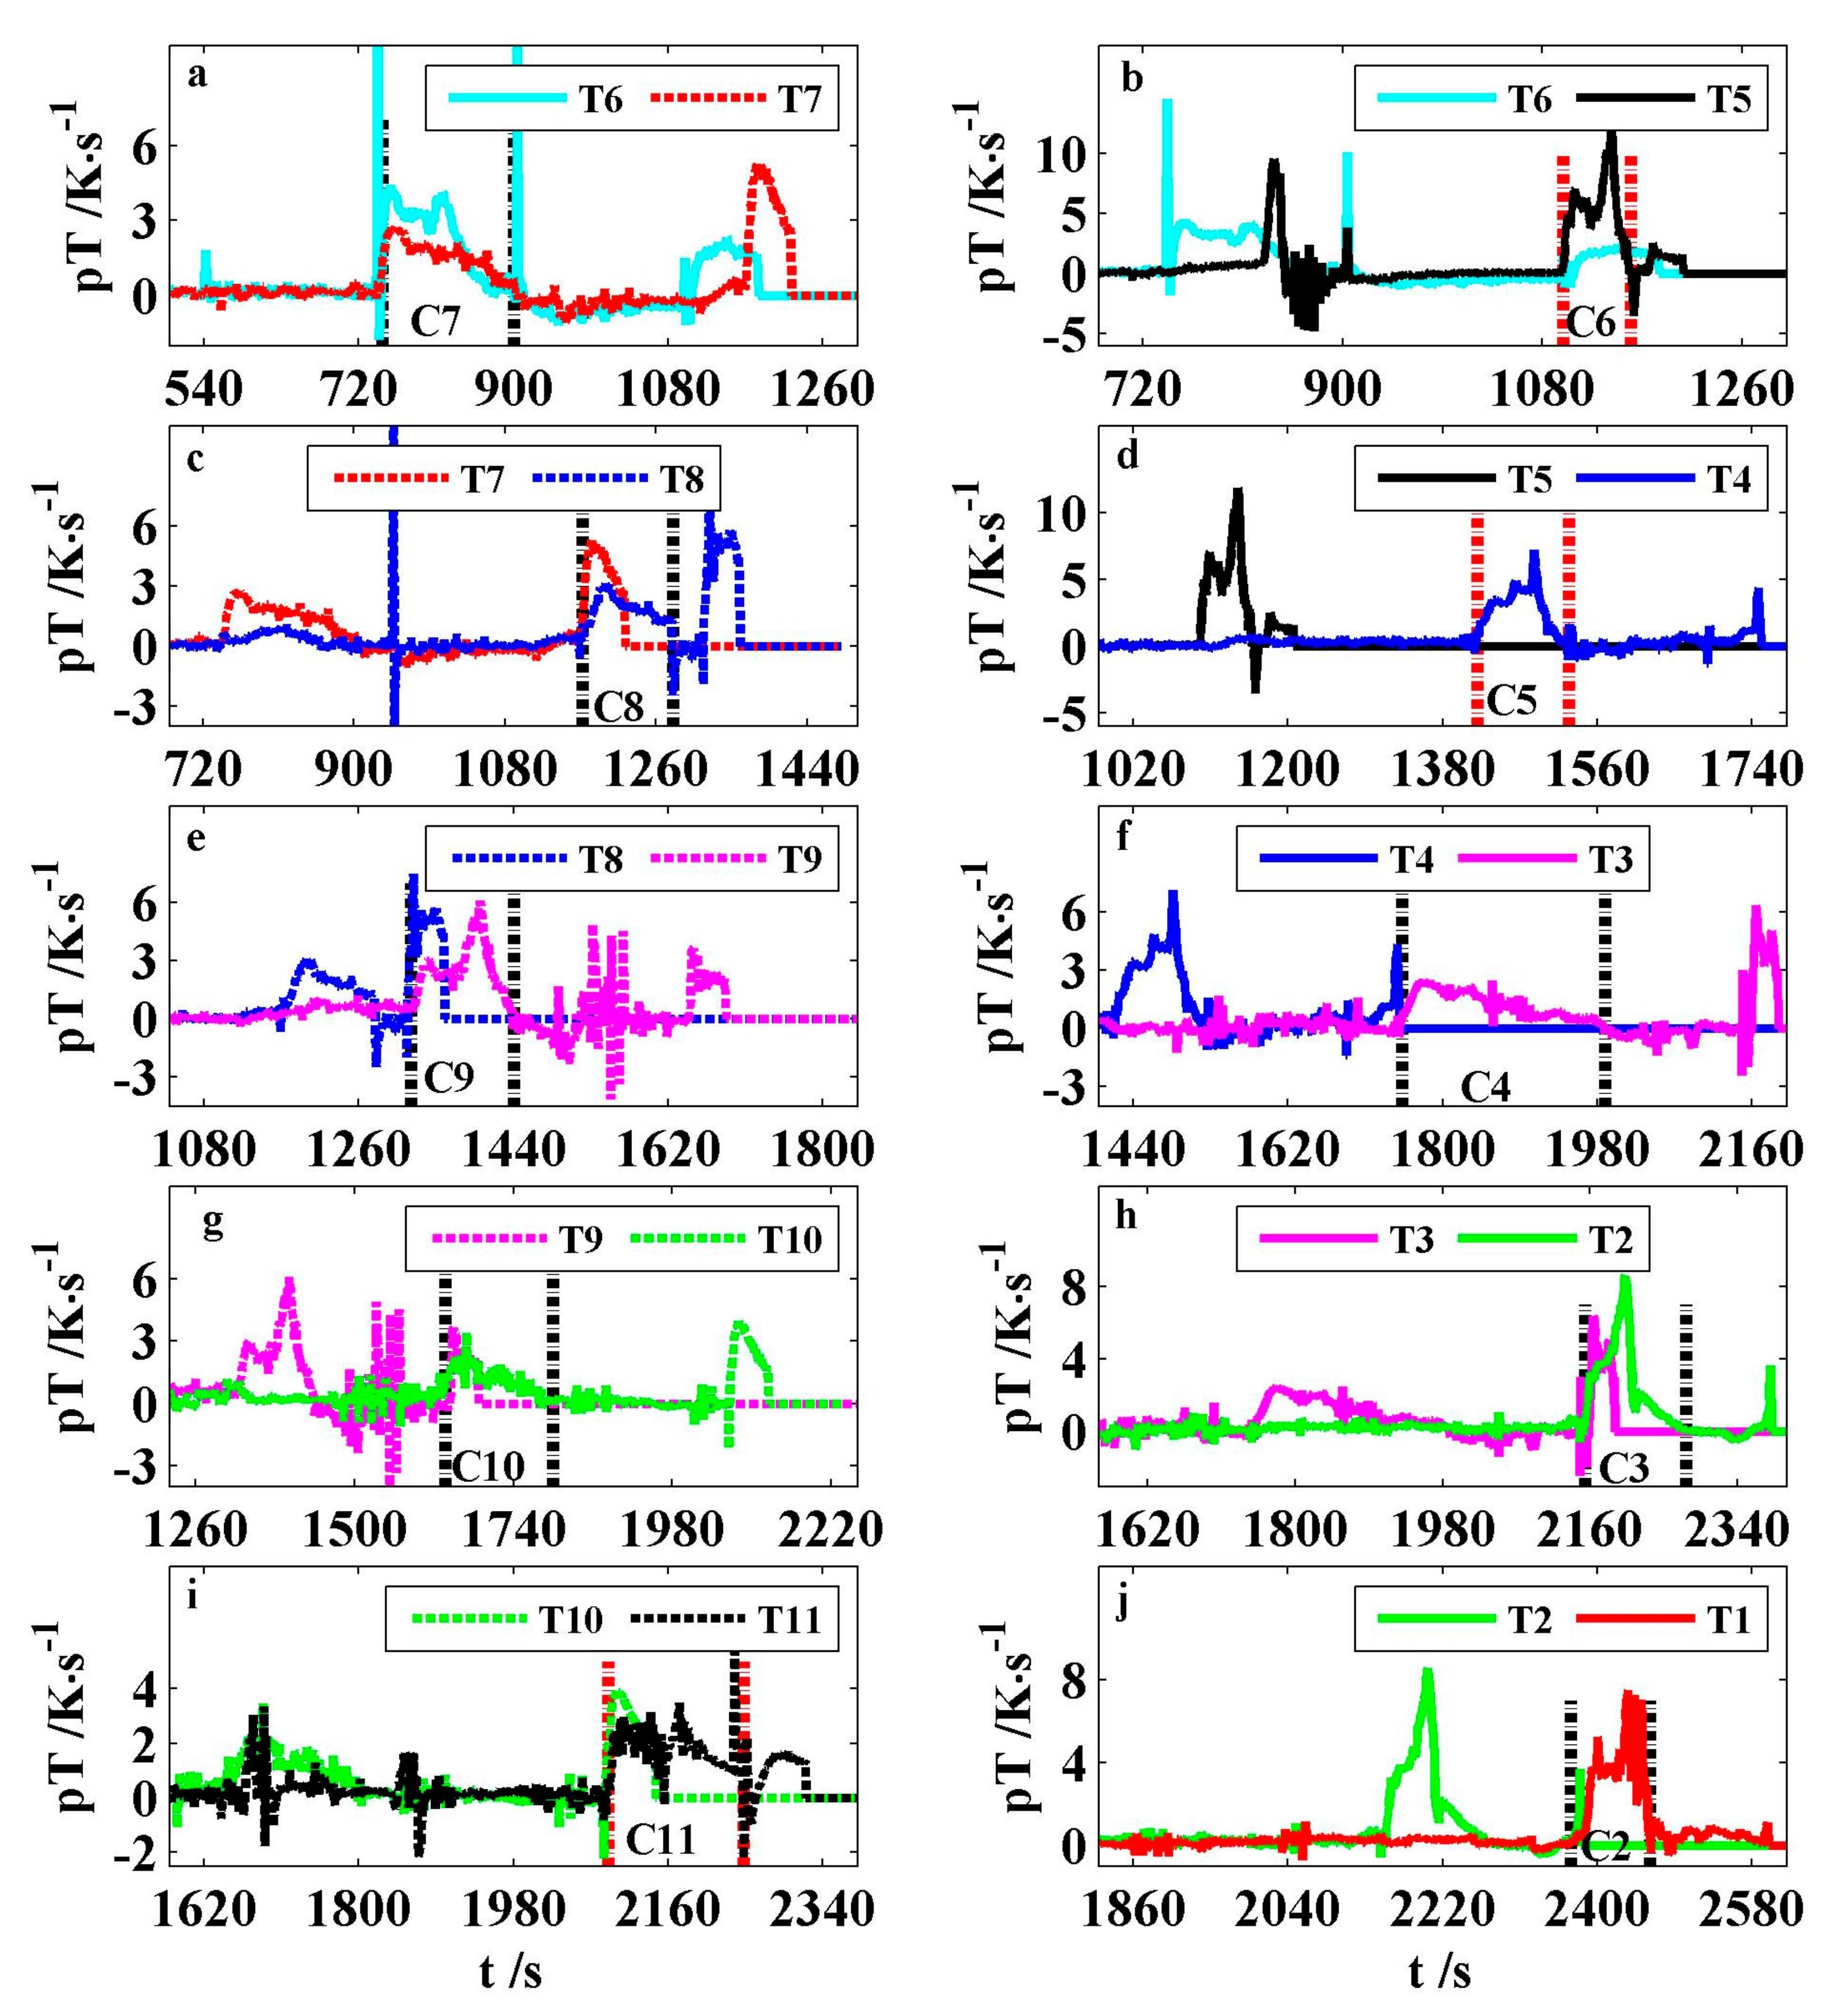
In the stage III, the 12 cells occurred ISC, which could be indicated by their pole temperature rates. As for every ISC interval, its temperature rate is greater than 0. The temperature rate interval (TRI) between the two vertical dot lines in each subplot of
Figure 9 is matched one by one with the temperature region after each circle on the curve E of
Figure 6. The shapes, amplitudes, and tendencies of these temperature rate curves are different. These 10 ISC intervals have different onset temperatures, average rates, and durations in
Table 3. The average value of the onset temperatures is about 145 °C. The average rate of every interval stays between 1.2 and 5.36 K/s. The total average is 2.43 K/s, which is about 17.5 times of that of pT
CX. Generally, the longer the ISC duration, the smaller its average rate. The maximum, average, and minimum durations of the ISC intervals are 236, 133, and 61 s, respectively.
When the temperature rate in an ISC interval is greater than a positive real number of α, it is expressed by the TRI of α.
Table 4 lists the characteristic data of the TRIs of 0.5 and 1.0 K/s, respectively. Their total average rates are 2.56 and 2.8 K/s, respectively. Compared to the duration of the TRI of 0 K/s, that of 0.5 and 1.0 K/s drops by 7% and 20% on average, respectively. For the three TRIs of 0, 0.5, and 1.0 K/s, their start time is 7.6, 4.5, and 2.3 s on average, which is earlier than the fire ejection time, respectively. In other words, the higher the temperature rate of an ISC interval, the closer the fire.
In the runaway process of a module, the high TRIs of one cell could result from not only itself ISC, but the flames of adjacent cells.
Table 5 lists the TRIs of 0.5 K/s caused by the thermal propagation of the flames of adjacent cells. The onset temperature on average is about 74 °C. Between 748 and 878 s, C7 burned intensely, ignited the wire harness above the module, and released extra heat to elevate the pole temperatures of C6 and C8 rapidly. From 783 s, both T5 and T8 had the TRIs of 0.5 K/s with respective durations of 66 and 50 s. Nevertheless, T5 also had the TRI of 1.0 K/s between 831 and 848 s with 5.7 K/s in average. It was probable for the wire harness to be ignited by the jet flames of farther cells. The venting flames of C9 extended with wind and ignited the wire harness above C4, which caused T3 for a 20-s TRI of 0.5 K/s. Furthermore, the big fire of C9 heated T10 to cause a 22-s TRI. In addition, one battery pole could produce a high TRI by its own flames before ISC. T11 had a 10 s TRI of 1.0 K/s from 1849 s, which is 241 s earlier than the onset time of itself ISC. It was found that the durations of the TRIs of 1.0 K/s greater than 50 s was caused only by ISC, over three times of that by thermal propagation. However, the duration of the TRIs of 0.5 K/s greater than 50 s could be provoked by both ISC and thermal propagation.
Researchers have validated that the SEI decomposition inside LIBs generates gases and exothermic spikes [
21,
23]. In the case of a prismatic cell, the gas production can increase the internal pressure for the safety valve rupture. At the same time, the exothermic spikes can elevate battery temperatures transiently. Therefore, when one cell is in thermal abuse, there seems to be a certain relationship between the time of the first gas eruption and the sudden change of the pole temperature rate. In
Figure 9a–c, T6, T5, and T8 have temperature rate spikes more than 1.8 K/s at time 542, 904, and 948 s, respectively, for at least 10 times of pT
AB in
Figure 8. Additionally, the temperature rate spikes of T5 and T6 are beyond 3.8 and 10.5 K/s, respectively. Their temperatures are greater than 90 °C.
Table 6 shows that C7, C6, and C8 erupted gas about 10 s after their own pole temperature rate spikes of T6, T5, and T8, respectively.
In summaries, the pole temperatures and their rates can be applied to predict what time some behaviors of the abused battery happen, including the initial gas eruption and ISC. That the duration of the TRI of 1.0 K/s is greater than 20 s can be used to indicate the ISC generation in the module. It is also probable to be in the risk of gas venting when a pole temperature rate spike exceeds 1.8 K/s, which is over 10 times of its forgoing average value, and its temperatures sustain above 90 °C for more than 10 s.
3.5. Thermal Runaway Propagation Time
When one cell thermally runs away in a battery pack, the heat of its exothermic reaction can be transferred to adjacent cells. It is probable that this thermal propagation makes normal cells abused thermally into runaway. The thermal propagation time is defined to indicate the triggering progress of runaway cells in a battery pack [
18].
where ∆
tk denotes the thermal propagation time, s,
tk denotes the onset time of one runaway cell, s, and
k denotes the number of the triggering sequence of runaway cells in a battery pack,
k = 1, 2, …, 10.
When one cell thermally runs away in the LIB pack, the heat of its exothermic reaction is transferred to adjacent cells. This thermal propagation likely makes the normal cells abused thermally into runaway. According to the observed phenomena of smoke and fire, the runaway sequence of 12 cells in the battery module was C7→C6→C8→C9→C5→C10→C4→C11→C3→C12→C2→C1. On both sides of C7, the cells triggered thermal runaway one by one from the inside to the outside.
Table 7 lists the thermal runaway propagation time (TRPT) between both cells in the module.
Overall, the maximum, average, and minimum of the TRPT are 362 s, 186 s, and 43 s, respectively. Due to different thermal environments, internal energy changes, and exothermic reaction time length, thermal runaway propagates unevenly and the TRPT varies, which is also validated in other studies [
18,
19]. The heat insulation layers, abuse types, and energy levels can change the TRPT. The average TRPT is around 183 s by using the thermal resistant layers of asbestos and puncture [
18]. Compared to the 100% SOC, the average TRPT increases by 70% at around 306 s for the 50% SOC even if the cells directly contact through their metal shells [
19]. The average value of thermal runaway duration of each battery cell is 382 s, which is at least two times of the average value of the TRPT of each battery cell. This indicates the thermal runaway processes of battery cells overlapped during the thermal runaway propagation in the module. Although the TRPT on both sides of C7 calculated from
Table 7 is different and varies between 253 and 506 s, it is surprising that its average value on each side almost equals about 340 s.
3.6. Thermal Runaway Propagation Capability
A large amount of heat is released when one cell occurred with an ISC in the battery module. The thermal impacts on its adjacent cells can be expressed by using enthalpy. On one hand, the module is a thermodynamic system, and the thermal energy change can be characterized by its enthalpy change. On the other hand, the enthalpy changes between adjacent cells are interrelated. Their relationship can be figured out by using a correlation coefficient.
where
γ(
CTR,
CuTR) denotes the thermal runaway propagation coefficient,
CTR and Δ
HTR denote the thermal runaway cell and its enthalpy change,
CuTR and Δ
HuTR denote the adjacent cell and its enthalpy change, and
ρH(
CTR,
CuTR) denotes the correlation coefficient of the enthalpy changes.
During the thermal runaway, the internal temperature, pressure, and volume can be variable inside one cell, which are high cost to be measured on board. Because of no real-time data available in literature and only being dependent on the thermocouples, the change of its pressure and volume is ignored for simplicity. Its enthalpy change can be expressed as shown below.
where
Cs,TR,
mTR, and Δ
TTR denote the heat specific capacity, mass, and temperature rise of the cell
CTR, respectively.
Cs,uTR,
muTR, and Δ
TuTR denote the heat specific capacity, mass, and temperature rise of the cell
CuTR.
By substituting Equations (3) and (4) into Equation (2), we obtain the following.
Due to the gas eruption and burning of the thermal runaway cell, its mass decreases and the heat specific capacity can be variable, which is both high cost and difficult to measure in real time. For simplicity, it is assumed that the heat specific capacity and mass of Equation (5) can be kept constant, so Equation (5) can be predigested as follows.
where,
ρT(
CTR,
CuTR) denotes the correlation coefficient of the temperature changes.
Equation (6) shows that
γ(
CTR,
CuTR) becomes a function of the temperature time sequences of adjacent cells.
Table 8 lists
CTR,
CuTR, Δ
TTR, Δ
TuTR,
ρT, and
γ by using the ISC data of the TRI of 0 K/s in
Table 3. There are eight positive correlation coefficients of
ρT with the maximum, average, and minimum values of 0.99, 0.86, and 0.95, respectively. Although there is one negative correlation coefficient, all thermal propagation coefficients of
γ are positive, and the maximum, average, and minimum values are 31%, 18.93%, and 1.3%, respectively. The average value of
γ is 24% in the right cells of C7 is about 1.8 times that of its left cells. This may be used to explain that the right cells underwent thermal runaway earlier than the left in the test. After the thermal runaway of C7, C6, and C8 occurred, the cells on the right side of C8 and left side of C6 initiated thermal runaway in turn, and the right cell C9 was the first.
The greater
γ is, the earlier thermal runaway of the adjacent cells should occur. Except the leftmost and rightmost cells, one cell has two adjacent cells in the module. C7 first triggered thermal runaway, the heat of which could be transferred to C6 and C8. The temperature rise of C6 is more than two times that of C8 even though
ρT between C6 and C7 is 0.1 smaller than that between C8 and C7. Therefore,
γ between C6 and C7 is 7% greater than that between C8 and C7. This shows that C6 can absorb more heat from C7 and initiate earlier runaway than C8. In practice, C6 entered thermal runaway 43 s earlier than C8. Following the thermal runaway of C6, C8 started its runaway process. Because
γ between C6 and C5 is 3.6% less than one eighth of that between C8 and C9 in
Table 8, C5 should be thermal runaway later than C9, which agrees with the experiment results.
Between 1420 s and 1527 s, C5 underwent ISC to make T4 a high temperature rate of 3.2 K/s. However, C4 absorbed heat to degrade T3 from 105.6 °C to 100.2 °C in the interval. Therefore,
ρT between C5 and C4 is negative, and yet
γ is a small positive number of 1.3%. In
Table 8, Δ
TTR is greater than 0.
γ is always positive because Δ
TuTR and
ρ are simultaneously positive or negative.
Through the above examples, the proposed thermal runaway propagation coefficient can characterize the capability of heat transfer between the runaway cell and adjacent cell. The greater the thermal runaway propagation coefficient, the more the heat transfer is, and vice versa. It can also can be applied for indexing heat insulation between cells in a battery pack.
3.7. Audio Characteristics of Gas Venting
In the process of thermal abuse, the cell could emit the sound of gas eruption. For instance, C7, C6, and C8 made sounds at their first gas eruption, which occurred, respectively, at about 200, 218, and 216 s earlier than that of ignition.
Audio signal can be quasi-steady-state and time-varying. The short-time analysis (STE) technology is often applied to figure out the feature parameters of each frame of sound data including amplitude, frequency, and energy [
34]. An audio data can be expressed as follows.
where
n and
L, respectively, denote the position and length of audio data frame, 1 ≤
n ≤
L.
x(
n) is the digital audio data.
k,
M, and
d, respectively, denote the frame number, the sub-frame number, and the frame offset of
x(
n). 1 ≤
k ≤
M.
xk(
n) denotes the
kth audio signal. Additionally,
w(
n) denotes the window signal.
The short time energy (STE) of each frame audio data can be written as below.
where
Ek denotes the STE of the
kth audio data frame.
Ek% denotes the normalization of
Ek.
Base frequency is the vibration frequency of vocal cords. It is one of the most important parameters of speech signals. Similarly, the excitation source frequency of the gas eruption sound of a battery cell can be extracted by using the Fourier transform and the inverse Fourier transform.
where
Xk(
ω) denotes the frequency spectrum of
xk(
n).
XIk(
ω) denotes the inverse spectrum of
xk(
n).
fs denotes the sample frequency. In addition,
fb denotes the base frequency.
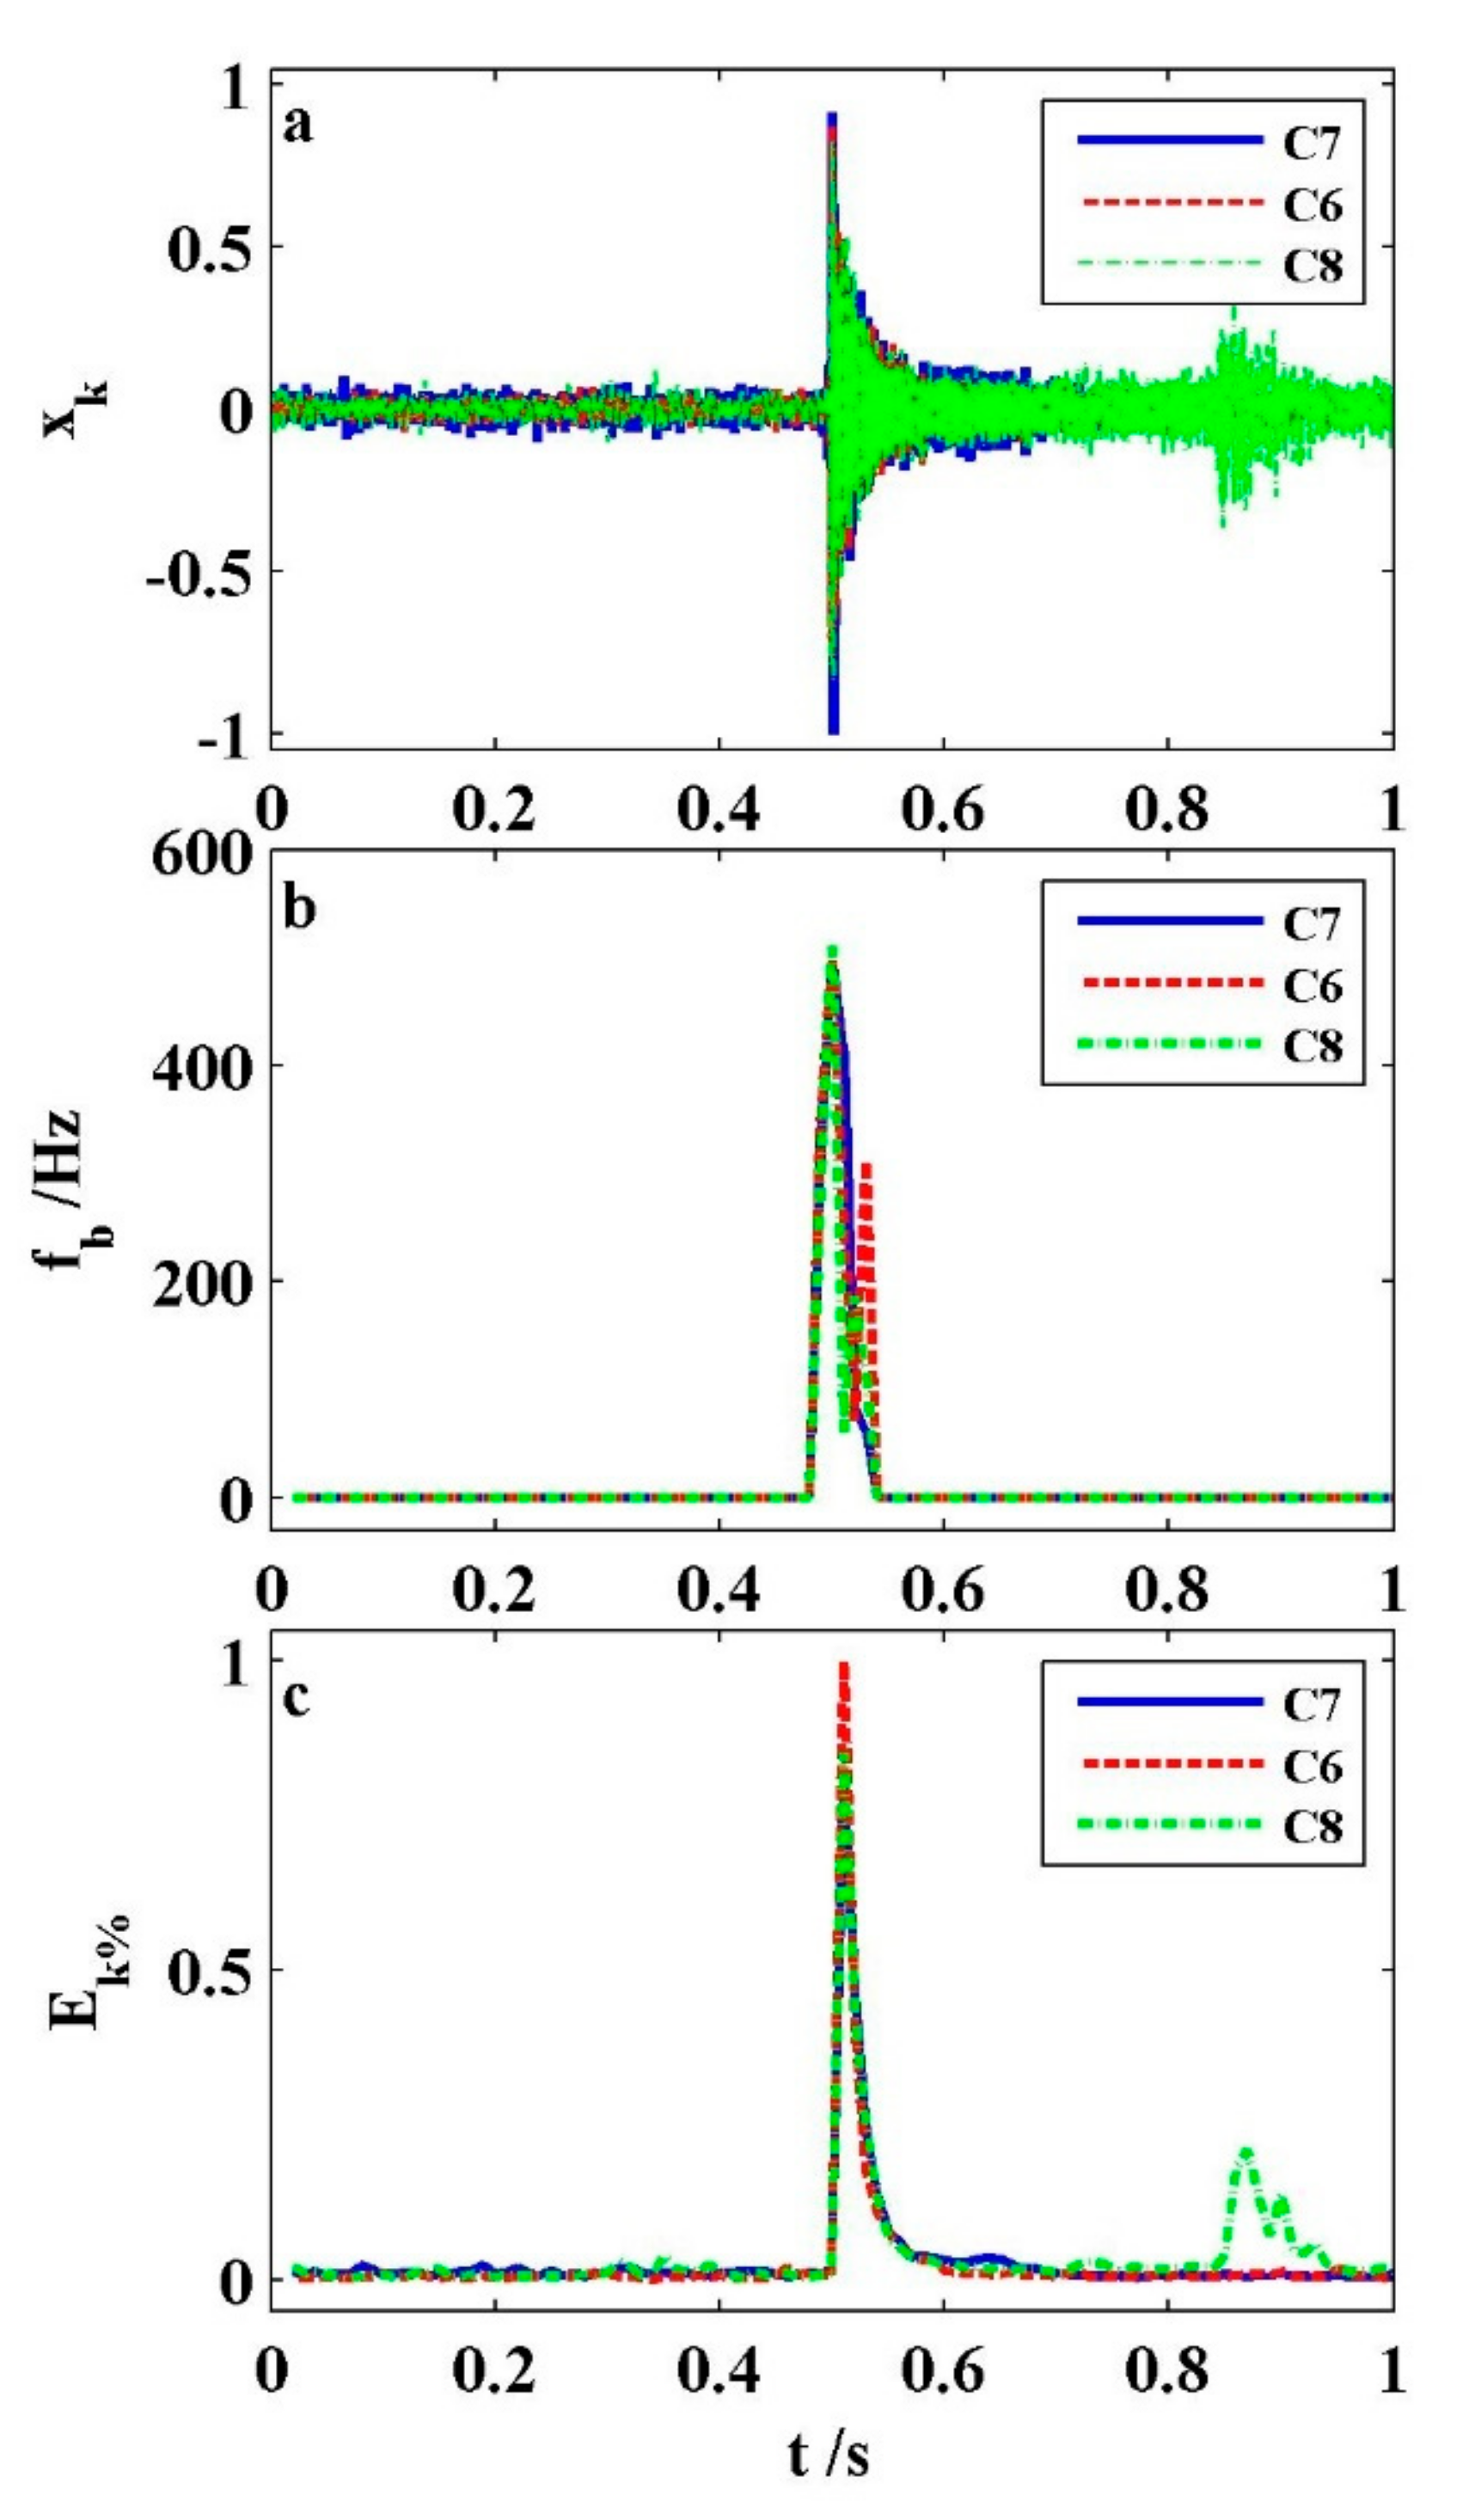
By using Equations (7)–(12),
Figure 10 shows that the characteristics of the short gas eruption sound of C7, C6, and C8. Although the venting sounds of these three cells occurred at different time periods and temperatures, their signals tended to be similar. In
Figure 10a, the shapes of three audio digital signals are indistinguishable. C7 has the most audio peak value of 0.915, where both C6 and C8 exceed the 90% value. In
Figure 10b, the three base frequencies of C7, C6, and C8 are 494 Hz, 500 Hz, and 510 Hz, respectively. They behave similarly. In
Figure 10c, the three STE shapes of C7, C6, and C8 tend almost identically. It is solely that they differ in magnitude. Additionally, the STE amplitudes of both C6 and C8 are, respectively, 80% and 85% of that of C7. Additionally, the audio signal of C8 is mixed with a little noise. Its normalized STE value of the noise is less than 0.25. It is helpful for us to identify whether the jet gas occurs for a prismatic cell in thermal abuse through the audio characteristic data.
4. Conclusions
Thermal abuse behaviors were profiled and characterized for a central overheat-induced thermal runaway propagation inside a large prismatic lithium-ion battery module based on the experimental audio-video records and pole temperature data. From the centrality to both sides, all 12 cells underwent thermal runaway. The main outputs of this work are summarized as follows.
The thermal abuse process of the battery module can be divided into several stages, mainly including the germination, propagation, and termination of thermal runaway. Meanwhile, the gas eruption, the fire ejection, and the flame combustion are typical phenomena. The gas eruption is the first phenomenon for about 200 s before fire. The color of jet gas can change during venting of either one cell or different cells. Additionally, the flames burn around 100 to 500 s. Furthermore, the gas and fire can alternately erupt and sustain beyond 10 s.
The first three thermal runaway cells erupt gas first and not less than 200 s earlier than ignite. The jet gas sounds less than 1 s and tends to be similar in the midst of close amplitudes, frequencies, and energies by using the short-time analysis technology. Moreover, each pole temperature rate behaves greater than 1.8 K/s spike about 10 s before the short gas eruption.
Both the internal short circuit and thermal runaway propagation can cause high pole temperature rates. However, the duration of the temperature rate interval of 1.0 K/s by the internal short circuit is more than three times of that by the thermal runaway propagation. The internal short circuit of each cell in thermal runaway can be characterized by using the temperature rate interval of 1.0 K/s with the duration greater than 20 s. The corresponding pole temperatures exceed 120 °C.
The thermal runaway propagates from the central to both sides. The average time of thermal runaway propagation is about 186 s for all, and 340 s per side. However, the cells on both sides do not completely alternate to trigger thermal runaway, which can be elucidated by the proposed thermal runaway propagation coefficient. The greater this coefficient is, the more easily it activates the cell’s thermal runaway adjacent to the ISC venting cell.
This work has focused on the relationships between cell behaviors and physical quantities during the thermal abuse process in a large prismatic 12S1P battery module. This investigation exemplifies that we can have adequate time to warn the occurrence of severe thermal runaway of onboard battery packs with the early characteristics. It is regrettable that the battery terminal voltage is not detected. If it is sensed in the test, the internal circuit short initiation can be more clearly confirmed at least. Additionally, some phenomena cause variable colors of the venting gas. Alternate ejection of flame and gas need to be explained by many more tests. In the future, we will continue to study the mechanical abuse behaviors and explore the fault diagnosis methods of thermal runaway propagation of lithium-ion batteries for electric vehicle applications.


