1. Introduction
The paths for shaping climate protection strategies and the energy transition are highly dependent on the spatial context including the environmental and socioeconomic conditions, the accessibility of resources and technologies as well as the built environment. In this context, integrated spatial and energy planning as a field within spatial planning [
1] plays a key role as it considers the spatial aspects of both energy supply and demand. It is a central task of integrated spatial and energy planning to provide methods and tools as well as databases for planning the energy transition.
This article introduces a novel approach for establishing an energy and greenhouse gas inventory on the municipal level by means of spatial analysis, the Energy Mosaic Austria (EMA). This inventory is implemented for all ca. 2100 Austrian municipalities. This paper explains and discusses the methodology and demonstrates its applicability to Austria. The new inventory permits a broad range of analysis and provides a sound basis for deriving general conclusions, recommendations and guidelines for energy transition and climate protection. This is, however, beyond the purpose of this methodology paper and is expected to be communicated later.
In the introduction section of this article, the state of the art concerning climate change and the spatial turn as well as different energy modelling approaches and existing research gaps are elaborated. Subsequently, the materials and methods for this approach are introduced. In the results section, the outcomes of the approach are presented such as an Austrian map of greenhouse gas (GHG) emissions and some interrelations among spatial structures, energy demand, and GHG emissions. Finally, the major strengths, benefits as well as weaknesses of the methodology are discussed and conclusions are drawn.
1.1. Climate Change and the Spatial Turn
Climate change and global warming pose one of the grand challenges of our time. A growing concentration of anthropogenic GHGs has led to an extraordinary increase in average global temperature over the last century [
2]. In order to deal with the harmful consequences of global warming such as rising numbers of extreme weather events [
3], adequate countermeasures are pursued [
4,
5,
6]. Climate protection strategies intend to limit the increase of the average global temperature to a maximum of 2 degrees Celsius relative to the pre-industrial age [
7,
8]. To an increasing degree, these strategies and associated research are linked to the territorial dimension incorporating the so-called spatial turn [
9]. Generally speaking, the latter considers space and spatiality as key dimensions in answering crucial policy questions [
10]. Moreover, it reflects the growing relevance of land and space [
11] in climate related policies.
As fossil based energy consumption is considered to be the main cause for the increased GHG concentration, the energy sector is a central field of action for achieving a climate-neutral future [
12]. According to the conceptual framework of the spatial turn, a broader understanding of energy politics has led to the development of integrated spatial and energy planning [
13,
14]. This research and policy area conceptualizes the spatial turn as the key feature for energy transition and climate protection [
1], i.e., as indispensable support for the necessary reduction of energy consumption and the increased use of renewable energy [
15].
Energy transition and climate protection affects all spatial levels [
16,
17]. Climate and energy policy strategies are elaborated on the international and national level. The European Union and national governments determine relevant energy targets [
7,
18,
19,
20,
21]. They are based upon harmonized energy statistics covering the entire territory of the EU [
22] or upon statistical data on a national respectively provincial level [
23,
24]. The regional and local administrations are confronted with the implementation of appropriate energy and climate relevant countermeasures to achieve the embedded objectives [
25,
26], but face the challenge of unavailable or inadequate data [
16,
27]. Without corresponding databases, both the determination of suitable measures as well as the estimation of their effectiveness regarding climate change mitigation and adaptation becomes difficult [
28]. In addition, the spatial turn in energy politics requires spatially differentiated knowledge of the energy consumption and associated GHG emissions [
1]. In order to determine energy consumption and GHG emissions on the local level, three different methods are conceivable: A full survey; an extrapolation using sampling procedures and a model-based balancing. Since the first two options require an extensive database, a possible avenue to tackle the problem is seen in the so-called energy models [
26].
1.2. Energy Modelling Approaches
Energy models can be described as fundamental methods to fathom energy systems and thereby create a simplified picture of the underlying processes [
29,
30,
31]. The past decades have brought significant improvements to energy system modelling due to technical feasibility and practicability [
32]. In particular, the oil crises in the 1970s and the liberalization of energy markets in the 1980s and 1990s reinforced the need for comprehensive energy models. During this period, the models were designed to generate knowledge on supply and demand patterns, dependencies and interrelationships within national and international energy systems [
30,
33,
34]. With the innovations in computing, the level of scrutiny was successively raised and energy models improved [
32]. Since the beginning of the 21st century, the original intention of revealing connections and functions within the increasingly complex energy system has been extended by the aim of decarbonization and the transition to a low-carbon society. Triggered by GHG reduction goals, the models no longer merely referred to energy supply and demand but also took GHG emissions into account [
32,
35]. Currently, the energy models tend to address challenges concerning the so-called energy trilemma and the sustainable development goals such as energy security, energy equity, affordability and environmental sustainability [
30,
36,
37].
As a result of different disciplinary objectives, a wide range of energy models and model extensions have been suggested [
34]. The range of possible model outputs and levels of detail depend significantly on the definition of appropriate system boundaries [
38]. Energy models must omit certain aspects and make simplified assumptions in order to remain manageable and to avoid incomprehensibility due to an extensively fine resolution or the capture of myriad interactions. Based on this, the tradeoff between spatial, temporal and content-related resolution becomes effective [
30]. On the one hand, the energy systems are modelled with coarse geographical and contentual resolution, while focusing on temporally dense results. On the other hand, some models focus on single time slices. Within this tight timeframe, smaller spatial units as well as a high level of thematic and sectoral diversity can be covered. While the first group of large scale models are capable of depicting entire states, the small-scale approaches are particularly suitable for focusing on smaller locations [
30,
32].
1.3. Local Energy Models
In order to support local and regional administrations and policy makers in providing their contribution to energy transition and climate protection, numerous energy models emerged within the last decades, serving the purpose of creating information on local energy systems and their effects on climate. An overview of corresponding models and the remarkable variety of their functions can be found in e.g. [
29,
32,
34,
39,
40,
41,
42]. Most of these models follow the purpose of spatial planning, implementing or optimizing energy networks, matching specific consumption and supply patterns or dealing with cost structures behind energy systems on a local level. However, most approaches disregard content and spatial alternations by focusing on only one single location, one energy sector, one energy purpose or one energy source or they lack an appropriate differentiation of the results. The remaining, rather holistic energy models often require a large amount of external input and presuppose extensive primary data sets on energy consumption [
41]. The results of the various models are not comparable with each other due to different approaches, system boundaries and assumptions.
1.4. Research Demand
Therefore, the need arises for nationwide and standardized energy and GHG inventories based upon a novel approach with a fine spatial resolution, a high level of contentual detail and free from external inputs [
16]. These inventories would permit comparisons between different locations as well as between past conditions, the current status and future targets. Furthermore, such inventories would be essential for benchmarking and monitoring reasons [
43]. The standardized and comparable data sets with regard to all energy sectors, all energy purposes and all energy sources are indispensable in order to provide a solid basis for local energy and climate policies [
16]. Since corresponding inventories are missing, planning practice and research activities are limited [
1].
To fill this research gap, a novel approach has been developed in this study based on the operationalization of the spatial turn in energy and climate policies to establish a nationwide energy and GHG inventory on the municipal level in high spatial and contentual resolution. This approach represents a milestone and preliminary highlight of a research process about spatially explicit energy modelling that was initiated at the BOKU Vienna (Institute of Spatial Planning, Environmental Planning and Land Rearrangement) ten years ago with the development of the energetic long-term analysis of settlement structures (ELAS-calculator) [
13]. Since then, the methods have been successively refined and further developed in several research projects, and here a spatially differentiated approach for establishing a nationwide energy and GHG inventory for Austria is presented. It delivers an inventory for all Austrian municipalities, which serves as a basis for planning the energy transition. Therefore, the inventory meets one of the key requirements of integrated spatial and energy planning, aiming for the development of spatially differentiated planning fundamentals and planning methods. The holistic inventory considers all consumers of energy and differentiates between all relevant energy purposes and energy sources. Furthermore, the inventory is based on statistical data exclusively and the application of a standardized treatment ensures full consistency and nationwide unprecedented comparability.
2. Materials and Methods
This section describes the general approach of the energy mosaic Austria (EMA). Subsequently, the input data, the data sources and the necessary processing for data integration into the EMA is clarified. Furthermore, this section explains the deduction of energy indicators and the origin of emission factors. In addition, the details of modelling energy consumption and GHG emissions are outlined. The methods regarding the validation of the EMA complete this section.
2.1. General Approach of the EMA
The EMA represents a nationwide inventory for energy consumption and GHG emissions on a municipal level based upon a standardized methodology for modeling comprehensive energy and emission data. Insofar, the EMA spans all 2095 Austrian municipalities (complemented with 23 urban districts of Vienna). The novel approach of the EMA originates from concepts of integrated spatial and energy planning. Thus, the EMA comprises all types of land use including mobility in order to account for all energy consumer sectors and all sources of GHG emissions. Furthermore, the EMA incorporates all energy purposes and energy sources. The EMA does not require any user-defined input but relies on multiple datasets. On the one hand, comprehensive data picture the land use and mobility structures of each of the municipalities. On the other hand, an extensive set of customized energy indicators for different types of land use and mobility, different purposes of energy consumption and different energy sources are employed. The product of structural data and energy indicators figures the entire energy consumption of each municipality in high contentual resolution. The absolute amount of GHG emissions derives from the energy consumption specific to energy sources in combination with corresponding GHG emission factors (
Figure 1).
2.2. Input Data
According to the general approach, the EMA requires a multitude of data on the municipal level to parameterize the various types of land use and the mobility behavior. The input data concerning the land use derive entirely from nationwide statistics provided by the federal government of Austria [
44,
45,
46,
47,
48]. The data consist of living areas, cultivated areas and employees in industry as well as in public and private services. The data featuring living areas consider various building types and building periods as well as the distinction between principal and further residence. The data representing cultivated areas account for different types of agricultural or forestal use. The employees are provided on the base of the 88 divisions according to the statistical classification of economic activities in the European Union (NACE, according to the French “Nomenclature Statistique des Activités Économiques dans la Communauté Européenne”) 2008 [
49].
One of the most important steps of editing these data for the EMA consists of considering the consolidation of municipalities in one of the nine Austrian provinces (Styria) since 2011. In addition, the municipal data regarding the employees in the industry as well as in public and private services need to be edited: The 88 divisions according to the NACE classification 2008 are in part too detailed for the present purpose. For example, the energy indicators for a large range of public and private services are nearly identical. Otherwise, some of the divisions need a further disaggregation in subsections according to the Austrian classification, which represents a refinement of the European NACE approach.
The input data regarding the everyday passenger mobility originates from nationwide statistics concerning commuting distances on a municipal level [
47]. In addition, the nationwide survey to everyday passenger mobility behavior [
50] provides relevant data on the provincial level and for different types of regions. The latter is analyzed to gain an insight into the frequency of trips and the significance of the various trip purposes. The results allow the projection of the annual kilometers traveled for commuting to the entirety of everyday passenger mobility on a municipal level. However, integrating mobility into the EMA is not based on a passenger focused approach but pursues a land use related method. Each municipality is considered as a residential site, as a site of working and education, as a site of costumer focused services and as a production site. The passenger kilometers traveled are allocated to the municipalities mainly according to the destination of trips dependent on the trip purpose (working, shopping, etc.). All the trips to the residence and most of the kilometers traveled for leisure purposes are allocated to the place of residence. In line with this approach, the EMA identifies three categories of everyday passenger mobility: The mobility of households including all kilometers traveled allocated to the place of residence; the mobility of employees and students comprising all the trips to the places of work and education; finally, the mobility of costumer focused services consisting of the kilometers traveled to selected facilities of public and private services. This approach accounts for the consideration that every type of land use is responsible for a certain number of kilometers traveled. It leads to specific statements for each of the Austrian municipalities and is presumed to be far more accurate than downscaling provincial level data to a local scale on a per capita basis [
41].
Further input data regarding occasional passenger traffic (vacation and business trips) as well as freight transport are provided by the federal government of Austria and are edited for modelling purposes such as restricting the input data to kilometers traveled within Austria. The allocation to the municipalities is performed according to the place of residence (vacation trips), to the place of work (business trips) and to the sites of production (freight transport).
Table 1 gives an overview of the 92 parameters integrated into the EMA in order to illustrate the land use and mobility structures of each of the Austrian municipalities in a detailed manner. Considering all municipalities in Austria, the input data comprise almost 200,000 values.
2.3. Energy Indicators and Emission Factors
In order to estimate energy consumption and GHG emissions on the base of the multitude of the parameters specifying land use and mobility structures on the local level, a large set of energy indicators is required. The energy indicators are expressed in final energy consumption in terajoule (TJ) per unit (square meter, hectare, employee). The final energy consumption consists of the total energy consumed by the end users. It excludes the energy used by the energy sector itself including losses due to the deliveries and the transformation as well as the energy used in selected transformation processes of industrial producers (such as coke transformation into blast furnace gas) [
51,
52].
The GHG emissions estimated in the frame of the EMA include direct and indirect emissions. The direct emissions originate from sources within the considered consumer sector. The indirect emissions are a consequence of the activities of the consumer sector but occur outside this sector. They originate mainly from the consumption of electricity or (district) heat, from the production of purchased materials and fuels, from transport and distribution-related activities or from waste disposal and treatment [
53,
54]. Hence, the GHG emissions related to the energy sector are included as indirect emissions. The GHG emissions are expressed in tons of carbon dioxide equivalents (t CO
2-eq). This measure is used to compare the climate impacts of various GHGs according to their global warming potential. For this purpose, the emissions from greenhouse gases other than carbon dioxide, such as nitrous oxide or methane, are converted to the equivalent amount of carbon dioxide with the same global warming potential [
43].
2.3.1. Energy Indicators and Emission Factors for Land Use Excluding Mobility
The deduction of energy indicators concerning the various types of land use (excepting mobility) is based on the so-called useful energy analysis (UEA) provided by the federal government of Austria [
23]. The UEA represents an application of nationwide useful energy surveys to the final energy consumption on a federal and provincial level. Therefore, the UEA provides information on the final energy consumption with a high level of detail concerning consumer sectors, energy consumption purposes and energy sources. In the frame of the EMA, the plurality of energy consumption purposes is merged to three categories including heat, processes and transport. The energy sources are subdivided into eight categories including three fossil and three renewable sources as well as electricity and district heating. The data regarding the households, agriculture and forestry, several branches of industry as well as public and private services correspond with the types of land use considered in the EMA and can be used for the estimation of energy indicators.
In order to cope with the multitude of parameters describing the structures of land use (excepting mobility) on a municipal level (see
Table 1), the energy consumption allocated to each of the consumer sectors must be assigned to the individual parameters. For this purpose, further information from the Austrian report on building culture 2011 [
55], the agrarian diesel regulation (meanwhile expired) [
56] and the Austrian energy account 2011 [
24] is employed. This allows the weighting of the individual parameters according to their specific energy intensity such as the specific heat demand for living areas subject to the building type, the building period and the kind of residence or the specific energy demand due to the different production techniques in the industry. This step of weighting enables the allocation of the energy consumption to each of the 75 parameters used for describing the land use structure (excepting mobility) and it allows a parameter-specific estimation of the energy indicators. The latter describe the final energy consumption in TJ per square meters of living area (residential purpose), per hectare of cultivated land (agriculture and forestry) or per employee (industry as well as public and private services). Since the energy consumption considers three energy consumption purposes and eight different energy sources a respectively large set of energy indicators comprising 1800 values is created.
The GHG emission factors applied in the frame of the EMA originate from the so-called CO
2-calculator of the environment agency Austria [
57]. These factors describe the direct and indirect CO
2-emissions related to the energy consumption of eight different energy sources.
2.3.2. Energy Indicators and Emission Factors for Mobility
The energy indicators for mobility cannot be deduced from the UEA due to the sales-based approach of the UEA for mobility: The energy consumption of mobility derives from the sales of fuels on a provincial level neglecting the origin and the destination of kilometers traveled (also including export of fuels to neighboring countries). Hence, for the passenger everyday mobility within the EMA the energy indicators—describing the final energy consumption per kilometers traveled—are built on regionally differentiated modal-splits. The base for the regional differentiation is the allocation of each of the Austrian municipalities to one of 13 municipality types [
58]. The classification is based on the designation of each of the municipalities to urban or rural regions including the quality of accessibility and on the level of service concerning public transport. In addition, a profound analysis of the nationwide survey of everyday passenger mobility behavior [
50] was performed and different modal-splits for each of the municipality types were identified [
58]. These results are transferred to the EMA: Each municipality is allocated to a municipality type and the specific modal-split is applied to the kilometers traveled in each of the municipalities. Subsequently, the energy indicators and emission factors for private cars and public transport [
58] are applied in the EMA for both the everyday as well as for the occasional mobility. The energy indicators and the emission factors for freight transport rely on values of the transport emission model (TREMOD) [
59].
2.4. Modelling Energy Consumption and GHG Emissions on Municipal Level
The estimation of the energy consumption on the municipal level is based on the multiplication of the 92 parameter values with the corresponding energy indicators considering three energy purposes and eight energy sources (respectively a simplified set for mobility). These results are multiplied by the emission factors of the different energy sources to calculate the GHG emissions on the municipal level. This step results in an amount of approximately 7.7 million energy consumption and GHG emission values within the EMA. For further presentation, an aggregation of these data is required including a noticeable reduction of the number of the parameters. However, this aggregation still permits a detailed insight into the current status of the energy consumption and GHG emissions on a municipal level allocated to different consumers of energy and GHG sources including statements regarding the significance of three different energy purposes as well as the role of fossil and renewable energy sources.
Since input data management and preparation as well as the management of the energy indicators and the emission factors are performed with the aid of Python scripts, the multiple algorithms to calculate the energy and the GHG values in fine spatial and contentual resolution are also implemented in Python. The main results are integrated in a geo-database covering all Austrian municipalities. This database represents an appropriate frame for the visualization of energy consumption and GHG emission data on a project-specific website.
2.5. Methods Regarding the Validation of the EMA
The lack of comprehensive data concerning energy consumption and GHG emissions on local level prevents a strict validation of the EMA´s accuracy. Therefore, specific validation rules are developed in order to recognize apparently incorrect results. First, interdependencies of the parameter values, the energy consumption and the GHG emissions are reviewed. Moreover, the correlations between the energy consumption of selected types of land use and selected energy purposes are verified. Finally, the land use types with different fractions of fossil and renewable sources are examined as they contribute unequally to the energy consumption respectively to GHG emissions.
In addition, the validation of the EMA can be performed considering a comparison of the results with the corresponding data on a provincial level. For this purpose, selected results are added up over all municipalities belonging to one province. In this context, the passenger kilometers traveled accounting for different trip purposes are compared with the values of the everyday passenger mobility survey [
50]. The energy consumption of the different types of land use (excluding mobility) is compared with the values of the UEA [
23]. A comparison of the energy consumption of mobility with the UEA lacks comparability due to the different approaches. Finally, a comparison of the GHG emissions with the annual GHG inventory for the Austrian provinces [
60] is considered. This comparison is, however, severely limited for three reasons: First, the annual GHG inventory only considers direct emissions. This fact especially leads to missing emissions for electricity and heat production in the consumer sectors. Second, the annual GHG inventory consists of all kinds of GHG emissions that exceed those deriving from energy consumption. Additional GHG emissions comprise CO
2-emissions deriving from industrial processes, notably from the iron and steel industry as well as from the glass, ceramic and cement industry. Otherwise, the emissions of other greenhouse gases than CO
2 derive particularly from agriculture and waste management (methane, nitrous oxide). Third, the annual GHG inventory´s classification of consumer sectors is different to the consumer sectors within the EMA. A direct comparison of the EMA with the GHG inventory is merely possible while calculating GHG emissions for residential purposes with direct emission factors.
3. Results
This section highlights the main outcomes of the EMA such as a map with annual GHG emissions per municipality and a detailed analysis of the inventory, particularly with respect to the interrelationships between the energy consumption and the spatial structures.
3.1. GHG Emissions on the Municipal Level
The EMA provides insight into the energy consumption and associated GHG emissions of each municipality in Austria with a high contentual resolution and thus, with a plurality of data. One of the main results of the EMA which is of pivotal importance for the development of climate protection strategies is the absolute amount of annual GHG emissions associated with energy consumption for each municipality as shown in
Figure 2.
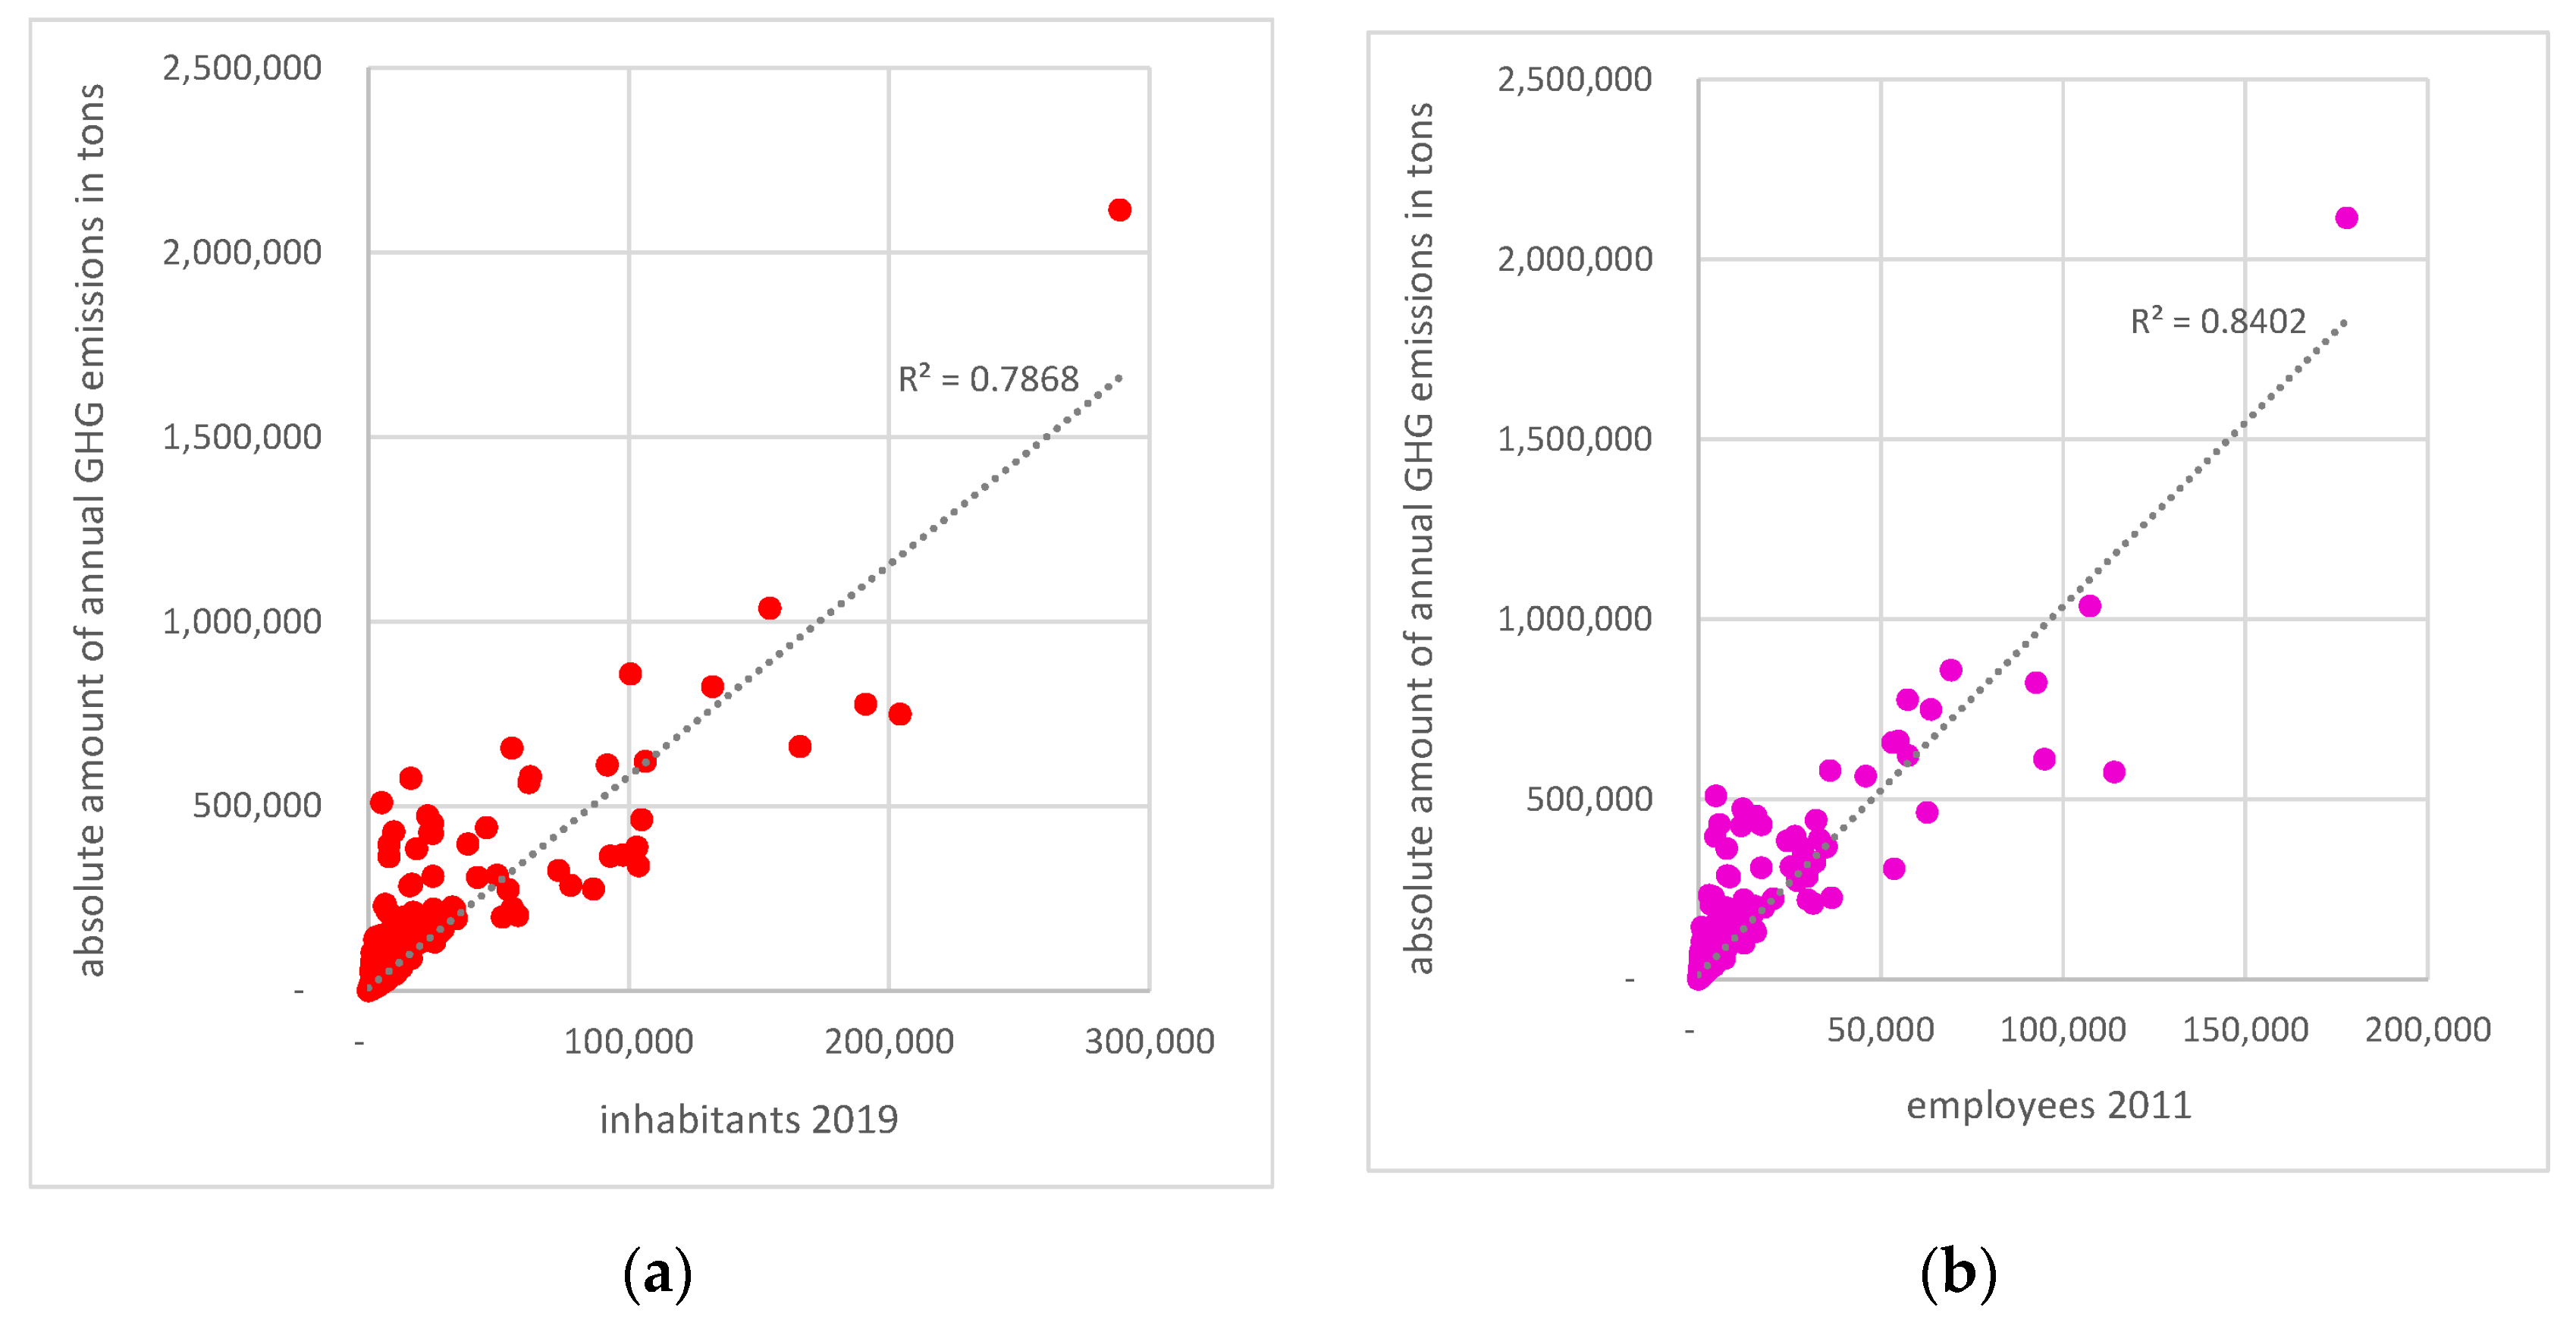
Even if the map partly permits the recognition of the main spatial structures, such as core areas or development axes along the high priority transport routes, a quite heterogenous picture of Austria emerges. This is a consequence of the fact that the map shows the absolute amount of GHG emissions, and the municipalities with a large number of inhabitants and a plurality of economic activities accompanied by a major volume of traffic feature higher emissions than smaller municipalities. This finding could well be anticipated but with the EMA is now put on a quantitative basis in order to define the baseline for local climate change mitigation and energy transition policies. A strong correlation between the number of inhabitants and the GHG emissions as well as between the number of employees and the GHG emissions is evident and underlined by the Pearson correlation coefficients of 0.79 (inhabitants) respectively 0.84 (employees) (
Figure 3).
This correlation seems to explain a large fraction of the variability among the municipalities´ GHG emissions. However, GHG emissions are not solely a question of the municipality´s size. This is evident for those cases where municipalities deviate from the expected amount of annual GHG emissions represented by the dotted lines in
Figure 3. Moreover, the total amount of GHG emissions has little explanatory merit without considering the main sources of GHG emissions and the responsible energy consumers. More sophisticated statements require a more detailed reflection of energy consumption patterns including the consideration of land use and energy purposes.
3.2. First Observations Concerning Energy Consumption and Spatial Structures
A more detailed view on the EMA leads to considerations concerning the energy consumption which is underlying the GHG emissions. Again, every municipality can be characterized by a single value. The absolute amount of annual energy consumption is another main result of the EMA. It shows a quite similar spatial distribution as the GHG emissions as well as a comparable correlation with the number of inhabitants and the number of employees.
In addition, a correlation between the municipality´s size and the main types of energy consumers can be identified. The energy consumption pattern concerning the fraction of the different land use types varies with the municipalities´ size. As
Figure 4 shows, the smaller municipalities are characterized by a high energy consumption due to residential purposes followed by mobility whereas industry, as well as public and private services, play usually a minor role comparable to agriculture and forestry. With increasing size of the municipalities, the fractions of residential purposes, of mobility as well as of agriculture and forestry decrease, whereas the fractions of industry, public and private services increase steadily. The municipalities with 20,000 to 30,000 inhabitants—mid-sized towns in the Austrian spatial contexts—mark a turning point for the proportions of the most important land use types: The energy consumption of industry attains its maximal fraction since these towns often are sites of energy intensive production facilities such as the paper industry or the steel industry. In contrast, for residential purposes and mobility, the minimum fractions can be determined. The municipalities with 30,000 inhabitants or more are characterized by almost equal fractions of residential purposes, industry, public and private services as well as mobility. These municipalities mostly represent major centers with a well-balanced mix of various types of land use apart from agriculture and forestry. In rare cases only, they are sites of high industrial density or of energy intensive industries. Mobility is the type, which shows the smallest variation over the different municipalities´ size ranges. This is due to the land use related method for integrating mobility into the EMA (refer to chapter 2.2): A certain volume of traffic is ascribed to every type of land use. Slightly more than half of the mobility-related energy consumption is directly linked to residential purposes, whereas somewhat less than half of the mobility-related energy consumption depend on the spatial distribution of industry as well as public and private services. If the mobility-related energy consumption decreases in response to reduced residential purposes, this is usually counterbalanced by increasing mobility-related energy consumption associated with increasing fractions of industry and services. Hence, the differences in the mix of land use types only produce relatively small variations of the mobility´s fraction. This finding diverges from passenger focused approaches as the latter reflect spatially differentiated mobility behavior in view of distances and modal-splits, whereas the land use related method is based on different spatial structures and the associated mobility requirements.
However, the patterns of energy consumption and the significance of the different types of land use may vary considerably even within the municipalities´ size range. Three municipalities with approximately the same population (1500 to 2500 inhabitants) can be used as example (
Figure 5a–c). In the municipality of Angerberg (Tyrol), the residential purposes and mobility are the most significant land use types with 30–50% each. In the municipality Hennersdorf (Lower Austria), the share of industry adds up to 60% and both residential purposes and mobility account for approximately 12–18% of the energy consumption each. Considering a third municipality, Groebming (Styria), again another pattern of energy consumption becomes apparent. Residential purposes, industry, public and private services as well as mobility represent about similar fractions between 15–25% of the energy consumption. Thus, the EMA is capable of mapping spatial structures onto specific patterns of energy consumption and offers the opportunity to properly distinguish between municipalities.
However, a few parameters with high energy indicators, notably selected industrial branches, have a great effect on the pattern of energy consumption and can even adulterate the spatial structures. For this reason, the significance of the different land use types may also be described without the energy intensive industrial branches. By applying these considerations on the municipality of Hennersdorf, a site of a production facility for bricks, the types of land use show modified shares of the energy consumption as illustrated in
Figure 5d.
3.3. A Deeper Insight into the Energy Consumption Pattern of Municipalities
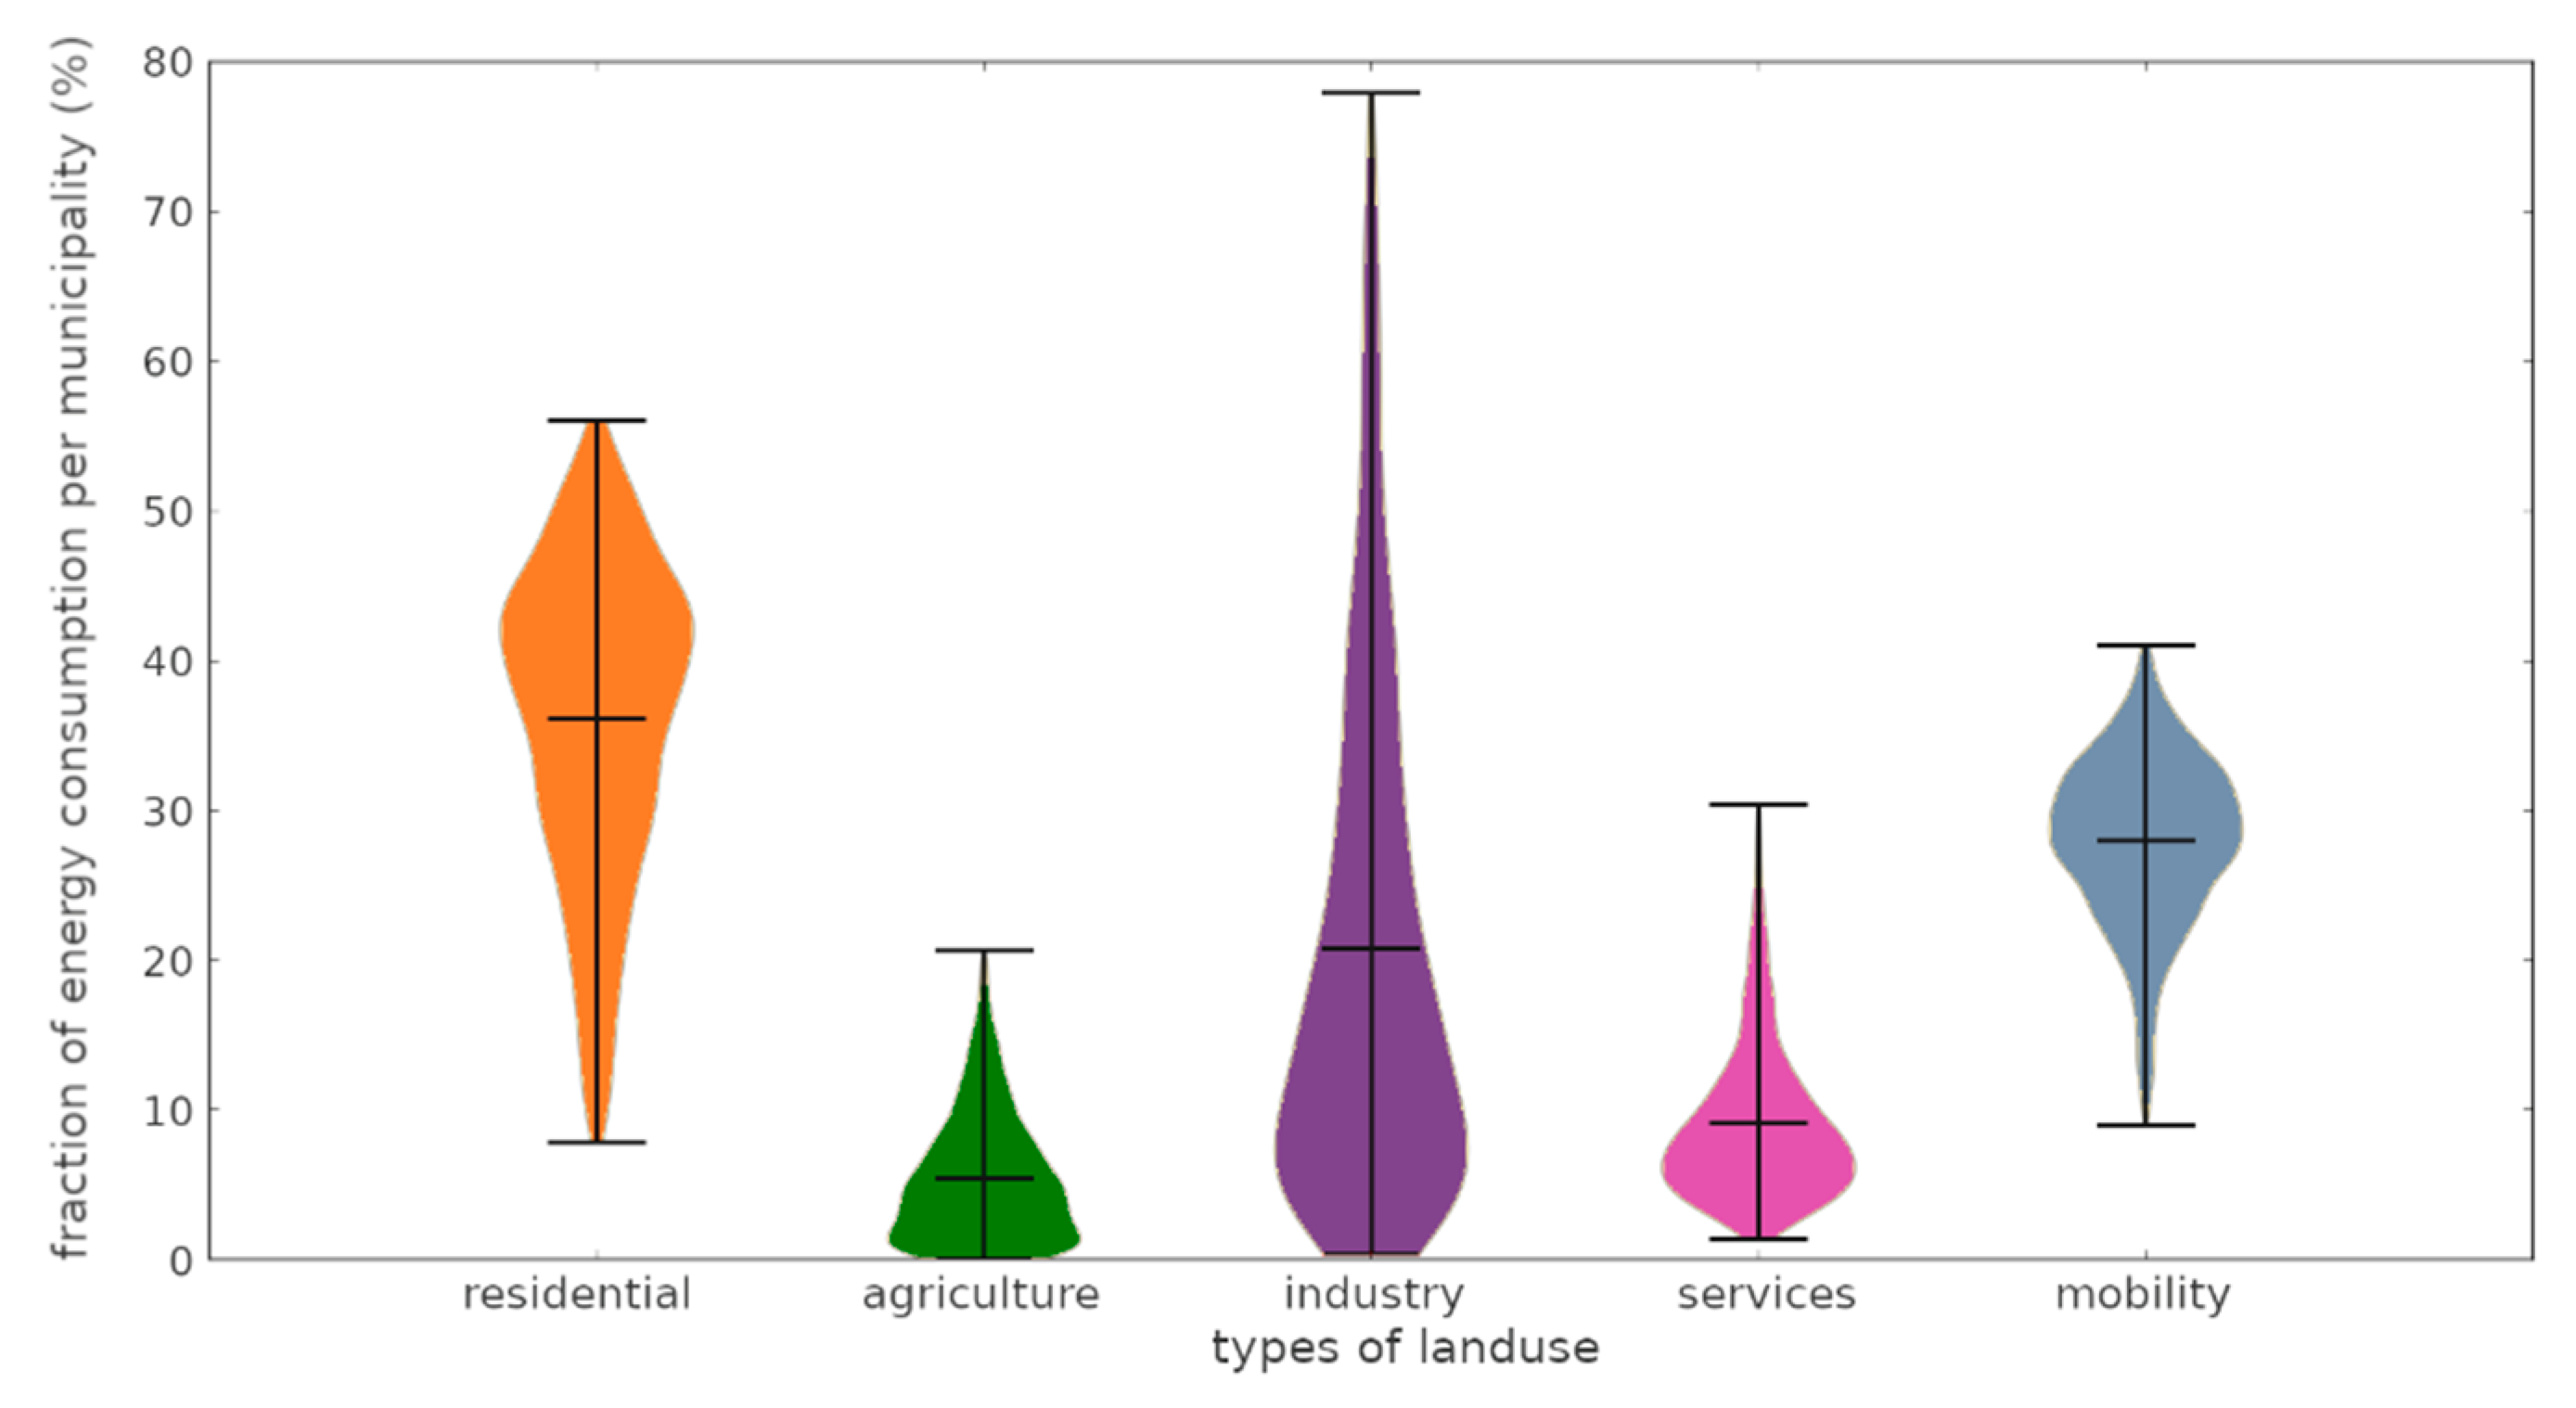
By addressing the structure of the energy consumer sectors, an insight into the energy consumption pattern can be obtained. Thus, the contributions of the various types of land use (including mobility) to the municipalities’ energy consumption as illustrated in
Figure 6 are worth consideration. The 1% lowest and highest values are considered as outliers and excepted from the discussion below.
First, the average share of the different types of land use varies between 6% (agriculture and forestry) and 36% (residential purposes) of the municipalities´ energy consumption. Mobility is on average responsible for 28%, industry for 21% and the public and private services for 9% of the municipalities´ energy consumption. In addition,
Figure 6 shows the minima and maxima shares of the various land use types. The industry shows a wide range of possible shares with a maximum share of more than 70% of the energy consumption, i.e. in a few municipalities, industry is by far the most important energy consumer sector. The maximum share for residential purposes amounts to 55%, that of mobility to 39% and that of the public and private services to 26% of the energy consumption. Agriculture and forestry feature the lowest maximum share, 18% of the energy consumption, and the smallest spectrum of possible shares. Finally, the frequency distribution of the shares of different types of land use is an important component of
Figure 6: Half of the municipalities feature shares of residential purposes between 29% and 44%, whereas the number of municipalities with higher shares rapidly decreases. The shares of industry show a reverse distribution—50% of the municipalities are characterized by industrial shares between 7% and 30% whereas the frequency distribution continues gently up to the maximum. In the event of agriculture and forestry, the most frequent shares are those between 2% and 8%, whereas shares higher than 15% are quite rare. The public and private services feature shares between 5% and 11% in half of the municipalities. In some cases, such as in major centers, the services sector attains shares higher than 20%. The frequency distribution of the mobility´s shares resembles partly a Gaussian distribution. In 50% of the municipalities, mobility contributes to the energy consumption with shares between 25% and 32%.
3.4. Variation of the Energy Consumption Due to the Individual Land Use
The different types of land use feature substantially varying shares of the energy consumption of the municipalities. On the one hand, this variation is a consequence of the different role of the land use types within the settlement structures. On the other hand, the differences in the energy consumption trace back to the specific design of the individual land use. For instance, considerable differences exist with respect to the energy consumption, especially to the heat demand, between various residential buildings depending on building type and building period. The differences in the energy consumption, notably process energy, are even more pronounced between different branches of industry owing to a plurality of various production routes. Due to the application of 92 parameters to capture the land use and mobility structures on the municipal level, the EMA can handle most of these phenomena. For example, the energy consumption of the industry is modelled for 27 different branches with different energy indicators. A particularly strong influence on the energy consumption emerges from energy-intensive industries such as paper mills, plants of chemical industry, glass/ceramic/cement industry as well as iron and steel industry. As
Figure 7 shows, these branches have an average share of 6% of the entire energy consumption per municipality. Three quarters of the municipalities feature shares below 4%. The municipalities where these four industrial branches have a share of more than 10% of the entire energy consumption count as outliers. In individual municipalities, this share can even be substantially higher and in extreme cases, exceed 70%. These shares above average occur in smaller municipalities as well as in medium-sized towns and lead to the underrepresentation of the other land use types. This observation is not primarily a result of settlement structures but reflects the locations of selected energy intensive companies.
3.5. Energy Consumption and Energy Purpose
The fact that the various types of land use contribute to the energy consumption to a variable extent is largely accompanied by differing shares of energy purposes (heat, processes and transport) of the energy consumption.
Figure 8 illustrates that heat and transport show a comparable pattern with average shares of 39% and 36%. However, the processes are on average responsible for approximately 24% of the energy consumption and 75% of the municipalities are characterized by rather low processes´ shares up to 29%. In return, the processes are characterized by a considerably high number of outliers towards high shares. This is a result of selective industrial energy consumption which is primarily responsible for the process energy demand. In such cases, heat and transport tend to be outliers downwards.
4. Discussion
The discussion section provides a scientific debate on the strengths, benefits and weaknesses of the EMA in the light of the novelty and the spatiality of the approach as well as with respect to the methodological frame and the accuracy of the model. A potential application of the EMA is highlighted by suggesting a new typology of municipalities based on their patterns of energy consumption.
4.1. Novelty of the EMA Approach
The requirement to develop a novel approach for modelling energy consumption and the associated GHG emissions results from the fact that in Austria the provinces are the smallest set of administrative entities at which energy and GHG data are available [
23,
60]. On the local level, neither statistical data on energy consumption nor assumptions on GHG emissions exist. In order to close this gap, the EMA has been developed and in fact, provides a comprehensive insight into energy consumption and GHG emissions on the level of the municipalities. Thus, the EMA is supposed to meet the requirements of local politics, administration, businesses and civil society recognizing the need for taking action in tempering climate change [
18], but missing a nationwide energy and climate related inventory for cities and local regions. Nevertheless, it should be borne in mind that allocating municipal GHG emissions only partly reflects responsibility on the municipal level for a reduction of the GHG emissions. The external factors influencing the local GHG emissions are e.g., energy prices, building codes, technological progress, individual behavior or weather patterns [
27].
The EMA deals with the energy system on a more detailed spatial level compared to energy models that investigate energy systems on global, international, national or regional levels. Otherwise, it features a coarser resolution than the energy models on a project level [
16,
30,
32,
34,
39,
40]. Like most energy models, the EMA renounces to use territorial boundaries due to e.g., the settlements and keeps to administrative boundaries, presumably because of the data availability and quality within these units [
41]. Since the EMA covers all municipalities in Austria, a comparison of energy consumption and GHG emissions among the municipalities is warranted. The comparability is one of the key features when calculating GHG emissions according to the IPPC guidelines [
61].
The EMA belongs to the type of energy models that analyze energy systems from an ecological, economic or social point of view. These models include, e.g., direct and indirect costs, funding, taxes, fines, public acceptance, environmental pollution, soil degradation, impairment of flora and fauna or climate change [
30]. The latter features the thematic focus of the EMA. Indeed, the EMA does not pursue technological issues such as the development, the implementation or the optimization of the energy system relying on the specific energy supply and the demand patterns in a detailed spatiotemporal resolution [
30].
4.2. Spatiality of the EMA
The EMA modelling approach is built on a spatial planning´s perspective which links the energy consumption and the associated GHG emissions to the spatial structures. Through this, the best fit of the approach to the local situation is ensured providing a sound, spatially differentiated basis for designing climate protection and energy transition strategies. Nationwide implementation of the approach generates a common baseline for all municipalities. Moreover, higher planning levels such as regions, provinces and the state government may benefit from the knowledge of the possible contributions of different spatial structures such as cities, small towns, suburban and rural areas to the superordinate climate and energy related strategies. The EMA allows for an intimate link between existing spatial structures or foreseeable spatial developments and future energy supply scenarios. This meets the indispensable prerequisite for achieving the energy transition with the lowest possible GHG emissions.
The EMA applies the conceptual framework of the spatial turn and underlines the centrality of land and space in energy and climate related policies. In this field, the shift towards the territorial dimension consists of the development of energy-optimized settlement structures accompanied by formal-regulatory changes (e.g., concerning the building codes) as well as societal processes (e.g., in terms of awareness raising, and in terms of societal learning about the spatial dimensions of the energy transition).
The EMA considers all relevant types of land use for residential purpose and economic sectors as well as the related mobility coequally. It focuses on the structure and patterns of final energy consumption and the entire (direct and indirect) GHG emissions on the local level. Therefore, it considers all energy sources as a common base for the estimation of GHG emissions and it takes all purposes of the energy use (heat, processes, transport) into account. Thus, the EMA differs substantially from the majority of energy models that either select a single energy sector, notably the residential or the mobility sector [
34], or consider selected purposes of energy consumption such as heating or process energy or selected energy sources, particularly oil, biomass or electricity. By focusing on certain segments, the energy models can answer specific, narrowly defined questions. These models are often developed for distinct purposes and unique audiences. However, the multi-sectoral and larger integrated models are particularly relevant for addressing policy relevance and strategic decision making processes [
41].
The EMA covers the entire energy system and is thus complete with respect to the consumers of energy and to the relevant categories of GHG sources. The completeness is another key-feature when calculating GHG emissions according to the IPPC guidelines [
61]. The EMA addresses energy demand recognized as a key component for fostering a low-carbon energy system [
30]. In this respect, the EMA follows the supposition to use the desired energy services as a starting point of an energy related analysis [
39]. In contrast, from an energy supply perspective, the technical aspects and the question on whether energy supply meets the given demand are relevant [
39].
4.3. Quantitativeness of the EMA
The energy models use either qualitative, quantitative or mixed methods depending on the research question. The quantitative evaluations can process and link numerical data by using equations or inequations to generate, e.g., scores and measures. The qualitative methods support the discussion on values, norms or objectives by disclosing influencing variables, describing the directions of the influence of these variables or revealing subjective opinions [
34,
62,
63]. Notably, the quantitative models depend on both the input data and the system-internal deliberation. The system modelers face the choice of allowing the later users to intervene with the model or not. The exogenous models are particularly suitable when available data sets are incomplete, and it is essential that users can add missing information, e.g., on-site knowledge. On the contrary, the purely endogenous models are free from external inputs [
39,
41].
The EMA represents an endogenous quantitative model which is exclusively based on the input of statistical data and neither relies upon user-defined specifications nor upon individual surveys or measurements. The availability of the necessary input data is a decisive factor in energy system modelling. The data quality and the costs have to be considered. Furthermore, the origin of the data and licensing issues need to be clarified [
29,
40,
41]. The EMA is built on systematic and consistent data deriving from comparable sources for all energy sectors and for all types of land use covering the entire country. The data responsibility is centralized by a governmental agency ensuring the data to be recognized as authoritative and regularly released. The latter offers the opportunity to release energy and GHG inventories at regular intervals. These facts are recognized as key assets when using statistical data for energy models [
16]. The statistical data concerning the various types of land use on the municipal level are complemented by a nationwide survey concerning everyday passenger mobility behavior with results on the provincial level [
50]. The combination of these inputs paves the way for an innovative approach to model the energy consumption and GHG emissions of everyday passenger mobility under consideration of spatial relationships among municipalities. Nevertheless, even a quantitative approach like the EMA cannot claim to be perfectly accurate. On the one hand, the input data are subject to some uncertainty. On the other hand, the standardized treatment of the input data cannot image all details of the variations in time and space, in individual behavior or in concurrent technical innovation. Finally, the energy models are generally not capable of fully describing situations that cannot even be observed or measured accurately [
30].
4.4. The EMA: Linking Top-Down and Bottom-Up Modelling
The EMA is built upon a smart linkage of top-down and bottom-up operations. It relies on a multitude of parameters based on hard, statistical data available on the local level for the entire country. These parameters allow a profound characteristic of the municipalities concerning the energy and climate related spatial structures including mobility (e.g., housing characteristics, industry mix, traffic performance). The multiple values represent a reliable foundation for the calculation of the energy consumption and the GHG emissions on the local level. The use of disaggregated data is a main characteristic of bottom-up models [
39]. On the other hand, the energy indicators derive from a top-down approach. This step is associated with the disadvantage that the energy indicators cannot explicitly represent the specific technologies [
39] and the special features of the individual municipalities. However, the outstanding advantage of this method is the consistency of the inventories on local and provincial levels. The aggregation of the municipalities´ values results in the provincial values. This applies for the kilometers traveled accounting for the different trip purposes as well as for the energy consumption of the different types of land use (excluding mobility) and for the GHG emissions as far as a comparison between the EMA and the provincial GHG inventory is possible. In this respect, the EMA meets the requirement to target on a consistent output on different spatial levels. The mixed approaches linking bottom-up and top-down methods are the best option to ensure that inventories are as accurate as possible [
43].
4.5. Accuracy of the EMA Approach
Therefore, the EMA represents an energy and GHG inventory that neither contains overestimates nor underestimates of the energy consumption and associated GHG emissions in total. However, within the scope of modelling energy consumption and GHG emissions on the level of individual municipalities or for single parameters, inaccuracies may arise particularly due to possible inexactness of some energy indicators. In order to minimize the uncertainty of the EMA, the calculation of energy consumption and GHG emissions is built on a multitude of parameters. This fact enables the application of the most specific and most precise energy indicators and ensures minimum deviations of the actual values from the respective indicator. In addition, the approach is presumed to yield high accuracy as the total energy consumption and the total amount of GHG emissions rests upon the aggregation over a multitude of parameters so that the possible differences between actual and simulated values for the single parameters, on average, cancel out. Accuracy is another key feature when calculating GHG emissions according to the IPPC guidelines [
61]. Due to sensitivity analysis which is an appropriate technique to determine which of the inputs has the greatest effect on the output [
41], the main focus within the EMA has to be lain on the parameters with either high energy indicators (e.g., energy intensive industries) or with large quantities (e.g., traffic performance) or on emission factors (e.g., depending on the electricity mix) in order to reduce uncertainties. Otherwise, modifying single parameters usually has marginal effects on the results.
4.6. The EMA as Accounting and Simulation Model
The EMA provides detailed accounting for the multitude of input and output data. It covers energy and climate related structural data concerning all types of land use including mobility as well as the key characteristics of the energy system and the GHG emissions on the local level. In this respect, the EMA may be assigned to the accounting models [
16]. In addition, the EMA is built on simulation techniques and may be classified as a descriptive simulation model based on a logical representation of the energy system [
34,
39]. The result of the model is the outcome of a set of complex calculations based on the input values [
32]. The EMA does not represent an optimization model providing the best solution for the future energy system out of a definite sample based on defined criteria and existing targets [
29,
30].
The EMA simulates the energy system for an individual time slice. Therefore, it may be assigned to the static models that use data from a single time slice, e.g., a single survey, to create output data. In contrast, the dynamic models rely upon a regularly updated input, e.g., continuous monitoring, and may achieve temporal pathways. The semi-dynamic models form time-series out of several sequential time slices [
30,
40]. The energy models are dealing with either past, present or future energy systems. Depending on the chosen time horizon, the energy models can be assigned to back casting, exploring or forecasting [
16,
30,
32,
34,
39,
40]. The EMA focuses on the current status and frames a nationwide reference for future energy and climate related activities. It is even applicable for other time horizons depending on the availability of input data. In this case, it can provide an insight into the trends in the energy system over decades. However, the EMA is not convenient for monitoring efforts on the municipality level due to the top-down approach for deriving the energy indicators.
As the EMA relies upon consistent data and methodological protocols, it is tuned to a high level of consistency to ensure that differences in the results reflect real differences in energy consumption or GHG emissions. Inconsistencies in the input and the approach can largely be excluded as potential sources of variation. Consistency is also a key feature when calculating GHG emissions [
61].
4.7. Spatially Differenciated Results of the EMA
As shown in the results section, the interrelations between spatial structures and patterns of energy consumption can be clearly observed. On the municipal level, the different types of land use contribute unequally to the energy consumption and GHG emissions. The interpretation of the results requires a discussion in light of the associated spatial structures. For this, the inventory includes all underlying energy and climate related parameters and provides further attributes for each municipality, such as total population, spatial area or designation as urban and rural. The extensive database permits the achievement of the highest possible merit values and enables meaningful cross-municipality comparisons [
16].
These considerations lead to the development of municipality types by the k-means algorithm [
64] according to the shares of the energy consumption shown by different types of land use. This clustering algorithm allows partitioning the result data set into a set of multiple groups (clusters) where the number of groups (k) is pre-specified. Thus, the k-means algorithm classifies the municipalities in k clusters in a way that municipalities within the same cluster are more similar than the municipalities in other clusters.
According to this algorithm, all Austrian municipalities are allocated to nine different types with similar patterns of energy consumption respectively underlying spatial structures (
Figure 9). In municipalities of types I and II, which together represent 42% of the municipalities, residential purposes and mobility have dominant shares of energy consumption, the types differ little with respect to the minor share of the industry. The municipalities of types III to V make up 18% and are again characterized by high shares of residential purposes and mobility but with noticeable shares of agriculture and forestry (type III), public and private services (type IV) respectively industry as well as public and private services (type V). The municipality types VI and VII consist of municipalities with a remarkable significance of public and private services, and they differ regarding the industrial share. These types represent only 7% of the municipalities. Nevertheless, they are quite important from a spatial planning point of view as they represent either the major centers with a well-balanced mix of different types of land use or the hotspots of tourism that are characterized by a considerable spatial and temporal concentration of one individual type of land use or selected sites of health and care facilities. Finally, the industry features a (very) dominant share of the energy consumption in municipalities of types VIII and IX that cover usually sites of production facilities from energy intensive branches and represent 33% of the municipalities.
The typology of municipalities addressing the energy consumption and GHG emissions permits the illustration of various spatial structures leading to different patterns of energy consumption on the local level. Comparisons of energy consumption and GHG emissions offer a high merit value within the municipality types featuring largely homogenous energy intensities of different spatial structures, economies and lifestyles on the local level [
16]. Variances of key figures within the municipality types decrease notably compared to nationwide values. The knowledge about similarities and differences among the municipalities provides a sound basis for developing strategies in favor of energy transition and climate protection both within and across municipalities.
5. Conclusions
The most relevant strategic implication of the Energy Mosaic Austria lies in the establishment of a consistent inventory of energy consumption and the associated GHG emissions for the entirety of the Austrian municipalities. It provides a sound basis for planning the energy transition. As compared to tools where the outcomes largely depend on the individual users´ input data, the EMA is a complete inventory based on multiple data in complex system interrelations and is being made available on an open-source homepage in autumn 2019 (
https://www.energiemosaik.at). The decision-makers on the municipal level and on superordinate levels get access to a realistic, spatially differentiated baseline for planning the energy transition. The main consumers of energy and the main sources of GHG emissions can be identified revealing hotspots and the highest leverage for the energy transition and climate protection strategies.
With the presentation of the EMA, this study intends to motivate other scholars and research groups to adapt the methodology according to the database available outside Austria. This is to establish comparable nationwide inventories providing comprehensive data on energy consumption and GHG emissions on a municipal level as a baseline for climate change mitigation and energy transition strategies.
Author Contributions
The authors individually contributed to this research article as well as the underlying projects in following way: conceptualization, L.A. and G.S.; methodology, L.A.; software, L.A.; validation, L.A.; formal analysis, L.A.; investigation, L.A.; resources, L.A.; data curation, L.A.; writing—original draft preparation, L.A., S.E. and G.S.; writing—review and editing, L.A. and G.S.; visualization, L.A. and S.E.; supervision, L.A.; project administration, L.A.; funding acquisition, L.A. and G.S.
Funding
This paper is based on findings from the project “ERPS - Modelling of energy- and climate-relevant basis of decision-making for local spatial planning in Styria” and “EnCO2Web - Austrianwide modelling and web-based visualization of energy consumption and greenhouse gas emissions on local level” (Project No 861788). The project EnCO2Web is funded by the Austrian Ministry of Transport, Innovation and Technology (BMVIT) within the program “Stadt der Zukunft” of the Austrian Research Promotion Agency (FFG). The funding body had no role in data collection, analysis, and interpretation of data as well as in writing the manuscript. Due to funding regulations, we are instructed to include the following paragraph: “Stadt der Zukunft ist ein Forschungs- und Technologieprogramm des Bundesministeriums für Verkehr, Innovation und Technologie. Es wird im Auftrag des BMVIT von der Österreichischen Forschungsförderungsgesellschaft gemeinsam mit der Austria Wirtschaftsservice Gesellschaft mbH und der Österreichischen Gesellschaft für Umwelt und Technik ÖGUT abgewickelt.“ This publication was supported by the BOKU Vienna Open Access Publishing Fund.
Acknowledgments
The authors would like to thank the entire project team of “EnCO2Web” as well as the provincial government of Styria for the accompaniment of the research processes. Findings, conclusions and recommendations within this paper reflect results of the original studies.
Conflicts of Interest
The authors declare no conflict of interest. The funders had no role in the design of the study; in the collection, analyses, or interpretation of data; in the writing of the manuscript, or in the decision to publish the results.
References
- Stoeglehner, G.; Neugebauer, G.; Erker, S.; Narodoslawsky, M. Integrated Spatial and Energy Planning: Supporting Climate Protection and the Energy Turn with Means of Spatial Planning; Springer: Berlin/Heidelberg, Germany, 2016. [Google Scholar]
- Intergovernmental Panel on Climate Change. Climate Change 2014: Synthesis Report. Contribution of Working Groups I, II and III to the Fifth Assessment Report of the Intergovernmental Panel on Climate Change; Core Writing Team, Pachauri, R.K., Meyer, L.A., Eds.; IPCC: Geneva, Switzerland, 2015. [Google Scholar]
- Intergovernmental Panel on Climate Change. Climate Change 2014: Impacts, Adaptation and Vulnerability. Part A: Global and Sectoral Aspects. Contribution of Working group I to the 5fth Assessment Report of the Intergovernmental Panel on Climate Change; Cambridge University Press: Cambridge, UK, 2014. [Google Scholar]
- Furtak, F.T. Internationale Organisationen: Staatliche und nichtstaatliche Organisationen in der Weltpolitik; Springer: Berlin/Heidelberg, Germany, 2015. [Google Scholar]
- United Nations. Paris Agreement; UN: New York, NY, USA, 2015. [Google Scholar]
- United Nations. Kyoto Protocol to the United Nations Framework Convention on Climate Change; UN: New York, NY, USA 1998. [Google Scholar]
- European Commission. Communication from the Commission to the European Parliament and the Council. The Paris Protocol—A Blueprint for Tackling Global Climate Change Beyond 2020. COM(2015) 81 Final/2 2015. Available online: https://eur-lex.europa.eu/legal-content/EN/TXT/?uri=COM%3A2015%3A81%3AFIN (accessed on 8 May 2019).
- UNFCC. Adoption of the Paris Agreement; UNFCC: Bonn, Germany, 2015. [Google Scholar]
- Döring, J.; Thielmann, T. Spatial Turn: Das Raumparadigma in den Kultur- und Sozialwissenschaften; Transcript: Bielefeld, Germany, 2015. [Google Scholar]
- Warf, B.; Arias, S. The Spatial Turn: Interdisciplinary Perspectives; Routledge studies in human geography; Routledge: London, UK, 2009. [Google Scholar]
- Löschner, L. The Spatial Turn in flood Risk Management. A Case Study of Austria’s Changing Flood Policies; University of Natural Resources and Life Sciences: Vienna, Austria, 2018. [Google Scholar]
- Intergovernmental Panel on Climate Change. Climate Change 2013. The Physical Science Basis. Technical Summary; IPCC: Geneva, Switzerland, 2015. [Google Scholar]
- Stöglehner, G.; Mitter, H.; Weiß, M.; Neugebauer, G.; Narodoslawsky, M.; Niemetz, N.; Kettl, K.-H.; Eder, M.; Sandor, N.; Baaske, W.; et al. ELAS—Energetische Langzeitanalyse von Siedlungsstrukturen; Klima- und Energiefonds: Wien, Austria, 2011. [Google Scholar]
- Stöglehner, G.; Narodoslawsky, M.; Steinmüller, H.; Steininger, K.; Weiss, M.; Mitter, H.; Neugebauer, G.; Weber, G.; Niemetz, N.; Kettl, K.-H.; et al. PlanVision—Visionen für eine energieoptimierte Raumplanung; Klima- und Energiefonds: Wien, Austria, 2011. [Google Scholar]
- European Commission. Communication from the Commission to the European Parliament, the Council, the European Economic and Social Committee and the Committee of the Regions. Energy Roadmap 2050. Available online: https://eur-lex.europa.eu/legal-content/EN/ALL/?uri=CELEX%3A52011DC0885 (accessed on 8 May 2019).
- Parshall, L.; Gurney, K.; Hammer, S.A.; Mendoza, D.; Zhou, Y.; Geethakumar, S. Modeling energy consumption and CO2 emissions at the urban scale: Methodological challenges and insights from the United States. Energy Policy 2010, 38, 4765–4782. [Google Scholar] [CrossRef]
- Oudes, D.; Stremke, S. Spatial transition analysis: Spatially explicit and evidence-based targets for sustainable energy transition at the local and regional scale. Landsc. Urban Plan. 2018, 169, 1–11. [Google Scholar] [CrossRef]
- European Commission. Communication from the Commission to the European Parliament, the Council, the European Economic and Social Committee and the Committee of the Regions. A Policy Framework for Climate and Energy in the Period from 2020 to 2030. Available online: https://eur-lex.europa.eu/legal-content/EN/ALL/?uri=CELEX%3A52014DC0015 (accessed on 8 May 2019).
- European Commission. European Energy Security Strategy; Centre for European Policy: Freiburg im Breisgau, Germany, 2014. [Google Scholar]
- European Commission. EC an EU Strategy on Heating and Cooling; European Union: Brussels, Belgium, 2012. [Google Scholar]
- Bundesministerium für Nachhaltigkeit und Tourismus. #Mission2030. Die Klima- und Energiestrategie der Österreichischen Bundesregierung; Bundesministerium für Nachhaltigkeit und Tourismus: Wien, Austria, 2018. [Google Scholar]
- European Commission. Energy Statistics. Available online: https://ec.europa.eu/eurostat/web/energy (accessed on 25 June 2019).
- Statistics Austria. Useful Energy Analysis for the Nine Provinces in Austria 2011 (Original title: Nutzenergieanalyse für die neun österreichischen Bundesländer 2011). Available online: http://www.statistik.at/web_de/statistiken/energie_umwelt_innovation_mobilitaet/energie_und_umwelt/energie/nutzenergieanalyse/index.html (accessed on 14 February 2018).
- Statistics Austria. Total Energy Account of Austria 2011 (Original title: Energiegesamtrechnung Österreich 2011). Available online: http://www.statistik.at/web_de/statistiken/energie_umwelt_innovation_mobilitaet/energie_und_umwelt/energie/energiegesamtrechnung/index.html (accessed on 14 February 2018).
- The Organisation for Economic Co-operation and Development. Cities and Climate Change; OECD: Paris, France, 2010. [Google Scholar]
- Ibrahim, N.; Sugar, L.; Hoornweg, D.; Kennedy, C. Greenhouse gas emissions from cities: Comparison of international inventory frameworks. Local Environ. 2012, 17, 1–19. [Google Scholar] [CrossRef]
- Kaselofsky, J.; März, S.; Schüle, R. Bottom-up monitoring of municipal energy and climate policy: More than an alternative to top-down approaches? Prog. Ind. Ecol. Int. J. 2014, 8, 279. [Google Scholar] [CrossRef]
- Kennedy, C.; Steinberger, J.; Gasson, B.; Hansen, Y.; Hillman, T.; Havránek, M.; Pataki, D.; Phdungsilp, A.; Ramaswami, A.; Mendez, G.V. Methodology for inventorying greenhouse gas emissions from global cities. Energy Policy 2010, 38, 4828–4837. [Google Scholar] [CrossRef]
- Pfenninger, S.; Hirth, L.; Schlecht, I.; Schmid, E.; Wiese, F.; Brown, T.; Davis, C.; Gidden, M.; Heinrichs, H.; Heuberger, C.; et al. Opening the black box of energy modelling: Strategies and lessons learned. Energy Strategy Rev. 2018, 19, 63–71. [Google Scholar] [CrossRef]
- Pfenninger, S.; Hawkes, A.; Keirstead, J. Energy systems modeling for twenty-first century energy challenges. Renew. Sustain. Energy Rev. 2014, 33, 74–86. [Google Scholar] [CrossRef]
- DeCarolis, J.F.; Hunter, K.; Sreepathi, S. The case for repeatable analysis with energy economy optimization models. Energy Econ. 2012, 34, 1845–1853. [Google Scholar] [CrossRef]
- Lopion, P.; Markewitz, P.; Robinius, M.; Stolten, D. A review of current challenges and trends in energy systems modeling. Renew. Sustain. Energy Rev. 2018, 96, 156–166. [Google Scholar] [CrossRef]
- Helm, D. Energy policy: Security of supply, sustainability and competition. Energy Policy 2002, 30, 173–184. [Google Scholar] [CrossRef]
- Hall, L.M.H.; Buckley, A.R. A review of energy systems models in the UK: Prevalent usage and categorisation. Appl. Energy 2016, 169, 607–628. [Google Scholar] [CrossRef]
- Hoffert, M.I.; Caldeira, K.; Jain, A.K.; Haites, E.F.; Harvey, L.D.D.; Potter, S.D.; Schlesinger, M.E.; Schneider, S.H.; Watts, R.G.; Wigley, T.M.L.; et al. Energy implications of future stabilization of atmospheric CO2 content. Nature 1998, 395, 881. [Google Scholar] [CrossRef]
- The World Energy Council. World Energy Trilemma Index 2018; WEC: London, UK, 2018. [Google Scholar]
- United Nations Sustainable Development Knowledge Platform. Sustainable Development Goals. Available online: https://sustainabledevelopment.un.org/sdgs (accessed on 8 May 2019).
- Brooks, R.J.; Tobias, A.M. Choosing the best model: Level of detail, complexity, and model performance. Math. Comput. Model. 1996, 24, 1–14. [Google Scholar] [CrossRef]
- Beeck, V. Classification of Energy Models 1999. Available online: https://research.tilburguniversity.edu/en/publications/classification-of-energy-models (accessed on 15 May 2019).
- Connolly, D.; Lund, H.; Mathiesen, B.V.; Leahy, M. A review of computer tools for analysing the integration of renewable energy into various energy systems. Appl. Energy 2010, 87, 1059–1082. [Google Scholar] [CrossRef]
- Keirstead, J.; Jennings, M.; Sivakumar, A. A review of urban energy system models: Approaches, challenges and opportunities. Renew. Sustain. Energy Rev. 2012, 16, 3847–3866. [Google Scholar] [CrossRef]
- Lyden, A.; Pepper, R.; Tuohy, P.G. A modelling tool selection process for planning of community scale energy systems including storage and demand side management. Sustain. Cities Soc. 2018, 39, 674–688. [Google Scholar] [CrossRef]
- Bader, N.; Bleischwitz, R. Measuring Urban Greenhouse Gas Emissions: The Challenge of Comparability. SAPIENS Surv. Perspect. Integr. Environ. Soc. 2009, 2, 1–15. [Google Scholar]
- Statistics Austria. Register Census 2011: Inhabitants (Original title: Registerzählung 2011: Einwohner). Available online: http://www.statistik.at/web_de/services/statcube/index.html (accessed on 13 February 2018).
- Statistics Austria. Building and Housing Census 2011: Residential Areas (Original title: Gebäude- und Wohnungszählung 2011: Wohnnutzflächen). Available online: http://www.statistik.at/web_de/services/statcube/index.html (accessed on 13 February 2018).
- Statistics Austria. Workplace Census 2011: Workplaces and Employees (Original title: Arbeitsstättenzählung: Arbeitsstätten und Beschäftigte). Available online: http://www.statistik.at/web_de/services/statcube/index.html (accessed on 13 February 2018).
- Statistics Austria. Register Census 2011: Commuters (Original title: Registerzählung 2011: Pendler). Available online: http://www.statistik.at/web_de/services/statcube/index.html (accessed on 13 February 2018).
- Statistics Austria. Agricultural Structure Survey 2010—Overview: Agricultural Cultivated Areas (Original title: Agrarstrukturerhebung 2010—Überblick: Landwirtschaftliche Kulturflächen). Available online: http://www.statistik.at/web_de/services/statcube/index.html (accessed on 15 February 2018).
- European Commission RAMON. Reference and Management of Nomenclatures. Available online: https://ec.europa.eu/eurostat/ramon/nomenclatures/index.cfm?TargetUrl=LST_NOM_DTL&StrNom=NACE_REV2&StrLanguageCode=FR (accessed on 25 June 2019).
- Tomschy, R.; Herry, M.; Sammer, G.; Klementschitz, R.; Riegler, S.; Follmer, R.; Gruschwitz, D.; Josef, F.; Gensasz, S.; Kirnbauer, R.; et al. Austria on the Road 2013/2014 (Original title: Österreich Unterwegs 2013/2014. Ergebnisbericht zur Österreichweiten Mobilitätserhebung “Österreich Unterwegs 2013/2014”. Im Auftrag von: Bundesministerium für Verkehr, Innovation und Technologie, Autobahnen- und Schnellstraßen-Finanzierung-Aktiengesellschaft, Österreichische Bundesbahnen Infrastruktur AG, Amt der Burgenländischen Landesregierung, Amt der Niederösterreichischen Landesregierung, Amt der Steiermärkischen Landesregierung, Amt der Tiroler Landesregierung); Bundesministerium für Verkehr, Innovation und Technologie: Wien, Austria, 2016. [Google Scholar]
- Kaltschmitt, M.; Hartmann, H.; Hofbauer, H. Energie aus Biomasse: Grundlagen, Techniken und Verfahren; Springer: Berlin/Heidelberg, Germany, 2016. [Google Scholar]
- European Commission. Eurostat Energy, Transport and Environment Indicators: 2018 Edition; Publications Office of the European Union: Luxembourg, 2018. [Google Scholar]
- Li, J.; Yang, X. Monitoring and Modeling of Global Changes: A Geomatics Perspective; Springer: Berlin/Heidelberg, Germany, 2015. [Google Scholar]
- Lee, S.; Noh, D.-W.; Oh, D. Characterizing the Difference between Indirect and Direct CO2 Emissions: Evidence from Korean Manufacturing Industries, 2004–2010. Sustainability 2018, 10, 2711. [Google Scholar] [CrossRef]
- Bundeskanzleramt Austria. Austrian Report on Building Culture 2011 (Original title: Österreichischer Baukulturreport 2011); Bundeskanzleramt Austria: Vienna, Austria, 2011. [Google Scholar]
- Bundesministerium für Finanzen; Bundesministerium für Land- und Forstwirtschaft, Umwelt und Wasserwirtschaft. Agrarian Diesel Regulation (Original title: Agrardieselverordnung: Verordnung des Bundesministers für Finanzen im Einvernehmen mit dem Bundesminister für Land- und Forstwirtschaft, Umwelt und Wasserwirtschaft über die Vergütung der Mineralölsteuer für Agrardiesel (Agrardieselverordnung); BGBl. II Nr. 506/2004); 2004. [Google Scholar]
- Federal Environment Agency. CO2 Emission Calculator. Available online: https://www.umweltbundesamt.at/thg_emissionsrechner (accessed on 18 April 2018).
- Mair am Tinkhof, O.; Strasser, H.; Prinz, T.; Herbst, S.; Schuster, M.; Tomschy, R.; Figl, H.; Fellner, M.; Ploß, M.; Roßkopf, T. Richt-und Zielwerte für Siedlungen zur integralen Bewertung der Klimaverträglichkeit von Gebäuden und Mobilitätsinfrastruktur in Neubausiedlungen. Berichte aus Energie- und Umweltforschung; 39/2017; Bundesministerium für Verkehr, Innovation und Technologie: Wien, Austria, 2017. [Google Scholar]
- Institut für Energie- und Umweltforschung Heidelberg. TREMOD. Transport Emission Model. Data and Calculation Model: Pollutant Emissions from Motorized Traffic in Germany 1960–2030. Ongoing Work on Behalf of the Federal Environment Agency since 1993. Available online: https://www.umweltbundesamt.de/bild/entwicklung-des-spezifischen-energieverbrauchs-im (accessed on 6 April 2017).
- Federal Environment Agency. Federal States Air Pollutant Inventory 1990–2016 (Original title: Bundesländer Luftschadstoff-Inventur (BLI) 1990–2016); Federal Environment Agency: Vienna, Austria, 2018. [Google Scholar]
- Intergovernmental Panel on Climate Change; National Greenhouse Gas Inventories Programme. 2006 IPCC Guidelines for National Greenhouse Gas Inventories; WMO: Geneva, Switzerland, 2006. [Google Scholar]
- Adam, D. Planung und Entscheidung: Modelle—Ziele—Methoden; Springer: Berlin/Heidelberg, Germany, 2013. [Google Scholar]
- Taylor, G.R. Integrating Quantitative and Qualitative Methods in Research; University Press of America: Lanham, MD, USA, 2005. [Google Scholar]
- Nisbet, R.; Elder, J.; Miner, G. Handbook of Statistical Analysis and Data Mining Applications; Academic Press: Cambridge, MA, USA, 2009. [Google Scholar]
© 2019 by the authors. Licensee MDPI, Basel, Switzerland. This article is an open access article distributed under the terms and conditions of the Creative Commons Attribution (CC BY) license (http://creativecommons.org/licenses/by/4.0/).


