1. Introduction
The initial differences among batteries which lead to inconsistency after charging and discharging are the main reasons for the shortened life and low safety in the use of battery packs. It is not feasible to completely eliminate the inconsistency of battery packs, but there are some ways to reduce inconsistency’s negative impact [
1,
2]. Cell sorting in lithium-ion battery industry is an indispensable process to assure the reliability and safety of cells that are assembled into strings, blocks, modules and packs [
3]. In the current lithium-ion power battery pack production line, cell sorting refers to the selection of qualified cells from raw ones according to quantitative criterions in terms of accessible descriptors such as battery resistance, open circuit voltage (OCV), charging/discharging capacity, etc. Correspondingly, resistance sorting, voltage sorting and capacity sorting are the main single parameter sorting methods used in battery pack production lines at present [
4,
5,
6,
7]. The single-parameter sorting method can quickly screen batteries whose parameters are in the qualified range from raw ones [
8], but this method ignores the relationship among battery parameters. In contrast, the multi-parameter sorting method which combines static and dynamic characteristics of batteries is a more accurate and comprehensive solution. In order to realize multi-parameter sorting of lithium batteries in the battery pack production line, it is necessary to test battery parameters, such as the resistance, voltage and capacity, using the existing equipment.
We note that a certain number of open publications focusing on sorting methods can be found, and clustering algorithms [
9,
10], including the fuzzy C-means algorithm (FCM) [
11,
12], k-means algorithm [
13], and self-organizing maps (SOM) neural networks [
14,
15,
16], are the main research direction. Nevertheless, the sorting parameters and their relationships and constraints adopted in the sorting process, which are of fundamental significance, have not been investigated. Therefore, in this study, a series of parameters as sorting criterions which can characterize the performance and difference of batteries are investigated, and they are divided into three categories: general parameters, static performance parameters and dynamic characteristics.
General parameters refer to the appearance parameters such as mass (m) and volume (v) of batteries and the derived parameters such as mass specific energy and volume specific energy caused by them. Static performance parameters include battery resistance, voltage, charge/discharge capacity, self-discharge rate, charge/discharge efficiency and charge/discharge time. They describe the performance of batteries under non-working conditions, but their acquisition needs certain conditions. For instance, charging and discharging [
17] experiments are needed to obtain the capacity data of batteries. As for static characteristics of a battery, charge-discharge voltage curve and electrochemical impedance spectroscopy (EIS) [
18] are typical methods to show the dynamic performance. Some previous studies utilize an overall voltage-current or voltage-time curve comparing the differences among batteries to complete sorting. However, drawing an overall voltage-time curve or EIS takes a long time to complete, so it is unrealistic to use it in production line.
Under such circumstances, this study compares several parameters as descriptors for battery sorting and finally selects the following sorting indicators: battery mass (m), volume (v), voltage (V), capacity (C) and surface temperature (T) [
19] as static indicators. As aforementioned, an overall voltage-time curve or EIS spectrum takes a long time to obtain, therefore, in this study the impedance characteristics of batteries at several key frequencies in EIS spectrum [
20] are extracted, and the AC (Alternative Current) impedance (R
A) and reactance (X) of batteries are taken as the evaluation criteria of dynamic characteristics. These parameters can be obtained by testing equipment now available on the production line. The principle components analysis (PCA) [
21] method is used to pre-process the data of battery parameters (clarifying the relationship between parameters), and obtain the principal components that can reflect the characteristics of the battery. The clustering and sorting process of batteries is accomplished by a self-organizing map (SOM) neural network.
The rest of this paper is organized as follows: The acquisition of battery parameters and data analysis are completed in
Section 2, followed by the results of data processing using PCA.
Section 3 introduces the principle of SOM algorithm and its application in battery clustering.
Section 4 carries out the battery sorting experiments and operation tests to obtain the state of charge (SOC) curves of the batteries to be sorted under special conditions. Finally, in
Section 5 the performance of batteries after grouping is studied, and the results of battery sorting are verified.
Section 6 concludes the major findings.
2. Parameter Acquisition and Data Processing
This section describes the process to obtain the parameters of the batteries to be sorted, so as to get a sufficient number of parameter inputs to start a follow-up clustering algorithm.
A set of 58 lithium iron phosphate (LiFePO
4) batteries are considered in this work. The batteries to be sorted are INR 18650-33G cylindrical batteries produced by Samsung SDI Company (Suwon, South Korea). The cathode is made of lithium iron phosphate and the anode is made of graphite. Tests were performed in laboratories in Tsinghua University Shenzhen Graduate School and Sunwoda electronics Co., Ltd. in Shenzhen to obtain experimental data such as mass, volume, voltage and currents under charge/discharge and capacity, etc. and to identify internal resistance. These 58 Samsung 18650 cells with a nominal capacity of 2700 mAh and nominal voltage of 3.6V were tested under certain circumstances.
Table 1 shows the cell specification.
2.1. General Parameters
The general parameters of batteries can be directly reflected in their physical attributes, such as the mass, volume and surface temperature of battery cells, as well as the derived mass specific energy and volume specific energy. Because all the batteries selected in this paper are of the same type, the battery energy is the same by default. Therefore, the mass (m), volume (v) and surface temperature (T) of the battery cells are selected as the general parameters.
Parameters m and v of batteries were tested with Keyence pressure sensor and vision measurement sensor. The quality measurement with 10 μg accuracy can be achieved by pressure conversion measured by pressure gauge. The volume of the battery is calculated by measuring the geometric size. The surface temperature (T) of battery is measured by thermocouple.
2.2. Static Parameters
The voltage (V) of the batteries to be sorted can be measured with a high precision voltmeter. The total capacity (
C) of batteries is a unique characteristic, which is different between different batteries. It can be obtained from the charge/discharge test, by means of the capacity data provided from the Coulomb counting method, shown as Equation (1), directly implemented in the testing equipment. The charge/discharge test is carried out using Arbin BT-5HC battery testing equipment, with battery cells (to be sorted) in a Sanwood constant temperature and humidity box.
Figure 1 indicates the curve of voltage and current during the charge/discharge test.
denotes charging/discharging capacity,
and
represent charging/discharging current and time. In the process of capacity testing, the lithium battery that has been stationary for 2 h is discharged to the discharge cut-off voltage (2.6 V) at a rate of 1
C. Then the battery is charged by means of CC-CV (Constant Current-Constant Voltage) at a rate of 0.5
C to the charging cut-off voltage (4.2 V), and then is discharged at a rate of 1
C until the discharge cut-off voltage. The capacity test curve as shown in
Figure 1 is obtained after several cycles, and the capacity is calculated using Equation (1).
There are several ways to measure DC (Direct Current) internal resistance of batteries. In this study, according to Equation (2), the DC internal resistance is derived by dividing the voltage drop during the transition to rest by the constant discharge current:
Due to the polarization phenomenon, the voltage of lithium batteries presents a dynamic process of rapid rise, slow rise, rapid fall and slow fall during pulse charging. The change of voltage during discharging is contrary to that during charging. In this process, the sharp voltage drop is caused by the ohmic polarization inside the battery, so the ohmic internal resistance of the battery can be identified by using the voltage and current data.
2.3. Impedance Characteristics
The electrochemical impedance spectroscopy (EIS) method is used to measure the change of the impedance or phase angle of the battery system with frequency, by applying sinusoidal alternating currents of different frequencies to the battery. The EIS of a battery is an inherent characteristic. It is a feasible method to use the similarity of EIS drawings to sort batteries. The EIS method is a quasi-dynamic process, and small sinusoidal alternating current will not cause great disturbance to the battery, so the EIS sorting method is more accurate than the static method.
In the EIS of lithium-ion batteries, the different parts corresponding to different frequencies can reflect the process of lithium ion removal and embedding in the embedded electrode during the charging and discharging process of lithium-ion batteries.
- (1)
Ultra high frequency (UHF) part: The section where the impedance curve intersects the transverse axis in EIS, reflecting the ohmic impedance () of lithium ion batteries.
- (2)
High frequency part: A semicircle related to the diffusion and migration of lithium ions through the insulating layer on the surface of active material particles. This process can be represented by a parallel circuit.
- (3)
Intermediate frequency (IF) part: A semicircle reflecting the charge transfer process. The process is represented by a parallel circuit. is the charge transfer impedance, or the polarization impedance of the battery, and is double-layer capacitor.
- (4)
Low frequency part: A line with a slope of 45 degrees, which is related to the solid diffusion process of lithium ions in active material particles. In the equivalent circuit model, a Warburg impedance describing diffusion can be used, also known as concentration polarization impedance.
- (5)
Ultra low frequency: A semicircle and a vertical line, reflecting the change in crystal structure of active material particles and the accumulation and consumption of lithium ions in active material respectively.
Figure 2a indicates the equivalent circle model for EIS used for curve fitting. In this study, using the HIOKI BT4560 Impedance Tester (HIOKI, Shanghai, China), the impedance experiments are carried out on one of the lithium battery cells using 0.1–1050 Hz AC current, and the impedance spectra are plotted, as shown in
Figure 2b, which reflects the intermediate frequency part mentioned above. BT4560 can realize simultaneous measurement of battery voltage and impedance with high accuracy. The measurement accuracy of voltage and impedance can reach 10
and 1
respectively. It can also measure the surface temperature of batteries by connecting thermocouples, and the accuracy can reach 0.1 °C.
As described in
Section 1, we collect the impedance characteristics of batteries at several key frequencies in EIS spectrum, so that the measurement process can be rapid. In this study, two characteristic frequencies, 0.1 Hz and 1000 Hz, are selected to obtain the impedance (
RA) and reactance (
X) of the battery as the sorting parameters. These two frequencies are between high, medium and low frequencies. The results of impedance can reflect the polarization impedance and Warburg impedance of batteries, respectively.
2.4. Principle Components Analysis
The parameters of each battery cell to be sorted are tested using the test equipment suitable for the production line. The results are shown in
Table 2; two cells are selected to show the input parameters.
The input data matrix of 58 × 9 is obtained after the test of 58 battery cells. Principle component analysis (PCA) is used to analyze data. PCA is a statistical method, which uses linear transformation to achieve dimension reduction. Its basic principle is to use the idea of dimension reduction and linear transformation to transform multiple indicators into several unrelated comprehensive indicators without losing much information, which are called the principle components. In this study, the data of 58 batteries are analyzed by principal component analysis in the following steps.
Arrange the raw data in rows to form a matrix .
Standardize the data of matrix , change its mean to zero.
Compute Covariance Matrix .
Calculate eigenvalues according to the covariance matrix . The eigenvectors are arranged from large to small eigenvalues, and the first k matrices are composed of rows P.
Calculate by Equation (3) to get the reduced dimension data matrix
.
Compute the contribution rate
of each eigenvalue as shown in Equation (4)
Sort the principal components according to their contribution rate and explain the physical significance of principal components based on eigen roots and their eigenvectors.
The result of PCA shows that three principle components can cover more than 90% of data variability, as shown in
Table 3. By analyzing the proportion of principal components of each parameter, the proportion results are obtained.
Equations (5)–(7) use eigenvectors to show the relationship with nine initial characteristic parameters. It can be seen that these nine characteristics are confirmed and can be divided into three categories: appearance parameters, impedance characteristics and safety parameters. The characteristic vector t1 is mainly positively correlated with the impedance characteristics of batteries, and negatively correlated with mass, volume and capacity, so t1 can be regarded as the principal component reflecting the impedance characteristics of batteries; similarly, the vector t2 can be regarded as the principal component reflecting the appearance parameters of batteries. The characteristic vector t3 mainly reflects the temperature parameters of the battery, which is related to the safety and thermal management of the battery.
3. SOM Neutral Networks and SOM Clustering
3.1. Introduction of SOM Neural Networks
The self-organizing map (SOM) neural network is an unsupervised learning clustering algorithm which realizes high-dimension visualization. It is an artificial neural network developed by simulating the characteristics of human brain to signal. The model was first proposed by Teuvo Kohonen [
22], a professor at Helsinki University in Finland in 1981, so it is also called the Kohonen network.
The application of SOM neural networks in clustering is mainly based on the following advantages:
Dimension reduction can be achieved, and clustering results have good visibility. High dimensional input space can be mapped to low dimensional output space maintain the original topological relationship.
With self-organizing and unsupervised learning, it can be applied to situations where the characteristics of input data are not fully understood.
The algorithm is clear and the calculation is simple.
These features enable SOMs to be widely used in clustering, helping to recognize homogeneous groups of generous and complex inputs. Reference [
14,
15,
16] indicates research and applications where SOMs are used in clustering processes in the last decades. Compared with traditional clustering algorithms, such as the k-means algorithm and FCM algorithm, SOM is more accurate and not affected by the selection of initial clustering centers, although its operation process is relatively complex.
3.2. Principle and Learning Algorithm of SOM
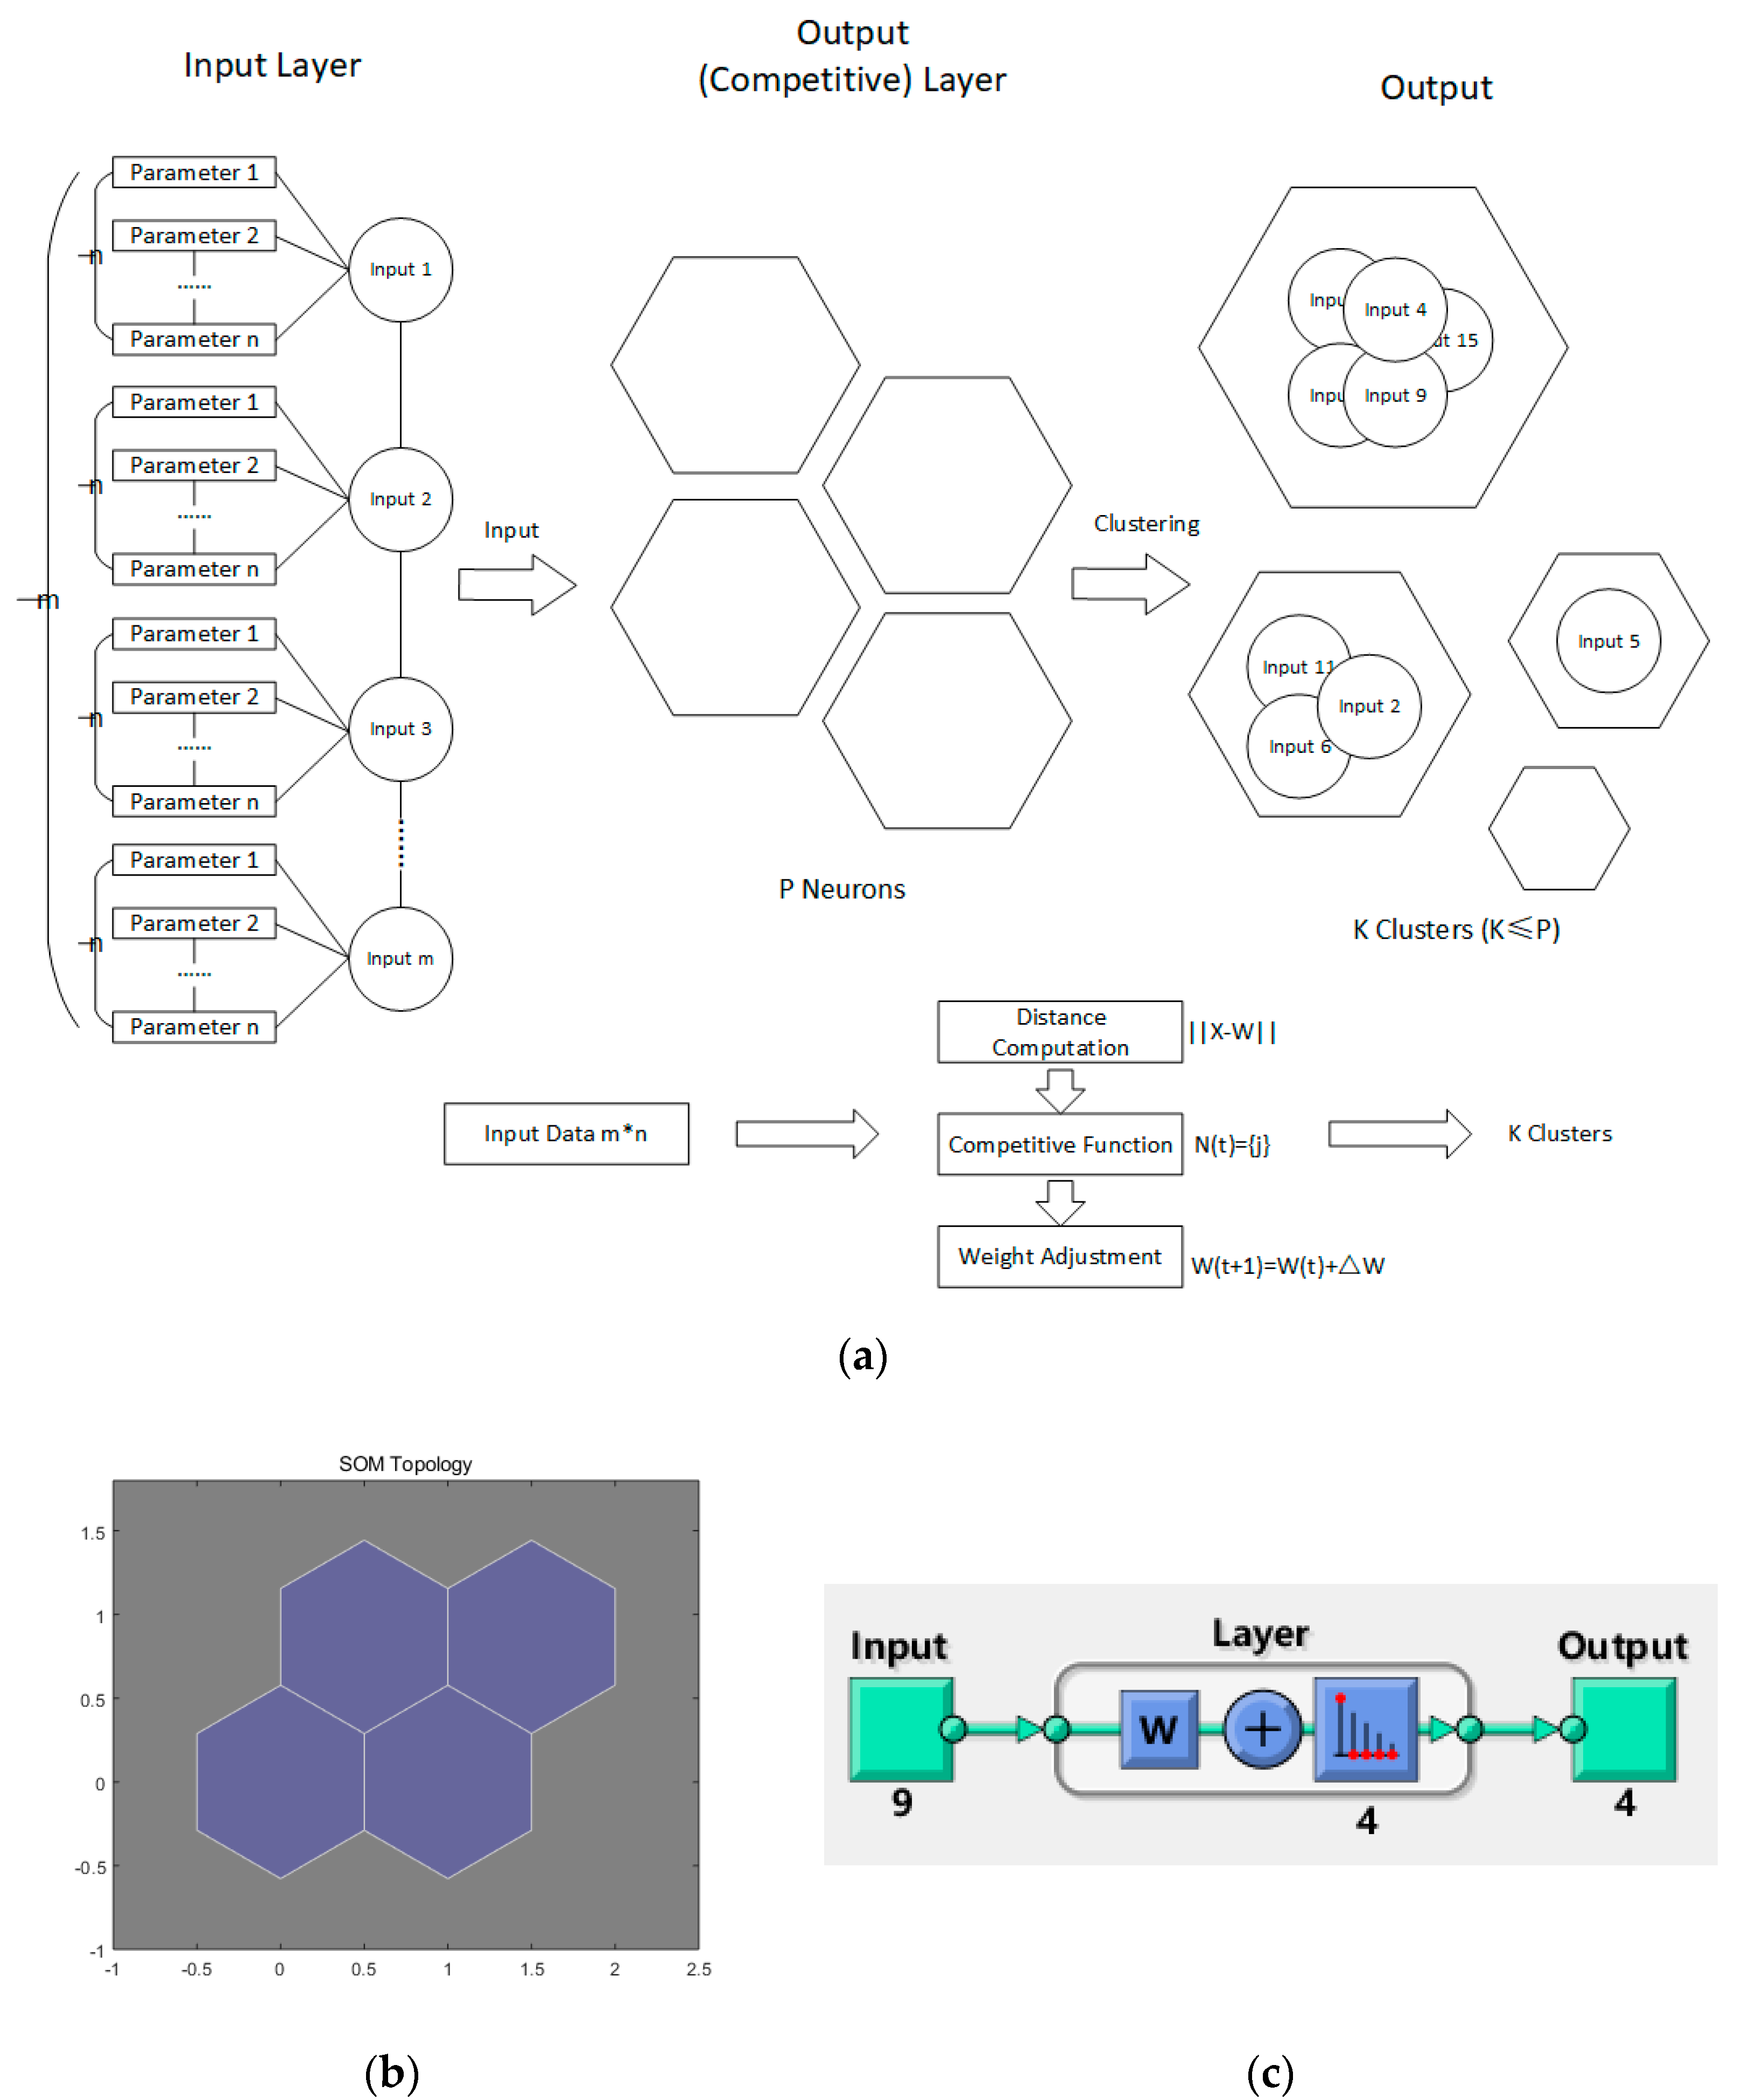
The structure of a SOM neural network is shown in
Figure 3. It consists of an input layer and output layer (competition layer). The number of neurons in the input layer is determined by the number of vectors in the input network, and the output layer is arranged into a two-dimensional node matrix by neurons. The neurons in the input layer and the neurons in the output layer are fully connected by weights
. When the network receives the external input signal, the neurons in the output layer excite and distribute the neurons in the region with the highest input spatial density through competition.
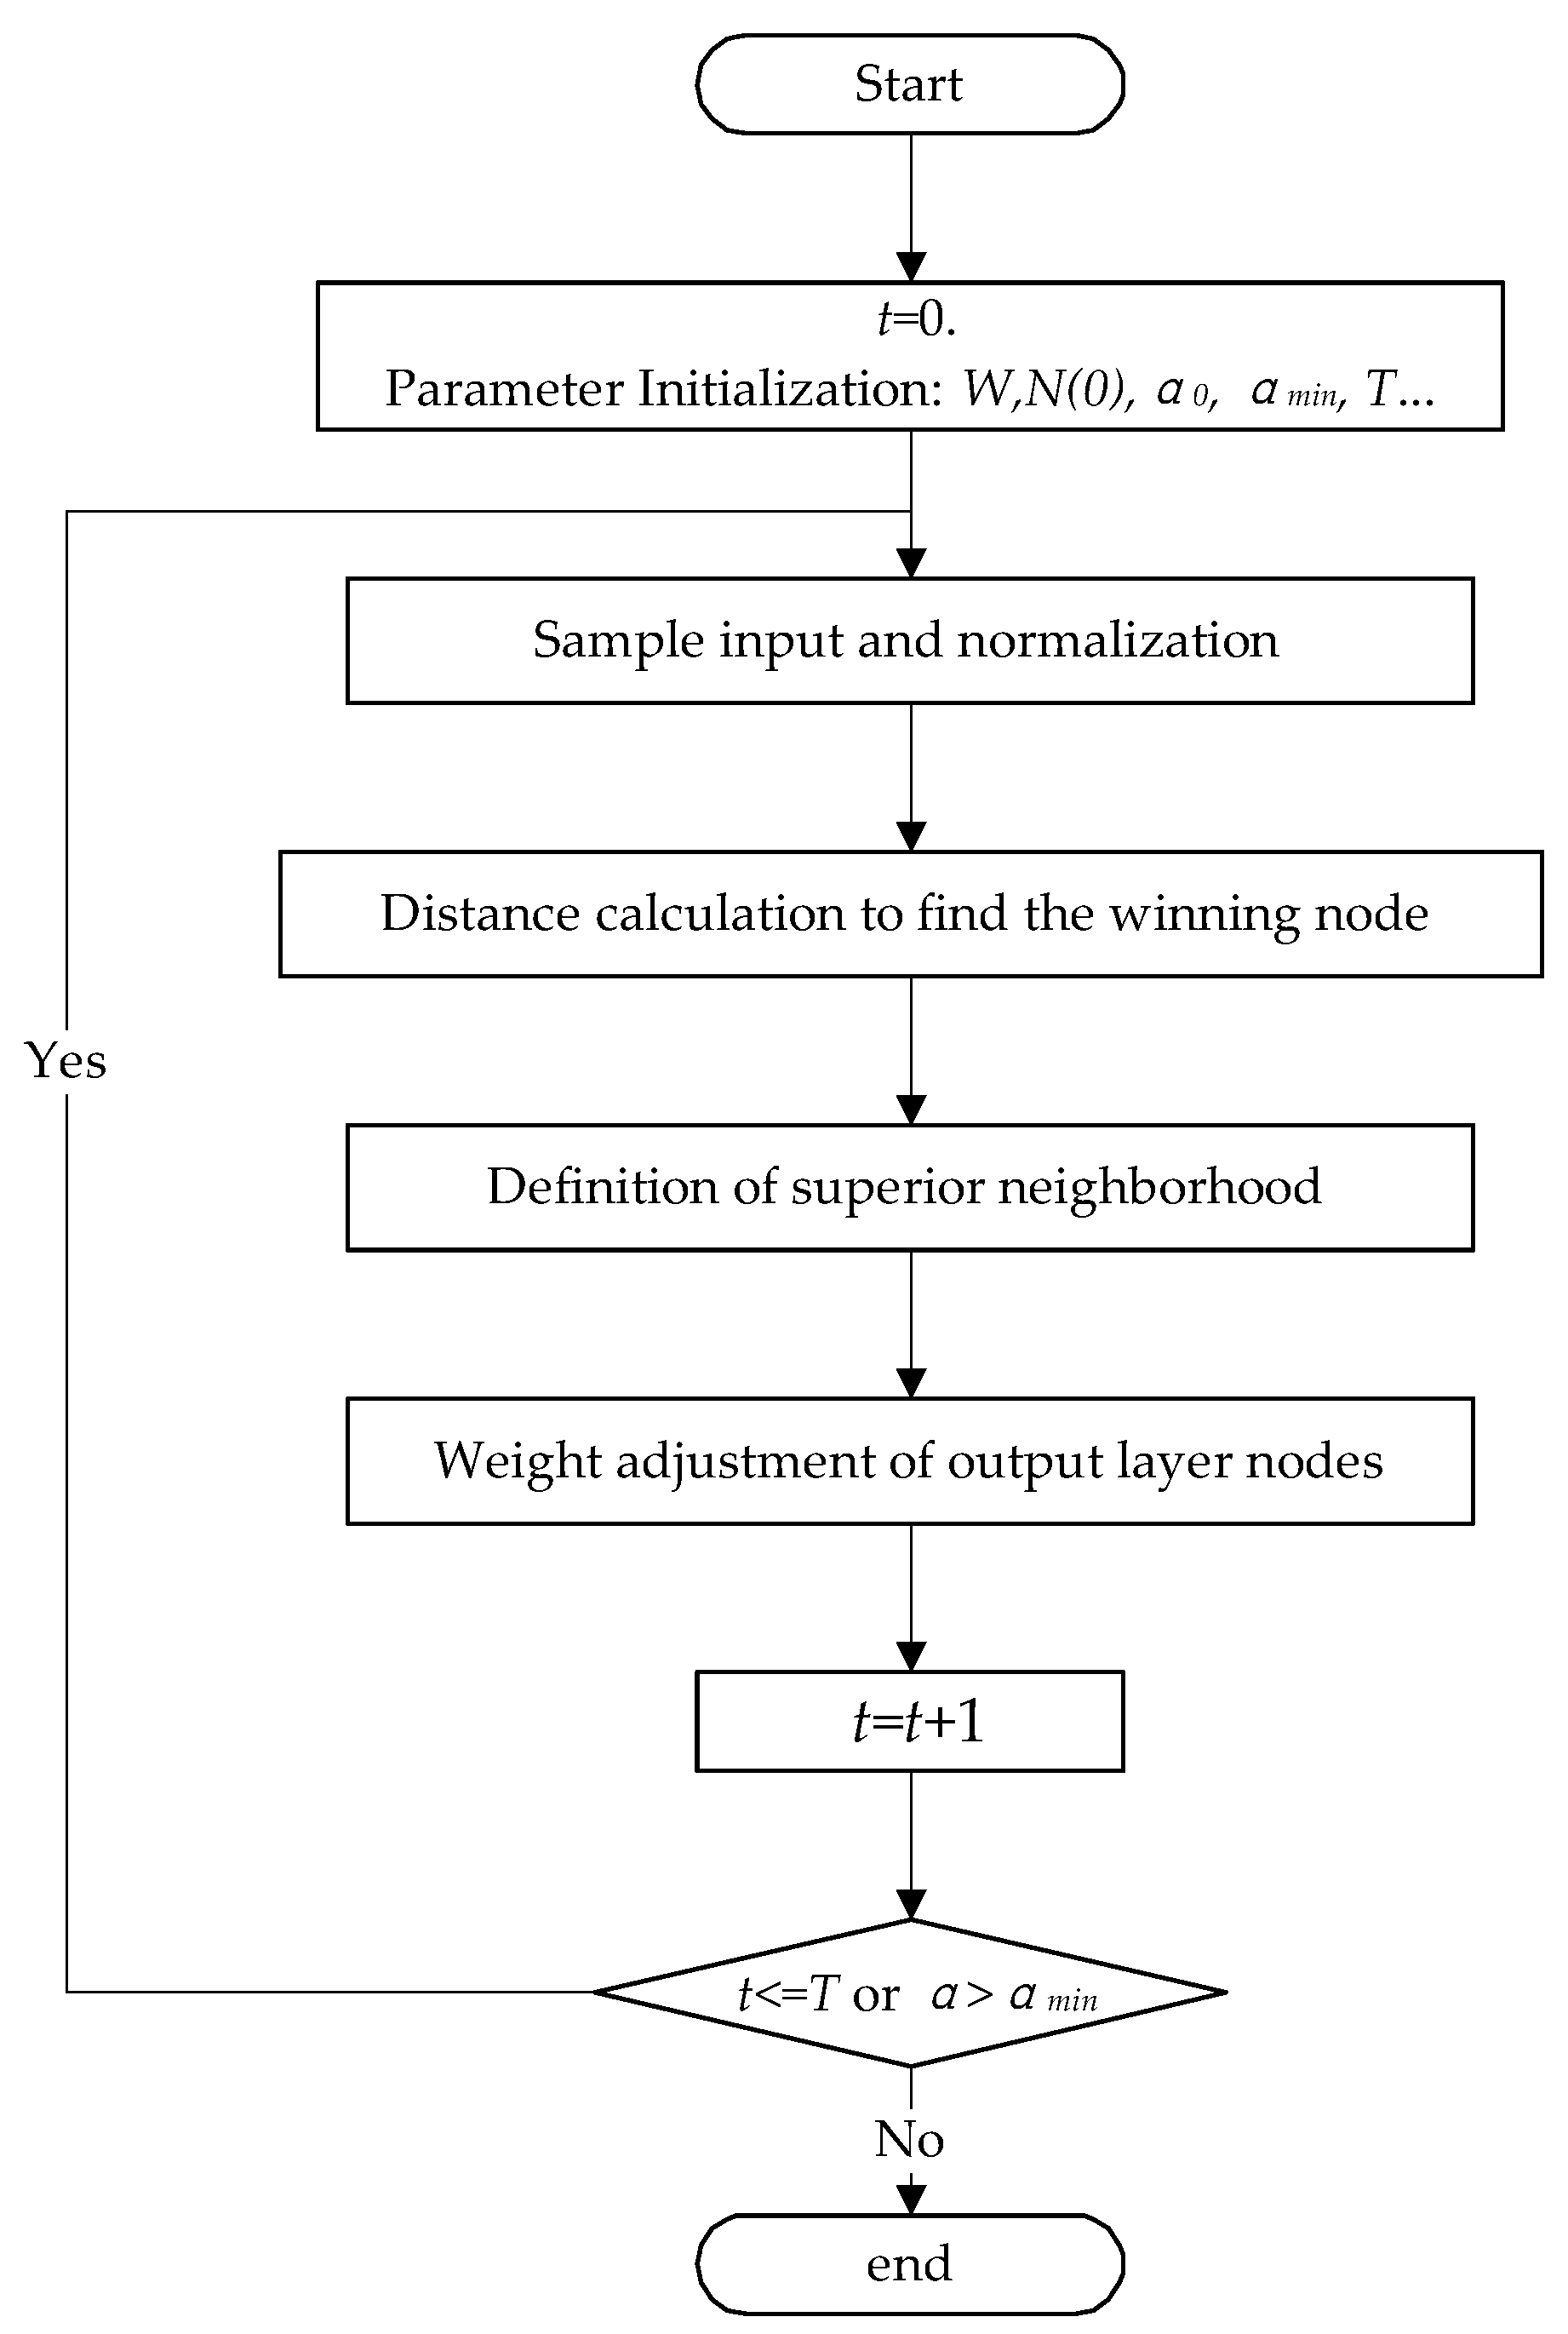
A SOM is a competitive neural network, which follows the rules of competitive learning (referring to lateral inhibition of neurons in human brain). For all neurons in the output layer (competitive layer), the winner neurons are found according to the principle of minimum distance, then only the winner neurons and the neurons in the winning neighborhood are adjusted by the weight vector. Based on the WTA (winner-takes-all) rule, the specific algorithm steps of the SOM are as follows:
Step 1: Data initialization. The weight vectors of the output layer are given smaller random numbers and normalized, which are recorded as , is number of neurons in the output layer. The initial optimal neighborhood is established as , and the initial value of learning efficiency and the number of iterations are set.
Step 2: Input data and normalize. Normalize the input vector
and the weight vector
in the competition layer as shown in Equation (8), where n is the dimension of the input data.
The normalized input vector is denoted as , where is the dimension of the input data.
Step 3: Find the winning node. Calculate the distance between input
and all output neurons, and select the winning neuron with the smallest distance. Euclidean distance is chosen for distance formula, as shown in Equation (9). Set the winning node as the center and determine the weight adjustment region at t-time. Setting the neighborhood distance d, the region within the D range of the distance from the winning node is regarded as the winning neighborhood.
Step 4: Definition of superior neighborhood. Taking the winning node
as the center, the weight adjustment region of
time is determined. Setting the neighborhood distance
, the region within the
range of the distance from the winning node is regarded as the winning neighborhood.
Step 5: Weight adjustment. Based on the gradient descent method, the connection weights between the winning node and all other nodes in the winning neighborhood are adjusted. Equation (11) indicates the adjustment process as follows:
where,
denotes the weight of neuron
to neuron
at
time;
denotes the learning rate, which affects the convergence and stability of the algorithm and decreases with time;
denotes the topological distance between the
neuron and the winning neuron
in the neighborhood at training time
.
Step 6: End Judgment: When the learning rate , or iterations , the training process is terminated, otherwise return back to Step 2 and continue the iteration.
The advantages of SOM unsupervised learning and visualization of results enable it to be well applied in clustering analysis, as well as in lithium cell sorting.
3.3. SOM Clustering in Battery Sorting
The SOM is able to map any high-dimensional inputs to low-dimensional outputs, such as one-dimensional linear array or two-dimensional grid. Therefore, this feature of the algorithm provides the possibility of sorting battery cells from raw cell groups according to single or multiple parameters or characteristics. As aforementioned in
Section 2, multiple parameters tested by testing equipment in a production line are obtained, and they can be regarded as input data. The output layer of the SOM map shows the sorting types each cell belongs to.
Nine parameters are tested including mass, voltage, impedance and parameters data. These are pre-processed using PCA and transformed to three components in
Section 2. These parameters are used as inputs of the SOM neural network for battery cell sorting and the results of classification are the output.
This study uses a SOM neural network to sort battery cells. The data of
battery cells with
parameters are input in the form of matrix of
, and finally the cells are classified into
classes. The learning rate
and neighborhood radius
of the network are updated in the way shown in Equations (12) and (13), respectively.
where,
means the maximum numbers of iteration.
and
are the initial learning rate and winning neighborhood radius respectively, and these two parameters decrease with time.
Figure 4 demonstrates the process of battery sorting using SOM in this study and the specific operation will be introduced in next section.
4. Cell Sorting Using a SOM
As described in
Section 2, the vector of nine parameters is considered as input for SOM neural network clustering. We tested 58 battery cells and recorded nine parameters of each cell. The input of the SOM is the parameter matrix with 58 × 9. After PCA, in order to reduce the data dimension, the matrix can be transformed to 58 × 3 as the nine parameters are replaced with the three principle components. Therefore, the first group of input data including nine parameters is marked as Group 1, and the second group of input data including three principle components is marked as Group 2.
Table 4 denotes part of the input data (eight cells).
This section compiles the algorithm of a SOM neural network and sets its initial algorithm parameters by using the Neural Network Toolbox in MATLAB. The initial number of neurons in the output layer, is set to four, as shown in
Figure 5.
Figure 6 shows the SOM clustering results of Group 1 and Group 2. In both sets of cells, eight battery cells are clearly separated from the whole ones, which means that these eight cells are different from the others.
The same procedure using a SOM is carried out to obtain the sorting results from the remaining 50 battery cells and the number of sorting is adjusted to six, as shown in
Figure 7. Six groups are obtained after being classified.
Table 5 shows the categories of 50 numbered batteries based on the SOM clustering results, both in Group 1 and Group 2.
It can be noted that the sorting result of Group 2 is basically coincident with Group 1, which means SOM sorting, using the three principle components obtained from nine parameters after PCA, is feasible. Consequently, pretreatment of PCA is also a workable method when the sorting batteries have multiple dimension parameters. It also effectively reduces the workload of the subsequent scoring algorithm such as SOM. According to the classification results, eight batteries with good consistency (i.e., classified into the same category) can be selected from each group to form a module. This result will be validated by experiments in the next section.
5. Verification for Sorting Results
In response to different operating conditions, the SOC of lithium-ion batteries will vary with the voltage and current. Despite of their different dynamic responses, battery cells with good consistency should have less SOC variation differences. Therefore, two typical power load profiles of electric vehicles, the New European Driving Cycle (NEDC) and the Urban Dynamo-meter Driving Schedule (UDDS), shown in
Figure 8, are chosen to test the battery modules sorted and formed from
Section 4. The changes of the SOC curve and differences in the module under working conditions are recorded and calculated in the module under working conditions to test the clustering algorithm.
Eight battery cells of Module 1 and Module 2 are chosen from the same categories of Group 1 and Group 2 in
Section 4, respectively. Eight cells (No. 3, 4, 5, 6, 9, 13, 16, 23), which are all classified to category 2 in Group 1, are connected in series to form Module 1. The same procedure is carried out to category 1 in Group 2, so that eight cells (No. 2, 7, 15, 21, 22, 34, 35, 36) are connected in series to form Module 2. For validation of consistency, another eight cells are chosen randomly from the whole cell stack to form Module 3. To ensure the randomness of the selection of the eight batteries, one cell is selected from each seven cells according to number order, which means the first cell is selected from No.1 to No.7 randomly, the second cell is selected from No. 8 to No. 14 and so on. The final number of these eight cells in Module 3 are: No. 1, 8, 17, 26, 32, 37, 45, 54.
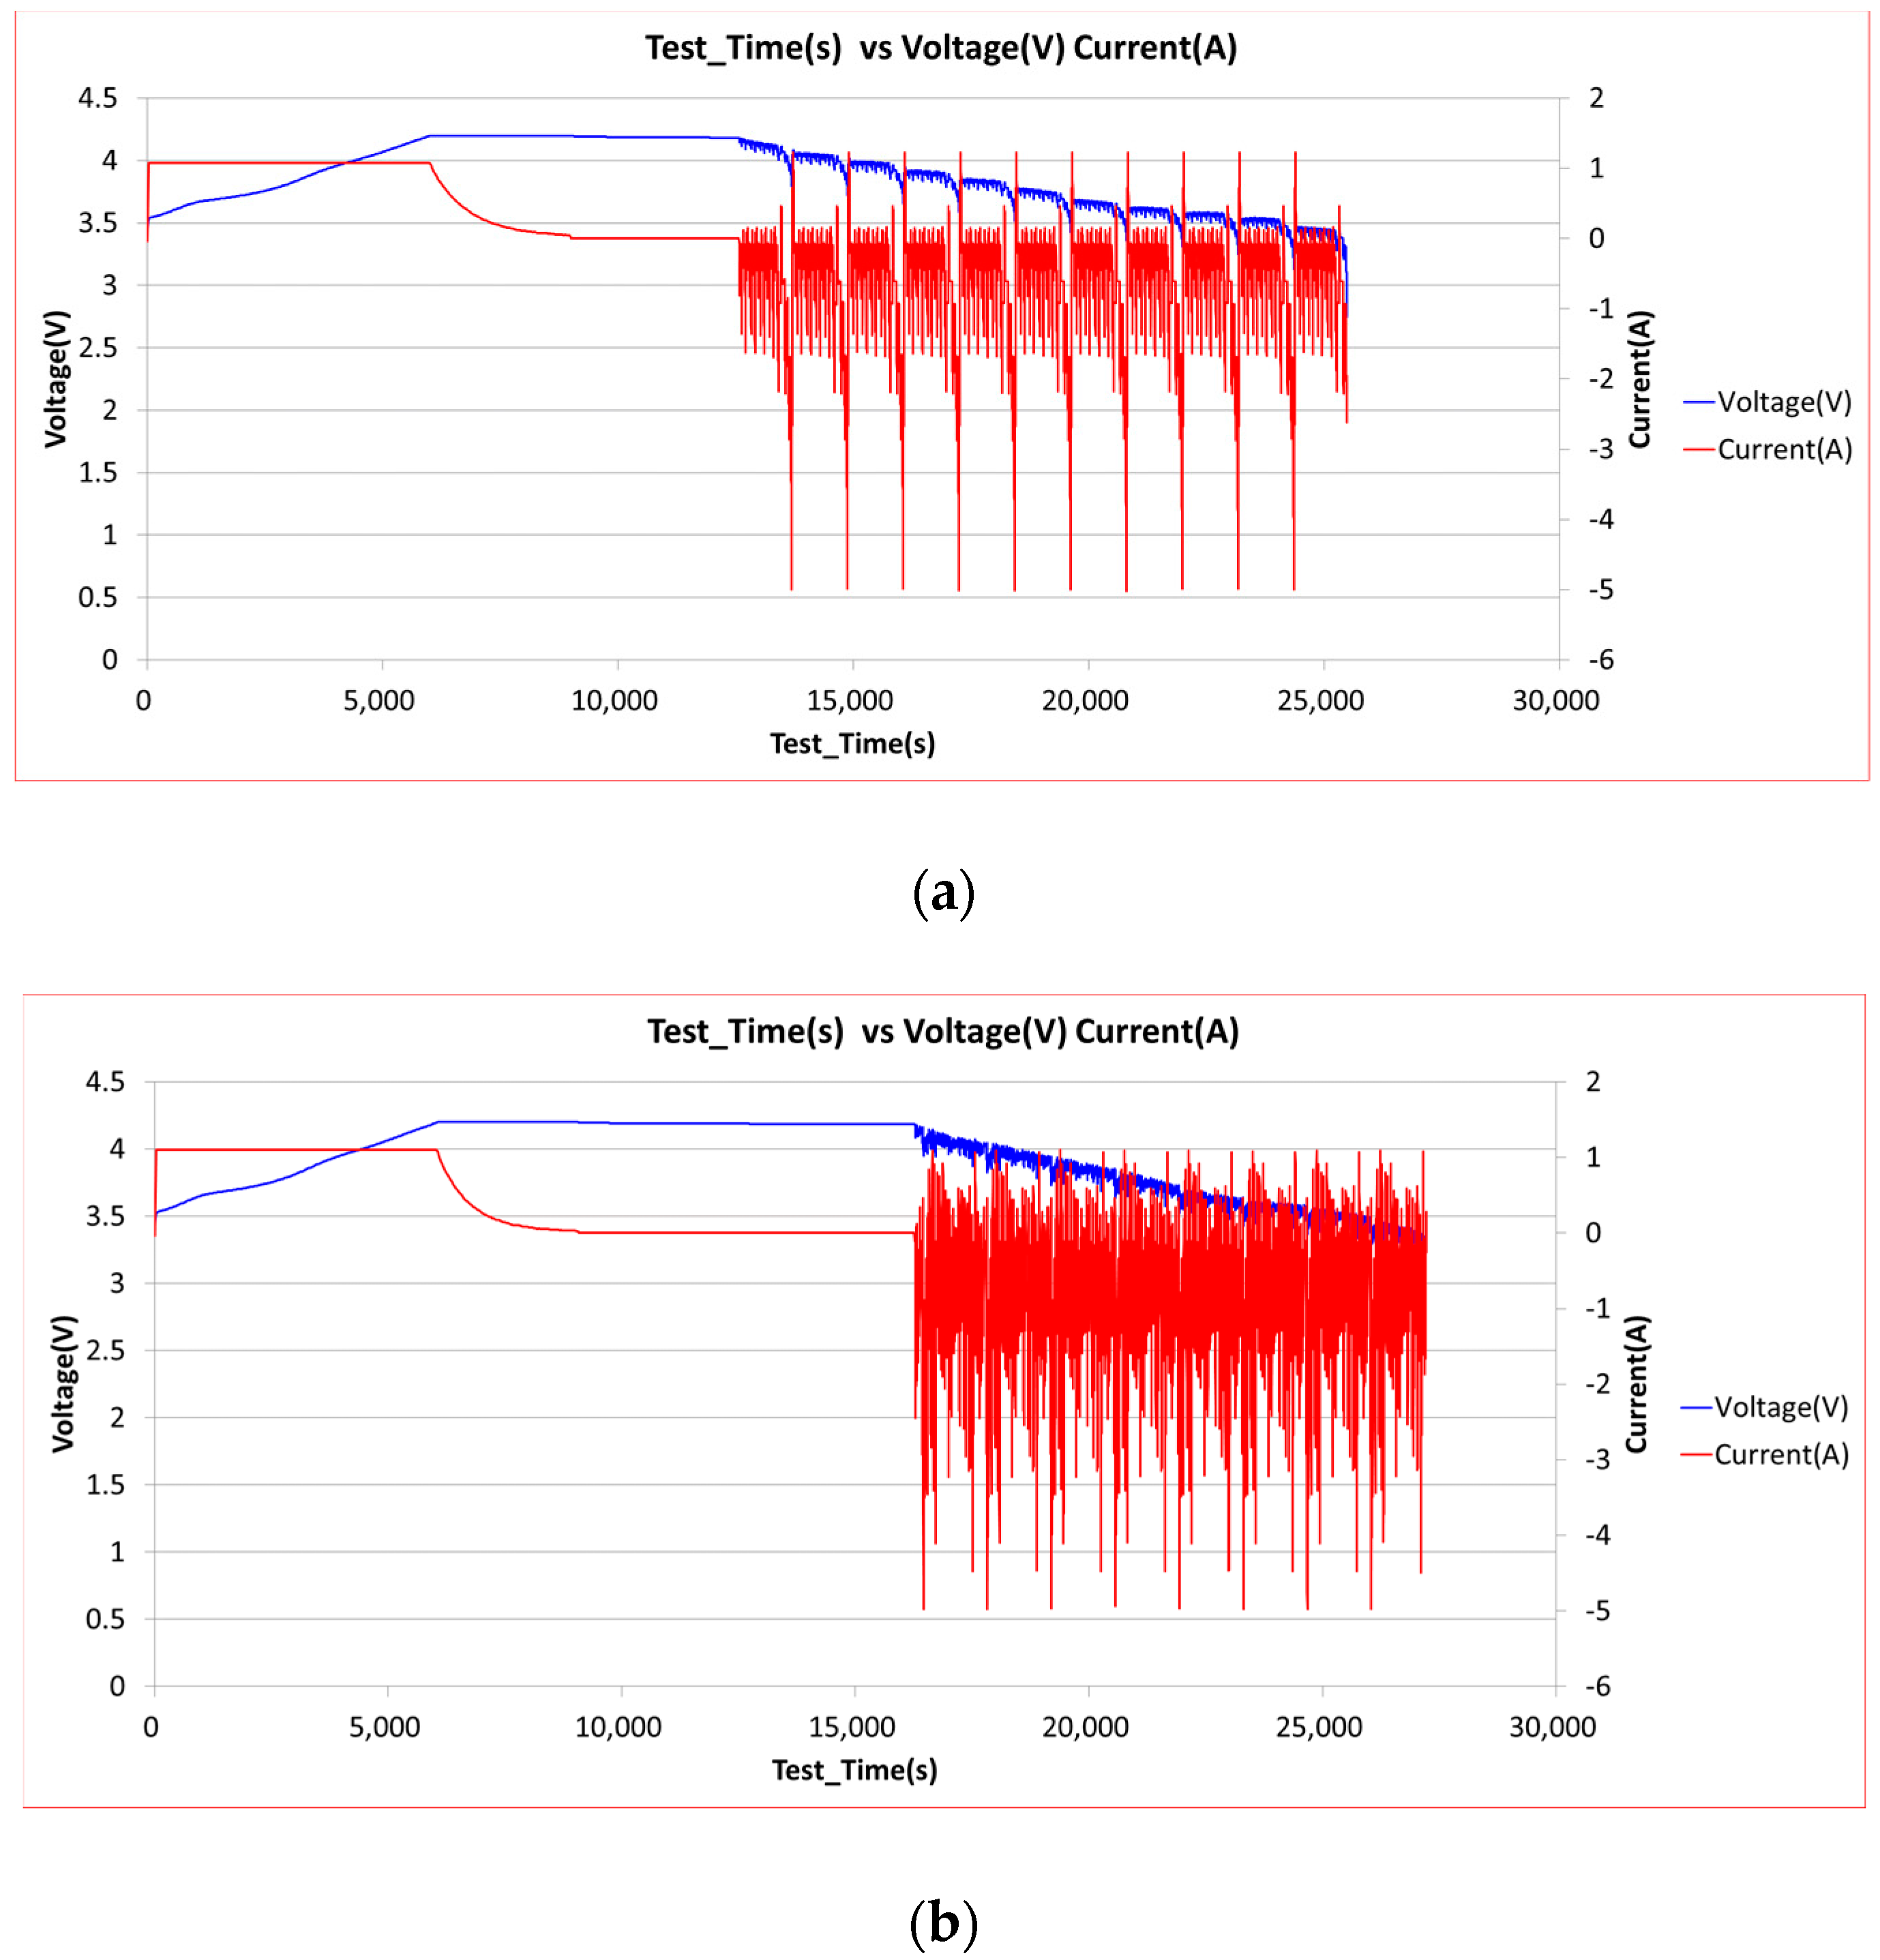
The battery module is charged and discharged using battery charging and discharging equipment under the working conditions shown in
Figure 8, and the current and voltage changes of each battery are recorded.
The main result of battery module inconsistency is that the state of charge (SOC) of each cell is not uniform, but differs from one another, because every cell is different in available capacity, dynamics, and imbalance of the individual cells in a series or parallel chain. So, the SOC curve and variability can be used to determine whether the battery module has good consistency or not. Currently, a lot of research has been done on the estimation methods of SOC. Among them, the most typical methods are the time integration method, open-circuit voltage method and Kalman filter method. In this section, extended Kalman filtering (EKF) [
23,
24] is used to estimate SOC change under two working conditions.
The Kalman filter is a common algorithm in SOC estimation. It can realize the optimal estimation of the state of a discrete-time linear system based on the minimum mean square error. The Kalman filter method mainly includes two parts: prediction and correction. The prediction process refers to updating the state estimates at the last time based on the state equation obtained from the battery model. The correction process is to update the state predicted value, according to the observed value obtained from the test. The extended Kalman filter (EKF) is based on the Kalman filter, which expands the non-linear function of the system into a Taylor expansion of the first order, and obtains the linearized system equation to complete the filtering and estimation of the state parameters.
In this study, EKF is one of the SOC estimation methods used for example, so the specific process of EKF is not discussed here.
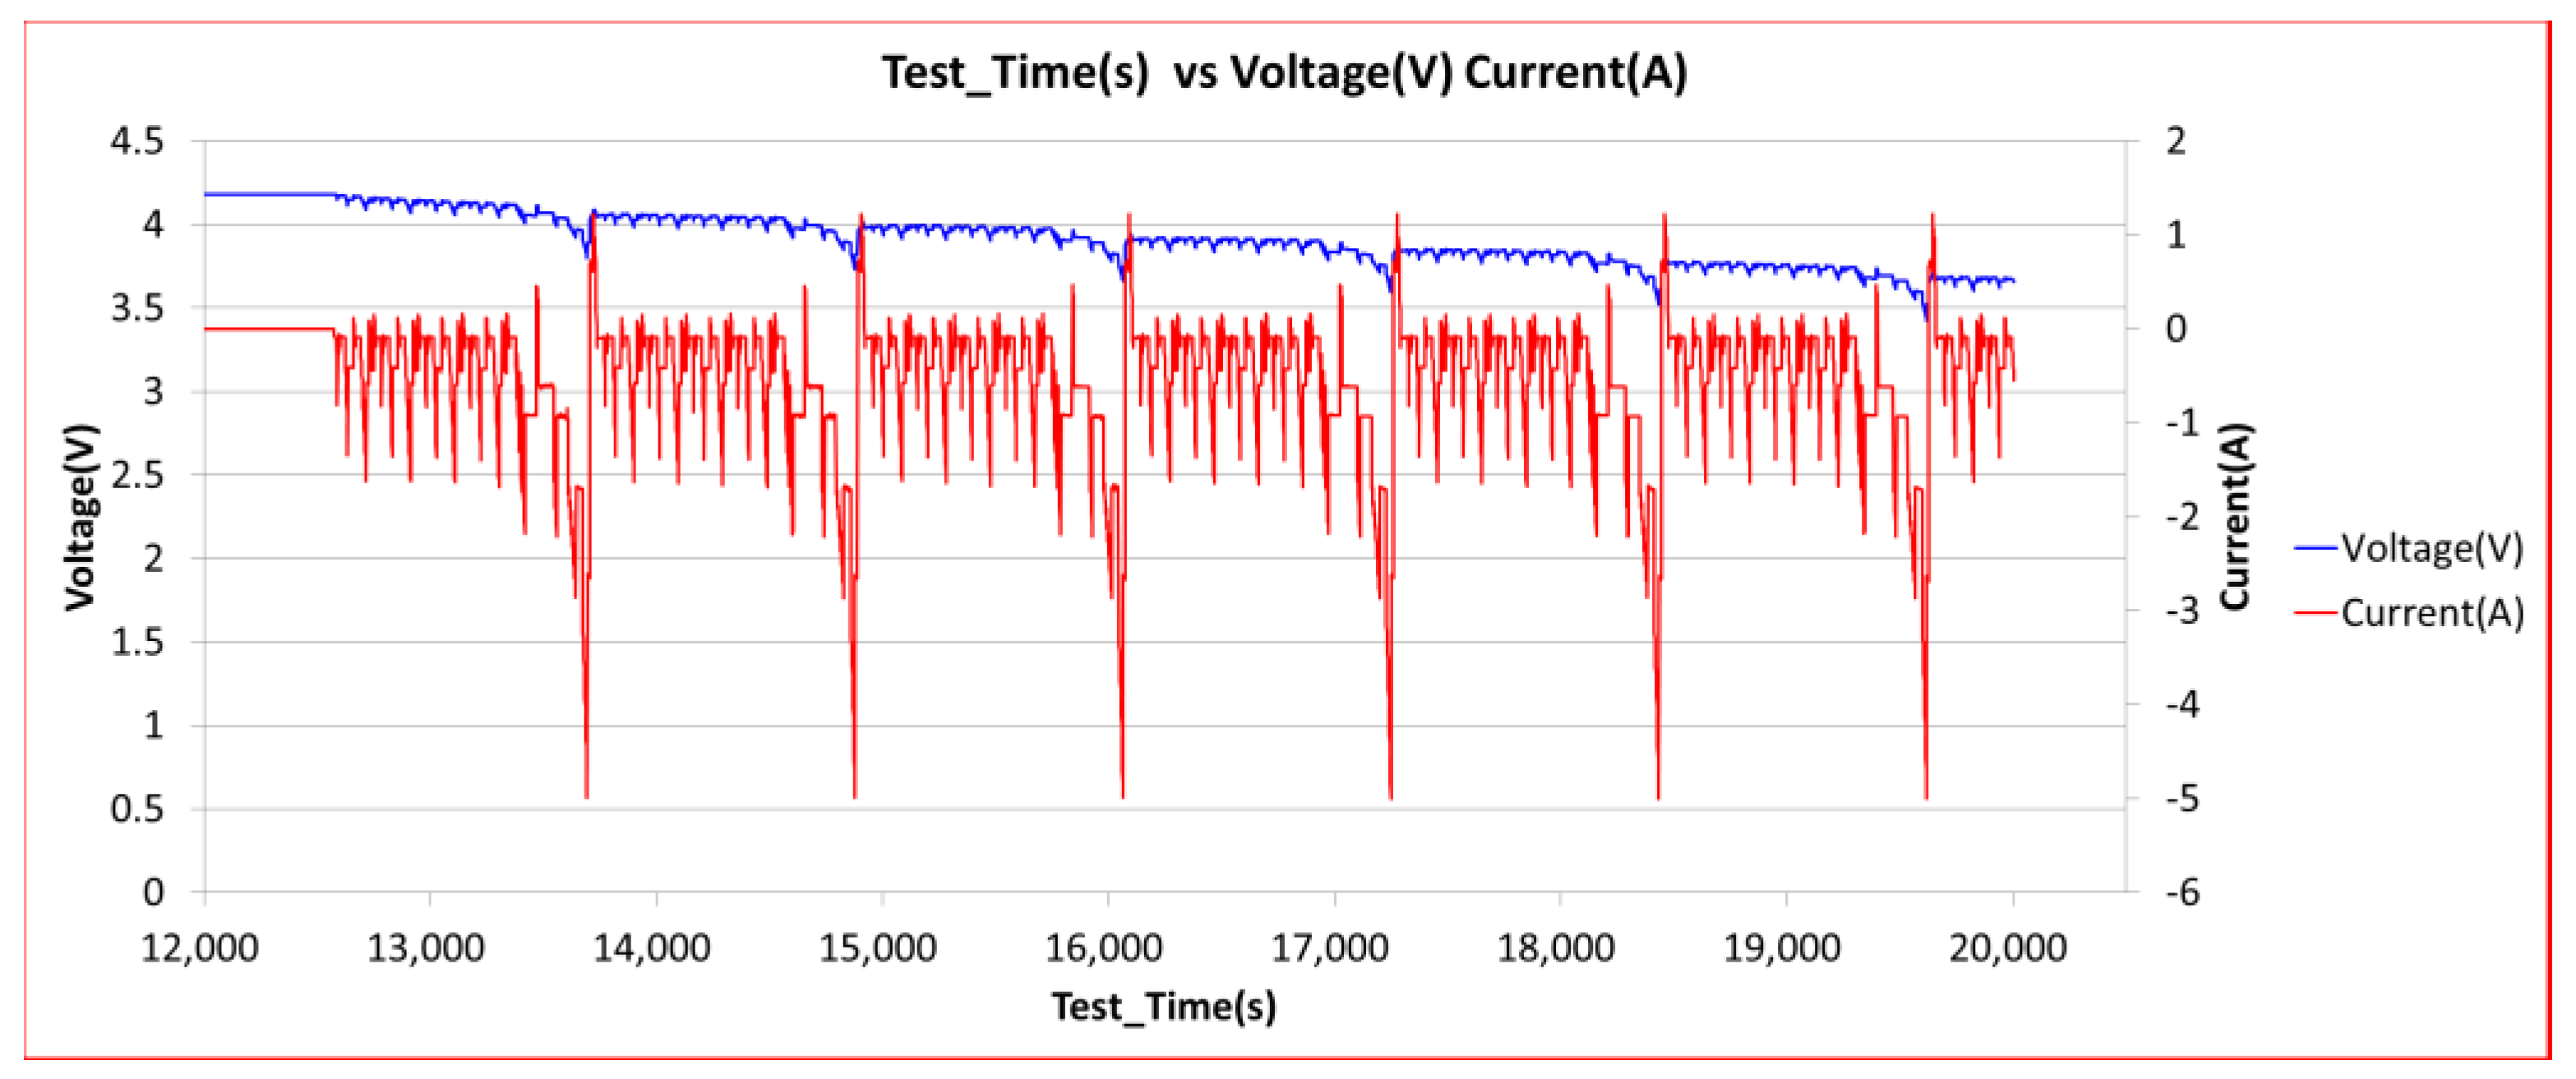
In order to save time, a section of NEDC working conditions is selected as shown in
Figure 9.
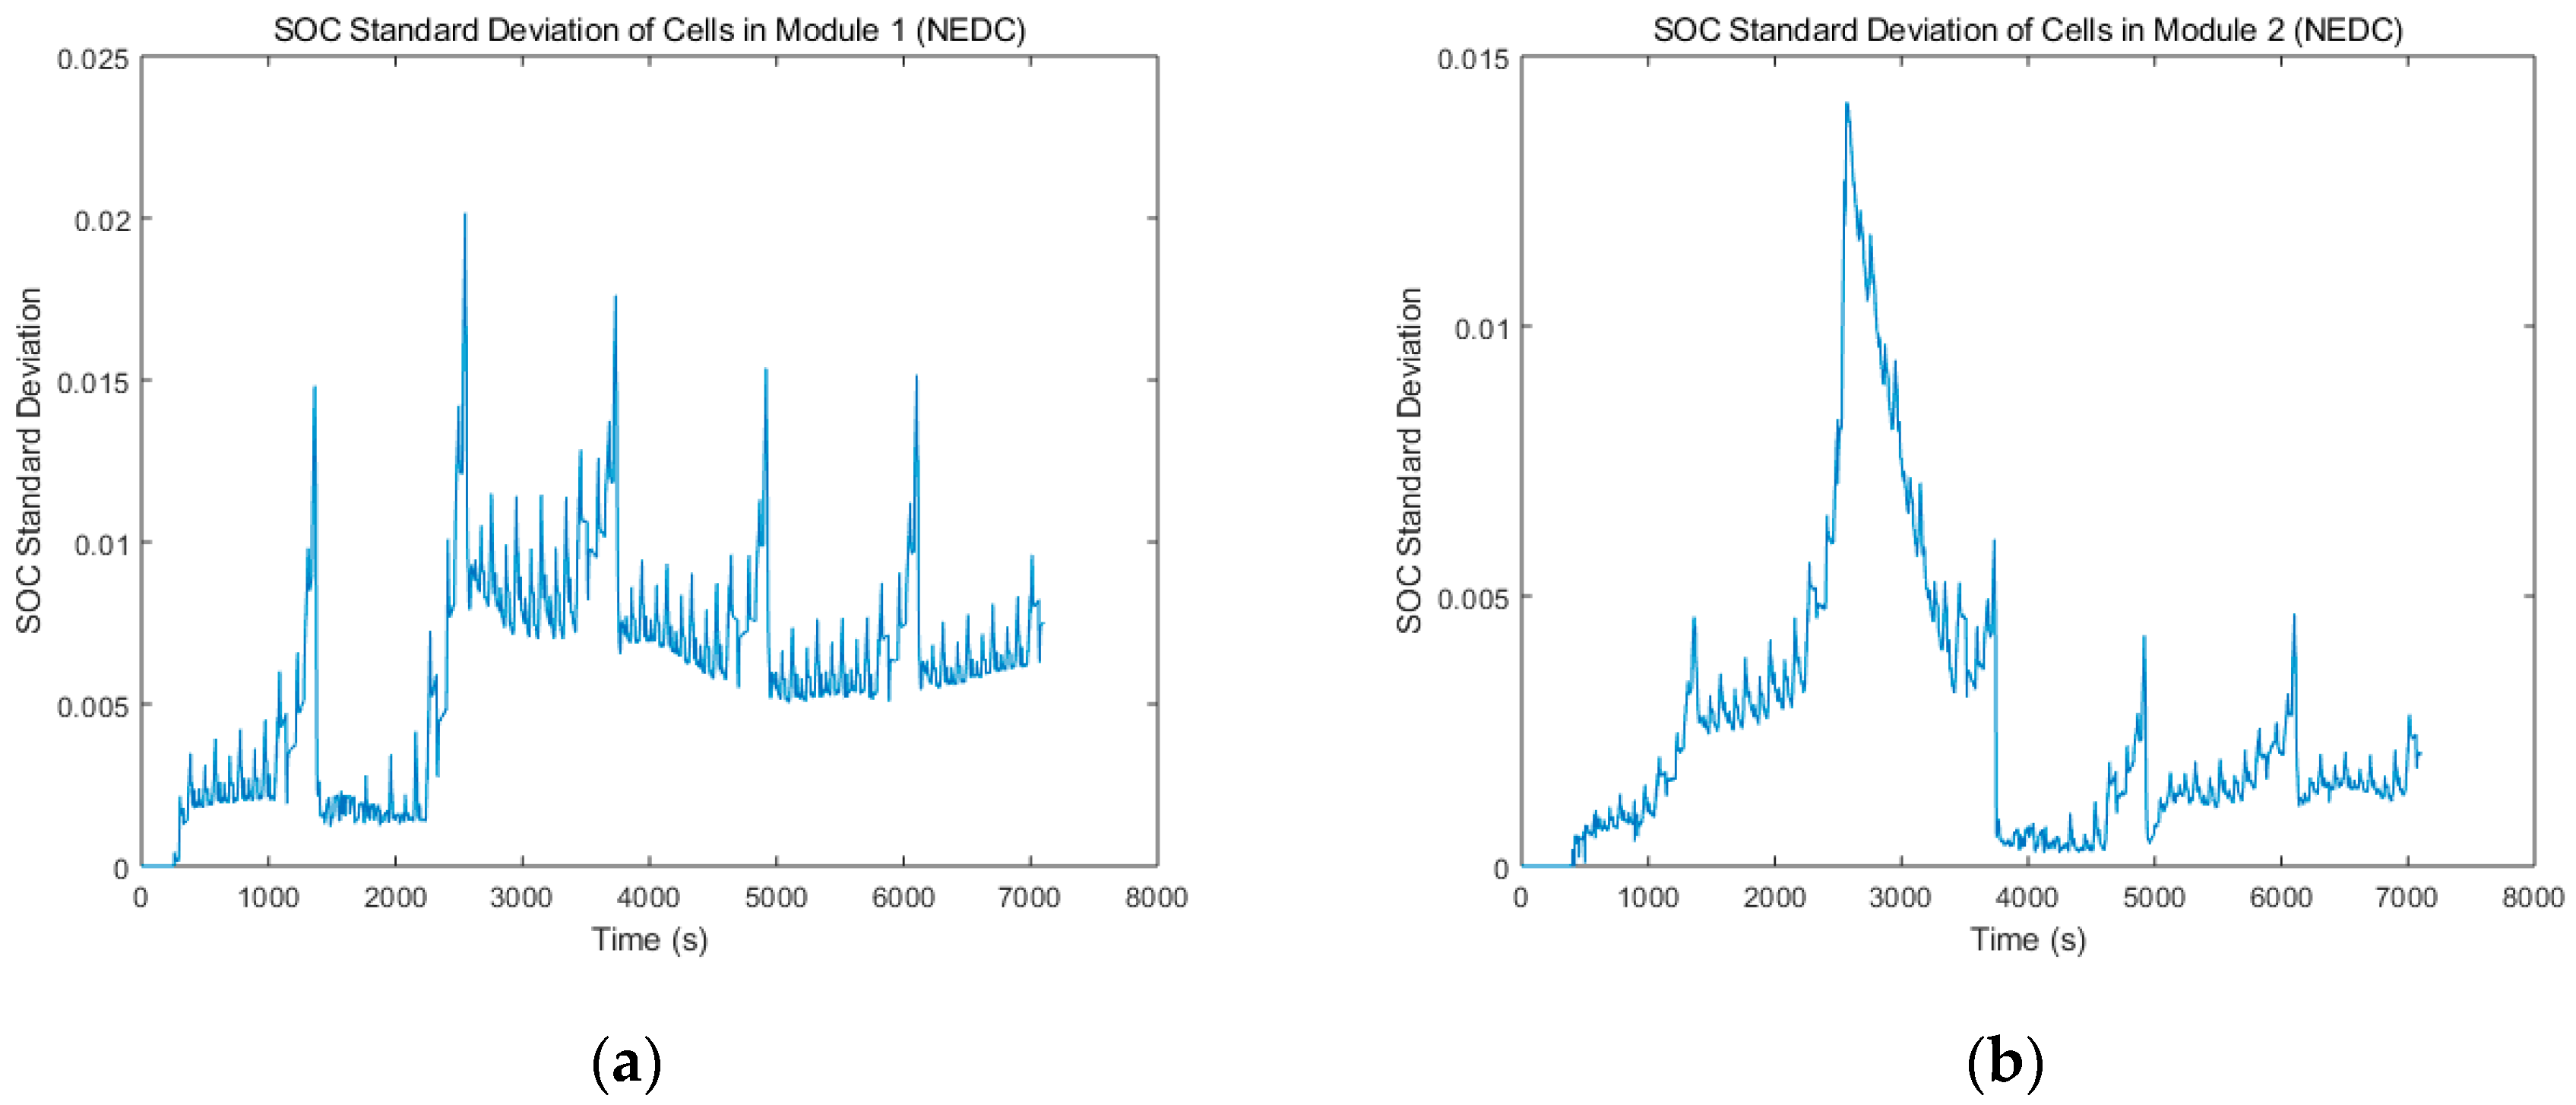
Figure 10 shows the SOC of these three modules subject to the power profile of the NEDC working conditions shown above. The SOC in the battery module appears as a consistent trend over time, but the SOC between each cell at the same time is clearly different, especially in different modules. The curves of cells in Module 1 and Module 2 have relatively better consistency, while in Module 3 the difference between the SOC of batteries increases obviously, showing that cells after clustering and sorting have better homogeneity than those chosen randomly.
The same validation procedure is performed under UDDS working conditions to verify the SOC changes in battery modules. The standard deviation of the SOC after load profile of
Figure 11 is chosen as another testing criterion.
Figure 11, and
Table 6 and
Table 7 illustrate the standard deviation of state of charge of these cells in respective modules.
The results clearly show a reduction in the SOC variability after power profile charge and discharge. The SOC standard deviation of Module 1 or Module 2 is notably lighter than that of Module 3, which means there is a significant improvement in the consistency of the battery module.
At the same time, it can be seen that the standard deviation of Module 2 is slightly less than Module 1, indicating the clustering based on PCA gives the best results overall.

 ,
, 


