Article

DBSCAN-Based Thermal Runaway Diagnosis of Battery Systems for Electric Vehicles

1
National Engineering Laboratory for Electric Vehicles, Beijing Institute of Technology, Beijing 100081, China
2
Collaborative Innovation Center of Electric Vehicles in Beijing, Beijing 100081, China
3
Beijing BITNEI Corp., Ltd, Beijing 100081, China
*
Authors to whom correspondence should be addressed.
Energies 2019, 12(15), 2977; https://doi.org/10.3390/en12152977
Submission received: 4 June 2019 / Revised: 24 July 2019 / Accepted: 28 July 2019 / Published: 1 August 2019
(This article belongs to the Section E: Electric Vehicles)

Abstract

:
Battery system diagnosis and prognosis are essential for ensuring the safe operation of electric vehicles (EVs). This paper proposes a diagnosis method of thermal runaway for ternary lithium-ion battery systems based on the Density-Based Spatial Clustering of Applications with Noise (DBSCAN) clustering. Two-dimensional fault characteristics are first extracted according to battery voltage, and DBSCAN clustering is used to diagnose the potential thermal runaway cells (PTRC). The periodic risk assessing strategy is put forward to evaluate the fault risk of battery cells. The feasibility, reliability, stability, necessity, and robustness of the proposed algorithm are analyzed, and its effectiveness is verified based on datasets collected from real-world operating electric vehicles. The results show that the proposed method can accurately predict the locations of PTRC in the battery pack a few days before the thermal runaway occurrence.

1. Introduction

In order to cope with the issues of fossil oil depletion and environmental pollution, electric vehicles (EVs) are being actively developed and incrementally deployed worldwide [1]. Battery systems play a vital role in determining the driving performance and cost-effectiveness of EVs [2]. There are several battery types available; lithium-ion batteries dominate the use in EVs due to their merits of highly specific energy and power, no memory effect and long service life [3]. Despite the fact that substantial improvements have been achieved in past decades regarding energy density and service life, the safety issue still remains unsolved and has been the focus of intensive research [4,5]. There have been a considerable number of fatal fire accidents occurring worldwide, and thermal runaway has been identified as the main culprit. Accurate and timely thermal runaway event diagnosis is essential for preventing thermal runaway occurrence and ensuring the safety of passengers.
Tremendous efforts have been directed to exploring the internal reaction mechanisms and external characteristics of batteries during thermal runaway process as well as to developing models and enabling methods for thermal runaway mitigation. In order to understand the process and to ascertain the cause of thermal runaway, the evolutions of temperature, voltage and gas composition during thermal runaway are analyzed. For example, Melcher et al. [6] gained a better understanding of the temperature increase process within the battery cell considering different heat sources under specified working conditions and found out the triggering condition of thermal runaway. Similarly, Koch et al. [7] analyzed the composition and amount of gases generated during thermal runaway. Abada et al. [8] studied the evolution of voltage and temperature during the thermal runaway process by combining experiments and models. Other researchers explored the thermal runaway phenomenon under the conditions of overcharging and over-discharging. For instance, Ouyang et al. [9] studied the thermal behavior of lithium-ion batteries during overcharge and over-discharge, and found a peak voltage of 5.4 V before thermal runaway occurrence [10]. However, these studies invariably focused on finding out the external characteristics of thermal runaway yet failed to reveal the underlying mechanisms. To cope with this issue, the heat generation mechanism of batteries is investigated, and accordingly, electrochemical-thermal models are often synthesized for thermal runaway behavior prediction. For instance, Ren et al. [11] established an electrochemical-thermal coupled model for overcharge-induced thermal runaway prediction. Analogously, Qi et al. [12] established a mathematical model to depict the voltage and temperature evolutions of lithium-ion batteries during overcharging. Chen et al. [13] developed a coupled electro-thermal runaway model using finite element methods. Seo et al. [14] proposed a model-based switching model method (SMM) to detect the short circuit in lithium-ion batteries. These models could reveal the details of the thermal runaway process, but were insufficient to predict the thermal runaway occurrence. In order to predict thermal runaway occurrence, Feng et al. [15] explored the correlation between the measured voltage, current, temperature and internal short-circuit (ISC) status using a 3D electrochemical-thermal-ISC coupled model, and proposed a scheme for on-line detection of internal short-circuit. In general, the above mentioned methods can diagnose abnormal battery states through measuring voltage, temperature and other characteristic parameters in the laboratory environment. However, during the real-world operation of EVs, the characteristics of battery systems are affected by various factors such as driving conditions, driver’s behaviors, and battery aging levels. These may significantly curtail the performance of laboratory-synthesized approaches for thermal runaway prediction [16].
The development of artificial intelligence (AI) provides enormous opportunities for uncovering the underlying mechanisms of battery failures and abnormal states [17,18]. Some scholars have researched the battery temperature data and proposed some algorithms for battery fault diagnosis. For example, Panchal et al. [19] collected real-world driving cycle data under different modes and temperatures to predict battery capacity fade level. Data-driven-based state of health (SOH) prognostics methods have also been documented in the literature. For example, You et al. [20] presented a data-driven approach to trace battery SOH evolution based on the historical datasets of current, voltage and temperature. Sun et al. [21] developed a health auxiliary diagnosis method based on the Sample Entropy for a lead-acid battery module. Nevertheless, the existence of the short pulse time rendered it incapable of directly estimating the residual capacity of batteries. Widodo et al. [22] utilized the support vector machine (SVM) and relevance vector machine (RVM) to predict battery SOH. Although the battery capacity value can be estimated, the computational efficiency is rather low. In order to discover the long-term potential failures of batteries, some scholars presented some voltage-based battery fault prognosis methods. For instance, Yao et al. [23] conducted an experiment to get battery voltage and used the ensemble Shannon entropy to predict the connection failure between battery modules within a battery pack. Zhao et al. [24] proposed a fault diagnosis method for electric vehicle battery system based on the statistics method. Abnormal changes in the battery terminal voltage are detected and calculated in the form of a probability. However, cell voltages in the battery pack may not strictly follow the normal distribution, which would markedly compromise the effectiveness of the presented method. Wang et al. [25] proposed a Shannon entropy-based fault diagnosis method. However, the Shannon entropy of battery cells may not strictly follow the normal distribution and the Z score is less than the threshold most of the time, which would obviously reduce the accuracy of the method.
In order to address the above mentioned issues, this article proposes a diagnosis method of thermal runaway for lithium-ion batteries based on Density-Based Spatial Clustering of Applications with Noise (DBSCAN) clustering. Two-dimensional fault characteristics are first extracted according to battery voltage, and the DBSCAN clustering is used to diagnose the potential thermal runaway cells (PTRC). The periodic risk assessing strategy is put forward to evaluate the fault risk of battery cells. The effectiveness of the proposed algorithm is verified based on datasets collected from real-world operating electric vehicles. The innovations and contributions are as follows:
(1)
The sudden and progressive deterioration features of battery are extracted to identify PTRC. Voltage deviation increment (VDI) is used to quantitatively represent the sudden deterioration of battery properties, and cumulative number of deviations (CND) is used to quantitatively represent the long-term accumulative deterioration of battery properties. The two features VDI and CND can achieve accurate fault diagnosis together.
(2)
This paper analyzes a large number of real-world vehicles’ operation data and establishes a novel method for preventing thermal runaway. The fault frequency is set to quantitatively assess the risk of each battery cell.
(3)
This paper applies DBSCAN to battery cell fault diagnosis, and the accuracy of the method is verified by the real-world vehicles’ operation data. The diagnosis method can do well in locating PTRCs in the battery pack a few days before the thermal runaway occurrence.
The remainder of the paper is organized as follows: Section 2 gives a brief introduction of the National Monitoring and Management Center for New Energy Vehicle (NMMCNEV) and acquisition of data. Section 3 introduces the diagnosis method and periodic risk assessing strategy. Section 4 makes the discussion of the fault diagnosis method which contains physical basis, feasibility, stability, reliability, and necessity analysis. Section 5 presents the results of the diagnosis method, followed by conclusions in Section 6.

2. Data Acquisition

The NMMCNEV is responsible for administrative supervision and management of new energy vehicles in China. In order to ensure the reliability and security of data collection and storage, a big data platform was established, which is also able to provide personalized services with advanced data mining techniques. It currently has the service capability for more than 2 million electric vehicles. A schematic illustrating the functionalities of the center is shown in Figure 1.
In this study, the used datasets are collected from 14 electric vehicles with a frequency of 0.1 Hz. Both vehicle 1 and vehicle 2 contain 156 battery cells. Thermal runaway occurred to cell No. 125 in vehicle 1 at 15:20 on 28 August 2018 and to the cells No. 51 and No. 52 in vehicle 2 at 21:00 on 26 July 2018. Different from vehicle 1 and vehicle 2, vehicle 3 and vehicle 4 contain 84 battery cells. Thermal runaway occurred to cell No. 68 in vehicle 3 at 11:11 on 19 March 2019 and to cell No. 82 in vehicle 4 at 13:51 on 30 January 2019. For comparison, the vehicles 5~14 are all in normal operation without any alarm, each containing 96 battery cells.
The batteries of all the vehicles studied in this paper are ternary lithium-ion batteries. The cell layout of the battery pack is shown in Figure 2. Generally, a battery pack comprises of several series-connected battery modules, and each module contains a certain number of series-connected battery cells. It is can be seen in Figure 2 that four modules and three modules are arranged longitudinally and laterally, with the former and the latter respectively containing 24 and 20 batteries. It is worth mentioning that each battery cell is composed of three batteries connected in parallel, and the voltage measurement is installed at each battery cell.

3. Diagnosis Method and Periodic Risk Assessing Strategy

3.1. Diagnosis Method

The DBSCAN is a density-based clustering algorithm proposed by Sander, J. et al. [26] in 1998, which is widely used in the fields of physics [27], computer science [28,29], medicine [30], architecture [31], agriculture [32] and so on. Compared to other clustering methods such as K-means and Gaussian mixtures, the advantages of the DBSCAN method lie in the following aspects: (1) It has better identification capability for abnormal points. (2) Clusters of arbitrary shapes can be formed. (3) There is no requirement of knowing clustering categories in advance. (4) There are no bias for clustering results. Since the DBSCAN clustering method can identify abnormal points in the process of clustering, it is well-suited for fault diagnosis. In addition, the number of clustering categories of fault diagnosis is uncertain: battery cells of a normal vehicle should be clustered into one category, that is, normal category; battery cells of the thermal runaway vehicle should be clustered into two categories, that is, normal category and fault category. The number of cluster categories can be automatically determined by the DBSCAN method based on the density of the points.
If the DBSCAN clustering is implemented based on certain features that can reflect battery performance before thermal runaway occurrence, potential faulty cells can be effectively identified. This paper establishes a battery fault diagnosis method based on the DBSCAN clustering method. The calculation process is as follows:
The voltages of different battery cells at different sampling times constitute the voltage matrix A k × n :
A k × n = ( U 1 , 1 U 1 , n U t , j U k , 1 U k , n )
where n is the number of battery cells; k is the number of rows corresponding to different sampling times; and U t , j ( t = 1 , 2 , , k ; j = 1 , 2 , , n ) is the voltage of the battery cell j at the sampling time of t .
Extract the sub-calculation interval (SCI) C m × n A k × n :
C m × n = ( U 1 , 1 U 1 , n U t , j U m , 1 U m , n )
Calculate the median matrix M m × 1 :
M m × 1 = ( U 1 , m e d i a n U m , m e d i a n )
where U t , m e d i a n ( t = 1 , 2 , , m ) is the median voltage at the sampling time of t .
Calculate the voltage deviation matrix B m × n :
B m × n = C m × n M m × 1 Y 1 × n = ( Δ U 1 , 1 Δ U 1 , n Δ U t , j Δ U m , 1 Δ U m , n )
where Y 1 × n = ( 1 , , 1 ) ; Δ U t , j ( t = 1 , 2 , , m ; j = 1 , 2 , , n ) is the voltage deviation of the battery cell j at the sampling time of t .
Define the voltage deviation increment (VDI) matrix S 1 × n :
S 1 × n = ( s m , 1 , , s m , j )
where s m , j ( j = 1 , 2 , , n ) is the VDI of battery cell j at the sampling time of m . s m , j = t = 1 m | Δ U t , j | .
Define the cumulative number of deviations (CND) matrix N 1 × n :
N 1 × n = ( n m , 1 , , n m , n )
where n m , j ( j = 1 , 2 , , n ) is the CND of the battery cell j at the sampling time of m . n m , j = t = 1 m | z t , j | . If the voltage deviation of the battery cell j exceeds a certain voltage deviation interval (CVDI), z t , j = 1 , otherwise z t , j = 0 .
Define the joint matrix V 2 × n :
V 2 × n = ( N 1 × n S 1 × n )
Cluster all the battery cells in the joint matrix V 2 × n with the DBSCAN clustering method to diagnose the PTRC.

3.2. Periodic Assessment of Fault Risk

In order to achieve online diagnosis of thermal runaway occurrence, the fault matrix F k × n is defined to quantitatively describe the faulty battery cells:
F k × n = ( f 1 , 1 f 1 , n f t , j f k , 1 f k , n )
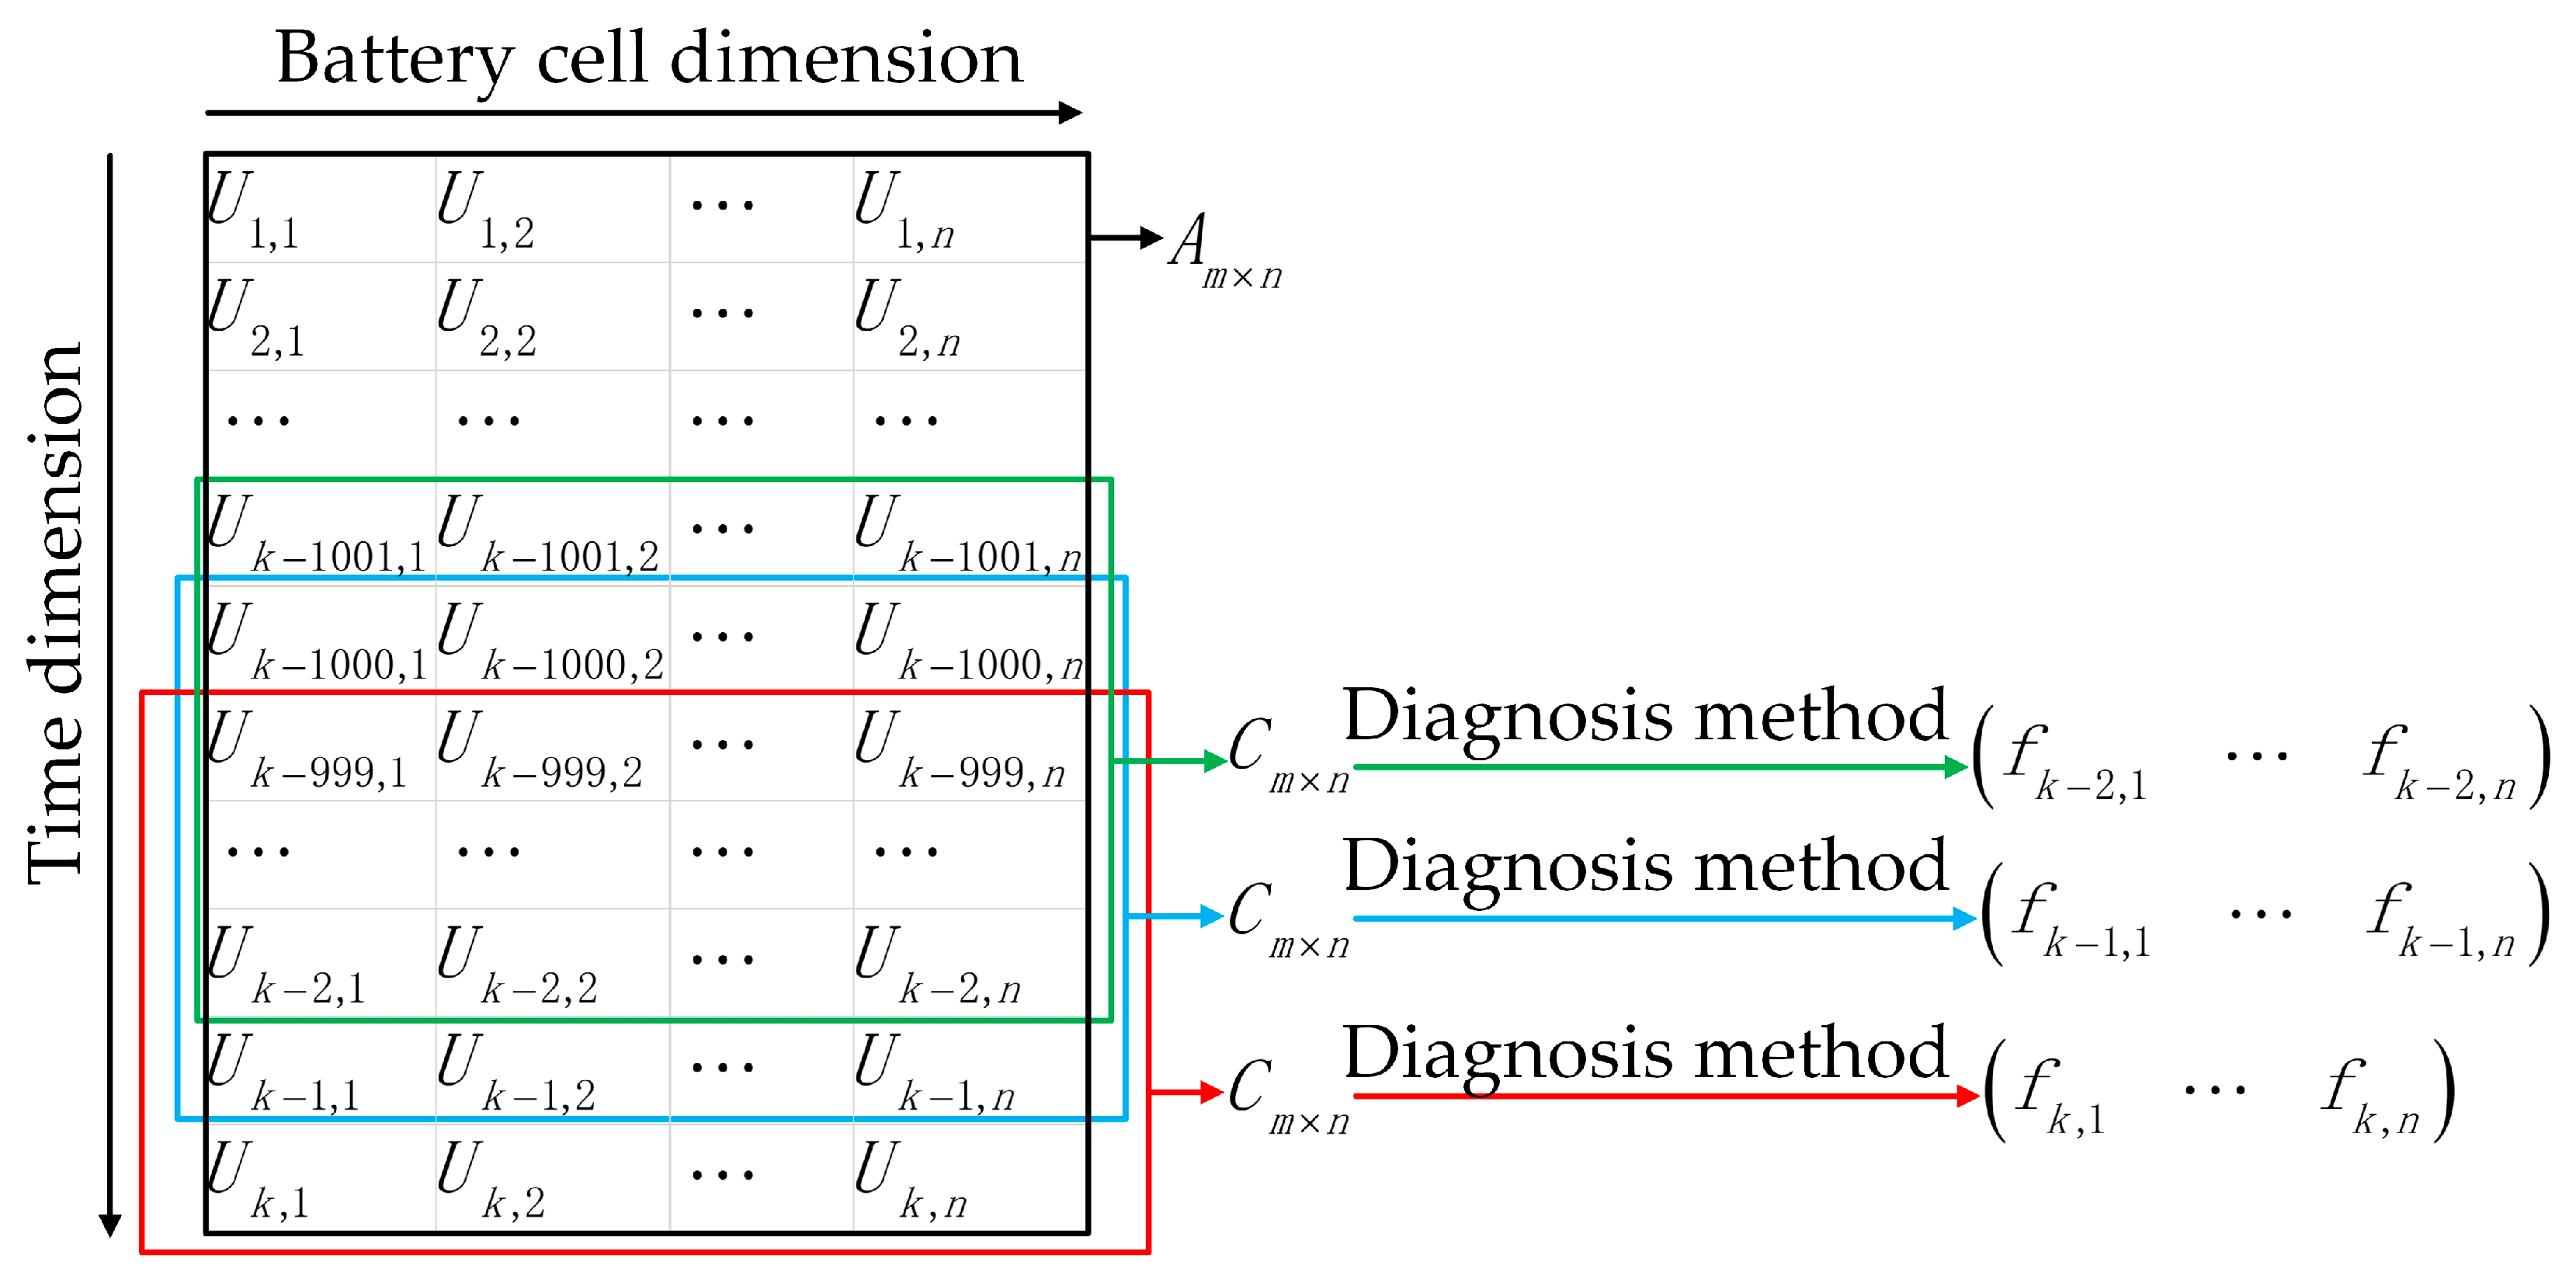
where f t , j ( t = 1 , 2 , , k ; j = 1 , 2 , , n ) is the fault value of the battery cell j at the sampling time of t . At each step, the vehicle generates a new row of data, and the latest 1000 rows of history data are extracted as the SCI C m × n A k × n . If the battery cell j is determined to be a PTRC at the sampling time of t according to the method in Section 3.1, f t , j = 1 , otherwise f t , j = 0 . The relationship between C m × n and A k × n is shown in Figure 3.
Define the fault frequency matrix R k × n to quantitatively describe the thermal runaway risk for a period of time:
R k × n = ( r 1 r n )
where r j ( j = 1 , 2 , , n ) is the fault frequency of battery cell j at the time step x to y . r j = t = x y f t , j y x , x and y are the start and the end time step of the selected time interval, respectively.

4. Discussion

4.1. Physical Basis of Diagnosis Method

Voltage indicates the external electrical property of batteries [33,34,35,36], so the voltage of the faulty cell may see abnormality from the normal cells (NC) some time before the thermal runaway occurrence. Voltage abnormity may have two different patterns: (1) Battery properties suddenly deteriorate: for example, a voltage jump caused by mechanical abuse. (2) Battery properties progressively deteriorate: for example, change in battery terminal voltage caused by battery aging.
The accumulation of voltage deviation over a period of time is calculated by VDI, so it can reflect the battery progressive degradation. In addition, for a battery pack with good performance, the voltage deviations of all the battery cells should be close to 0 and kept within a certain interval. The CND is used to indicate the sudden degradation of batteries. Therefore, when the VDI and the CND of a battery cell are significantly different from other battery cells, its thermal runaway risk is considered to be large.

4.2. The Feasibility Analysis

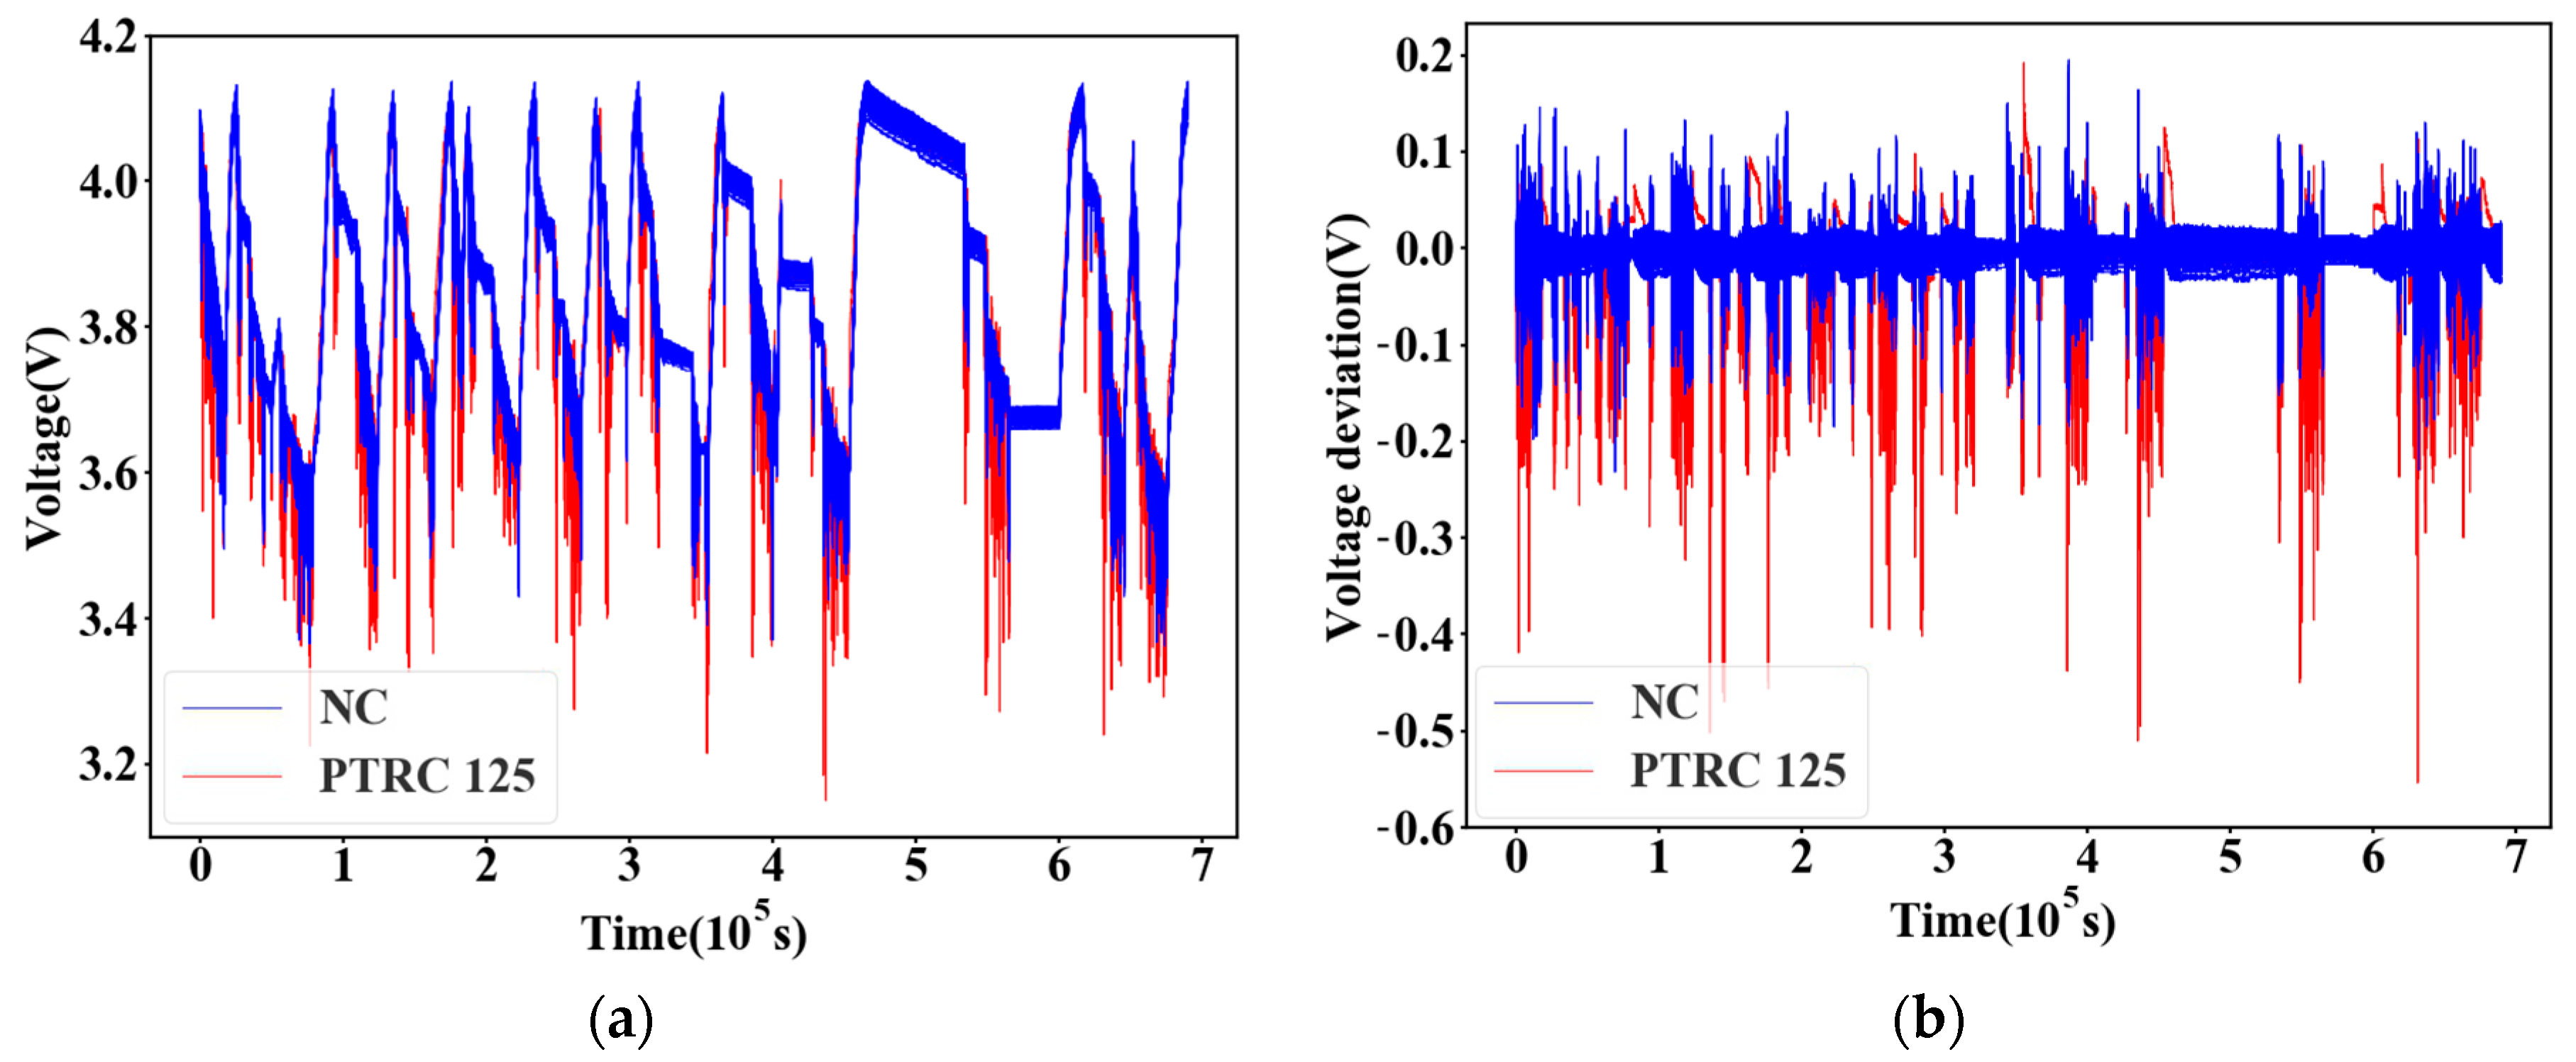
In order to study the potential fault of the battery cell, the cell data of vehicle 1 is retrieved from the NMMCNEV. The data period covers from 30 July 2018 03:45:53 to 28 August 2018 08:10:49. The data acquisition frequency is 0.1 Hz. The ignition source is cell No. 125. Figure 4a shows the voltage curves of battery cells. It can be seen from the figure that the voltage of cell No. 125 is low. At the end of the discharge, its voltage is lower than 3.3 V multiple times. The terminal voltage can reflect the SOC, so the battery cell experienced over-discharge sometimes, and the electrochemical properties of cell No. 125 gradually deteriorated as charging and discharging cycles increased. Figure 4b shows the voltage deviation of each battery cell. It can be seen from the figure that the voltage deviations of normal battery cells are generally kept within a certain interval, while the voltage deviation of cell No. 125 is significantly larger than the other battery cells. Its voltage deviation even exceeds −0.3 V and appears to be positive and negative alternately.
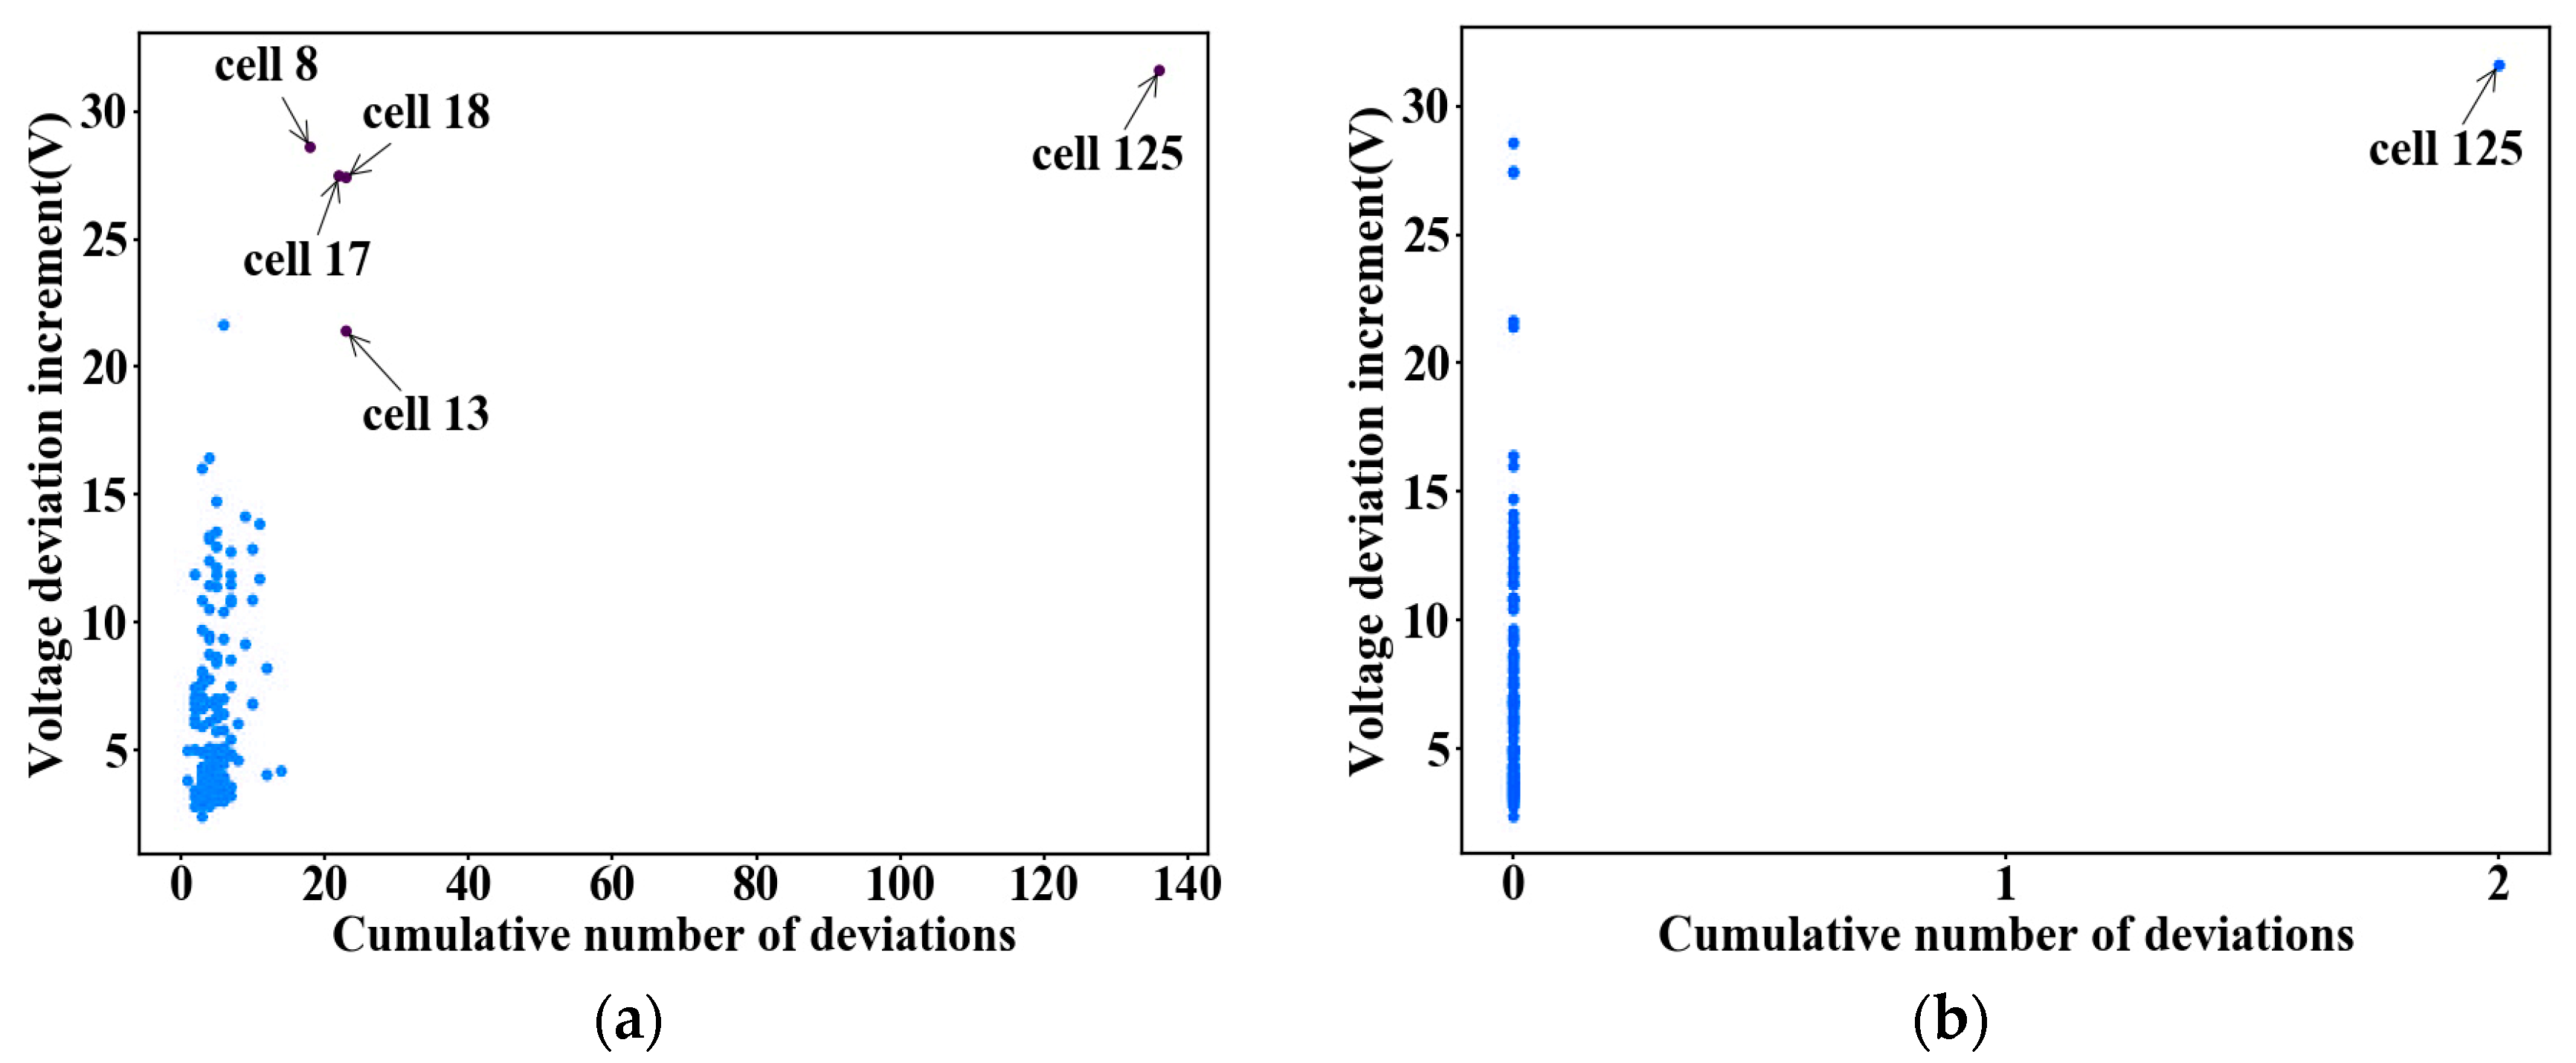
It is acknowledgeable that the width of the CVDI has significant influence on the accuracy of the diagnosis method when calculating the CND, so we studied the effect of this value L on the results, which is shown in Figure 5. Each dot in the figure represents a battery cell. The blue dots represent the normal ones, and the black dots represent the PTRCs diagnosed by the DBSCAN clustering method. If L is too small, some normal battery cells would be misdiagnosed as the PTRCs, as shown in Figure 5a; If L is too large, the PTRC will be misdiagnosed as a normal battery cell, as shown in Figure 5b. Finally, L = ± 0 . 1 V is selected in this study by the trial-and-error method using the data of vehicle 1~2 and 5~12. In addition, the length of the SCI m also has an effect on the results. If m is too large, the calculating time will be too long. If m is too small, the volume of history data is insufficient, and the PTRC cannot be well recognized. Through the analysis of a large amount of data and the trial-and-error method, the length of the SCI is 1000, and the minimum neighborhood points and the domain radius of the DBSCAN clustering method are 5 and 10, respectively.
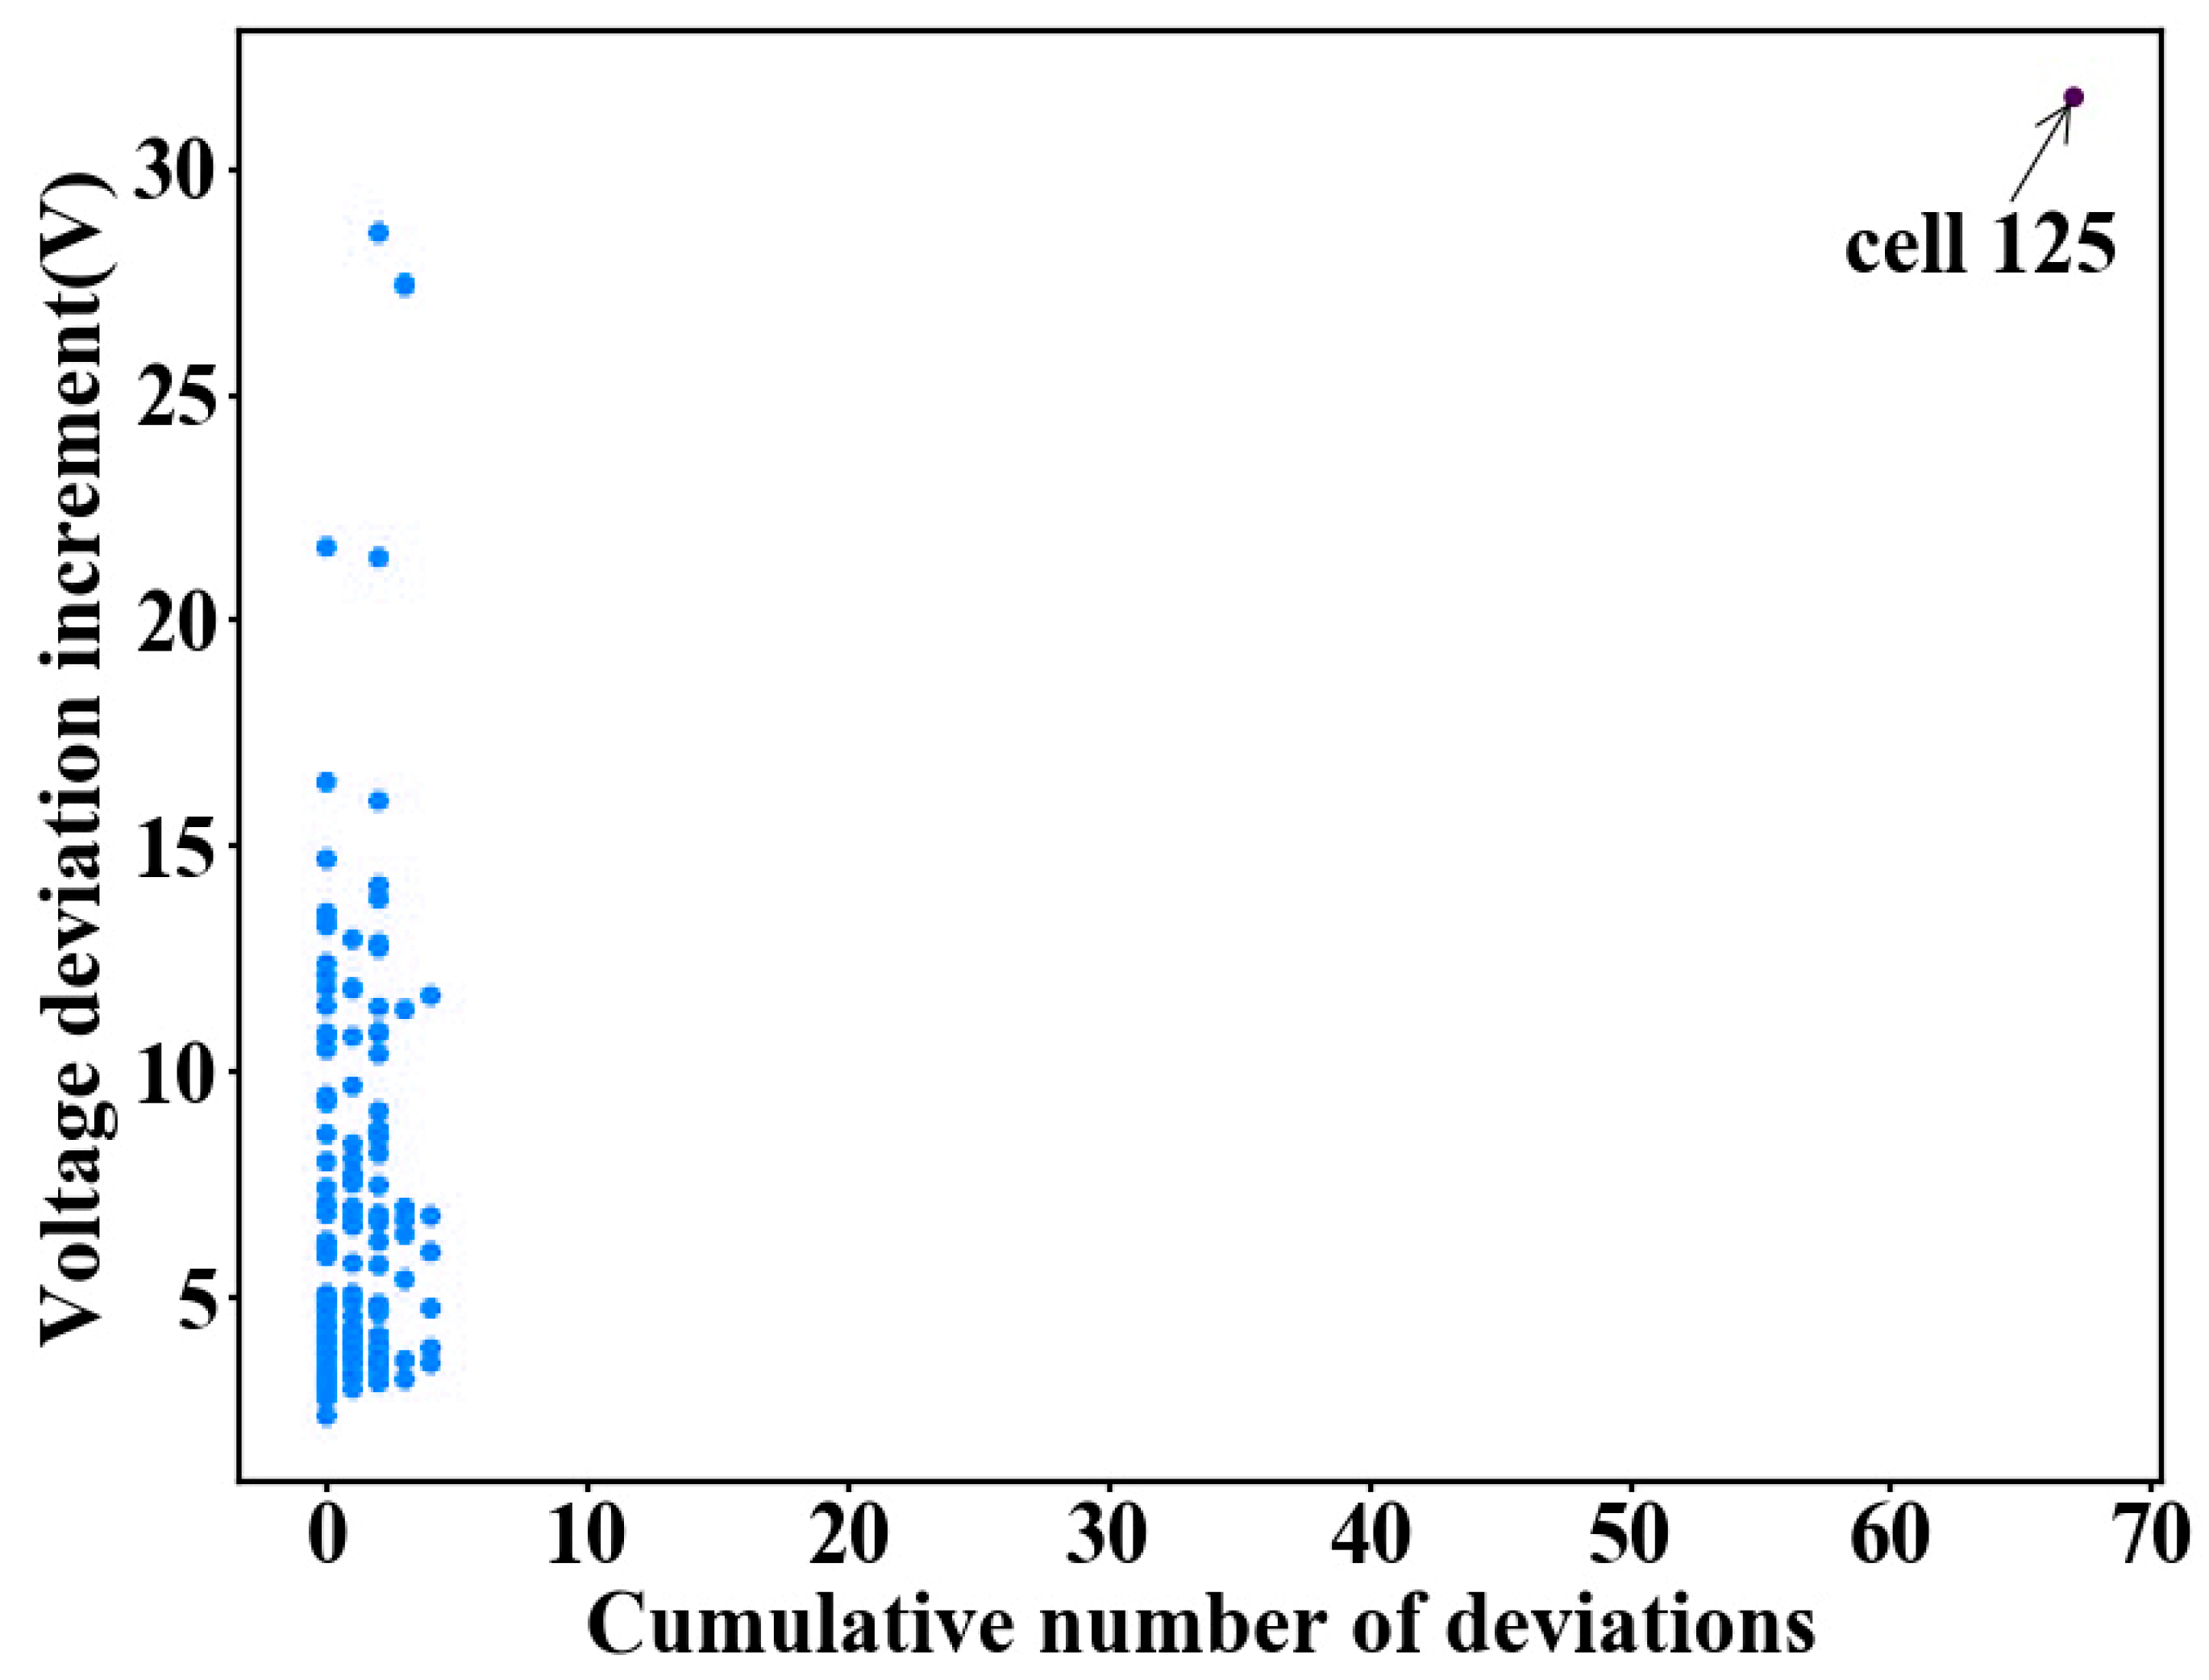
Figure 6 shows the DBSCAN clustering results. It can be seen from the figure that the CND of cell No. 125 is larger than the other battery cells, and it can be well recognized by the DBSCAN clustering method, which proves the feasibility of the proposed method.

4.3. The Stability Analysis

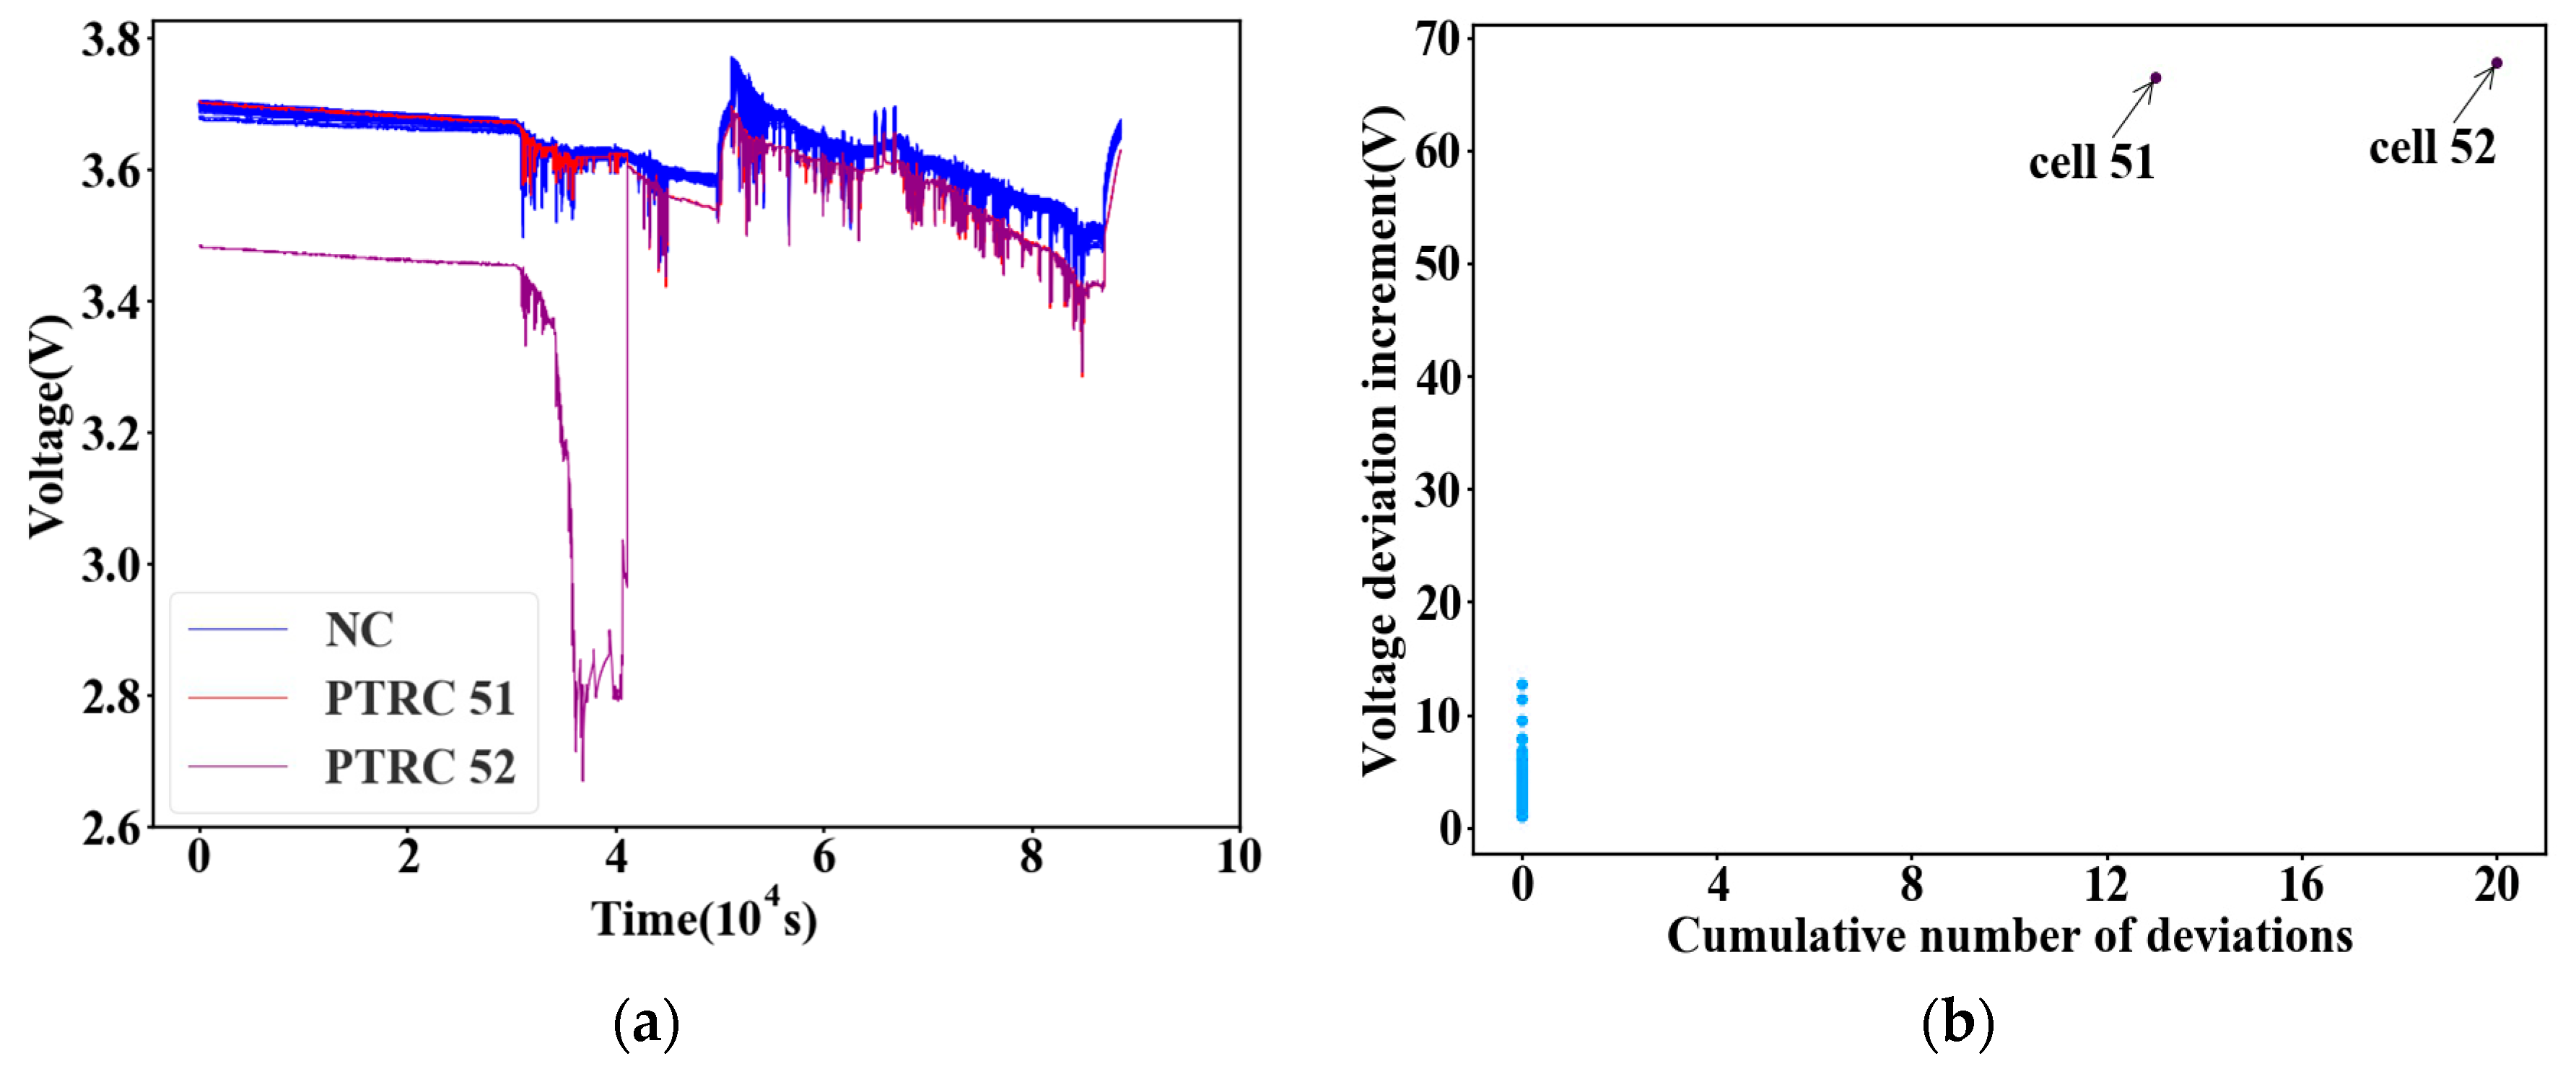
The cell data of vehicle 2 is also retrieved from the big data platform, and the data period covers from 26 June 2018 17:52:51 to 26 July 2018 18:25:46. The data acquisition frequency is 0.1 Hz. The ignition battery cells are cells No. 51 and No. 52. Figure 7a shows the voltage curves of the battery cells. Figure 7b shows the clustering results. It can be seen from Figure 7a that there is under-voltage fault occurrence to cells No. 51 and No. 52, and the VDI and the CND of these battery cells as shown in Figure 7b are higher than those of the other battery cells. Thus, these two battery cells are judged as the PTRCs by the diagnosis method. All the abnormal battery cells can be detected by the DBSCAN clustering in Figure 7, which verifies the stability of the proposed method.

4.4. The Reliability Analysis

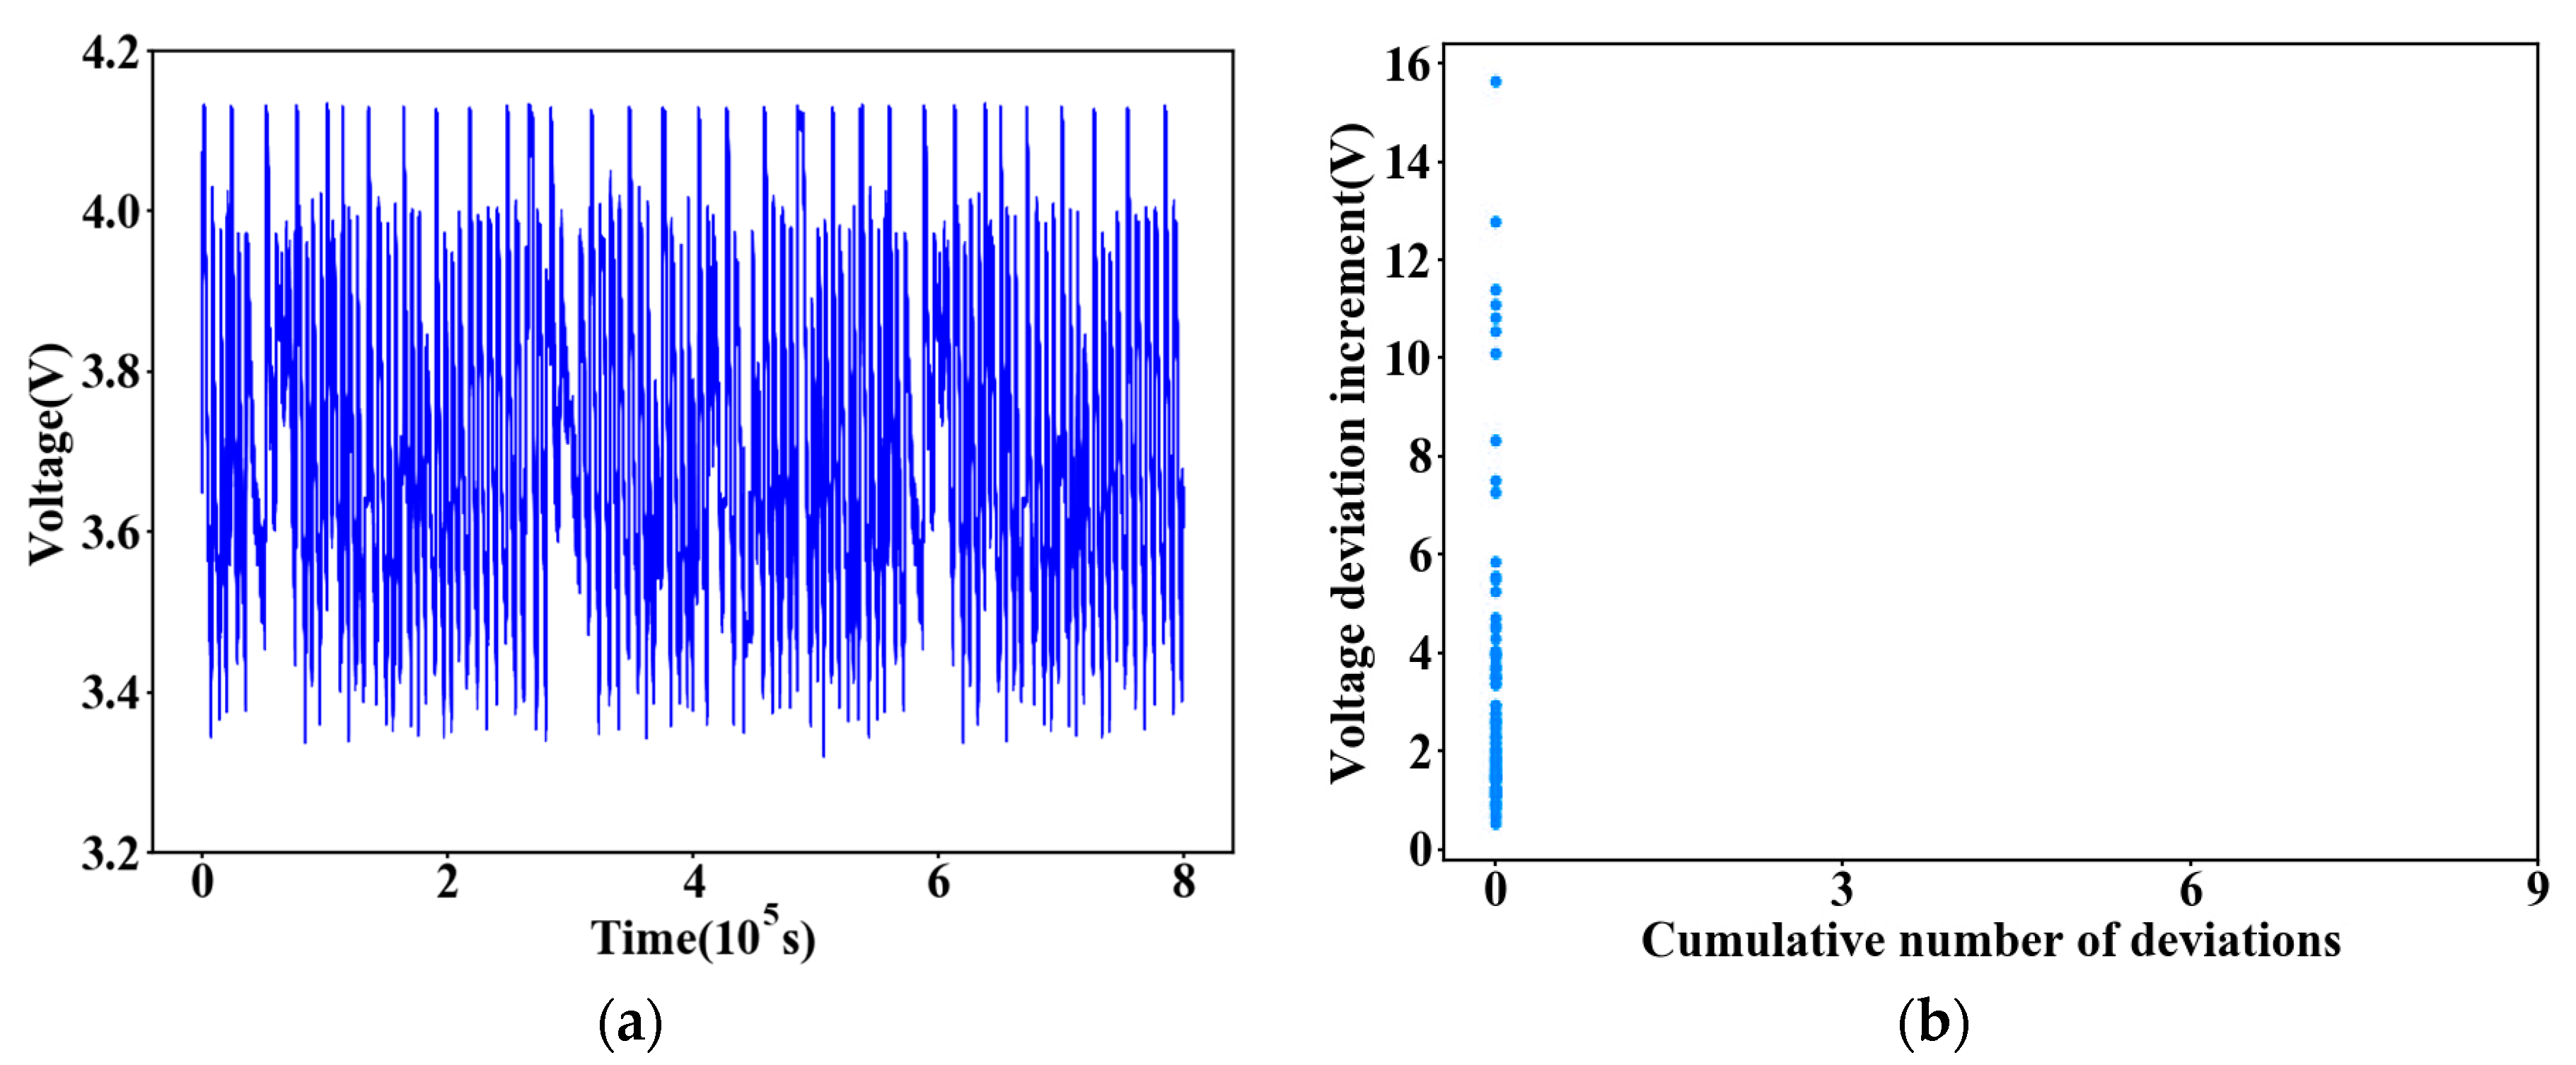
The cell data of vehicle 5 is retrieved from the NMMCNEV, and the data period covers from 27 July 2017 20:56:00 to 27 August 2017 17:05:51. The data acquisition frequency is 0.1 Hz. Figure 8a shows the voltage curves of the battery cells. Figure 8b shows the clustering results. As can be seen from Figure 8a, there are no abnormities in any of the battery cells. In Figure 8b, all battery cells are judged as normal battery cells by the diagnosis method. Therefore, this method would not mis-diagnose abnormal battery cells, which verifies the reliability of the proposed method.

4.5. The Necessity Analysis

The cell data of vehicle 1 vehicle 2 are retrieved from the NMMCNEV. The data period of vehicle 1 covers from 30 July 2018 03:45:53 to 28 August 2018 08:10:49, and the data period of vehicle 2 covers from 26 June 2018 17:52:51 to 26 July 2018 18:25:46. The battery cells’ VDI and CND a month before thermal runaway occurrence are shown in Figure 9. The VDI of vehicle 1 is shown in Figure 9a. The VDI of the PTRC No. 125 is not always higher than the other cells, so the one-dimensional feature VDI alone cannot diagnose the fault and must be combined with the CND. The CND of vehicle 2 is shown in Figure 9d. The CND of the PTRC No. 51 is higher than the other cells only for a short period of time before the thermal runaway occurrence. The one-dimensional feature CND alone cannot precisely diagnose the fault and must be combined with the VDI. Therefore, one-dimensional feature VDI or CND alone cannot diagnose the PTRC, which verifies the necessity of extracting the two features together to diagnose the PTRCs.

5. Results of Diagnosis Method

5.1. Risk Assessment Result of Vehicles

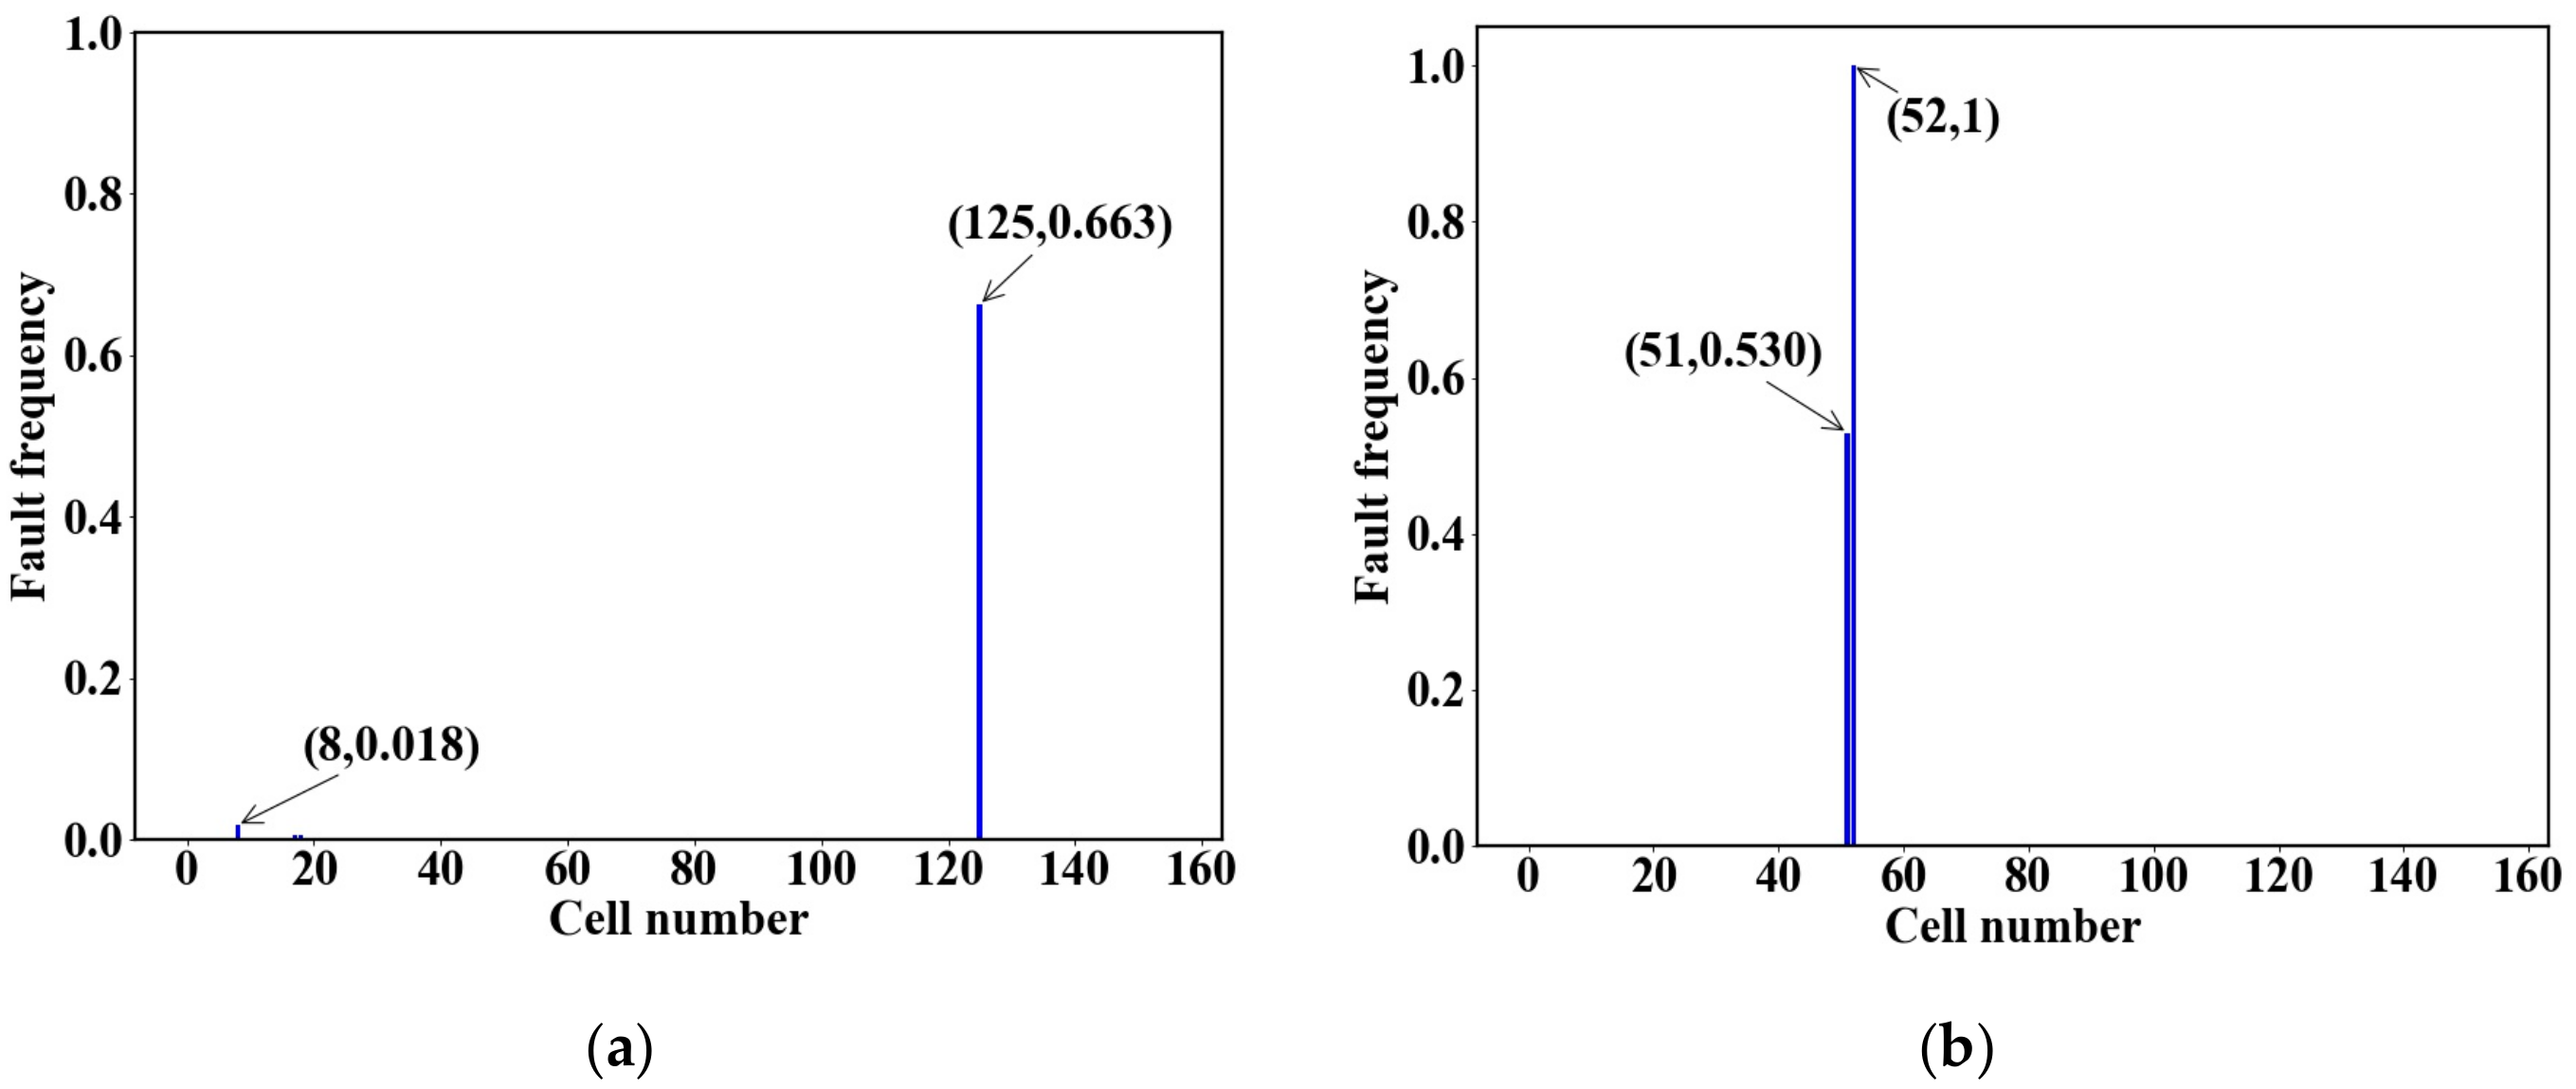
The cell data of vehicles 1~2 and 5~12 are retrieved from NMMCNEV. The data period of vehicle 1 covers from 30 July 2018 03:45:53 to 28 August 2018 08:10:49. The data period of vehicle 2 covers from 26 June 2018 17:52:51 to 26 July 2018 18:25:46. The data periods of vehicles 5~12 are a month approximately. The fault frequencies of battery cells are shown in Figure 10. PTRC No. 125 of vehicle 1 has the highest fault frequency of 0.663 and can be diagnosed well, which verifies the accuracy of the method. Cell No. 8 has the second highest fault frequency of 0.018, which means that cell No. 8 has the second highest risk of thermal runaway and should be maintained in time. The fault frequencies of other normal battery cells in vehicle 1 are 0. PTRC No. 52 of vehicle 2 has the highest fault frequency of 1, indicating that its properties are already poor a month before thermal runaway. PTRC No. 51 of vehicle 2 has the second highest fault frequency of 0.530. Using this method, PTRC No. 51 and PTRC No. 52 can be accurately diagnosed before thermal runaway. The fault frequencies of other normal battery cells are 0. In addition, the fault frequencies of battery cells in vehicle 5~12 are 0, which verifies the reliability of the method.

5.2. Risk Assessment Result of More Vehicles

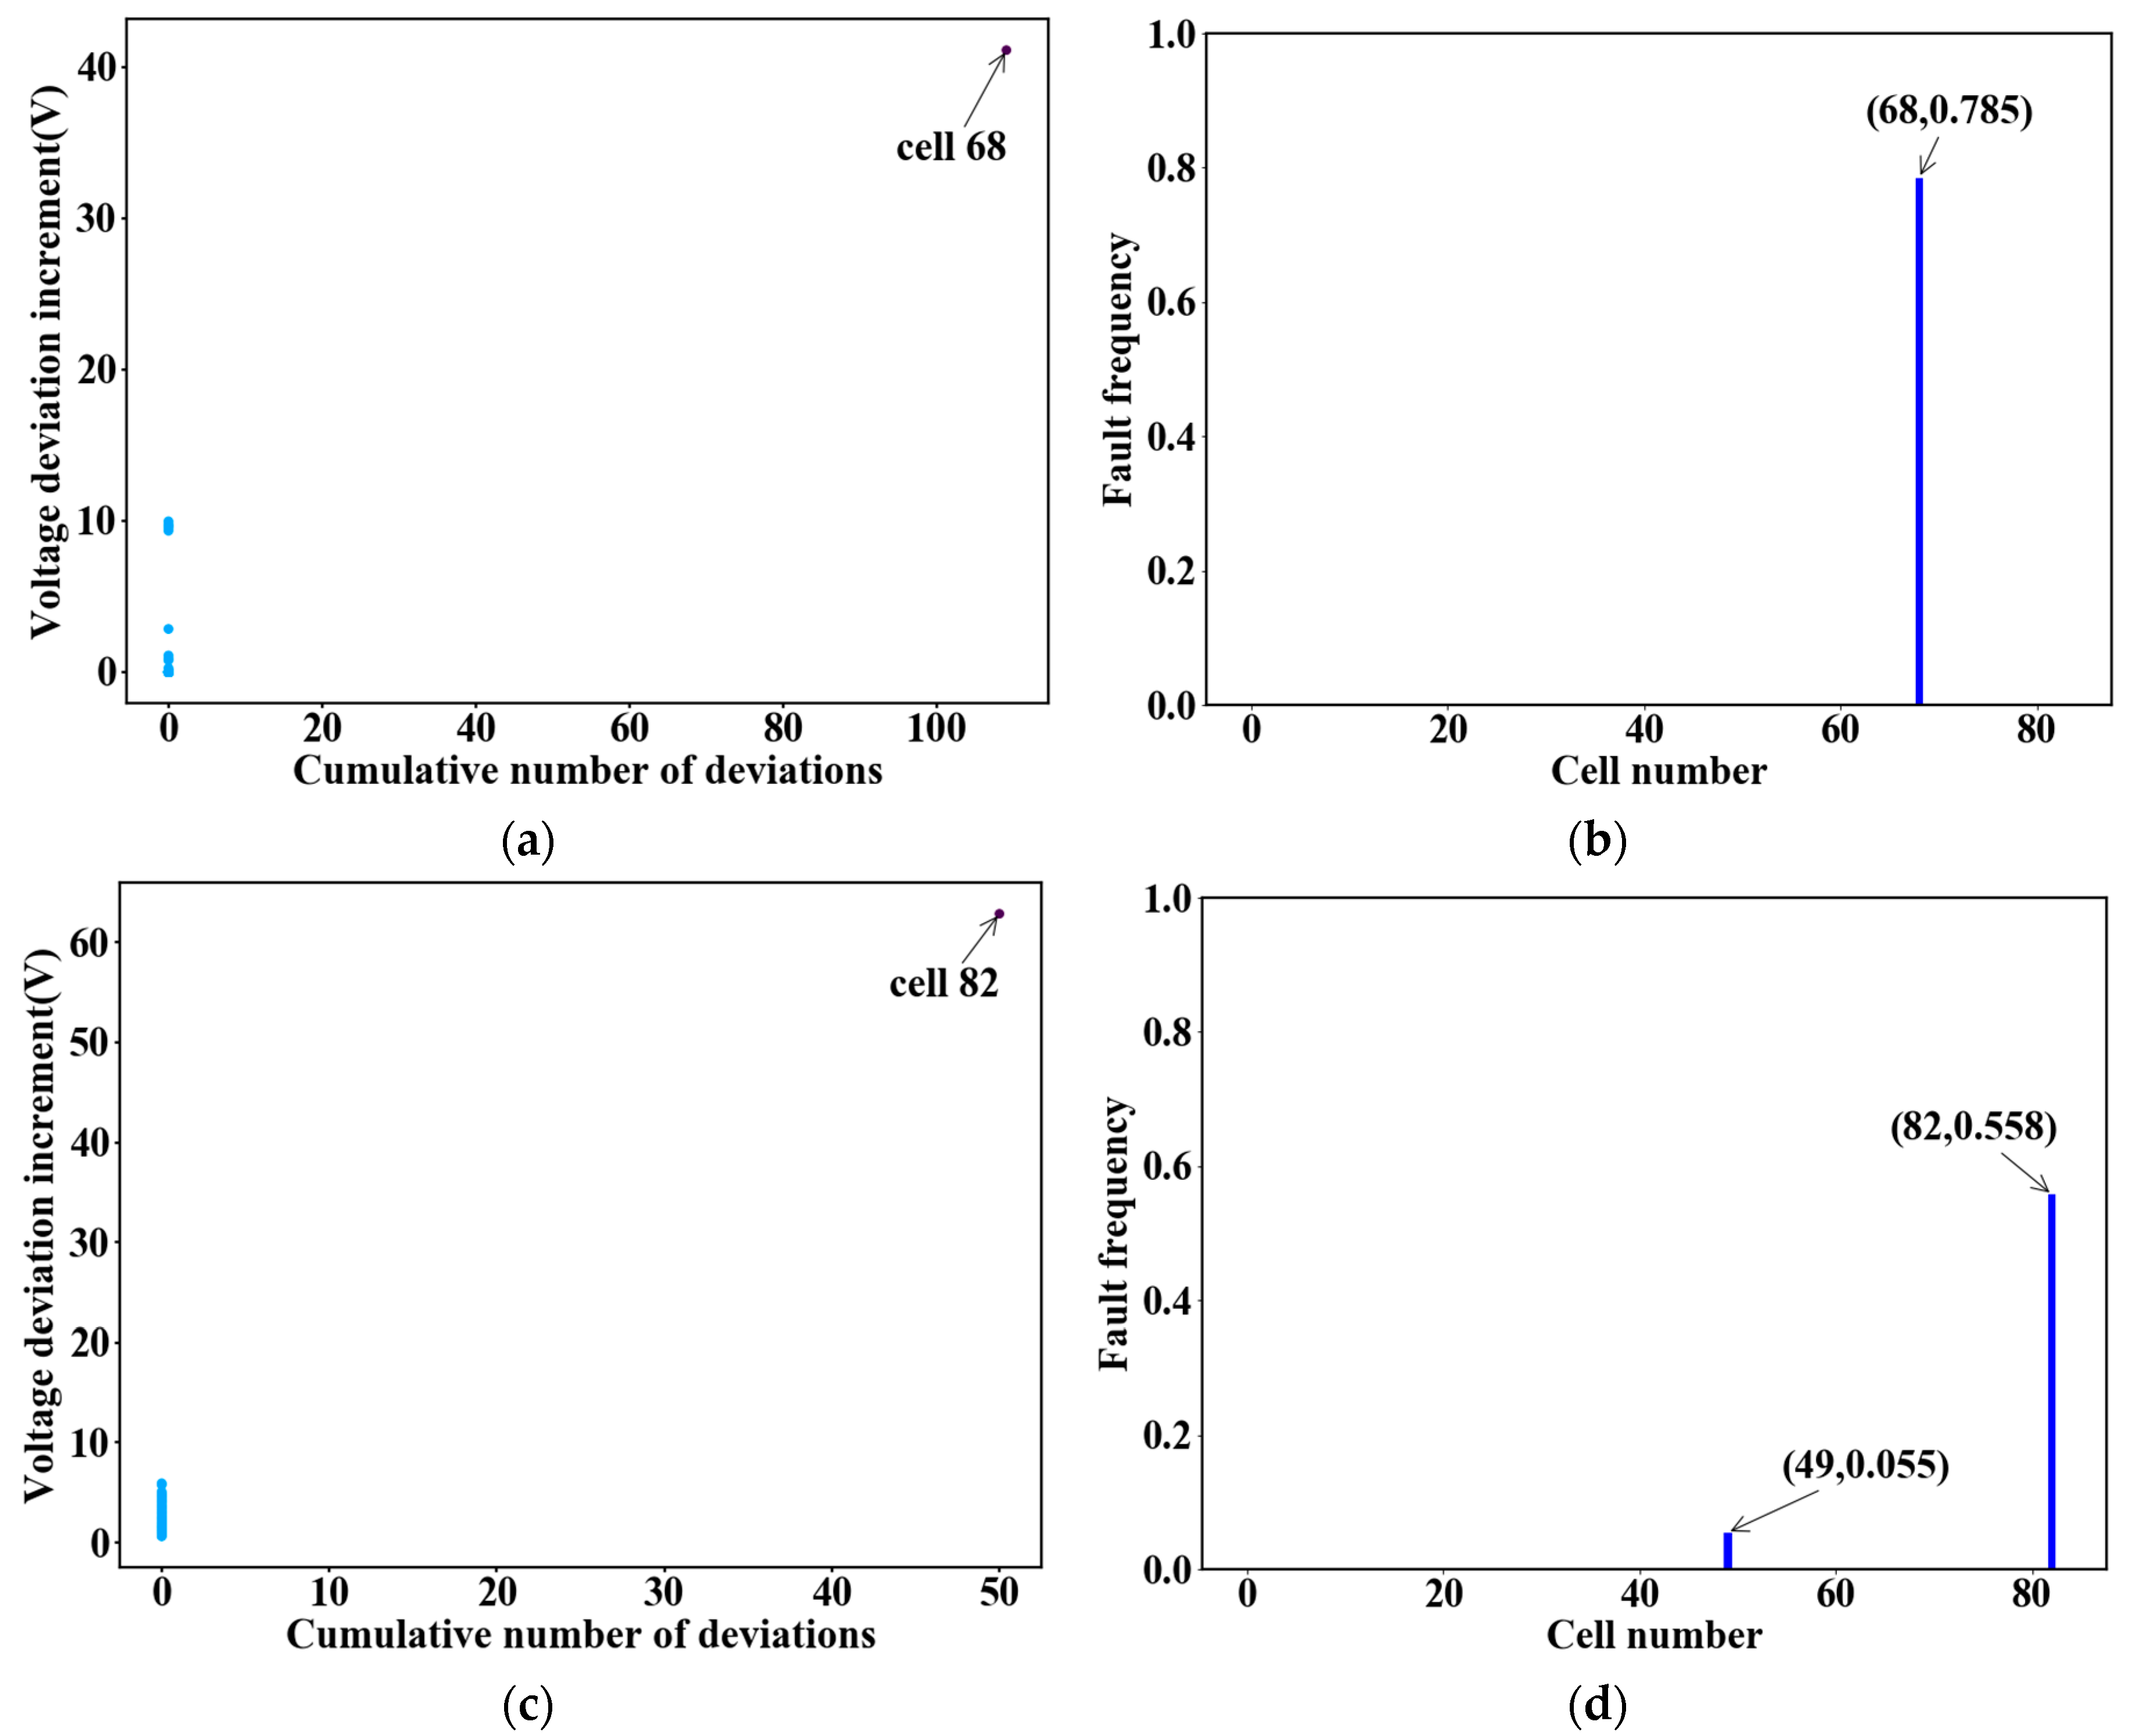
To further verify the robustness of the diagnosis method, the cell data of vehicles 3~4 and 13~14 are retrieved from the NMMCNEV. The data period of vehicle 3 covers from 16 February 2019 17:20:50 to 19 March 2019 11:11:26. The data period of vehicle 4 covers from 19 December 2018 13:51:00 to 30 January 2019 14:59:31. The data periods of vehicles 13~14 are both a month approximately. The cluster results and fault frequencies of battery cells in vehicles 3~4 are shown in Figure 11. The PTRC No. 68 of vehicle 3 has the highest fault frequency of 0.785. The PTRC No. 82 of vehicle 4 has the highest fault frequency of 0.558. Using this method, these two faulty battery cells can be timely and precisely diagnosed before thermal runaway. Cell No. 49 in vehicle 4 has the second highest fault frequency of 0.055, which means that it has the second highest risk of thermal runaway occurrence and should be maintained in time. The fault frequencies of the other normal battery cells are 0. In addition, the fault frequencies of the battery cells in vehicles 13~14 are 0. All the results show that the diagnosis method can be used in other vehicles to precisely diagnose the PTRCs, so the robustness of the diagnosis method and the rationality of parameter selection are verified.

5.3. Comparison with Other Diagnosis Methods

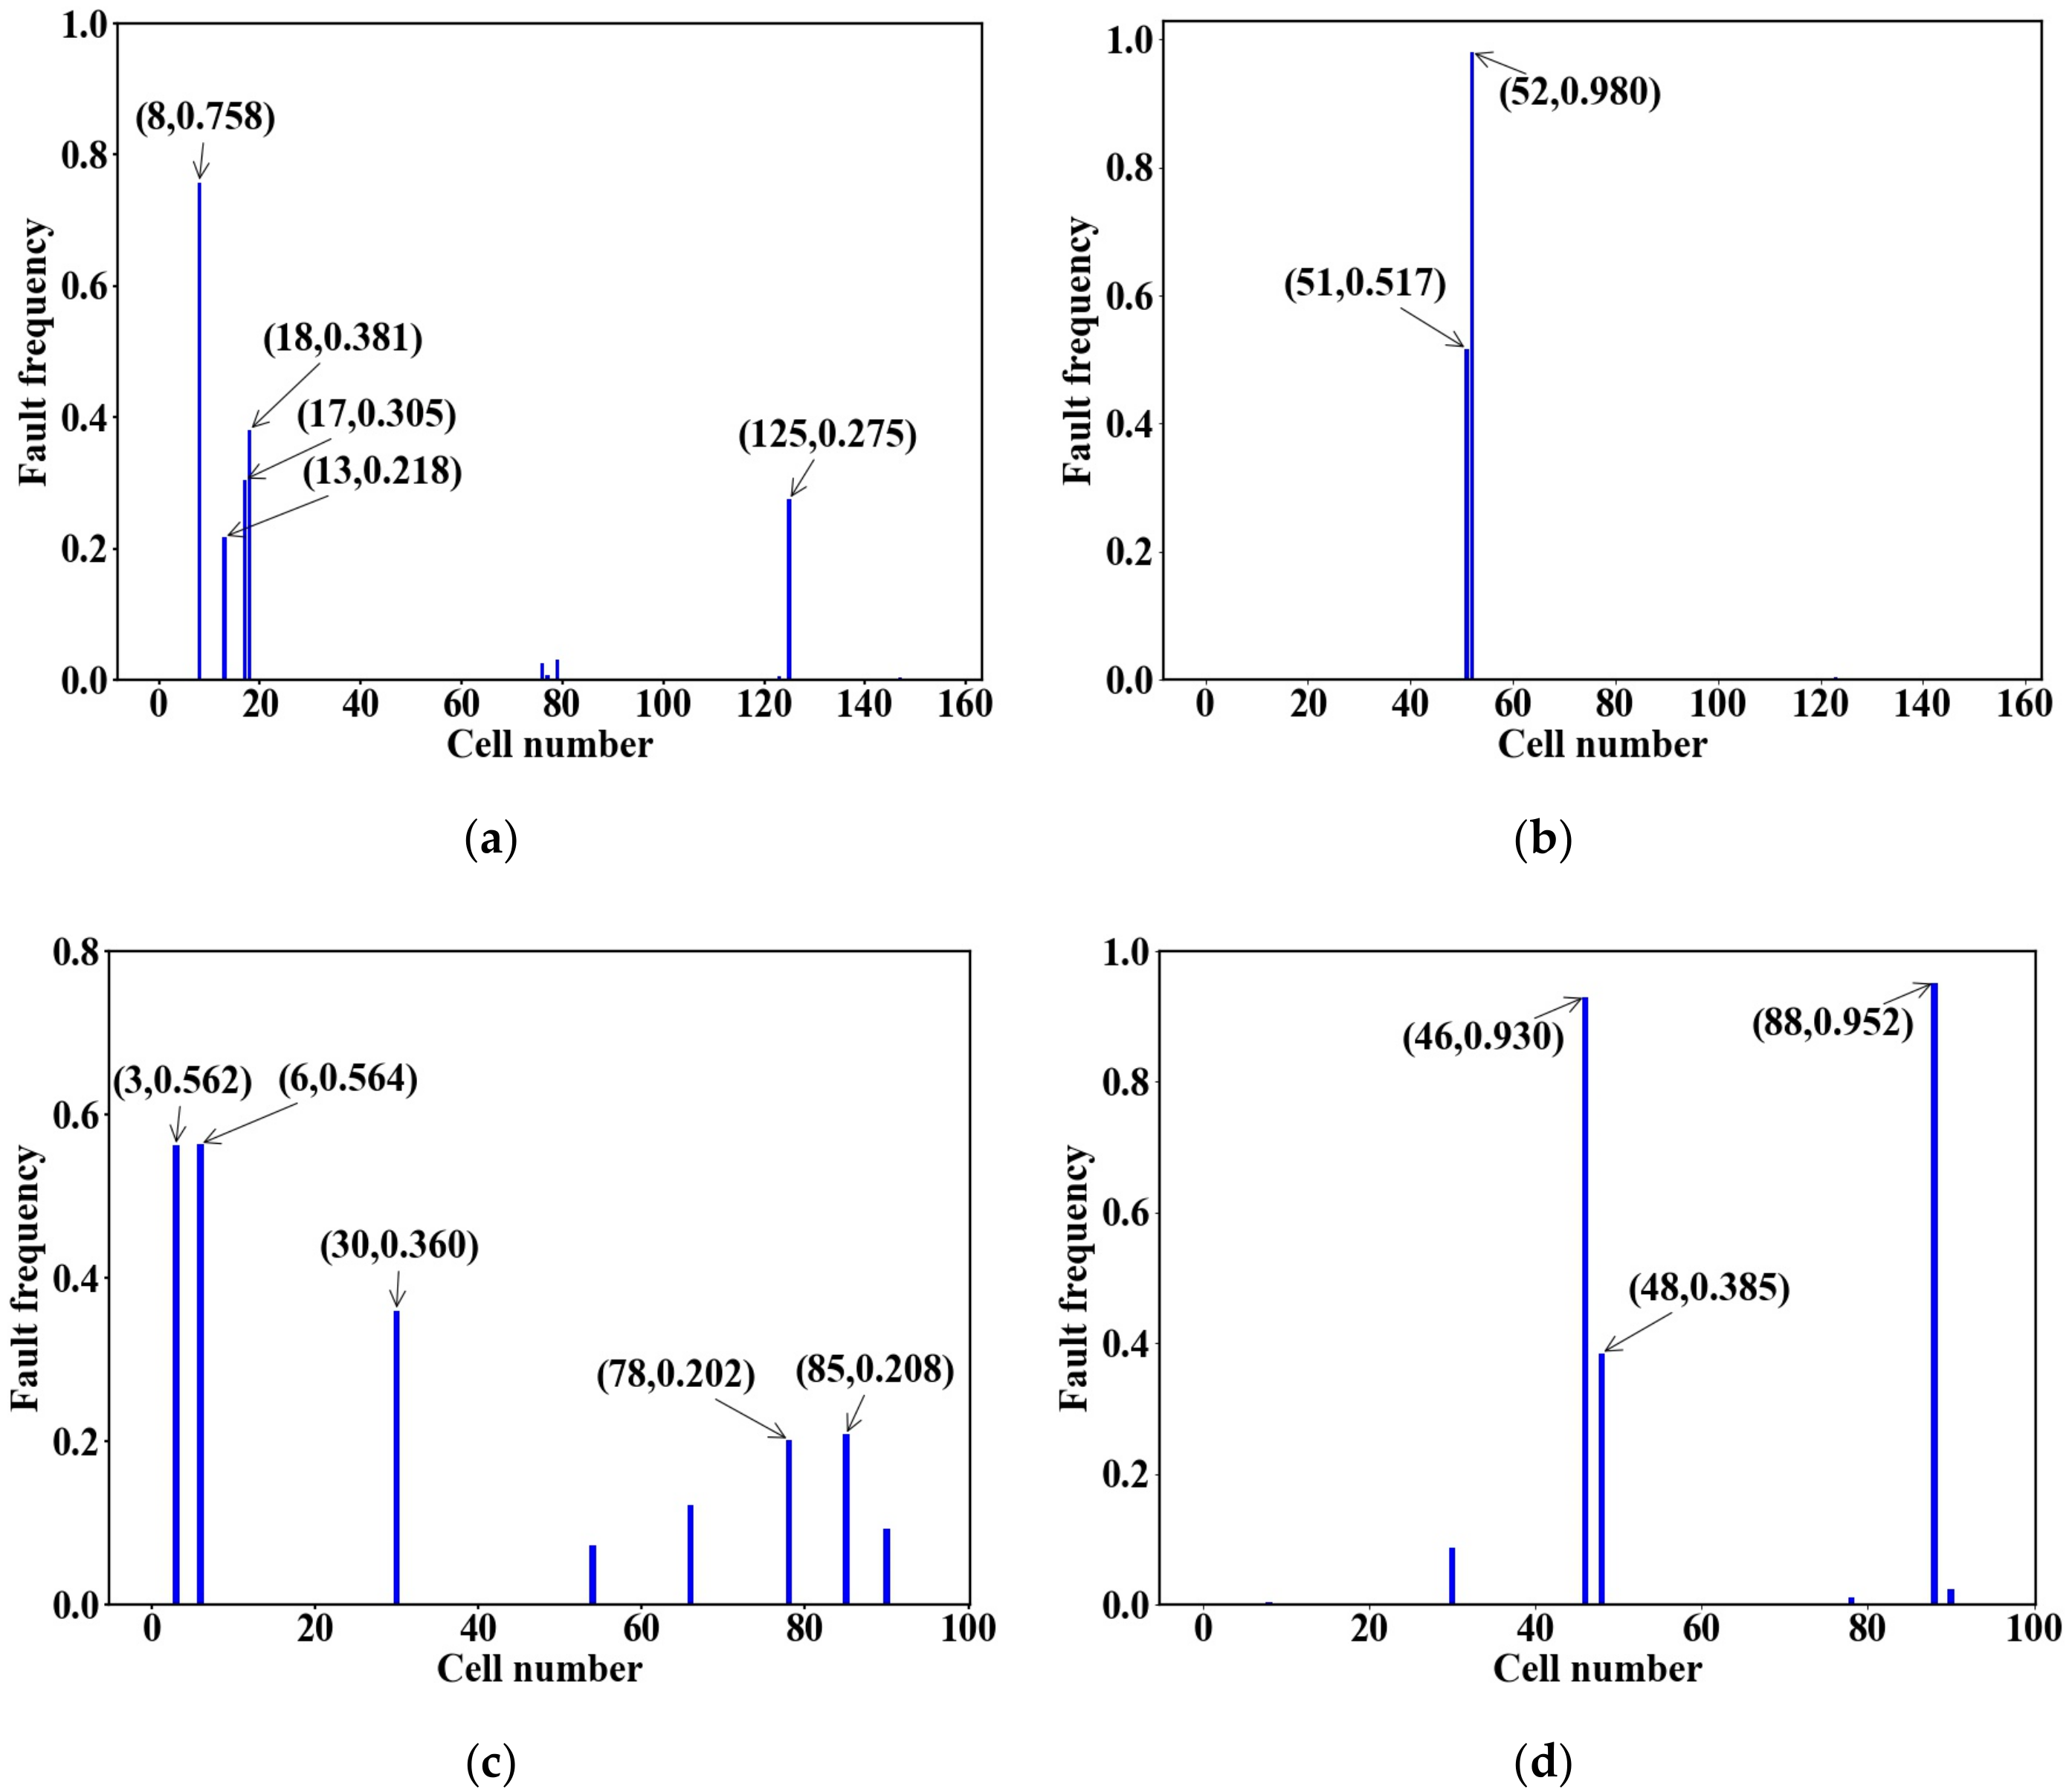
In order to compare the effects of different fault diagnosis methods, the fault frequencies of the cells in vehicles 1~2 and 5~12 are calculated by 3r-MSS fault diagnosis method [28]. Figure 12 shows the results of vehicles 1~2 and 5~6. The fault frequency of PTRC No. 125 in vehicle 1 is only 0.275 while cells No. 8, No. 13, No. 17, and No. 18 are 0.758, 0.218, 0.305, and 0.381 respectively, but there is no fault occurrence in them. Therefore, the 3r-MSS method cannot accurately diagnose the PTRCs of vehicle 1. The reason is that the 3r-MSS fault diagnosis method is based on the current cell voltage, and the deterioration of the battery properties in the history is not considered. When the properties of the PTRCs become normal at some time steps, the potential fault cannot be detected. The fault frequencies of PTRCs No. 51 and No. 52 in vehicle 2 are 0.517 and 0.980, which can be diagnosed well. The reason is that 3r-MSS fault diagnosis method is based on the normal distribution. As shown in Figure 7a, the voltage curves of PTRCs No. 51 and No. 52 are always different from other normal battery cells, so the majority of the time, before the thermal runaway occurrence, their voltages exceed the interval of ( μ 3 σ , μ + 3 σ ) and can be diagnosed by the 3r-MSS method. The fault frequencies of some battery cells in the vehicles 5~12 are high, but these vehicles do not have any faults, so the accuracy of the 3r-MSS method in normal vehicles is low.
In general, when the cell voltages obey the normal distribution or approximate normal distribution, the 3r-MSS fault diagnosis method is simple and effective, and can well identify the faulty cells outside of the interval ( μ 3 σ , μ + 3 σ ) . However, the performance of the battery during the real-world operation is affected by many factors. The difference between different individuals is not random and the cell voltages do not obey the normal distribution. If the fault is forcibly checked by the normal distribution, some normal cells will be misdiagnosed as faulty cells, and the accuracy will be greatly reduced. At the same time, the 3r-MSS fault diagnosis method cannot judge the severity of the fault, so it cannot distinguish the PTRCs from the other cells. Compared with the 3r-MSS fault diagnosis method, the proposed method in this article is based on the DBSCAN clustering to diagnose the PTRCs and is suitable for the normal distribution and non-normal distribution of battery voltages. This method combines the current data with the historical data by extracting the SCI and can accurately diagnose the PTRCs before the thermal runaway occurrence, thereby improving the diagnosis accuracy.

6. Conclusions

This paper proposes an online thermal runaway diagnosis method for lithium-ion battery systems based on real-world data. The results show that the diagnosis method established by the DBSCAN clustering can effectively predict the PTRCs. By analyzing a large amount of real-world data, the feasibility, stability, reliability, necessity, and robustness of the method are discussed and verified. In addition, a comparison with another diagnosis method is performed, and the results show the superiority of the proposed method.
In summary, the proposed diagnosis method in this article can be divided into two parts: real-time diagnosis and periodic assessment of the fault risk. The DBSCAN clustering diagnosis method is an online method, which can be used in realistic BMSs. In the meantime, the fault matrix can be saved in the BMS, and the fault frequency can be calculated based on the fault matrix regularly to assess the potential fault risk.
It is worth mentioning that the presented method can also be used for fault diagnosis of systems with time series features, regardless of data type and application area. In addition to the diagnosing voltage anomalies, temperature anomalies or any other information anomalies can be detected and predicted by this method.

Author Contributions

D.L. provided algorithms, analyzed the data and wrote the paper; Z.Z., P.L. and Z.W. conceived the structure and research direction of the paper.

Funding

This research was funded by the National Key R & D Program of China grant number 2018YFB0105700. This research was funded by the State Key Program of Natural Science Foundation of China grant number U1564206. The APC was funded by the National Key R & D Program of China.

Conflicts of Interest

The authors declare no conflict of interest.

Abbreviations

Nomenclature
PTRCPotential thermal runaway cell
NCNormal cell
NMMCNEVNational Monitoring and Management Center for New Energy Vehicles in China
EVsElectric vehicles
SMMSwitching model method
ICAIncremental capacity analysis
DNNDeep neural networks
BMSBattery management system
SampEnSample Entropy
SVMSupport vector machine
3r-MSS3r multi-level screening strategy
SCISub-calculation interval
VDIVoltage deviation increment
CNDCumulative number of deviations
CVDICertain voltage deviation interval
Symbol Description
UThe cell voltage
ΔUThe cell voltage deviation
sThe voltage deviation increment
nThe cumulative number of deviations
fThe fault value
rThe fault frequency
LThe certain voltage deviation interval
SubscriptDescription
nThe total number of battery cells
kThe total number of index
tThe index number
jThe cell number
mThe length of the sub-calculation interval

References

  1. Zhu, J.; Wang, Z.; Zhang, L.; Zhang, W. State and parameter estimation based on a modified particle filter for an in-wheel-motor-drive electric vehicle. Mech. Mach. Theory 2019, 133, 606–624. [Google Scholar] [CrossRef]
  2. Zhang, J.; Zhang, L.; Sun, F.; Wang, Z. An overview on thermal safety issues of lithium-ion batteries for electric vehicle application. IEEE Access 2018, 6, 23848–23863. [Google Scholar] [CrossRef]
  3. Wang, Z.; Ma, J.; Zhang, L. State-of-health estimation for lithium-ion batteries based on the multi-island genetic algorithm and the Gaussian process regression. IEEE Access 2017, 5, 21286–21295. [Google Scholar] [CrossRef]
  4. Xiong, R.; Cao, J.Y.; Yu, Q.Q.; He, H.; Sun, F.C. Critical Review on the Battery State of Charge Estimation Methods for Electric Vehicles. IEEE Access 2017, 6, 1832–1843. [Google Scholar] [CrossRef]
  5. Feng, X.; Ouyang, M.; Liu, X.; Lu, L.; Xia, Y.; He, X. Thermal runaway mechanism of lithium ion battery for electric vehicles: A review. Energy Storage Mater. 2018, 10, 246–267. [Google Scholar] [CrossRef]
  6. Melcher, A.; Ziebert, C.; Rohde, M.; Seifert, H.J. Modeling and Simulation of the Thermal Runaway Behavior of Cylindrical Li-Ion Cells—Computing of Critical Parameters. Energies 2016, 9, 292. [Google Scholar] [CrossRef]
  7. Koch, S.; Fill, A.; Birke, K.P. Comprehensive gas analysis on large scale automotive lithium-ion cells in thermal runaway. J. Power Sources 2018, 398, 106–112. [Google Scholar] [CrossRef]
  8. Abada, S.; Petit, M.; Lecocq, A.; Marlair, G.; Sauvant-Moynot, V.; Huet, F. Combined experimental and modeling approaches of the thermal runaway of fresh and aged lithium-ion batteries. J. Power Sources 2018, 399, 264–273. [Google Scholar] [CrossRef] [Green Version]
  9. Ouyang, D.; He, Y.; Chen, M.; Liu, J.; Wang, J. Experimental study on the thermal behaviors of lithium-ion batteries under discharge and overcharge conditions. J. Therm. Anal. Calorim. 2017, 132, 65–75. [Google Scholar] [CrossRef]
  10. Ouyang, M.; Ren, D.; Lu, L.; Li, J.; Feng, X.; Han, X.; Liu, G. Overcharge-induced capacity fading analysis for large format lithium-ion batteries with LiyNi1/3Co1/3Mn1/3O2+LiyMn2O4 composite cathode. J. Power Sources 2015, 279, 626–635. [Google Scholar] [CrossRef]
  11. Ren, D.; Feng, X.; Lu, L.; Ouyang, M.; Zheng, S.; Li, J.; He, X. An electrochemical-thermal coupled overcharge-to-thermal-runaway model for lithium ion battery. J. Power Sources 2017, 364, 328–340. [Google Scholar] [CrossRef]
  12. Qi, C.; Zhu, Y.; Gao, F.; Yang, K.; Jiao, Q. Mathematical model for thermal behavior of lithium ion battery pack under overcharge. Int. J. Heat Mass Transf. 2018, 124, 552–563. [Google Scholar] [CrossRef]
  13. Chen, M.; Sun, Q.; Li, Y.; Wu, K.; Liu, B.; Peng, P.; Wang, Q. A Thermal Runaway Simulation on a Lithium Titanate Battery and the Battery Module. Energies 2015, 8, 490–500. [Google Scholar] [CrossRef] [Green Version]
  14. Seo, M.; Goh, T.; Park, M.; Koo, G.; Kim, S. Detection of Internal Short Circuit in Lithium Ion Battery Using Model-Based Switching Model Method. Energies 2017, 10, 76. [Google Scholar] [CrossRef]
  15. Feng, X.; Sun, J.; Ouyang, M.; Wang, F.; He, X.; Lu, L.; Peng, H. Characterization of penetration induced thermal runaway propagation process within a large format lithium ion battery module. J. Power Sources 2015, 275, 261–273. [Google Scholar] [CrossRef]
  16. Liu, P.; Sun, Z.; Wang, Z.; Zhang, J. Entropy-Based Voltage Fault Diagnosis of Battery Systems for Electric Vehicles. Energies 2018, 11, 136. [Google Scholar] [CrossRef]
  17. LeCun, Y.; Bengio, Y.; Hinton, G. Deep learning. Nature 2015, 521, 436–444. [Google Scholar] [CrossRef]
  18. Pedregosa, F.; Varoquaux, G.; Gramfort, A.; Michel, V.; Thirion, B.; Grisel, O.; Blondel, M.; Prettenhofer, P.; Weiss, R.; Dubourg, V.; et al. Scikit-learn: Machine Learning in Python. J. Mach. Learn. Res. 2011, 12, 2825–2830. [Google Scholar]
  19. Panchal, S.; McGrory, J.; Kong, J.; Dincer, I.; Agelin-Chaab, M.; Fraser, R.; Fowler, M. Cycling degradation testing and analysis of a LiFePO4 battery at actual conditions. Int. J. Energy Res. 2017, 41, 2565–2575. [Google Scholar] [CrossRef]
  20. You, G.W.; Park, S.; Oh, D. Real-time state-of-health estimation for electric vehicle batteries: A data-driven approach. Appl. Energy 2016, 176, 92–103. [Google Scholar] [CrossRef]
  21. Sun, Y.; Jou, H.; Wu, J. Auxiliary diagnosis method for lead-acid battery health based on sample entropy. Energy Convers. Manag. 2009, 50, 2250–2256. [Google Scholar] [CrossRef]
  22. Widodo, A.; Shim, M.C.; Caesarendra, W.; Yang, B.S. Intelligent prognostics for battery health monitoring based on sample entropy. Expert Syst. Appl. 2011, 38, 11763–11769. [Google Scholar] [CrossRef]
  23. Yao, L.; Wang, Z.; Ma, J. Fault detection of the connection of lithium-ion power batteries based on entropy for electric vehicles. J. Power Sources 2015, 293, 548–561. [Google Scholar] [CrossRef]
  24. Zhao, Y.; Liu, P.; Wang, Z.; Zhang, L.; Hong, J. Fault and defect diagnosis of battery for electric vehicles based on big data analysis methods. Appl. Energy 2017, 207, 354–362. [Google Scholar] [CrossRef]
  25. Wang, Z.; Hong, J.; Liu, P.; Zhang, L. Voltage fault diagnosis and prognosis of battery systems based on entropy and Z -score for electric vehicles. Appl. Energy 2017, 196, 289–302. [Google Scholar] [CrossRef]
  26. Sander, J.; Ester, M.; Kriegel, H.P.; Xu, X.W. Density-based clustering in spatial databases: The algorithm GDBSCAN and its applications. Data Min. Knowl. Disc. 1998, 2, 169–194. [Google Scholar] [CrossRef]
  27. Zhang, H.; Liu, P.; Guo, Y.; Zhang, L.; Huang, D. Blind modulation format identification using the DBSCAN algorithm for continuous-variable quantum key distribution. J. Opt. Soc. Am. B 2019, 36, B51–B58. [Google Scholar] [CrossRef]
  28. Wang, C.; Ji, M.; Wang, J.; Wen, W.; Li, T.; Sun, Y. An Improved DBSCAN Method for LiDAR Data Segmentation with Automatic Eps Estimation. Sensors 2019, 19, 172. [Google Scholar] [CrossRef]
  29. Huang, H.; Liu, F.; Zha, X.; Xiong, X.; Ouyang, T.; Liu, W.; Huang, M. Robust Bad Data Detection Method for Microgrid Using Improved ELM and DBSCAN Algorithm. J. Energy Eng. 2018, 144, 04018026. [Google Scholar] [CrossRef]
  30. Ijaz, M.F.; Alfian, G.; Syafrudin, M.; Rhee, J. Hybrid Prediction Model for Type 2 Diabetes and Hypertension Using DBSCAN-Based Outlier Detection, Synthetic Minority Over Sampling Technique (SMOTE), and Random Forest. Appl. Sci. 2018, 8, 1325. [Google Scholar] [CrossRef]
  31. Czerniawski, T.; Sankaran, B.; Nahangi, M.; Haas, C.; Leite, F. 6D DBSCAN-based segmentation of building point clouds for planar object classification. Automat. Constr. 2018, 88, 44–58. [Google Scholar] [CrossRef]
  32. Ferrara, R.; Virdis, S.G.P.; Ventura, A.; Ghisu, T.; Duce, P.; Pellizzaro, G. An automated approach for wood-leaf separation from terrestrial LIDAR point clouds using the density based clustering algorithm DBSCAN. Agric. For. Meteorol. 2018, 262, 434–444. [Google Scholar] [CrossRef]
  33. Wang, Z.; Sun, F.; Lin, C. An Analysis on the Influence of Inconsistencies upon the Service Life of Power Battery Packs. Trans. Beijing Inst. Technol. 2006, 26, 577–580. [Google Scholar]
  34. Dai, H.; Wang, N.; Wei, X.; Sun, Z.; Wang, J. A Research Review on the Cell Inconsistency of Li-ion Traction Batteries in Electric Vehicles. Automot. Eng. 2014, 36, 181–188. [Google Scholar]
  35. Zheng, Y.; Han, X.; Lu, L.; Li, J.; Ouyang, M. Lithium ion battery pack power fade fault identification based on Shannon entropy in electric vehicles. J. Power Sources 2013, 223, 136–146. [Google Scholar] [CrossRef]
  36. Zhang, C.; Jiang, Y.; Jiang, J.; Cheng, G.; Diao, W.; Zhang, W. Study on battery pack consistency evolutions and equilibrium diagnosis for serial- connected lithium-ion batteries. Appl. Energy 2017, 207, 510–519. [Google Scholar] [CrossRef]
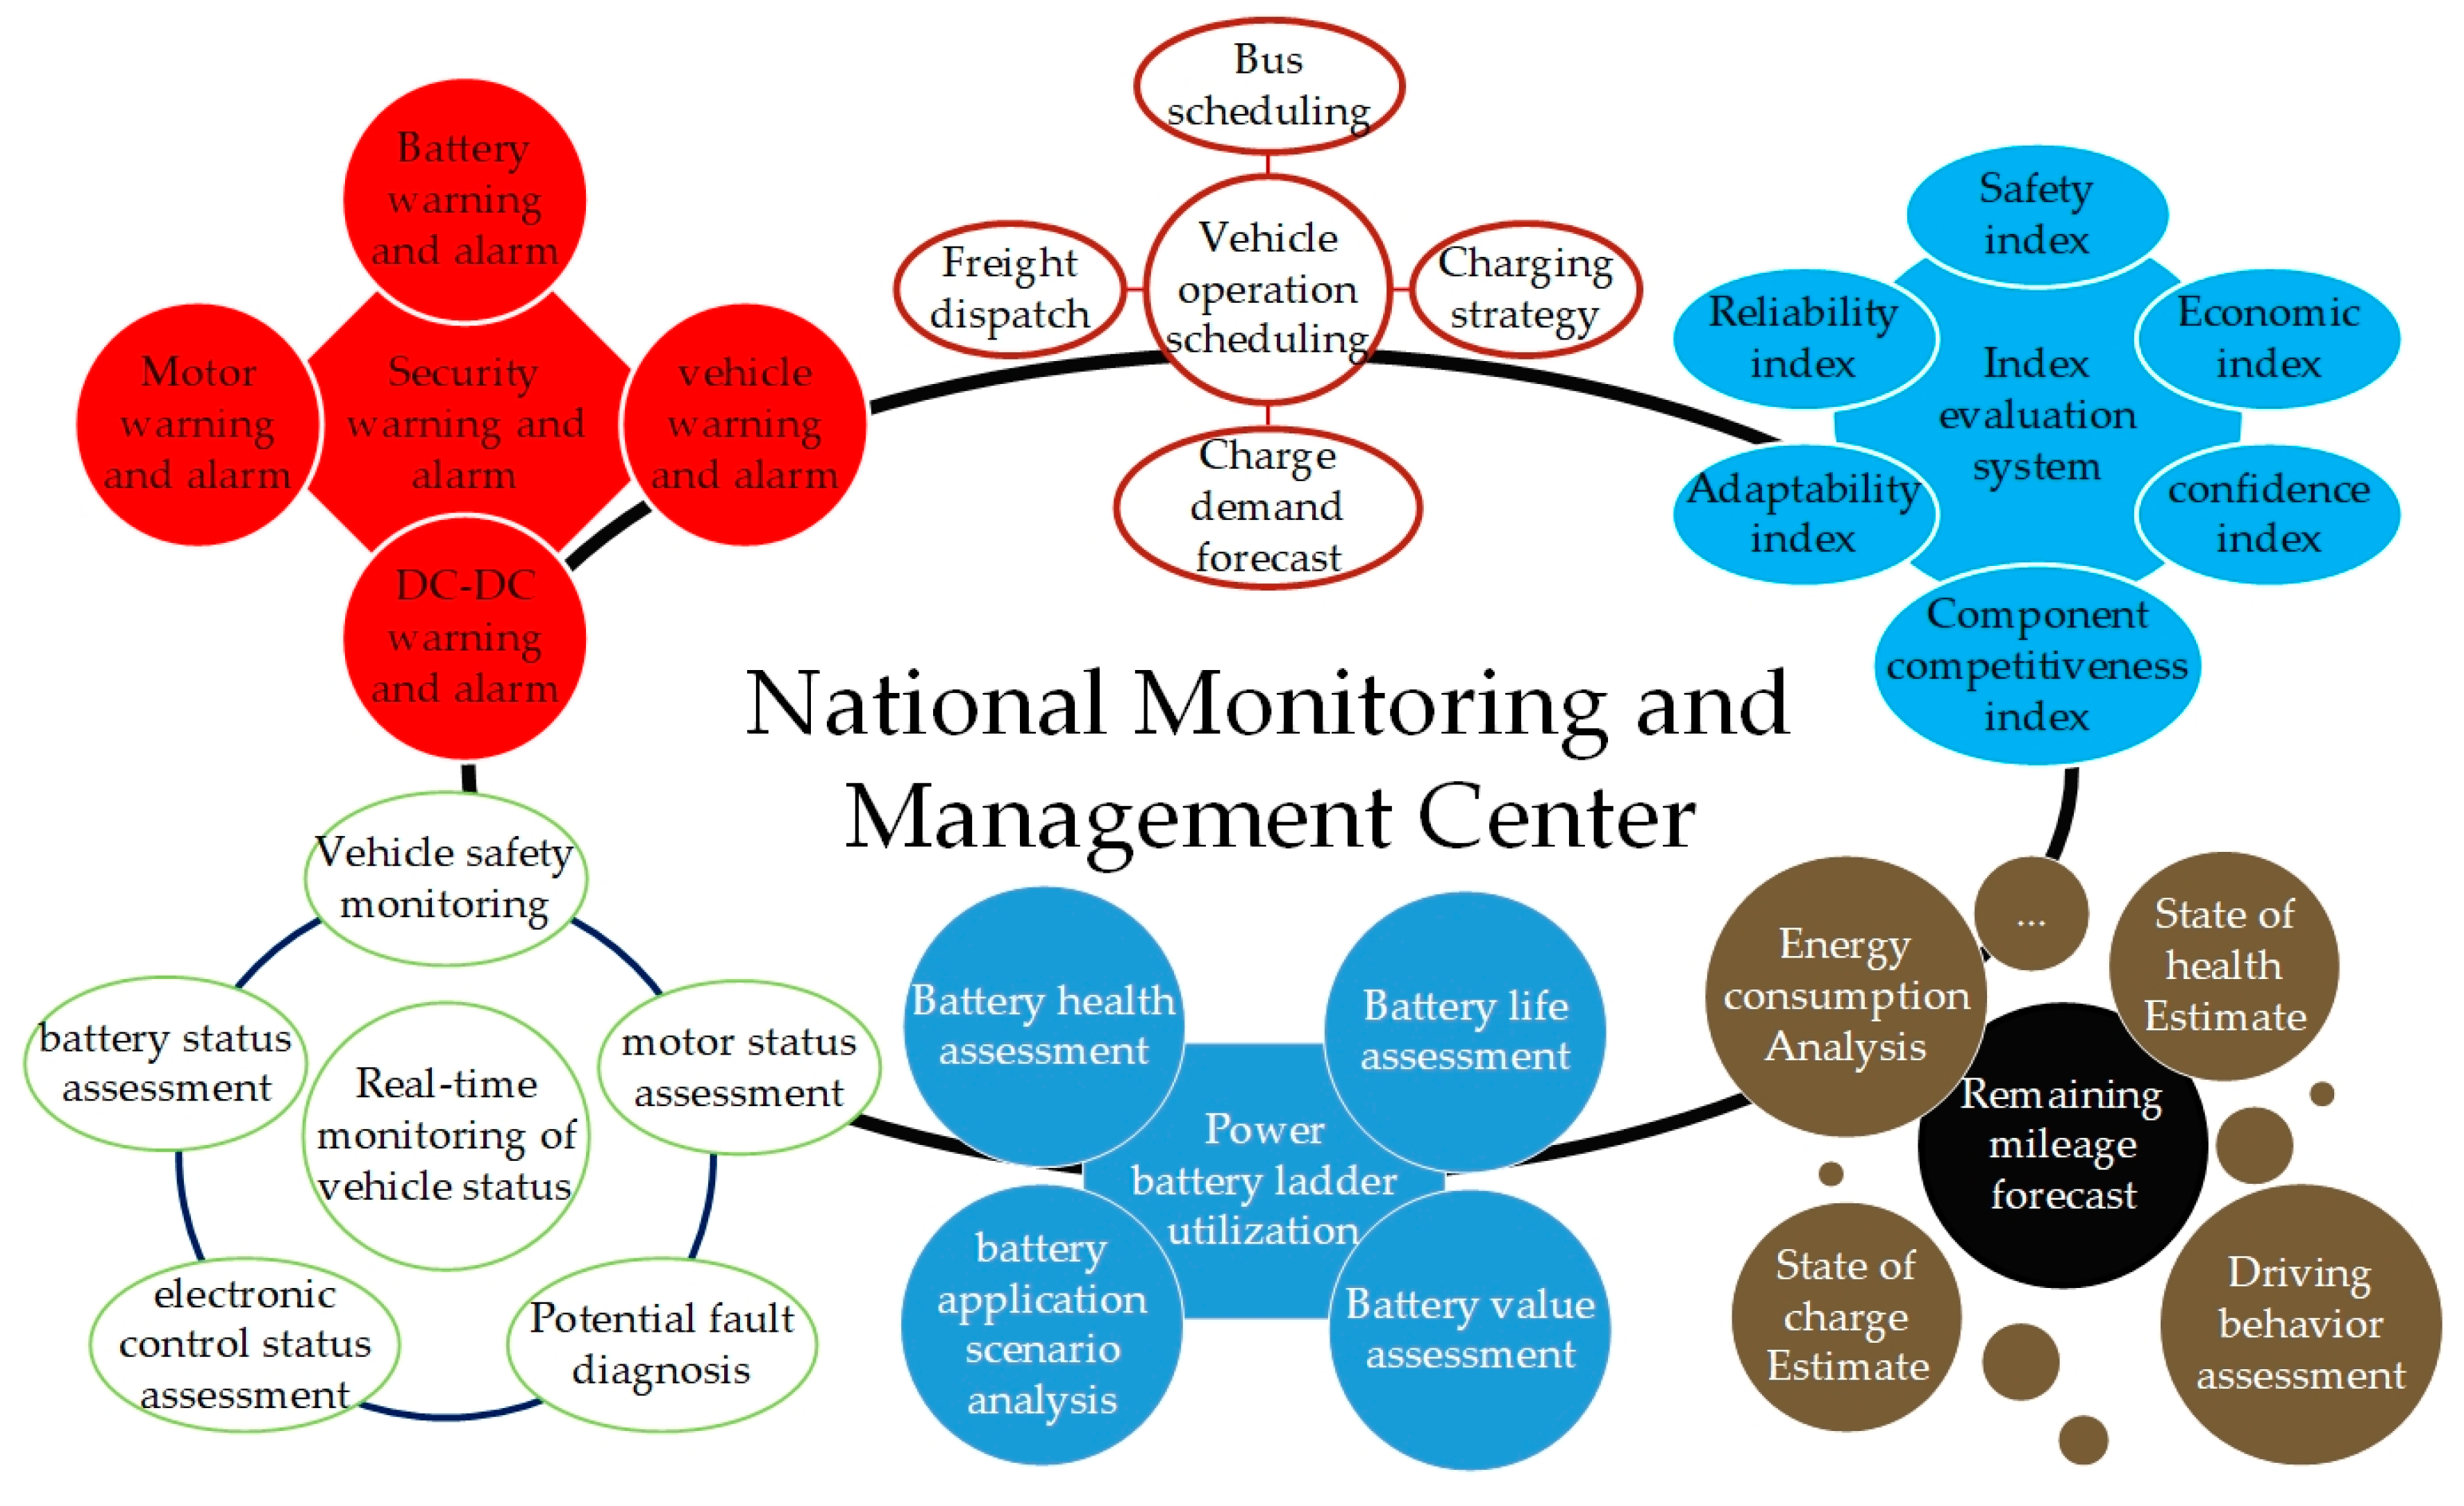
Figure 1. NMMCNEV’s role in the management of electric vehicles.
Energies 12 02977 g001
Figure 2. Cell layout within the battery pack.
Energies 12 02977 g002
Figure 3. The relationship between C m × n and A k × n .
Energies 12 02977 g003
Figure 4. (a) The voltage curves of vehicle 1; (b) The voltage deviation curves of vehicle 1.
Energies 12 02977 g004
Figure 5. The clustering results with different L : (a) L = ± 0.05 V ; (b) L = ± 0.3 V .
Energies 12 02977 g005
Figure 6. The DBSCAN clustering results of vehicle 1.
Energies 12 02977 g006
Figure 7. (a) The voltage curves of vehicle 2; (b) The DBSCAN clustering results of vehicle 2.
Energies 12 02977 g007
Figure 8. (a) The voltage curves of vehicle 5; (b) The DBSCAN clustering results of vehicle 5.
Energies 12 02977 g008
Figure 9. (a) The VDI curves of vehicle 1; (b) The CND curves of vehicle 1; (c) The VDI curves of vehicle 2; (d) The CND curves of vehicle 2.
Energies 12 02977 g009aEnergies 12 02977 g009b
Figure 10. Fault frequencies of battery cells in: (a) vehicle 1; (b) vehicle 2.
Energies 12 02977 g010
Figure 11. (a) Clustering result of vehicle 3; (b) Fault frequencies of battery cells in vehicle 3; (c) Clustering result of vehicle 4; (d) Fault frequencies of battery cells in vehicle 4.
Energies 12 02977 g011
Figure 12. Fault frequencies by 3r-MSS of battery cells in: (a) vehicle 1; (b) vehicle 2; (c) vehicle 5; (d) vehicle 6.
Energies 12 02977 g012