1. Introduction
Lithium-ion batteries have been widely used in portable electronic devices, electric and aerospace vehicles, and energy storage systems because they offer high energy and power density, and long cycle life operation [
1,
2]. The performance of lithium-ion batteries can be evaluated by capacity, stored energy, and internal resistance. The capacity is also often used as a health indicator because it represents the amount of time that a fully charged battery can operate for a given current and temperature condition.
In a charge–discharge cycle, lithium ions are shuttled between the positive and negative electrodes, where active materials provide accommodations in their lattice [
3]. Loss of lithium inventory in active material, loss of active material, and reaction kinetics degradation collectively determine the amount of charge a battery can deliver [
4]. The maximum amount of charge that a battery can deliver decreases with the time of storage (rest) and usage (charge–discharge cycles) [
5]; this phenomenon is known as capacity fade. For lithium-ion batteries, the end-of-life (EOL) is defined as the time when 80% of the nominal capacity remains, and is an indicator of how often the batteries will need to be recharged to carry out their mission. This definition is in the standards for electric vehicles [
6,
7], and is used by most companies, including Apple [
8].
It has been shown that a knee point marks a rapid capacity fade trend to the EOL [
9,
10,
11,
12,
13,
14,
15]. In addition, the energy efficiency—defined as the ratio of the discharge energy to the charge energy—exhibits a more dramatic decrease near the EOL because of the significant energy loss due to an increase of the battery resistance. Neubauer and Pesaran [
9] used the knee point to define the EOL, but this has not been a widely accepted definition of EOL, as noted above.
Williard [
10] and He et al. [
11] tested LiCoO
2-based batteries with different capacities at room temperature and observed that the capacity initially faded in an approximately linear fashion, followed by a pronounced reduction rate (the knee point). Smith et al. [
12] compiled the capacity degradation data of 2.2 Ah LiFeO
4-based batteries from various research groups, and noted that 13 out of more than 50 testing conditions showed the existence of a knee point. For Li(NiMnCo)O
2-based batteries, Yang et al. [
13] noted that the capacity of cells tested at 25 °C tended to exhibit an exponential decay after the knee point, while Ecker et al. [
14] and Schuster et al. [
15] found that the capacity of cells tested at 35 °C experienced a sudden drop after a certain number of cycles. The capacity fade of cells with lithium titanium oxide anode and Li(NiMnCo)O
2 cathode also showed a two-stage degradation characteristic when cycled at 55 °C [
16].
The above literature shows that knee points occur under all operating conditions and can appear before or after the EOL is reached. Identifying the occurrence of a knee point can be used to schedule battery replacements, and can serve as a guide for secondary use. In the
IEEE Standard 485™-2010 “IEEE Recommended Practice for Sizing Lead-Acid Batteries for Stationary Applications” [
17], the “knee” of the capacity fade curve is mentioned to guide battery replacement; however, it does not provide an approach to identify (quantify) the “knee”.
While a knee point can often be approximately identified visually once data are plotted, the difference between observers can be as much as 100 cycles, and there is no standard approach or algorithm that can always identify the location. For example, Smith et al. [
6] modeled two-stage degradation behaviors and described the properties of the second derivatives of the capacity fade curve. However, they did not provide a method to identify the knee point. Han et al. [
16] approximated the capacity fade using the intersection of a step-wise linear function to locate the knee point. This method requires one to determine the intervals of the step-wise linear function in advance, and thus it is not automated and cannot be computed.
Yang et al. [
13] and Han et al. [
16] used an inflection point as an alternative term to the knee point, and Satopaa et al. [
18] used the point with the maximum curvature to locate the knee point. The inflection point is a point of a curve at which a change in the direction of curvature occurs (i.e., the curve changes from being concave to convex, or vice versa). A necessary condition for an inflection point is that its second derivative should be zero. The curvature is given by:
where
and
are the second and first derivatives of functions, respectively. Knee points are often considered to be located where the curvature reaches a local extremum. However, neither the inflection point nor the point with the maximum curvature can represent the knee point on capacity fade curves of lithium-ion batteries in general.
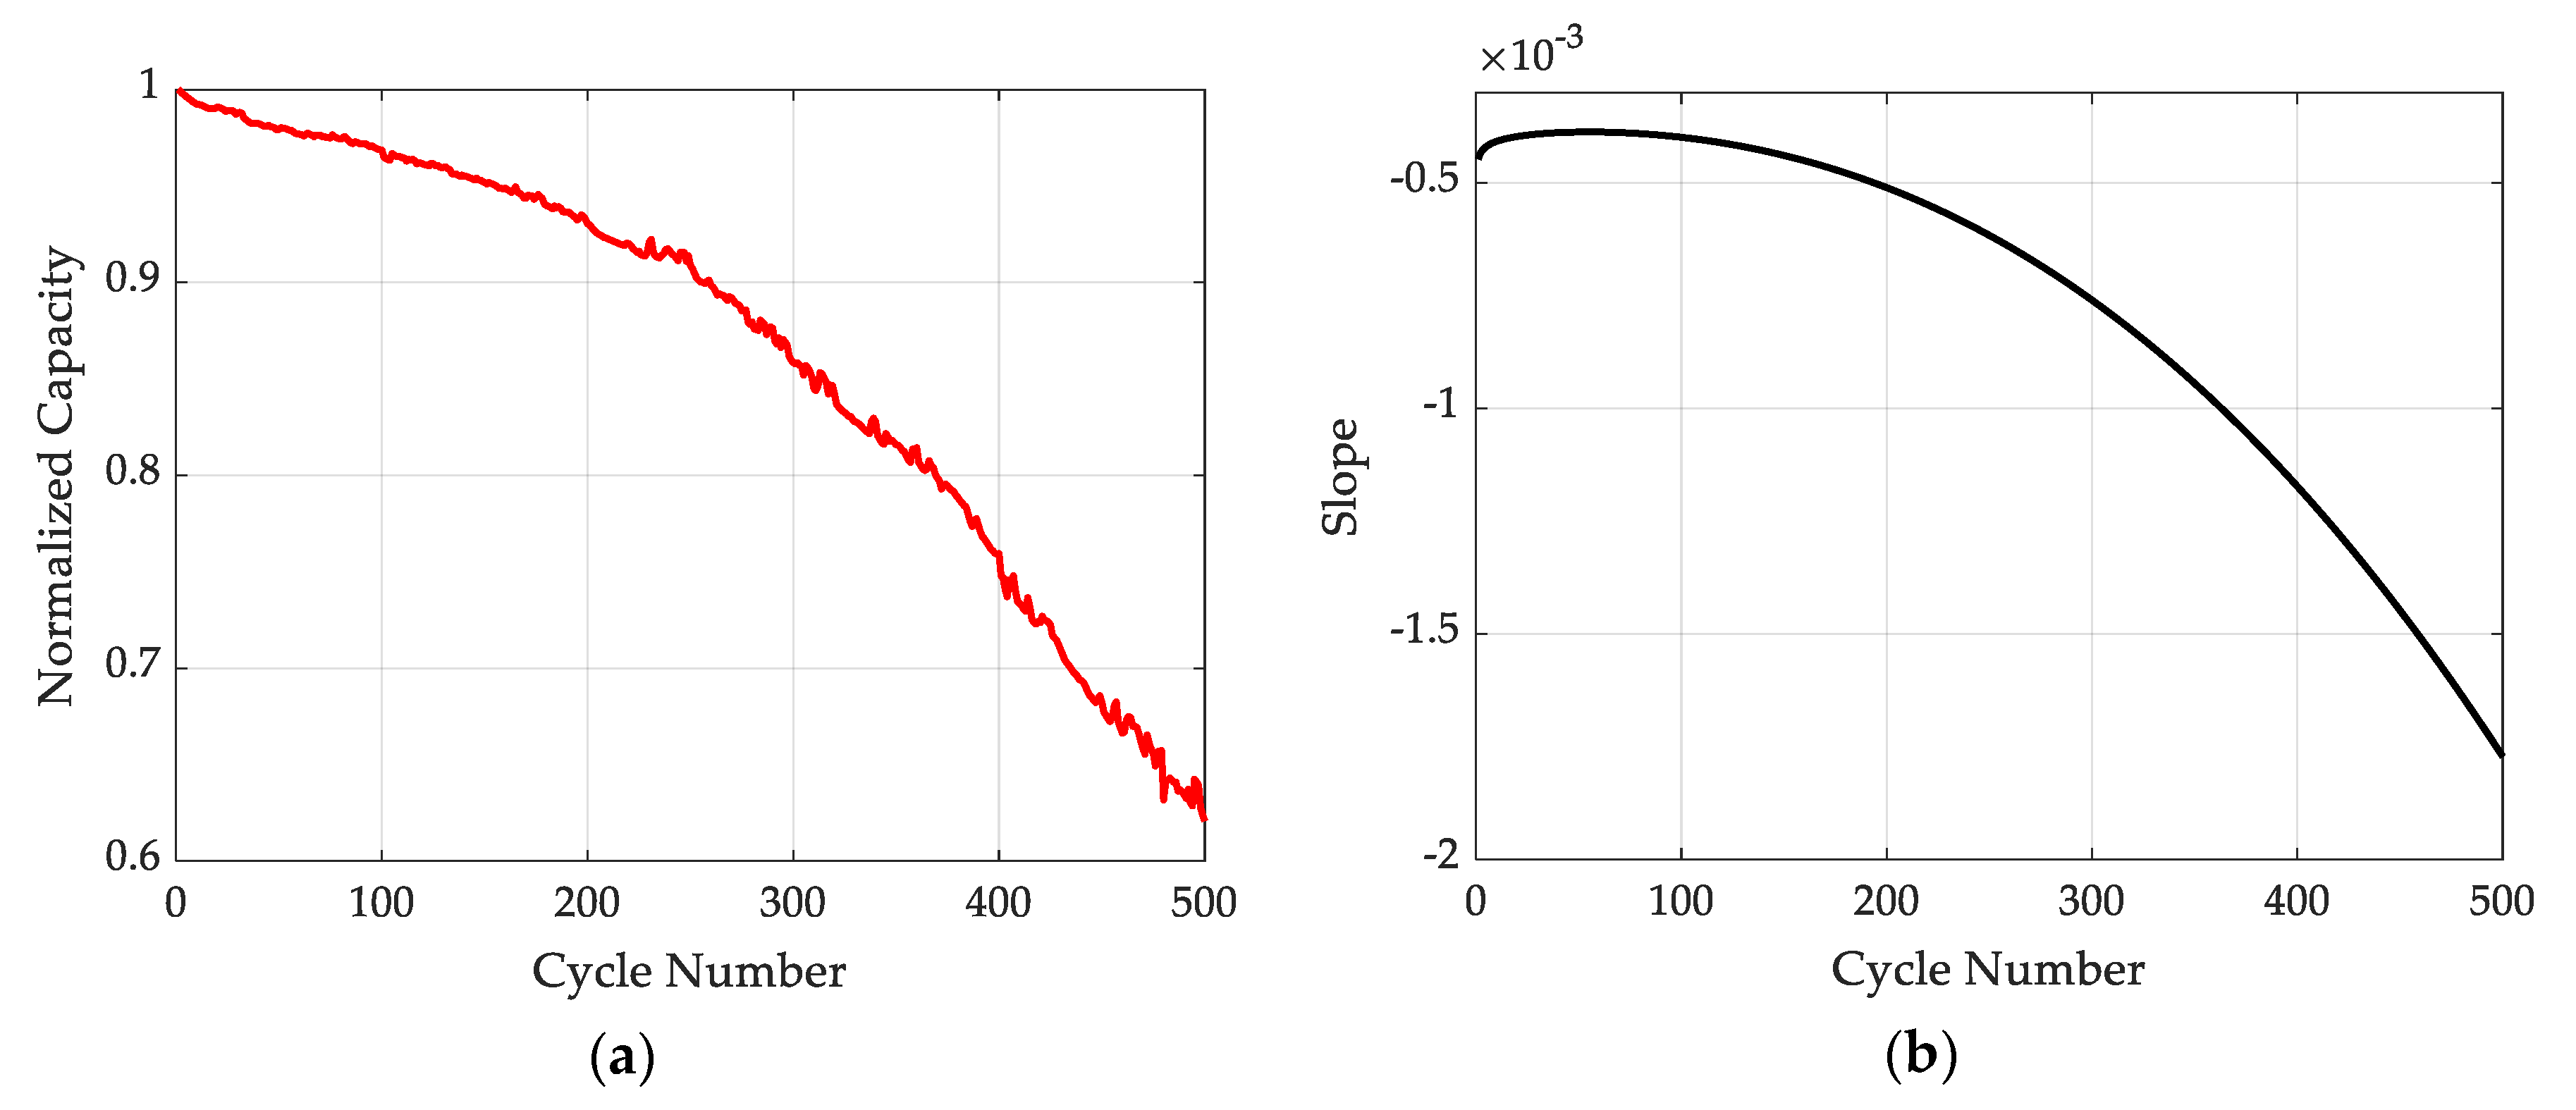
The problem is that for capacity fade curves, there is no maximum or minimum in the slope of the curve (as will be shown in the case studies). That is, one cannot define a knee point or draw a tangent line because the slope is continuously monotonically changing after the knee point occurrence. For example,
Figure 1a shows a typical set of normalized capacity fade data. The slope of the capacity fade curve (
Figure 1b) shows that the tangent is monotonically changing in the fast degradation stage (i.e., after knee point occurrence). Thus, there is no general algorithm that can assess a knee point using the slopes.
This paper defines a knee point and develops an algorithm to determine the knee point from test data. The approach involves two parts: the development of an empirical model to characterize the capacity fade trend, and then identify the points with the minimum and maximum absolute slope-changing ratio to locate two tangent lines.
Section 2 presents the definition and the algorithm used to determine a knee point.
Section 3 presents case studies and the implementation of the algorithm mentioned above, along with comparisons.
Section 4 provides conclusions.
3. Case Studies
To assess our approach, a cycling test for pouch-shaped lithium-ion batteries was conducted at four different temperature conditions: 10, 25, 45, and 60 °C. Eight samples were measured at each temperature condition. The major composition of cathode, anode, and electrolyte was LiCoO2, graphite, and LiPF6-salt mixed with the organic solvent, respectively. The nominal capacity was 3.36 Ah and the operation voltage range was 3.0–4.4 V. The discharge C-rate and charge cut-off C-rate were 0.7C and C/40, respectively.
After every 50 cycles, the samples were charged and discharged using a standard profile for discharge capacity characterization. Two constant current constant voltage (CCCV) charging stages were recommended for these cells by battery manufacturers. These constant current (CC) and constant voltage (CV) charging sub-stages were: ① CC: 1.5 C until voltage reaches 4.2 V; ② CV: 4.2 V until current drops to 1 C; ③ CC: 1 C until voltage reaches 4.4 V; ④ CV: 4.4 V until current drops to C/40, followed by a CC discharge at 0.7 C. The rest time between the charge and discharge stages was 5 min. A typical characterization cycle took about 3.5 h for new cells. The cycling profile was identical to the standard profile used for the characterization test. All characterization tests were conducted at 25 °C.
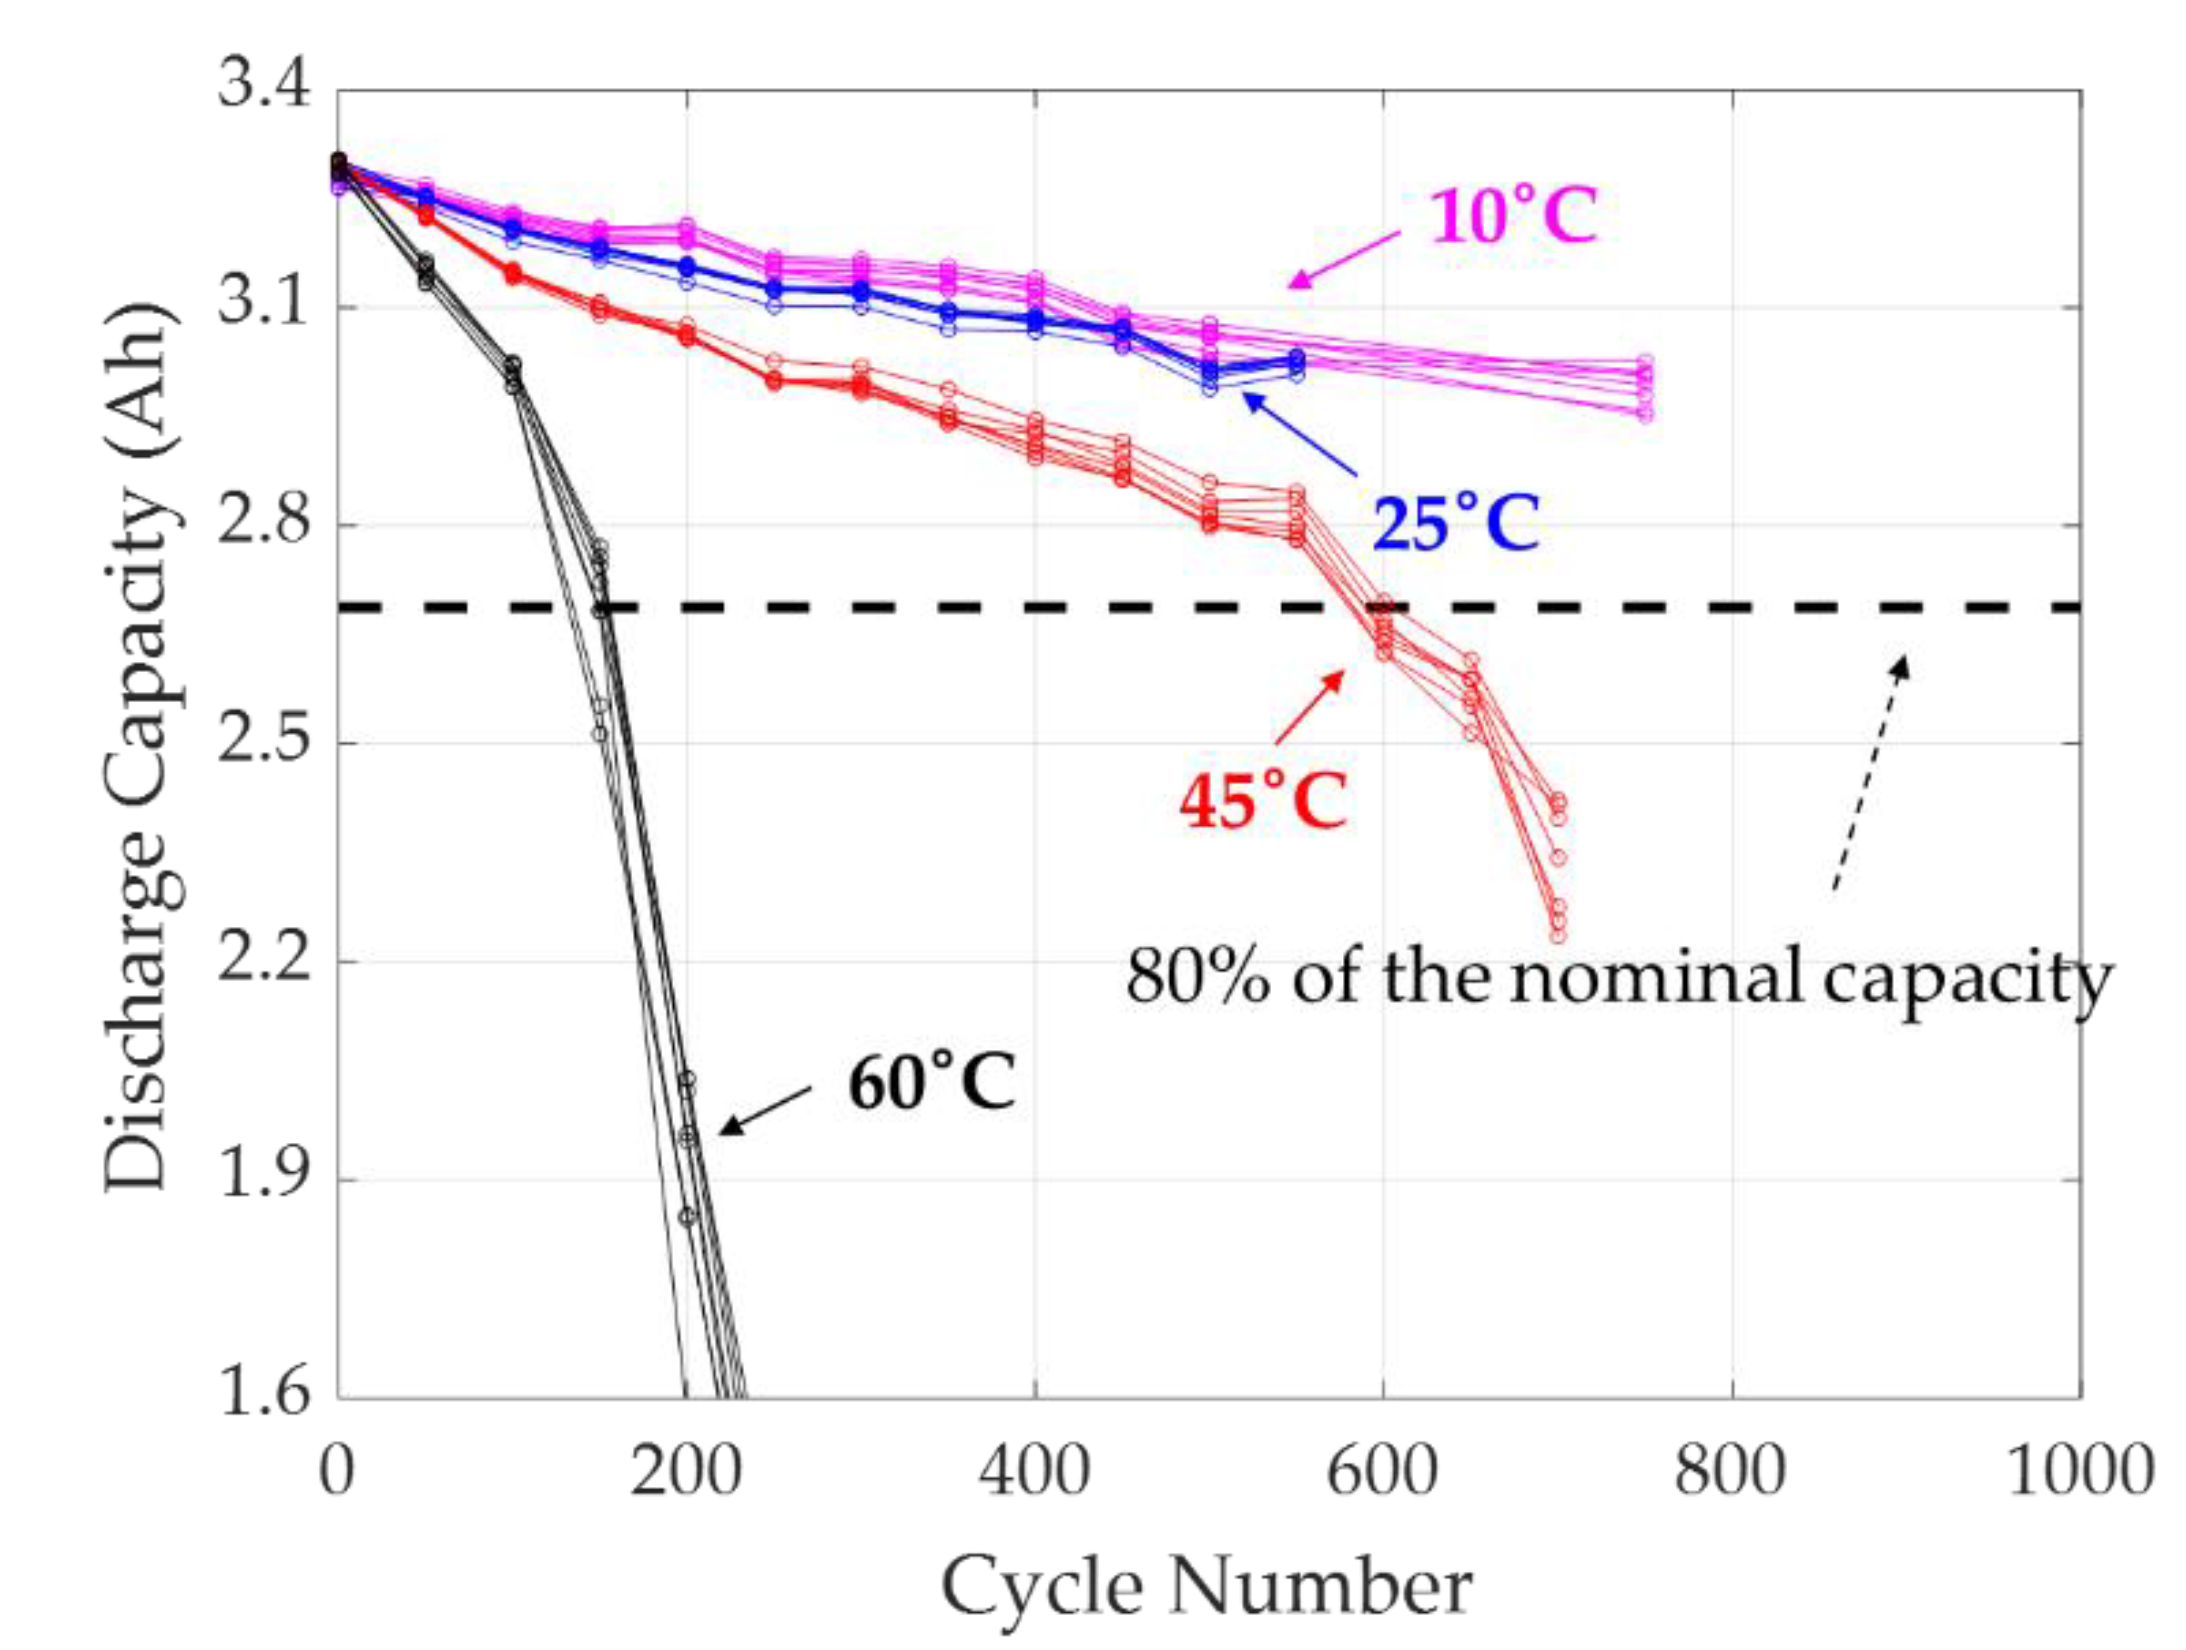
Figure 2 shows the capacity degradation curves at different temperatures. Visually, one can identify the knee point to occur around the 100th cycle for the capacity fade curves at 60 °C. The capacity fade curves at 45 °C showed similar two-stage characteristics but with a slower degradation rate. The knee point can be visually assessed to be around the 550th cycle. The knee points at both 45 and 60 °C occurred before the discharge capacity reached 80% of the nominal capacity.
Our approach first involves a characterization of the capacity fade curve, using the model [
19]:
where
NDC is the normalized discharge capacity;
N is the number of cycles; and
a,
b,
c, and
d are the model coefficients to be determined. In this model, three coefficients in the double power law model in Equation (4) vary as a function of temperature:
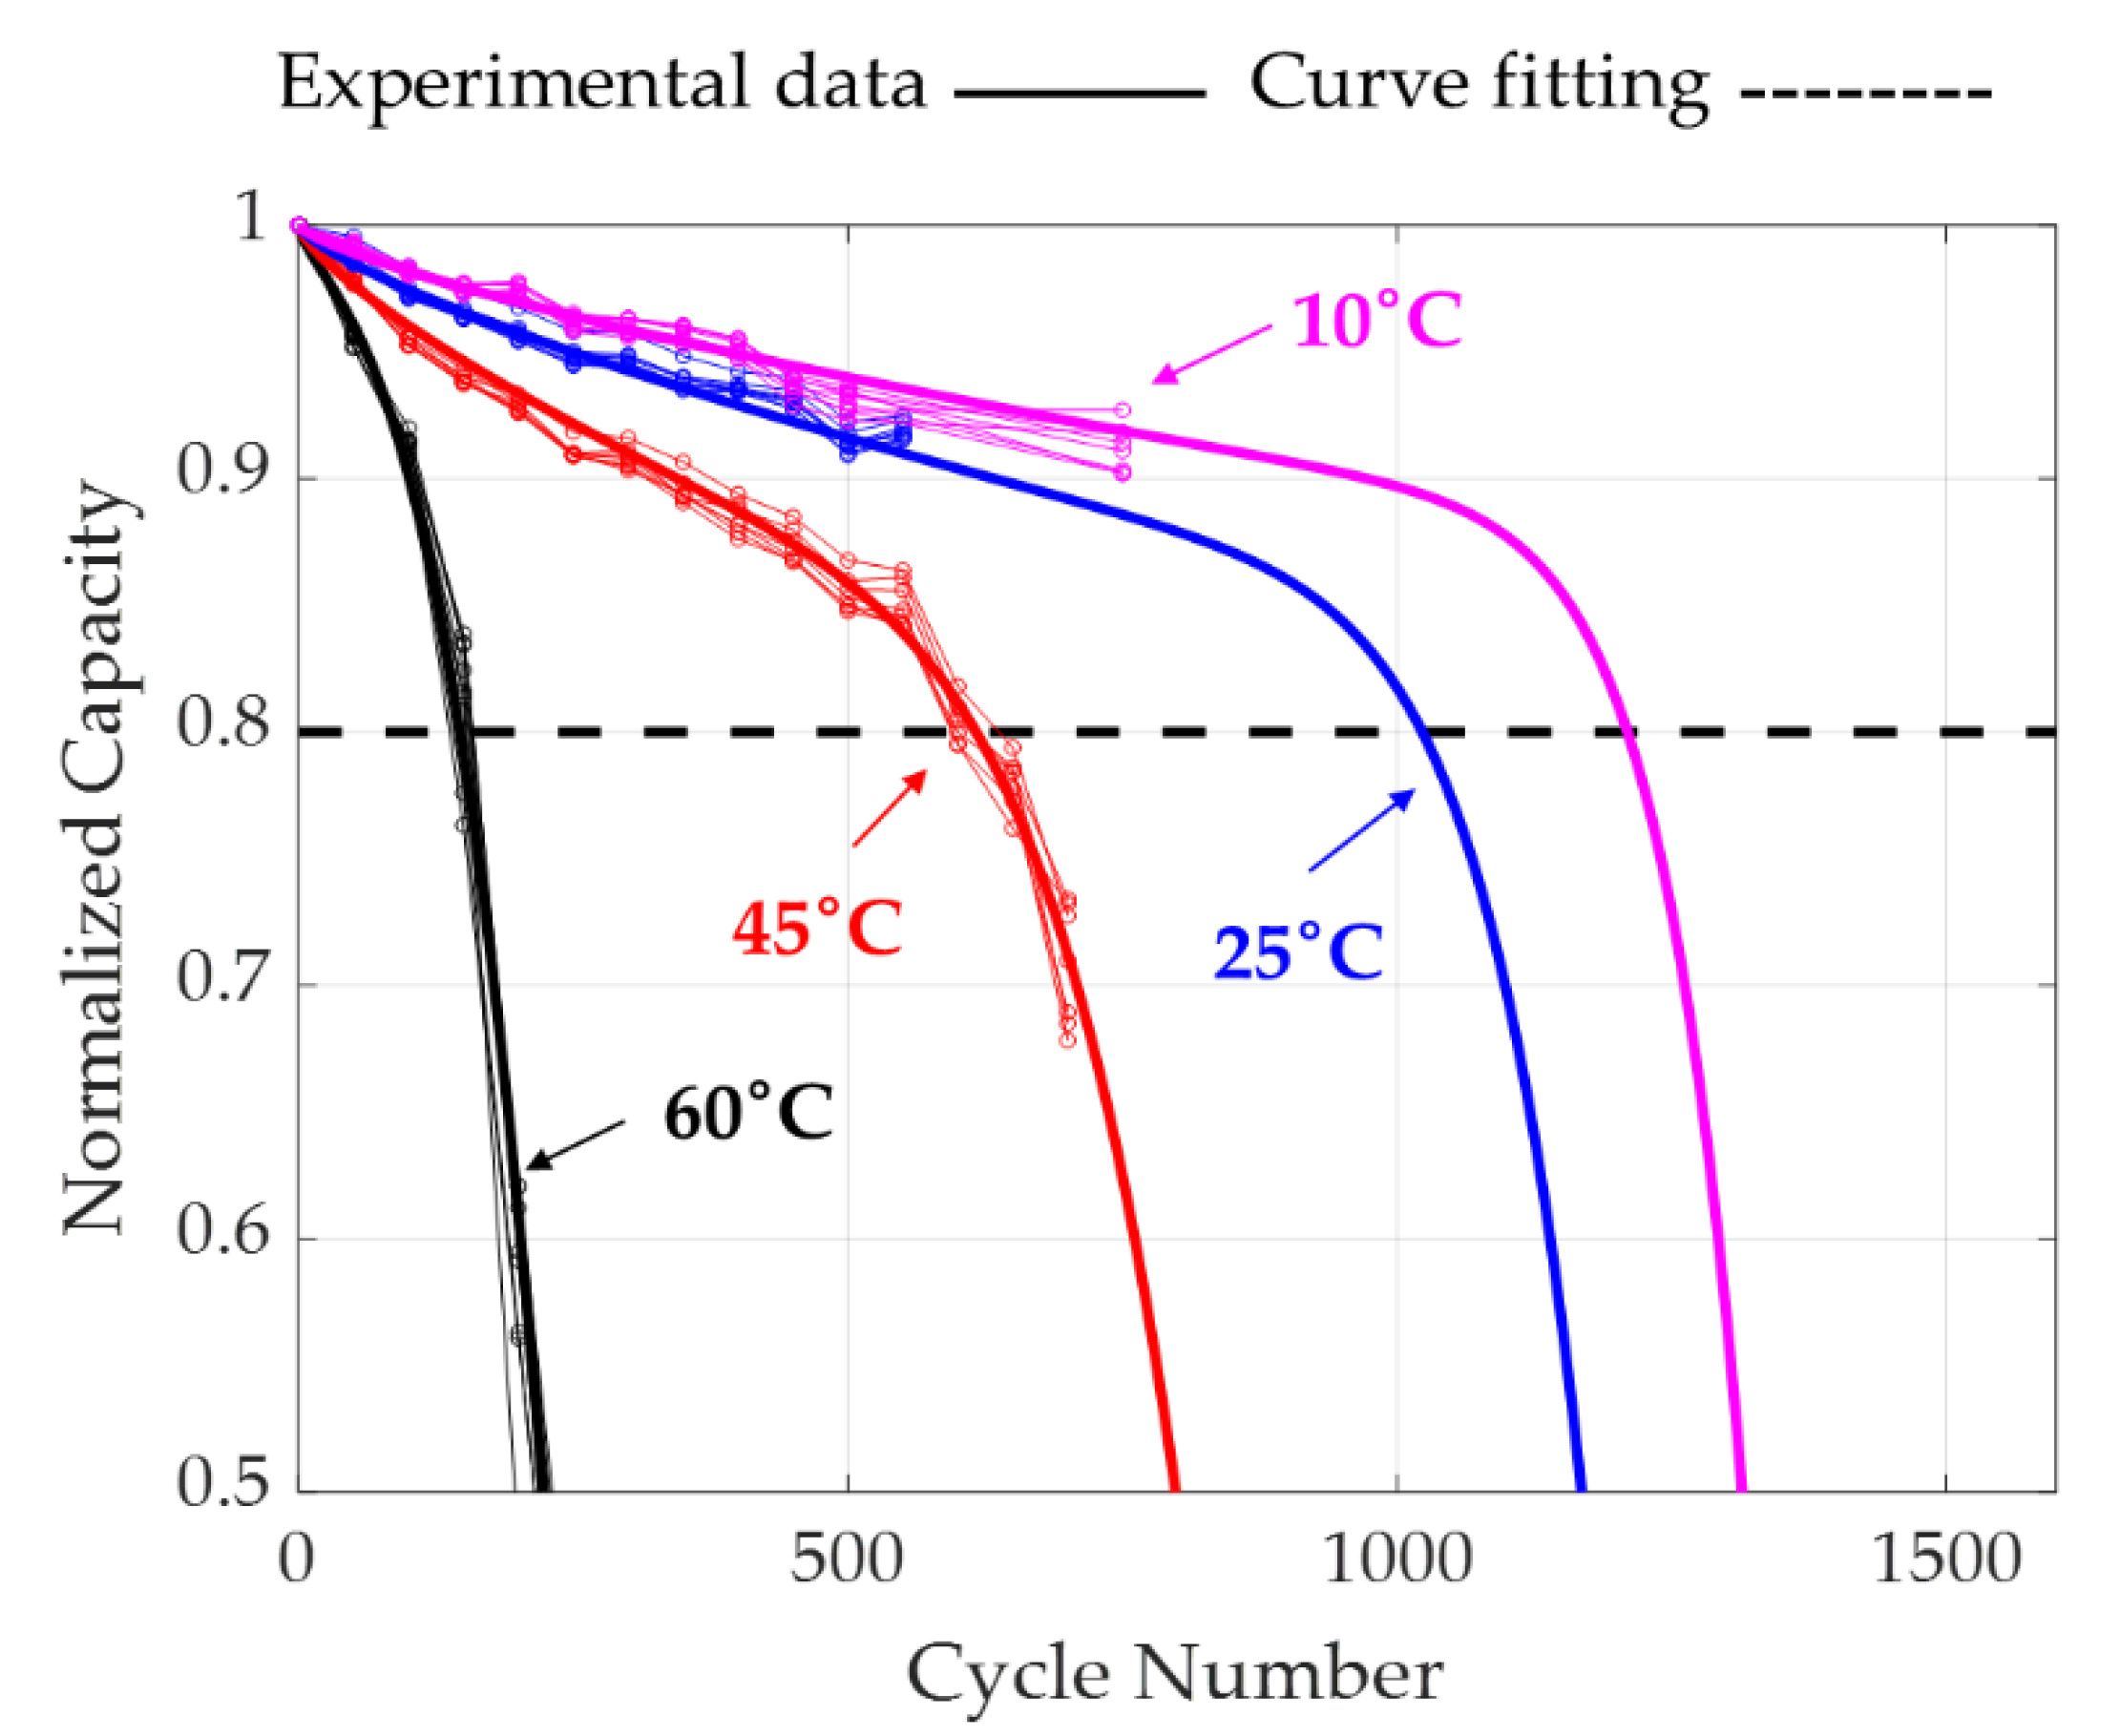
The fitted results are shown in
Figure 3. It is evident that the fitted curves agree well with the experimental data (R
2 = 0.9774).
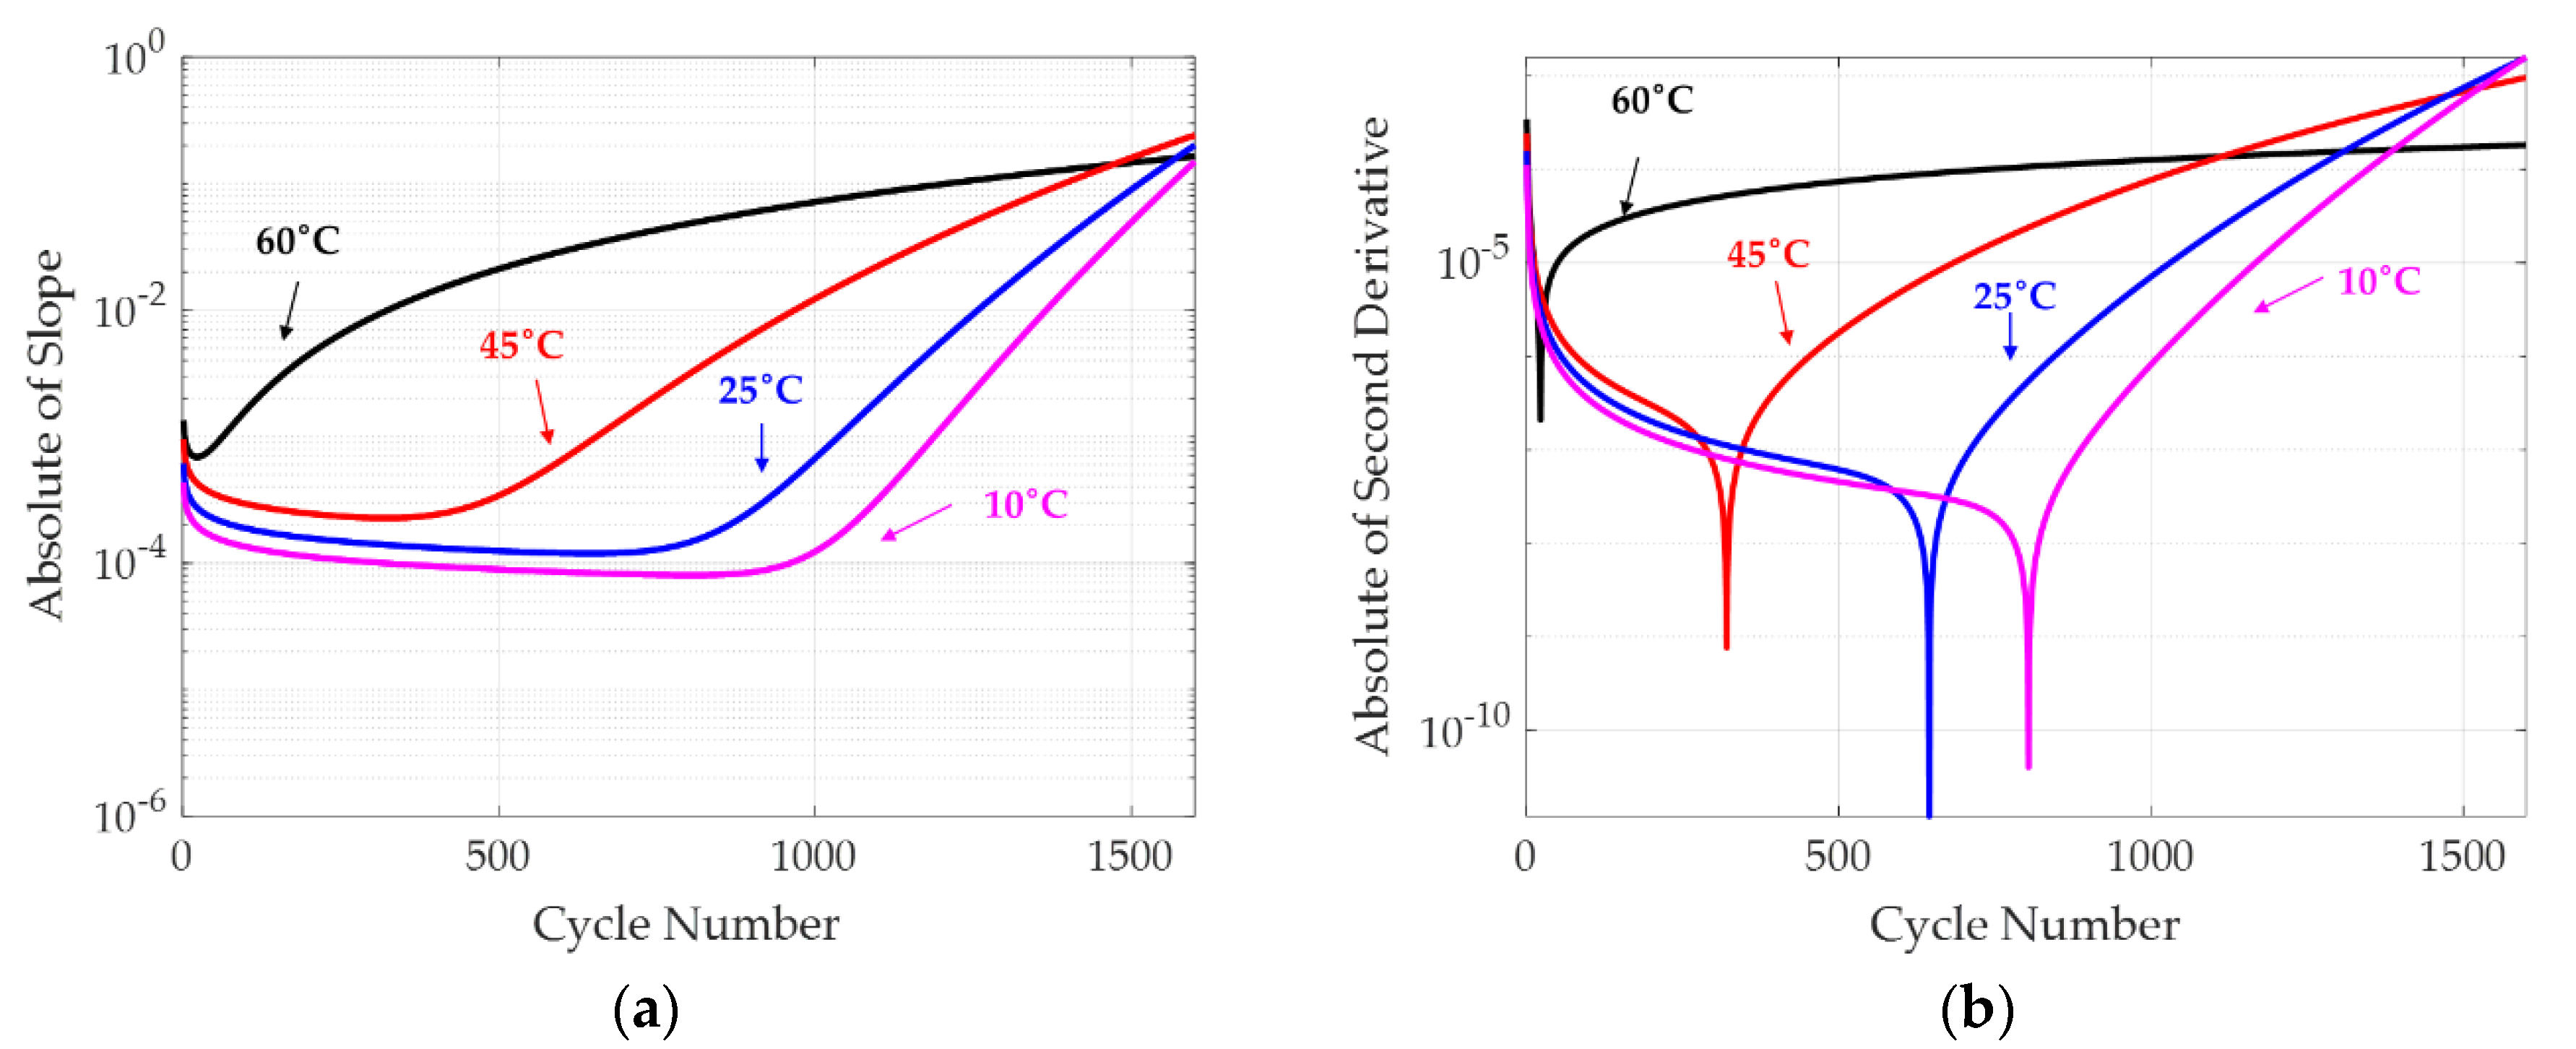
Figure 4a,b shows the absolute of slopes and second derivatives of each capacity fade curve in
Figure 3, and they are constantly monotonically changing in the second degradation stage. Comparing
Figure 4 with
Figure 3 demonstrates again that the slope quantity or the second derivative quantity alone [
6] cannot be used to locate the knee point.
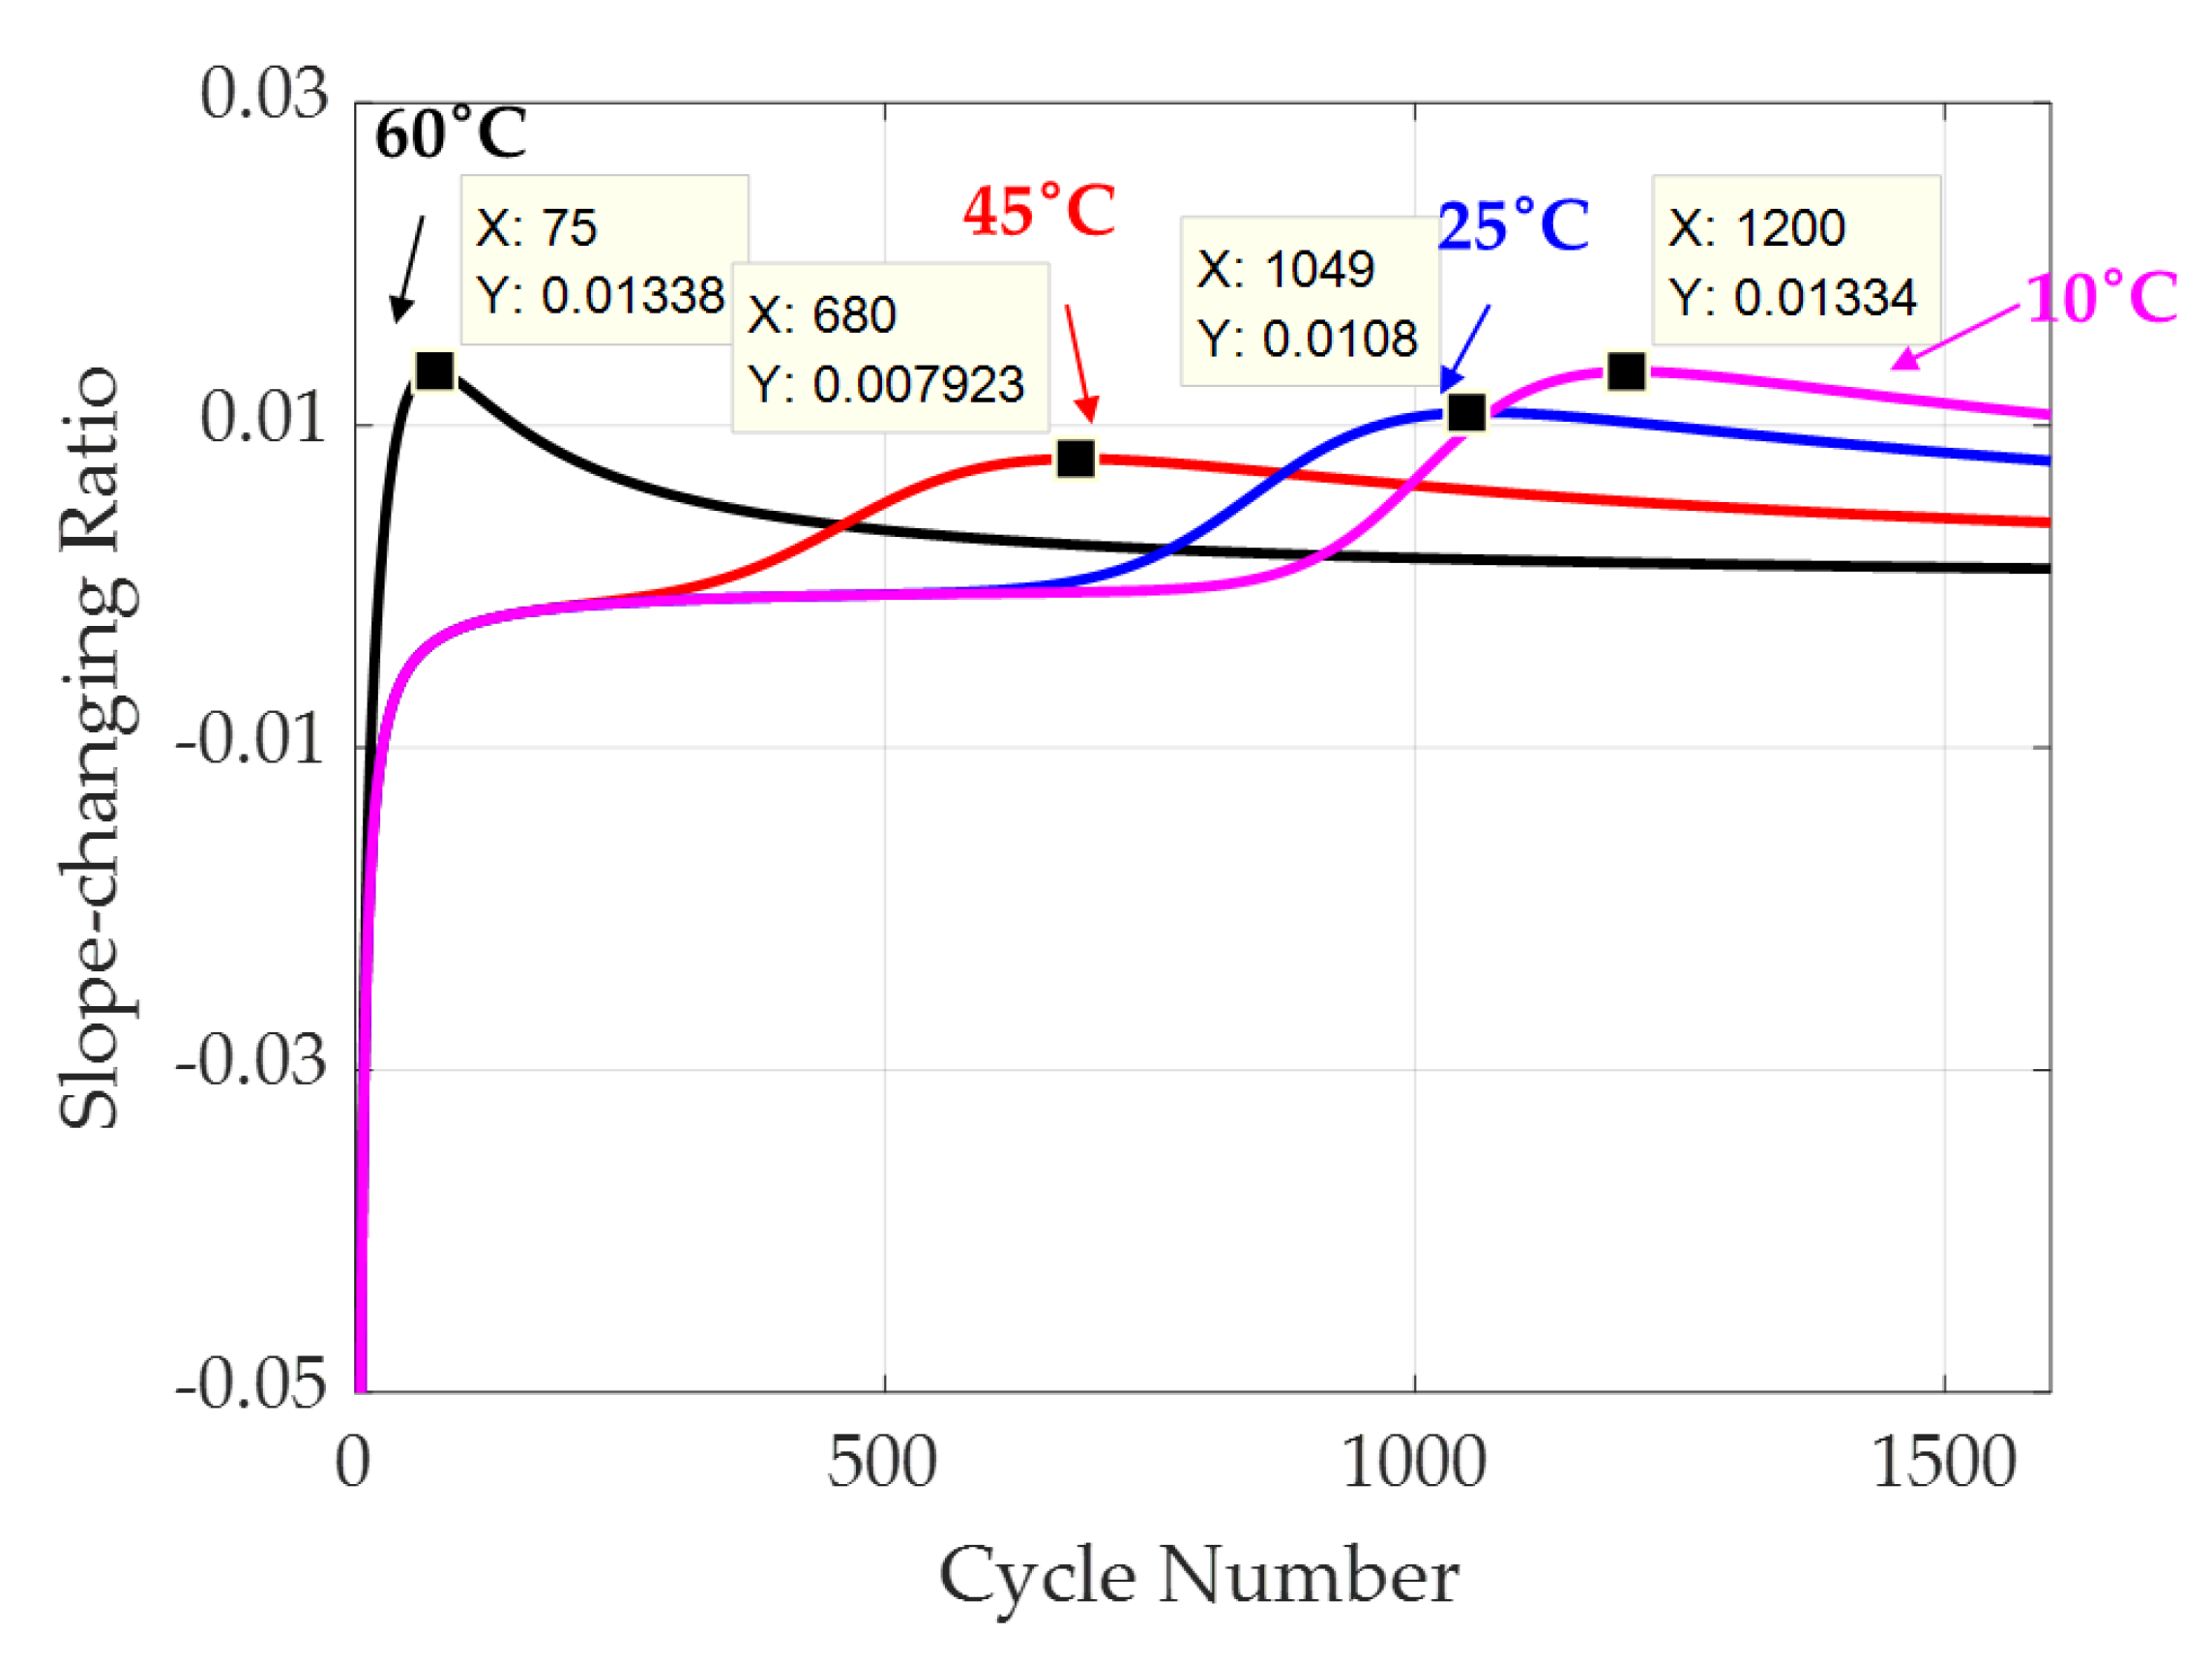
Figure 5 shows the slope-changing ratio of each fitted curve in
Figure 3. The maximum point of each slope-changing ratio curve is marked on the plot.
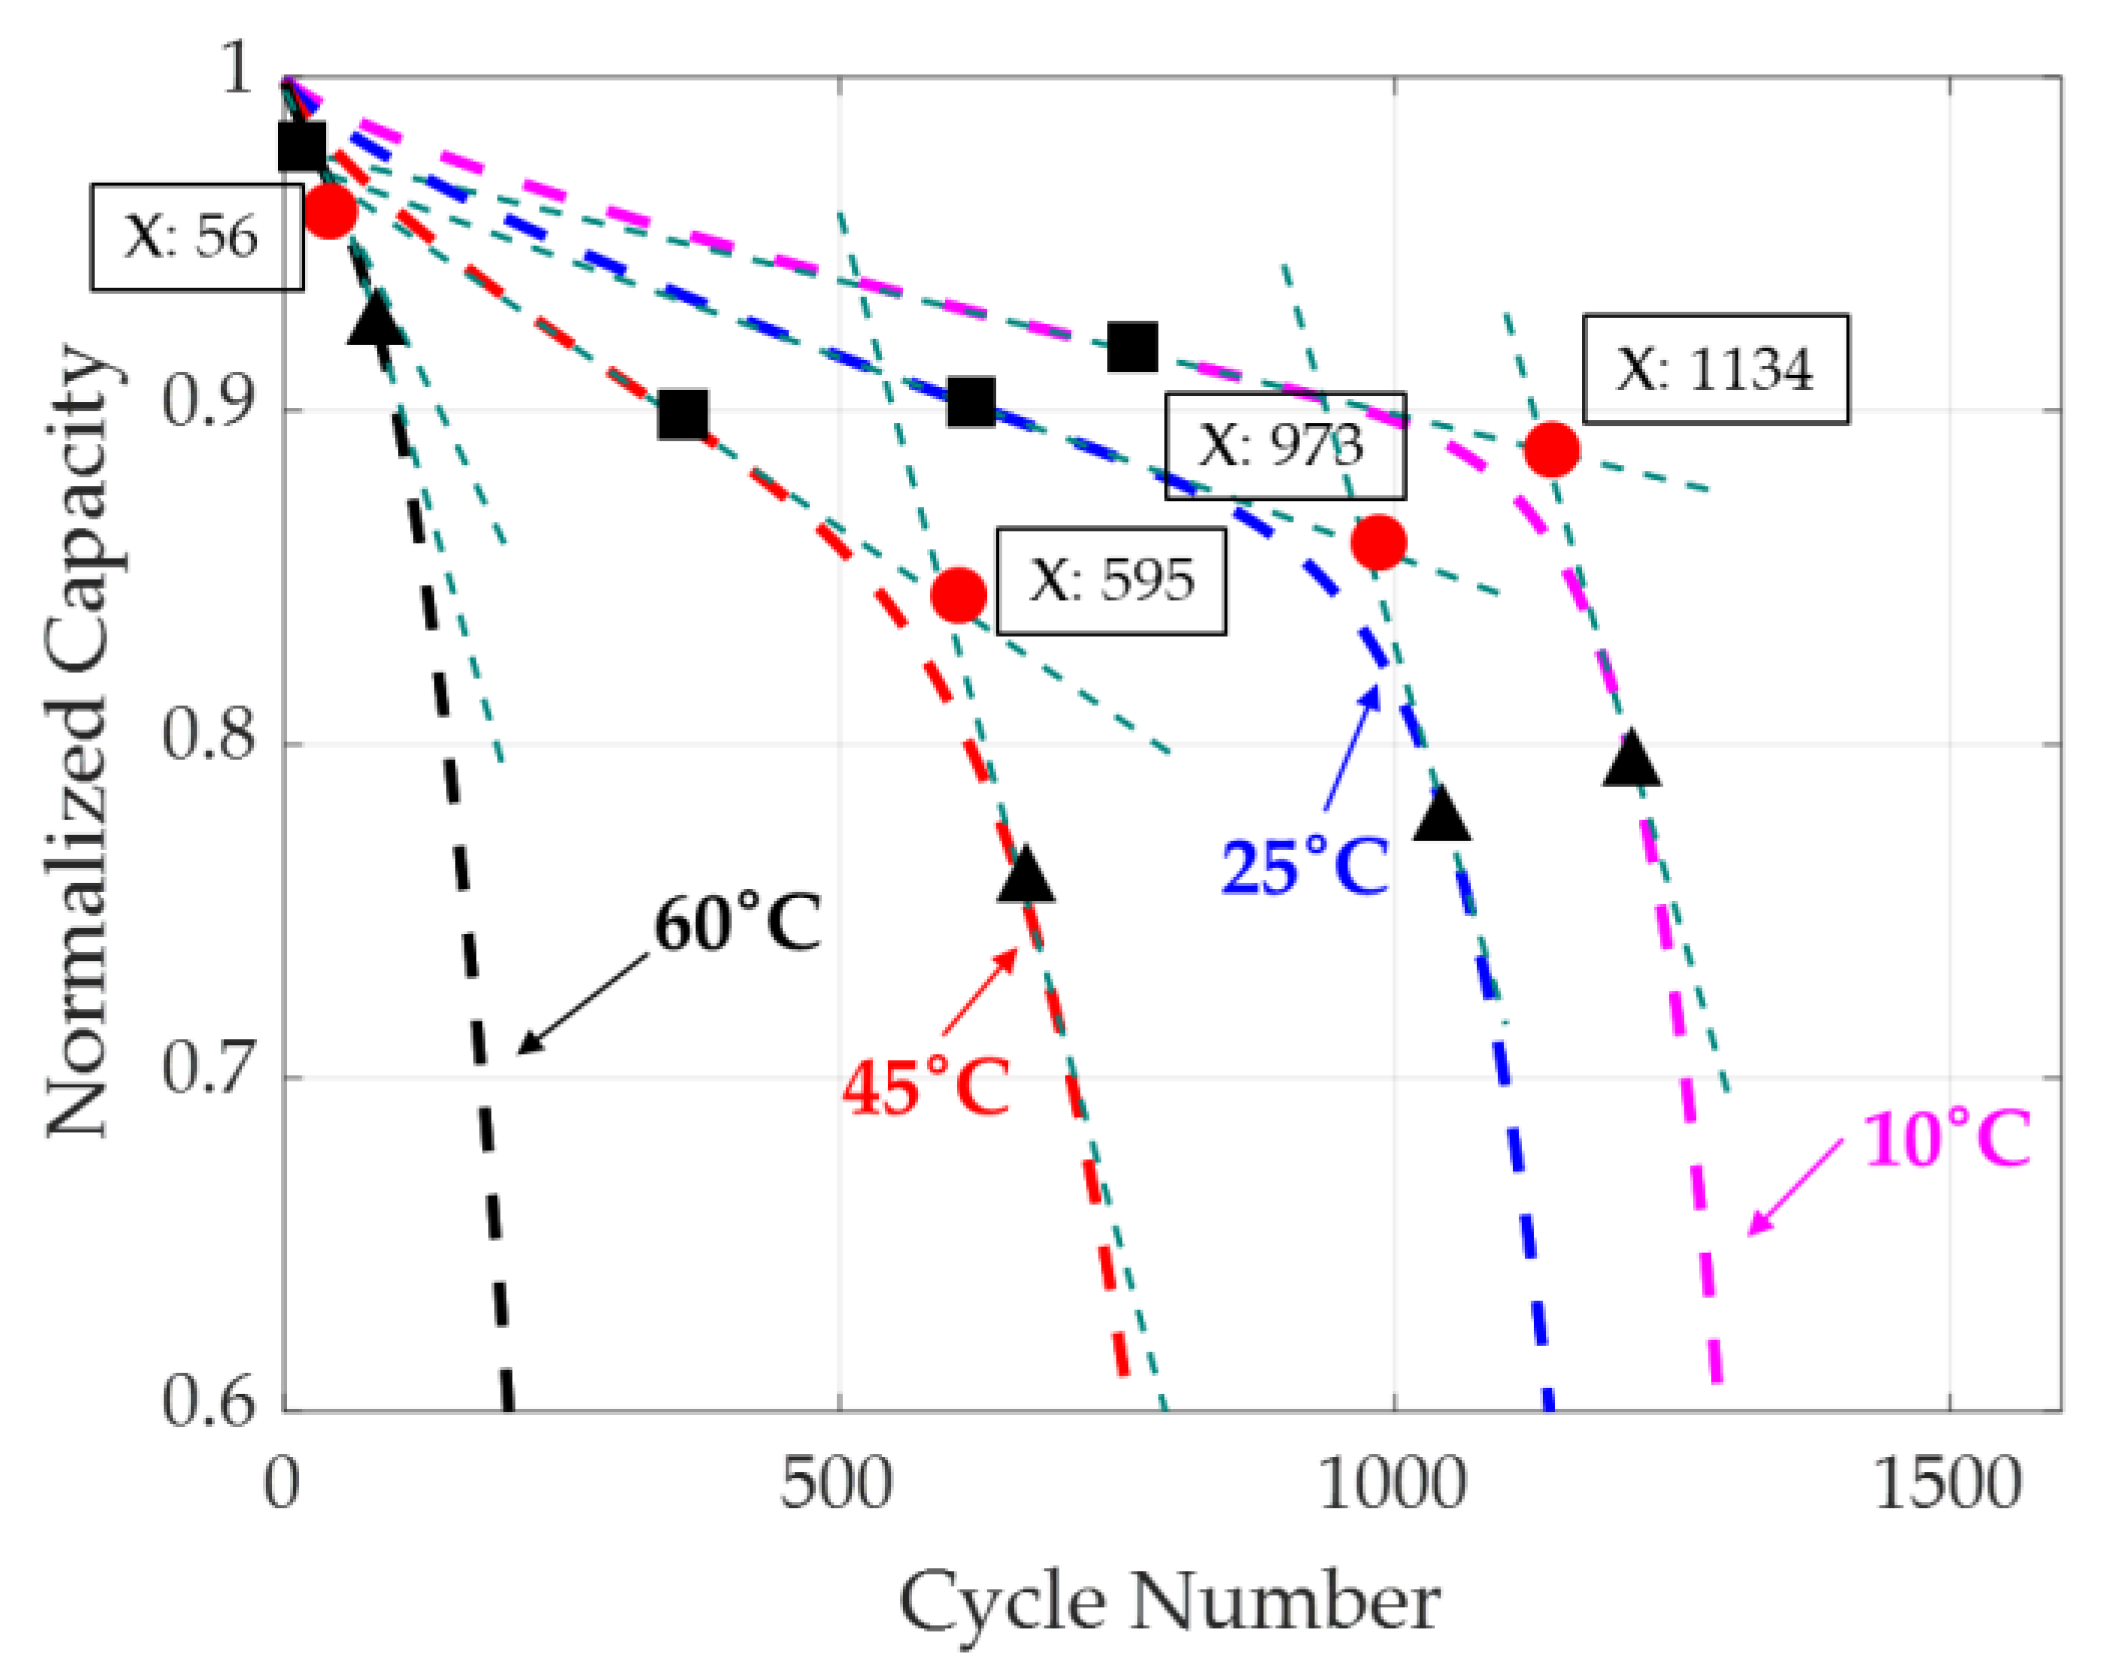
Figure 6 shows the identified knee points of fitted degradation curves at different temperatures. The points with minimum and maximum absolute slope-changing ratio are marked on the plot using black squares and black triangles, respectively. The corresponding tangent lines of each curve are plotted, and the intersections of the tangent lines are marked using red solid circles. The number of cycles at the intersection is when the knee occurred.
The performance of the knee identification methods mentioned in the Introduction was compared to our developed knee definition in
Table 1, based on the double power law model. The inflection points and the points with the maximum curvature on each curve are shown in the second and third columns of
Table 1, respectively. The inflection points (also the points with minimum absolute slope-changing ratio) are marked in
Figure 6 using black squares, and they are clearly not representative of a knee point. The knee points on the capacity fade curve also could not be identified by the maximum curvature. This is because—as shown in the third column in
Table 1—the points with the maximum curvature in fact did not occur in the range of battery life cycles.
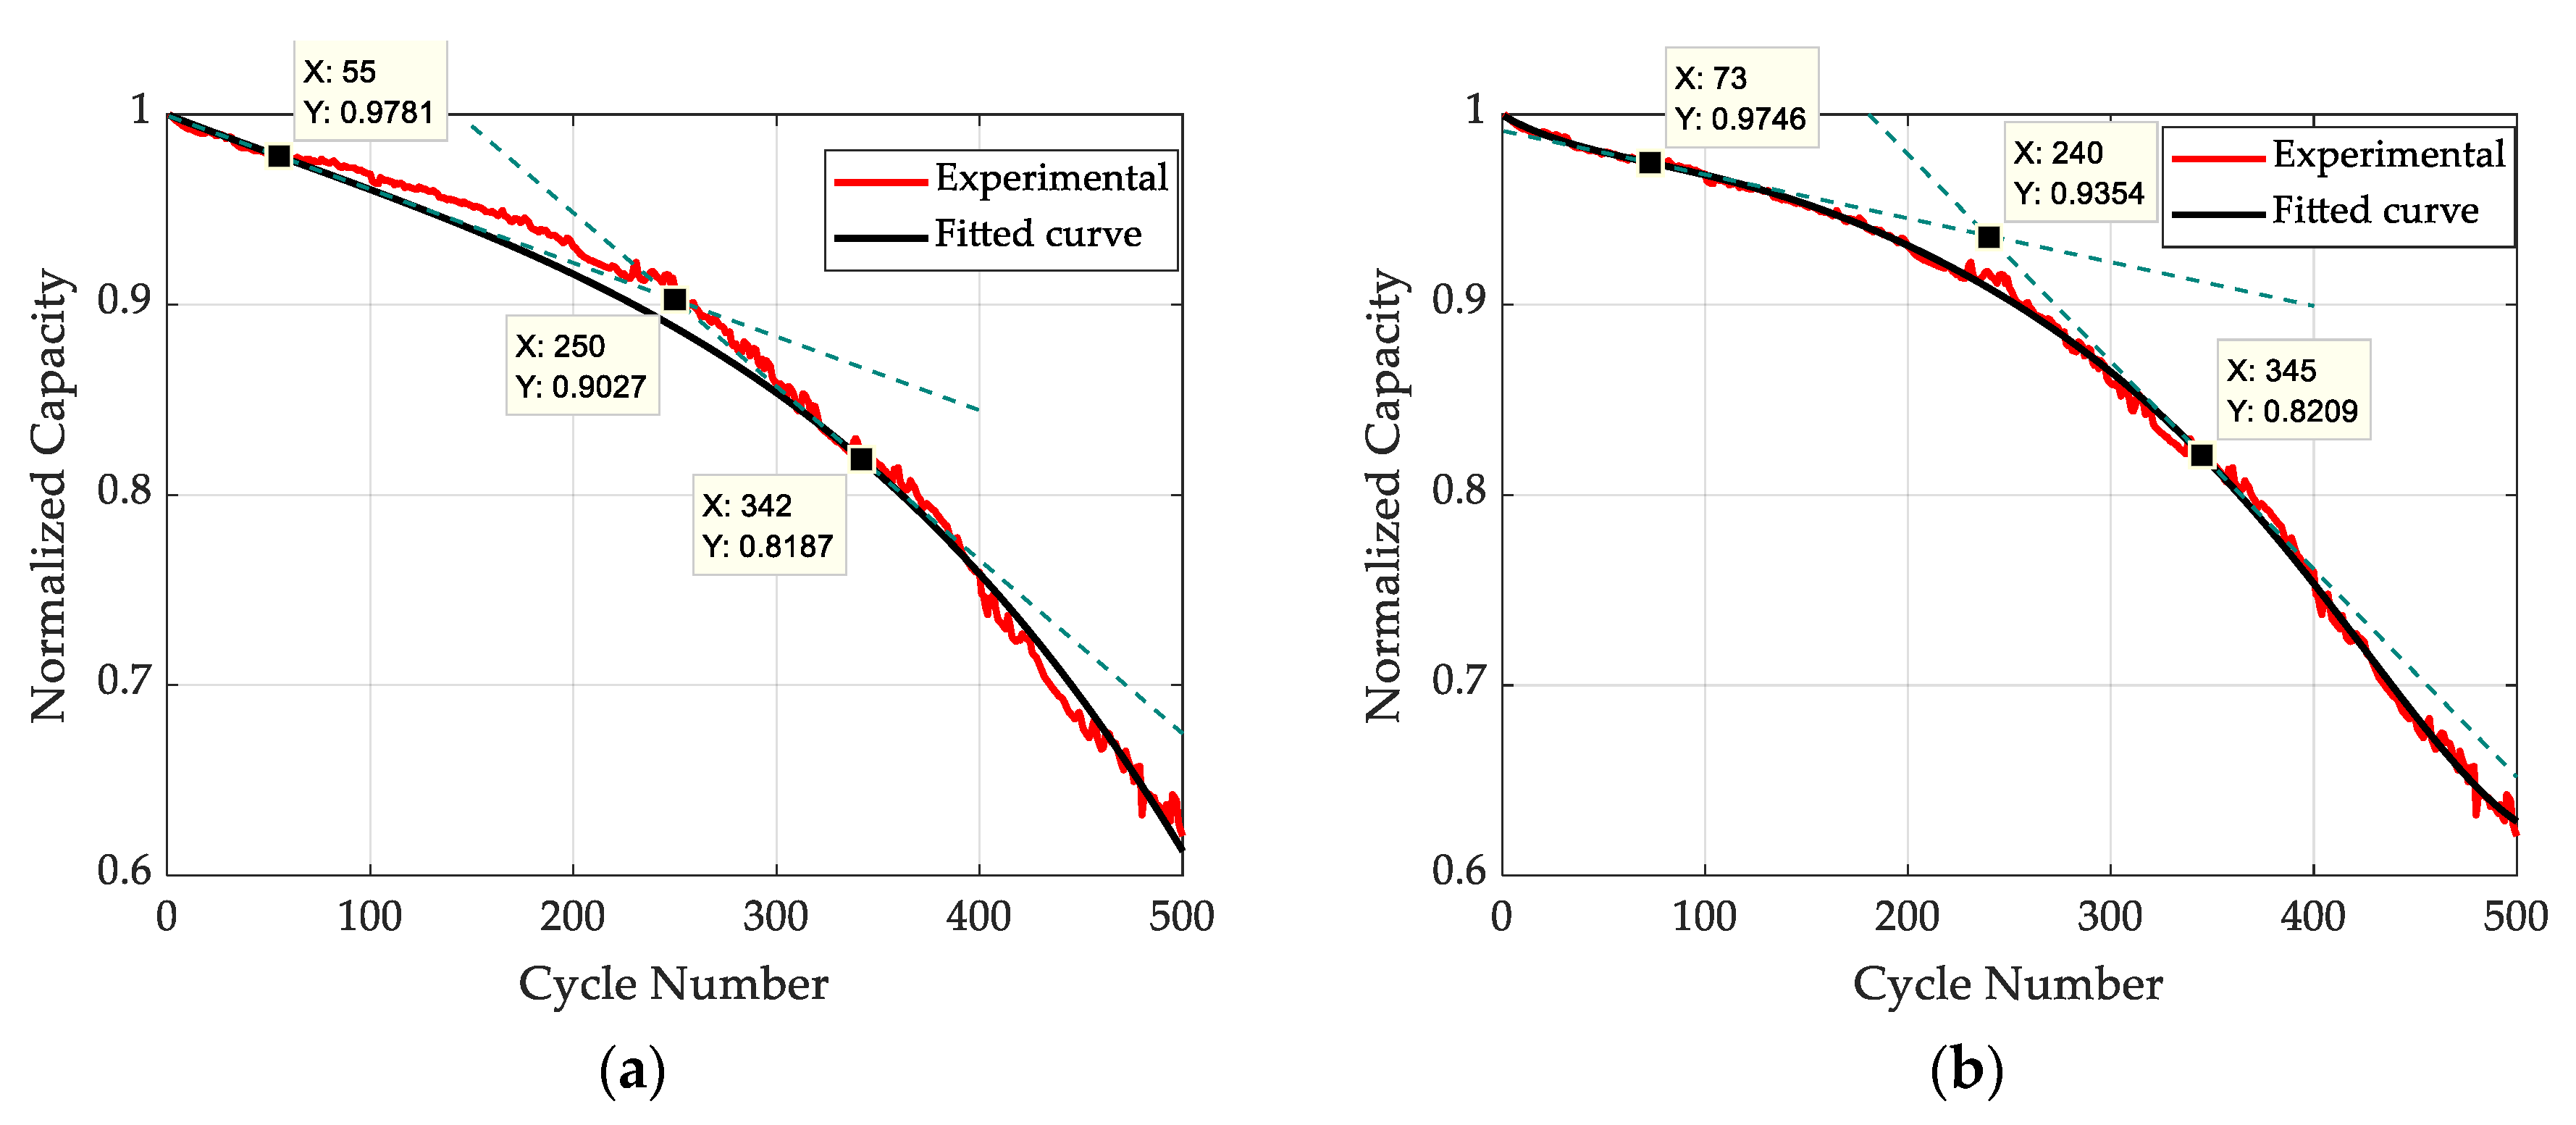
The effectiveness of the developed knee point definition was assessed on the data set of capacity fade of lithium-ion batteries presented in the Introduction, based on the model defined by Equation (4). The points with minimum (cycle = 55) and maximum absolute slope-changing ratio (cycle = 342) are marked in
Figure 7a. The identified number of cycles when the knee point occurred was 250, which is visually consistent with the sharp transition in the capacity fade rate. As noted, the other methods—inflection point (cycle = 55) method and maximum curvature (does not exist in this case) method—did not provide the knee point. The MATLAB code used to identify the knee point is provided in the
Appendix A.
A 6th-order polynomial was also fitted to these data. As shown in
Figure 7b, by assessing the slope-changing ratio, the number of cycles when the knee point occurred was around 240, which is in agreement with the developed method (see
Figure 7a).
4. Conclusions
The occurrence of knee points indicates the onset of rapid deterioration in the capacity fade of lithium-ion batteries, and thus serves as an indicator of rapid battery degradation. It is also a metric that can be used in combination with the 80% capacity fade threshold to assess the long-term (useful life) performance and reliability of a battery. This indicator/metric is therefore valuable in qualification assessment, the maintenance scheduling of batteries in commercial electronic systems, and in evaluating and planning secondary use of batteries (e.g., in electric vehicles).
To address the challenge of identifying the knee point on capacity fade curves in a concise, repeatable, and automated manner, the knee point was defined uniquely as the cycle number at the intersection of two tangent lines on the capacity fade curve. The tangent lines were obtained from the points with the minimum and maximum absolute slope-changing ratio. This procedure coped with the problems associated with the existing methods (i.e., inflection point method, maximum curvature method). The enhanced performance of the developed scheme was corroborated by analyzing multiple data sets of the capacity fade of lithium-ion batteries.
Because the developed approach produced more acceptable and repeatable results than existing methods, the definition and approach are being recommended for adoption by IEEE Standard 485™-2010 “knee” metric, along with “end-of-life” to identify “degraded” behavior in batteries.


