Article

A Q-Cube Framework of Reinforcement Learning Algorithm for Continuous Double Auction among Microgrids

1
School of Electronics and Information Engineering, Tongji University, Shanghai 201804, China
2
Education Technology and Computing Center, Tongji University, Shanghai 200092, China
*
Author to whom correspondence should be addressed.
Energies 2019, 12(15), 2891; https://doi.org/10.3390/en12152891
Submission received: 9 July 2019 / Revised: 22 July 2019 / Accepted: 23 July 2019 / Published: 26 July 2019
(This article belongs to the Special Issue Market Design for a High-Renewables Electricity System)

Abstract

:
Decision-making of microgrids in the condition of a dynamic uncertain bidding environment has always been a significant subject of interest in the context of energy markets. The emerging application of reinforcement learning algorithms in energy markets provides solutions to this problem. In this paper, we investigate the potential of applying a Q-learning algorithm into a continuous double auction mechanism. By choosing a global supply and demand relationship as states and considering both bidding price and quantity as actions, a new Q-learning architecture is proposed to better reflect personalized bidding preferences and response to real-time market conditions. The application of battery energy storage system performs an alternative form of demand response by exerting potential capacity. A Q-cube framework is designed to describe the Q-value distribution iteration. Results from a case study on 14 microgrids in Guizhou Province, China indicate that the proposed Q-cube framework is capable of making rational bidding decisions and raising the microgrids’ profits.

1. Introduction

The power system has experienced the evolution from a traditional power grid to the smart grid and then to the Energy Internet (EI), driven by economic, technological and environment incentives. Distributed energy resources (DERs) including distributed generation (DG), battery energy storage system (BESS), electric vehicle (EV), dispatchable load (DL), etc. are emerging and reconstructing the structure of power systems. In future EI, renewable energy sources (RESs) are regarded as the main primary energy owing to the wide application of solar panels, wind turbines and other new energy technologies [1]. According to a recent report from the U.S. Energy Information Administration (EIA), the U.S. electricity generation from RESs surpassed coal this April for the first time in history, providing 23% of the total electricity generation compared to coal’s 20%. Meanwhile, the proportion of RES generation in Germany has already reached 40% in 2018. The considerable increase of RESs encourages a significant decrease in energy prices, which drives the reform of energy trading patterns and behaviors in the power system. In addition, flexible location and bi-direction energy trading ability of DERs lead to the transformation of management mode from centralized to decentralized [2]. In this process, the introduction of economic models to this decentralized system makes the power grid truly equipped with market characteristics [3].
As the aggregators of DERs in certain geographical regions, microgrids are important participants in the power market [4]. By implementing internal dispatch, microgrids can provide economic benefits through applying demand response projects and avoiding long distance energy transmission [5]. Moreover, microgrids give solutions for emergencies when power from the grid is disrupted. Energy trading among networked microgrids in the distribution network form the local energy market [6]. In early research and realistic practice, cooperative energy trading mechanisms have been proposed to achieve better performances on profit and management for the overall market. Models and algorithms have been investigated to describe features of the multi-microgrid system [7,8] and solve the optimization problem [9,10]. However, given a diverse internal network topology and device configurations, the microgrids’ willingnesses of joining this cooperative energy trading market differ from each other. Though some mix-strategy Nash equilibrium points have been found by theoretical proofs, the freedom of energy trading have to be sacrificed in exchange for global optimum, as the solutions to this NP-hard problem often fail to satisfy everyone. In addition, a cooperative energy trading mechanism requires detailed information on power prediction and operating data of every device in the microgrids. This will expose residential energy consumption habits and behavioral preferences, causing privacy protection issues. Non-cooperative energy trading mechanisms are urgently needed. The development of information and communication technologies (ICTs) provides ideas for solving the above problems.
With the application of advanced ICT in the energy market, the degree of informatization has been greatly improved. Smart meter, mobile internet, blockchain and 5G, etc. help to extend the traditional power system to a three-layer architecture [11,12]: the bottom layer is the network of power devices and transmission lines. The middle layer is the network of information nodes, in which the ICTs play a very important role. Software-based negotiation agents participate in the energy trading market in the top layer [13]. In the energy trading market of networked microgrids, microgrid operators (MGOs) are set to trade energy with each other and the grid under the regulations formulated by distribution network operators (DNOs). Different economic models are implemented in this layer based on personalized behaviors of the participants, which is an emerging topic in both academic and practical fields. As a common method for allocating resources, continuous double auction (CDA) is frequently used to address the bidding problem in energy markets among multi-buyers and multi-sellers [14]. The authors in [15] discussed the efficiency of applying CDA in a computational electricity market with the midpoint price method. In [16], an adaptive aggressiveness strategy was presented in the CDA market to adjust bidding price according to market change. A stable CDA mechanism was proposed in [17], which alleviated the unnecessarily volatile behavior of normal CDA. Furthermore, peer-to-peer (P2P) energy trading mechanisms are drawing attention as ICTs like blockchain are making P2P energy trading in real time possible [18]. Wang et al. [19] proposed a parallel P2P energy trading framework with multidimensional willingness, mimicking the personalized behaviors of microgrids. In [20], a canonical coalition game was utilized to propose a P2P energy trading scheme, which proves the potential to corroborate sustainable prosumer participation in P2P energy trading. To summarize, the literature mentioned above is mainly concerned with the bidding price in the energy trading market, as the intersection of price sequences decides whether to close a deal or not. However, with the wide use of advanced ICT in the power grid, the uncertainty of DERs can be compensated by real-time behavior adjustment; meanwhile, DER responses to price signal become faster than ever before. Not only does the bidding price have impacts on the bidding results, but bidding quantity also simultaneously affects the real-time supply and demand relationship. Meanwhile, the capacity of BESS is only taken into consideration in the internal scheduling of each microgrid, neglecting the potential of BESS to participate in energy market dispatching.
At the same time as research on energy trading mechanisms, significant efforts have been devoted to model the complex bidding behaviors of negotiation agents in energy trading markets, among which the interest of applying reinforcement learning (RL) algorithms to solve power grid problems is emerging [21]. Reinforcement learning is a formal framework to study sequential decision-making problems, particularly relevant for modeling the behavior of financial agents [22]. The authors in [23] made a comprehensive review on the application of RL algorithms on electric power system decision and control. A few research works have begun to pay attention to this problem and made an effort to establish better bidding mechanisms [15,24,25,26,27,28]. Nicolaisen et al. [15] applied a modified Roth–Erev RL algorithm to determine the bidding price and quantity offers in each auction round. The authors in [25] presented an exact characterization of the design of adaptive learning rules for contained energy trading game concerning privacy policy. Cai et al. [26] analyzed the performance of evolutionary game-theory based trading strategies in the CDA market, which highlighted the practicability of the Roth–Erev algorithm. The authors in [27] presented a general methodology for searching CDA equilibrium strategies through the RL algorithm. Residential demand response enhanced by the RL algorithm was studied in [28] by a consumer automated energy management system. Particularly, Q-learning (QL) stands out because it is a model-free algorithm and easy to implement. The authors in [29] considered the application of QL with temperature variation for bidding strategies. Rahimiyan’s work [30,31] concentrated on the adaptive adjustment of QL parameters with the energy market environment. Salehizadeh et al. [32] proposed a fuzzy QL approach in the presence of renewable resources under both normal and stressful cases. The authors in [33] introduced the concept of scenario extraction into a QL-based energy trading model for decision support.
The existing literature shows the potential of combining QL algorithms and energy trading mechanisms in obtaining better market performance. However, suitable answers to the following three issues are still unsettled, which are the motivations for this paper’s research:
(1)
How the QL algorithm could be combined to fit better with energy trading mechanisms to describe the characteristics of the future energy market. Bidding in the future energy market is close to real-time enhanced by ICTs, and the iteration of Q-values should be round-based rather than hour-based or day-based, whereas the time scale of updating Q-values in [29] couldn’t reflect the latest market status. In addition, for a multi-microgrid system, the QL algorithm should be carried out separately by each microgrid. The authors in [34] provided the thought of applying a fitted-Q iteration algorithm in the electric power system, and more appropriate methods need to be proposed.
(2)
How the coupling relationship of bidding price and quantity should be modeled and reflected by the Q-values of the Q-learning algorithm. Little research has been made about the impact of bidding quantity on bidding results in the above literature. Wang’s work referred to the issue of bidding quantity [25], but only the bidding strategies of sellers in the market are discussed. In addition, the energy trading game presented in this paper adopted a discontinuous pricing rule. The impact of BESS on adjusting bidding quantity was mentioned in [35] without considering the ramping restriction, which is not practical in realistic scenes. The authors in [36] applied the extended fitted-Q iteration algorithm to control the operation modes of battery storage devices in a microgrid; however, only three actions were taken into consideration in this paper and the (dis)charge rate constraints were ignored.
(3)
How the QL parameters should be decided by each microgrid, considering real-time energy market status, microgrid preferences, historical trading records and other time-varying factors. In QL algorithms, the risk characteristic of one microgrid is reflected by the values of QL parameters. However, in the existing literature, those QL-based models try to identify the bidding status according to the experiences gained from a series of trials in the current bidding rounds, ignoring the importance of historical trading records. The authors in [30,31] had noticed this issue, but the relationship between QL parameters and bidding performances were not analyzed in detail. In addition, the progress of QL research in other areas [37] hasn’t been introduced into the energy trading market.
To tackle the above issues, we formulate the energy trading problem among microgrids as a Markov Decision Process (MDP) and investigate the potential of applying a Q-learning algorithm into a continuous double auction mechanism. Taking inspiration from related research on P2P trading and heuristic algorithms, a Q-cube framework of Q-learning algorithm is proposed to describe the Q-value distribution of microgrids, which is updated in each bidding round iteratively. To the best of the authors’ knowledge, none of the previous work has proposed a non-tabular formation of Q-values for decision-making of the power grid.
The contributions of this paper are summarized as follows:
(1)
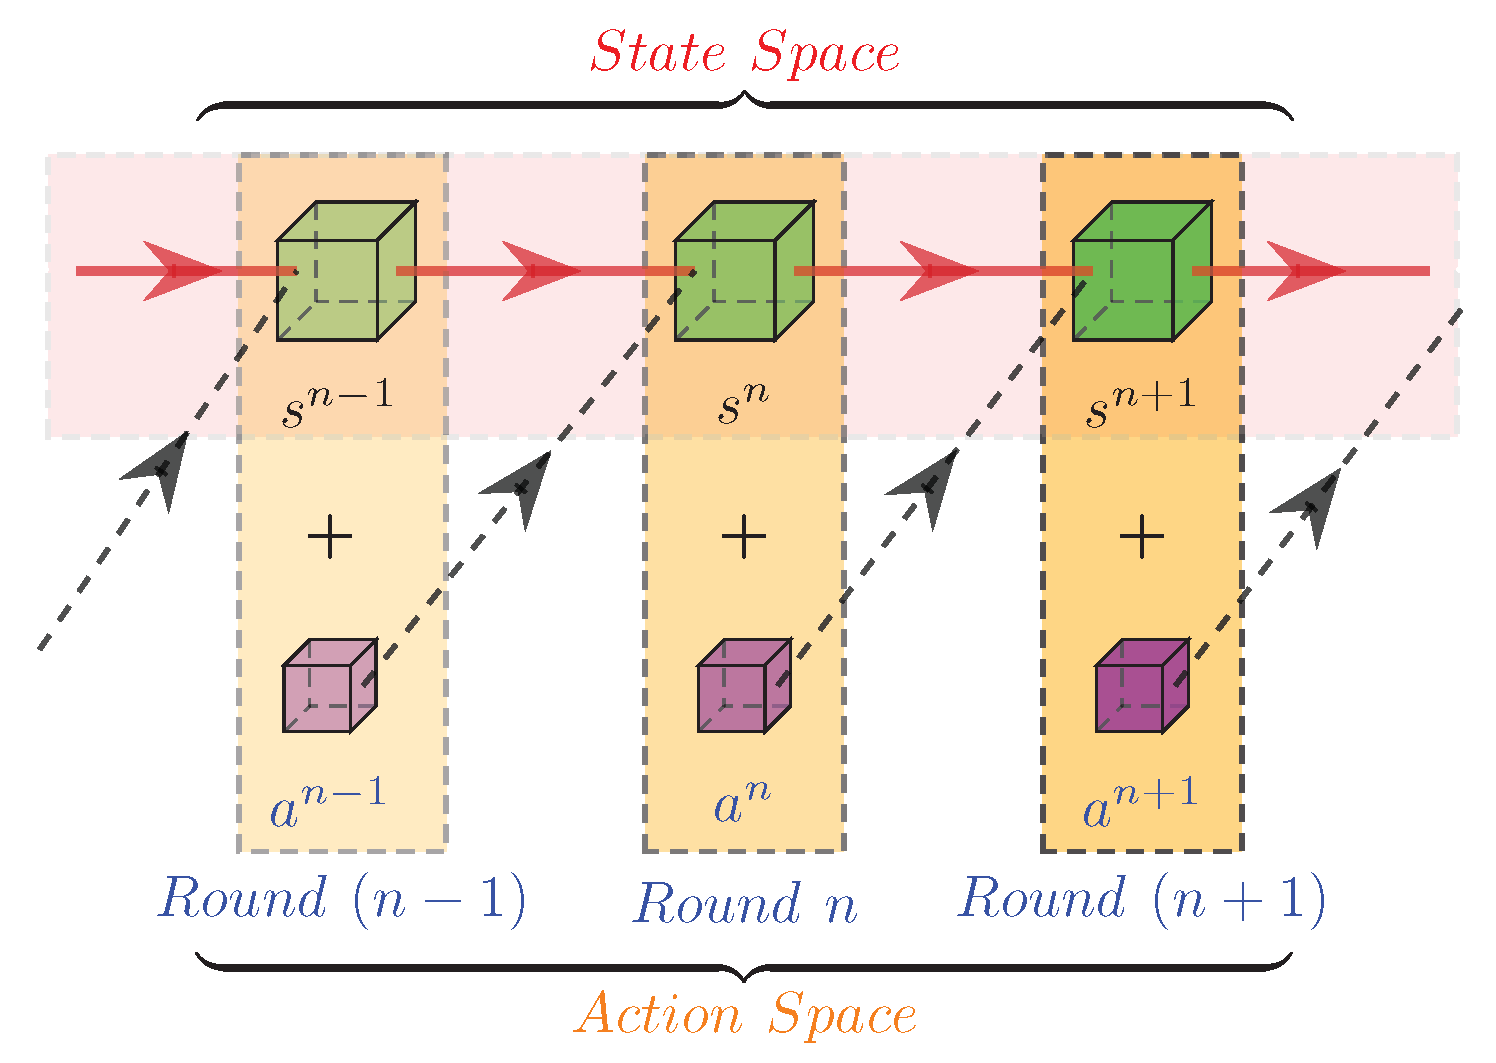
The energy trading problem among microgrids in the distribution network is framed as a sequential decision problem. The non-cooperative energy market operation and bidding behaviors are modeled with a continuous double auction mechanism, which decreases the need for centralized control and suits the weakly-centralized nature of this distribution network.
(2)
The high dimensional continuous problem is tackled by the Q-learning algorithm. Except for the bidding price, the bidding quantity of microgrids is considered as the second dimension of bidding action space and could be adjusted during the bidding process with the assistance of BESS, by which the coupling relationship between energy trading price and quantity during bidding process is handled. Related parameter setting and sharing mechanisms are designed.
(3)
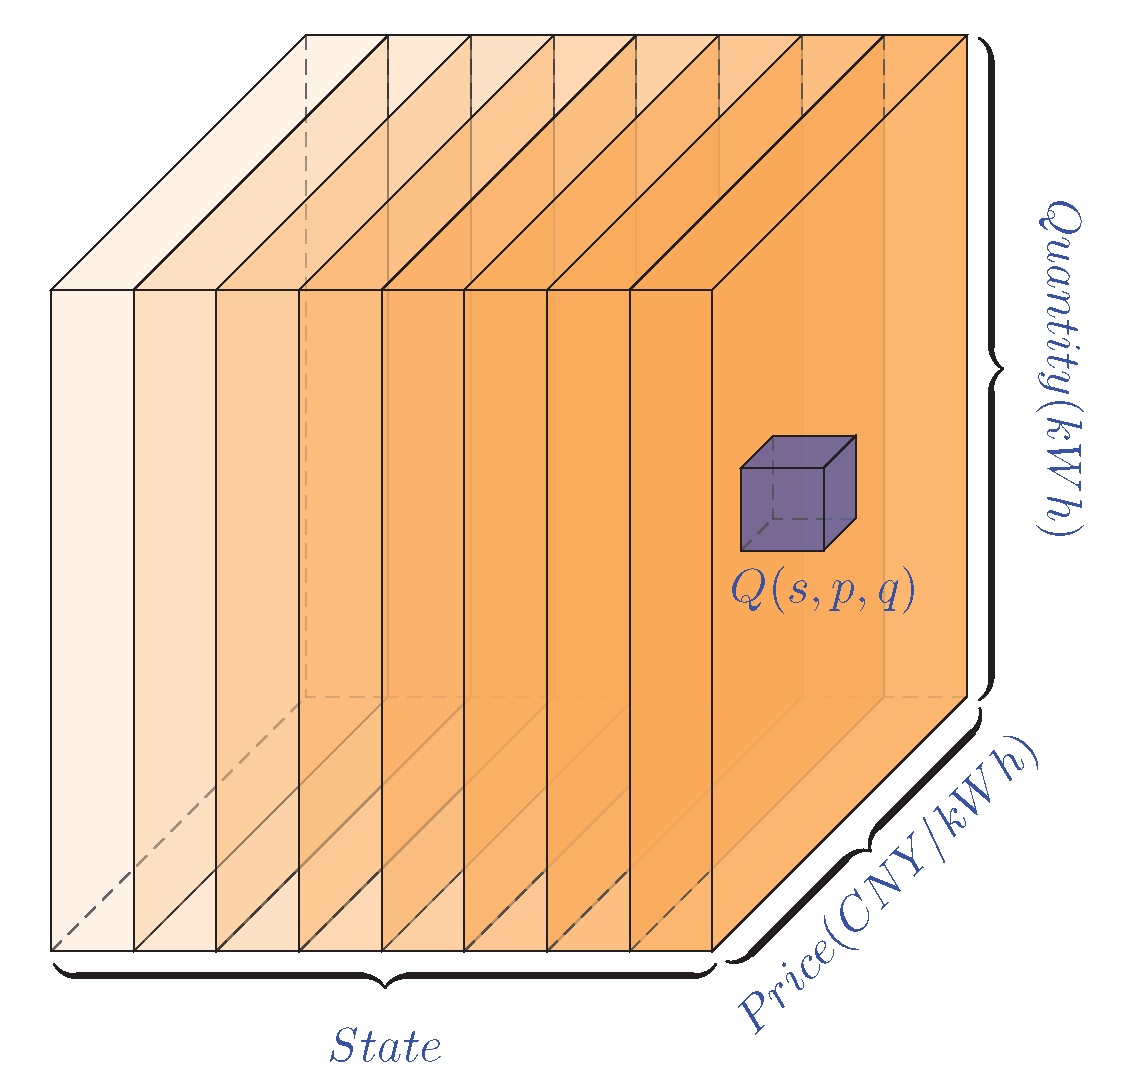
A non-tabular solution of Q-values considering two dimensions of action space is designed as a Q-cube. The Q-value distribution in the proposed Q-cube is in accordance with the behavior preferences of the microgrids.
(4)
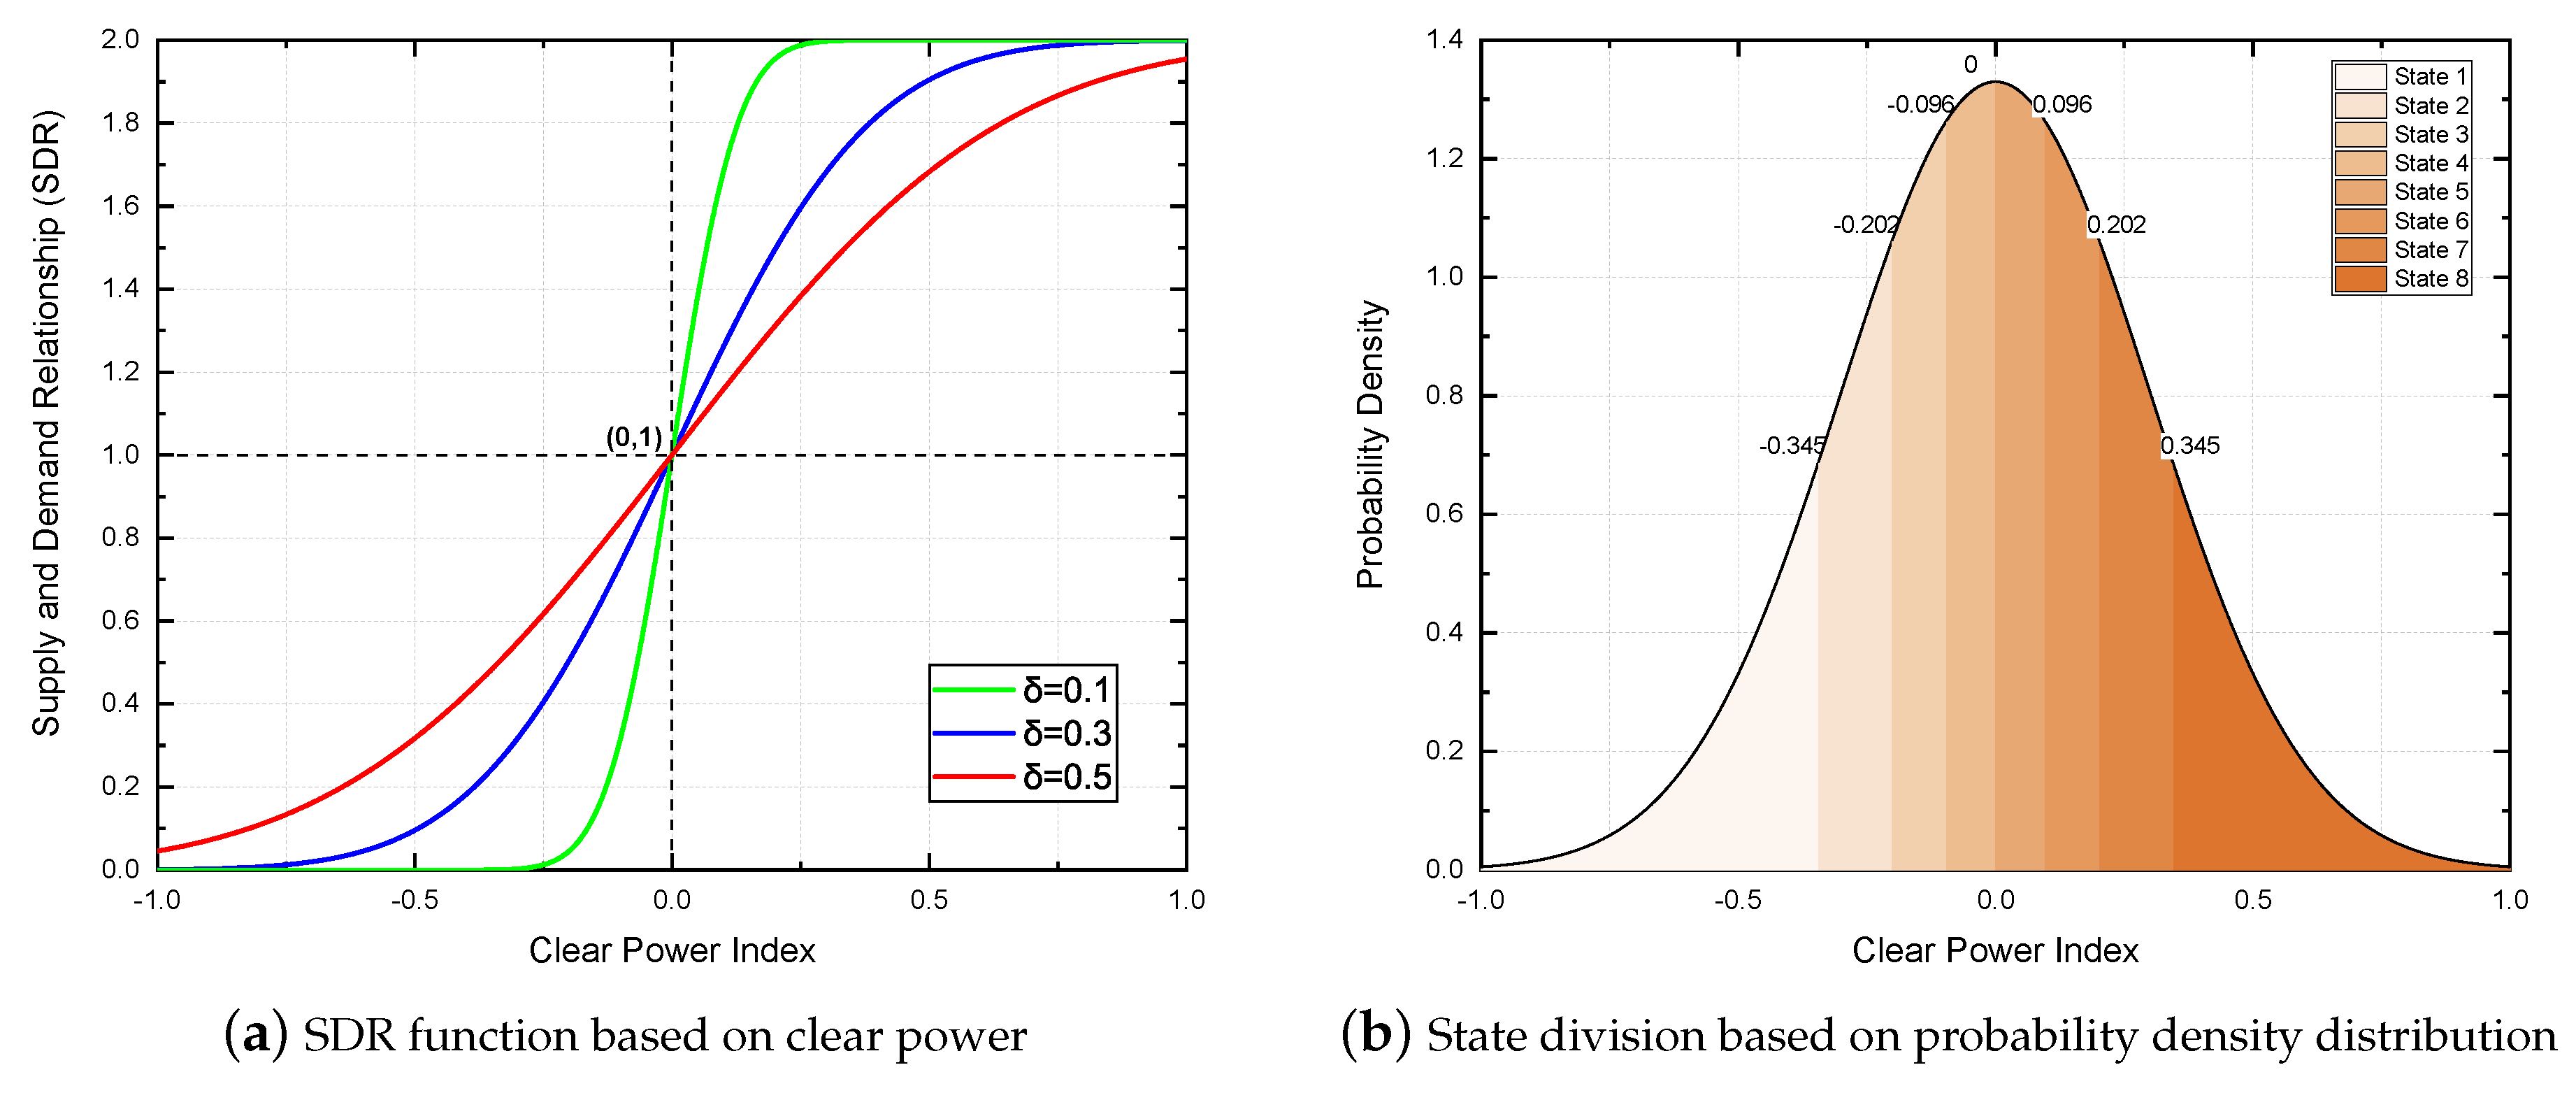
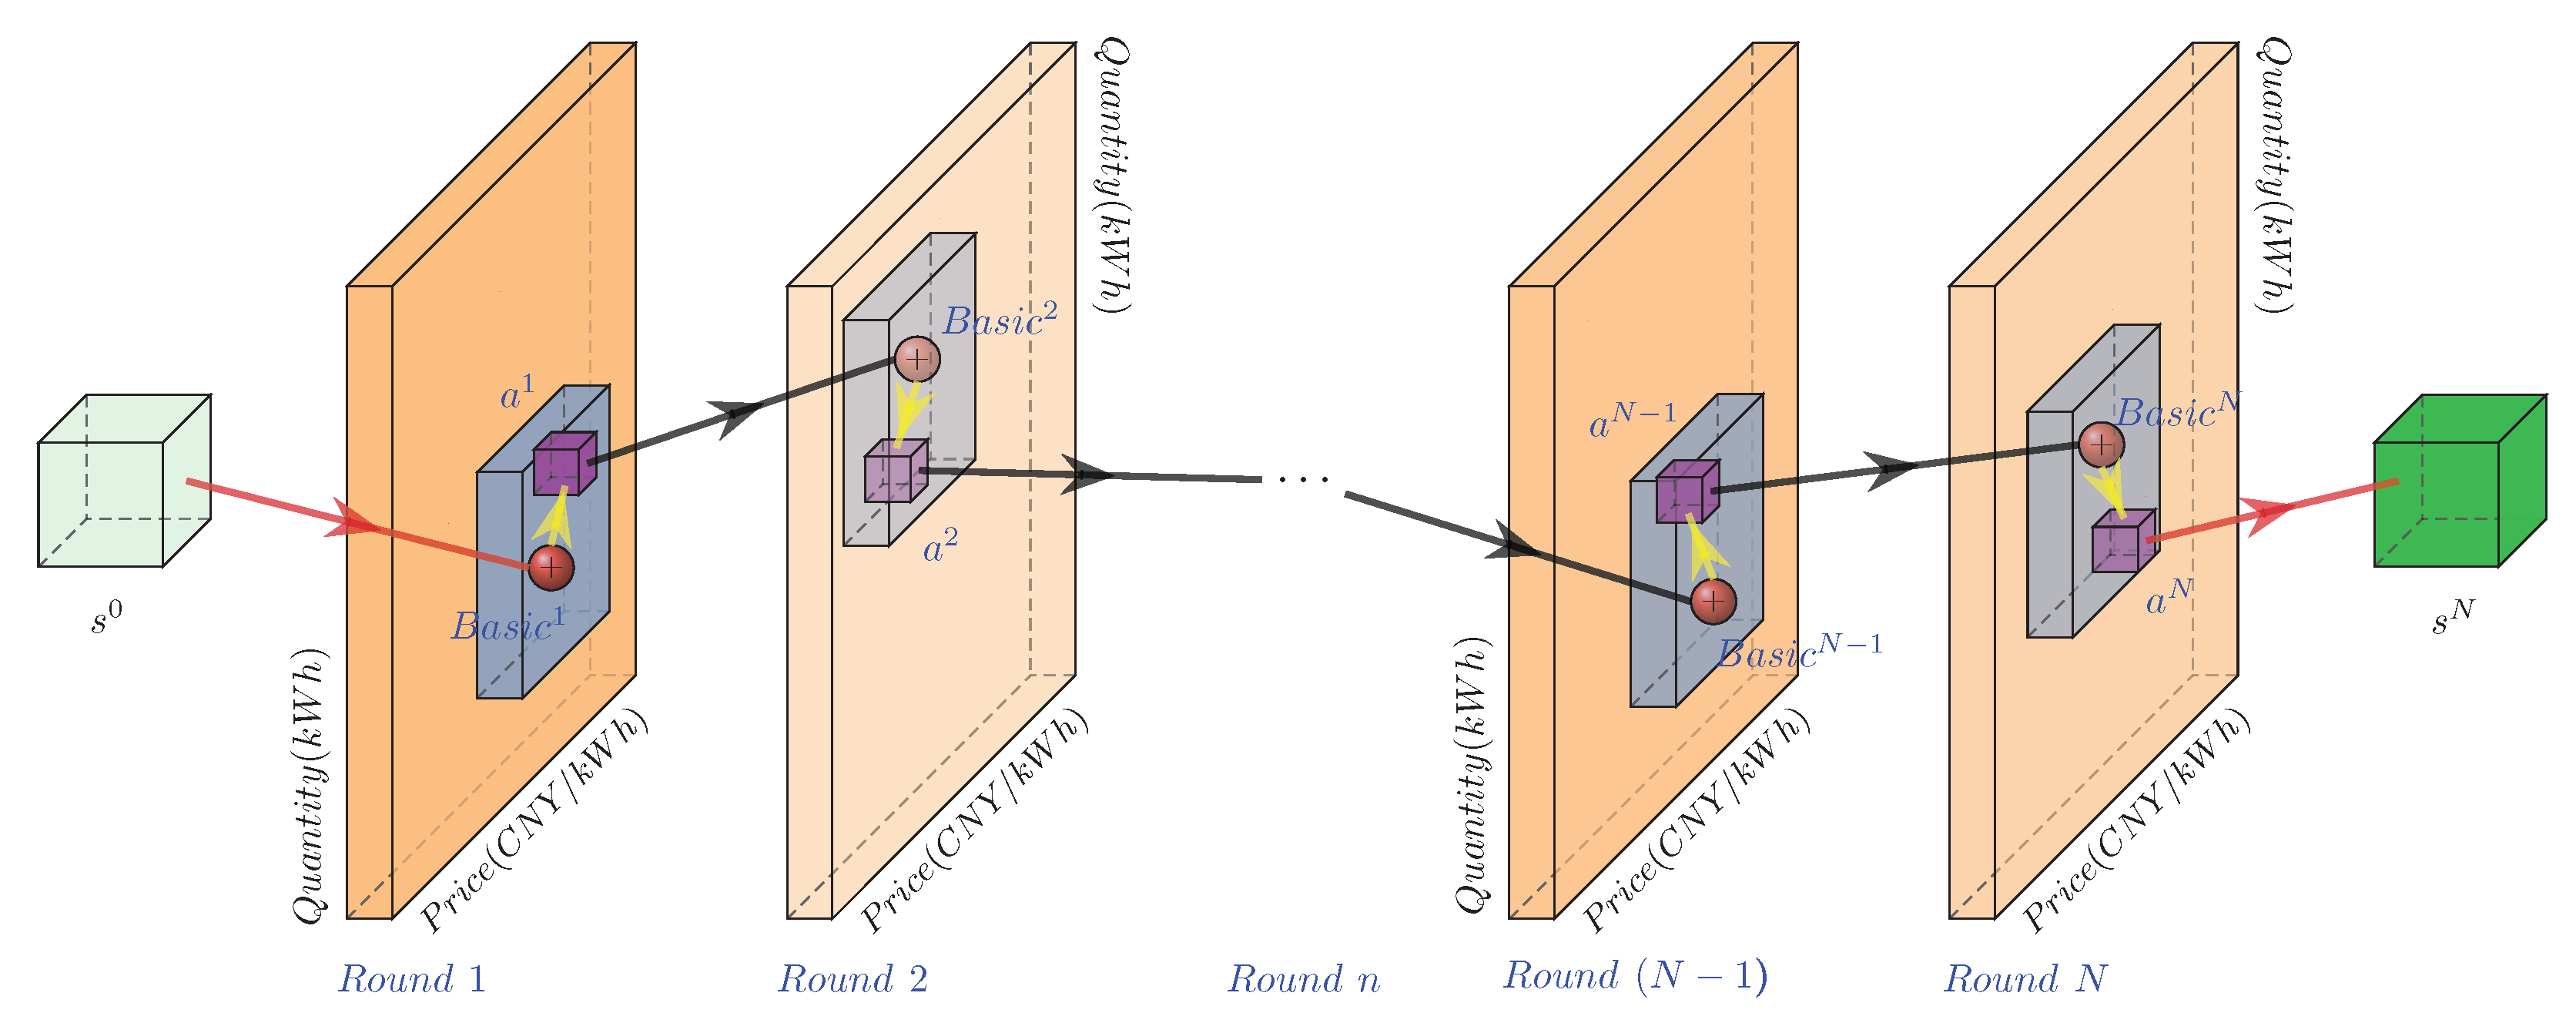
The real-time supply and demand relationship is highlighted as the state in the proposed Q-learning algorithm. A normal probability density distribution is divided into eight equal parts as eight states for all the microgrids. In addition, the idea of ’local search’ in heuristic algorithms is applied in the proposed Q-learning algorithm for generating the action space. This approach not only takes the characteristics of power grids into consideration, but also achieves the compromise between exploitation and exploration in the action space.
(5)
The proposed continuous double auction mechanism and Q-learning algorithm are validated by a realistic case from Hongfeng Lake, Guizhou Province, China. Profit comparison with traditional and P2P energy trading mechanisms highlights the doability and efficiency of the proposed method. A 65.7% and 10.9% increase in the overall profit of the distribution network could be achieved by applying a Q-learning based continuous double auction mechanism compared with the two mechanisms mentioned above.
The rest of this paper is organized as follows. In Section 2, the overview of a non-cooperative energy trading market is presented, along with a description of the proposed Q-learning based continuous double auction mechanism. A Q-cube framework of the Q-learning algorithm is introduced in Section 3. Case studies and analyses are demonstrated in Section 4 to verify the efficiency of the proposed Q-cube framework for a Q-learning algorithm and continuous double auction mechanism. Finally, we draw the conclusions and future works in Section 5.

2. Mechanism Design for Continuous Double Auction Energy Trading Market

In this section, we provide the overview of non-cooperative energy trading market and the analytical description of Q-learning based continuous double auction mechanism.

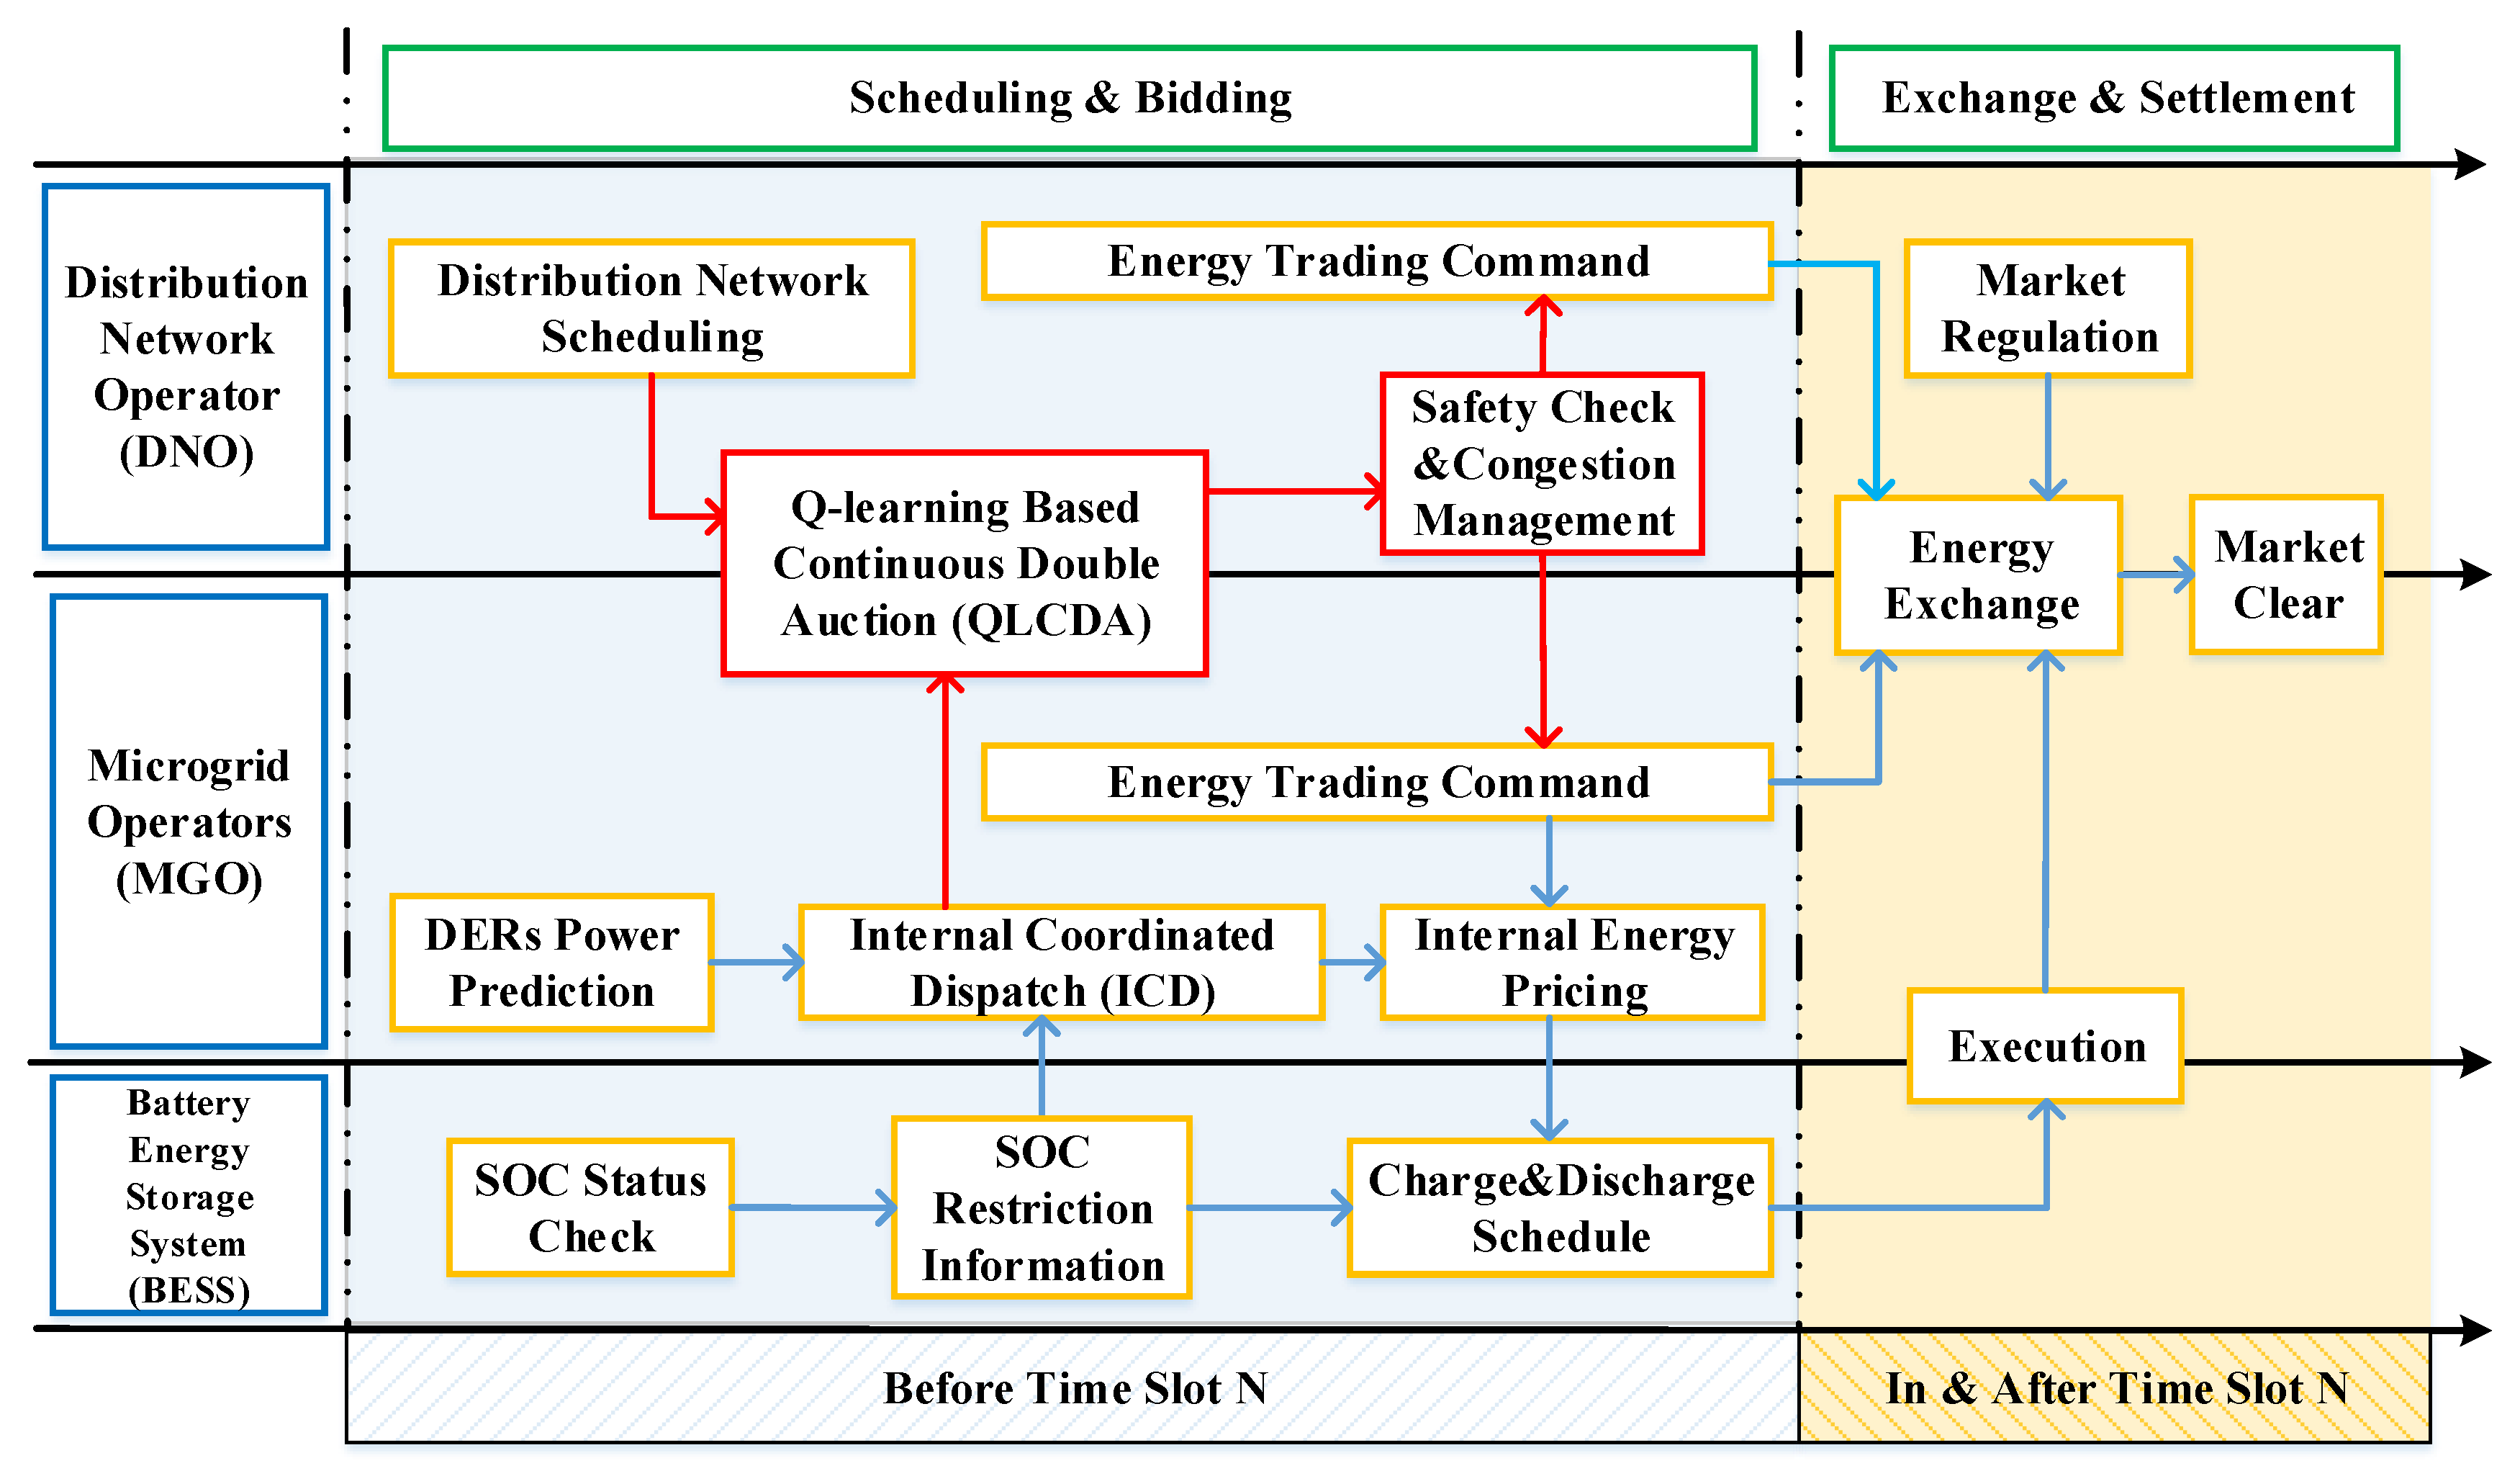
2.1. Non-Cooperative Energy Trading Market Overview

In a future distribution network, the DNO is the regulator of local energy trading market as it provides related ancillary services for market participants: (1) By gathering and analyzing the operation data from ICT, the DNO monitors and regulates the operation status of distribution network; (2) By carrying out centralized safety check and congestion management, the DNO guarantees the power flow in every transmission line is under limitation; (3) By adopting reasonable economic models, the DNO affects energy trading patterns and preferences of market participants. With the reform of the traditional energy market, along with the application of advanced metrology and ICT, the trend of peer-to-peer energy trading pattern is emerging. As peers in this energy market, we assume that MGOs have no information on their peers’ energy trading preferences and internal configurations, which addresses the concern on privacy protection. In addition, each peer in this energy market is blind about the bidding target, it joins this energy trading market to satisfy its own needs for energy to the greatest extent rather than seeking cooperation. Each MGO can adjust its bidding price and quantity according to public real-time market information and private historical trading records. Accordingly, the energy trading among microgrids in the distribution network could be formulated as a non-cooperative peer-to-peer energy trading problem. Figure 1 shows the process of the non-cooperative energy trading market discussed in this paper.
Consider a distribution network containing a number of networked microgrids in a certain area. In the hour-ahead energy trading market before Time Slot N, each MGO deals with the internal coordinated dispatch (ICD) of local DERs and residents based on DERs’ power prediction and BESS’s state of charge (SOC) restriction information. Meanwhile, the DNO makes the distribution network scheduling for further procedures. A Q-learning based continuous double auction among microgrids is implemented according to ICD results and BESS’s SOC status; detailed descriptions are presented in the following chapter. After the safety check and congestion management made by DNO, energy trading commands are confirmed and transmitted to each MGO. As the MGOs are empowered to set real-time price for regional energy, internal pricing for DER power and charge and discharge scheduling for BESS are completed in this period.
Energy is exchanged according to the pre-agreed trading contracts in Time Slot N under the regulation of DNO. Sufficient back-up energy supply and storage capacity are provided in case of the impact of extreme weather and dishonesty behaviors of the market participants. A market clear process is carried out after Time Slot N to ensure the accurate and timely settlement of energy transactions. Punishments are also made for the above abnormal market behaviors. Security and timeliness of the market clear process could be guaranteed by advanced ICT such as blockchain, smart meters, 5G, etc.

2.2. Q-Learning Based Continuous Double Auction Mechanism

This paper proposes a Q-learning based continuous double auction (QLCDA) mechanism for the energy trading market. Figure 2 presents the process of the proposed QLCDA in one time slot.
Before the QLCDA start in one time slot, each MGO tackles the ICD problem and generates the initial bidding information. The SOC check and charge and discharge restriction of the BESS are also completed in this initialization stage. In each round of CDA (indexed by n), each MGO reports its energy trading price and quantity to the DNO. Note that the trading quantity would be updated in each round; it is possible that one MGO changes its role as buyer or seller in the bidding process. Thus, an identity confirmation is made as the first step in CDA and the number of buyers ( n b )/ sellers ( n s ) are obtained. Then, the DNO calculates and releases the overall supply and demand relationship (SDR) to these networked microgrids. Meanwhile, the reference prices for buyer and seller microgrids are calculated and released, which are the average price of selling and buying energy in the real-time market. MGOs update their bidding price and quantity according to real-time SDR and historical trading records based on the Q-Learning algorithm; the SOC restrictions are also taken into consideration to limit the behaviors of BESS in each microgrid. The bidding price of sellers and buyers are sorted in increasing order by the DNO; we have p r i c e n b b < p r i c e n b 1 b < < p r i c e 1 b and p r i c e 1 s < p r i c e 2 < < p r i c e n s s . Once the price sequences of seller and buyers are intersected, i.e., p r i c e 1 s < p r i c e 1 b , MGOs whose bidding prices are in this interval are chosen to join the energy sharing process. Actual trading price and quantity are decided in this step and the bidding quantity of each microgrid is updated based on the sharing results. If there is still untraded energy in the market, the QLCDA will repeat until the deadline of bidding rounds (N represents the maximum bidding round in one time slot). If energy demand or supply are fully satisfied before the deadline, QLCDA will be stopped in the current round. Results of QLCDA are confirmed by MGOs and sent to the DNO for further energy allocation and safety check. Detailed descriptions on initialization and the energy sharing mechanism are presented in the following chapters.

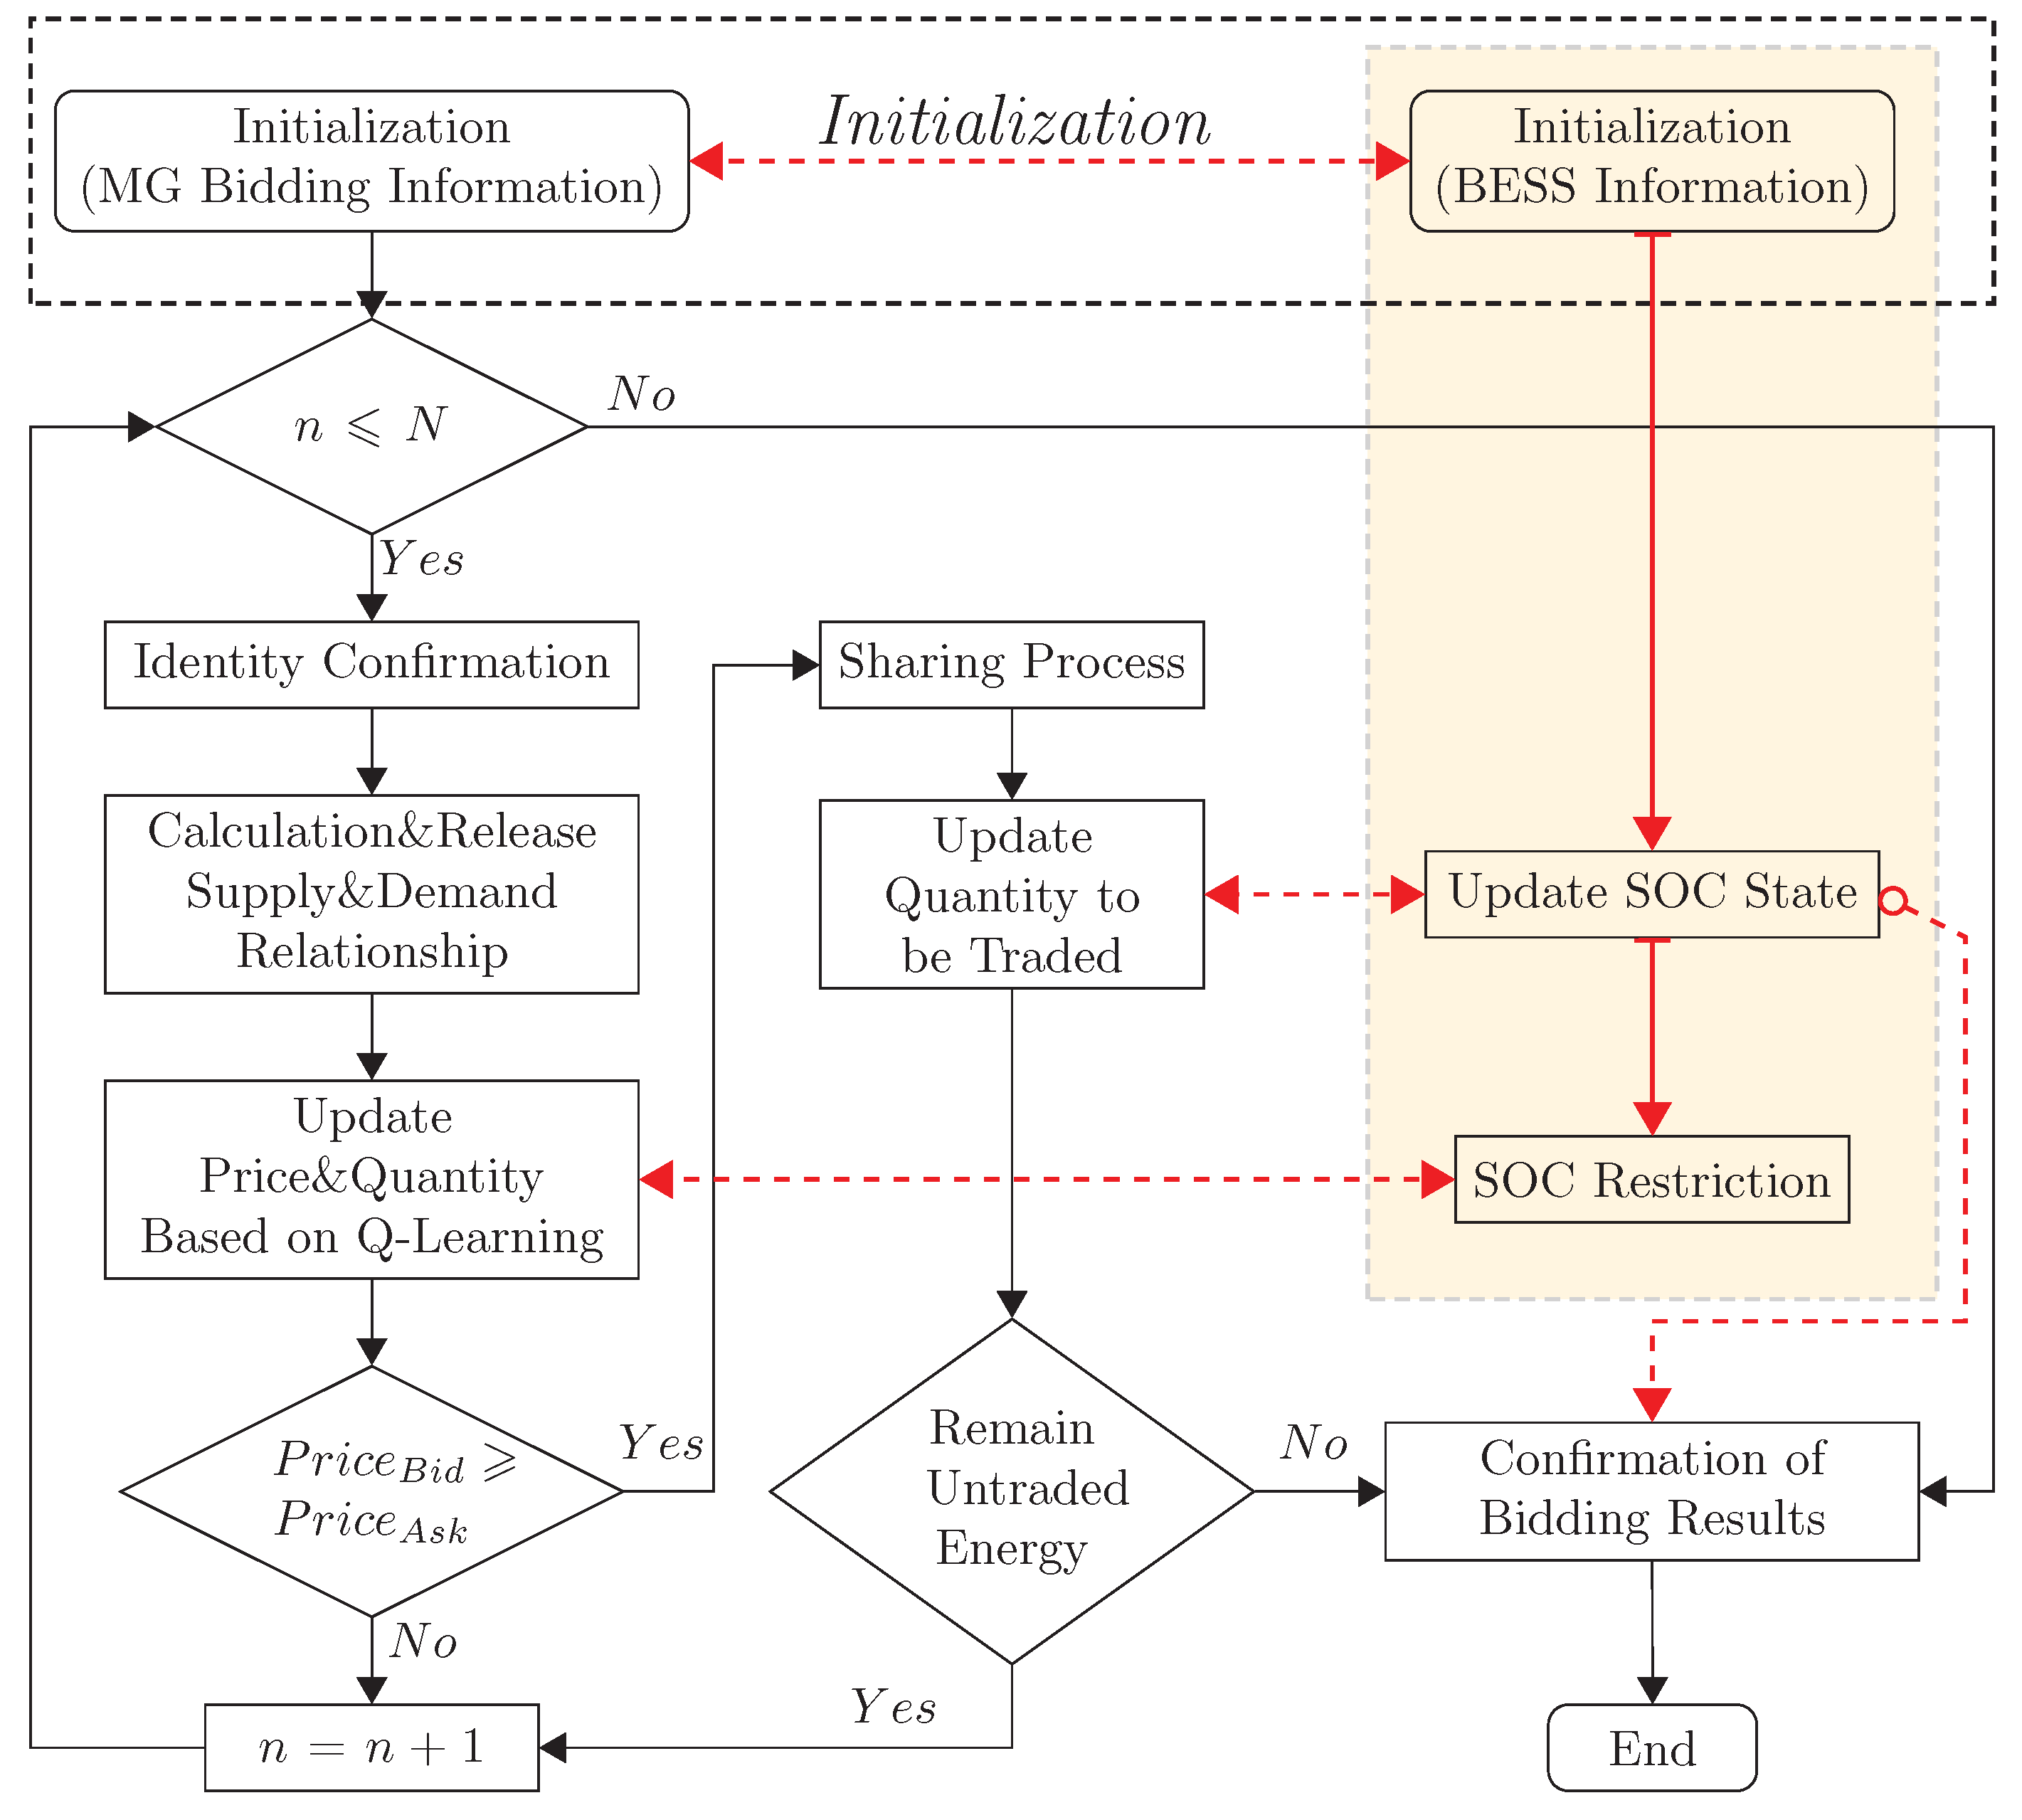
2.2.1. Initialization Setups

As the ICD of each microgrid is completed before QLCDA by each MGO, the scheduling plans are assumed to be fixed during one time slot, therefore the initial bidding quantity of QLCDA are set as the results of ICD. For seller microgrid i, the initial bidding price in time slot T is calculated as follows:
p i i n i t i a l = p g r i d , b u y t + p _ h l t p _ l l t · r a n d i .
Similar to the seller, buyer microgrid j submits the bidding price as follows:
p j i n i t i a l = p g r i d , s e l l t p _ h l t p _ l l t · r a n d j ,
where p g r i d , b u y t and p g r i d , s e l l t represent energy purchase and sell price of the grid in time slot t respectively. p _ h l t and p _ l l t are the highest/lowest bidding price limitation of this market in time slot t. r a n d i and r a n d j are random real numbers generated from the range of [0.95,1] to obtain higher/lower initial bidding price for sellers/buyers.
As each microgrid is equipped with BESS already, it is essential to consider the application of BESS in QLCDA and make full use of its charging and discharging capacity to improve real-time SDR inside the distribution network. The charging ability of microgrid i’s BESS is given by:
P b e s s , i t , c h a r g e = C i · min S O C i Δ , c h a r g e , ( 1 S O C i t ) Δ t · η i c h a r g e .
Similarly, the discharging ability of microgrid i’s BESS is calculated as follows:
P b e s s , i t , d i s c h a r g e = C i · min S O C i Δ , d i s c h a r g e , S O C i t · η i d i s c h a r g e Δ t ,
where C i is the capacity of microgrid i’s BESS, S O C i t is the initial SOC of BESS in time slot t. Due to the limitation of material technology, charging and discharging behaviors of BESS are constrained, S O C i Δ , c h a r g e and S O C i Δ , d i s c h a r g e represent the ramp constraints on charging and discharging of microgrid i’s BESS, respectively. Practical operations of BESS will cause energy loss, therefore we set η i c h a r g e and η i d i s c h a r g e as the charging and discharging efficiency of BESS, respectively. During the QLCDA process, updated bidding quantity can’t exceed the restrictions on these two parameters. Δ t is the bidding cycle in this energy trading market.

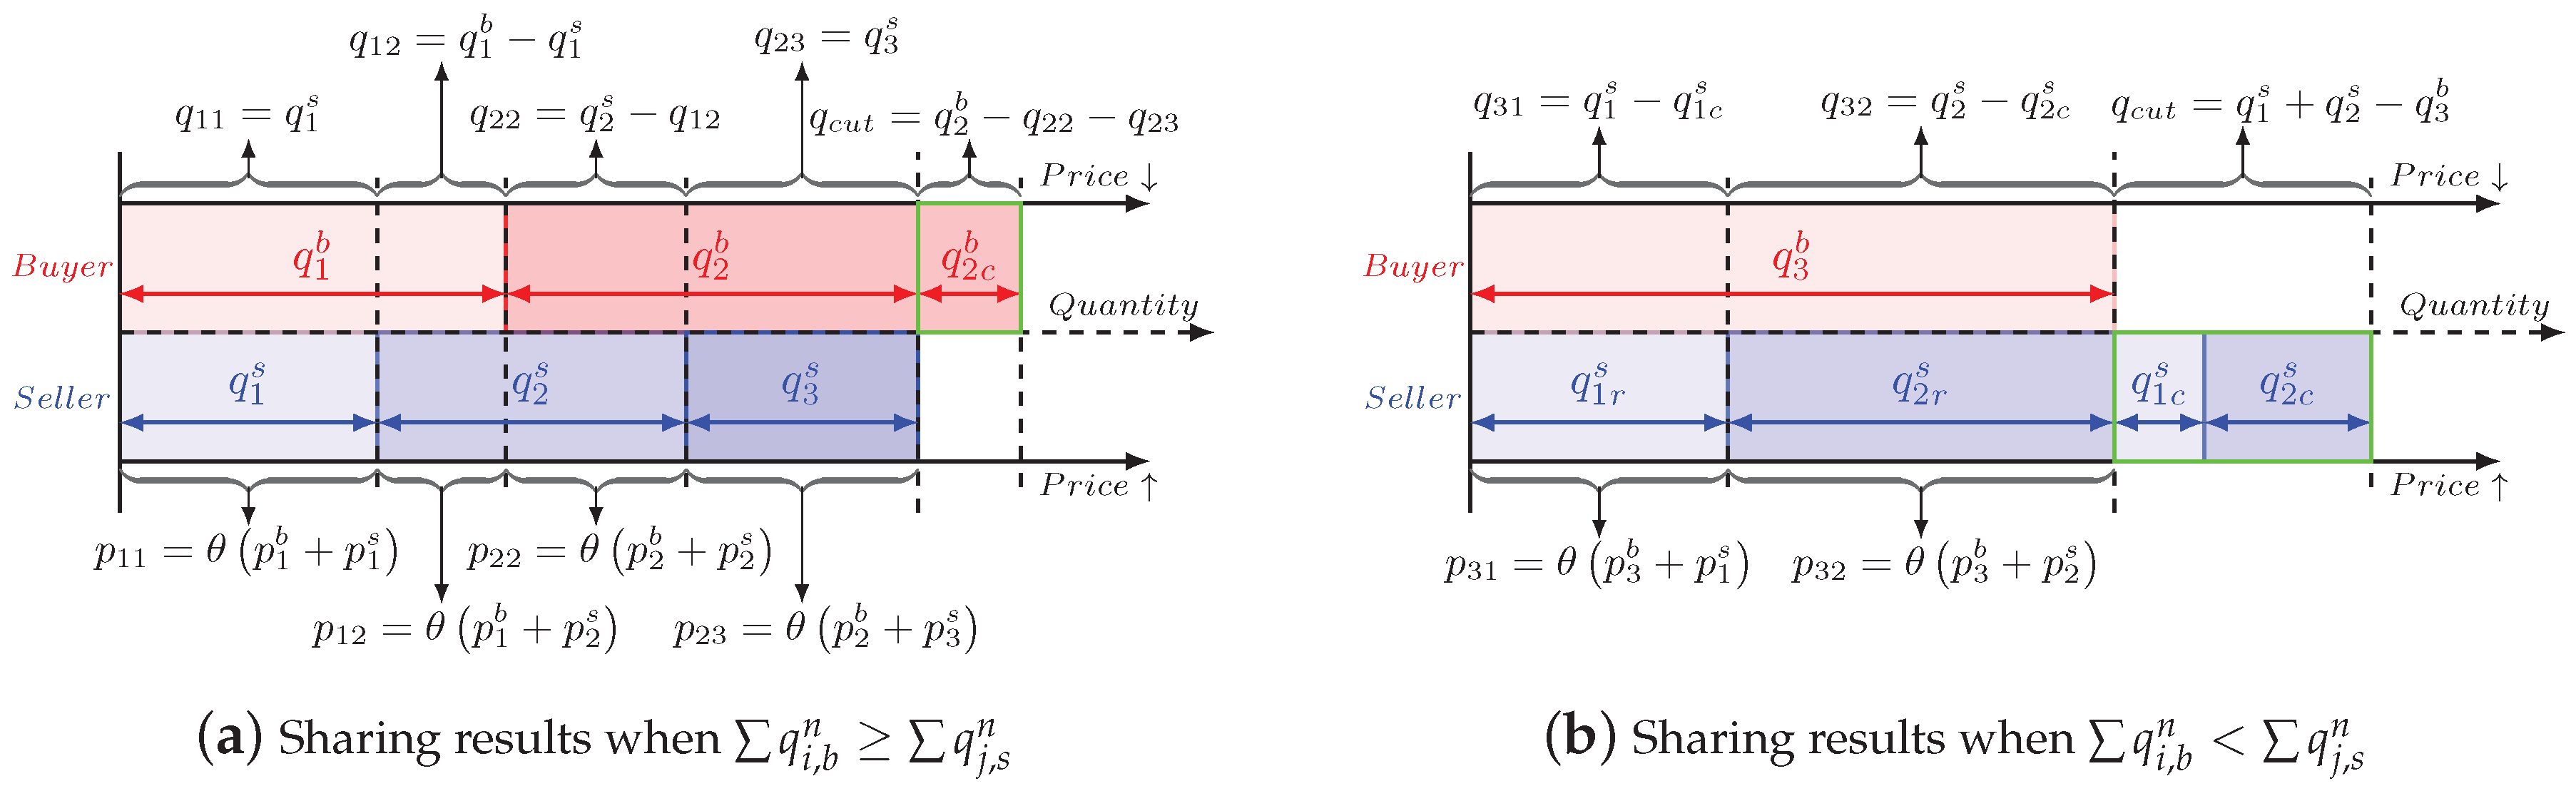
2.2.2. Energy Sharing Mechanism

Once the price sequences of buyers and sellers are intersected, i.e., p r i c e 1 s < p r i c e 1 b , the microgrids whose bidding price are within the interval will be chosen to enter the energy sharing process. Due to the uncertainty and complexity of price intersections, a layering method and a price-prioritized quantity-weighted sharing rule are combined to solve the energy sharing problem.
The number of selected buyer and seller microgrids are n b s h a r e and n s s h a r e , respectively. Starting from the highest bidding price of sellers, the buyer microgrids whose bidding prices are higher than p b s s h a r e s and all of the seller microgrids are selected to be combined into a sharing layer. These buyer microgrids have the priority to trade with seller microgrids as they would like to pay the higher price for each unit of energy. Deals are made in this layer and related microgrids are removed from the sharing list depending on different situations. The layering method is applied repeatedly until there is no buyer microgrid in the sharing list or all the energy of seller microgrids is sold out. The detailed layering process is presented below:
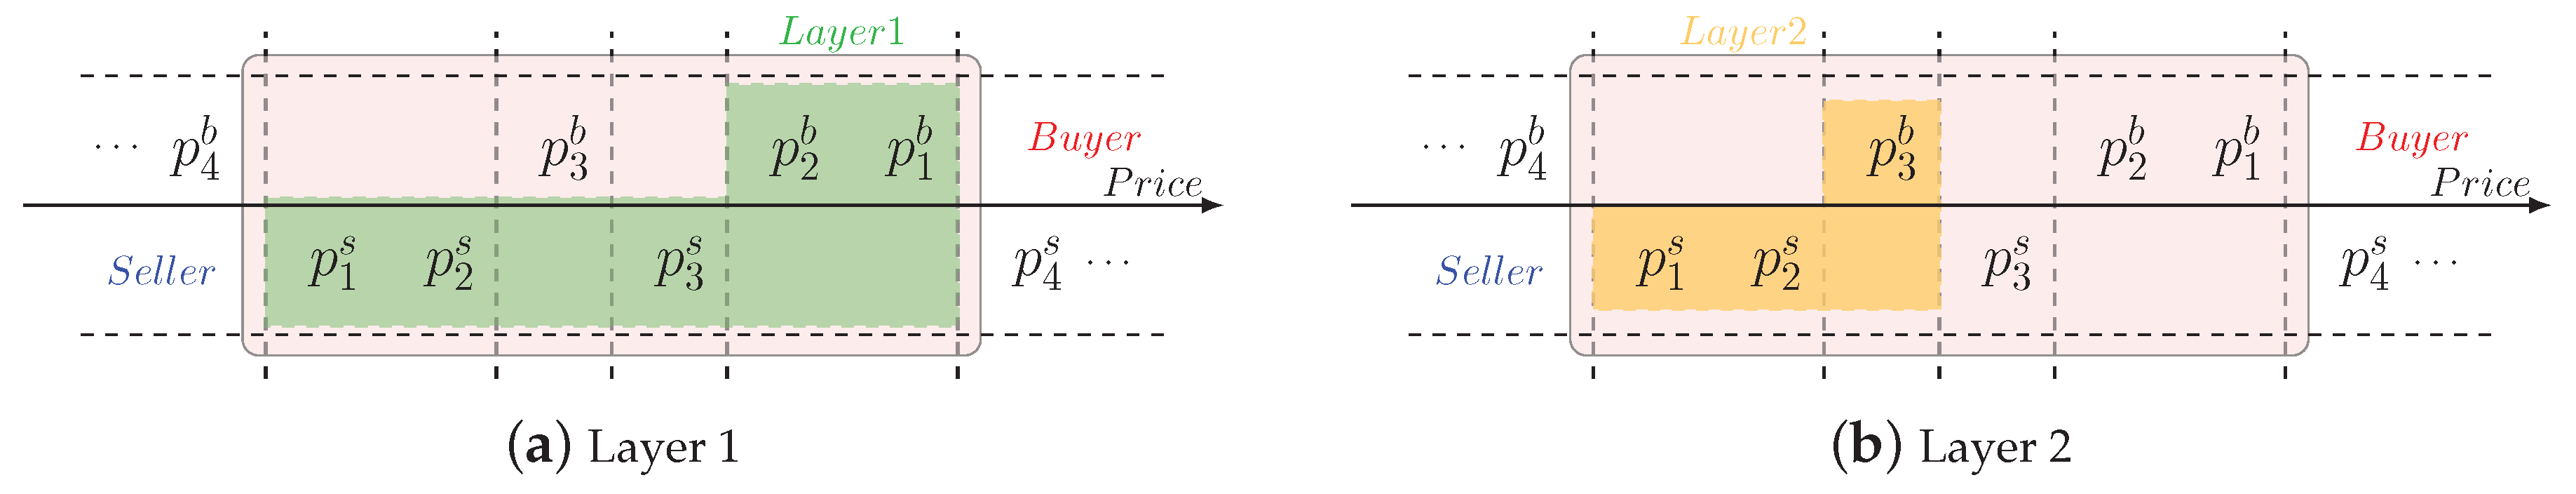
  • (1) Form a bidding layer according to the above-mentioned method and proceed to (2).
  • (2) Allocate the energy in this layer. If energy demand exceeds supply in this layer, the sharing process is over after allocation. If energy supply exceeds demand in this layer, proceed to (3).
  • (3) Remove the buyer microgrids in this layer from the optional sharing list as their energy demands are satisfied. Remove the sell microgrids whose selling prices are higher than the current highest price of buyer microgrids as there are no potential buyers for them. Return to (1) to form a new bidding layer.
Take the situation in Figure 3 as an example. Two buyer microgrids ( p 1 b and p 2 b ) and three seller microgrids ( p 1 s , p 2 s and p 3 s ) are selected to form Layer 1 as shown in Figure 3a. After energy allocation in Layer 1, all of the seller microgrids have surplus energy, therefore p 1 b and p 2 b are removed from the sharing list as their energy demands are satisfied. p 3 s is also removed from the list as no buyer microgrid’s bidding price is higher than his. Afterwords, Layer 2 is formed containing one buyer microgrid ( p 3 b ) and two seller microgrids ( p 1 s and p 2 s ), as shown in Figure 3b. The sharing process ends after the energy allocation in this layer.
For each layer in the energy sharing process, without loss of generality, we propose a price-prioritized quantity-weighted sharing rule for two situations. Figure 4 gives the sharing results of examples on these two situations, in which the bidding price/quantity of each deal is given below/above the figure. Energy quantity of buyers in a layer is sorted based on their quoted prices in descending order, while for sellers the quantity are sorted in ascending order. This rule ensures buyers with higher bid prices give priority to lower-priced energy. In Figure 4a, for the sharing process in round n, when q i b q j s , every seller will sell out its energy, the exceeded part of demand will be cut and participate in the next round of bidding in the energy market. However, when q i b < q j s as shown in Figure 4b, the sellers will have to fairly share the exceeded part of supply. A seller microgrid j’s trading quantity is calculated as follows:
q j n = q j n i f q i b q j s , q j n q c u t , j n i f q i b < q j s ,
q c u t , j n = q j s q i b · q j n q j s .
In Equation (6), q c u t , j m represents the cut quantity for microgrid j in round n. The oversupply burden is weighted shared to each seller microgrid and cut from their energy supply. This sharing rule guarantees that each seller microgrid could sell a non-negative quantity, which is more fair than the equally sharing mechanism. After the determination of sharing layers and trading quantity, the DNO can choose any suitable price within the interval [ p i s , p j b ] as trading price at this time slot for microgrid i and j. We assume both sides of this transaction agree to trade at a price p i j = θ · ( p i b + p j s ) , where θ ( 0 , 1 ) is a predefined constant. Without loss of fairness, θ is set as 0.5 in this paper.
The proposed energy sharing mechanism ensures that buyer microgrids with higher bidding price and seller microgrids with lower bidding price have the priority in reaching a deal. In addition, the fairness of energy trading quantity is accomplished by a weighted sharing rule.

3. A Q-Cube Framework for Q-Learning in a Continuous Double Auction Energy Trading Market

In a normal Q-learning algorithm, an agent learns from the environment information and interacts with relevant agents. By observing states and collecting rewards, an agent selects appropriate actions to maximize future profits. The agents are independent from one other both in terms of acting as well as learning. However, the particularity of the energy trading market creates a complex energy economic system. Non-cooperative trading pattern, personalized MGO preferences and time-varying market conditions bring difficulties to the selection of bidding strategies for market participants. As a model-free algorithm, Q-learning is capable of modeling the MGOs’ bidding behaviors in a continuous double auction energy trading market. In this paper, a Q-cube framework of Q-learning algorithm is proposed especially for this multi-microgrid non-cooperative bidding problem, which addressed the exploitation–exploration issue.

3.1. Basic Definitions for Q-Learning

We base the Q-cube framework on an MDP consisting of a tuple S , A , S , r . Detailed introductions of these variables are given as follows.

3.1.1. State Space

S represents the state space, which describes the state of MGOs in a real-time energy market. As a multi-agent system, it is impossible and senseless to select different state descriptions for each agent, whereas a common formulation is preferred. We propose to choose the real-time supply and demand relationship to form the state space for the following reasons: (1) the SDR has a decisive impact on bidding results. When the energy supply exceeds demand in a distribution network, seller microgrids are more willing to cut their bidding prices to make more deals, and exceeded supply is preferred to be stored in the BESS rather than selling to the grid at lower prices. In the meantime, buyer microgrids are not eager to raise their bidding prices quickly, but they tend to buy more energy for later use as the trading prices are much cheaper than those of the grid. The interactions between price and quantity on two roles of the energy market participants still exist when the energy demand exceeds supply. (2) The SDR reflects external energy transactions status of the networked microgrids. The more balanced the supply and demand relationship is, the less energy networked microgrids interacted with the distribution network. (3) The SDR describes the bidding situation as a public information of the energy trading market, which addresses the issue of privacy protection.
In this paper, the real-time SDR of round n in time slot T is formulated as a normal distribution with μ = 0 and δ = 0.3 , whose value is extended to the interval of [0,2].
S D R n = 2 · 1 2 π δ exp ( ( C P n μ ) 2 2 δ 2 ) ,
C P n = q s e l l e r n q b u y e r n A ,
where C P n is the clear power index, representing the clear power of the energy market in round n divided by a pre-defined constant A.
A pre-selection on the value of δ is performed and the results are shown in Figure 5a. A small choice of δ value ( δ = 0.1 ) will cause a sharp increase of SDR during the interval of [−0.25, 0.25], which makes the SDR meaningless in a large clear power index range. Meanwhile, a large δ value ( δ = 0.5 ) will reduce the sensitivity of SDR when the energy supply and demand are close to equilibrium. Therefore, a compromise choice of δ value ( δ = 0.3 ) is preferred.
The blue curve in Figure 5a shows the SDR under a different clear power index. When q s e l l e r n = q b u y e r n , S D R n = 1 , the energy supply and demand attain equilibrium. When q s e l l e r n q b u y e r n , S D R n 1 , vice versa. The SDR is sensitive in the interval close to 1 as the equilibrium between energy supply and demand is dynamic and in real time. In view of the fact that the SDR of energy trading market is a continuous variable, it is impossible to consider this MDP problem in an infinite space. In addition, it is impractical to model and simulate the energy trading market with limitless state descriptions. As a common method of applying Q-learning algorithm in practical problems, the state space should be divided into limited pieces for a better characterization of the SDR. For the Q-learning algorithm proposed in this paper, the number of states should be even-numbered as the SDR function is symmetrical. In addition, the probability of falling into each state should be equal. Without loss of fairness, the probability density distribution of the SDR function is divided into eight blocks with equal integral areas as shown in Figure 5b. These eight SDR intervals are defined as eight states in the proposed state space S for all the MGOs. The clear power index is also divided into eight intervals, corresponding to eight intervals of the SDR. When the clear power index is close to 0 (the market is near the equilibrium between energy supply and demand), the interval length of state is small as in most time slots the SDR experiences minor oscillation in the bidding rounds near the deadline. However, for the states whose clear power index is far from 0, the interval length is large as the SDR isn’t sensitive, which means that the microgrids in the distribution network want to escape from these states.

3.1.2. Action

A represents the set of eligible actions of MGOs, which are the variation of bidding price and quantity in each bidding round. As most of the previous works aim at increasing market participants’ profits via the dynamic adjustment of bidding pricing, we propose a two-dimensional formulation of action for Q-learning. By covering both bidding price and quantity, the action space is extended to a two-dimensional space rather than a set of single price actions, formulated as Equation (9):
a n = ( p n , q n ) n = 1 , 2 , , N .
The basic idea on actions in this paper is that each MGO always optimistically assumes that all other MGOs behave optimally (though they often will not, due to their exploration and exploitation nature). In addition, all the MGOs play fair competition in the bidding process. Considering the particularity of energy trading market and agent-based simulation environment, the concept of ’Basic Action’ is created to describe the rational and conventional action of each MGO. One point needs to be emphasized is that ’Basic Action’ is just a point in the action space, showing the general choices of bidding price and quantity for MGOs. The mathematical expressions of basic price action are presented as follows:
p i n , b a s i c = p i , s t e p T · ( 1 + T P n ) · S D R F n ,
p i , s t e p T = p r i c e i i n i t i a l p r i c e i h i s t o r y , T β · N ,
T P n = 1 ( 1 n N ) e 1 ,
where p i , s t e p T represents the price changing step of MGO i, determined by MGO i’s initial bidding price p r i c e i i n i t i a l and historical trading price p r i c e i h i s t o r y , T in time slot T as shown in Equation (11). β is a regulation factor for the price changing step. As the QLCDA reaches the time deadline, both buyer and seller MGOs are willing to make a concession on the bidding price to make more deals. The setup of time pressure T P n as presented in Equation (12) describes the degree of urgency over bidding rounds. Discussions on the choice of time pressure function have already been made in previous research [19]. In this paper, we adopt a simplified form in which the time pressure of each microgrid is only related to the bidding round index. The historical trading records of each microgrid are ignored in the description of time pressure. S D R F n is a modified factor based on real-time SDR. Different calculation expressions are adopted for buyer and seller MGOs as follows, inside which π is an adjustment coefficient in the range of [0.3,0.5]. The setting of π measures the influence of SDR on the basic bidding price:
S D R F i n = π · ( 1 S D R n ) + 1 for buyers , π · ( S D R n 1 ) + 1 for sellers .
Accordingly, the basic quantity action is calculated as follows:
q i n , b a s i c = q i n · S D R n · P S i n 1 for buyers , q i n · ( 2 S D R n ) · P S i n 1 for sellers ,
P S i n = ρ + 2 · ( 1 ρ ) · N ( P R i n , μ , σ ) ,
P R i n = λ · p i h i s t o r y , T p i r e f e r e n c e , n p h l t p l l t ,
where the P R i n is a reference price factor calculated as a parameter of normal distribution, λ = 1 when MGO i is a buyer, while λ = 1 when MGO i is a seller. p i r e f e r e n c e , n is the reference price of MGO i in round n, calculated as the average price of potential transactions in the market. The values of μ and σ in Equation (15) are the same as those in Equation (7). ρ is a pre-defined adjustment coefficient located in the range of [0.95,1] for coordination with the change rate of SDR in Equation (14).
Since the action space is a continuous one, it is impossible to explore the whole action space in this problem. The idea of ’local search’ in heuristic algorithms is applied in the proposed Q-learning algorithm: we intend to explore the neighborhood space of basic action on price and quantity dimensions for better bidding performance in the QLCDA process. Based on the basic action obtained in the former process, we search two directions of the price and quantity dimensions symmetrically, therefore the number of actions in each dimension is odd. Supposing that we choose more than two neighborhoods of the basic action in one direction, the total number of actions in this problem will be at least 25 actions, which is impractical and meaningless in both modeling and simulation. To limit the number of bidding actions and reduce computational complexity, only the closest neighborhoods are taken into account. The neighborhood actions are calculated as follows, where ξ and τ indicate the proximity of bidding price and quantity according to bidding experiences, respectively. ξ and τ are independent variables that only describe the neighborhood relationship of bidding price and quantity. Thus, a 3 × 3 action matrix is created as alternative behaviors of one MGO under a certain state. One factor, in particular, needs highlighting: the nine actions under a certain state represents nine bidding preferences and tendencies of each microgrid. Given that the SDR in one state might be different, the nine actions are also SDR-based and not totally the same for one state:
p i n , = p i n , b a s i c ξ · p i , s t e p n ,
p i n , + = p i n , b a s i c + ξ · p i , s t e p n ,
q i n , = q i n , b a s i c · ( 1 τ ) ,
q i n , + = q i n , b a s i c · ( 1 + τ ) .

3.1.3. Q-Values and Rewards

The goal of the Q-learning algorithm for bidding strategy optimization is to choose the appropriate actions under different states for each MGO, and the Q-Values indicate the long-term values of state-action pairs. In the former Q-learning process, the Q-values for state-action pairs are arranged in the so-called Q-table. However, based on the action space, we mention, in the former chapter, a Q-cube framework of Q-learning algorithm is proposed as shown in Figure 6, in which the colors of state slices are corresponding to Figure 5.
The Q-value of taking one bidding action under one certain state is distributed in this Q-cube as shown with a small blue cube inside. Generally speaking, the proposed Q-cube is a continuous three-dimensional space, but, for practical purposes, we discrete the problem domain by taking eight states, three bidding prices and three bidding quantities under consideration in this paper. Each MGO has a unique Q-cube showing the Q-value distribution in the proposed problem domain. The Q-values in the Q-cube are not cleared to zero at the end of each time slot but will be applied as initial configuration of the next time slot. The rolling iteration of Q-cube accumulates bidding experience in the energy trading market.
r ( s , a ) is the reward function for adopting action a in state s. The selection of reward function is crucial, since it induces the behavior of MGOs. Seeing that we consider the dual effects of bidding price and quantity in QLCDA, both contributions of adopting one certain action should be taken into account in the reward function. The mathematical expression of reward function is presented in Equation (21). ω represents the weighted factor on bidding price and quantity. As price is the decisive factor in deciding whether a deal is closed, we pay more attention to the bidding price, therefore ω is usually set to be greater than 0.5:
r ( s , a ) = ω · r p ( s , a ) + ( 1 ω ) · r q ( s , a ) .
r p ( s , a ) and r q ( s , a ) represent the contributions of bidding price and quantity update on the reward function, which are calculated as follows. All of the variable definitions are the same as those in Equations (10)–(16):
r p ( s , a ) = p i n p i h i s t o r y , T p i r e f e r e n c e , n p i h i s t o r y , T p i , s t e p T ,
r q ( s , a ) = λ · ( q i n q i i n i t i a l , T ) q i i n i t i a l , T · ( S D R n 1 ) .

3.2. Update Mechanism of the Proposed Q-Cube Framework

In the proposed Q-learning-based continuous double auction energy trading market, as two dimensions of MGOs’ action, bidding price is the key factor in deciding whether to close a deal or not, bidding quantity affects the real-time SDR of the overall market. Meanwhile, the SDR (as the MGOs’ states) has a decisive influence on MGOs’ actions by updating Q-Values. The coupling relationship between MGOs’ actions and market SDR is modeled in this chapter, as shown in Figure 7. One MGO takes a n 1 in round n 1 and the state transfers from s n 1 to s n . After calculating rewards and updating Q-value, the probability of choosing any action in the action space is modified. Afterwards, given the new Q-cube and market SDR, the MGO might choose a n as the action in round n and repeat the above process. Therefore, the state-action pair of one MGO in each bidding round is formulated in a spiral iteration way, considering both local private information and public environment. The Q-cube framework is a connector of the state perception process and a decision-making process, which is the core innovation of this paper.

3.2.1. Q-Value Update

The common Q-Value update rule for the model-free Q-learning algorithm with learning rate α and discount factor γ is given as follows:
Q n + 1 ( s i n , a i n ) = ( 1 α ) · Q n ( s i n , a i n ) + α · r ( s i n , a i n ) γ · max a i Q n ( s i n + 1 , a i n + 1 ) ,
where Q n + 1 ( s i n , a i n ) represents the updated Q-value for MGO i adopting action a i n under state s i n in the nth bidding round. When observing the subsequent state s i n + 1 and reward r ( s i n , a i n ) , the Q-value is immediately updated. We adopt this common Q-value update rule for Q-learning in this paper.
The learning rate α and discount factor γ are two critical parameters of MGOs as they reflect each MGO’s bidding preference. The learning rate defines how much the updated Q-value learns from the new state-action pair. α = 0 means the MGO will learning nothing from new market bidding information, while α = 1 indicates that the Q-value of a new state-action pair is the only important information. The discount factor defines the importance of future revenues. The MGOs whose γ near 0 are regarded as a short-sighted agent as it only cares about gaining short-term profits, but, for the MGOs whose γ is close to 1, they tend to wait until the proper time for more future revenues.

3.2.2. Action Update

In each round of QLCDA, for each MGO, firstly the basic action is calculated based on market SDR and historical trading records as shown in Figure 8 with red balls in the action space. The colors of action space slices represent the market state. The neighborhood actions are formed in the action space as shown with blue blocks. A selection process is carried out by creating the probability matrices of nine optional actions.
In Equation (25), the action matrix A i n is composed by combining the optional bidding price and quantity. Correspondingly, the elements the probability matrix Pro i n are formed according to ’ ε -greedy’ strategy. The probability ( x b b ) of the basic action ( a i b b = ( p i b a s i c , q i b a s i c ) ) is given preferential treatment and equals ε . For each microgrid, the setting of ε represents its degree of attention on optimal bidding action choice in theory, which is diverse from each other. The probability of other neighborhood actions are calculated by weighted sharing of the remaining probability according to their Q-value (as Equation (26)). The sum of nine probabilities on actions equal to 1:
A i n = ( p i , q i + ) ( p i b a s i c , q i + ) ( p i + , q i + ) ( p i , q i b a s i c ) ( p i b a s i c , q i b a s i c ) ( p i + , q i b a s i c ) ( p i , q i ) ( p i b a s i c , q i ) ( p i + , q i ) Pro i n = x + x b + x + + x b x b b x + b x x b x + .
For example, x + represents the probability of choosing action a i + = ( p i , q i + ) under the current state, which is calculated as follows:
x + = ( 1 ε ) · Q n ( s i n , a i + ) a / a b b Q n ( s i n , a i ) .
This selection mechanism means that all MGOs have a higher possibility of choosing actions with higher Q-values in each round of QLCDA. By putting the MGOs’ best possible local actions together, the most suitable actions for the current global state are generated in a distributed non-cooperative way.

4. Case Studies and Simulation Results

In this section, we investigate the performance of the Q-learning algorithm for continuous double auction among microgrids by Monte Carlo simulation. The proposed algorithm is tested on the realistic case in Guizhou Province of China. The distribution network near Hongfeng Lake consists of 14 microgrids with different scales and internal configurations. Detailed topology of the networked microgrids are given in Figure 9. As power flow calculation and safety check are not the focus of this paper, distance information and transmission price in this distribution network are not provided here. The interested reader may refer to [24] for more details.
We simulate this non-cooperative energy trading market within a scheduling cycle of 24 h. The QLCDA is performed every Δ t = 0.5 h. A scheduling cycle starts at 9:00 a.m. The internal coordinated dispatch of each microgrid is accomplished in advance, from which the dispatch results are treated as initial bidding information in QLCDA. BESS properties of the 14 microgrids are provided in Table A1, including capacity, initial SOC, charge and discharge restriction and charge and discharge efficiency. Guizhou Grid adopts the peak/flat/valley pricing strategy for energy trading, which divides a 24-hour scheduling cycle into three types of time intervals. The surplus energy injected to the grid is paid at 0.300 CNY for each kWh in the whole day. In addition, buying energy from the grid is charged at the price 1.197/0.744/0.356 CNY, respectively (see Table A2).
In order to simulate the microgrids’ preferences in decision-making, different risk strategies are adopted by setting diverse Q-learning parameters. Fourteen microgrids’ values of learning rate, discount rate and greedy degree are given in Table A3. Three risk strategies are defined and discussed according to different Q-learning parameter choices:
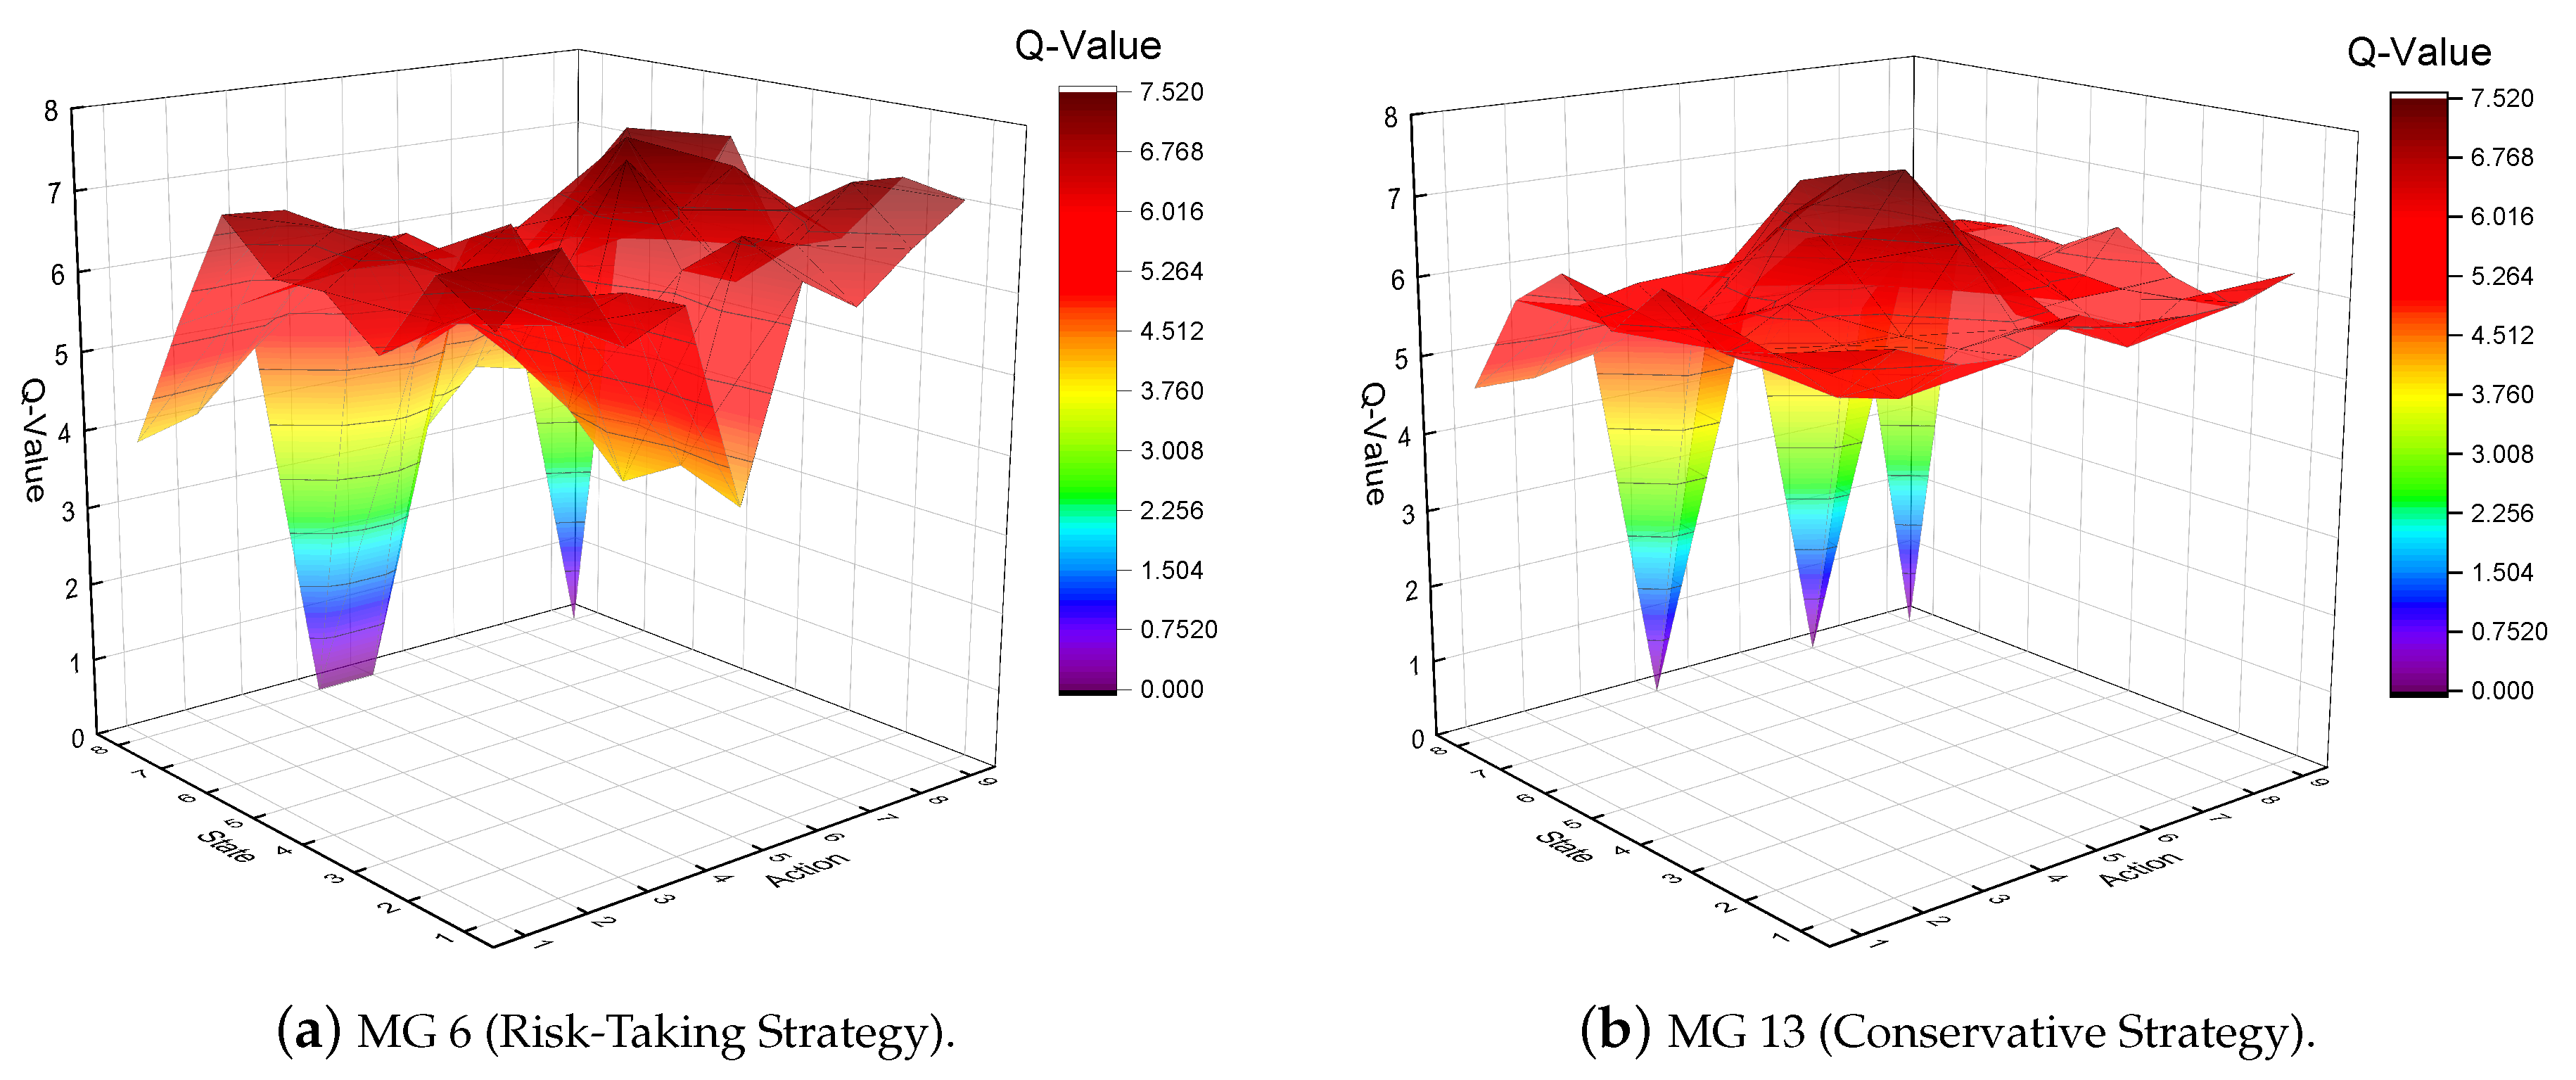
  • Conservative Strategy: the high value of α (ranged in [0.6,1]) indicates that the MGO is greedy about new bidding information, but the higher choice of ε (ranged in [0.6,1]) indicates that he is conservative on basic QLCDA bidding actions. In addition, he’s satisfied with a lower value of γ (ranged in [0,0.4]) as future revenue is not important for him.
  • In-Between Strategy: Ordinary choices of three parameters ranged in [0.4,0.6].
  • Risk-Taking Strategy: the MGO is not greedy about new bidding information (low value of α ranged in [0,0.4]) but likes to explore more potential actions (low value of ε ranged in [0,0.4]) as a risk-taker. In the meantime, he is eager for more future profits (high value of γ ranged in [0.6,1]).
Other hyper parameters in the proposed Q-learning algorithm are given in Table A4.
The proposed energy trading market model and QLCDA algorithm are implemented and simulated using MATLAB R2019a on an Intel Core i7-4790 CPU, 3.60GHz. Three case studies on bidding performances and profit comparisons are discussed in this section. All the three case studies are simulated repeatedly for 30 times, among which the bidding result of one certain Monte Carlo simulation is analyzed in detail in Case Studies 1 and 2, and the average values of bidding profits are adopted to compare with the profits of two other energy trading mechanisms in Case Study 3.

4.1. Case Study 1: Bidding Performance of the Proposed Continuous Double Auction Mechanism

4.1.1. Bidding Performance of the Overall Energy Trading Market

The proposed continuous double auction energy trading mechanism achieves significant effects on the energy trading among microgrids. Figure 10 shows the bidding process of price in Time Slot 12. In Figure 10a, the bidding price of all microgrids in the whole time slot is presented. Starting with different initial bidding prices, the slopes of price curves indicate different bidding strategies of the MGOs. Due to the fact that bidding price is the key factor in deciding whether to close a deal or not, different intersection points of the pricing curves represent deals under various market conditions. Buyer/Seller MGOs with stronger willingness of reaching deals prefer to raise/drop their prices quickly, expecting that their energy demand/supply is satisfied in the early stage of a time slot. Although patient MGOs would like to wait until the deadline for a better trading price, they have to experience fierce price competition near the deadline and face the possibility of no energy to trade.
Figure 10b shows the bidding price details in rounds 105–135 of time slot 12. MG 11 hadn’t traded energy with other microgrids for a long time according to historical records. With stronger willingness of selling energy, MG 11 drops its bidding price quickly and reaches a deal with MG 4 at the price 0.530 CNY/kWh. Unmet energy demand of MG 4 is satisfied by MG 13 with a higher price (0.579 CNY/kWh). MG 6 raises its bidding price slowly and closes deals with MG 9 and MG 10 at the price of 0.481 CNY/kWh and 0.489 CNY/kWh, respectively. However, 27.016 kWh of energy demand has to be bought from the grid with a higher price (0.744 CNY/kWh) as all the energy supply from other microgrids is sold out. This shows a trade-off between price and trading opportunity: one MGO might be eager for closing a deal, but the trading price might not be satisfactory. On the other hand, the energy trading market follows the principle of ’First, Bid, First, Deal’, which means the closer the time to the deadline, the less energy one is able to trade.
Comparison on clear power curves before and after CDA is presented in Figure 11. Enhanced by the proposed CDA mechanism, the distribution network achieves better performance on the balance of energy supply and demand. As a result of more balanced energy trading market conditions, more energy is transacted within the distribution network rather than trading with the grid, which reduces long-distance energy transmission loss. With the help of BESS, an alternative form of ’demand response’ is performed among microgrids by exerting the potential capacity of elastic loads, which expands the concept of demand response from time-slot-based to multi-agent-based by CDA. In addition, trading prices are more reasonable and profitable, taking care of each MGO’s personal preferences.
The comparison of trading quantity before and after the proposed CDA is given in Table 1. A significant effect could be obtained by adopting CDA as the trading quantity with grid decrease by different degrees. For example, only 10.8% of the energy demand of MG 3 is provided by the grid, while microgrids with heavy demand like MG 4 and MG 6 still depend on the grid to a large extent, holding 65.5% and 57.1%, respectively. Seller microgrids’ dependency of the grid is obviously less than that of buyer microgrids with an average percentage of 26.1% as they prefer to sell energy within the distribution network. The BESS storage change and (dis)charge energy loss are also presented in Table 1, from which we could find that most of the microgrids’ BESS obtain higher SOC at the end of one scheduling cycle. The larger BESS capacity and the more active the participation in the trading market, the more BESS (dis)charge energy loss will be caused.

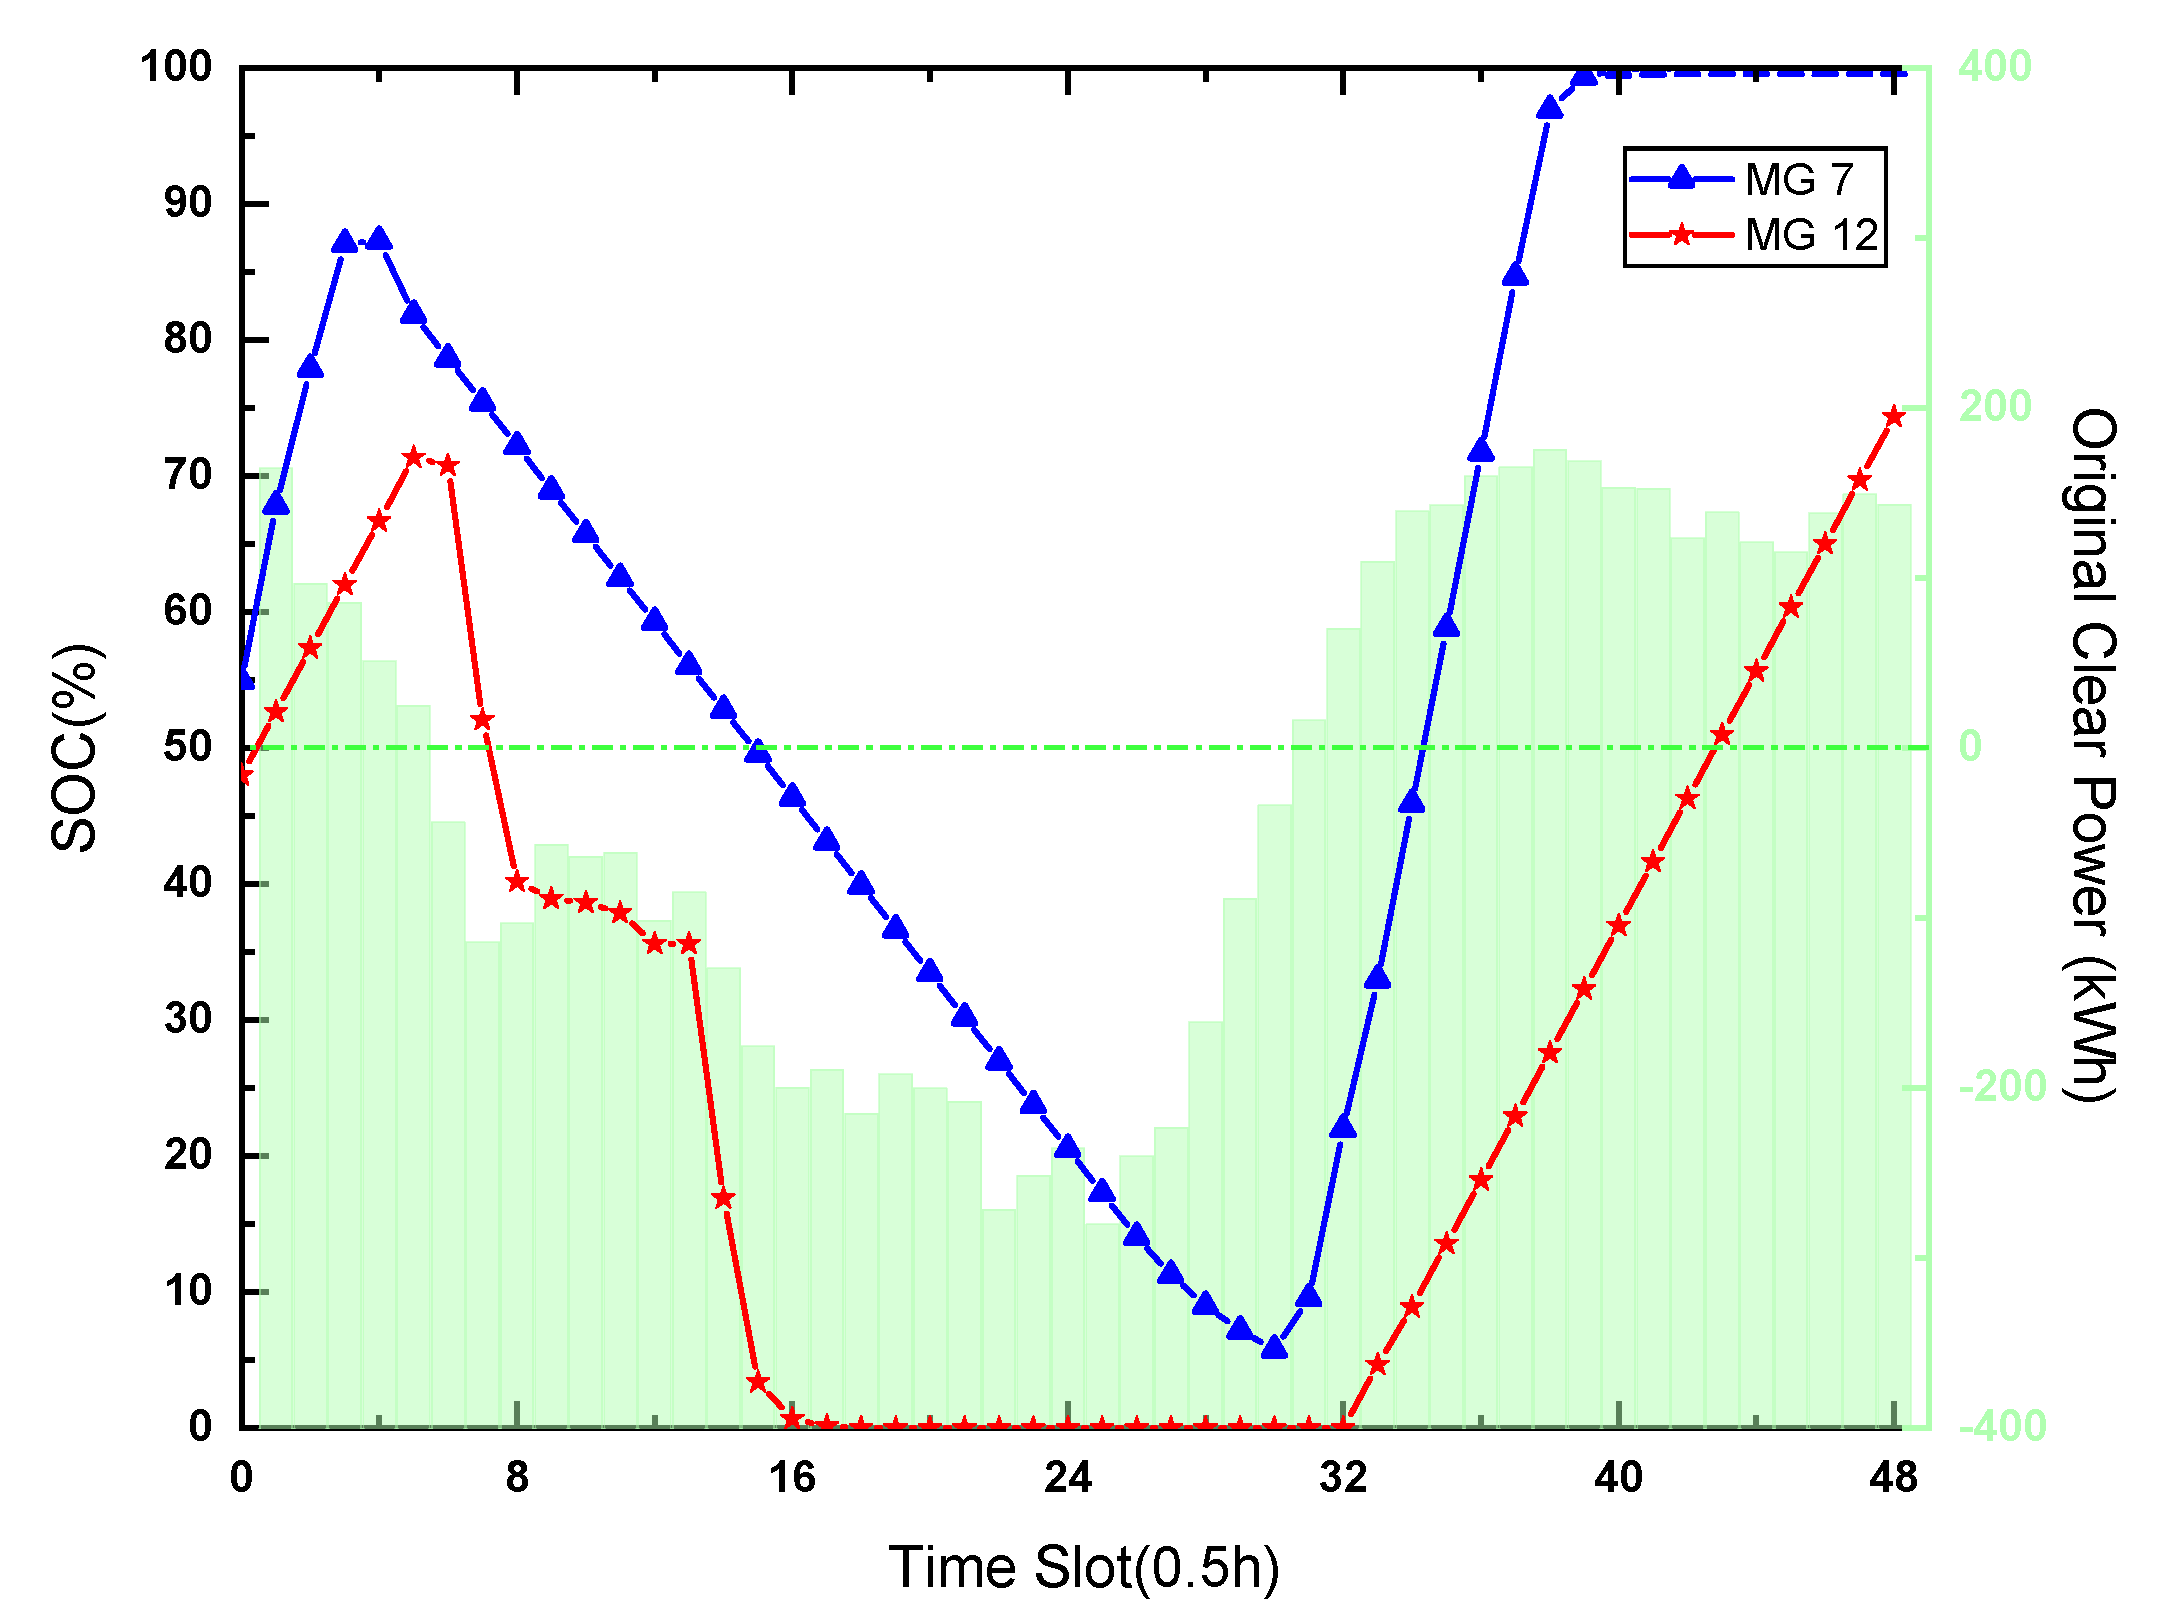
4.1.2. Bidding Results of Specific Microgrids with Different Roles

The bidding results of specific microgrids with different roles are presented in this chapter, including bidding price and quantity. Figure 12 gives the energy trading price of MG 4 and MG 12. MG 4 plays the role of buyer in the whole scheduling cycle, and it successfully reaches deals with other microgrids in most of the time slots as shown in Figure 12a. On no-deal time slots, it buys energy from the grid at higher prices. During the valley interval, although the grid purchase price is low enough (0.356 CNY/kWh), there are still plenty of opportunities to trade with other microgrids in consideration of the real-time SDR. MG 4 succeeds at buying energy at lower prices in almost all the time slots in this interval. Different from MG 4, MG 12 plays two roles in different time slots. The detailed trading prices of MG 12 in time slots 9 to 32 are presented in Figure 12b. Good performance is obtained in both roles that MG 12 plays: during buyer intervals, it reaches deals with other microgrids at prices lower than the grid’s, while, in seller intervals, it sells energy in every time slot for higher profits. The overall profit of MG 12 raised by 33.9% after joining the CDA energy trading market.
For MG 7, the bidding performance on quantity is presented in Figure 13a. As a buyer microgrid in the whole scheduling cycle, the gaps between original bidding quantity curve and actual trading quantity curve correspond to the real-time SDR. When S D R 1 (the original clear power ≥ 0 as shown in Figure 13a above the blue horizontal line) in former and later time slots, MG 7 raises its trading quantity and stores more energy into its BESS to absorb the surplus energy in the market. During the middle time slots when S D R < 1 (the original clear power < 0), part of the energy demand is provided by its own BESS, which helps to balance the excessive energy demand in market. The two curves coincide at the end of the scheduling cycle as the BESS stores enough energy in time slot 32 to 38 and SOC is near 1. The same characteristics could be found in the bidding performance of MG 12. In Figure 13b, when energy demand exceeds supply as shown below the purple horizontal line, the BESS of MG 12 discharges to satisfy the energy demand. More energy is sold in these time slots to reach a better market SDR performance, while, during the nighttime, MG 12 charges the surplus energy to its BESS rather than selling to the grid. It is obvious that the actual trading quantity curves cohere better with the real-time SDR than the original bidding quantity curves in both the standpoints of buyer and seller microgrids.
The BESS SOC of MG 7 and MG 12 is presented in Figure 14, from which we could find the trend of SOC curves coheres with that of the SDR. When S D R < 1 , both MG 7 and 12 discharge their BESS to compensate the lack of energy supply. The BESS of MG 12 releases all its energy and the SOC reaches 0 since time slot 16. However, when the energy supply exceeds demand during the nighttime, the BESS starts to charge and save surplus energy for later use. The SOC of MG 7 reaches 100% since time slot 40. Different from former research by [25], the charge and discharge behaviors of BESS are restricted by ramp constraints, which makes the simulation results closer to reality. Due to BESS capacity and (dis)charge energy loss, the regulatory ability of BESS on the energy trading market is limited. When S O C = 0 or S O C = 1 , internal re-scheduling of each microgrid could be developed for greater bidding potential.

4.2. Case Study 2: Effectiveness Verification of the Proposed Q-Cube Framework

The Q-cube of a MGO is updated in each round of the whole scheduling cycle. Q-values are iteratively accumulated following the proposed update rules. In order to display this distribution in the three-dimension space, bidding actions are abstracted to nine actions. MG 6 and MG 13 are chosen as the examples of risk-taking strategy and conservative strategy, respectively. The Q-value distributions of these two microgrids are shown in Figure 15.
As a risk-taker, the Q-value distribution in MG 6’s Q-cube is a non-uniform distribution with a slight trench in the middle of action dimension as shown in Figure 15a. According to the Q-cube framework proposed in this paper, the low value of MG 6’s greedy degree ( ε = 0.1680 ) results in its curiosity on the neighborhood actions of basic action (action 5) for all the states. Neighborhood actions are given more opportunities to accumulate Q-values based on the action selection mechanism. The eagerness of obtaining more future profits aggravates this phenomenon as the discount factor ( γ = 0.6721 ) is high. A low value of learning rate ( α = 0.2617 ) indicates that new bidding information in the real-time market has little impact on the choice of actions.
On the contrary, MG 13 chooses to be conservative in the QLCDA process, whose Q-value distribution in the Q-cube is presented in Figure 15b. MG 13 likes to keep in touch with the latest market information and prefers to choose the basic action under states near S D R = 1 , which leads to high values of learning rate ( α = 0.6812 ) and greedy degree ( ε = 0.8462 ). He is satisfied with current revenues and doesn’t have much interest in exploring new actions, so the discount factor of MG 13 is at a low level ( γ = 0.333 ). Therefore, there is an obvious hump on the surface of Q-value plane around the middle part (near Q (state 4, action 5) and Q (state 5, action 5)), showing that MG 13 is rational and not greedy.
The iteration results of Q-values of different microgrids prove that the proposed Q-Cube framework for Q-learning algorithm is capable and effective in reflecting the microgrids’ characteristics.

4.3. Case Study 3: Profit Analysis on Different Energy Trading Mechanisms

To verify the performance of the proposed QLCDA, a profit analysis on different energy trading mechanisms is carried out. Previous work of [19] on peer-to-peer energy trading mechanism is introduced here for comparison. As shown in Table 2, three energy trading mechanisms are simulated on the same case from Guizhou Grid for 30 times and the average values of energy trading profits are calculated and analyzed for statistically significance. Negative values indicate the cost paid to peer microgrids and the DNO. The proposed QLCDA mechanism is proved to have superior performance over tradition energy trading mechanism as expected. In addition, for most microgrids, a certain degree of increase on profits could be obtained compared to P2P mechanisms. The profits of seller microgrids are commonly raised as clean energy generated during valley intervals could be stored until the needed time rather than selling to the grid at lower prices. A 65.7% and 10.9% rise in the overall profits of the distribution network can be achieved by the QLCDA mechanism compared with that of the tradition energy trading mechanism and P2P mechanism, respectively.
However, for some buyer microgrids (particularly for MG 6), the profits by adopting the QLCDA mechanism is less than that of the P2P mechanism. This could be explained by the following reasons: (1) as presented in Table 1, the trading quantity is adjustable in the QLCDA mechanism, most of the microgrids obtain higher BESS SOC at the end of one scheduling cycle, inside which MG 6 stores the largest quantity of energy (151.1kWh). The profits by selling this part of stored energy are not calculated in Table 2, while, in a P2P mechanism, the effect of applying BESS and changes in bidding quantity is not taken into consideration. (2) MG 6 is a risk-taker based on its Q-learning parameters. The low value of greedy degree ( ε = 0.1680 ) and learning rate ( α = 0.2617 ) indicate that MG 6 cares less about new bidding information and wants to explore more potential actions rather than sticking to the basic action. A high value of discount rate ( γ = 0.6721 ) proves his eagerness for more future profits, therefore it prefers to keep its BESS at a high SOC and seek deals with lower trading prices near the deadline. From another standpoint of view, the profits analysis proves the effectiveness of the proposed Q-Cube framework for the Q-learning algorithm on energy trading problems.
Considering the equipment and operation costs of BESS, the proposed QLCDA mechanism might not be the best choice for energy trading among microgrids, but the simulation results prove its potential in increasing profits for microgrids with different configurations and preferences.

5. Conclusions

To better describe the characteristics of future electricity market, a non-cooperative continuous double auction mechanism, considering the coupling relationship of bidding price and quantity, was developed in this paper to facilitate energy trading among microgrids in the distribution network. An alternative form of ’demand response’ is performed in the proposed energy trading mechanism by exerting the potential capacity of BESS, which expands the concept of demand response from time-based to multi-agent-based. The Q-learning algorithm was introduced to CDA mechanism as a decision-making method for each microgrid. To solve the existing defects on the application of Q-learning algorithm in power system, a non-tabular framework of Q-values considering two dimensions of the bidding action is proposed as a Q-cube. In addition, corresponding parameter setting and state-action architecture are designed to better reflect the microgrids’ personalized bidding preferences and make rational decisions according to real-time status of the networked microgrids. Simulations on a realistic case from Hongfeng Lake, Guizhou Province, China prove the efficiency and applicability of the proposed CDA mechanism and Q-cube framework. All of the microgrids are able to make an appropriate negotiation response to the global real-time supply and demand relationship without disclosing personal privacy. A 65.7% and 10.9% increase in the overall profit of the distribution network could be achieved by applying a QLCDA mechanism compared with the traditional energy trading mechanism and P2P energy trading mechanism, respectively. In addition, the Q-value distribution in the proposed Q-cube gives a good response to microgrid’s bidding behaviors and preferences on both theoretical analysis and simulation results. As has been demonstrated in this paper, the proposed Q-cube framework of a Q-learning algorithm for a continuous double auction mechanism can be applied to more energy trading markets in future EI.
There are still some limitations of the proposed Q-cube framework to be discussed: the interaction between bidding price and quantity should be better described as many other factors could have an influence on this coupling relationship, and it is still difficult to summarize the microgrids’ energy bidding preferences with these existing parameters. Moreover, the power flow calculation should be considered synchronously as the energy trading quantity might cause safety issues in the distribution network. In future works, a two-layer energy bidding architecture could be discussed considering both QLCDA among microgrids and internal coordinated dispatch inside microgrids. The interaction of these two layers is worth studying. The power transmission limitations should be considered to ensure the safety of energy market. In addition, further extensions are to be carried out on the time-varying setting of QL parameters and a more appropriate description of the reward function.

Author Contributions

Conceptualization, N.W. and W.X.; Methodology, N.W.; Software, N.W.; Validation, N.W.; Formal Analysis, N.W.; Investigation, N.W. and Z.X.; Data Curation, Z.X.; Writing—original draft preparation, N.W.; Writing—review and editing, W.X., Z.X. and W.S.; Visualization, N.W.; Supervision, W.X.; Project Administration, W.X.; Funding Acquisition, W.X. All of the authors have read and approved the final manuscript.

Funding

This research was funded by the National Natural Science Foundation of China under Grant No. 61773292 and 71841036.

Acknowledgments

The authors thank Ke Sun and Yifan Cheng for careful reading and many helpful suggestions to improve the presentation of this paper.

Conflicts of Interest

The authors declare no conflict of interest.

Abbreviations

The following abbreviations are used in this manuscript:
EIEnergy Internet
DERDistributed Energy Resource
DGDistributed Generation
BESSBattery Energy Storage System
EVElectric Vehicle
DLDispatchable Load
RESRenewable Energy Source
ICTInformation and Communication Technology
MGOMicrogrid Operator
DNODistribution Network Operator
CDAContinuous Double Auction
P2PPeer-to-Peer
RLReinforcement Learning
QLQ-learning
MDPMarkov Decision Process
ICDInternal Coordination Dispatch
SOCState of Charge
QLCDAQ-learning based Continuous Double Auction
SDRSupply and Demand Relationship

Appendix A. Supplementary Case Data from the Guizhou Grid, China

Table A1 shows the BESS properties of the 14 microgrids in the Guizhou Grid, including capacity, initial SOC, charge and discharge restriction and charge and discharge efficiency.
Table A1. Battery energy storage system properties of 14 microgrids in the Guizhou Grid.
MG 1MG 2MG 3MG 4MG 5MG 6MG 7
Capacity(kWh)40208010010030080
Initial SOC (%)33.7430.6068.7868.0549.6554.9360.59
Charge & Discharge Restriction(%)24.0516.1816.3915.5515.9816.1518.23
Charge & Discharge Efficiency0.85430.92070.94650.87560.91560.94000.9309
MG 8MG 9MG 10MG 11MG 12MG 13MG 14
Capacity(kWh)150705060100200150
Initial SOC (%)60.5944.9932.8459.0548.0069.5862.65
Charge & Discharge Restriction(%)18.2320.9119.9320.9123.3918.9618.87
Charge & Discharge Efficiency0.93090.88990.89330.87910.88910.90040.8622
The peak/flat/valley electricity price formulated by Guizhou Grid, China is presented in Table A2, which divides a day into three types of time internals.
Table A2. Peak/flat/valley electricity price formulated by the Guizhou Grid.
Time IntervalInterval TypePrice (CNY/kWh)
8 a.m.–11 a.m., 6 p.m.–9 p.m.Peak1.197
6 a.m.–8 a.m., 11 a.m.–6 p.m., 9 p.m.–10 p.m.Flat0.744
10 p.m.–6 a.m.Valley0.356
The learning rate α , discount factor γ and greedy degree ε parameters of the 14 microgrids are given in Table A3.
Table A3. Q-Learning Parameters of 14 Microgrids.
MG 1MG 2MG 3MG 4MG 5MG 6MG 7
Learning Rate α 0.51070.32050.71240.79690.71690.26170.6210
Discount Factor γ 0.52400.64230.75690.33730.77810.67210.4231
Greedy Degree ε 0.65640.35640.81560.49610.34850.16800.4894
MG 8MG 9MG 10MG 11MG 12MG 13MG 14
Learning Rate α 0.35460.50830.32910.55660.23710.68120.2996
Discount Factor γ 0.46700.70650.25700.41460.63970.33300.4062
Greedy Degree ε 0.36480.26580.61730.31730.49830.84620.7943
The values of hyper parameters that appear in this paper are given in Table A4.
Table A4. Hyper parameters settings for the proposed Q-learning algorithm.
Parameter θ μ δ β π ρ ξ τ ω
Value0.5000.301.200.400.980.300.100.70

References

  1. Ampatzis, M.; Nguyen, P.H.; Kling, W. Local electricity market design for the coordination of distributed energy resources at district level. In IEEE PES Innovative Smart Grid Technologies, Europe; IEEE: Piscataway, NJ, USA, 2014; pp. 1–6. [Google Scholar] [CrossRef]
  2. Al-Awami, A.T.; Amleh, N.A.; Muqbel, A.M. Optimal Demand Response Bidding and Pricing Mechanism With Fuzzy Optimization: Application for a Virtual Power Plant. IEEE Trans. Ind. Appl. 2017, 53, 5051–5061. [Google Scholar] [CrossRef]
  3. Dehghanpour, K.; Nehrir, M.H.; Sheppard, J.W.; Kelly, N.C. Agent-Based Modeling of Retail Electrical Energy Markets With Demand Response. IEEE Trans. Smart Grid 2018, 9, 3465–3475. [Google Scholar] [CrossRef]
  4. Jeong, G.; Park, S.; Lee, J.; Hwang, G. Energy Trading System in Microgrids With Future Forecasting and Forecasting Errors. IEEE Access 2018, 6, 44094–44106. [Google Scholar] [CrossRef]
  5. Wei, W.; Liu, F.; Mei, S. Energy Pricing and Dispatch for Smart Grid Retailers Under Demand Response and Market Price Uncertainty. IEEE Trans. Smart Grid 2015, 6, 1364–1374. [Google Scholar] [CrossRef]
  6. Olson, M.; Rassenti, S.; Rigdon, M.; Smith, V. Market Design and Human Trading Behavior in Electricity Markets. IIE Trans. 2003, 35, 833–849. [Google Scholar] [CrossRef]
  7. Nunna, H.S.V.S.K.; Doolla, S. Energy Management in Microgrids Using Demand Response and Distributed Storage—A Multiagent Approach. IEEE Trans. Power Deliv. 2013, 28, 939–947. [Google Scholar] [CrossRef]
  8. Nunna, H.S.V.S.K.; Doolla, S. Demand Response in Smart Distribution System With Multiple Microgrids. IEEE Trans. Smart Grid 2012, 3, 1641–1649. [Google Scholar] [CrossRef]
  9. Sueyoshi, T.; Tadiparthi, G. Wholesale Power Price Dynamics Under Transmission Line Limits: A Use of an Agent-Based Intelligent Simulator. IEEE Trans. Syst. Man Cybern. Part C (Appl. Rev.) 2008, 38, 229–241. [Google Scholar] [CrossRef] [Green Version]
  10. Kasbekar, G.S.; Sarkar, S. Pricing games among interconnected microgrids. In Proceedings of the 2012 IEEE Power and Energy Society General Meeting, San Diego, CA, USA, 22–26 July 2012; pp. 1–8. [Google Scholar] [CrossRef]
  11. Zhang, C.; Wu, J.; Zhou, Y.; Cheng, M.; Long, C. Peer-to-Peer energy trading in a Microgrid. Appl. Energy 2018, 220, 1–12. [Google Scholar] [CrossRef]
  12. Devine, M.T.; Cuffe, P. Blockchain Electricity Trading Under Demurrage. IEEE Trans. Smart Grid 2019, 10, 2323–2325. [Google Scholar] [CrossRef]
  13. Bunn, D.W.; Oliveira, F.S. Agent-based simulation-an application to the new electricity trading arrangements of England and Wales. IEEE Trans. Evol. Comput. 2001, 5, 493–503. [Google Scholar] [CrossRef]
  14. Vytelingum, P.; Cliff, D.; Jennings, N.R. Strategic bidding in continuous double auctions. Artif. Intell. 2008, 172, 1700–1729. [Google Scholar] [CrossRef] [Green Version]
  15. Nicolaisen, J.; Petrov, V.; Tesfatsion, L. Market power and efficiency in a computational electricity market with discriminatory double-auction pricing. IEEE Trans. Evol. Comput. 2001, 5, 504–523. [Google Scholar] [CrossRef] [Green Version]
  16. Wang, J.; Wang, Q.; Zhou, N.; Chi, Y. A Novel Electricity Transaction Mode of Microgrids Based on Blockchain and Continuous Double Auction. Energies 2017, 10, 1971. [Google Scholar] [CrossRef]
  17. Tan, Z.; Gurd, J.R. Market-based grid resource allocation using a stable continuous double auction. In Proceedings of the 2007 8th IEEE/ACM International Conference on Grid Computing, Austin, TX, USA, 19–21 September 2007; pp. 283–290. [Google Scholar] [CrossRef]
  18. Long, C.; Wu, J.; Zhou, Y.; Jenkins, N. Peer-to-peer energy sharing through a two-stage aggregated battery control in a community Microgrid. Appl. Energy 2018, 226, 261–276. [Google Scholar] [CrossRef]
  19. Wang, N.; Xu, W.; Xu, Z.; Shao, W. Peer-to-Peer Energy Trading among Microgrids with Multidimensional Willingness. Energies 2018, 11, 3312. [Google Scholar] [CrossRef]
  20. Tushar, W.; Saha, T.K.; Yuen, C.; Liddell, P.; Bean, R.; Poor, H.V. Peer-to-Peer Energy Trading With Sustainable User Participation: A Game Theoretic Approach. IEEE Access 2018, 6, 62932–62943. [Google Scholar] [CrossRef]
  21. Rocchetta, R.; Bellani, L.; Compare, M.; Zio, E.; Patelli, E. A reinforcement learning framework for optimal operation and maintenance of power grids. Appl. Energy 2019, 241, 291–301. [Google Scholar] [CrossRef]
  22. Sutton, R.S.; Barto, A.G. Reinforcement learning: An introduction; MIT Press: Cambridge, MA, USA, 2018. [Google Scholar]
  23. Glavic, M.; Fonteneau, R.; Ernst, D. Reinforcement Learning for Electric Power System Decision and Control: Past Considerations and Perspectives. IFAC-PapersOnLine 2017, 50, 6918–6927. [Google Scholar] [CrossRef]
  24. Foruzan, E.; Soh, L.; Asgarpoor, S. Reinforcement Learning Approach for Optimal Distributed Energy Management in a Microgrid. IEEE Trans. Power Syst. 2018, 33, 5749–5758. [Google Scholar] [CrossRef]
  25. Wang, H.; Huang, T.; Liao, X.; Abu-Rub, H.; Chen, G. Reinforcement Learning for Constrained Energy Trading Games With Incomplete Information. IEEE Trans. Cybern. 2017, 47, 3404–3416. [Google Scholar] [CrossRef] [PubMed]
  26. Cai, K.; Niu, J.; Parsons, S. Using Evolutionary Game-Theory to Analyse the Performance of Trading Strategies in a Continuous Double Auction Market. In Adaptive Agents and Multi-Agent Systems III. Adaptation and Multi-Agent Learning; Tuyls, K., Nowe, A., Guessoum, Z., Kudenko, D., Eds.; Lecture Notes in Computer Science; Springer: Berlin/Heidelberg, Germany, 2008; pp. 44–59. [Google Scholar]
  27. Schvartzman, L.J.; Wellman, M.P. Stronger CDA Strategies Through Empirical Game-theoretic Analysis and Reinforcement Learning. In Proceedings of the 8th International Conference on Autonomous Agents and Multiagent Systems ( AAMAS ’09), Budapest, Hungary, 10–15 May 2009; International Foundation for Autonomous Agents and Multiagent Systems: Richland, SC, USA, 2009; Volume 1, pp. 249–256. [Google Scholar]
  28. O’Neill, D.; Levorato, M.; Goldsmith, A.; Mitra, U. Residential Demand Response Using Reinforcement Learning. In Proceedings of the 2010 First IEEE International Conference on Smart Grid Communications, Gaithersburg, MD, USA, 4–6 October 2010; pp. 409–414. [Google Scholar] [CrossRef]
  29. Naghibi-Sistani, M.B.; Akbarzadeh-Tootoonchi, M.R.; Javidi-Dashte Bayaz, M.H.; Rajabi-Mashhadi, H. Application of Q-learning with temperature variation for bidding strategies in market based power systems. Energy Convers. Manag. 2006, 47, 1529–1538. [Google Scholar] [CrossRef]
  30. Rahimiyan, M.; Rajabi Mashhadi, H. Supplier’s optimal bidding strategy in electricity pay-as-bid auction: Comparison of the Q-learning and a model-based approach. Electr. Power Syst. Res. 2008, 78, 165–175. [Google Scholar] [CrossRef]
  31. Rahimiyan, M.; Mashhadi, H.R. An Adaptive $Q$-Learning Algorithm Developed for Agent-Based Computational Modeling of Electricity Market. IEEE Trans. Syst. Man Cybern. Part C (Appl. Rev.) 2010, 40, 547–556. [Google Scholar] [CrossRef]
  32. Salehizadeh, M.R.; Soltaniyan, S. Application of fuzzy Q-learning for electricity market modeling by considering renewable power penetration. Renew. Sustain. Energy Rev. 2016, 56, 1172–1181. [Google Scholar] [CrossRef]
  33. Rodriguez-Fernandez, J.; Pinto, T.; Silva, F.; Praça, I.; Vale, Z.; Corchado, J.M. Context aware Q-Learning-based model for decision support in the negotiation of energy contracts. Int. J. Electr. Power Energy Syst. 2019, 104, 489–501. [Google Scholar] [CrossRef]
  34. Ernst, D.; Glavic, M.; Geurts, P.; Wehenkel, L. Approximate Value Iteration in the Reinforcement Learning Context. Application to Electrical Power System Control. Int. J. Emerg. Electr. Power Syst. 2005, 3. [Google Scholar] [CrossRef]
  35. Bui, V.H.; Hussain, A.; Im, Y.H.; Kim, H.M. An internal trading strategy for optimal energy management of combined cooling, heat and power in building microgrids. Appl. Energy 2019, 239, 536–548. [Google Scholar] [CrossRef]
  36. Mbuwir, B.V.; Ruelens, F.; Spiessens, F.; Deconinck, G. Battery Energy Management in a Microgrid Using Batch Reinforcement Learning. Energies 2017, 10, 1846. [Google Scholar] [CrossRef]
  37. Manchin, A.; Abbasnejad, E.; Hengel, A.V. Reinforcement Learning with Attention that Works: A Self-Supervised Approach. arXiv 2019, arXiv:1904.03367. [Google Scholar]
Figure 1. The process of the proposed non-cooperative energy trading market.
Energies 12 02891 g001
Figure 2. The process of Q-learning based continuous double auction in one time slot.
Energies 12 02891 g002
Figure 3. Layering methods in the proposed sharing mechanism.
Energies 12 02891 g003
Figure 4. Sharing price and quantity under two situations.
Energies 12 02891 g004
Figure 5. Supply and demand relationship function and state division of the proposed Q-cube framework.
Energies 12 02891 g005
Figure 6. A Q-cube framework designed for the Q-learning algorithm.
Energies 12 02891 g006
Figure 7. The coupling relationship between microgrid operators’ actions and market supply demand relationship.
Energies 12 02891 g007
Figure 8. The update process of bidding action in the proposed Q-learning algorithm.
Energies 12 02891 g008
Figure 9. Network topology of 14 microgrids in Guizhou Province, China.
Energies 12 02891 g009
Figure 10. The bidding process of price in time slot 12.
Energies 12 02891 g010
Figure 11. Clear power of the overall energy trading market before/after continuous double auction.
Energies 12 02891 g011
Figure 12. Energy trading price of MG 4 and MG 12.
Energies 12 02891 g012
Figure 13. Bidding performance on quantity of MG 7 and MG 12.
Energies 12 02891 g013
Figure 14. Battery energy storage system’s SOC on MG 7 and MG 12.
Energies 12 02891 g014
Figure 15. The Q-value distribution of microgrids adopting two risk strategies.
Energies 12 02891 g015
Table 1. Comparison of trading quantity before/after continuous double auction.
Trading QuantityMG 1MG 2MG 3MG 4MG 5MG 6MG 7
With Grid(Before)(kWh)530.0351.31540.71747.22840.36787.72167.5
With Grid(After)(kWh)125.0
(23.6%)
85.5
(24.4%)
166.5
(10.8%)
1145.2
(65.5%)
741.1
(26.1%)
3876.4
(57.1%)
595.7
(27.5%)
BESS Storage Change (kWh)21.713.355.531.232.0151.136.1
BESS (Dis)Charge Loss(kWh)7.58.114.610.926.651.910.4
Trading QuantityMG 8MG 9MG 10MG 11MG 12MG 13MG 14
With Grid(Before)(kWh)3754.11640.01275.41209.21616.94427.72230.6
With Grid(After)(kWh)1131.1
(30.1%)
386.2
(23.5%)
287.9
(22.6%)
243.4
(20.1%)
622.7
(38.5%)
705.5
(15.9%)
720.9
(32.3%)
BESS Storage Change (kWh)−5.915.214.23.926.4−26.1−9.7
BESS (Dis)Charge Loss(kWh)16.512.77.712.520.133.934.8
Table 2. Contrast of profits among three energy trading mechanisms 1 .
MG 1MG 2MG 3MG 4MG 5MG 6MG 7
Profit in TM (CNY)−428.3−281.5−1224.7−1429.4−1989.0−4542.4−1516.6
Profit in P2PM (CNY)−340.9−230.0−993.5−1090.6−1483.0−3539.1−1199.6
Profit in QLCDAM (CNY)−313.7−217.4−892.1−1154.5−1494.1−3989.2−1143.2
Growth Rate(Over P2PM)8.0%5.5%10.2%−5.9%−0.7%−12.7%4.7%
MG 8MG 9MG 10MG 11MG 12MG 13MG 14
Profit in TM (CNY)1126.2491.9295.4−110.1421.21328.3515.6
Profit in P2PM (CNY)1687.4808.4459.3−70.5581.01874.2708.4
Profit in QLCDAM (CNY)1875.4897.0471.329.3564.22105.8743.1
Growth Rate(Over P2PM)11.1%11.0%2.6%141.6%−2.9%12.4%4.9%
1 TM: Traditional Mechanism; P2PM: Peer-to-Peer Mechanism; QLCDAM: Q-learning based Continuous Double Auction Mechanism.

