Author Contributions
The authors all contributed to the deployment of the paper. Z.H., Z.Z. (Zhennan Zhu) and K.L.; Data curation, Z.Z. (Zhennan Zhu), P.W., Z.Z. (Zinong Zuo) and D.Z.; Formal analysis, Z.Z. (Zhennan Zhu); Funding acquisition, Z.H.; Investigation, Z.Z. (Zhennan Zhu), P.W. and Z.Z. (Zinong Zuo); Methodology, Z.H., Z.Z. (Zhennan Zhu); Project administration, Z.H.; Software, P.W. and Z.Z. (Zinong Zuo); Supervision, Z.H. and K.L.; Writing—original draft, Z.Z. (Zhennan Zhu); Writing—review & editing, Z.H., P.W. and K.L.
Figure 1.
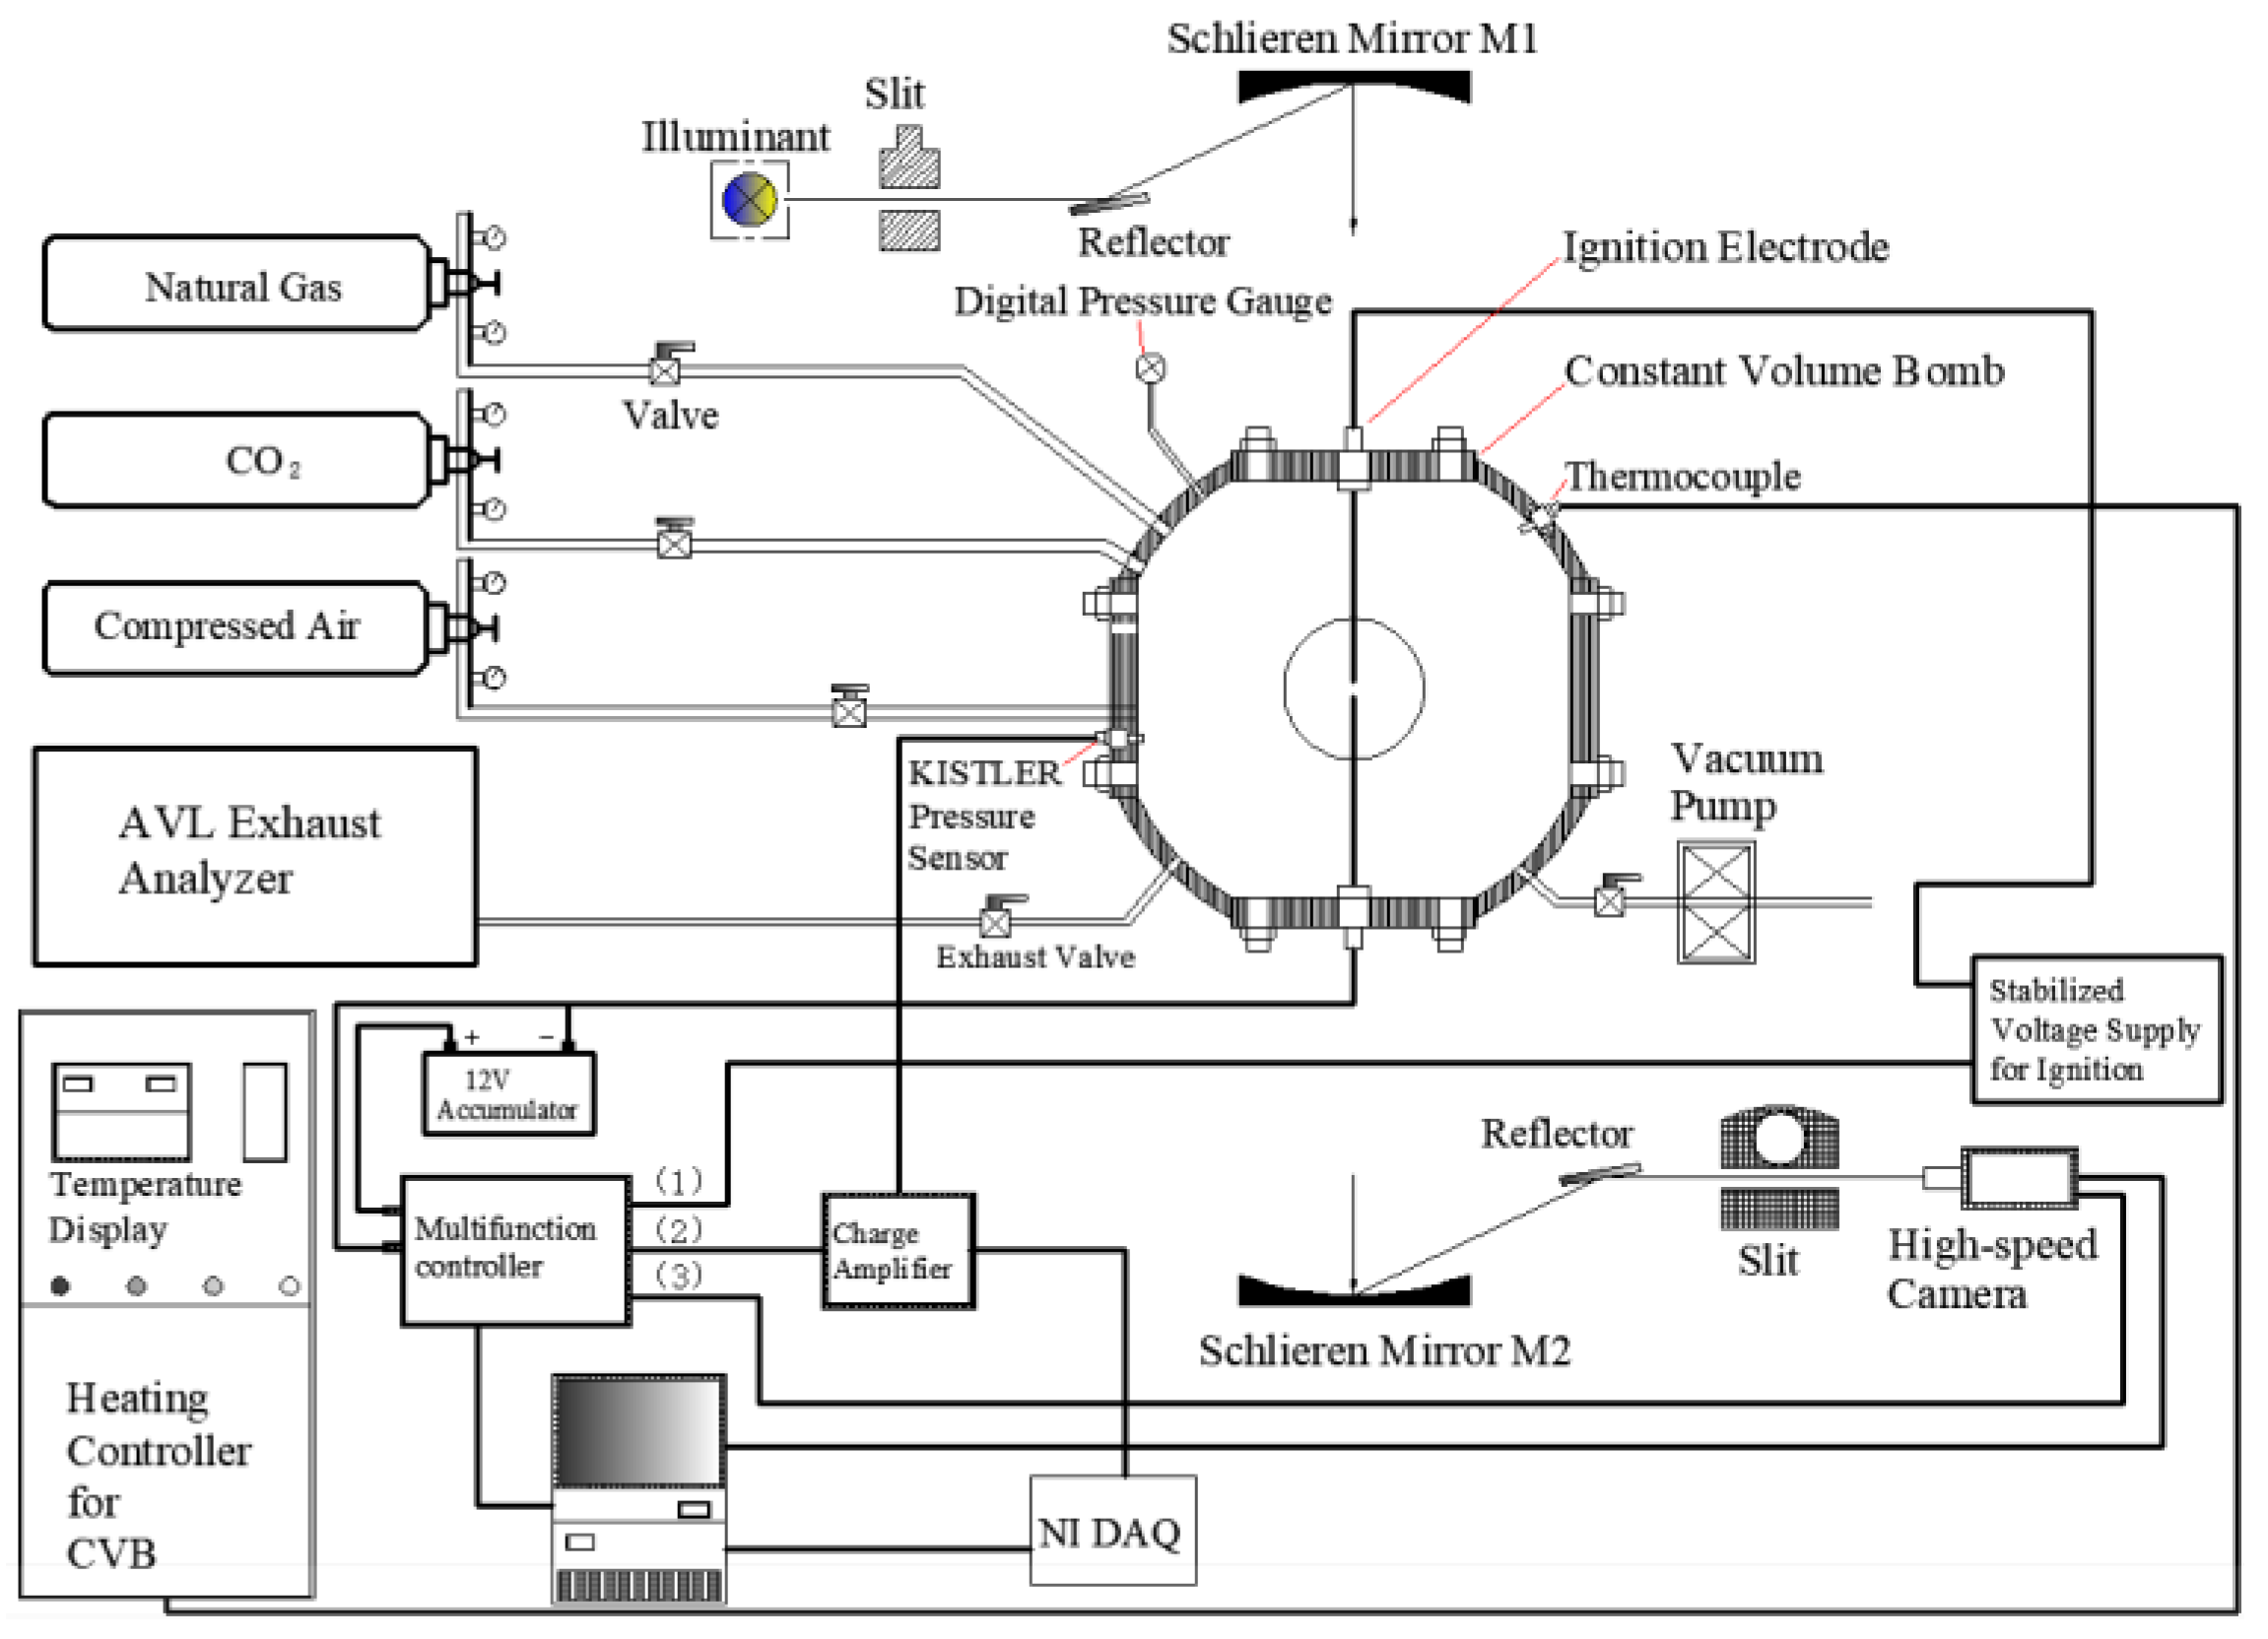
The experimental setup, consisting of a constant volume chamber, a Schlieren system, a temperature controlling and monitoring system, an intake and exhaust system, an AVL exhaust analyzer and a computer as a controller.
Figure 1.
The experimental setup, consisting of a constant volume chamber, a Schlieren system, a temperature controlling and monitoring system, an intake and exhaust system, an AVL exhaust analyzer and a computer as a controller.
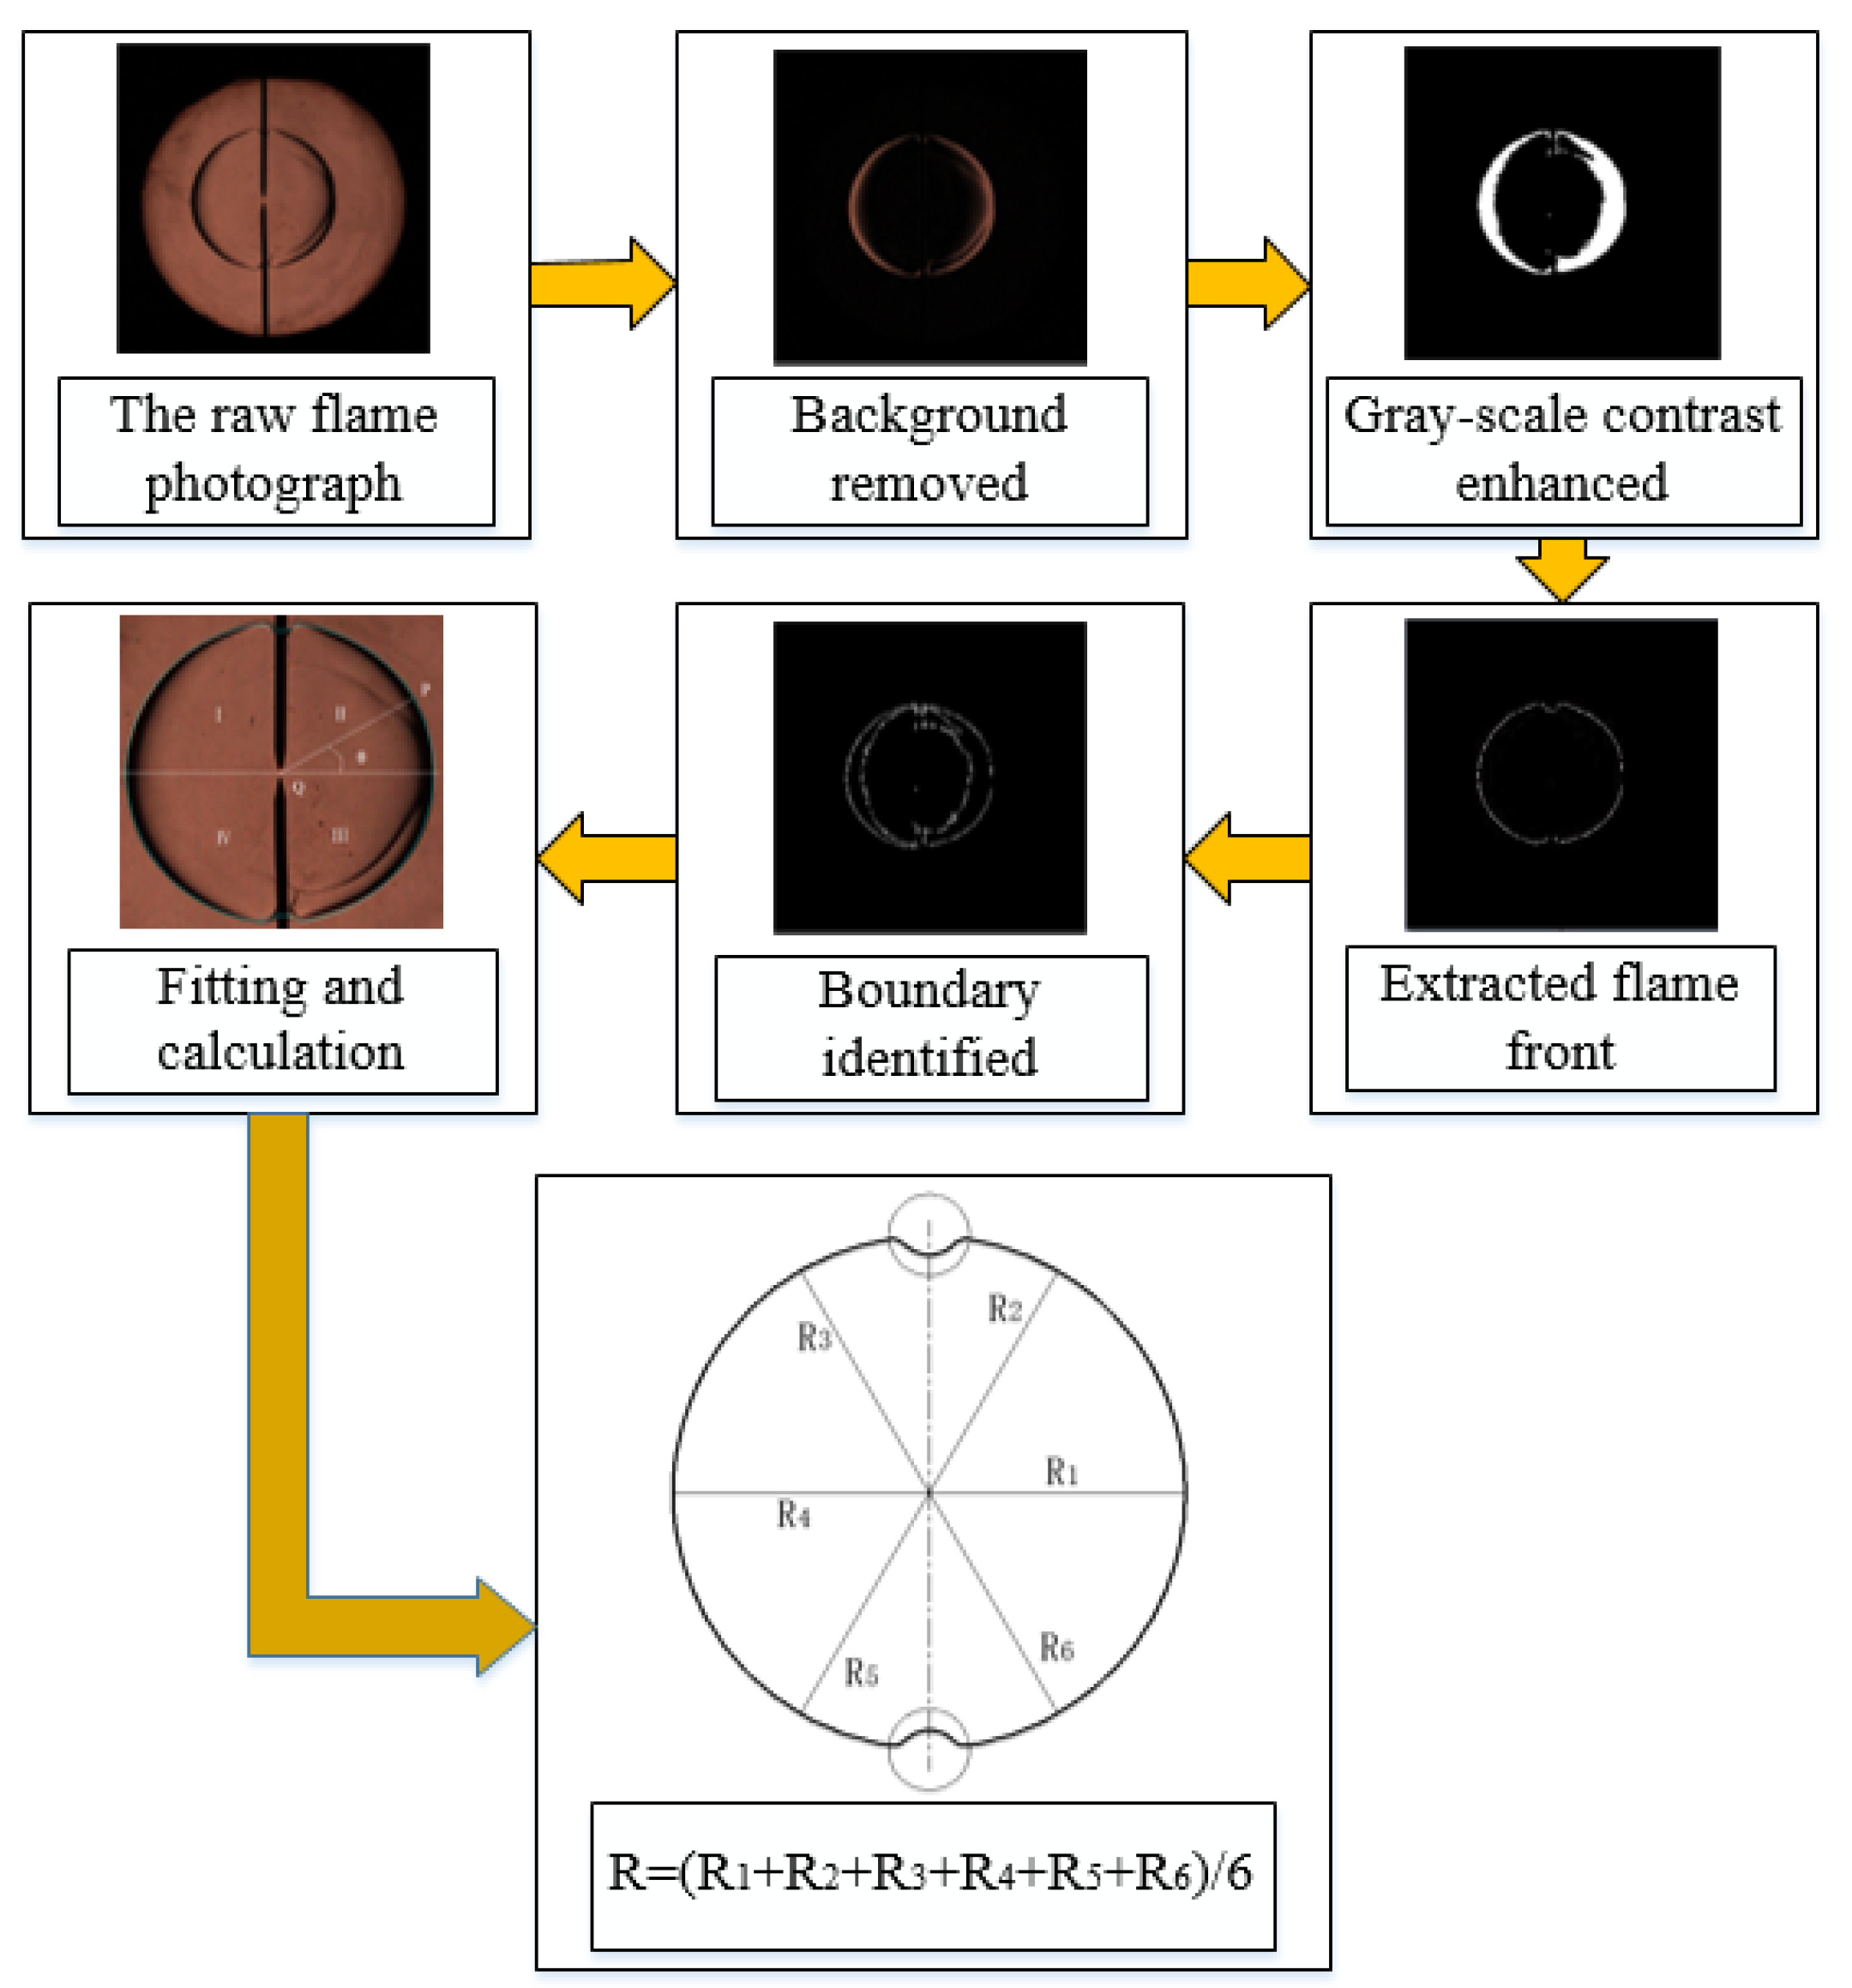
Figure 2.
Diagram of extracting the flame radius.
Figure 2.
Diagram of extracting the flame radius.
Figure 3.
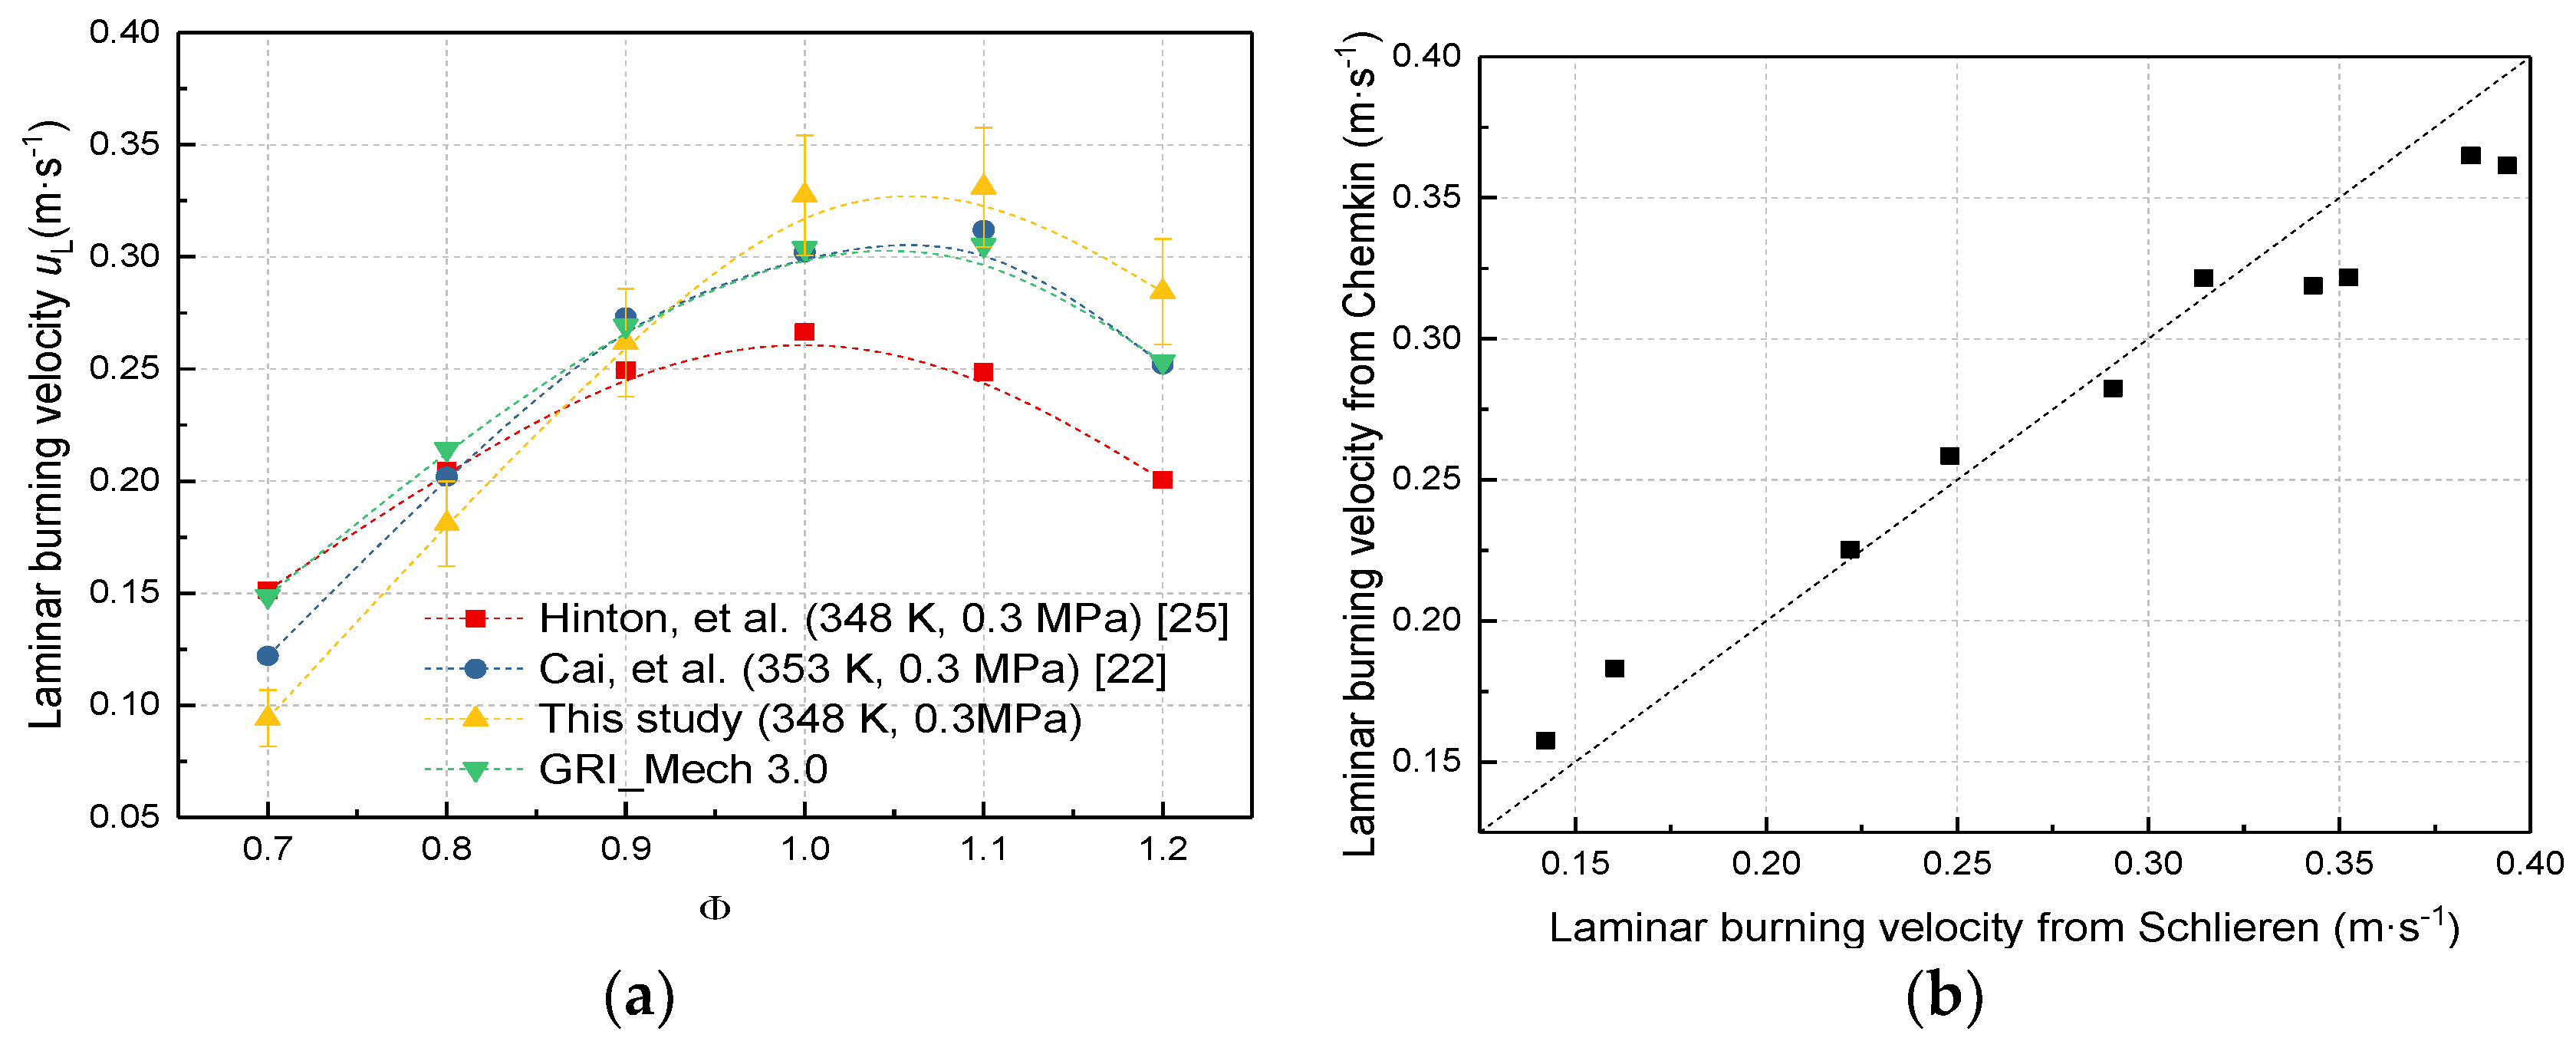
Validation of present experimental and simulation studies. (a) Comparing with previous data; (b) Comparing Chemkin with Schlieren.
Figure 3.
Validation of present experimental and simulation studies. (a) Comparing with previous data; (b) Comparing Chemkin with Schlieren.
Figure 4.
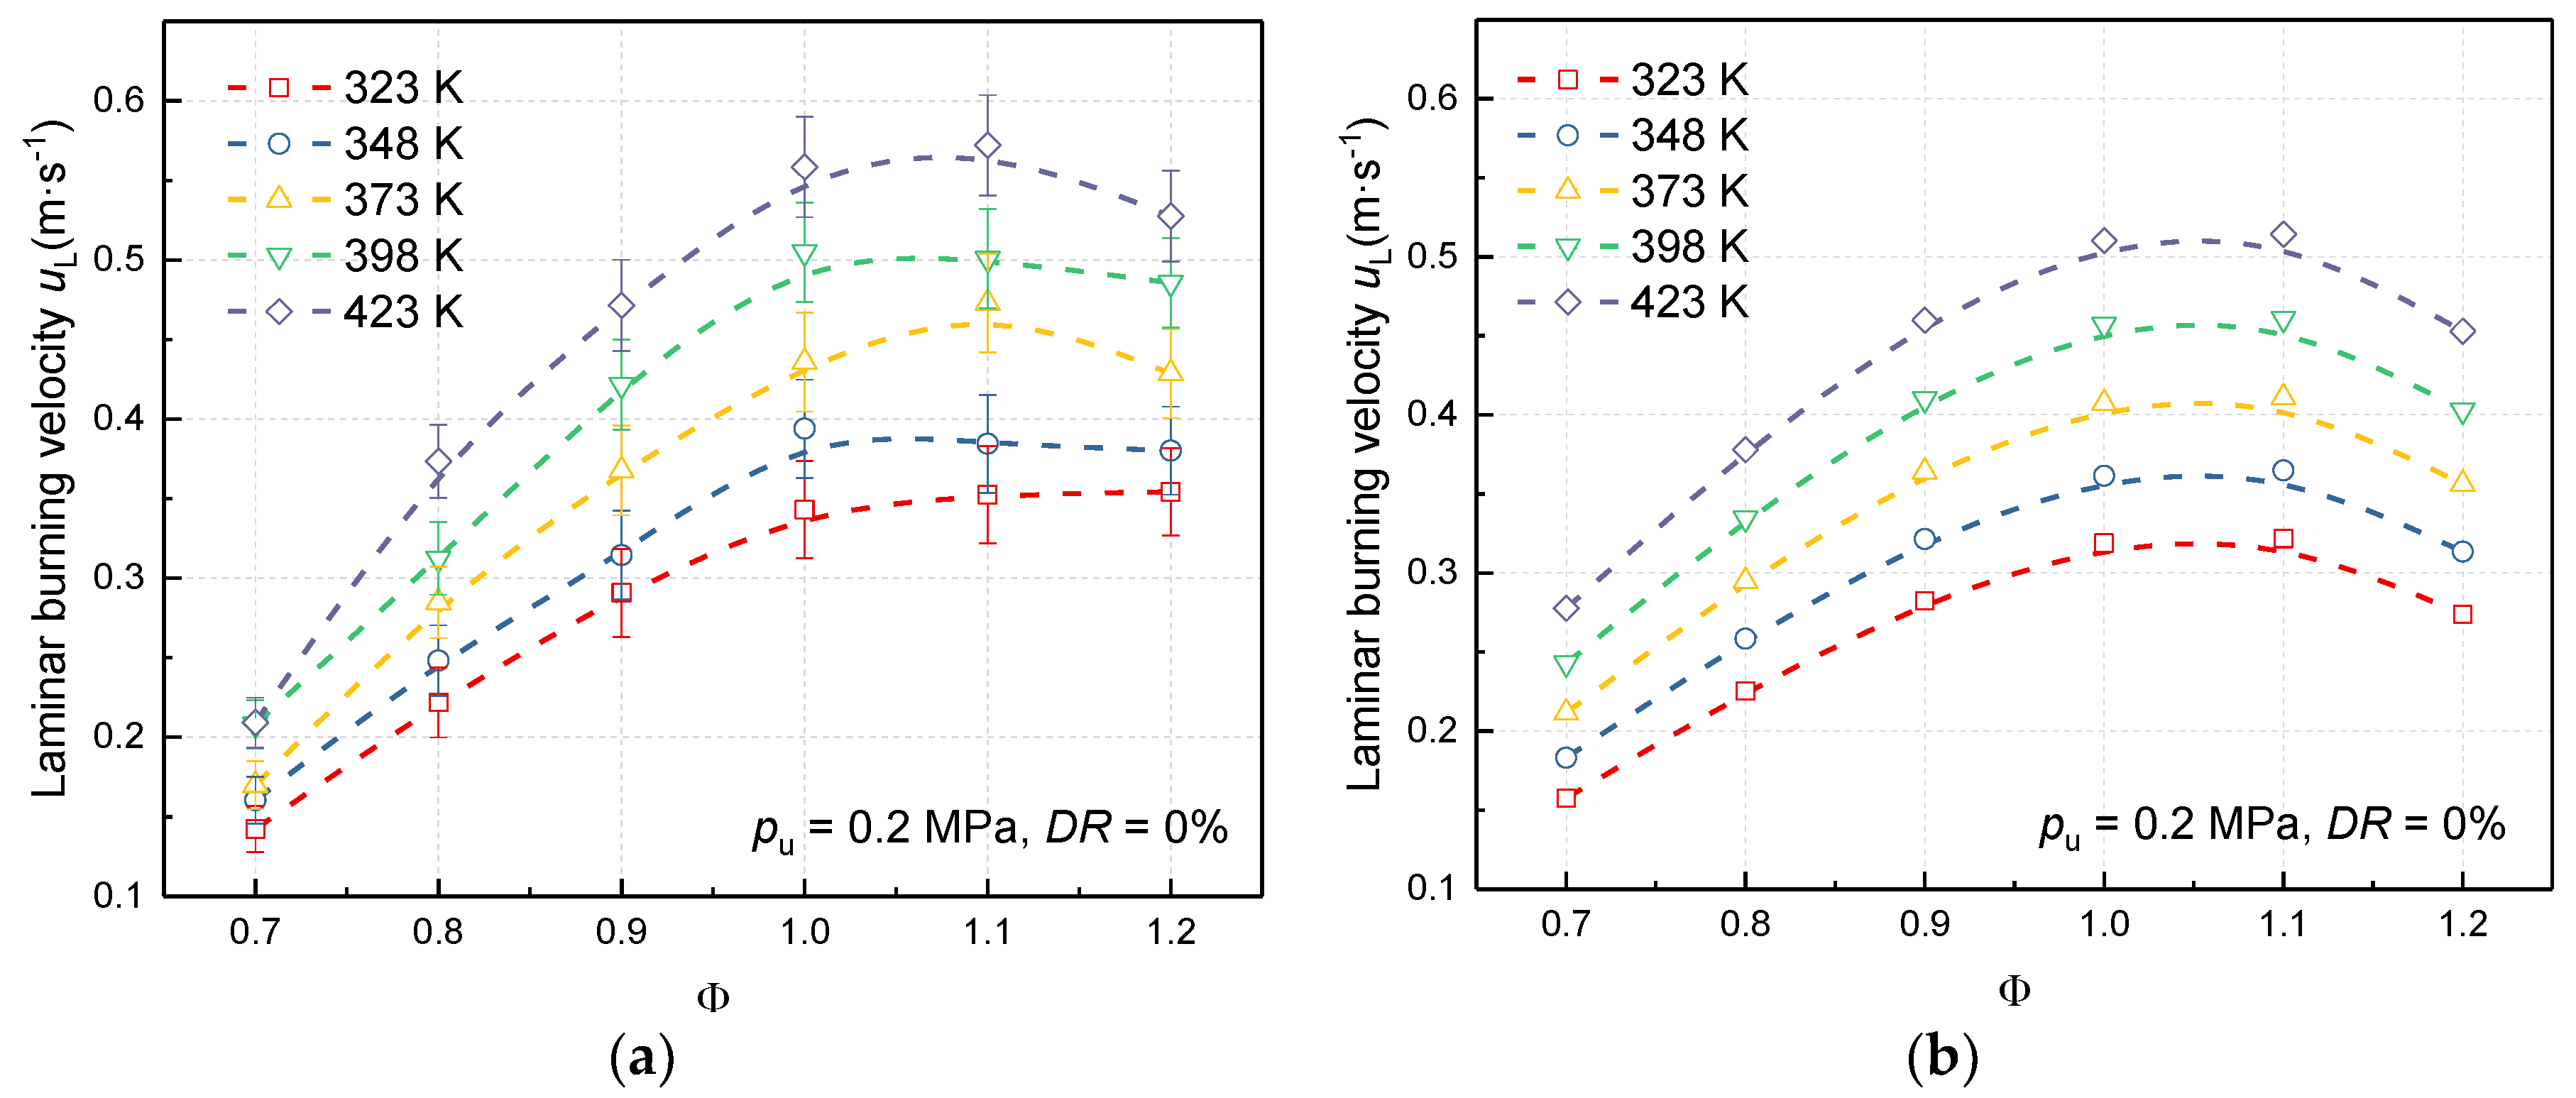
Laminar burning velocities under different initial temperatures (initial pressure of 0.2 MPa, dilution rate of 0%). (a) From Schlieren; (b) From Chemkin.
Figure 4.
Laminar burning velocities under different initial temperatures (initial pressure of 0.2 MPa, dilution rate of 0%). (a) From Schlieren; (b) From Chemkin.
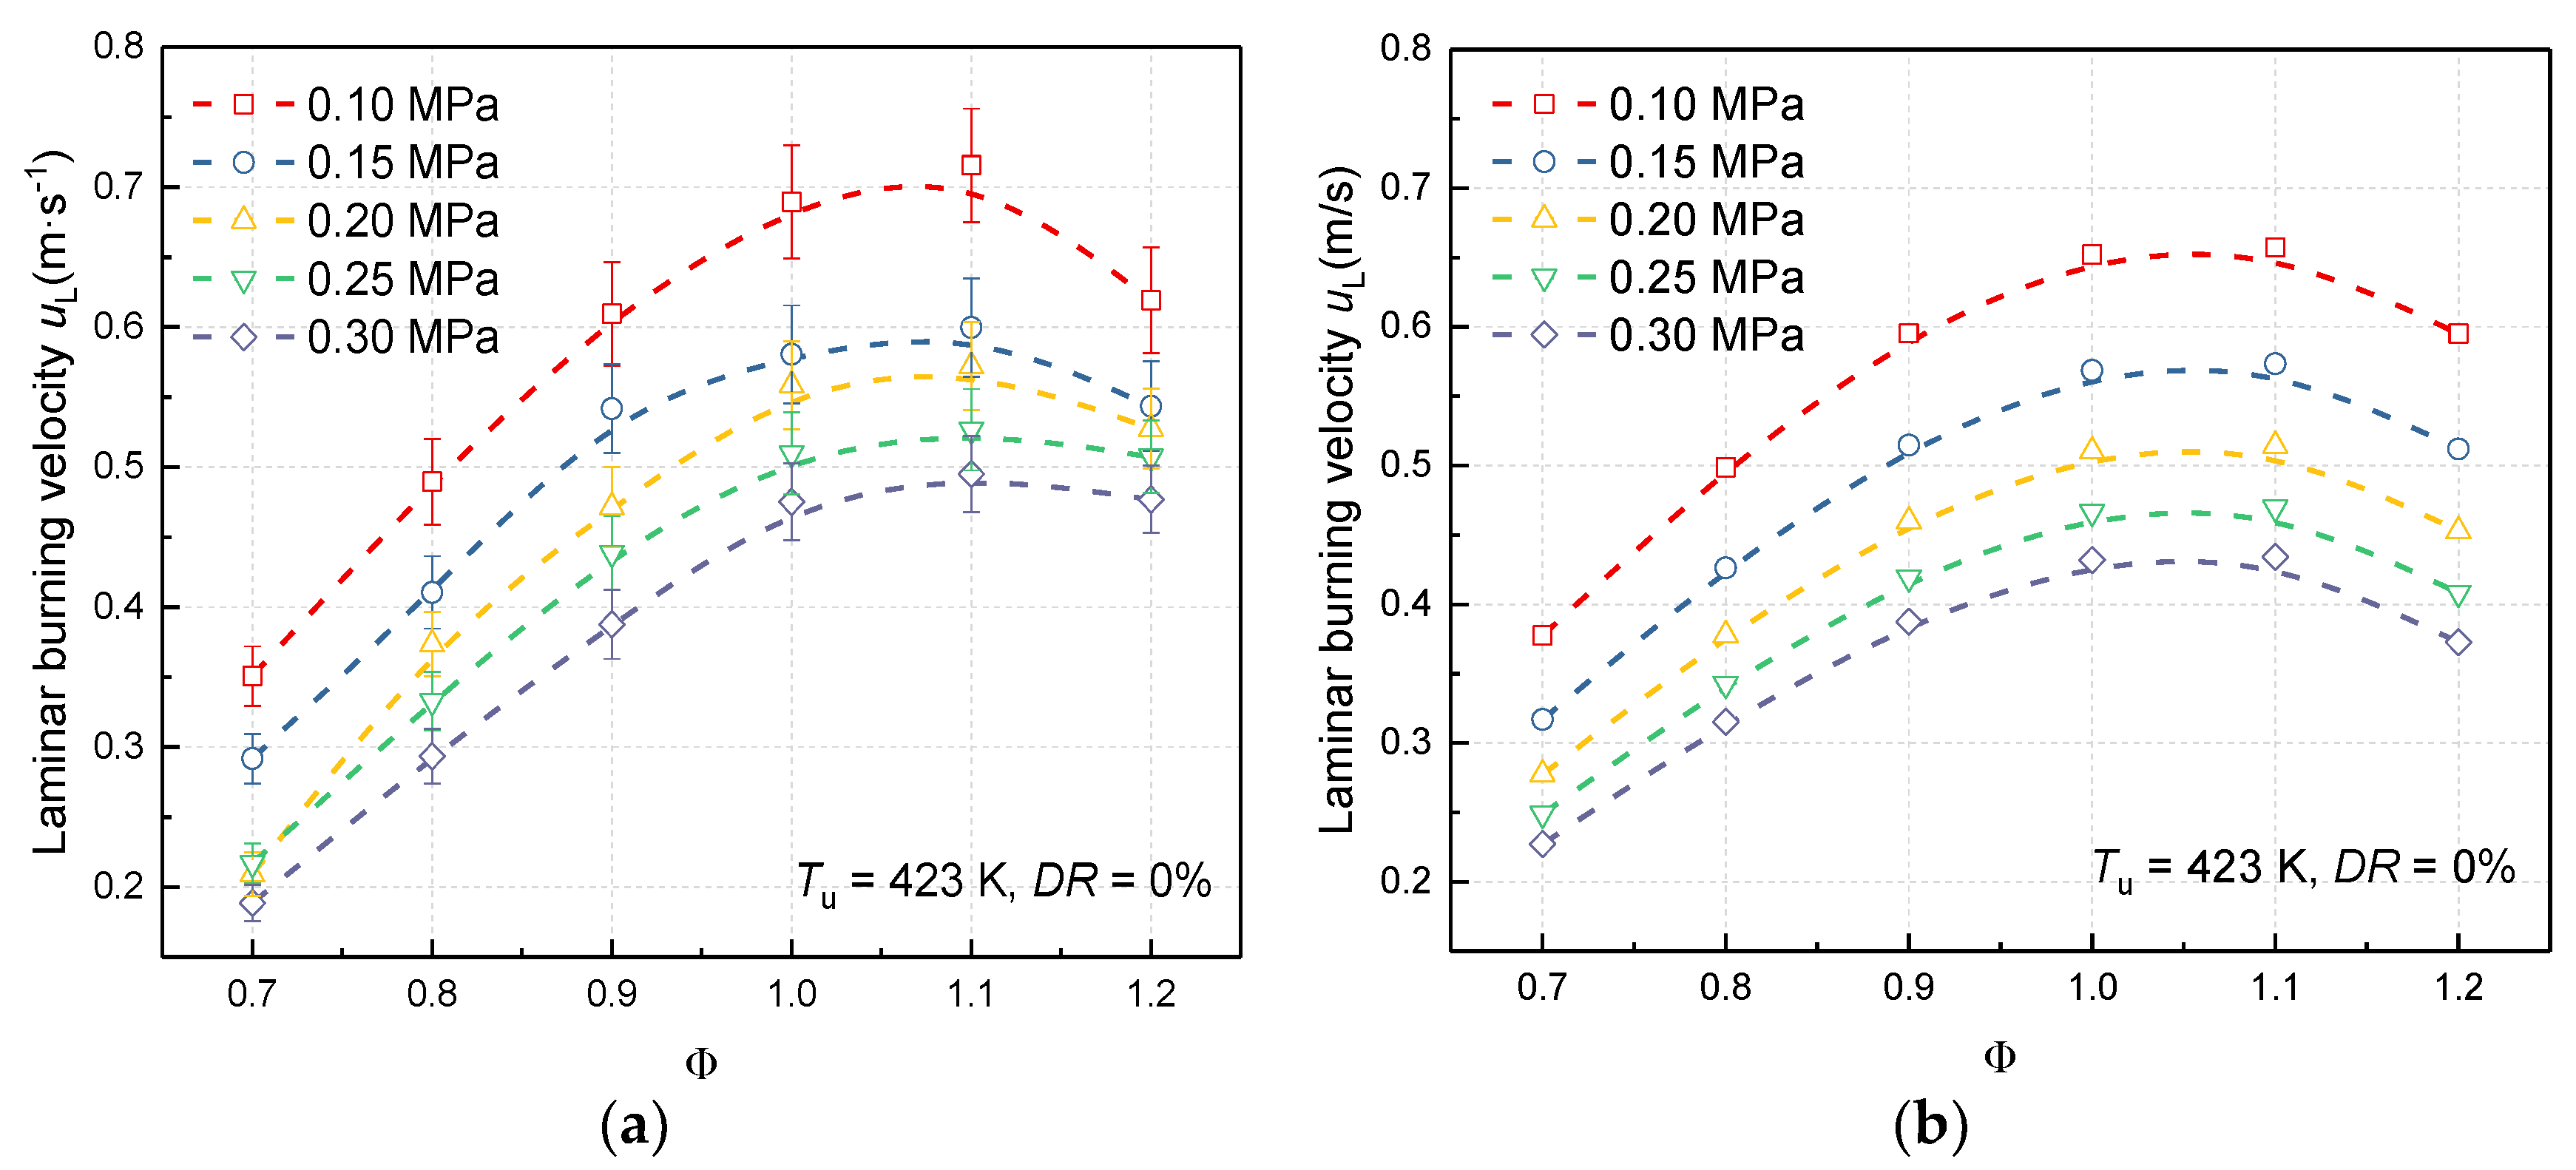
Figure 5.
Laminar burning velocities under different initial pressures (initial temperature of 423 K, dilution rate of 0%). (a) From Schlieren; (b) From Chemkin.
Figure 5.
Laminar burning velocities under different initial pressures (initial temperature of 423 K, dilution rate of 0%). (a) From Schlieren; (b) From Chemkin.
Figure 6.
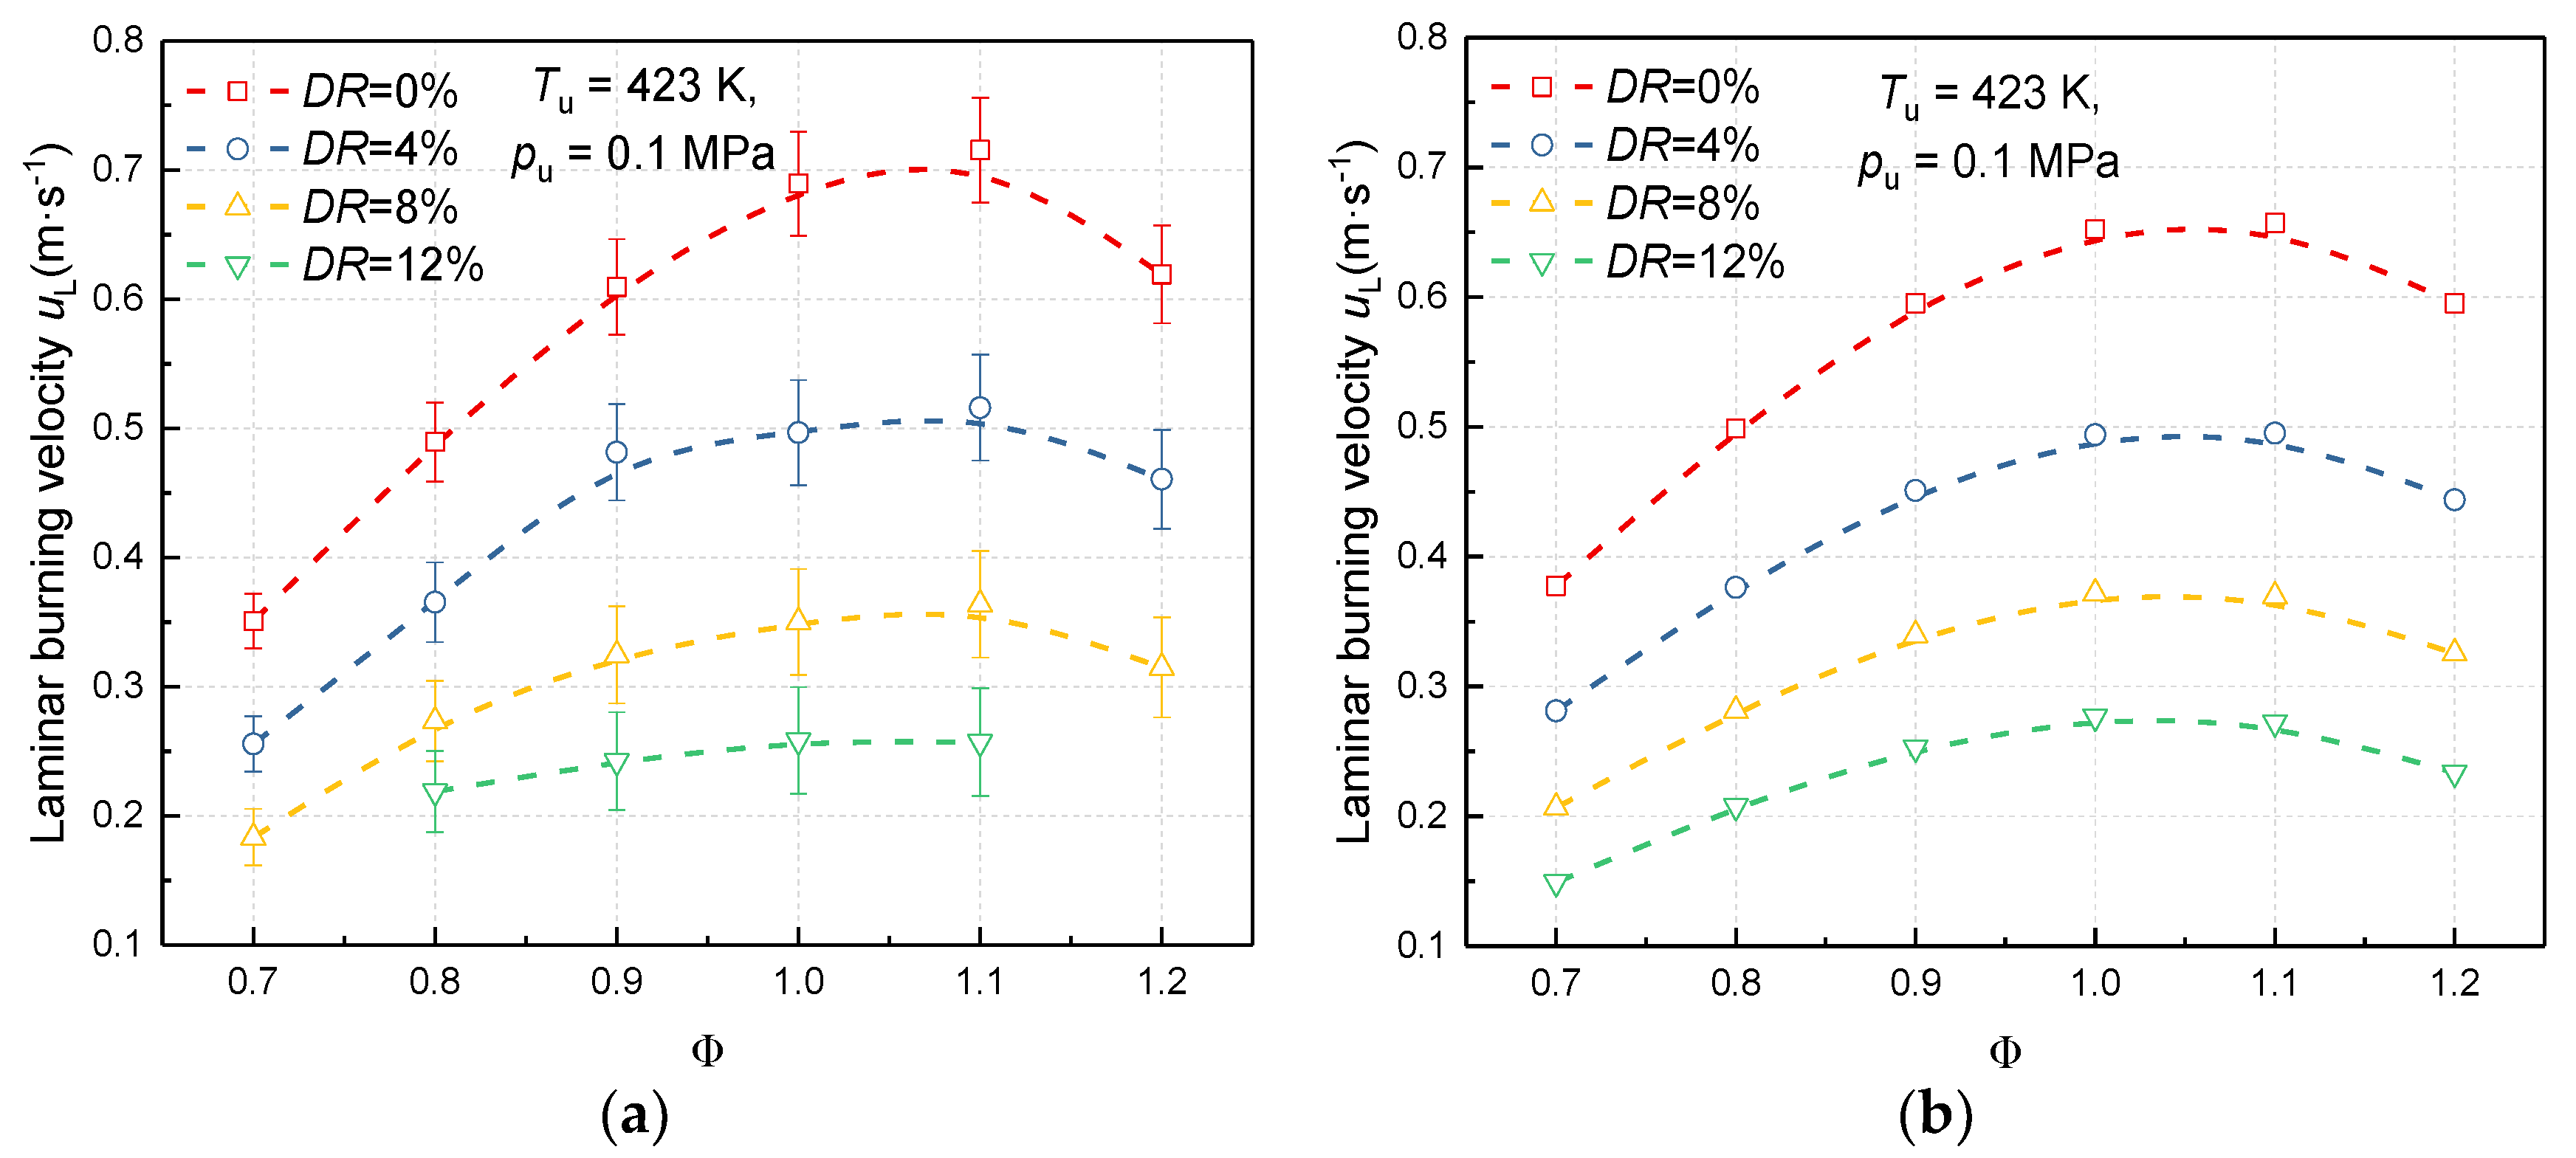
Laminar burning velocities under different dilution rates (initial temperature of 423 K, initial pressure of 0.1 MPa). (a) From Schlieren; (b) From Chemkin.
Figure 6.
Laminar burning velocities under different dilution rates (initial temperature of 423 K, initial pressure of 0.1 MPa). (a) From Schlieren; (b) From Chemkin.
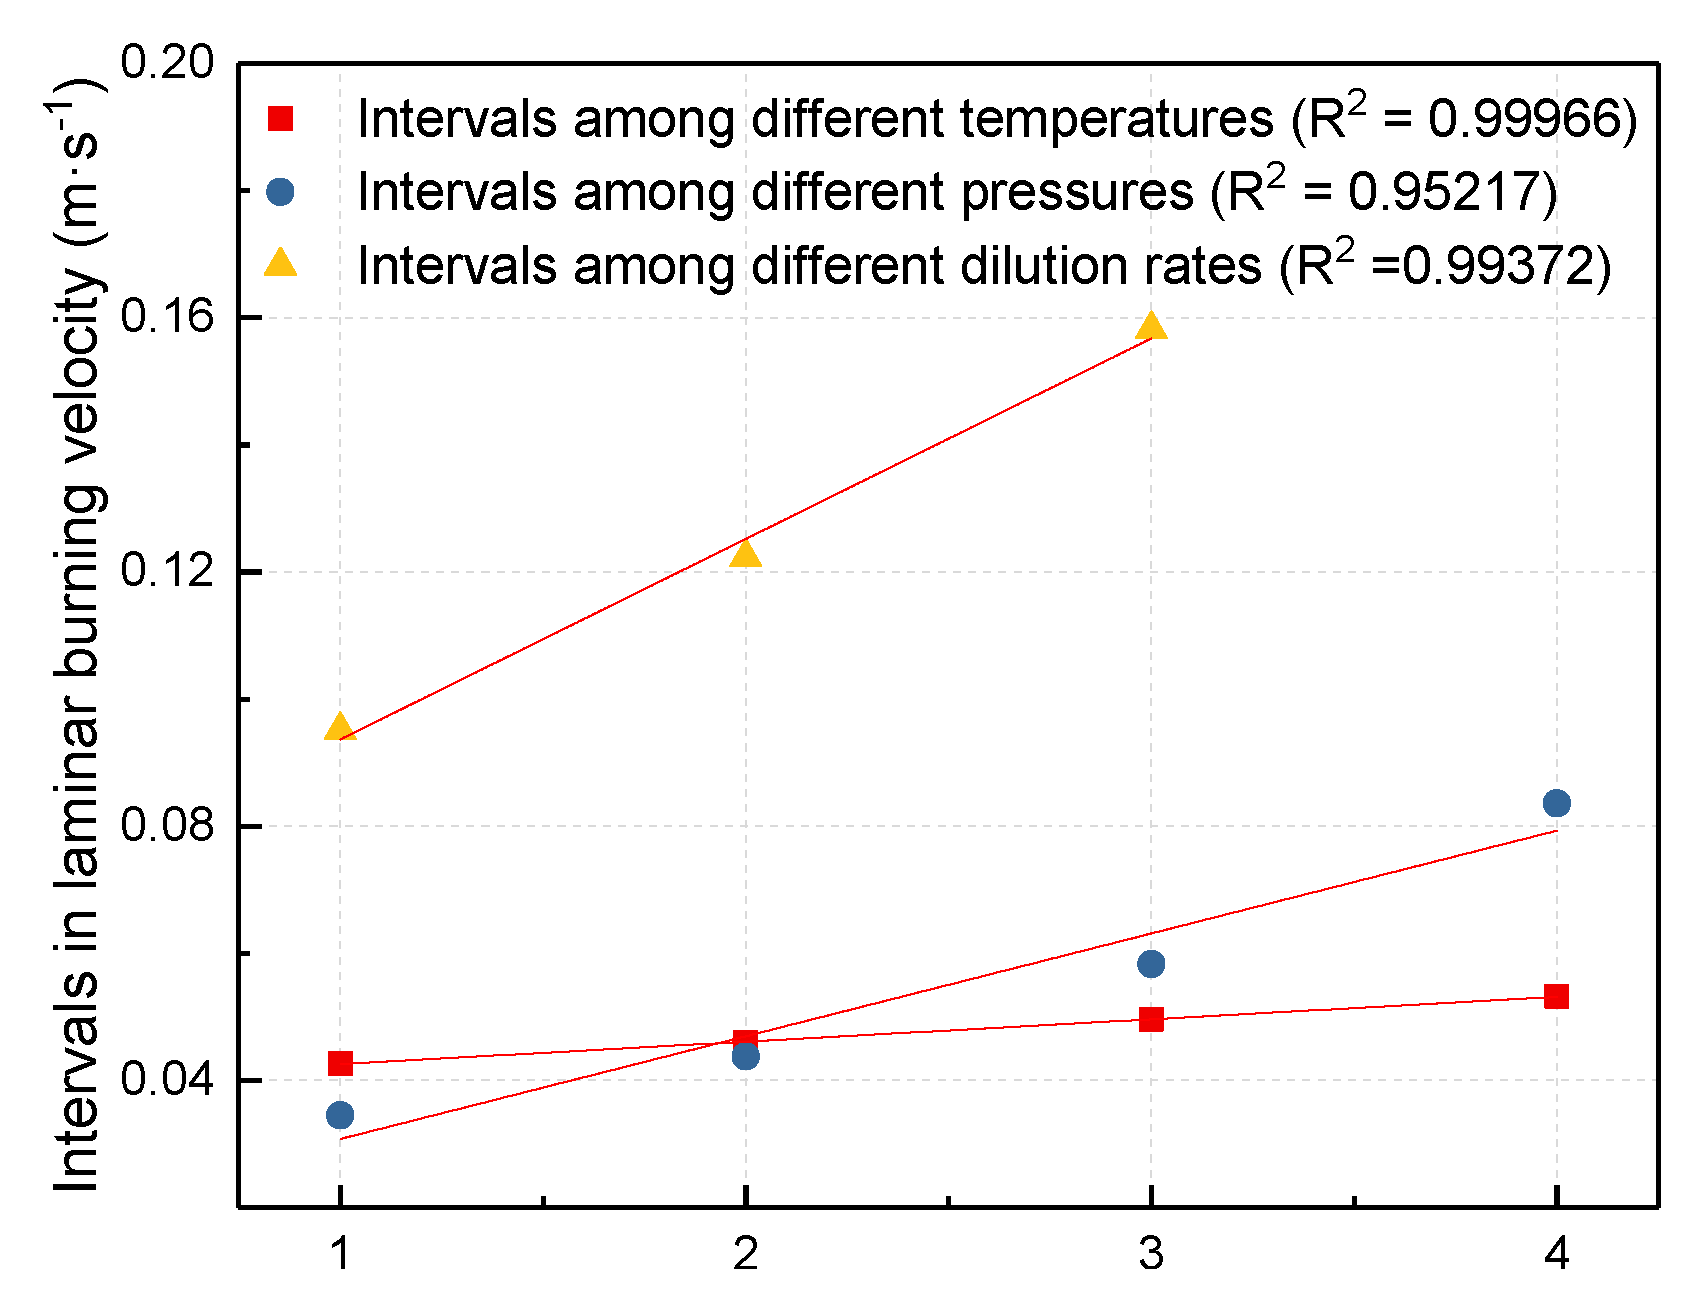
Figure 7.
Fitting of the interval values.
Figure 7.
Fitting of the interval values.
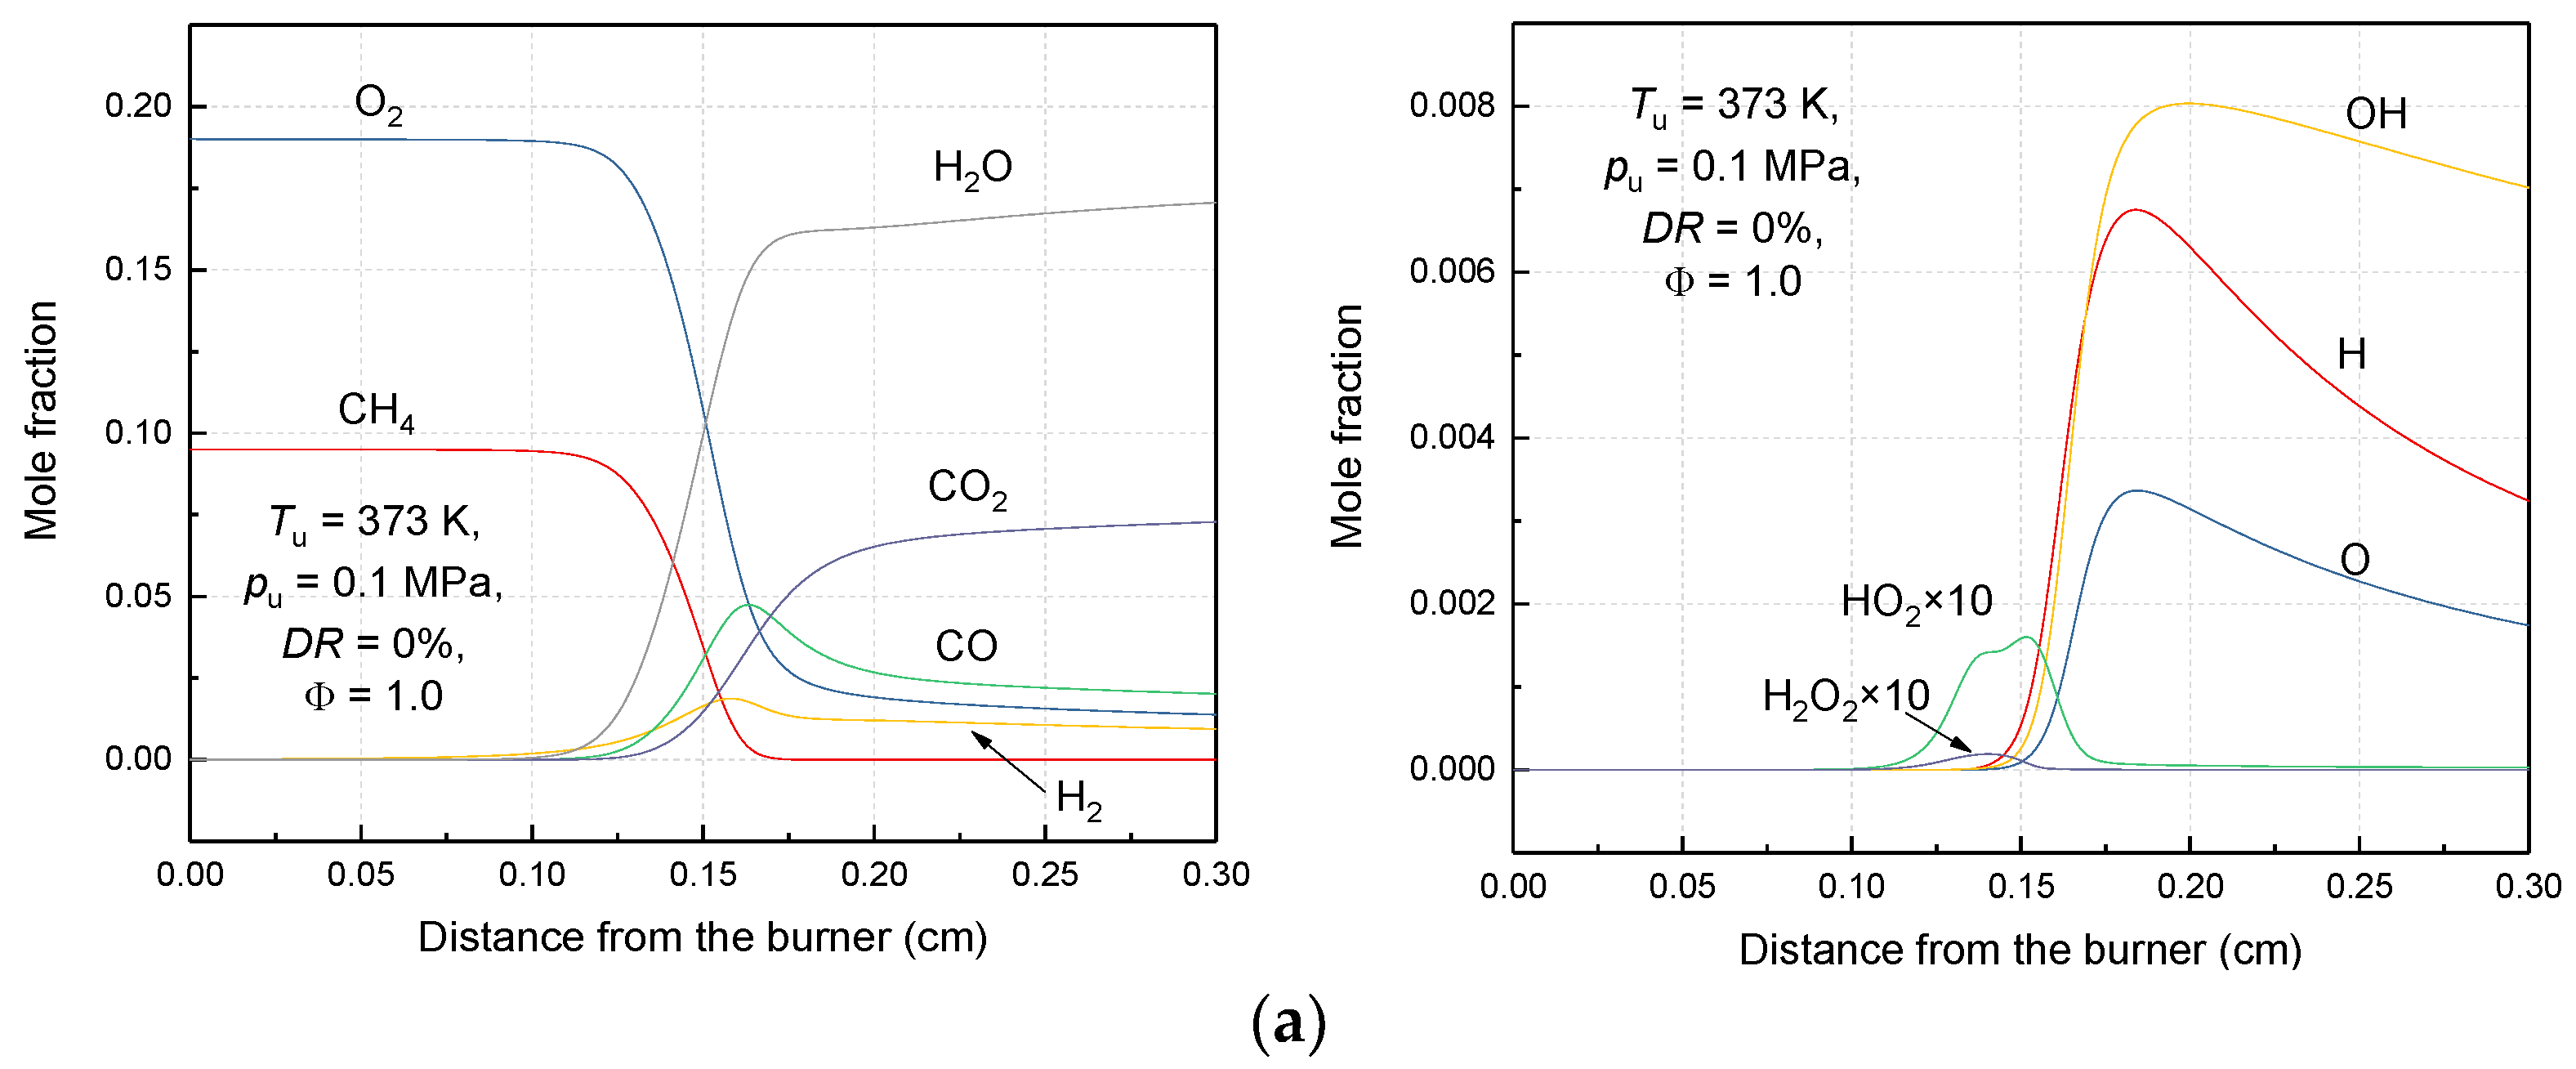
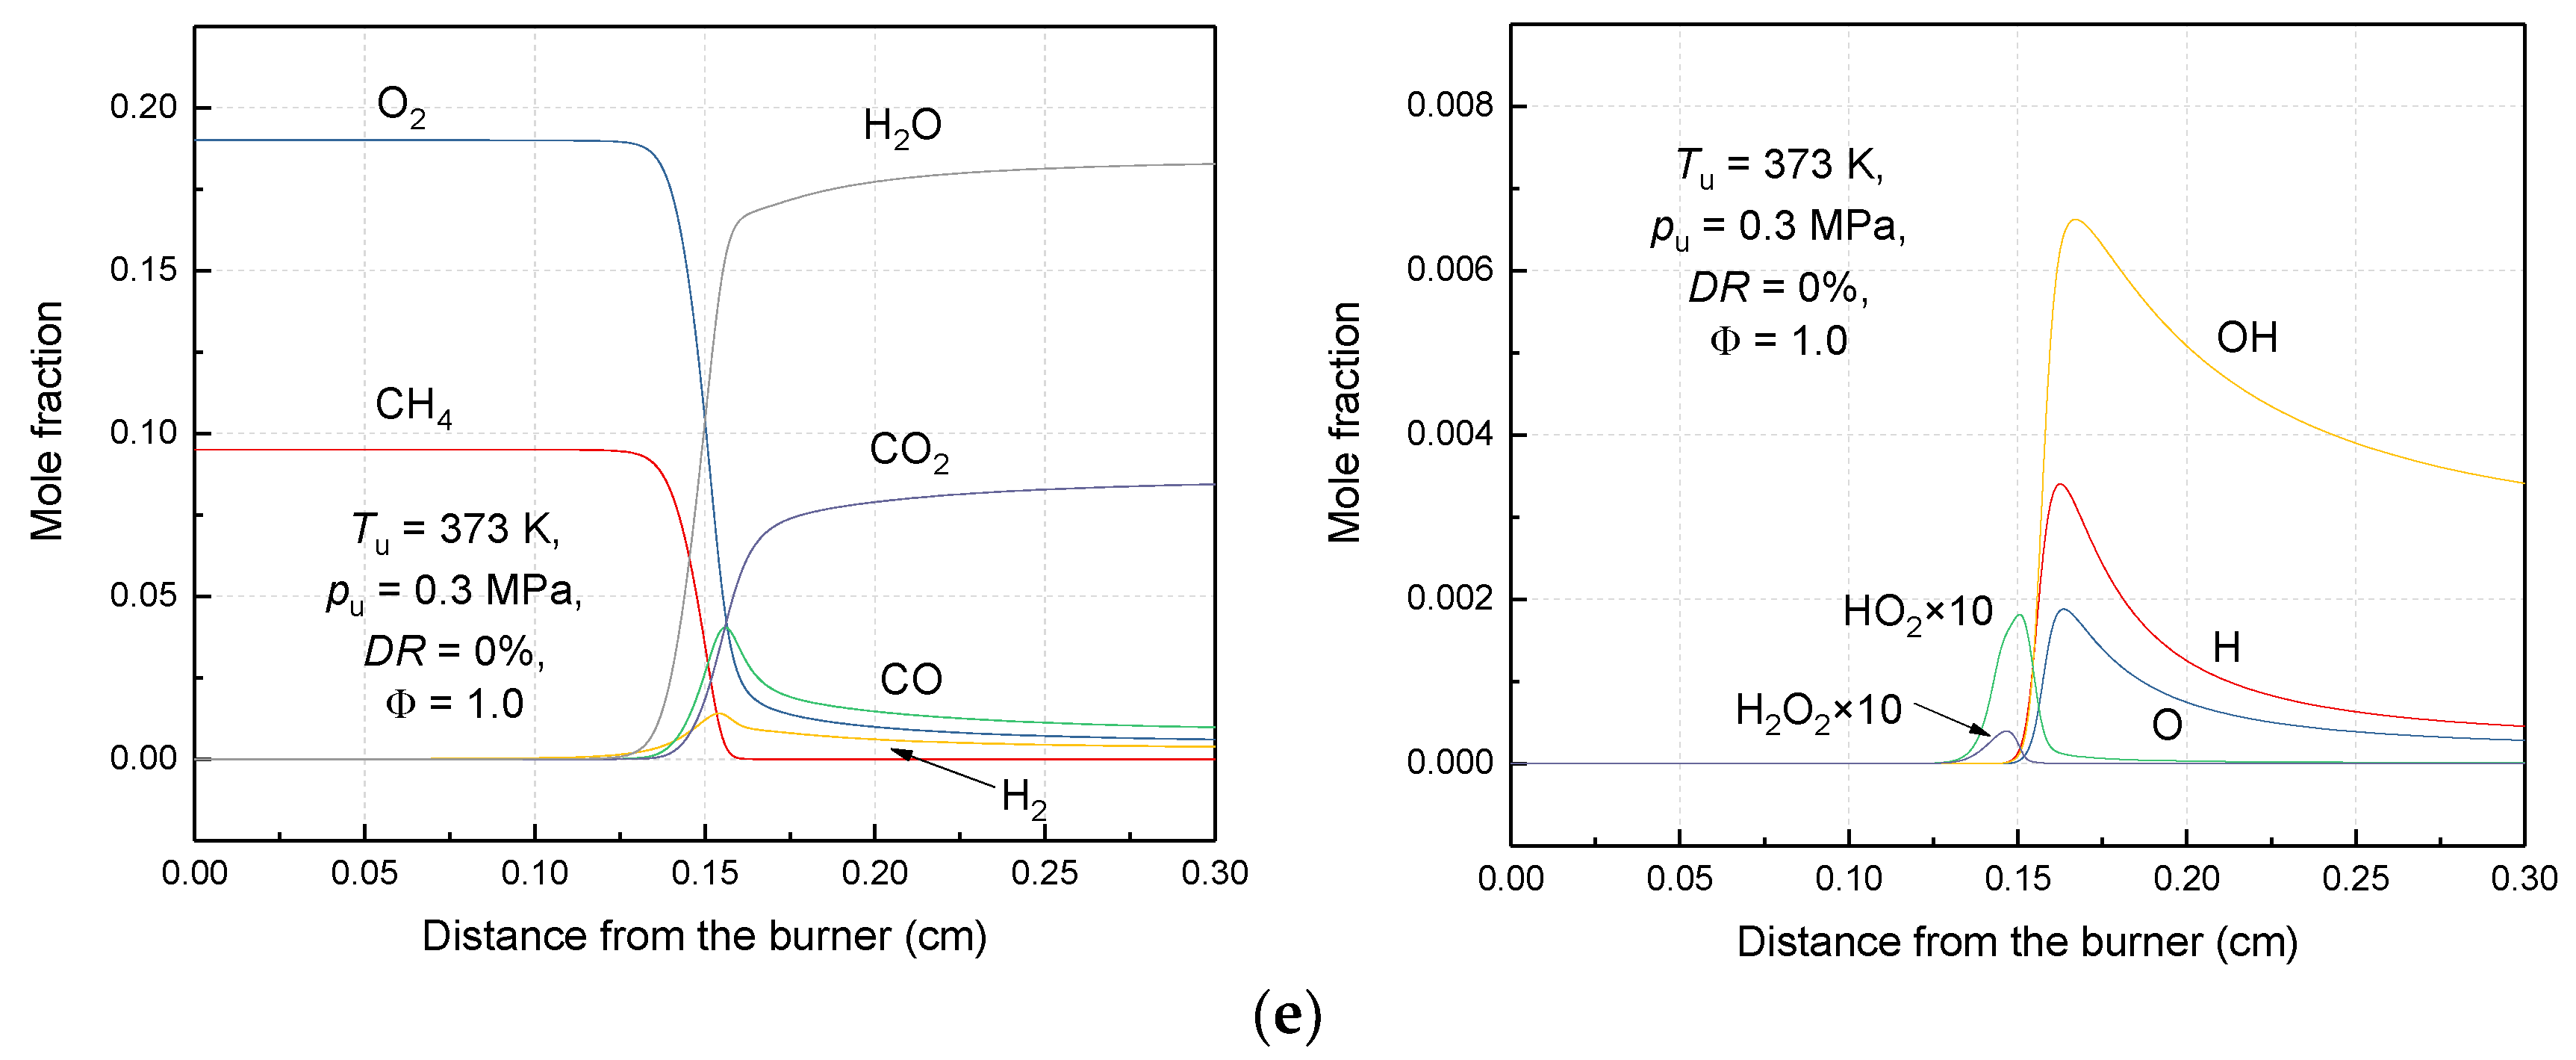
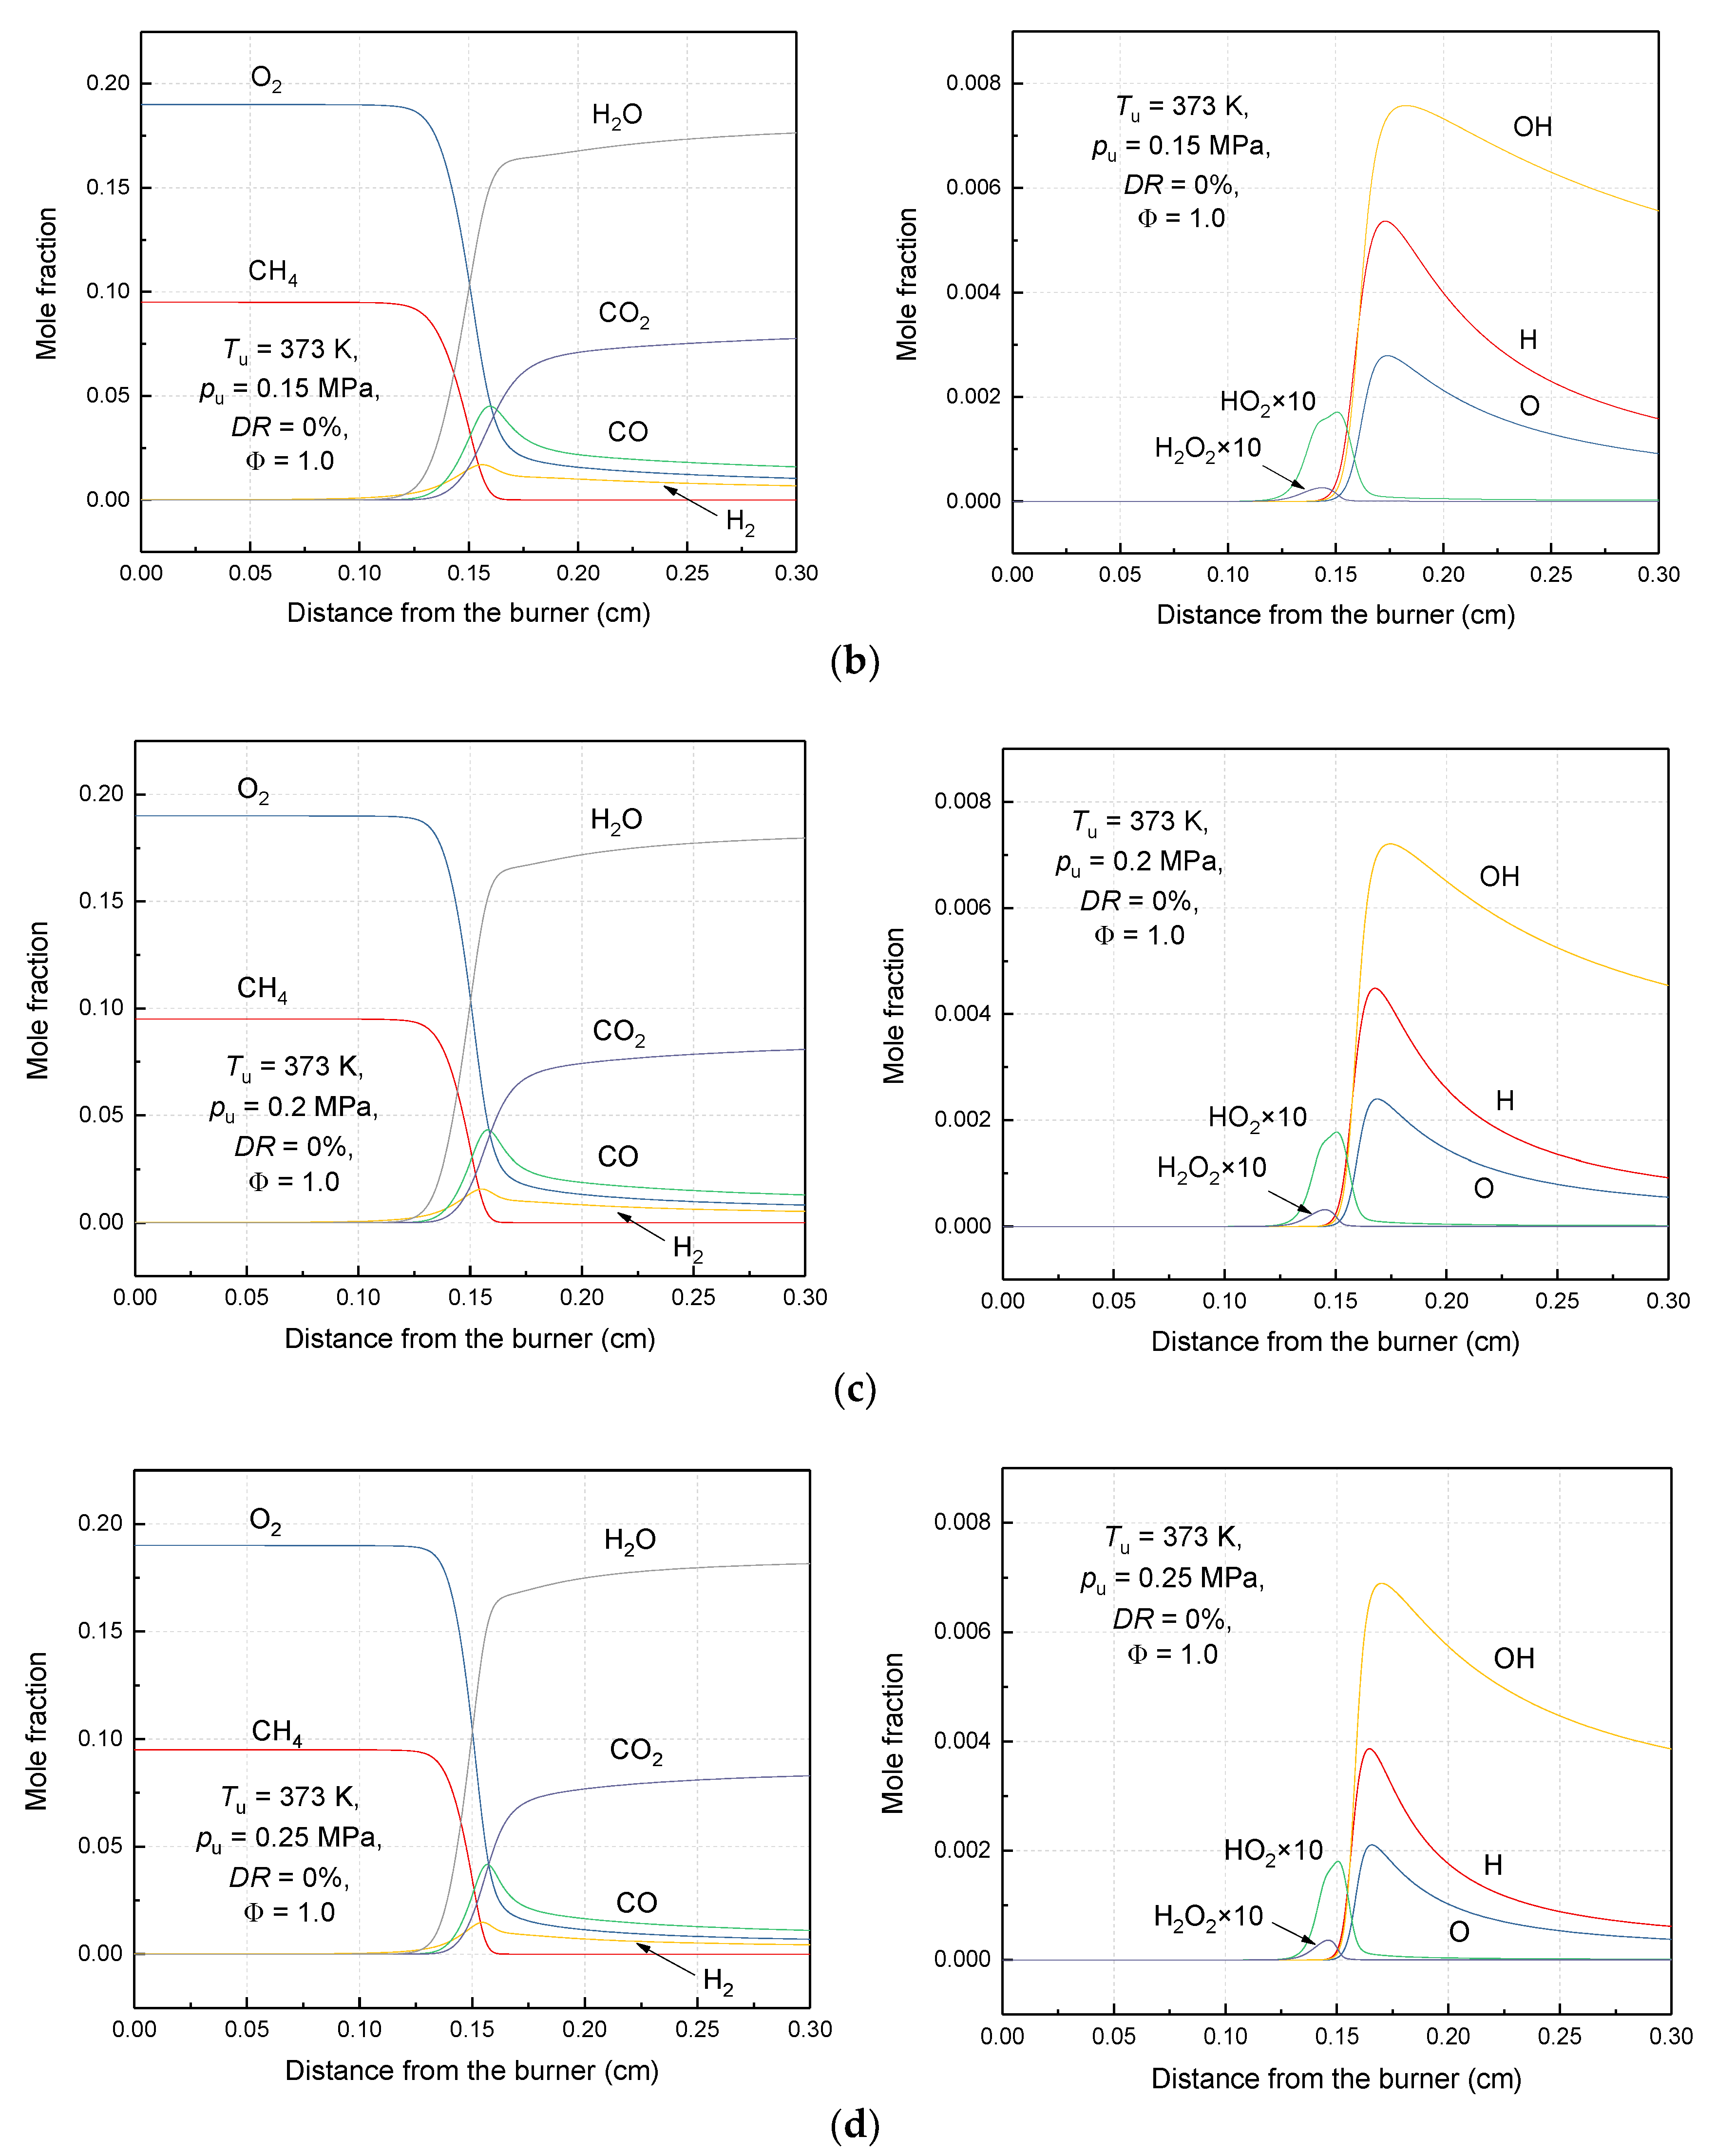
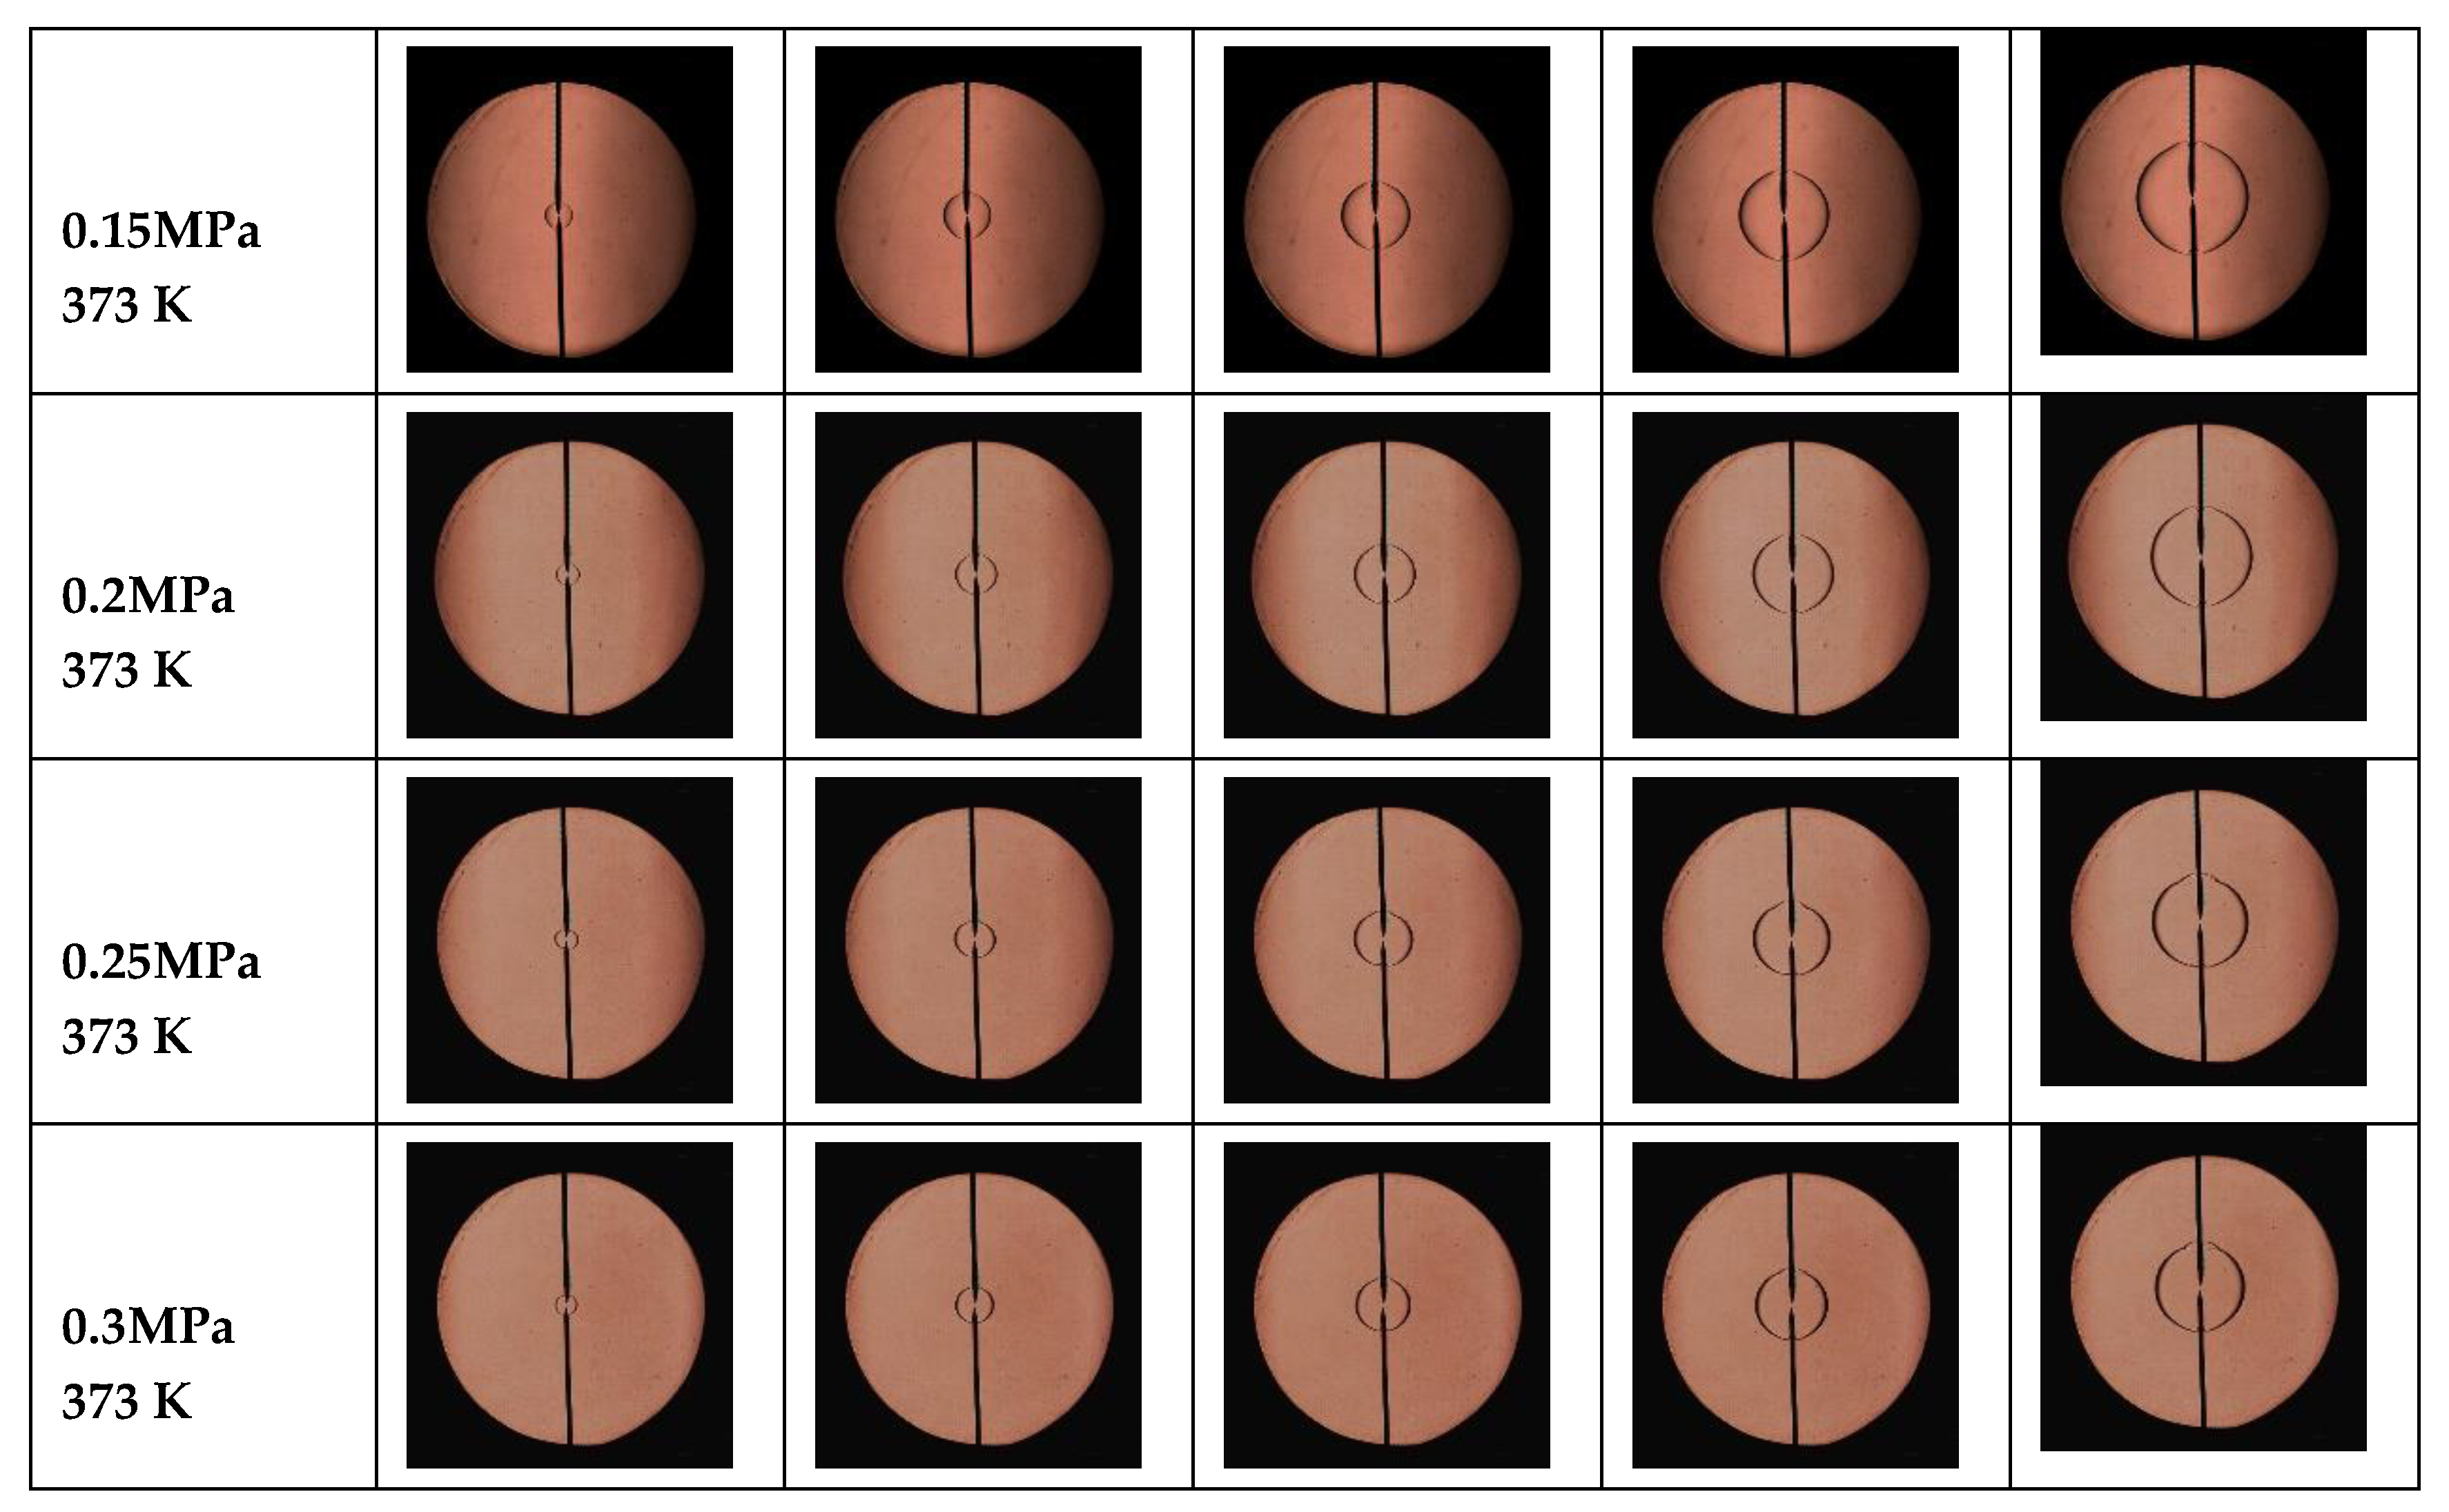
Figure 8.
Flame structures under different initial pressures. (a) Tu = 373 K, pu = 0.1 MPa, DR = 0%, Φ = 1.0; (b) Tu = 373 K, pu = 0.15 MPa, DR = 0%, Φ = 1.0; (c) Tu = 373 K, pu = 0.2 MPa, DR = 0%, Φ = 1.0; (d) Tu = 373 K, pu = 0.25 MPa, DR = 0%, Φ = 1.0; (e) Tu = 373 K, pu = 0.3 MPa, DR = 0%, Φ = 1.0.
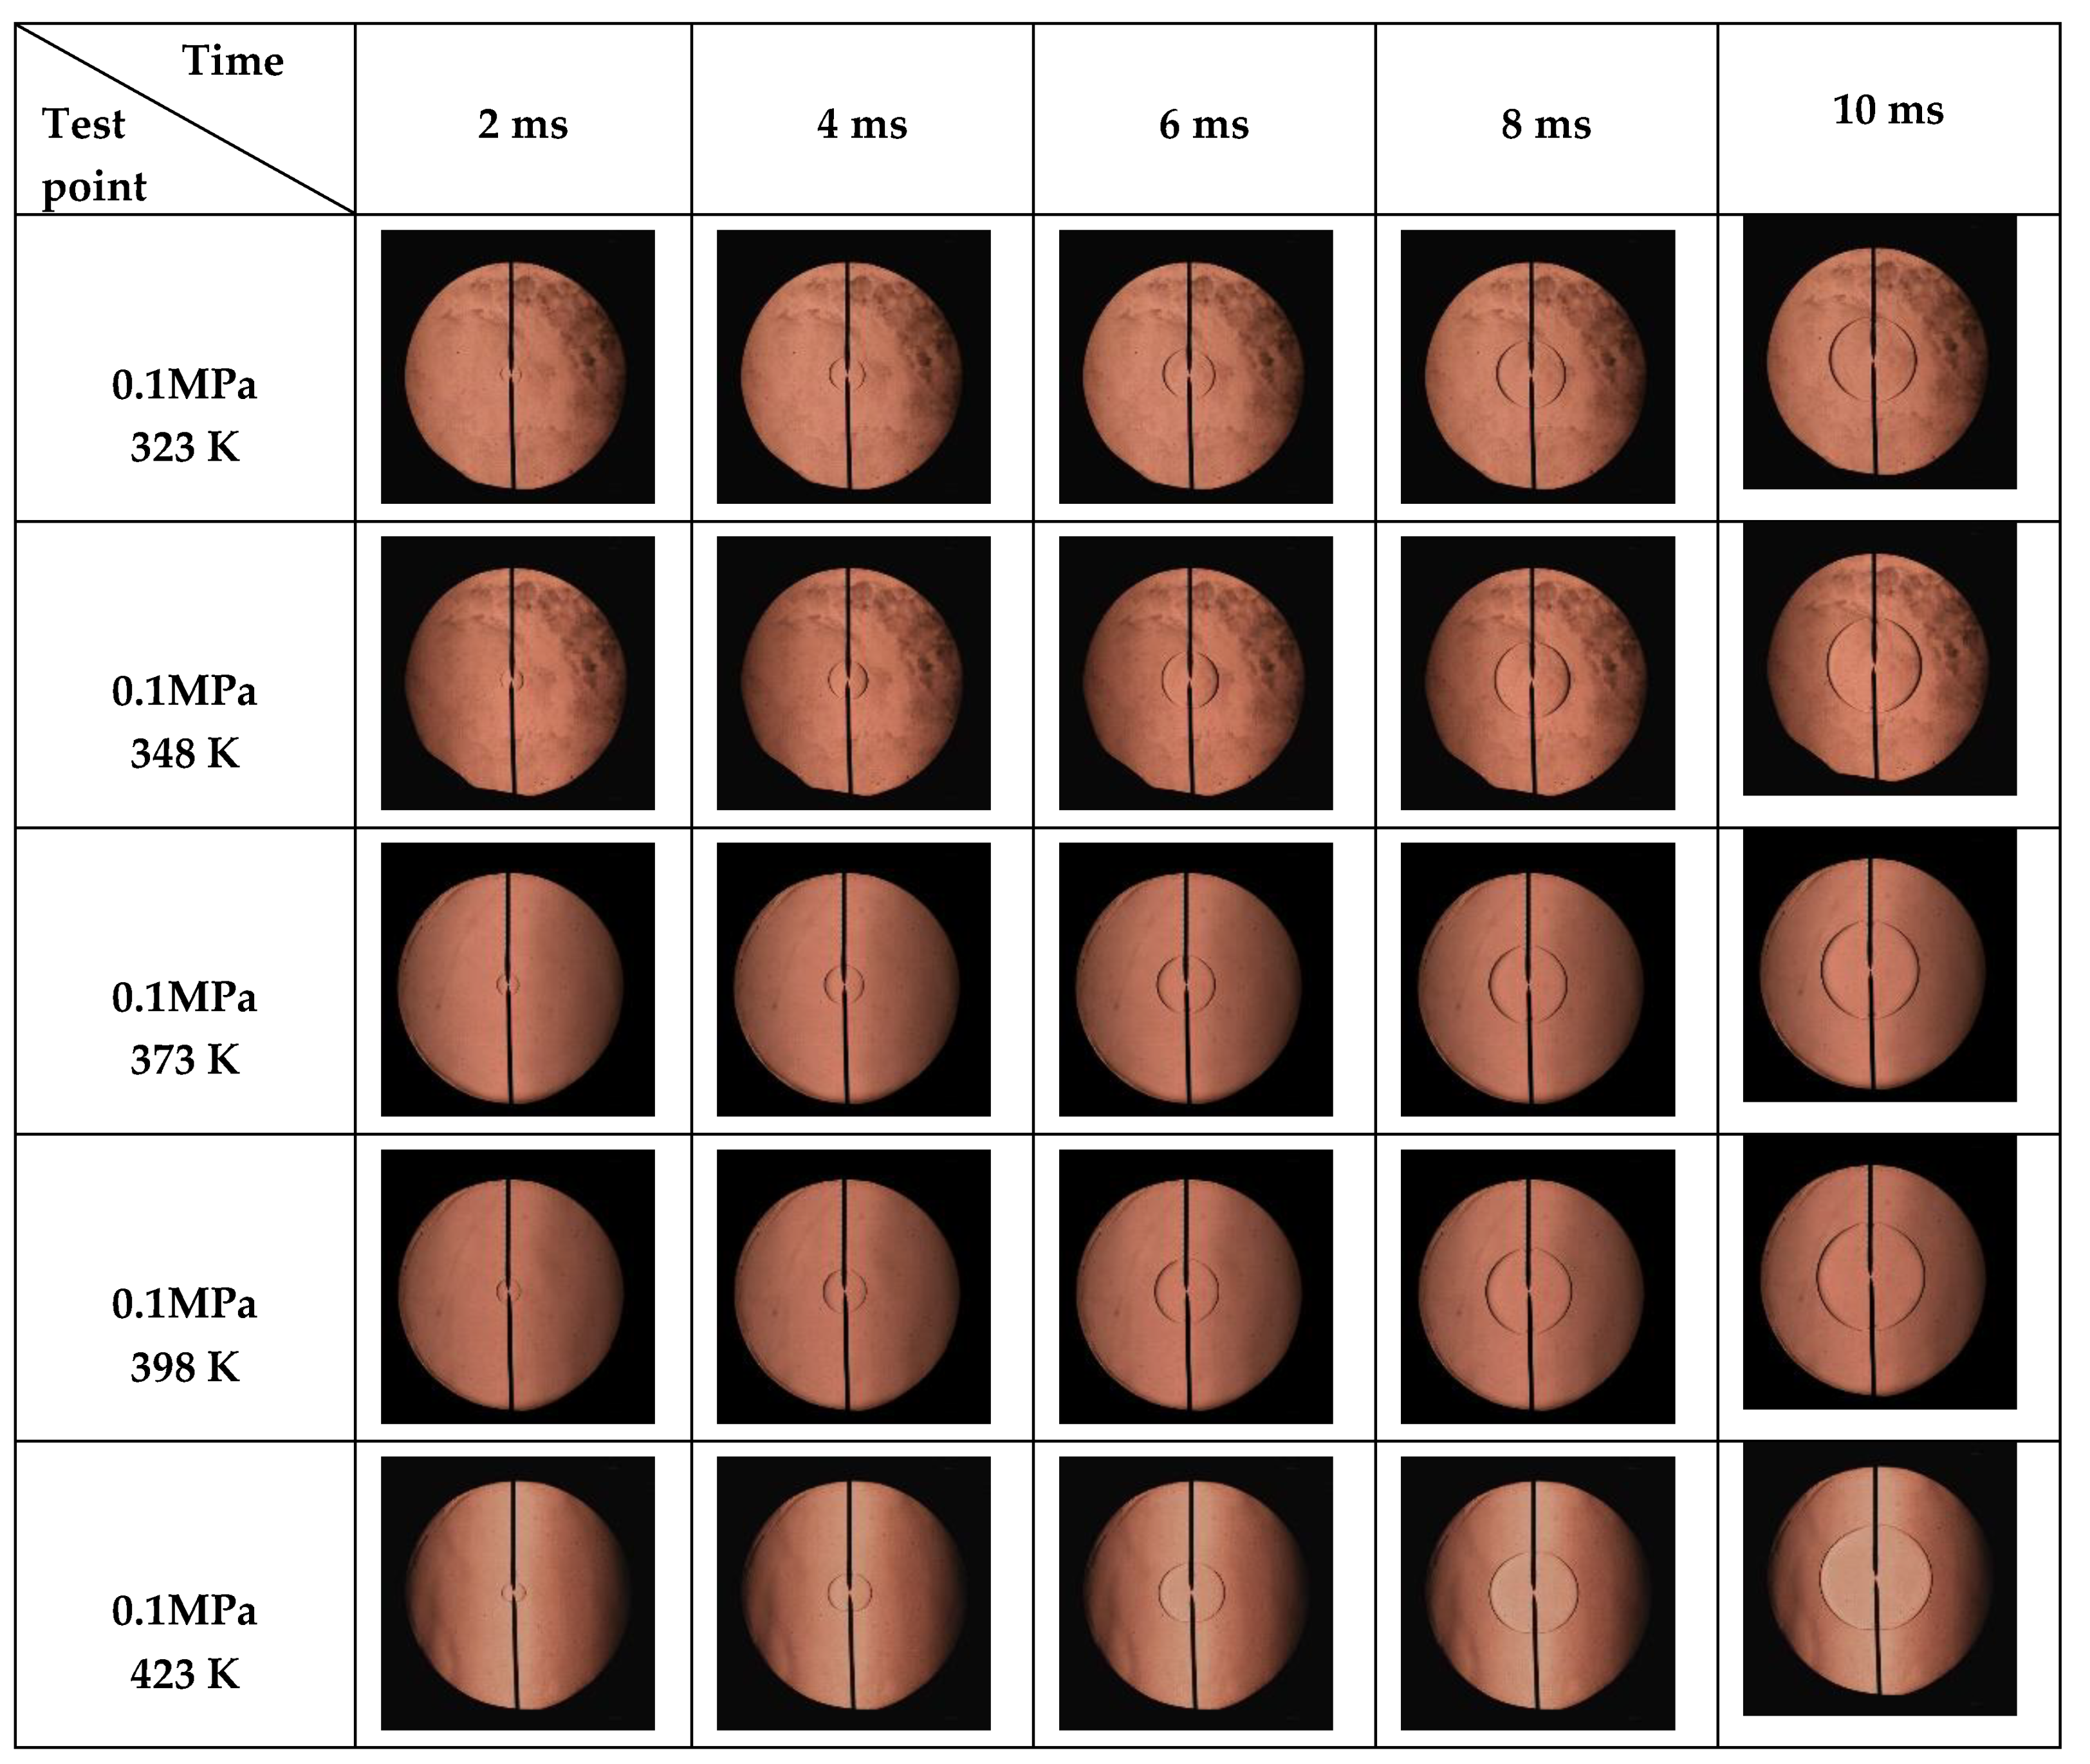
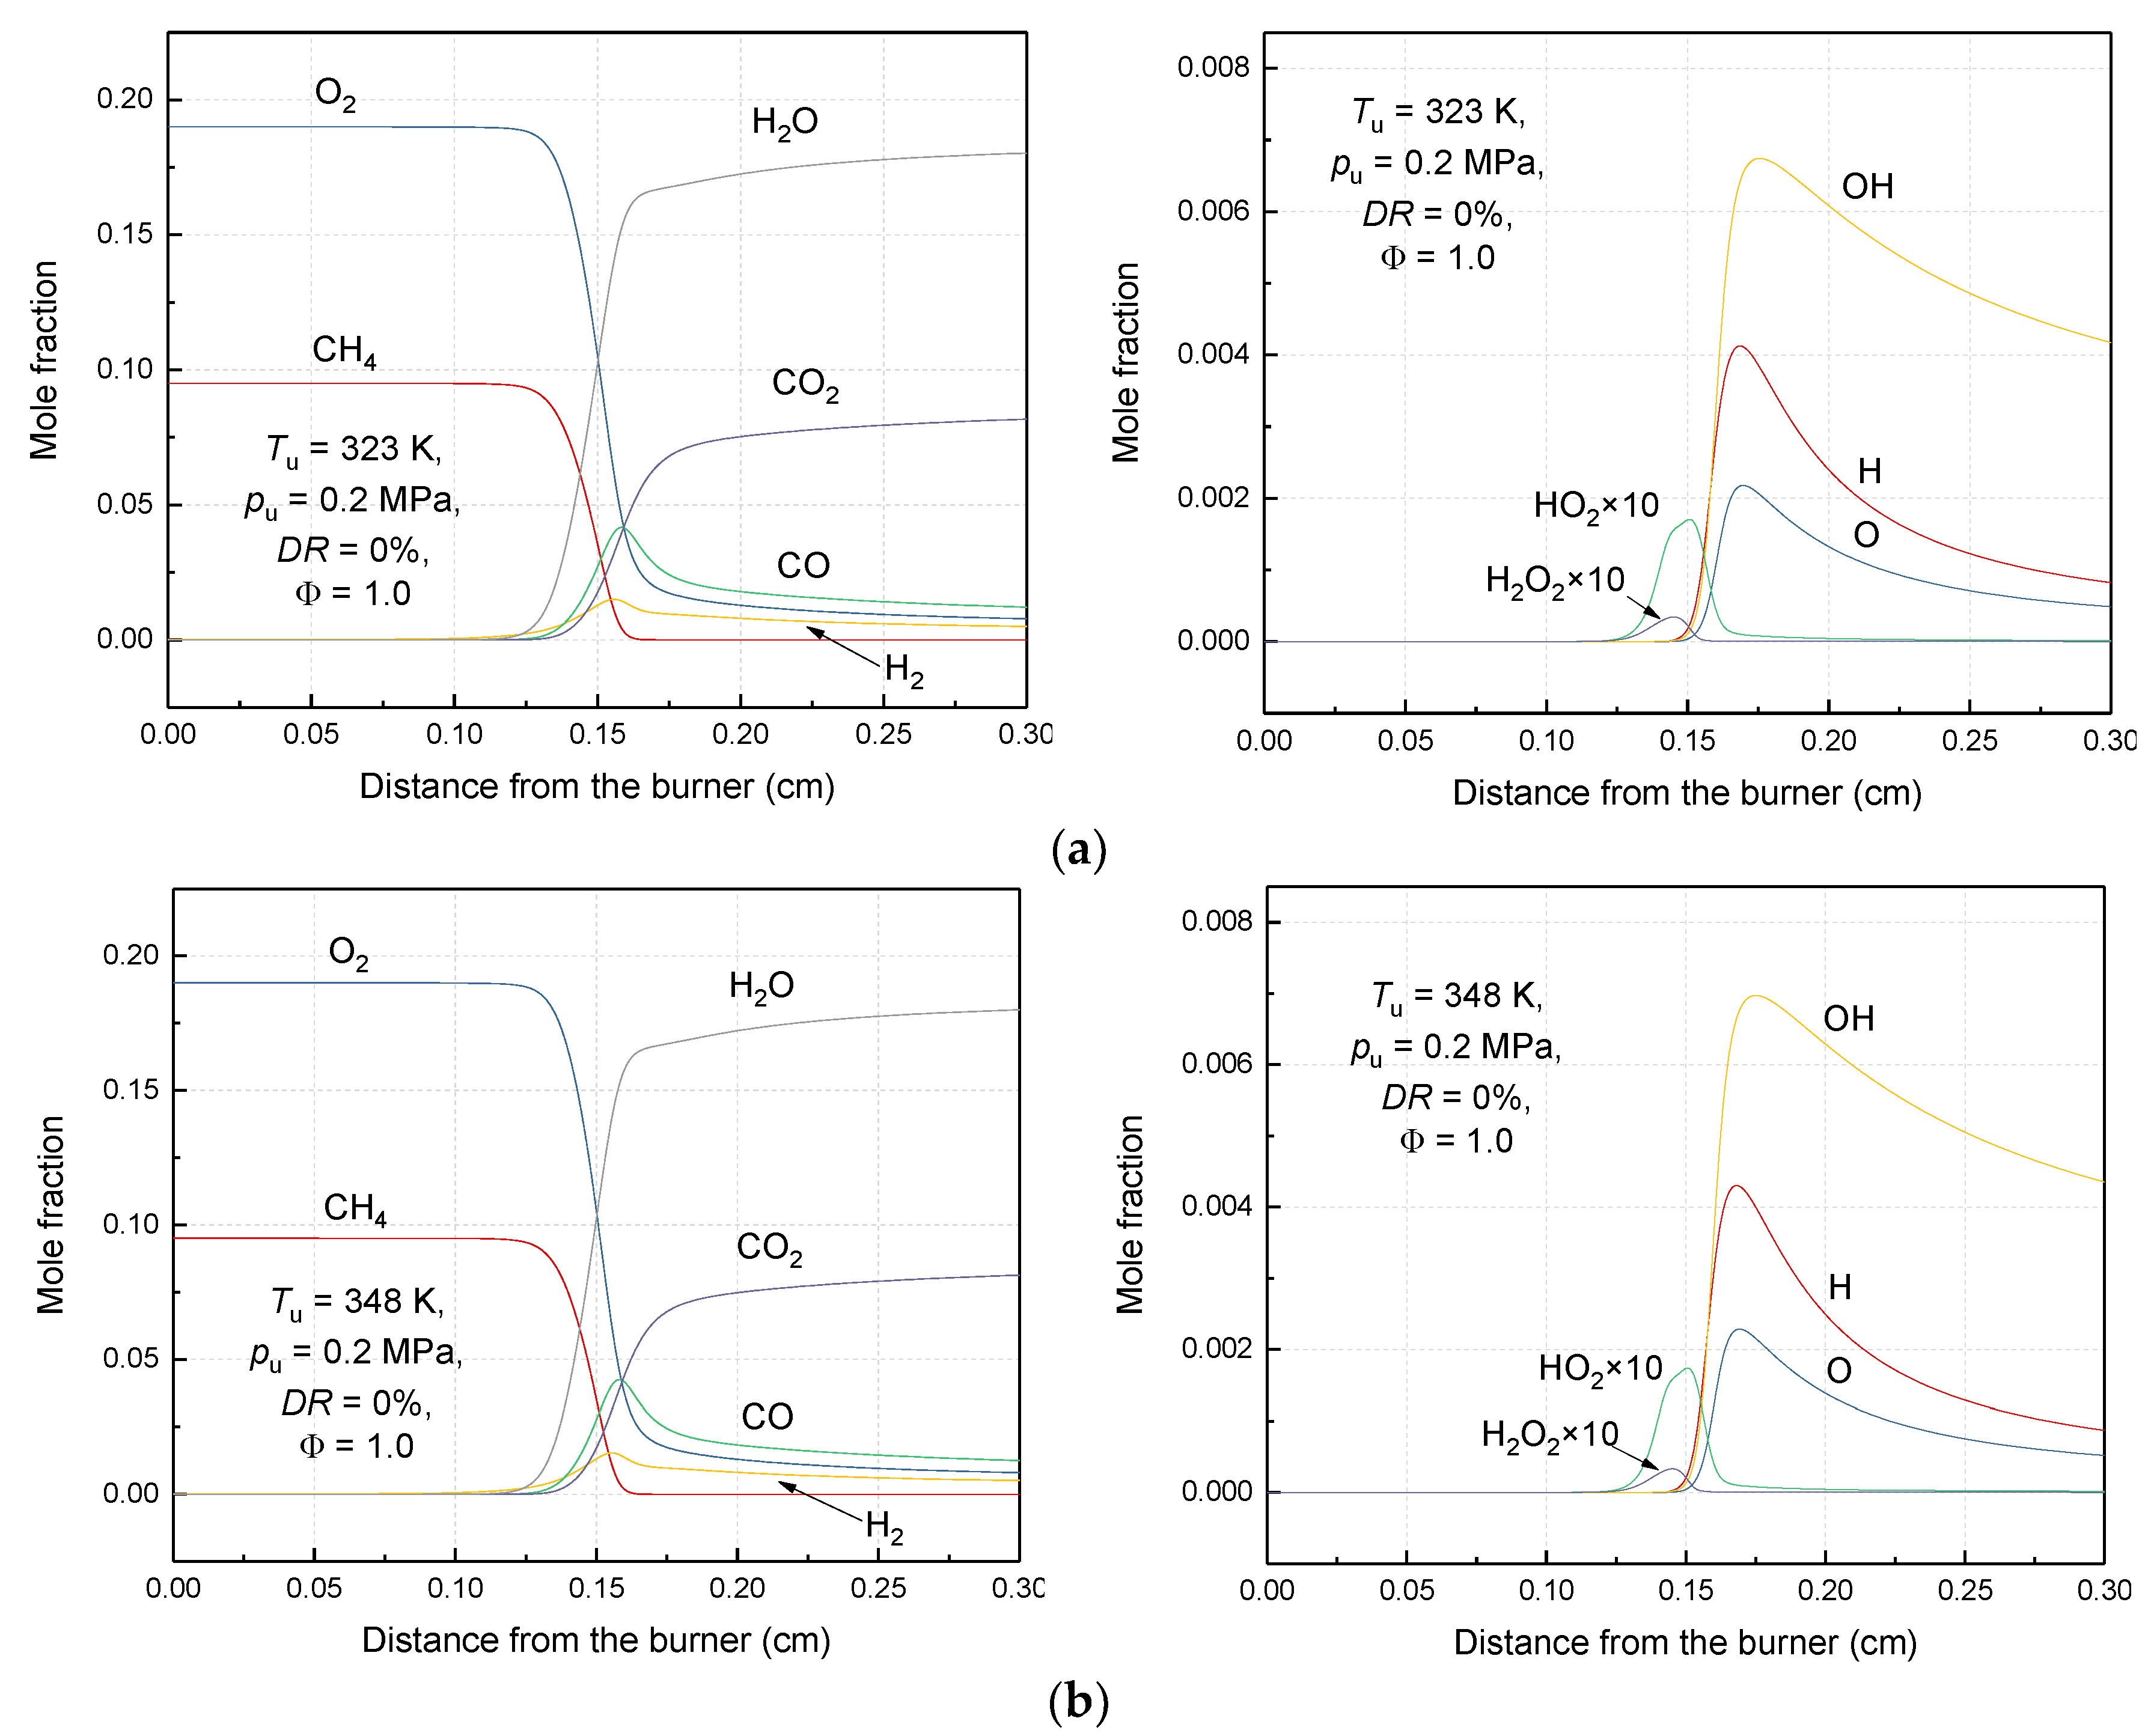
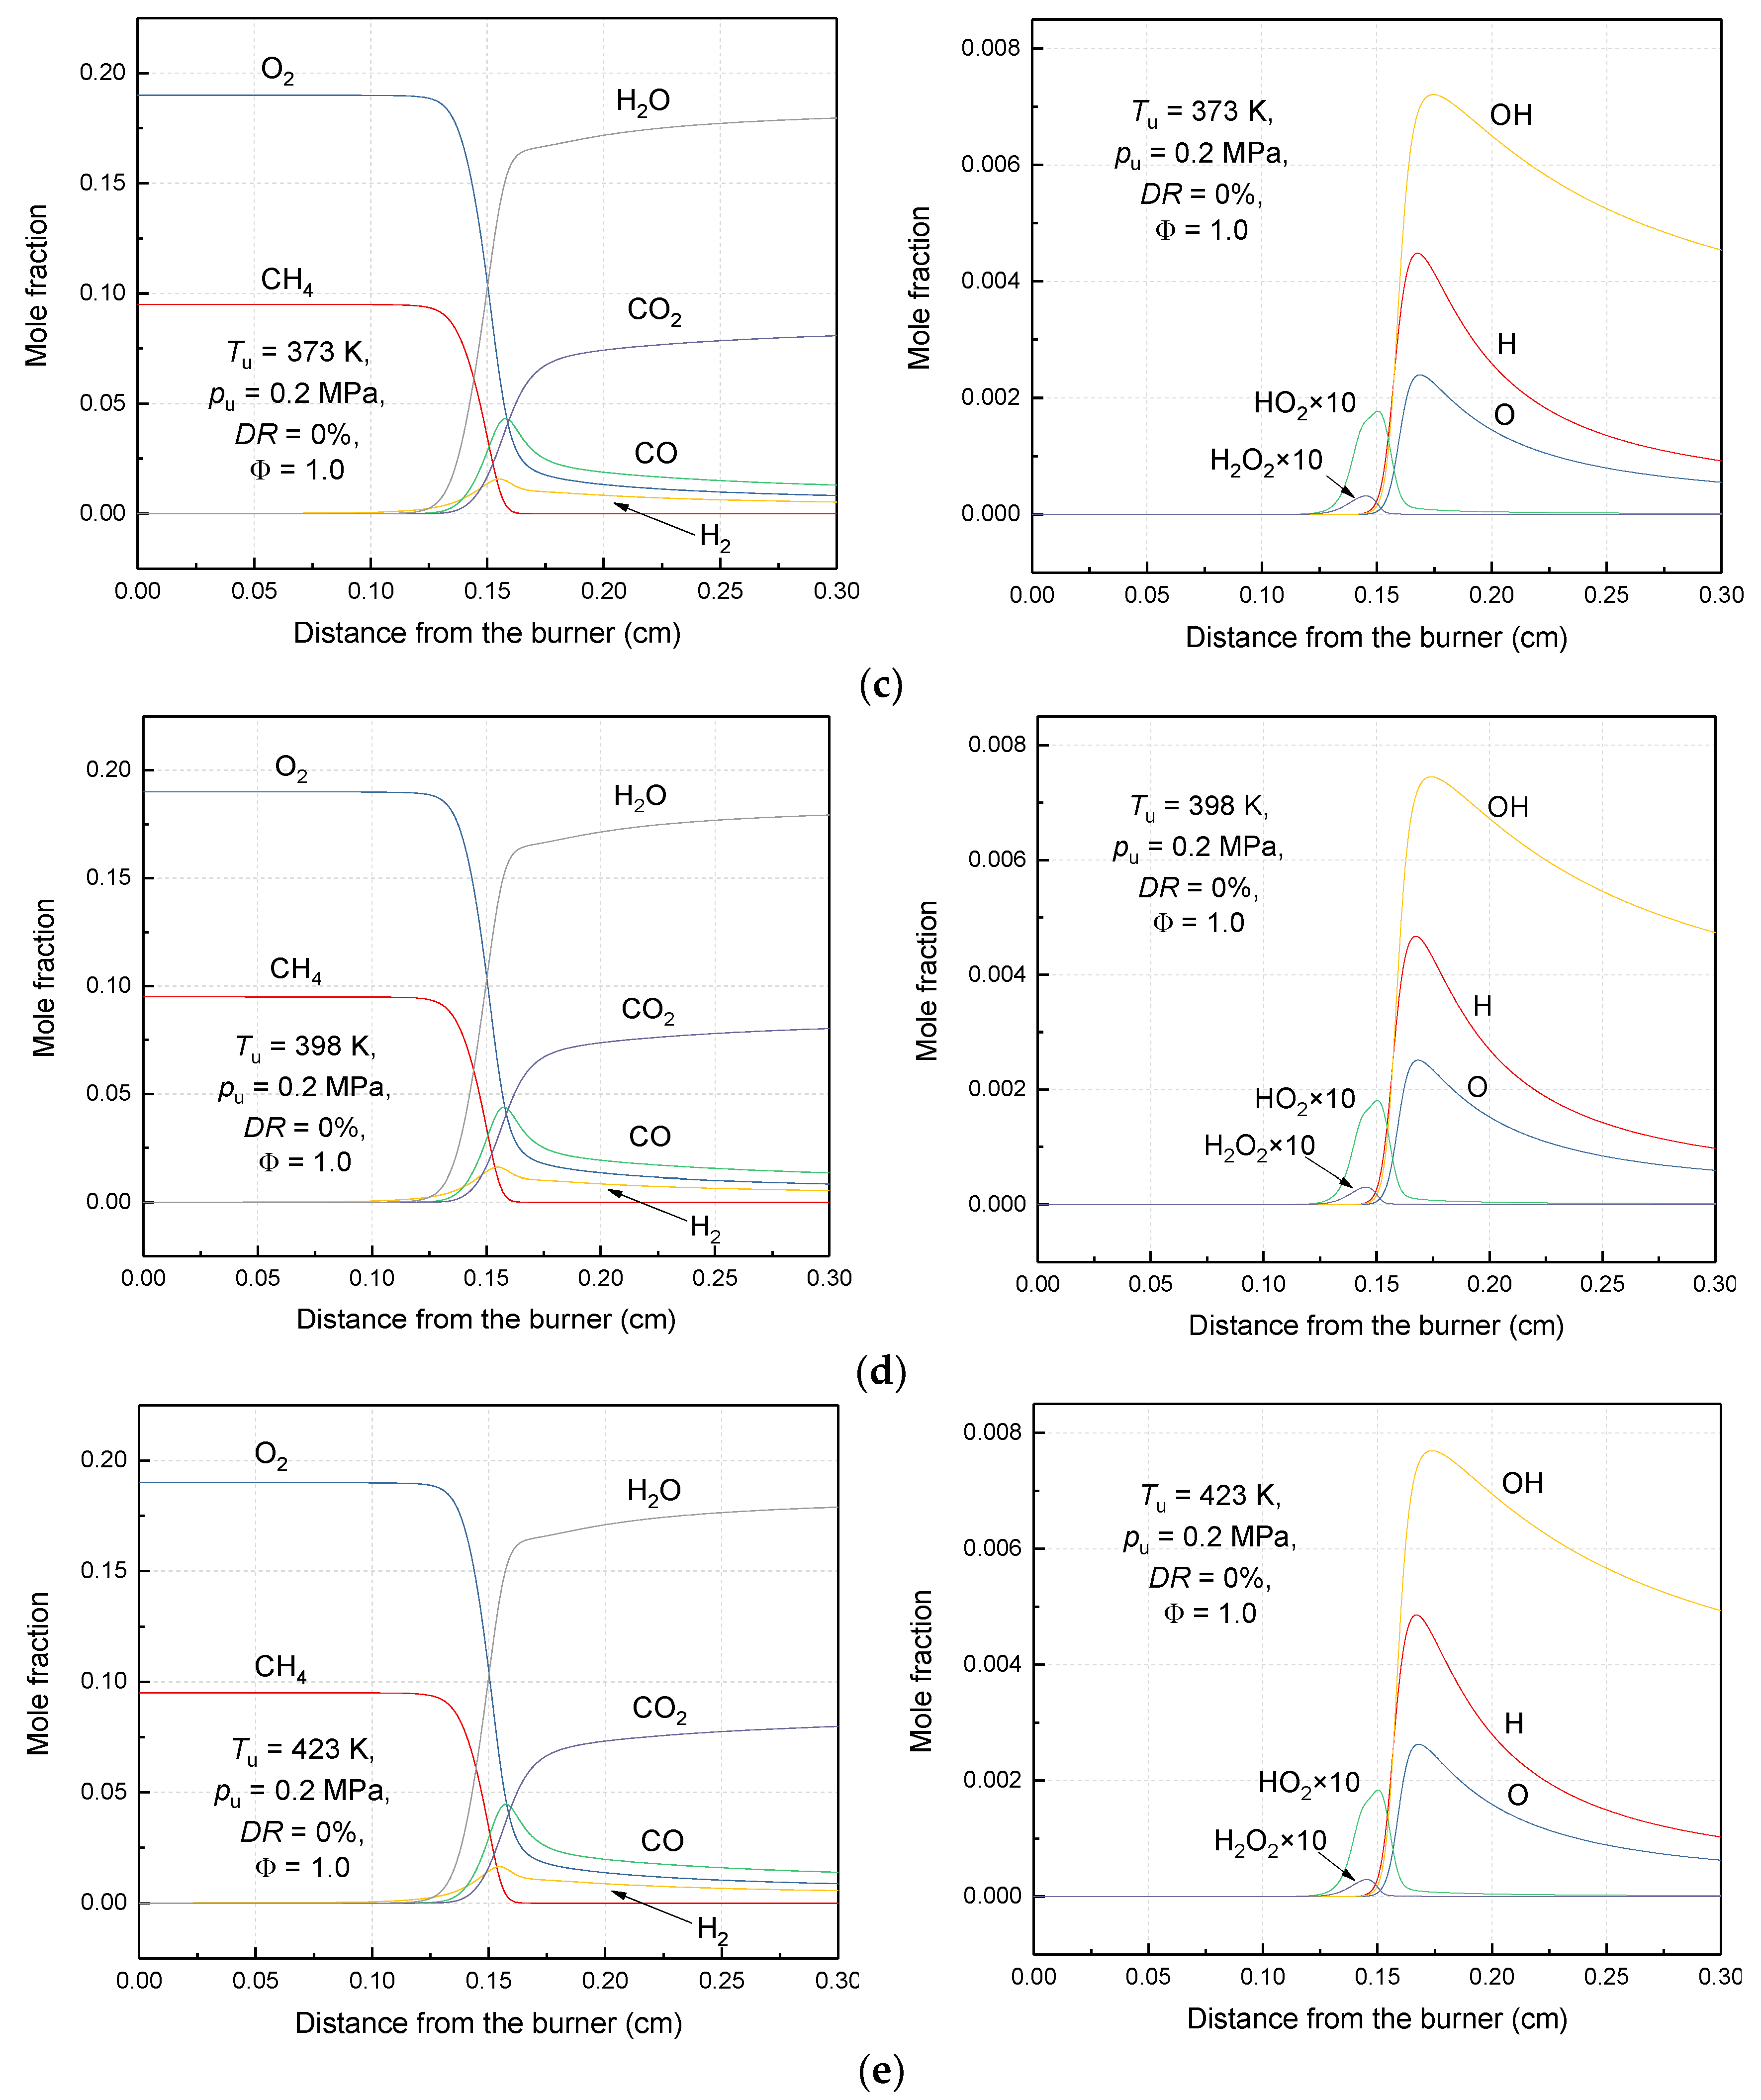
Figure 9.
Flame structures under different initial temperatures. (a) pu = 0.2 MPa, Tu = 323 K, DR = 0%, Φ = 1.0; (b) pu = 0.2 MPa, Tu = 348 K, DR = 0%, Φ = 1.0; (c) pu = 0.2 MPa, Tu = 373 K, DR = 0%, Φ = 1.0; (d) pu = 0.2 MPa, Tu = 398 K, DR = 0%, Φ = 1.0; (e) pu = 0.2 MPa, Tu = 423 K, DR = 0%, Φ = 1.0.
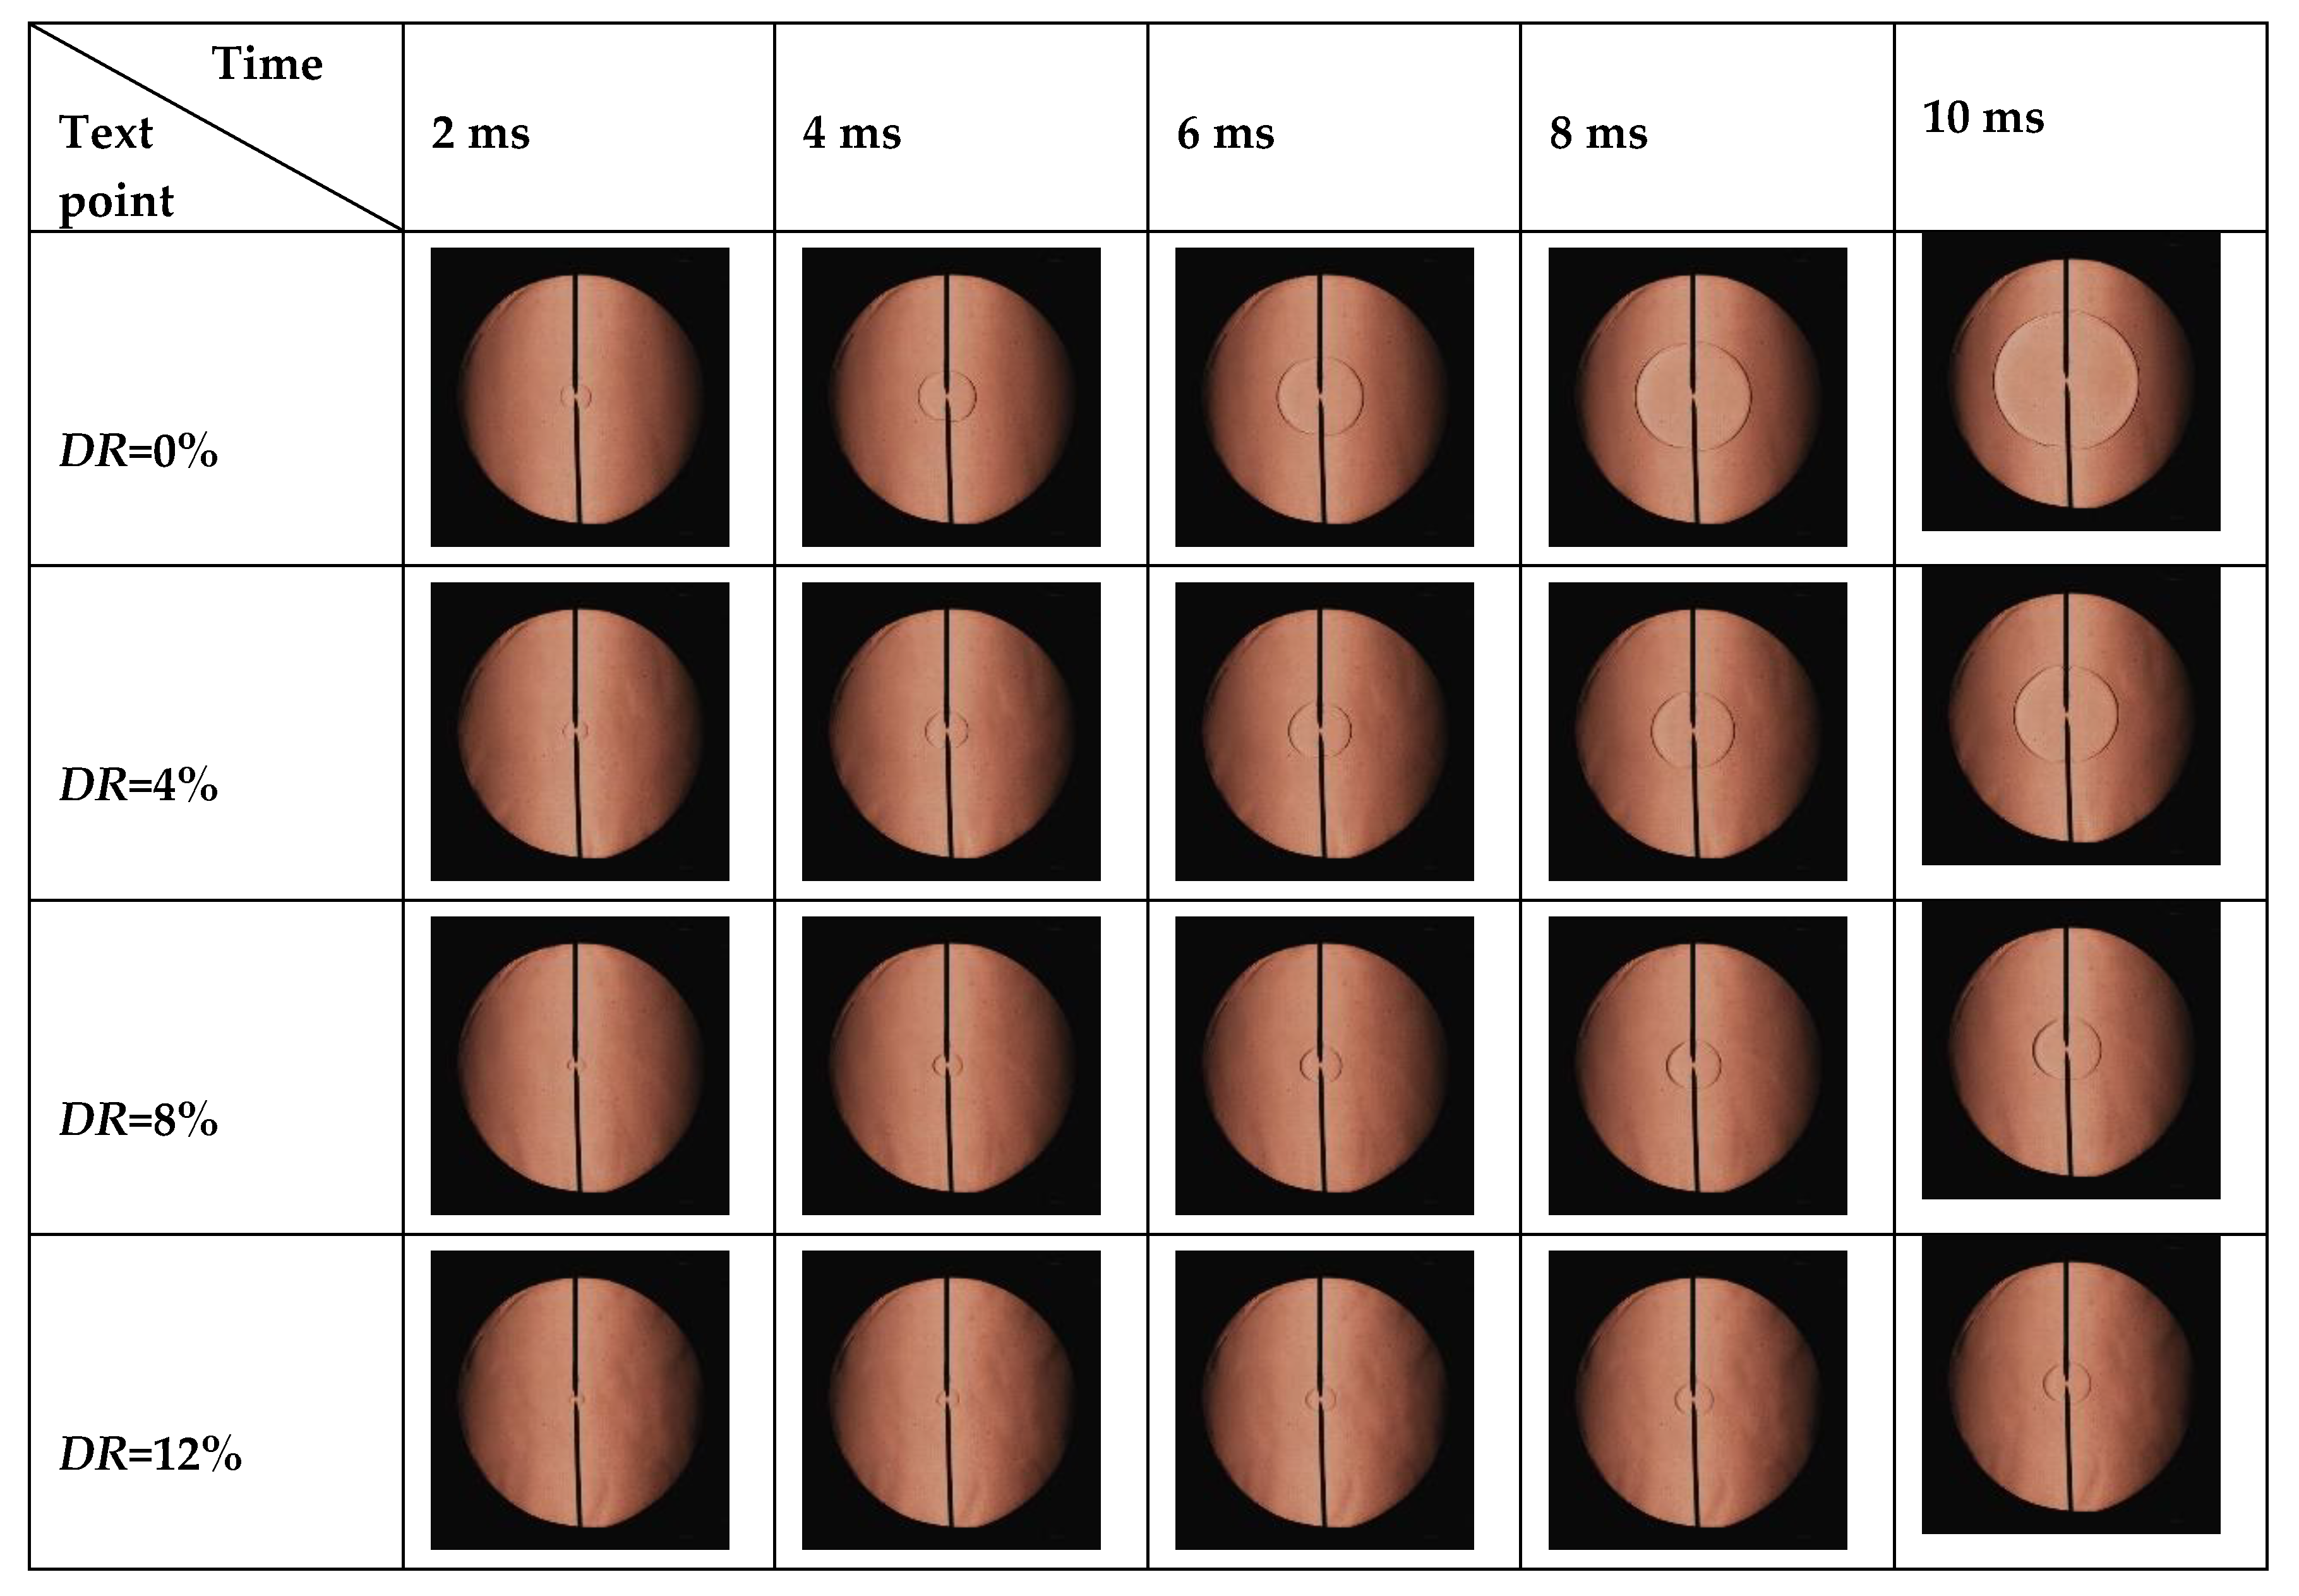
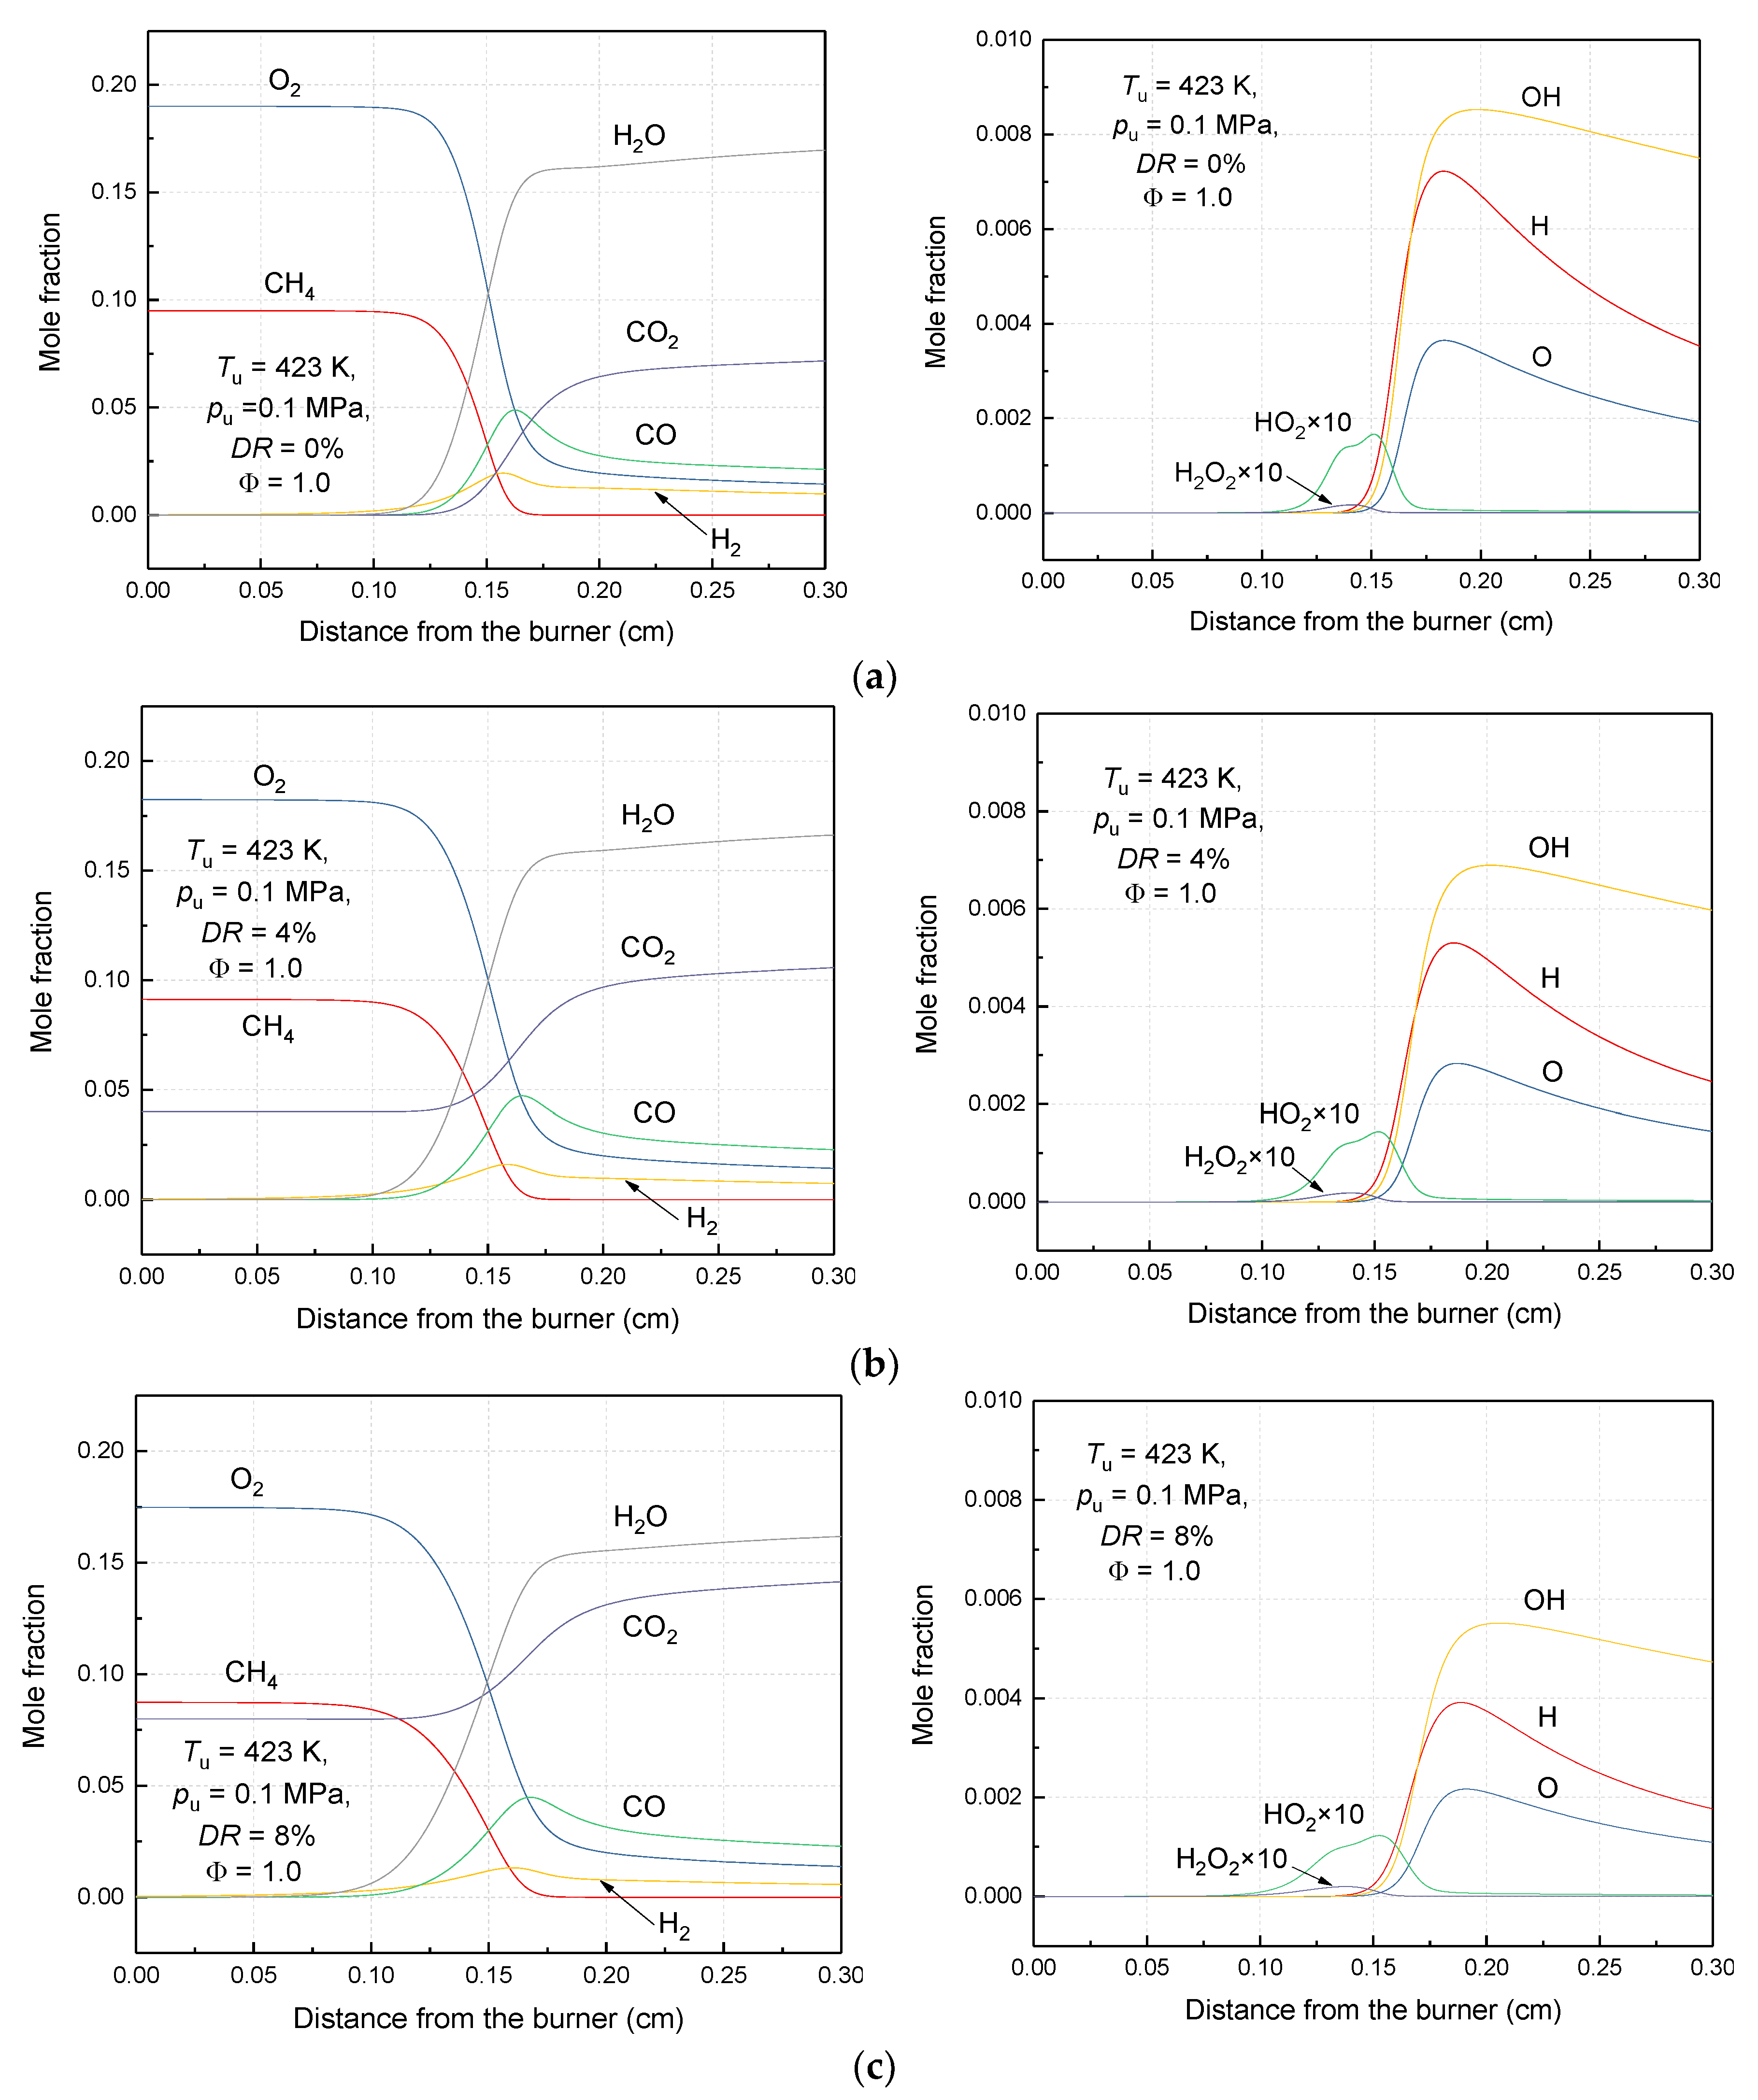
Figure 10.
Flame structures under different dilution rates. (a) DR = 0%, Φ = 1.0; (b) DR = 4%, Φ = 1.0; (c) DR = 8%, Φ = 1.0; (d) DR = 12%, Φ = 1.0.
Figure 10.
Flame structures under different dilution rates. (a) DR = 0%, Φ = 1.0; (b) DR = 4%, Φ = 1.0; (c) DR = 8%, Φ = 1.0; (d) DR = 12%, Φ = 1.0.
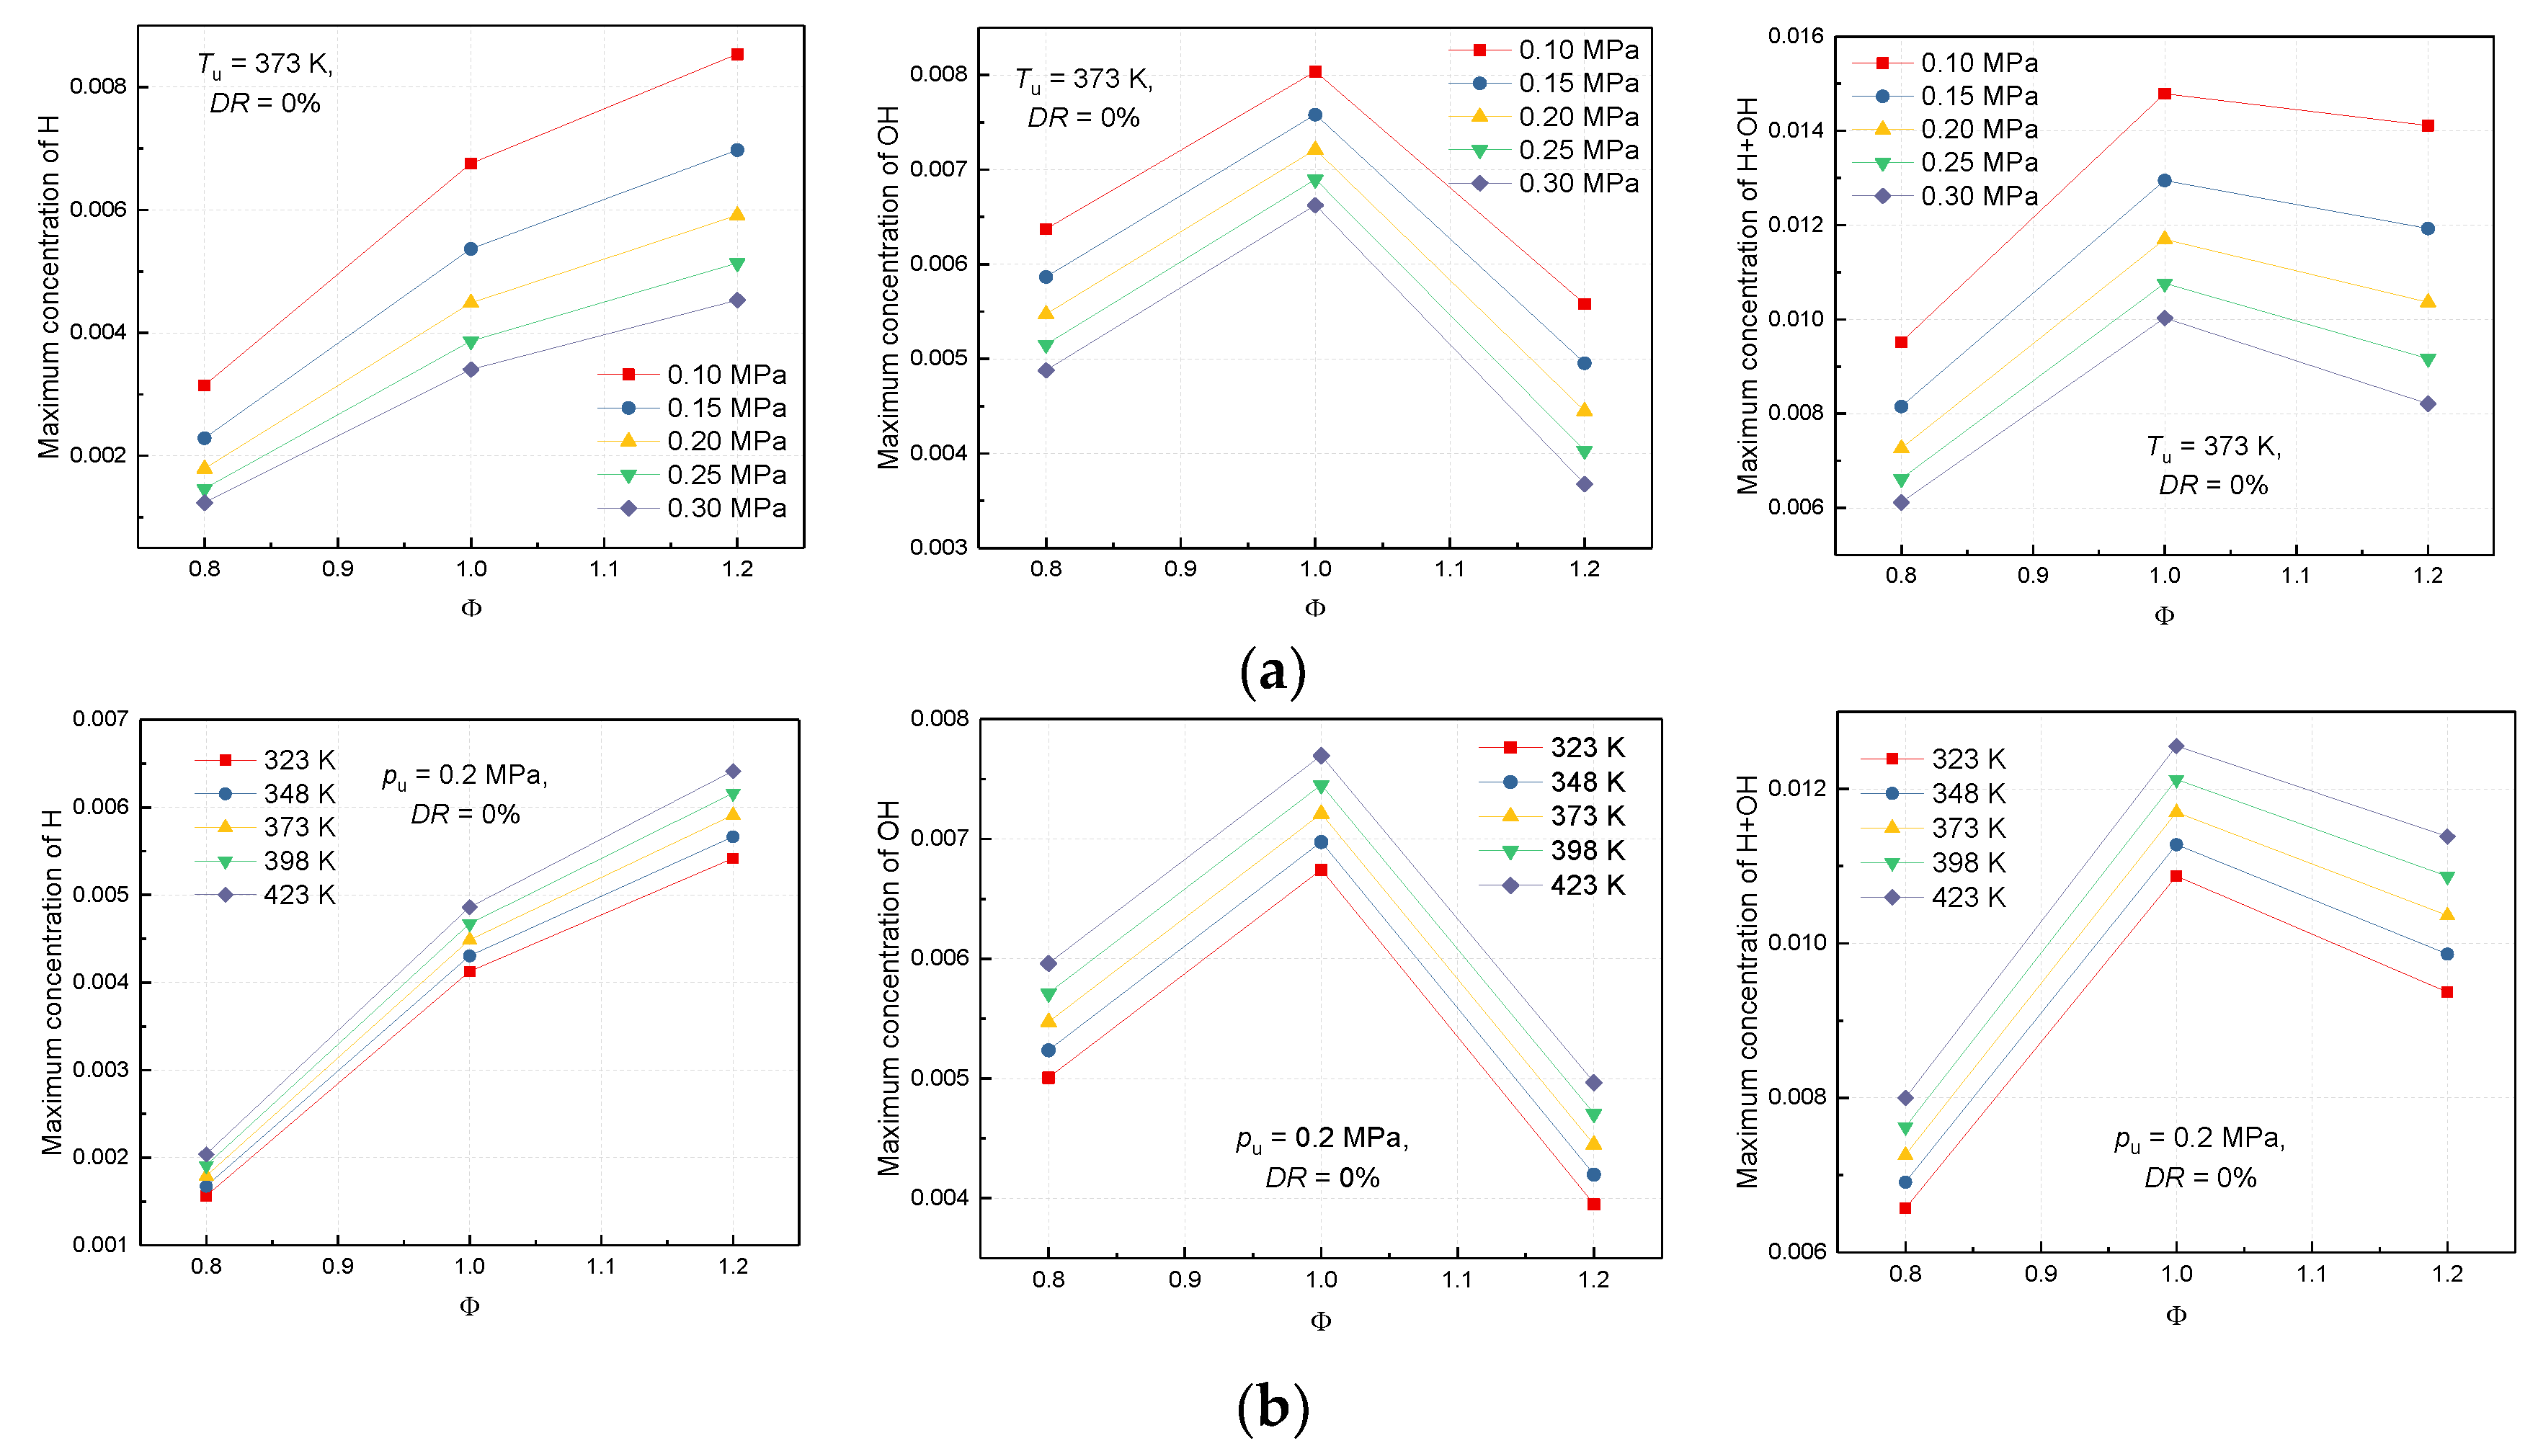
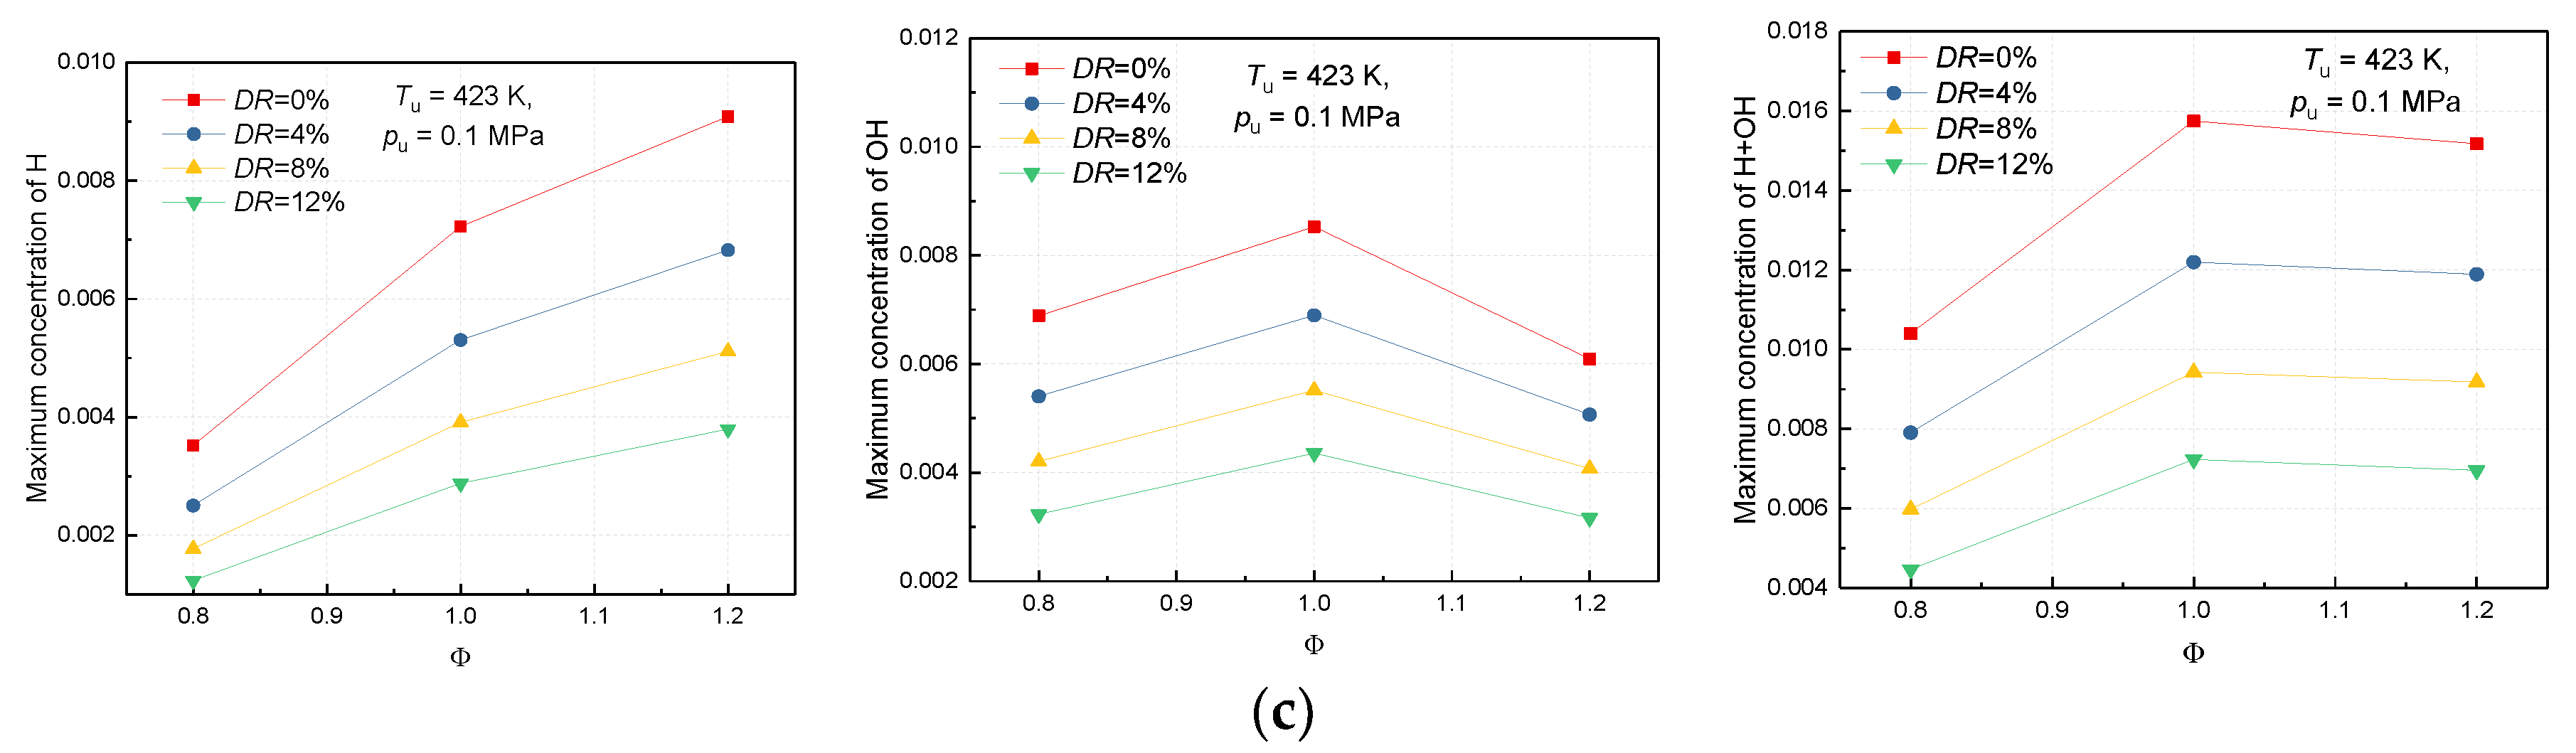
Figure 11.
Maximum concentration of H, OH and H + OH. (a) Under different initial pressures; (b) Under different initial temperatures; (c) Under different dilution rates.
Figure 11.
Maximum concentration of H, OH and H + OH. (a) Under different initial pressures; (b) Under different initial temperatures; (c) Under different dilution rates.
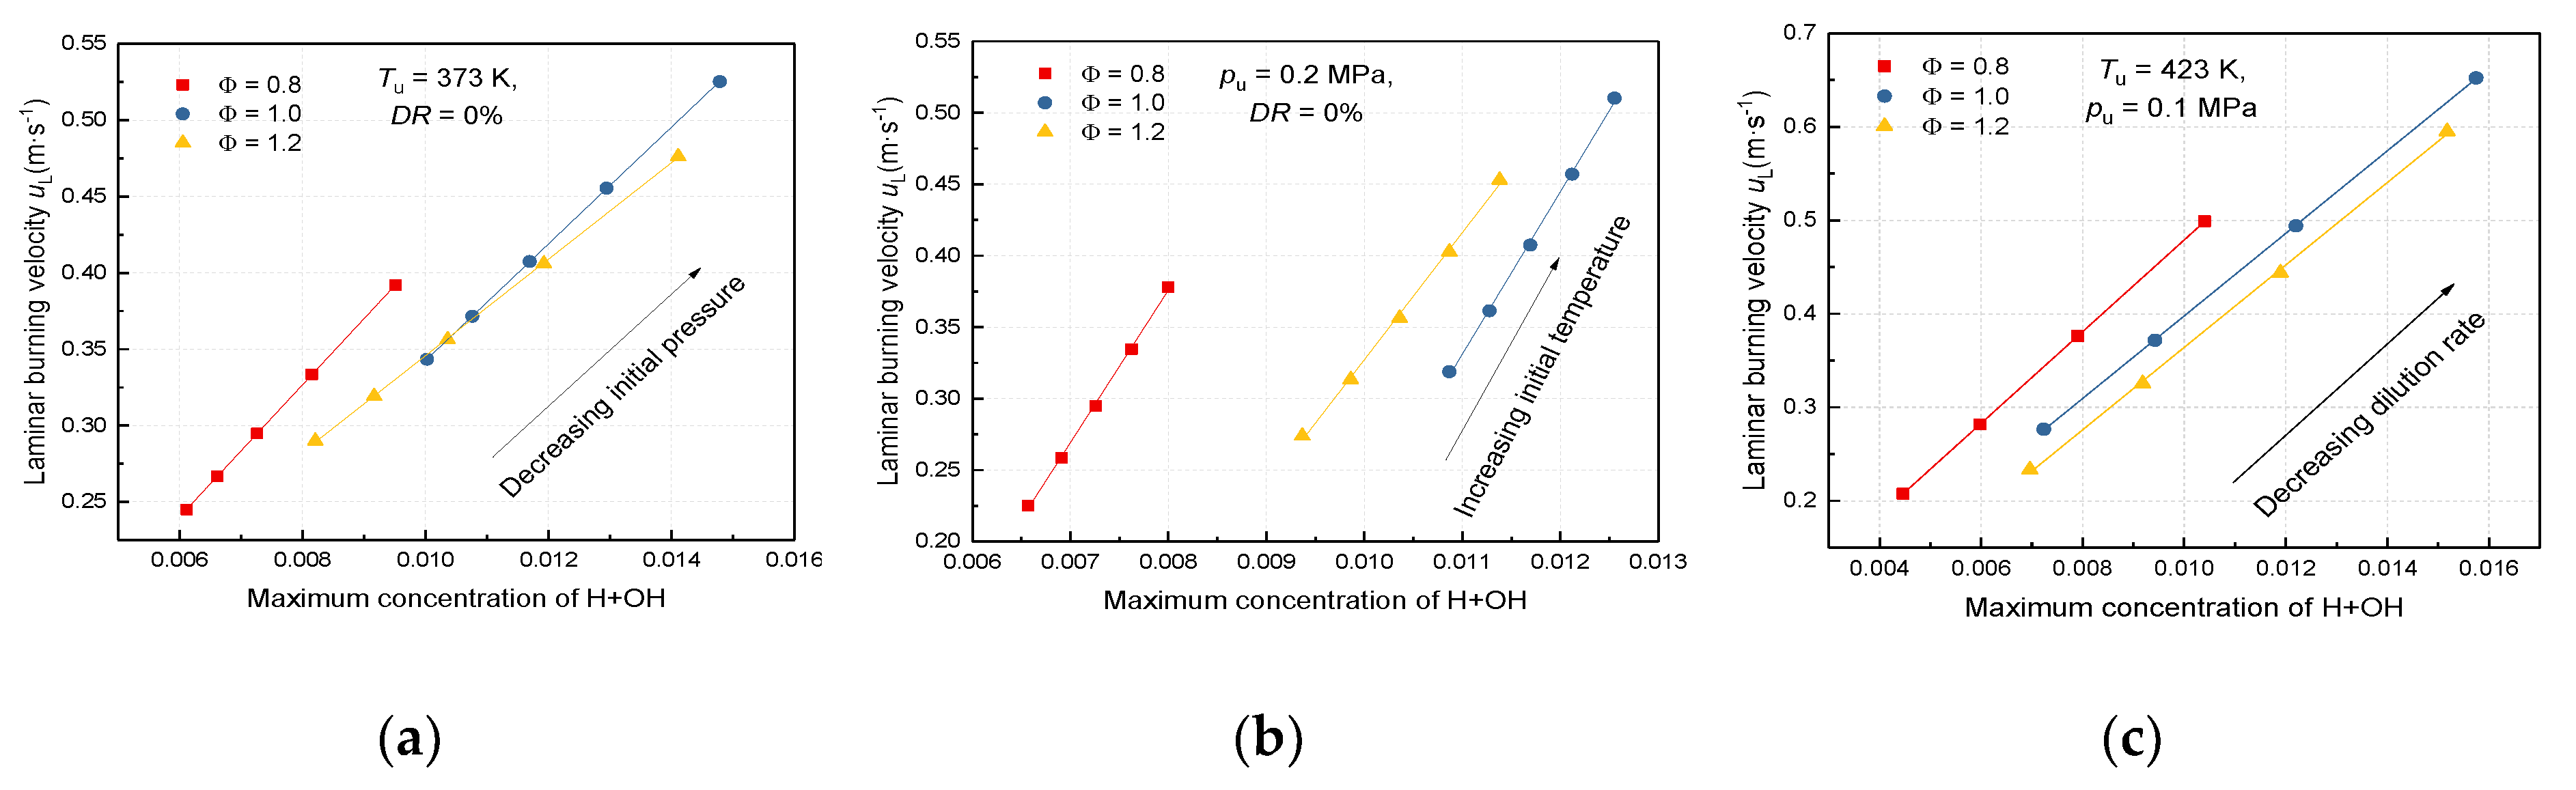
Figure 12.
Laminar burning velocity versus maximum concentration of H + OH. (a) Under different initial pressures; (b) Under different initial temperatures; (c) Under different dilution rates.
Figure 12.
Laminar burning velocity versus maximum concentration of H + OH. (a) Under different initial pressures; (b) Under different initial temperatures; (c) Under different dilution rates.
Table 1.
Parameters of the constant volume chamber.
Table 1.
Parameters of the constant volume chamber.
| Parameter (Unit) | Value |
|---|
| Inner diameter (mm) | 350 |
| Volume (L) | 22.4 |
| Maximun heating temperature (K) | 600 |
| Maximum pressure (MPa) | 4 |
| Effective diameter of windows (mm) | Φ120 |
| Primary ignition voltage (V) | 14 |
| Ignition electrode gap (mm) | 2 |
| Ignition pulse width (ms) | 2 |
Table 2.
Test conditions of natural gas-CO2 mixture.
Table 2.
Test conditions of natural gas-CO2 mixture.
| Parameter (Unit) | Value |
|---|
| Initial temperature Tu (K) | 323, 348, 373, 398, 423 |
| Initial pressure pu (MPa) | 0.1, 0.15, 0.2, 0.25, 0.3 |
| Φ | 0.7, 0.8, 0.9, 1.0, 1.1, 1.2 |
| DR (%) | 0, 2, 4, 6, 8, 10, 12, 14, 16 |
Table 3.
Correlation Coefficients for Methane.
Table 3.
Correlation Coefficients for Methane.
| A | B | C | D | E | F |
|---|
| −141.362 | 331.485 | −156.243 | 2.586 | −4.390 | 2.174 |
Table 4.
Coefficients of the linear fit to the data of laminar burning velocity versus maximum concentration of H + OH under different initial pressures.
Table 4.
Coefficients of the linear fit to the data of laminar burning velocity versus maximum concentration of H + OH under different initial pressures.
| Tu = 373 K, DR = 0% | Φ |
|---|
| 0.8 | 1.0 | 1.2 |
|---|
| A | 43.27645 | 38.23116 | 31.58986 |
| B | −0.01949 | −0.0398 | 0.02985 |
| R2 | 0.99998 | 0.99999 | 0.99991 |
Table 5.
Coefficients of the linear fit to the data of laminar burning velocity versus maximum mole fraction of H + OH under different initial temperatures.
Table 5.
Coefficients of the linear fit to the data of laminar burning velocity versus maximum mole fraction of H + OH under different initial temperatures.
| pu = 0.2 MPa, DR = 0% | Φ |
|---|
| 0.8 | 1.0 | 1.2 |
|---|
| A | 106.77247 | 113.60037 | 88.93747 |
| B | −0.47819 | −0.91848 | −0.56212 |
| R2 | 0.99891 | 0.99897 | 0.99851 |
Table 6.
Coefficients of the linear fit to the data of laminar burning velocity versus maximum mole fraction of H + OH under different dilution rates.
Table 6.
Coefficients of the linear fit to the data of laminar burning velocity versus maximum mole fraction of H + OH under different dilution rates.
| Tu = 423 K, pu = 0.1 MPa | Φ |
|---|
| 0.8 | 1.0 | 1.2 |
|---|
| A | 49.05268 | 44.14693 | 44.08372 |
| B | −0.01146 | −0.04367 | −0.07669 |
| R2 | 1 | 0.99997 | 0.99946 |


