Article

Applicability of a New Sulfonated Pentablock Copolymer Membrane and Modified Gas Diffusion Layers for Low-Cost Water Splitting Processes

1
CNR-IMM, Zona Industriale Strada VIII n.5, I-95121 Catania, Italy
2
Dipartimento di Scienze Chimiche, Università degli Studi di Catania, Viale A. Doria n.6, I-95125 Catania, Italy
*
Author to whom correspondence should be addressed.
Energies 2019, 12(11), 2064; https://doi.org/10.3390/en12112064
Submission received: 10 April 2019 / Revised: 8 May 2019 / Accepted: 26 May 2019 / Published: 30 May 2019
(This article belongs to the Special Issue Materials and Devices for Solar to Hydrogen Energy Conversion)

Abstract

:
The aim of this work is to evaluate the possible use of Nexar™ polymer, a sulfonated pentablock copolymer (s-PBC), whose structure is formed by tert-butyl styrene, hydrogenated isoprene, sulfonated styrene, hydrogenated isoprene, and tert-butyl styrene (tBS-HI-SS-HI-tBS), as a more economical and efficient alternative to Nafion® membrane for proton exchange membrane (PEM) electrolysis cells. Furthermore, we have studied a new methodology for modification of gas diffusion layers (GDL) by depositing Pt and TiO2 nanoparticles at the cathode and anode side, respectively, and a protective polymeric layer on their surface, allowing the improvement of the contact with the membrane. Morphological, structural, and electrical characterization were performed on the Nexar™ membrane and on the modified GDLs. The use of modified GDLs positively affects the efficiency of the water electrolysis process. Furthermore, Nexar™ showed higher water uptake and conductivity with respect to Nafion®, resulting in an increased amount of current generated during water electrolysis. In conclusion, we show that Nexar™ is an efficient and cheaper alternative to Nafion® as the proton exchange membrane in water splitting applications and we suggest a possible methodology for improving GDLs’ properties. These results meet the urgent need for low-cost materials and processes for hydrogen production.

1. Introduction

Polymer electrolyte membrane (PEM) water electrolysis is one of the most promising technologies for hydrogen production due to its relatively high compactness, simplicity, low operating temperature, and high efficiency [1,2]. The durability and costs of PEM electrolyzers are still the two main barriers for their large-scale commercialization, which also opens new challenges for researchers regarding the search for new efficient and economical materials for cell construction.
Hydrogen is an excellent fuel that is ideal for energy storage from discontinuous renewable power sources such as photovoltaic or wind fields. However, the shift to a hydrogen-based economy has been disrupted by various fundamental and organizational factors, mainly concerning storage, distribution, and production. Even if hydrogen is the most abundant element in the universe, it is not present as itself; it must be produced by extraction from natural gas (48%), oil (30%), coal (18%), or by electrolysis (4%) by means of an energy input [3]. High-quality hydrogen can be produced by water electrolysis consisting of the electrochemical conversion of water to hydrogen and oxygen. With respect to steam reforming, which produces low purity hydrogen with a high concentration of carbon monoxide [3], the water splitting process for H2 generation is cyclic and environmentally friendly, since the raw material is abundant and cheap and the combustion of H2 in air produces only water. Electrolysis is not just a large-scale technology due to its high costs, rather it is due to the fact that energy input must be provided for electrochemical reactions to occur. If this energy input can be obtained from a renewable source, such as solar energy, H2 can then become a low-cost and clean energy alternative capable of powering our planet [4].
The first water electrolyzer using a solid polymer as electrolyte was proposed by General Electric in the sixties. In particular, they used a solid sulfonated polystyrene membrane for proton conduction [5]. The advantages of a PEM system with respect to an alkaline water electrolysis cell are mainly due to the low thickness of the membranes (between 20 and 300 μm) and can be summarized as follows: compactness of the system, low gas crossover, operation at high pressure and high proton conductivity, i.e., higher than 0.1 S/cm [6].
The commercial Nafion® membrane from Dupont is ordinarily used as the proton exchange membrane in fuel cells and many other applications in water environments due to its thermal and chemical resistance, ion exchange properties, selectivity, mechanical strength, and insolubility in water [7,8,9,10]. Its main disadvantages are its high cost of production and disposal. Many studies already exist seeking alternative polymers to be used as membranes for PEM water electrolysis, such as polybenzimidazoles (PBI), poly(ether ether ketones) (PEEK), poly(ether sulfones) (PES), and sulfonated polyphenyl quinoxaline (SPPQ) [11]. However, the results in terms of current densities and durability were not comparable with the ones achievable with Nafion membranes; therefore, the research is still focusing on polymeric materials with high durability, low cost, and good performance. Recently, a sulfonated pentablock copolymer (s-PBC) commercialized as Nexar™ by Kraton LCC has found numerous applications, mainly thanks to its block architecture and functionalization with sulfonilic groups that allow this polymer to achieve a good trade-off between hydrophilicity and mechanical stability [12,13,14,15,16,17]. In particular, Nexar is a symmetric pentablock copolymer comprised of poly[t-butyl styrene-b-hydrogenated isoprene-b-sulfonated styrene-b-hydrogenated isoprene-b-t-butyl styrene] (tBS-HI-SS-HI-tBS), in which the sulfonated midblock provides the ionic character, while the outer blocks provide the flexibility of a low glass transition (Tg) material and the strength of a high Tg material. In this new polymeric architecture, the sulfonation is limited to the middle block, resulting in a polymer with controlled swelling and good mechanical properties in the hydrated state [12,13,14,15,16,17]. The structure of Nexar is reported in Figure 1 in comparison with Nafion. Like Nafion, this polymer is composed of alternating hydrophobic and hydrophilic domains with which it can absorb water while still being stable, and the sulfonilic groups confer high proton conductivity.
With respect to Nafion, the absence of a fluorinated back bond allows reduction of its production and disposal costs, the block architecture confers high mechanical stability and the possibility of higher sulfonation degree which increases its acidity and water uptake, resulting in higher proton conductivity.
In this work, Nexar™ commercial film has been tested as the proton exchange membrane in a home-made cell for water electrolysis and has been compared to Nafion®. The membrane was sandwiched between two gas diffusion layers (GDLs) that were modified by depositing TiO2 or Pt nanoparticles for the anode and cathode side, respectively. Finally, the GDLs were covered by a thin polymeric protective layer, improving the contact with the membrane and avoiding detachment of Pt and TiO2 nanoparticles.
The efficiency at the anode side mainly relies on the interaction of the anode with water (or hydroxyl species) [18,19,20]. The ability of Titanium dioxide in water splitting under irradiation is well known and established [21] due to its high interaction with water and/or hydroxyl species. Furthermore, TiO2 has several advantages, such as long-term stability, nontoxicity, availability, and low cost, and it has been used in fuel cells as fillers in Nafion nanocomposites to increase polymer hydrophilicity and proton conductivity [22]. We have chosen to add titanium dioxide on the GDL to take advantage of its ability to interact with water (breaking H2O bonds), to increase the hydrophilicity of the GDL (as shown by contact angle measurements), to favor the O2 gas to flow through the carbon fibers of the GDL, and to improve the contact of GDL with the membrane in a wet environment. Finally, the addition of a superficial layer of titanium dioxide has the role of reducing the oxidation of carbon fibers during the electrolytic cell tests. Pt was added at the cathode side as a catalyst for HER, a purpose for which it is extensively used [23]. All the materials have been chemically, morphologically, and electrically characterized. The results show that both the use of Nexar as PEM for water electrolysis and the proposed preparation methodology of GDLs are promising for water splitting applications and meet the industrial need for cost reduction of hydrogen production.

2. Materials and Methods

2.1. Materials

Nexar™ polymer films MD9200 (10–12 wt% polymer in a cyclohexane/heptane mixed solvent, thickness 50 μm) were provided by courtesy of Kraton Polymers LLC and were used as proton exchange membranes (PEMs). The IEC value of the commercial polymer is 2.0 meq/g, corresponding to a sulfonation degree of 52 mol%. The molecular weight is 112,500 g/mol and the volume fraction (tBS-[sS:S]-HI) is 0.300-[0.226:0.208]-0.266.
Nafion® DE 2020 solution and Nafion® NRE-212 membranes (thickness: 50 μm) were purchased at Sigma Aldrich. The IEC value of the commercial polymer solution is 1.08 meq/g and is >0.92 meq/g for the commercial film.
Gas diffusion layers (H2315 I2) were purchased at QuinTech and Pt and TiO2 nanoparticles for the cathode and anode side, respectively, were deposited on the surface, followed by the deposition of a thin Nafion layer in order to protect the surface and make it more hydrophilic, thus improving the contact with the membrane. The Pt layer was deposited by sputtering, while TiO2 (Sigma Aldrich anatase phase, size < 25 nm) and the polymeric layer were deposited by electrophoretic deposition (EPD), an alternative simple, reproducible, and low-cost assembly method to deposit metallic, semiconducting, and insulating nanoparticles on conductive substrates [24].
In our case, EPD was performed by keeping a distance of 5 mm between two GDLs (one to be deposited and the other one being the counter-electrode and their area was of 12 cm2) with a voltage of 20 V, for both TiO2 and Nafion deposition processes, using a solution of titania anatase nanoparticles with a particle size <100 nm (Sigma-Aldrich, St. Louis, MI, USA) dispersed in ethanol or a 5 wt% Nafion solution obtained by dilution of Nafion® DE 2020 commercial solution with isopropyl alcohol. The process duration was 30 and 20 minutes for the deposition of homogeneous layers of TiO2 and Nafion, respectively, and the deposited surface area was 9 cm2. The deposition occurred on the positive electrode in both cases.

2.2. Characterization

The chemical structure of both Nexar and Nafion commercial films was investigated by IR spectroscopy by a Spectrum Two FT-IR Spectrometer (Perkin Elmer, Waltham, MA, USA) equipped with a DTGS detector.
Impedance measurements were performed by using an Agilent E4980A in the frequency range from 20 Hz to 2 MHz with 100 mV small signal amplitude.
The morphology and the chemical composition of GDLs were characterized by field emission scanning electron microscope (Zeiss Supra35 FE-SEM) equipped with energy dispersive X-ray (EDX) microanalysis system (Oxford Instruments, Abingdon, UK, X-MAX, 80 mm2).
Contact angle measurements were performed by an Optical compact angle meter, (CAM 200 model by KSV Instruments LTD, Helsinki, Finland). The current–voltage measurements for the electrochemical cells were performed by using a Keithley 2602A-Source Meter Unit (SMU).

3. Results and Discussion

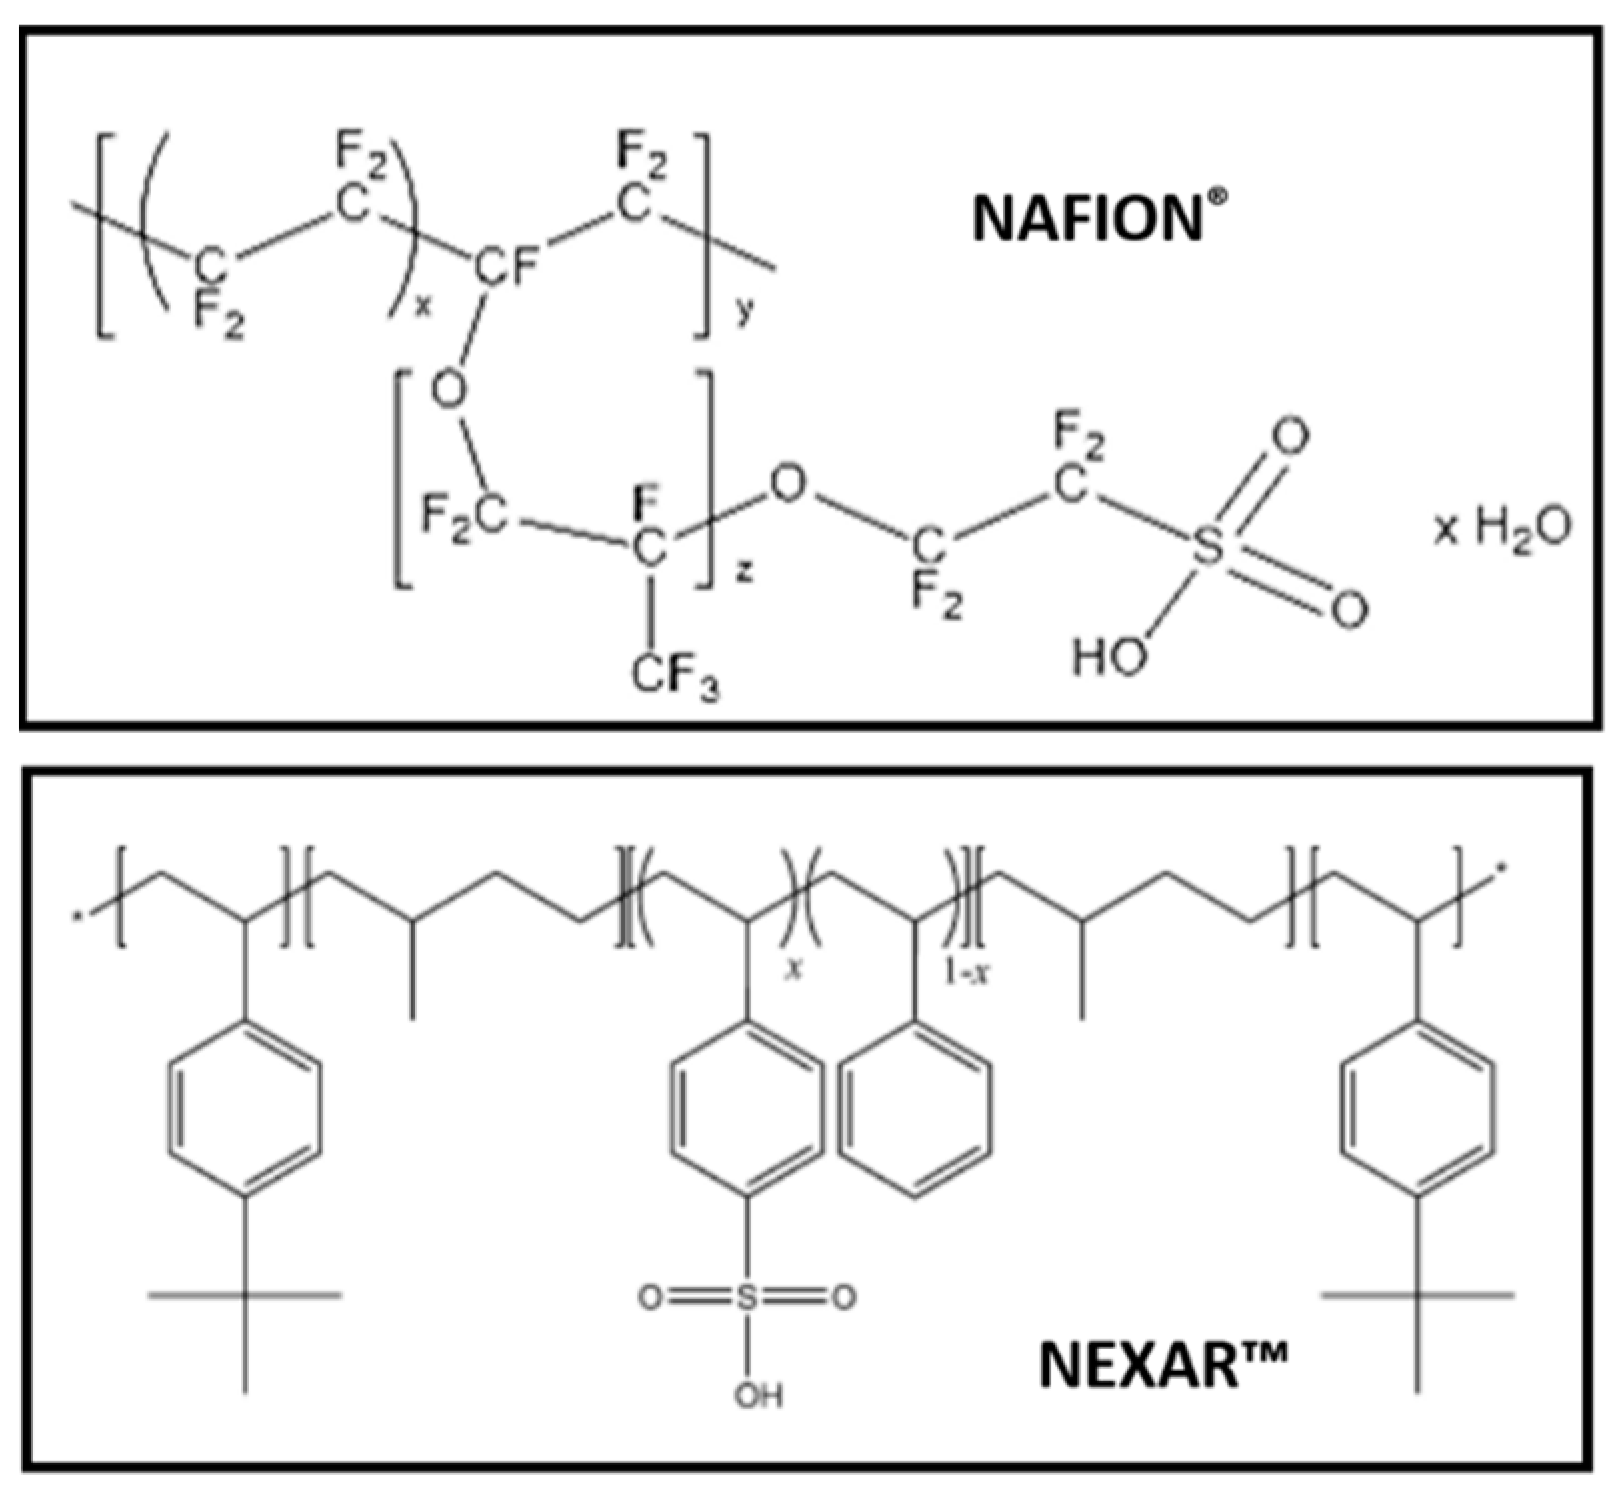
3.1. Water Uptake of Membranes

Water uptake is an important property for polymeric membranes that have to be used as PEM in water electrolysis; therefore, we measured this value for our Nafion and Nexar membranes. In particular, the water content value of each membrane was determined by using a microbalance and recorded as: water uptake% = [(mwetmdry)/mdry] × 100, where mdry is the mass of membrane dried in an oven at 60 °C for 2 h and then put to equilibrate in a desiccator before being weighed; mwet is the weight of the membrane after immersion in deionized water at room temperature for at least 48 h. In order to measure the water uptake, mwet was measured after quickly removing most of the free surface liquid on membrane surface with a paper tissue. Table 1 reports the calculated water uptake for the two commercial films: Nexar shows a water uptake one order of magnitude higher than Nafion. This aspect is important in explaining the performance shown by this polymer as reported in the following results. The water uptake values were measured for three consecutive times, all showing the same values.
Furthermore, we report in Table 1 λ, the number of water molecules per sulfonic acid group of ionomer based on the water uptake as:
λ = mol(H2O)/mol(SO3)
where the number of moles of water is calculated by the water uptake and the number of moles of sulfonic groups is calculated considering the EW (the number of grams of dry polymer per mole of sulfonic acid groups) for each polymer, i.e., 0.92 meq/g and 2 meq/g for Nafion and Nexar, respectively. The presence of sulfonilic groups was confirmed by the acquisition of IR spectra for both Nexar and Nafion commercial films. The IR spectra are reported in Figure S1 of Supporting Information, also showing the higher hydrophilic character of Nexar film with respect to Nafion film, in agreement with Table 1.
For Nafion NRE212, the swelling in thickness is 9% as reported in [25]. In order to determine the swelling of the Nexar polymer, we measured the diameter increase (%) of a circular polymeric disc before and after water absorption. We observed a 33% increase of the diameter (from 2.7 cm to 3.6 cm), in agreement with the one measured by Geise in [13,14]. Knowing the diameter of the dry polymeric disc (ddry) and its thickness (h = 50 μm), we calculated the volume of the cylinder with height corresponding to the thickness of the membrane in the dry state (Vin = πr2h). After water absorption, the final volume (Vfin = Vin + VH2O) is the sum of the one corresponding to the dry membrane and the volume of absorbed water molecules (calculated by the water uptake). Using the last volume and knowing the diameter of the wet disc dwet, it was possible to calculate the thickness of the membrane after water absorption: this value is 92 μm (increase of 84%) for the Nexar membrane with water uptake of 168%.
Usually, Nafion membranes are subjected to a washing and regeneration process by rinsing in nitric acid and hydrogen peroxide to remove organic impurities, in sulphuric acid to remove any metallic impurities, and again in boiling deionized H2O to remove excess acid [7,8,9]. Concerning Nexar, such oxidizing treatments are not recommended by the Producers, since they can damage the polymeric structure. Therefore, an optimization of the activation processes for s-PBC membranes based on other acidic media such as HCl should be performed in the future.
For this reason, in this work, we just compare the two polymeric films as received by the two companies after only washing in Milli Q water (till neutral pH), without any further treatment.

3.2. Electrical Characterization of Membranes

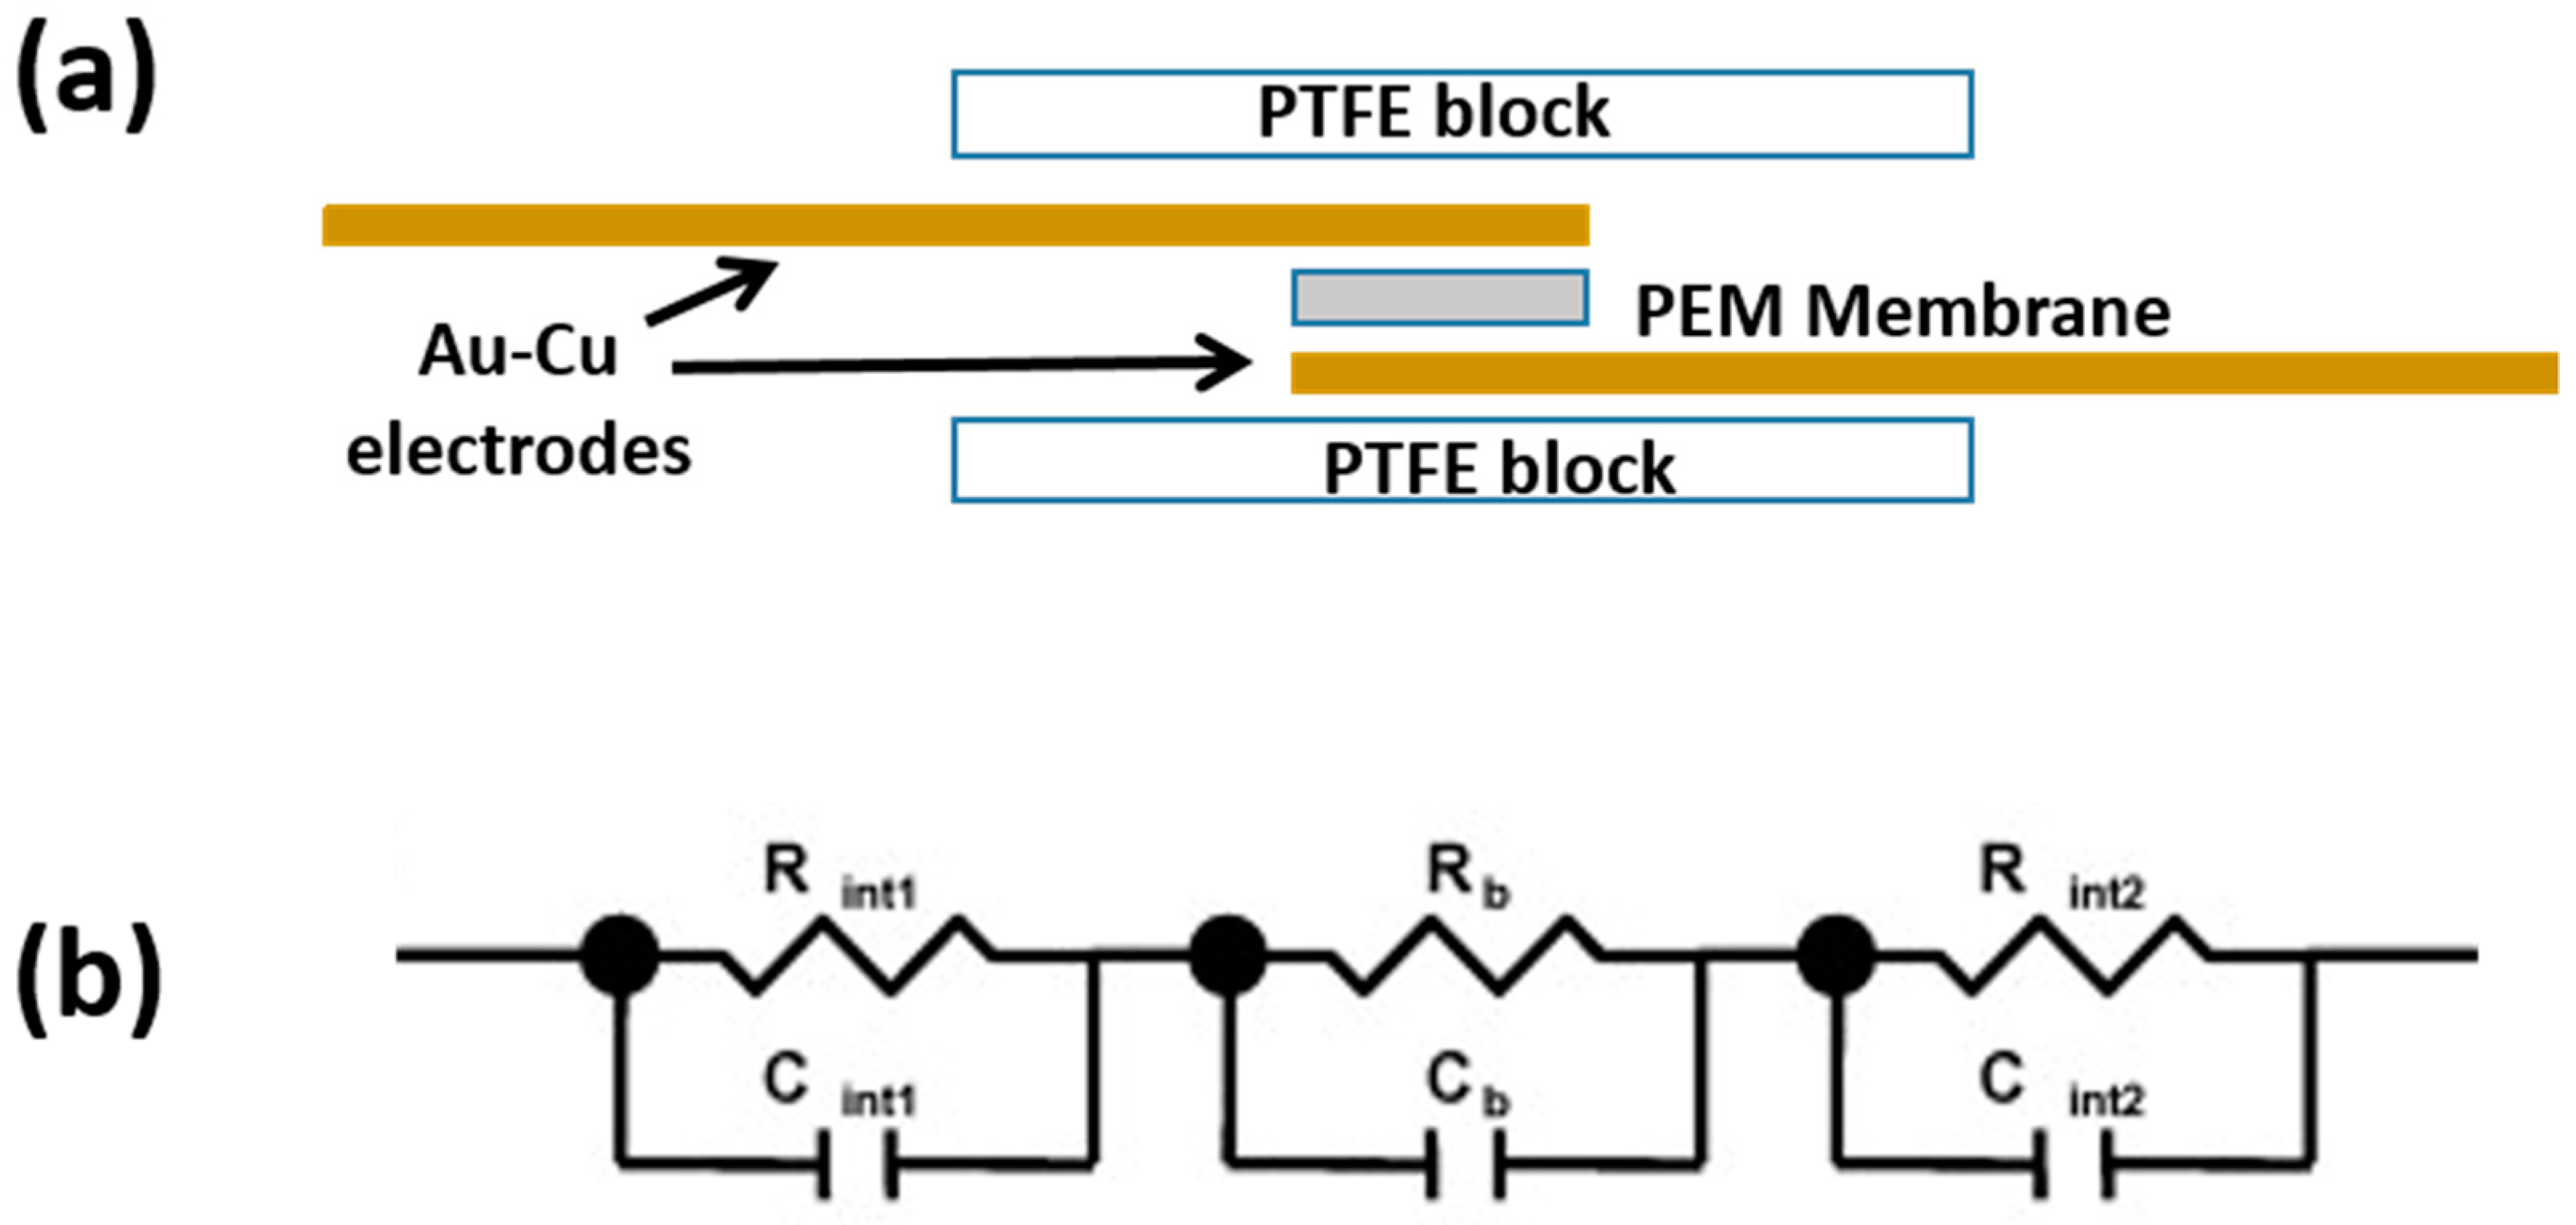
The membrane proton conduction was investigated using AC Impedance spectroscopy in the frequency range from 20 Hz to 2 MHz and with 100 mV small signal amplitude and 0 V bias. The through-plane conductivity was measured by placing the membrane between two gold-plated copper stripes (0.1 mm thick) used as electrodes and two PTFE blocks held together by screws, as illustrated in Figure 2a. Before the measurements, membranes were immersed in water for some hours and during the test, the bottom part of the membrane in the cell was kept in deionized water in order to avoid its complete drying.
The LCR system was calibrated by measuring the impedance in open and short configuration. Conductivity σ can be calculated as:
σ = L R A
where L and A correspond to membrane thickness and area, respectively, and R is the bulk membrane resistance.
As reported in the literature [26], such a system can be ideally schematized by an equivalent electrical circuit, as shown in Figure 2b, considering the contribution of the bulk membrane (Rb) in parallel with the bulk membrane capacitance (Cb) and in series with the contribution of the interfaces between membrane and electrode. The latter contribution can be represented by a parallel combination of the capacitance (Cint1 and Cint2) and the resistance (Rint1 and Rint2) at the interfaces. Therefore, the impedance of the equivalent circuit of Figure 2b can be written as:
Z (ω) = (1/Rb + iωCb)−1 + (1/Rint1 + iωCint1)−1 + (1/Rint2 + iωCint2)−1
The real part is resistive and the imaginary part is capacitive and the impedance spectra are expected to consist of (i) a semicircle at high frequencies, associated to the bulk membrane impedance, and (ii) another semicircle at low frequencies, associated to the membrane/electrode interfaces. In order to get the membrane resistance value, it is necessary to consider the high frequency region of the spectra and remove any inductance contribution. As described above, this can be done by LCR calibration.
Proton conductivity is a fundamental factor to evaluate the performance of proton exchange membranes and PEM cells. Commonly, proton conductivity is measured along the plane of the membrane [
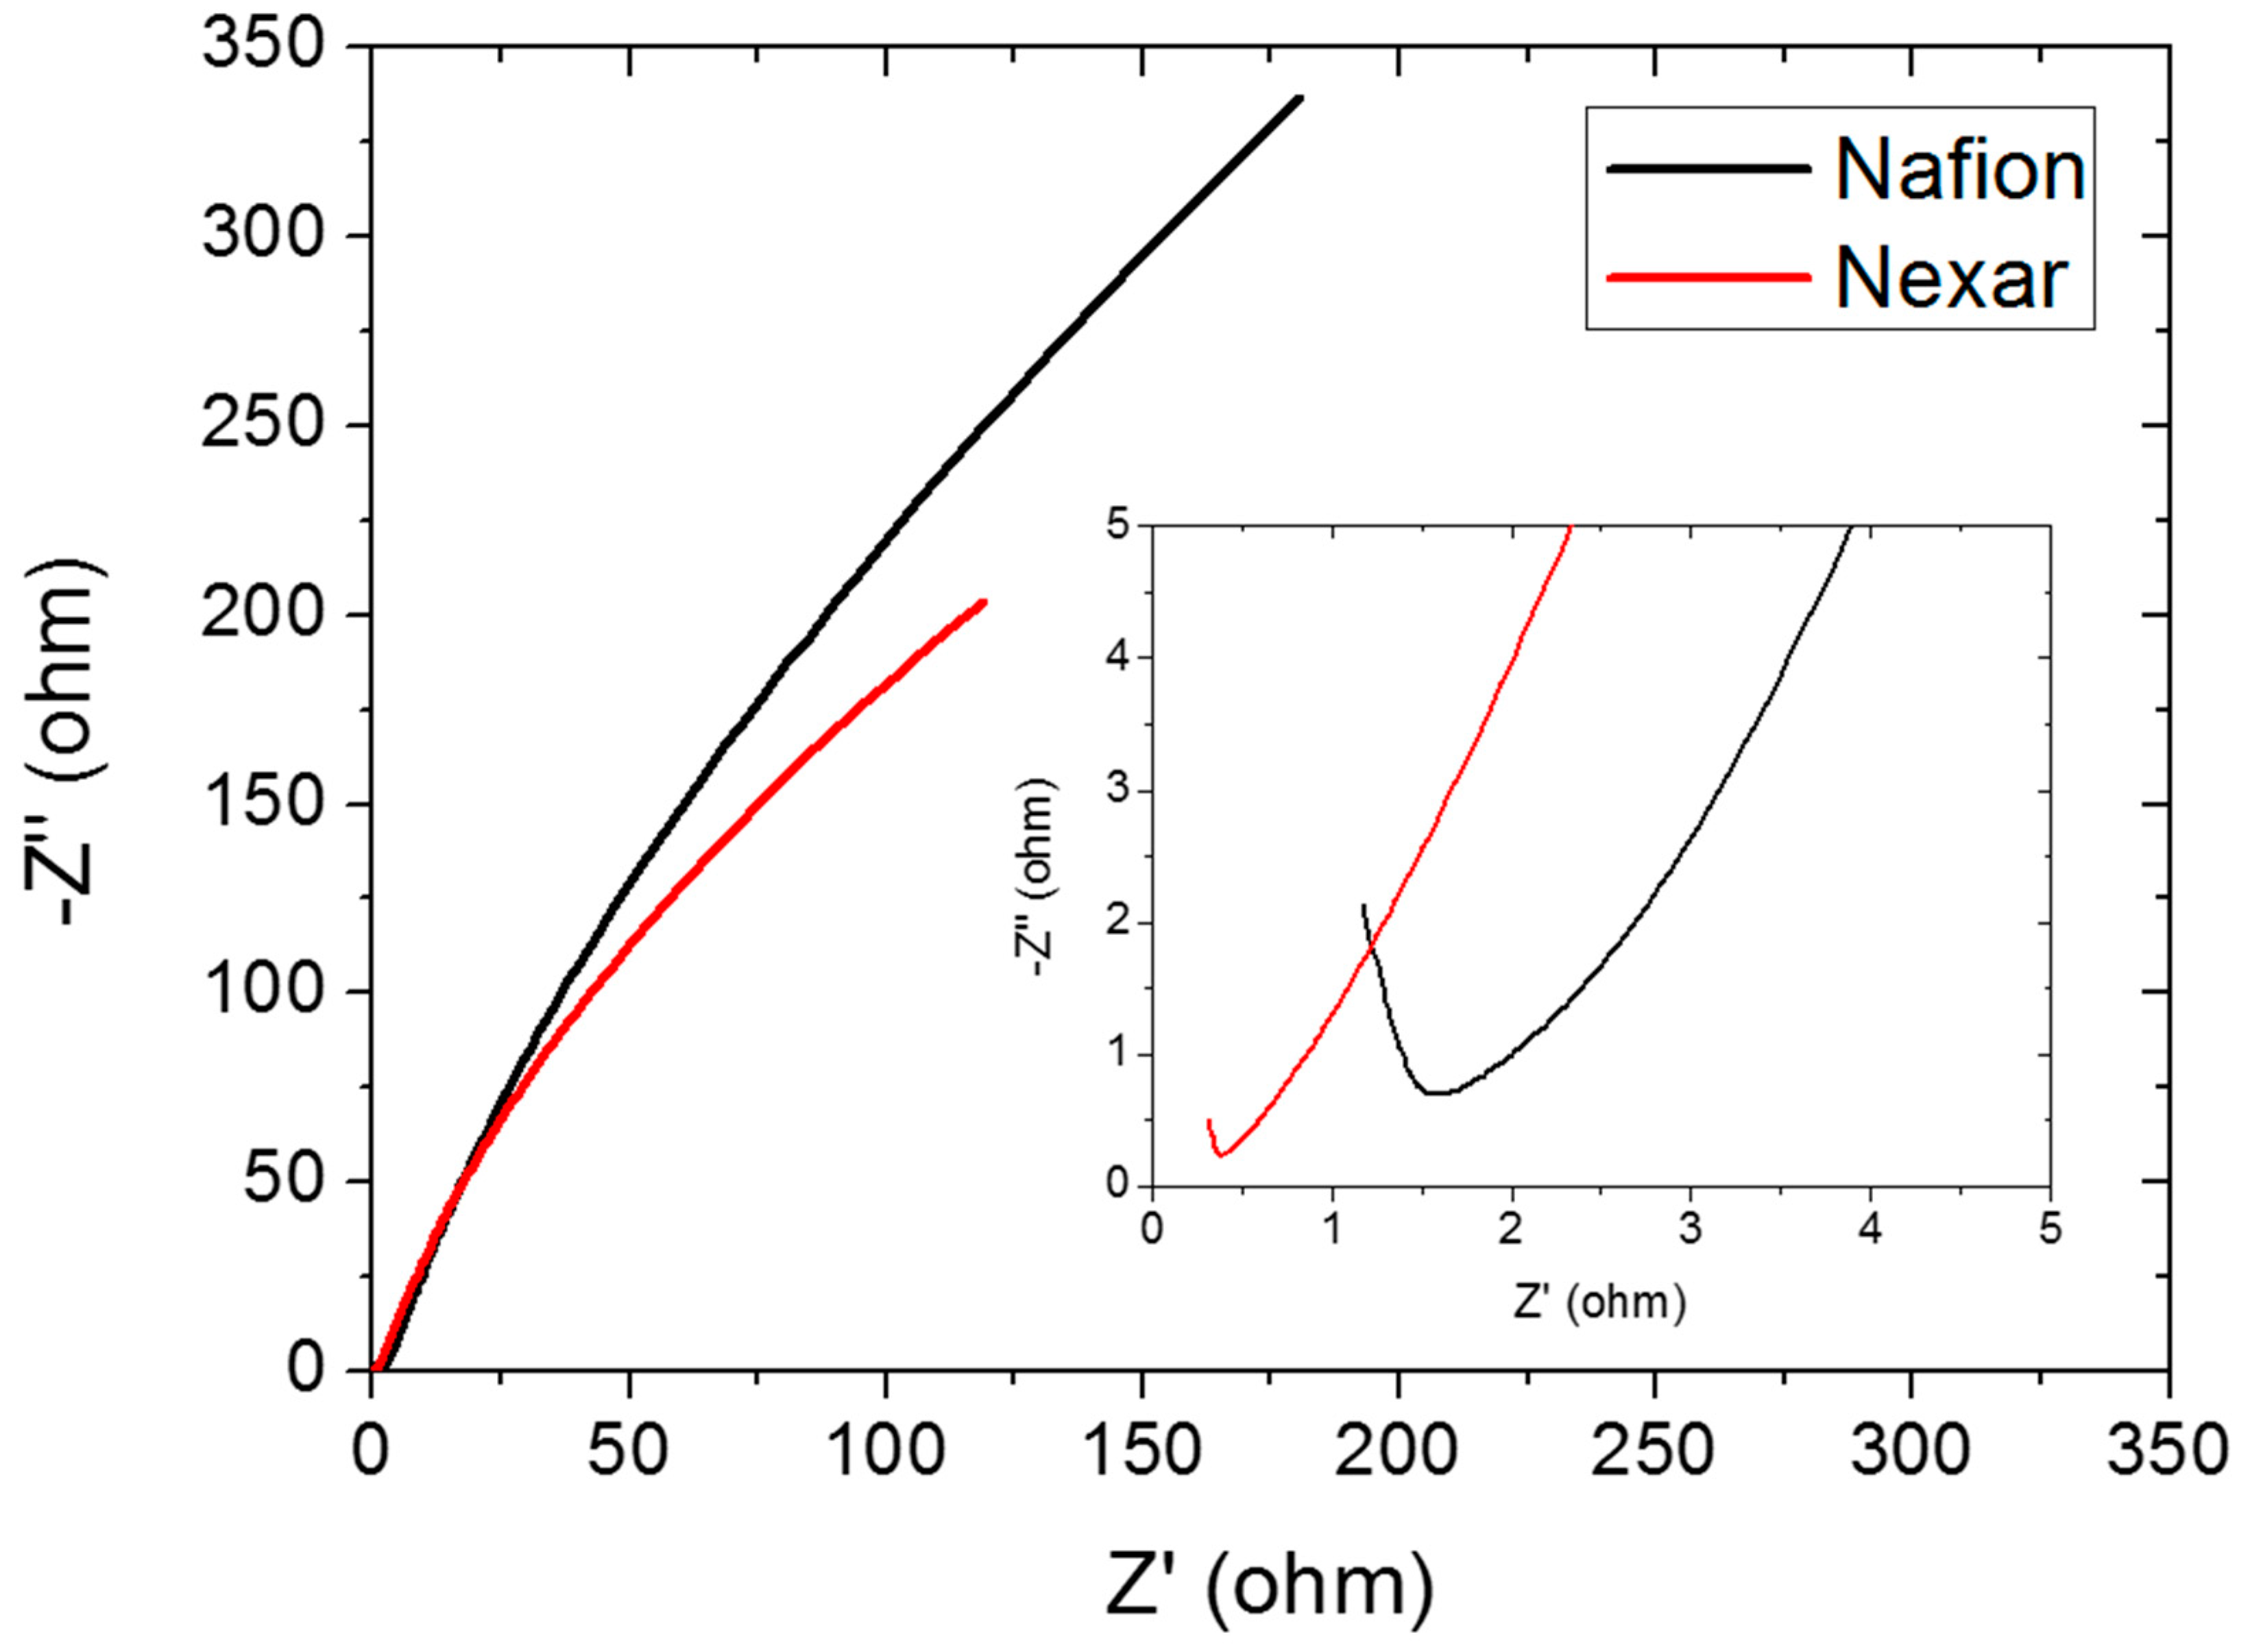
26]. However, in the specific application of water electrolysis cell, protons must be transported from the anode to the cathode through the membrane and, considering that materials like s-PBC can exhibit morphological anisotropy, it is evident how relevant the measurement of the through-plane conductivity is for studying proton exchange membranes. The impedance curves recorded for the Nafion and Nexar membranes are shown in Figure 3 and in the inset, a magnification of the same impedance curves at higher frequencies is reported. Each impedance curve is composed of a contribution at low frequencies (right of the graph) due to the electrode-membrane interfaces and a contribution at high frequencies (left part of the graph) related to the bulk membrane impedance [26]. The onset of the semicircle observed in the magnification of the impedance curves is attributed to the bulk membrane resistance.
Concerning the impedance measurements, we observed that for both Nafion and Nexar it is necessary to repeat the measurement for some minutes in order to achieve stability (improvement of contact between membrane and electrodes). Afterwards, several measurements were performed consecutively for about 1 hour, showing that the Z” vs Z’ curve remained stable with a variability of the calculated R value within ±0.05 Ω for Nafion and Nexar.
Table 2 reports the calculated values of resistance and conductivity for the two membranes for an area of 5 cm2 and considering the thickness value for two extreme conditions: 50 μm for dry membranes or a larger value for wet membranes proportional to the swelling of their thickness after water absorption as calculated in the previous paragraph (54.5 μm and 92 μm, respectively, for Nafion and Nexar).
From the impedance curves recorded at 0 V shown in Figure 3, Nexar™ shows a resistance value lower than for Nafion®, i.e., 0.38 Ω instead of 1.55 Ω, calculated by linear extrapolation of the linear portion of the semicircle at lower frequencies. The calculated conductivities according to Equation (1) are also reported in Table 2. The value for Nafion is in agreement with that reported in the literature in the case of low humidity [27]. Nexar shows higher proton conductivity with respect to Nafion; in particular, it is about four times higher than the value of Nafion for dry membranes and seven times higher for wet membranes, as shown in Table 2. This is fundamental in explaining the improved performance of Nexar with respect to Nafion in the cell, as shown in the last section of the paper. It is mandatory to underline that these values are obtained for membranes without activation processes and for low humidity content, so higher values can be expected in the case of fully hydrated membranes.
The differences observed at low frequencies between the two polymers may depend on their superficial morphologies (flat or disordered surfaces) and the surface hydrophilicity, which affect the electrical contact between the electrodes and the membranes. In particular, at very low frequencies, the impedance curve for Nexar shows a smaller slope with respect to Nafion, i.e., the Nexar capacity at the interfaces is higher than the Nafion one, probably due to a higher amount of water molecules present at the interface between the Nexar surface and the electrodes (at low frequencies the contribution of the bulk material capacitance can be neglected).

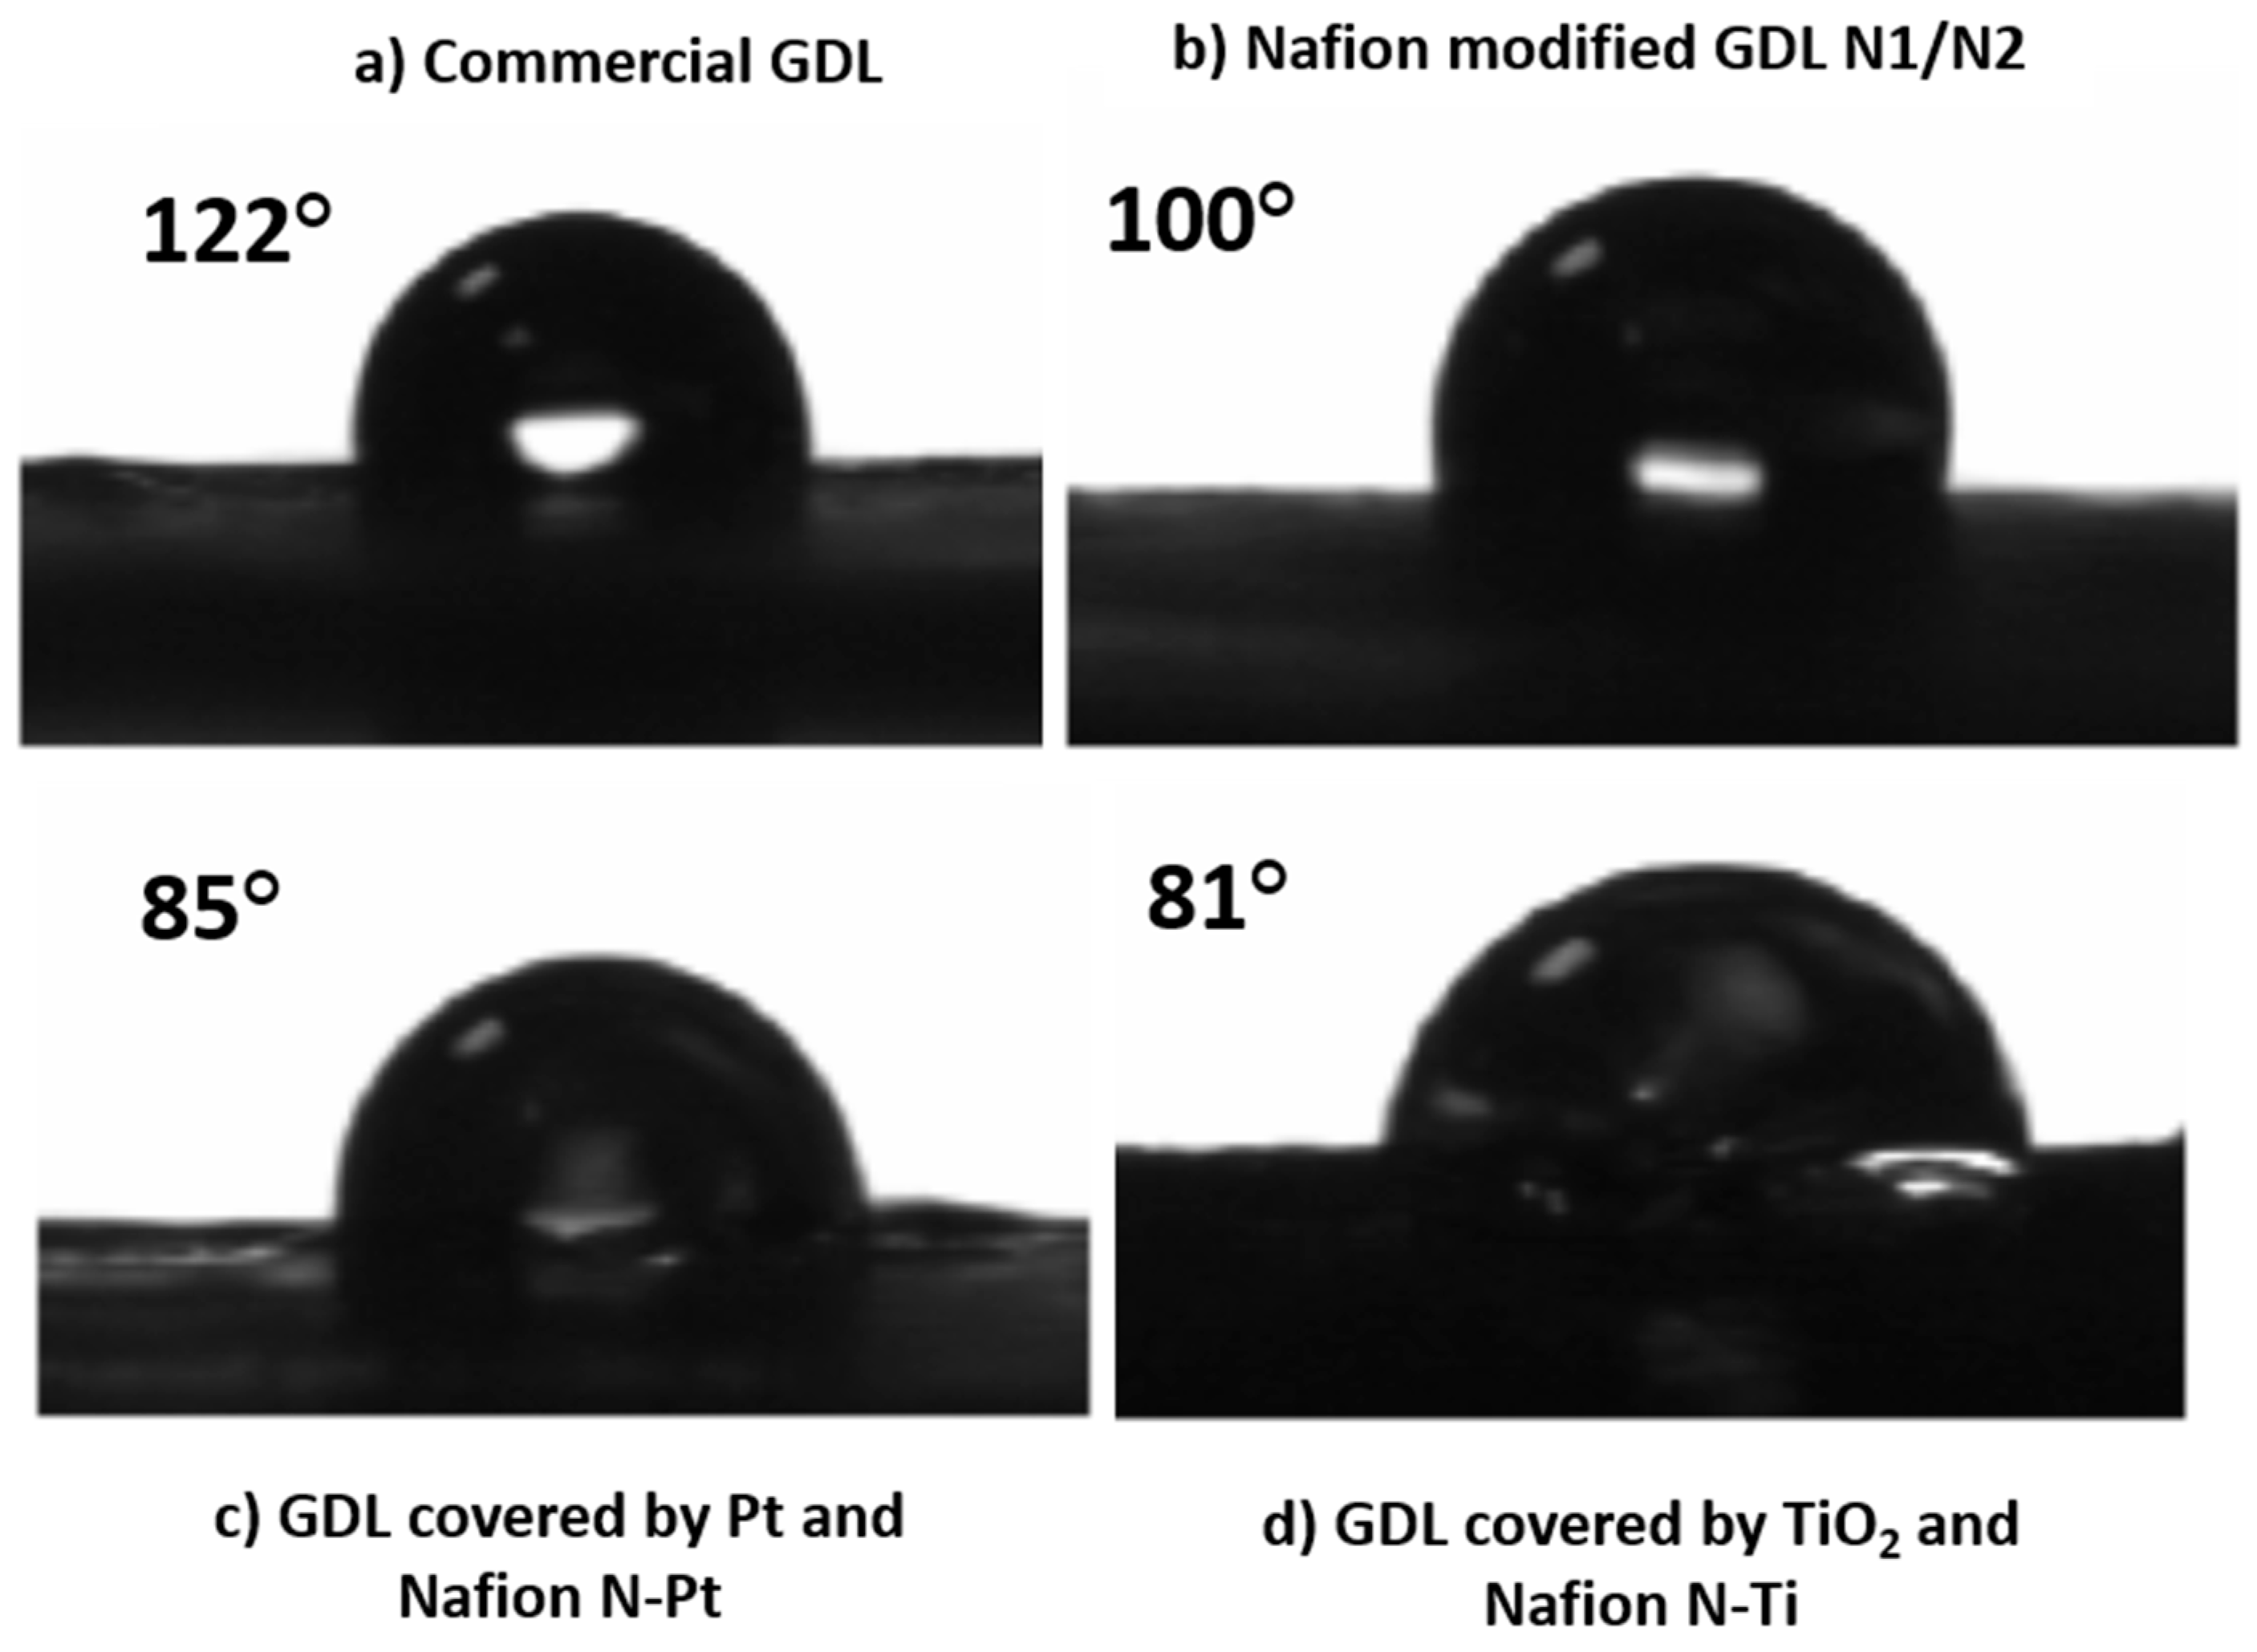
3.3. Modification of GDLs
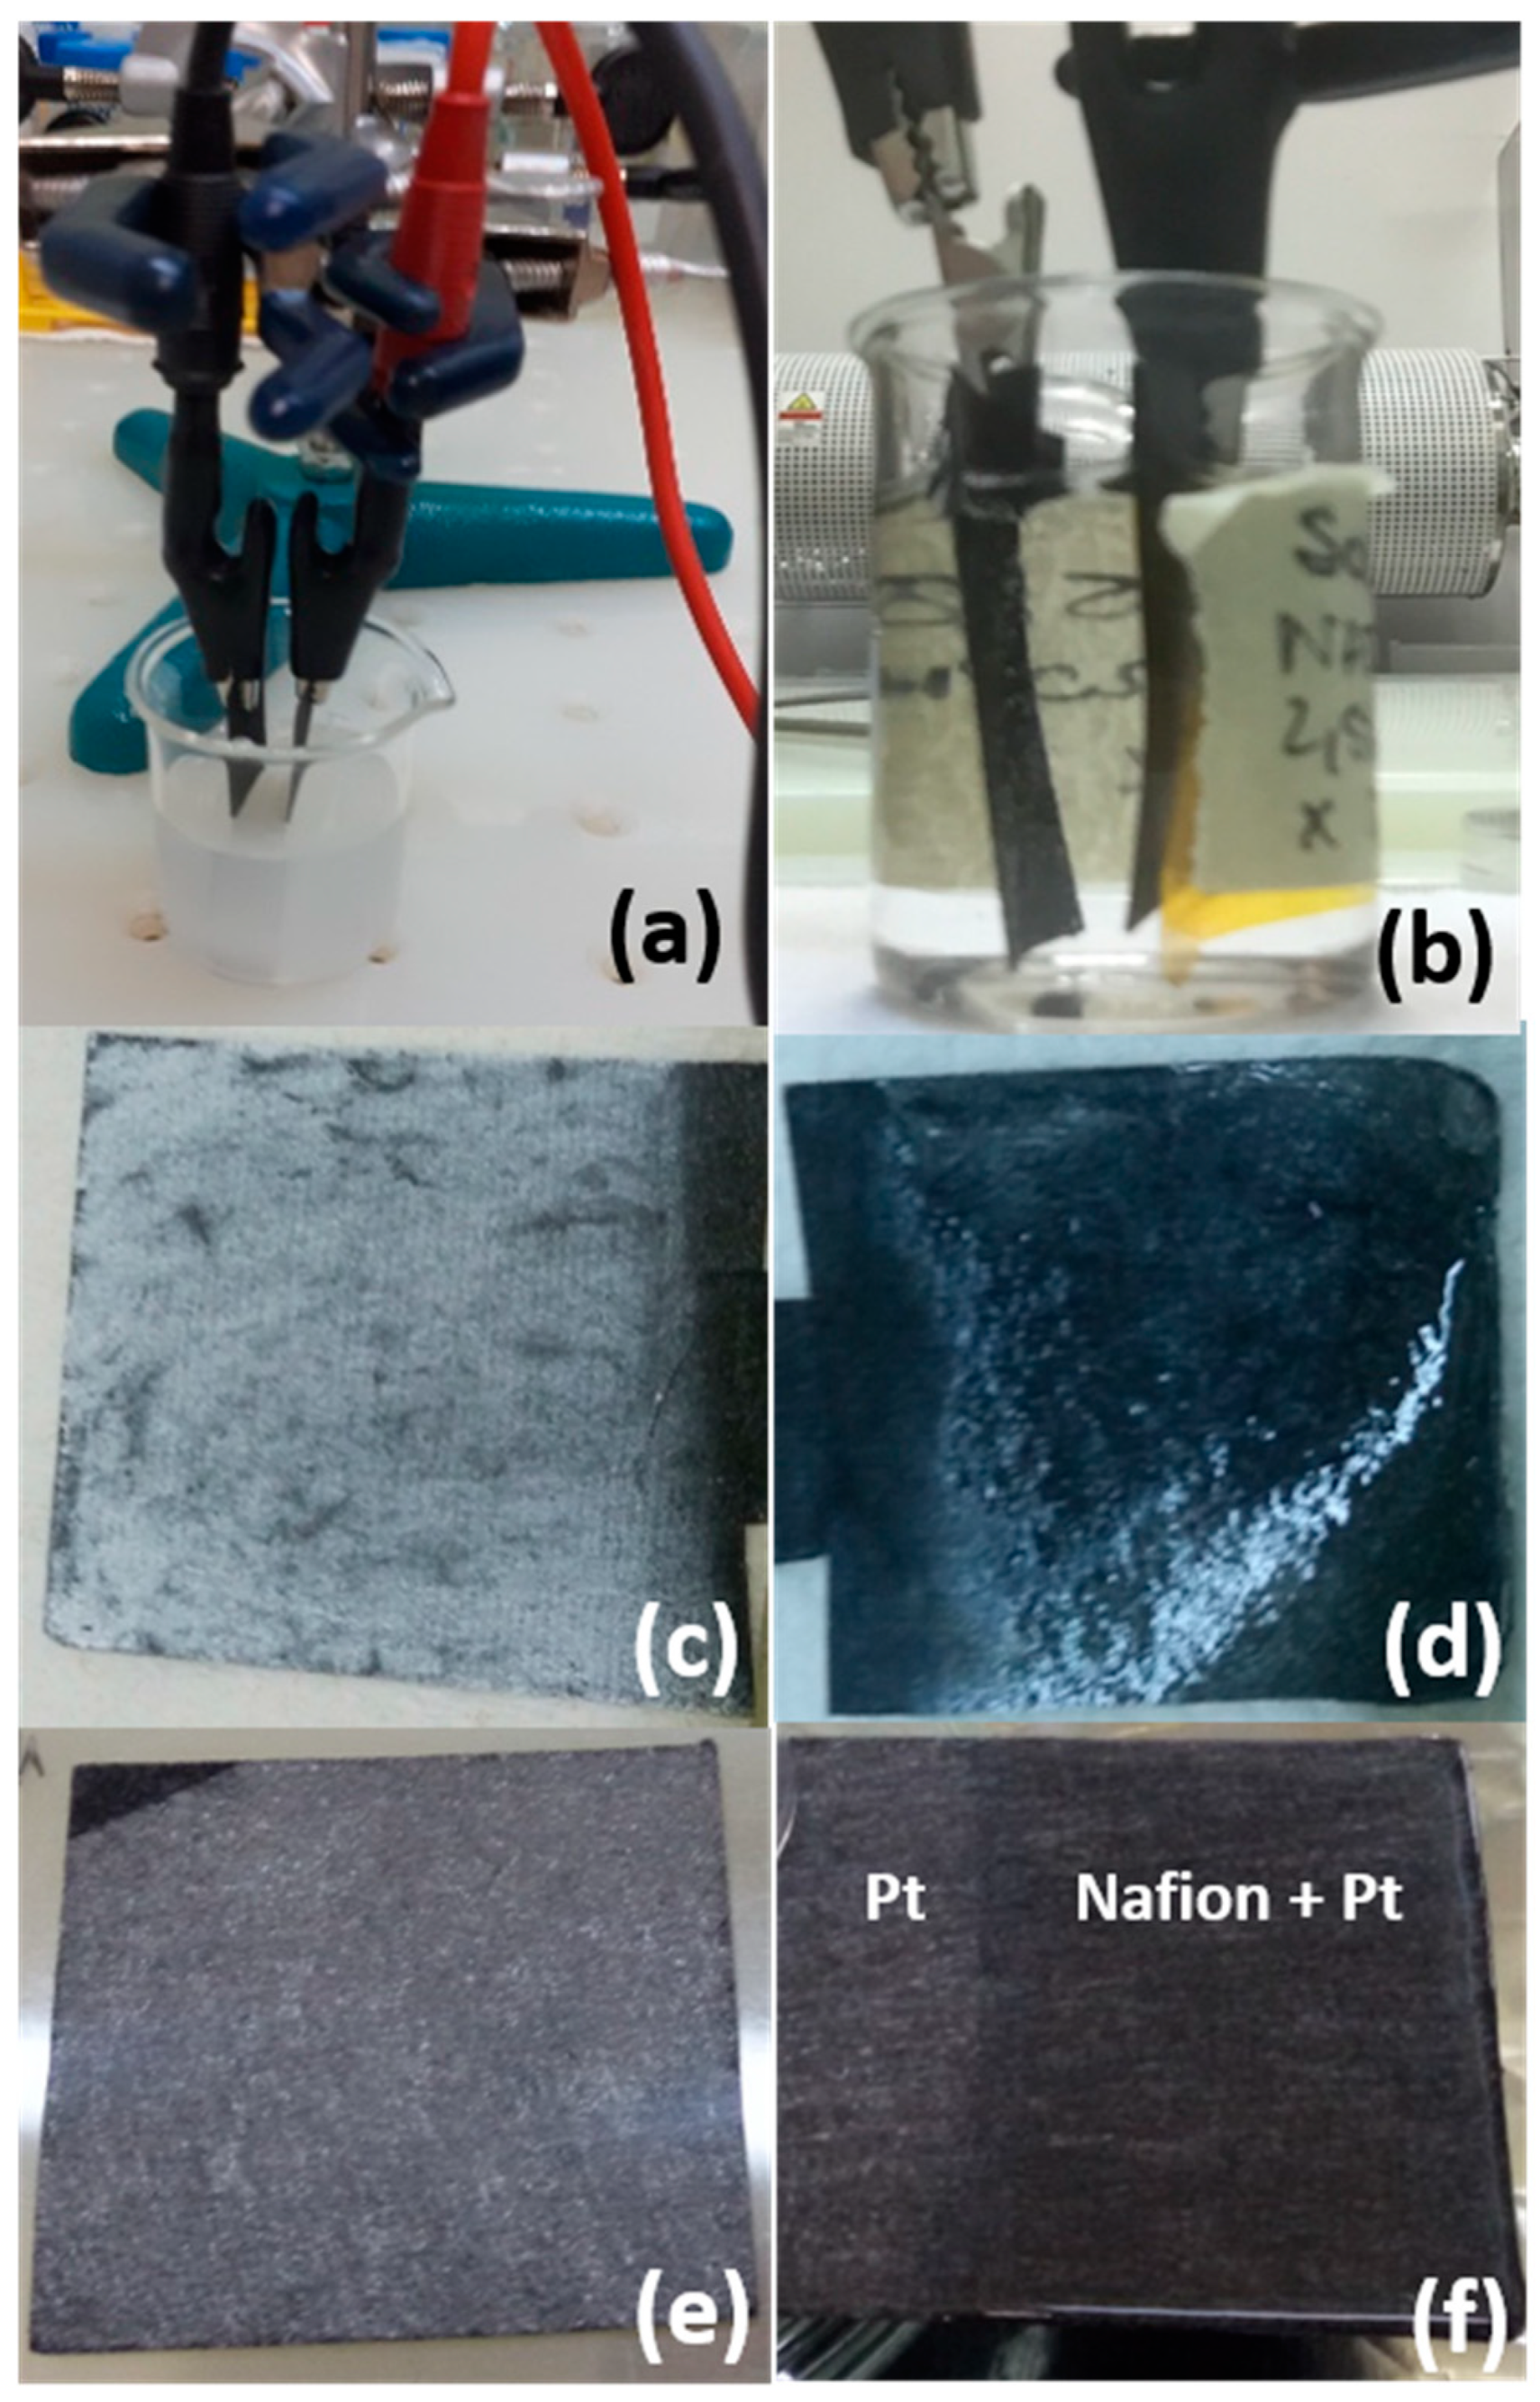
In Figure 4a–d we report the photos showing the electrophoretic depositions of TiO2 nanoparticles in ethanol (a) and Nafion solution (b) and the GDLs covered by TiO2 (c) and, afterwards, by Nafion (d).
Pt was deposited by sputtering with a nominal thickness of 40 nm. The photos of the GDLs covered by Pt after the sputtering process and the same covered by Nafion after the electrophoretic deposition are reported in Figure 4e,f. The weight of the GDLs was measured before and after the deposition, in order to get an estimation of the weight of the different materials (Pt, TiO2, Nafion) deposited per unit area (mg/cm2). The amount of deposited catalysts and Nafion layers in mg/cm2 for the modified GDLs used in this study are reported in Table 3: GDLs covered only by Nafion are referred as N1 and N2, while those containing titanium dioxide or Pt and Nafion are called N-Ti and N-Pt, respectively. As shown in the table, within the same experimental conditions, the deposition of the polymeric films on different substrates is quite reproducible.
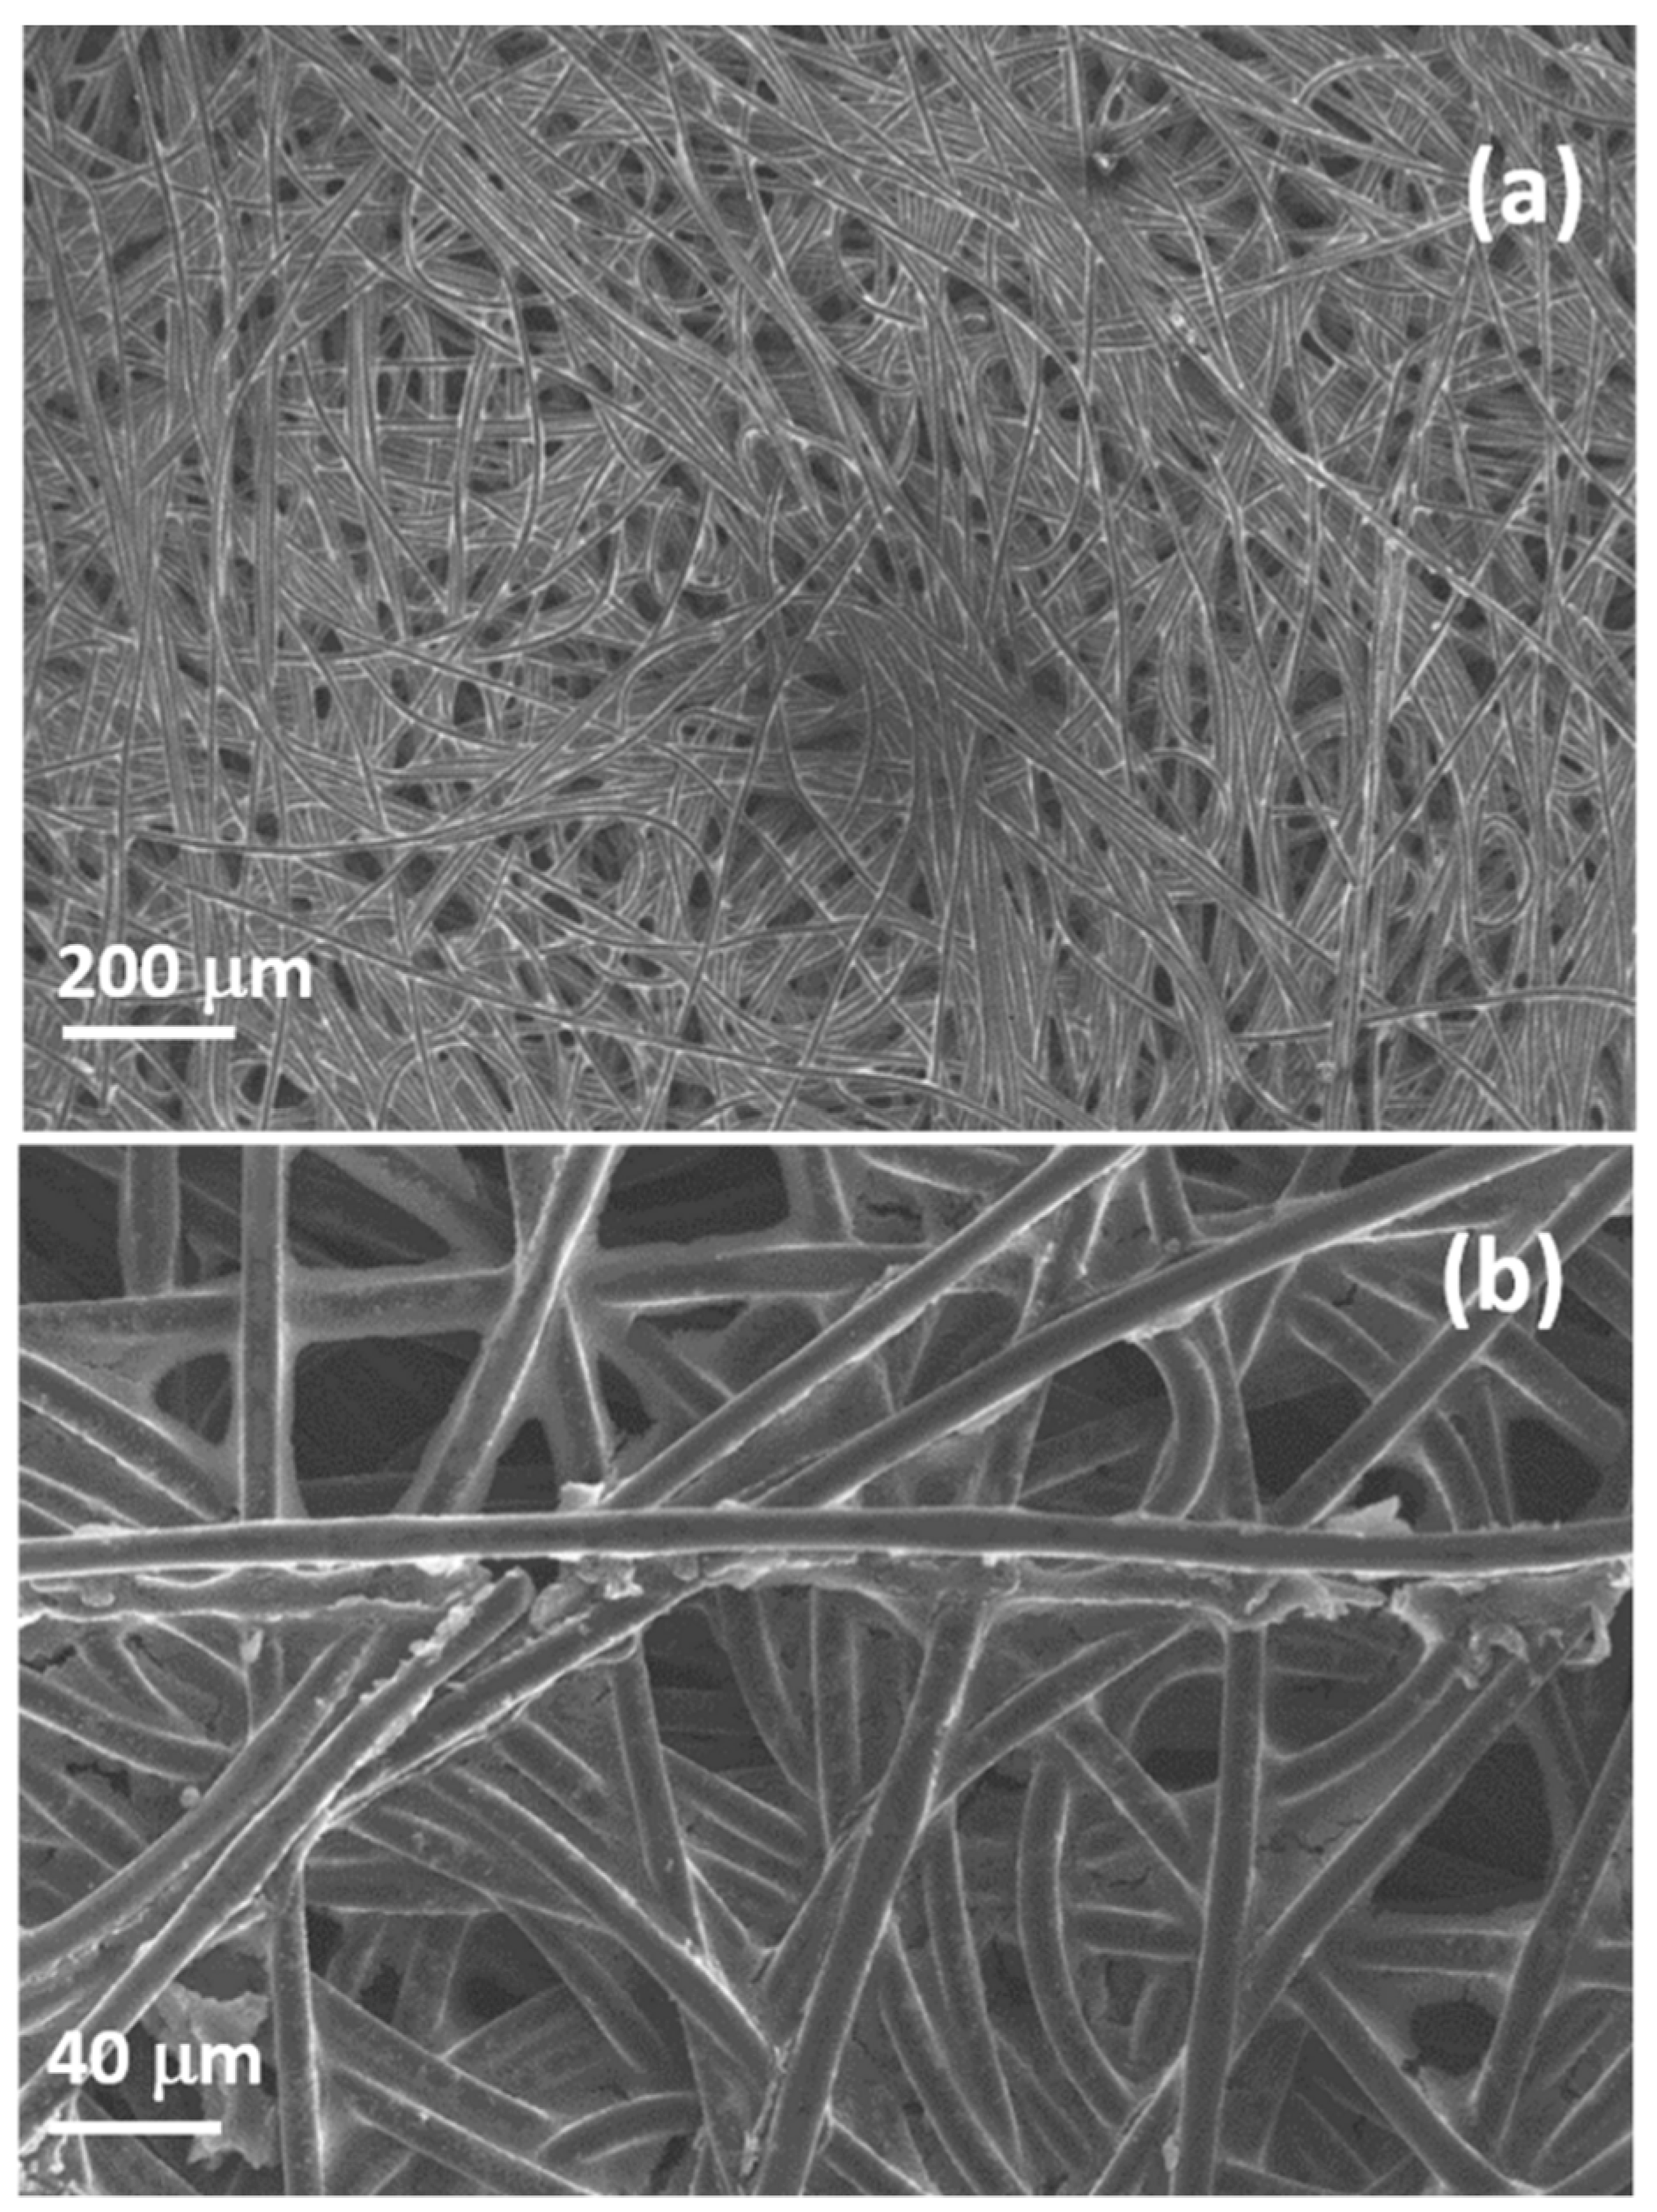
Commercial GDL is formed by carbon fibers of diameters randomly distributed around 10 µm, forming a porous structure. The fibers are prevalently composed of carbon with a small amount of fluorine due to PTFE that is added during production to increase their hydrophobicity. The morphology and composition are confirmed by SEM and EDX characterization reported in Figure 5 and Figure S2 of the Supporting Information, respectively.
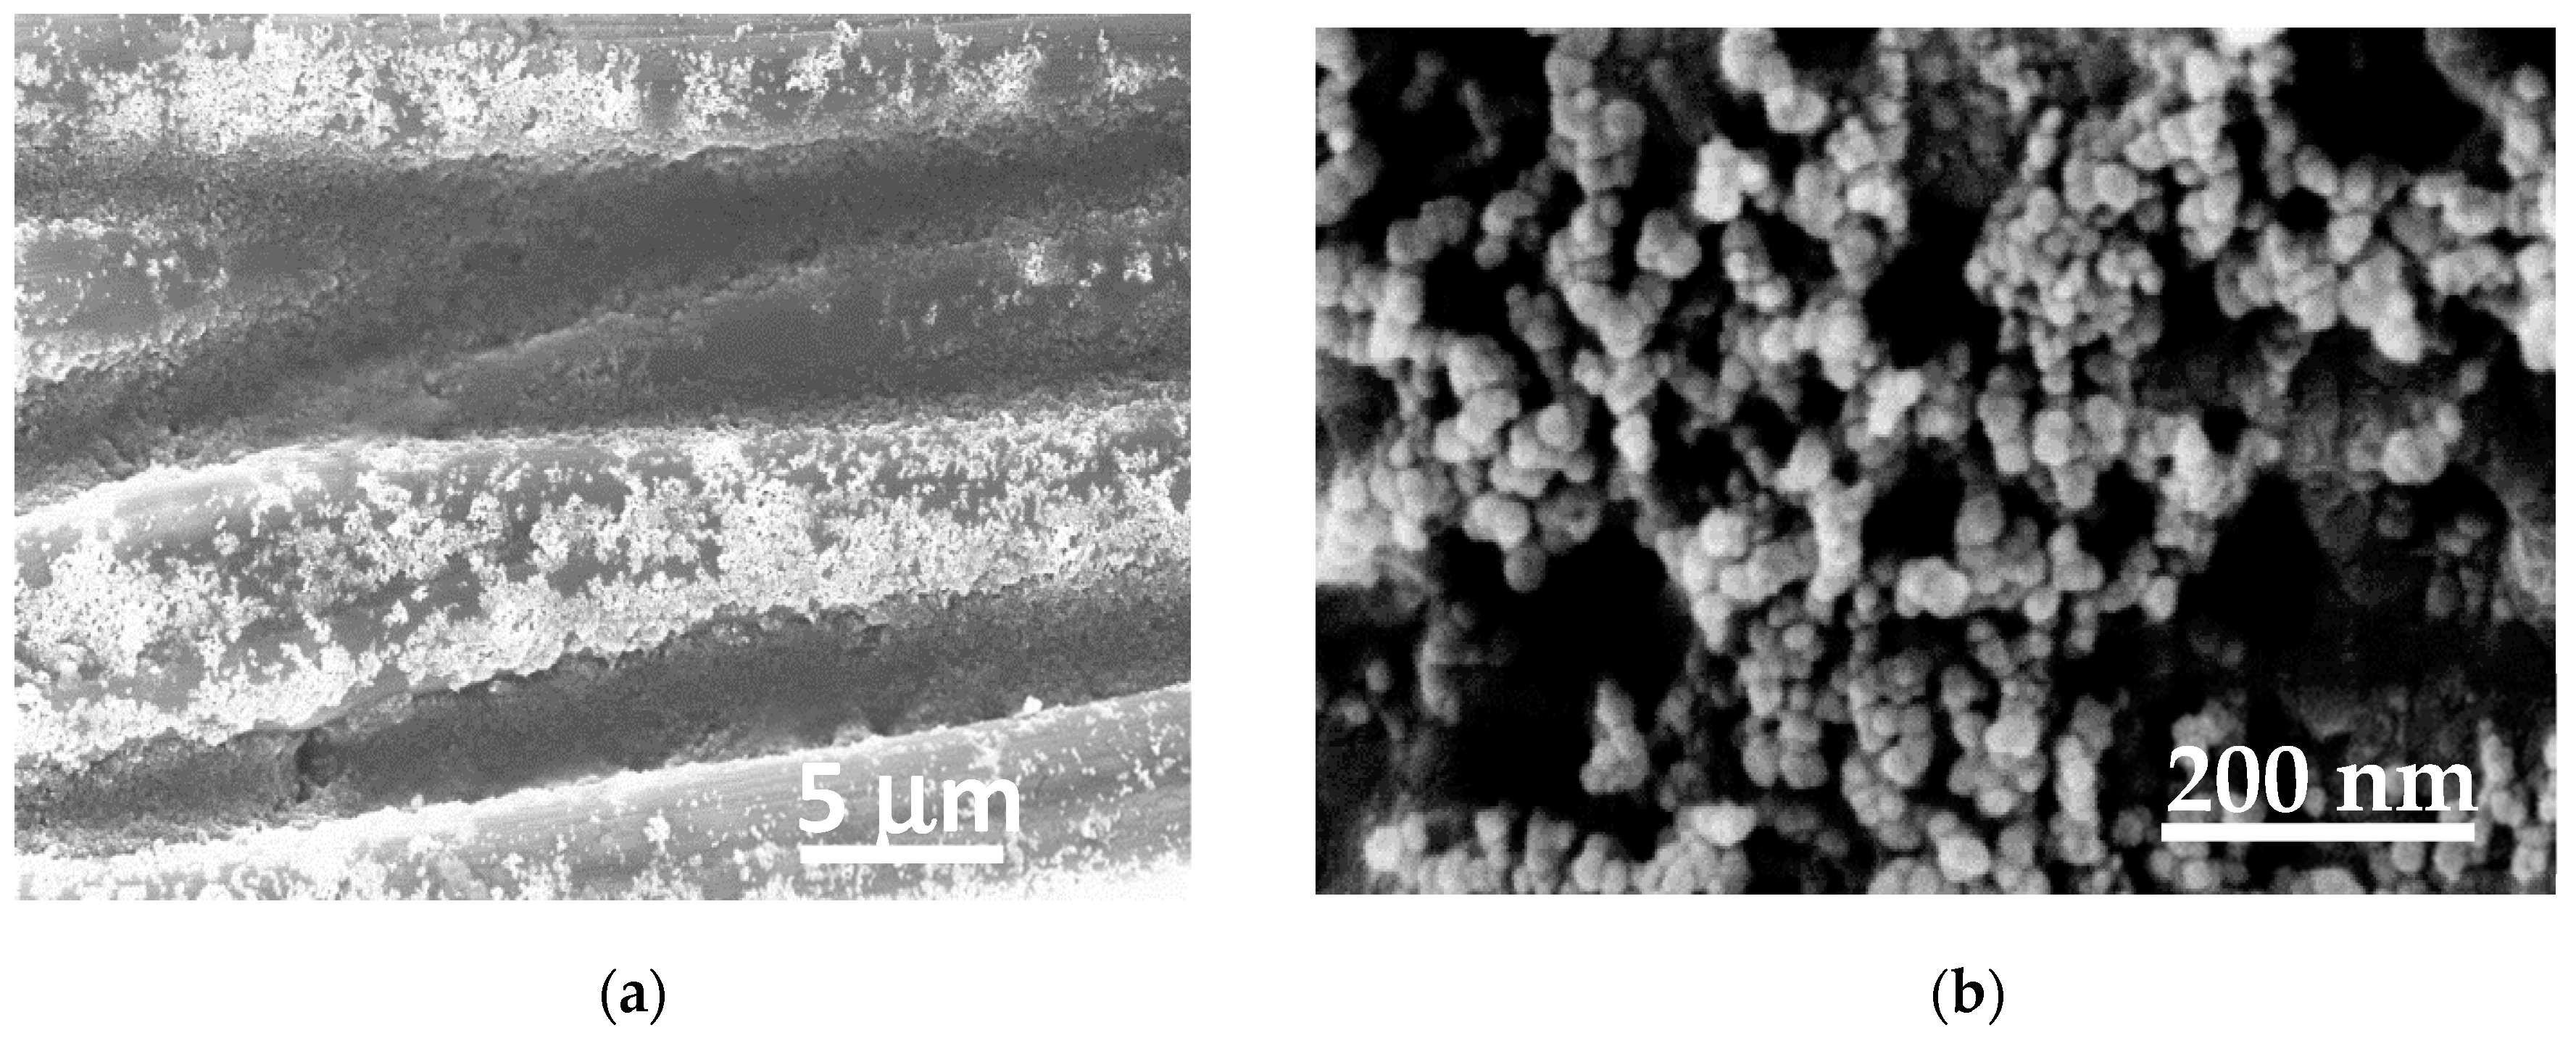
The GDL used on the cathodic HER side was modified by sputtering deposition of a Pt layer. Figure 6 shows SEM images (at different magnifications) of the carbon fibers covered by a Pt layer formed by nanoparticles tens of nanometers in diameter.
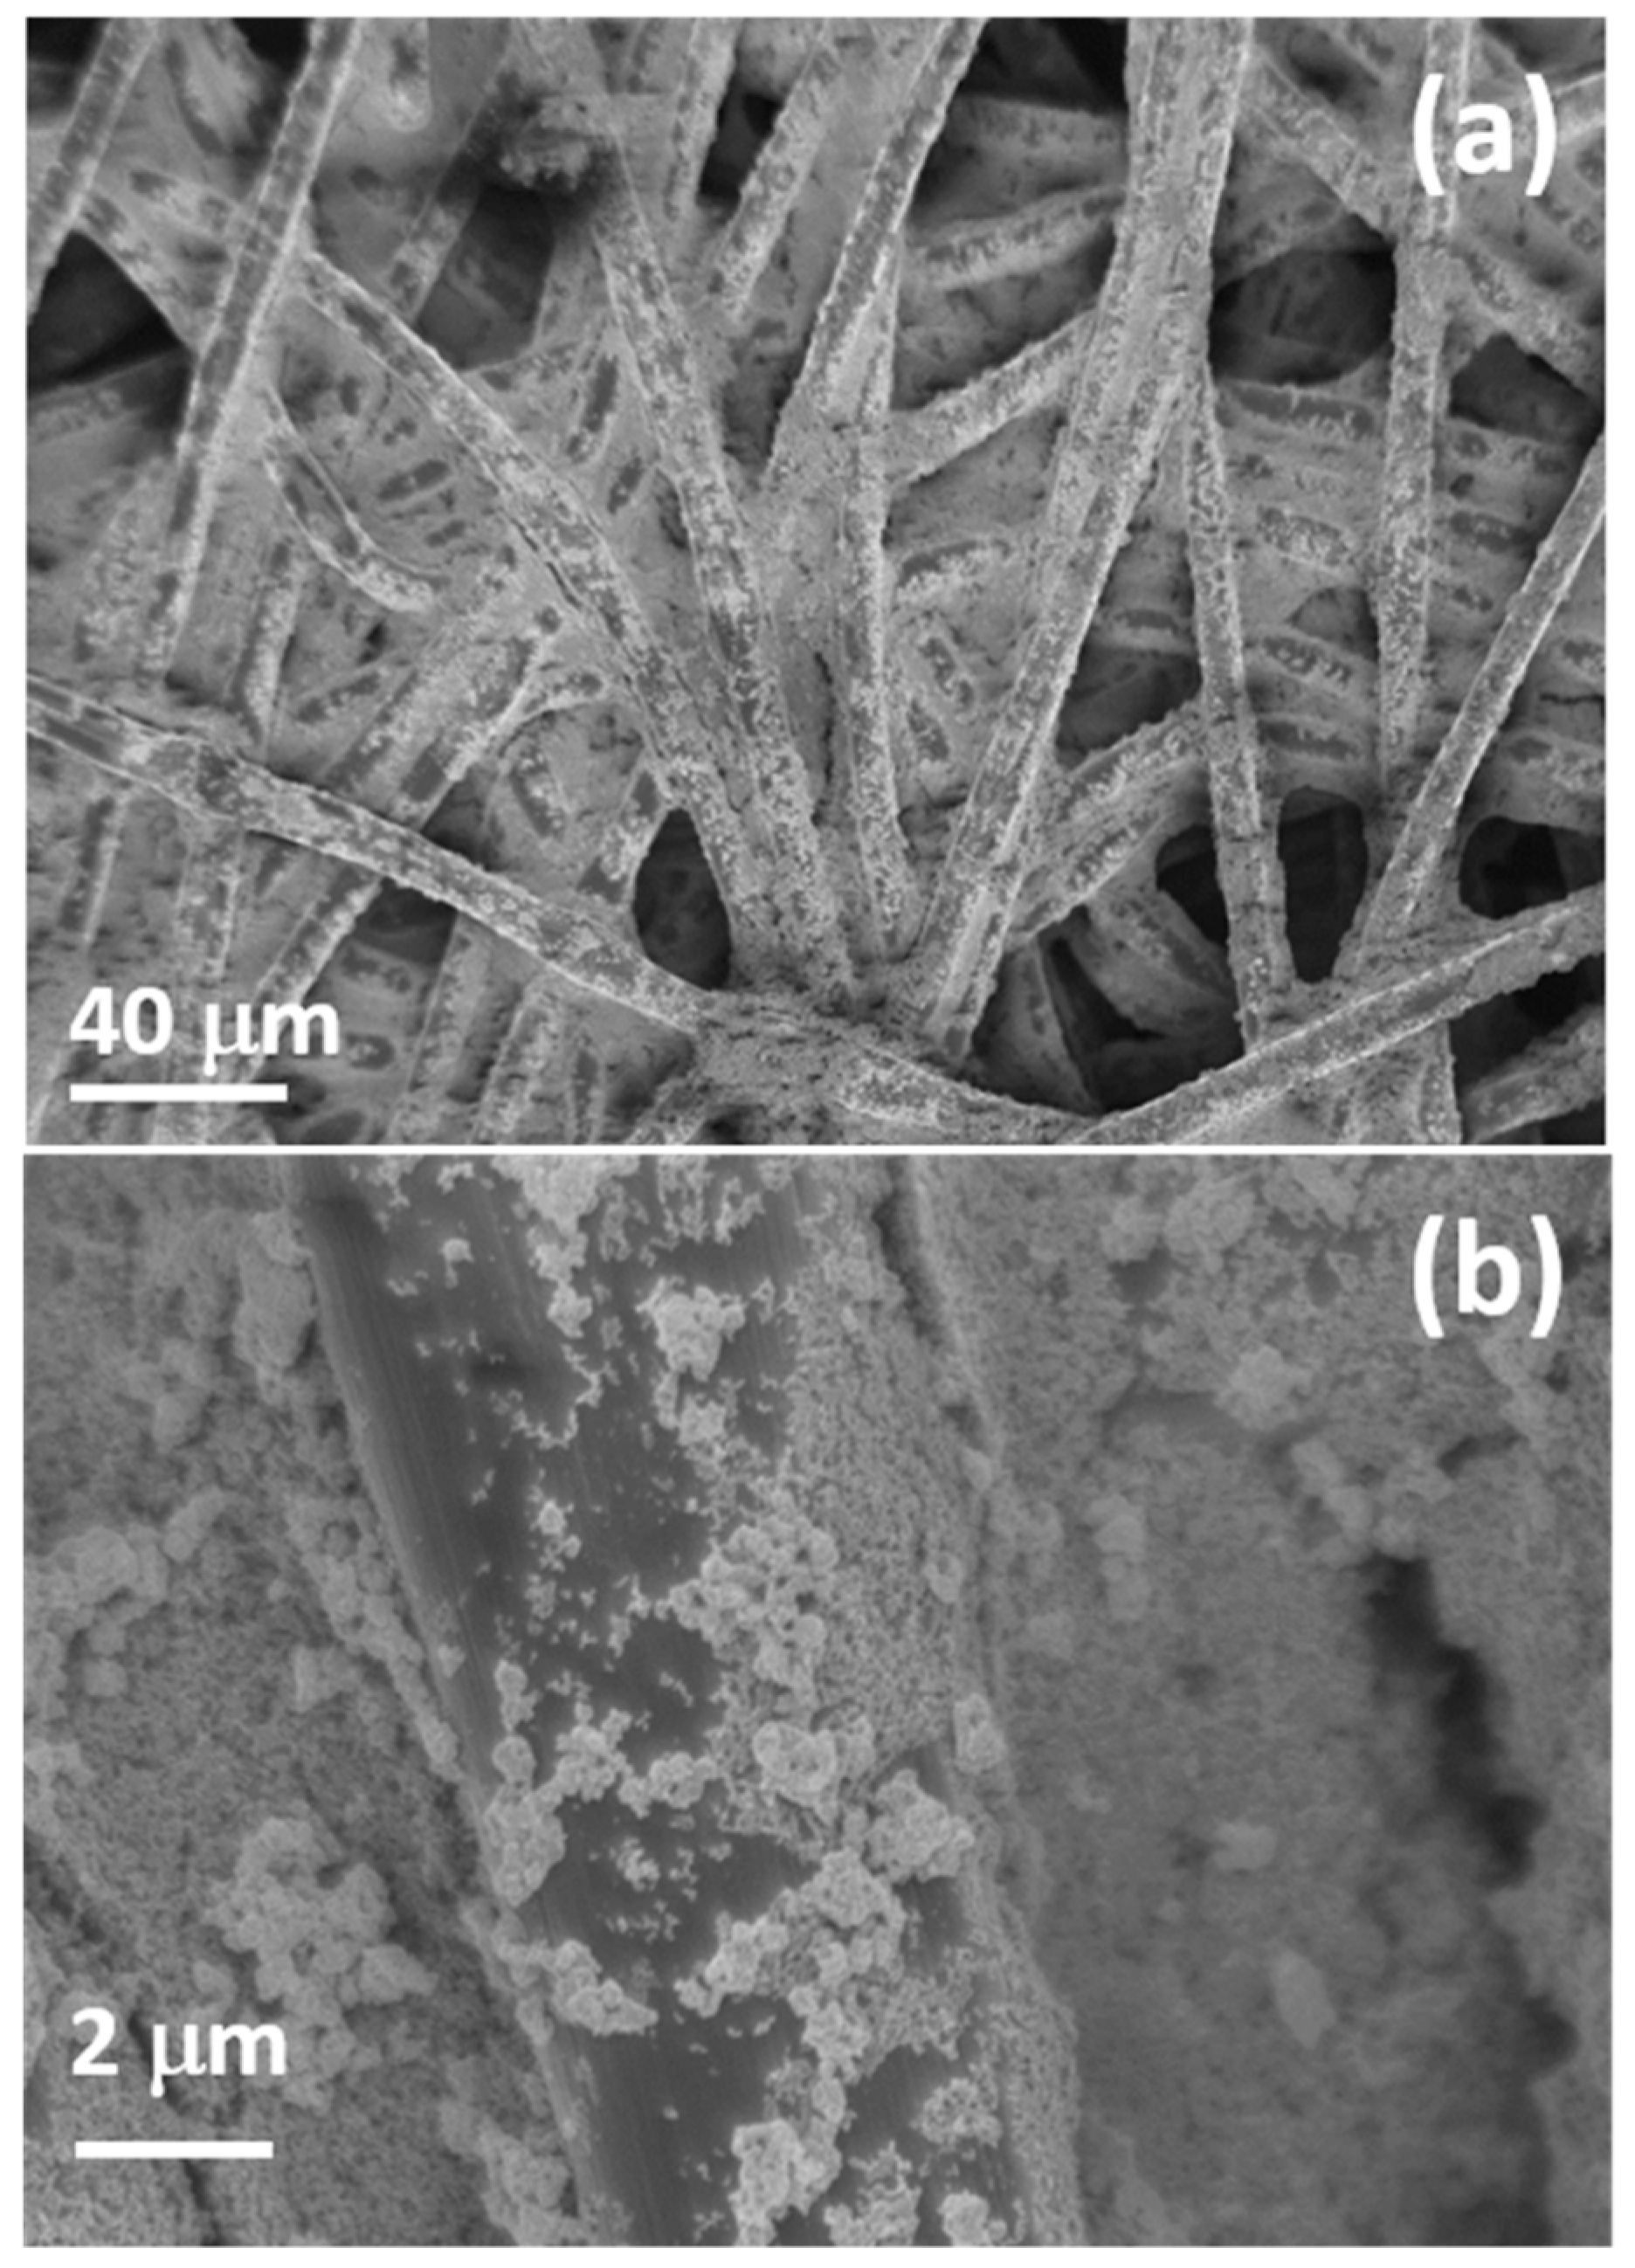
On the GDL used for the OER side, TiO2 nanoparticles were deposited by electrophoretic deposition (EPD).
Figure 7 shows SEM images of the GDL fibers homogeneously covered by a layer of titanium dioxide nanoparticles, as confirmed by the EDX elemental maps (not shown here).
After a water splitting test (see Figure S3), damage of the fibers was observed, also confirmed by the acquisition of elemental maps, maybe due to local increase of current during the electrochemical process. To avoid catalyst layer damage, which strongly affects the efficiency of the water splitting cell, both the cathode and the anode GDLs were covered by a thin polymeric layer.
The EPD process was used for the deposition of the polymeric layers coating the Pt and titanium dioxide nanoparticles. In this case, the EPD is a simpler, more tunable, and lower cost method for polymer deposition than other methods (e.g., electrospray). According to the parameters reported in the experimental section, a Nafion layer was deposited on GDLs on the side precovered by Pt or titanium dioxide nanoparticles to protect them and the fibers during the water splitting reaction. Moreover, in this way, we increase the hydrophilicity of the GDL surface (as shown in the next section), allowing a better electrical contact and adaptation between membrane and GDL. A smooth homogeneous layer covering the fibers is then achieved, as shown by SEM analysis.
In Figure 8, we report a SEM image obtained on a GDL after TiO2 and Nafion deposition. The elemental maps were also acquired, confirming the presence of the catalysts, while the presence of sulfur confirmed the deposition of the Nafion layer. In Figure S4 of the Supporting Information, we report a SEM image and the corresponding chemical maps of GDL covered by Nafion and TiO2, showing a hole in the Nafion layer and allowing us to acquire the EDX signals of Ti and O alongside the other elements present on the modified GDL: C, F, S.
In Figure S5, we report a SEM image of the Pt-containing GDL after Nafion deposition and the EDX analysis acquired on the same region, showing the presence of C, F, Pt, O, and S. It is worth mentioning that the presence of the Nafion protective layer allowed us to avoid any damage of the material or detachment of the catalyst during the electrolytic process in the water electrolysis cell.
Currently, catalyst loadings for the cathode side usually range between 0.5–1 mg/cm2 [11]. It is important to underline that, in this work, we have tested very low catalytic loadings (i.e., 0.03 mg/cm2 for Pt) with respect to the literature. For TiO2 nanoparticles, we used the minimum amount (i.e., 0.11 mg/cm2) sufficient to observe an effect on the current produced in the water electrolysis test.

3.4. Contact Angle Measurements on GDLs

The change from hydrophobic to hydrophilic behavior of the GDL surface after the deposition of Pt, TiO2, and Nafion layers was confirmed by contact angle measurements. Figure 9 reports the optical images of contact angle measurements for commercial and modified GDLs. The measured angle decreases from a value of 122° for commercial GDL (Figure 9a) to 100° for Nafion-modified GDL (Figure 9b). This value is lower for GDLs covered by a Nafion layer in the presence of Pt and TiO2: in particular, it is 85° for the one precovered by the Pt layer and it is 81° for the one precovered by the titanium dioxide nanoparticles. These measurements confirmed the initial hypothesis: Nafion layers increase the GDL surface hydrophilicity and this effect is enhanced in the presence of both Pt and TiO2 nanoparticles. The higher hydrophilicity will positively affect the cell performance, as shown in the last paragraph.

3.5. Water Electrolysis Cell Test

The electrochemical tests of different GDL/membrane/GDL configurations were performed using a home-made cell, as reported in Figure 10, where we can insert, exchange, and test GDLs and membranes easily.
The membranes were sandwiched between two as-received or modified GDLs and the sandwich was put in contact with a Ni foam on the anode side and another one on the cathode side in such a way that the produced gases flow through them. The current is collected by two copper stripes that work as electrodes. The anode and cathode electrodes are insulated by a Kapton foil (orange films in the image). All the components are kept together by two PLA blocks joined by screws; in each block, a 2 cm × 2 cm square-shaped hole allows the produced gases to flow outside.
The current–voltage measurements have been performed varying the applied potential from 0 to 3 V. The experiments were performed at room temperature and under ambient light. Both the anode and cathode electroactive areas were 7 cm2.
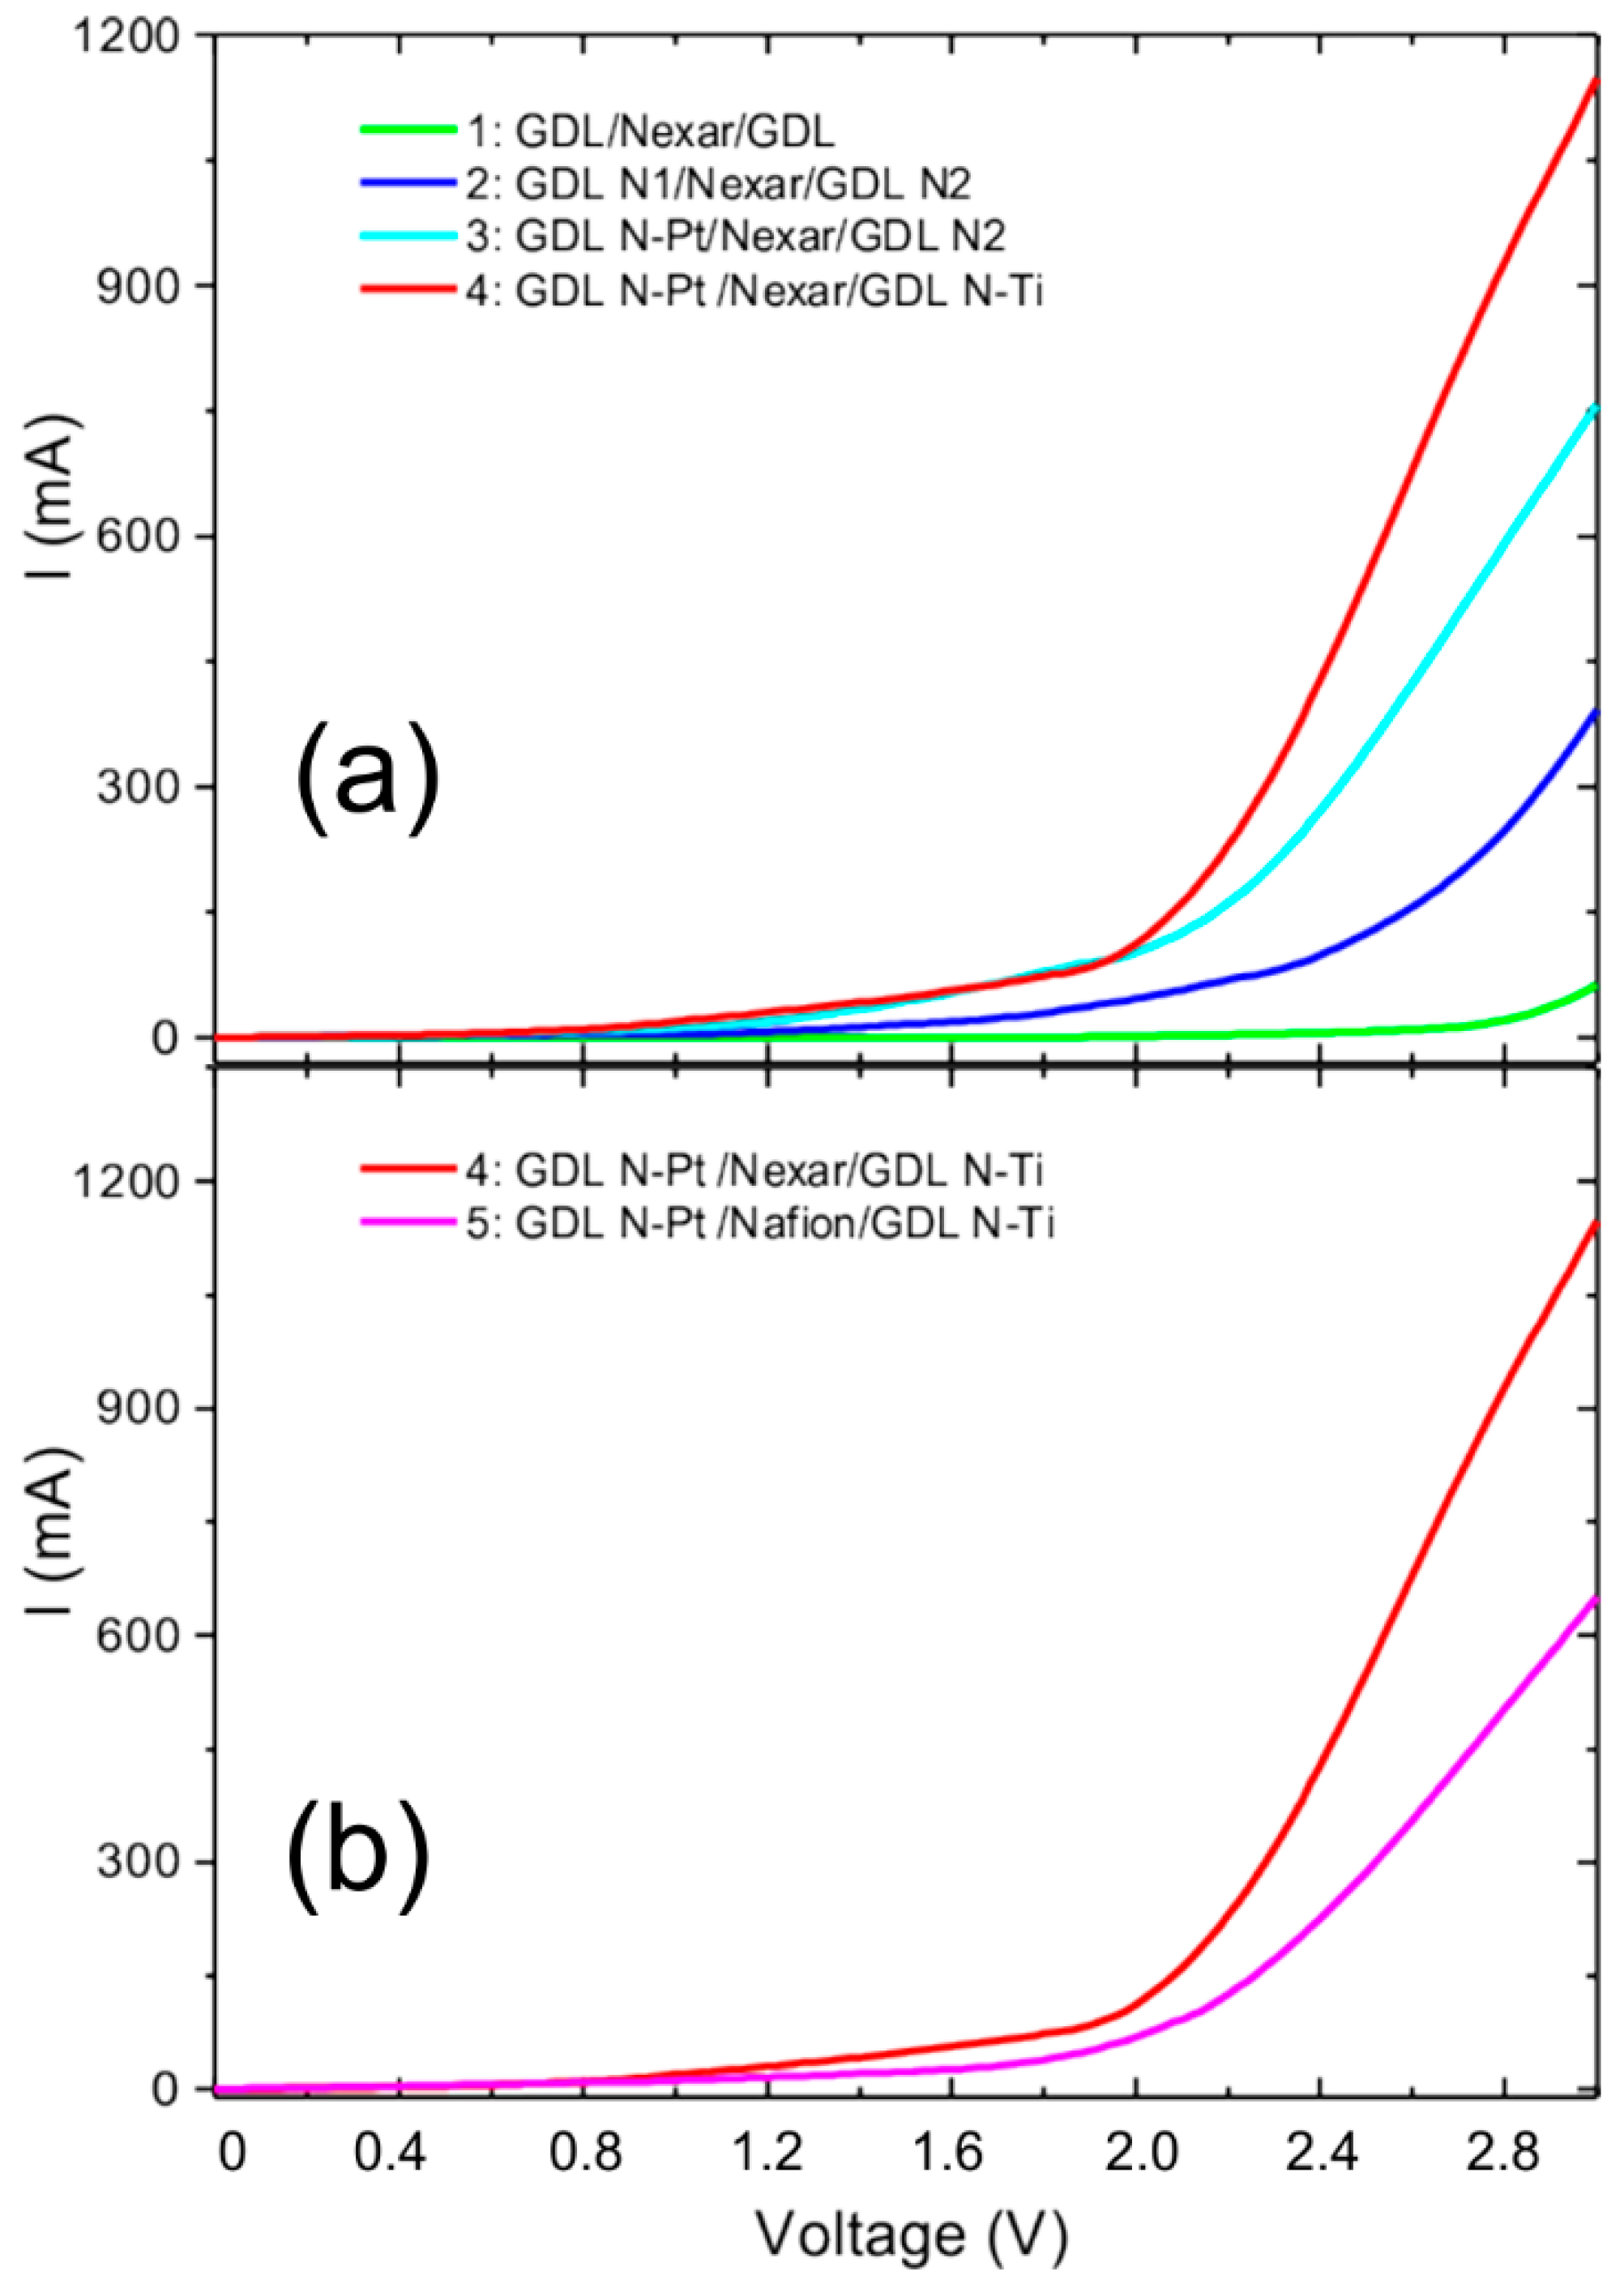
Figure 11 reports the I–V curves resulting from different water splitting tests using the following cell configurations:
1. GDL/Nexar/GDL: Nexar membrane between two unmodified gas diffusion layers.
2. GDL N1/Nexar/GDL N2: Nexar membrane between two gas diffusion layers with the surface covered by a Nafion layer.
3. GDL N-Pt/Nexar/GDL N2: Nexar membrane between modified GDLs. The GDL on the cathode side has been modified by a sputter-deposited Pt layer (0.03 mg/cm2) and then covered by a Nafion layer. The GDL on the anode side was covered only by a Nafion layer.
4. GDL N-Pt /Nexar/GDL N-Ti: Nexar membrane between modified GDLs. The GDL on the cathode side has been modified by a sputter-deposited Pt layer (0.03 mg/cm2) and then covered by a Nafion layer. The GDL on the anode side was modified by depositing TiO2 particles (0.11 mg/cm2) and, afterwards, a Nafion layer.
5. GDL N-Pt /Nafion/GDL N-Ti: Nafion membrane between the two GDLs used in the previous configuration (4).
All the I–V curves were acquired with the wet membranes, equilibrated in deionized water, but without a water flow in the cell during measurement. However, the bottom part of it is kept in deionized water during electrolysis, in order to replace the water consumption due to electrolysis, as reported in [28]. Therefore, there is no liquid water mixed with the produced hydrogen and oxygen gases. The gases form at the interface between the membrane and the Pt- or TiO2-loaded GDLs and then they can flow outside through the porous GDL-Ni foam and the squared holes.
The I–V measurements are performed using the cell assembly described in the “Water electrolysis cell test” Section and shown in Figure 10. In this case, the cell assembly can affect (reduce) the measured current, since there are several interface resistances (membrane-GDL-Ni foam-Cu electrode-external electrical wiring) that can cause voltage drops. Therefore, the measured current is an underestimation of the value that could be reached in an optimized (from the electrical wiring point of view) cell. The main factor affecting the measurements is the degradation of the GDL during operation. We have observed that while the GDLs are in good condition, the measurements are perfectly reproducible. As soon as the GDLs deteriorate (on the OER side by oxidation and on the HER side by Pt loss), the current drops. A large improvement on the durability of GDLs was achieved by covering the GDLs with a thin Nafion layer and adding TiO2 on the OER side. We have repeated the measurements for the different configurations as a function of time and observed that for bare GDLs, the measured current decreases with consecutive tests immediately. This is due to damages induced on both the HER side (Pt detachment) and the OER side (oxidation of carbon fibers) already after two tests. On the contrary, GDLs covered with thin Nafion layers and, on the OER side, with TiO2 nanoparticles maintained their efficiency for several (more than 20) consecutive tests and no variation of their weights was observed (no Pt, TiO2, or polymer layer detachment).
We have reported the tests made with the minimum amount of Pt and TiO2 sufficient to give a significant effect. It is possible to increase the amount of Pt to improve the catalytic effect, but it has to be noted that an excess of Pt deposited by sputtering will create a compact layer, with smaller efficiency due to lower surface/volume ratio. Similarly, the total amount of TiO2 particles can be increased, but we have observed that for a TiO2 concentration two times higher than the one reported in this work, a reduction of the total amount of measured current occurred and this effect can be ascribed to a blocking effect of the produced gases by the TiO2 particles, reducing the carbon fiber porosity.
Our results reported in Figure 11a show that covering GDLs with Nafion (configuration 2) allows a large improvement in terms of current (from 60 to 390 mA at 3 V) compared to unmodified GDL (configuration 1). As expected, the addition of Pt (configuration 3), even at very low concentration (0.03 mg/cm2), induces a general increase of the current (up to 760 mA at 3 V), and a lowering of the onset potential.
A further increase of the generated current (up to 1140 mA at 3 V) was obtained by the addition of TiO2 on the GDL on the anode side (configuration 4).
An estimation of the onset of I–V curves reported in Figure 11 can be obtained by considering the intersection point between the tangent at maximum slope of current (linear part at higher voltage) and the background current (linear part at lower voltage). Therefore, we obtain the following results: 2.4 V for configuration 2, 2.2 V for configurations 3, and 2.1 V for the configurations 4 and 5. We also observed a variation of the slope by adding Pt. The addition of TiO2 has a very small effect on the onset of the curve but increases the total measured current significantly, due to the effects discussed above: the TiO2 (in this amount) has the role of increasing the hydrophilicity of the system, favoring the O2 to flow out and retarding the oxidation of carbon fibers. For the measurement performed in the first configuration with bare GDLs, it is not possible to estimate the onset since we do not observe any reaction occurring in the considered voltage range, as expected, due to the absence of catalysts.
An absolute comparison with I–V measurements reported on commercial electrolytic cells cannot be done since the final electrical characteristics strongly depend on the cell’s assembly (electrical connections, contacts, catalyst content on both anode and cathode sides, water flow, etc.). However, in order to simply compare the two membranes, we kept configuration 4, which gave the best performance, and exchanged the Nexar membrane with the Nafion one (configuration 5). The comparison, reported in Figure 11b, shows that Nexar has higher efficiency than Nafion: at 3 V, the measured current is 1140 mA for Nexar and 650 mA for Nafion.

4. Conclusions

In this work, we have focused on two aspects that play fundamental roles in water-splitting electrolytic cell efficiency: the proton exchange membrane and the gas diffusion layers. In particular, the performance of Nexar was compared with the well-known Nafion in the same operational conditions. The higher acidity of Nexar results in a larger water uptake (Table 1) and an increased proton conductivity with respect to Nafion. Furthermore, in this condition of high water uptake, it is easier to maintain the hydration of the system and fuel for the electrochemical reactions is more accessible. This explains why Nexar’s performance is better compared to Nafion in the same working conditions. Another advantage is the lower cost of Nexar with respect to Nafion; a fundamental aspect for practical industrial applications.
Furthermore, we have modified the GDLs by adding the catalysts to them (Pt on the cathode side and TiO2 on the anode) and covering the surface in contact with the membrane with a thin hydrophilic layer of Nafion, protecting the nanoparticles during the operational procedure and to improve the electrical contact with the proton exchange membranes. For this purpose, electrophoretic deposition has been shown to be a simple, reproducible, efficient, and low-cost procedure. An increase of current is observed for GDLs covered by Nafion layers (Figure 11a) with respect to commercial GDLs, and a further increase, as expected, is observed after the addition of Pt on the cathode side. It has to be noticed that the amount of catalysts used in this work for the water splitting tests is much lower than typical values reported in the literature. In particular, the Pt amount used in the present work as HER catalyst is almost one order of magnitude lower than what is normally used in the existing literature. TiO2 has been used on the anode side, and we have shown that even a very small amount can positively affect the water splitting process. The advantages of the use of TiO2 on the OER side are as follows: (1) its ability to increase the hydrophilicity of the GDL (as demonstrated by contact angle measurements in the paper) and (2) to interact with water (breaking H2O bonds), (3) favoring the contact of GDL with the membrane in a wet environment, and (4) the O2 gas flow through the GDL. Finally, (5) the addition of a superficial layer of titanium dioxide can have the role of reducing the oxidation of carbon gas diffusion layers during the cell tests. In fact, we observed an increase of GDL durability after modification with TiO2. All these factors contribute to the better results obtained for configuration 4 containing TiO2 on the GDL (anode side) with respect to configuration 3, as reported in Figure 11.
The materials and preparation methodology presented above are very promising and there are still improvements to be made in both reduction of the electrical contact resistance of the cell and catalyst enrichment of GDLs. Furthermore, we highlight that the materials and processes used in this work meet the industrial need to reduce hydrogen production costs.

Supplementary Materials

The following are available online at https://www.mdpi.com/1996-1073/12/11/2064/s1, Figure S1: FT-IR spectra of Nafion and Nexar polymers ; Figure S2: (a) SEM image of the pristine GDL; (b) C and F chemical maps acquired in the box shown in (a); Figure S3: (a) SEM image of a GDL covered by Pt after water splitting tests and (b) the corresponding C, Pt, and F chemical maps; Figure S4: SEM images of a detail of a GDL covered by TiO2 and Nafion showing one of the rare regions where Nafion was not uniform, leaving uncovered the fibers below. The chemical maps are also reported, Figure S5: SEM image and the chemical maps of a GDL covered by Pt and Nafion.

Author Contributions

Conceptualization, S.S. and S.F.; methodology, S.S., S.F., R.G.M., S.M.S.P.; investigation S.S., S.F., G.U., R.G.M., S.M.S.P.; data analysis: S.F., S.S., R.G.M., S.M.S.P.; Writing—Original Draft preparation, S.F. and S.S.; Writing—Review and Editing, S.S., S.A.L., G.C.; funding acquisition, S.A.L.; resources, S.S., S.M.S.P., S.A.L., G.C.

Funding

The work has been supported by the European Project PECSYS. The project has received funding from the Fuel Cells and Hydrogen 2 Joint Undertaking under grant agreement No 735218. This Joint Undertaking receives support from the European Union’s Horizon 2020 Research and Innovation program and Hydrogen Europe and N.ERGHY.

Acknowledgments

The authors thank S. Di Franco (CNR-IMM) for Pt sputtering deposition, C. Galati and N. Spinella (STMicroelectronics) for contact angle measurements and Daniele D’Angelo for the preliminary work on the electrolytic cell system. Kraton Polymers LLC is acknowledged for providing Nexar polymer.

Conflicts of Interest

The authors declare no conflict of interest.

References

  1. Immerz, C.; Schweins, M.; Trinke, P.; Bensmann, B.; Paidar, M.; Bystron, T.; Bouzek, K.; Hanke-Rauschenbach, R. Experimental Characterization of Inhomogeneity in Current Density and Temperature Distribution along a Single-channel PEM Water Electrolysis Cell. Electrochim. Acta 2018, 260, 582–588. [Google Scholar] [CrossRef]
  2. Shiva Kumar, S.; Himabindu, V. Hydrogen Production by PEM Water Electrolysis—A Review. Mater. Sci. Energy Technol. 2019, 2, 442–454. [Google Scholar] [CrossRef]
  3. Holladay, J.D.; Hu, J.; King, D.L.; Wang, Y. An overview of hydrogen production technologies. J. Catal. Today 2009, 139, 244–260. [Google Scholar] [CrossRef]
  4. Lewis, N.S.; Nocera, D.G. Powering the Planet: Chemical Challenges in Solar Energy Utilization. Proc. Natl. Acad. Sci. USA 2006, 103, 15729–15735. [Google Scholar] [CrossRef]
  5. Russell, J.H.; Nuttall, L.J.; Fickett, A.P. Hydrogen Generation by Solid Polymer Electrolyte Water Electrolysis. In Hydrogen Energy; Springer: Boston, MA, USA, 1973; pp. 441–455. [Google Scholar] [CrossRef]
  6. Slade, S.; Campbell, S.A.; Ralph, T.R.; Walsh, F.C. Ionic Conductivity of an Extruded Nafion 1100 EW Series of Membranes. J. Electrochem. Soc. 2002, 149, A1556–A1564. [Google Scholar] [CrossRef] [Green Version]
  7. Filice, S.; D’Angelo, D.; Libertino, S.; Nicotera, I.; Kosma, V.; Privitera, V.; Scalese, S. Graphene Oxide and Titania Hybrid Nafion Membranes for Efficient Removal of Methyl Orange Dye from Water. Carbon 2015, 82, 489–499. [Google Scholar] [CrossRef]
  8. Scalese, S.; Nicotera, I.; D’Angelo, D.; Filice, S.; Libertino, S.; Simari, C.; Dimos, K.; Privitera, V. Cationic and Anionic Azo-dye Removal from Water by Sulfonated Graphene Oxide Nanosheets in Nafion Membranes. New J. Chem. 2016, 40, 3654–3663. [Google Scholar] [CrossRef]
  9. D’Angelo, D.; Filice, S.; Libertino, S.; Kosma, V.; Nicotera, I.; Privitera, V.; Scalese, S. Photocatalytic Properties of Nafion Membranes Containing Graphene Oxide/titania Nanocomposites. In Proceedings of the 2014 IEEE 9th Nanotechnology Materials and Devices Conference (NMDC), Aci Castello, Italy, 12–15 October 2014; pp. 54–57. [Google Scholar]
  10. Enotiadis, A.; Angjeli, K.; Baldino, N.; Nicotera, I.; Gournis, D. Graphene-based Nafion Nanocomposite Membranes: Enhanced Proton Transport and Water Retention by Novel Organo-functionalized Graphene Oxide Nanosheets. Small 2012, 8, 3338–3349. [Google Scholar] [CrossRef]
  11. Carmo, M.; Fritz, D.L.; Mergel, J.; Stolten, D. A Comprehensive Review on PEM Water Electrolysis. Int. J. Hydrog. Energy 2013, 38, 4901–4934. [Google Scholar] [CrossRef]
  12. Willis, L.; Handlin, D.L.; Trenor, S.R.; Mather, B.D. Sulfonated Block Copolymers, Method for Making same, and Various Uses for such Block Copolymers. US Patent 7,737,224 B2, 15 June 2010. [Google Scholar]
  13. Geise, G.M.; Freeman, B.D.; Paul, D.R. Characterization of a Sulfonated Pentablock Copolymer for Desalination Applications. Polymer 2010, 51, 5815–5822. [Google Scholar] [CrossRef]
  14. Geise, G.M.; Freeman, B.D.; Paul, D.R. Sodium Chloride Diffusion in Sulfonated Polymers for Membrane Applications. J. Membr. Sci. 2013, 427, 186–196. [Google Scholar] [CrossRef]
  15. Fan, Y.; Zhang, M.; Moore, R.B.; Cornelius, C.J. Structure, Physical Properties, and Molecule Transport of Gas, Liquid, and Ions within a Pentablock Copolymer. J. Membr. Sci. 2014, 464, 179–187. [Google Scholar] [CrossRef]
  16. Filice, S.; D’Angelo, D.; Scarangella, A.; Iannazzo, D.; Compagnini, G.; Scalese, S. Highly Effective and Reusable Sulfonated Pentablock Copolymer Nanocomposites for Water Purification Applications. RSC Adv. 2017, 7, 45521–45534. [Google Scholar] [CrossRef]
  17. D’Angelo, D.; Filice, S.; Scarangella, A.; Iannazzo, D.; Compagnini, G.; Scalese, S. Bi2O3/Nexar® Polymer Nanocomposite Membranes for Azo Dyes Removal by UV–vis or Visible Light Irradiation. Catal. Today 2019, 321–322, 158–163. [Google Scholar] [CrossRef]
  18. De Faria, L.A.; Boodts, J.F.C.; Trasatti, S. Electrocatalytic Properties of Ternary Oxide Mixtures of Composition Ru0.3Ti(0.7−x)CexO2: Oxygen Evolution from Acidic Solution. J. Appl. Electrochem. 1996, 26, 1195–1199. [Google Scholar] [CrossRef]
  19. Kota, R.; Lewerenz, H.J.; Bruesch, P.; Stucki, S. Oxygen Evolution on Ru and Ir Electrodes: XPS-studies. J. Electroanal. Chem. 1983, 150, 209–216. [Google Scholar]
  20. Savinell, R.F.; Zeller, R.L. Electrochemically Active Surface Area Voltammetric Charge Correlations for Ruthenium and Iridium Dioxide Electrodes. J. Electrochem. Soc. 1990, 137, 489–494. [Google Scholar] [CrossRef]
  21. Filice, S.; Compagnini, G.; Fiorenza, R.; Sciré, S.; D’Urso, L.; Fragalà, M.E.; Russo, P.; Fazio, E.; Scalese, S. Laser Processing of TiO2 Colloids for an Enhanced Photocatalytic Water Splitting Activity. J. Colloid Interface Sci. 2016, 489, 131–137. [Google Scholar] [CrossRef]
  22. Devrim, Y. Preparation and Testing of Nafion/titanium Dioxide Nanocomposite Membrane Electrode Assembly by Ultrasonic Coating Technique. J. Appl. Polym. Sci. 2014, 131. [Google Scholar] [CrossRef]
  23. Chanakan, R.; Nisit, T. Influence of Gas Diffusion Layer on Pt Catalyst Prepared by Electrodeposition for Proton Exchange Membrane Fuel Cells. Thin Solid Film. 2017, 636, 116–126. [Google Scholar]
  24. Sadeghi, A.A.; Ebadzadeh, T.; Raissi, B.; Ghashghaie, S. Electrophoretic Deposition of TiO2 Nanoparticles in Viscous Alcoholic Media. Ceram. Int. 2013, 39, 7433–7438. [Google Scholar] [CrossRef]
  25. Shi, S.; Weber, A.Z.; Kusoglu, A. Structure/property relationship of Nafion XL Composite Membranes. J. Membr. Sci. 2016, 516, 123–134. [Google Scholar] [CrossRef]
  26. Soboleva, T.; Xie, Z.; Shi, Z.; Tsang, E.; Navessin, T.; Holdcroft, S. Investigation of the Through-plane Impedance Technique for Evaluation of Anisotropy of Proton Conducting Polymer Membranes. J. Electroanal. Chem. 2008, 622, 145–152. [Google Scholar] [CrossRef]
  27. Othman, M.H.D.; Ismail, A.F.; Mustafa, A. Recent Development of Polymer Electrolyte Membranes for Direct Methanol Fuel Cell Application—A Review. Malays. Polym. J. 2010, 5, 1–36. [Google Scholar]
  28. Lin, Z.; Wang, C.H.; Liu, Y. Modeling and Analysis of Static Water Feed Solid Polymer Water Electrolysis Cell. Adv. Mater. Res. 2011, 236–238, 750–754. [Google Scholar] [CrossRef]
Figure 1. Structures of Nafion® and Nexar™ polymers.
Energies 12 02064 g001
Figure 2. (a) Representation of the cell used for impedance measurement of PEM (i.e., Nafion or Nexar); (b) Idealized circuit representing the proton conducting membrane placed between two electrodes. Rint1, Rint2 and Cint1, Cint2 represent the resistances and the capacitances of the membrane–electrode interfaces; Rb and Cb represent the bulk membrane resistance and capacitance, respectively.
Energies 12 02064 g002
Figure 3. Impedance curves for commercial Nafion and Nexar membranes; in the inset, a magnification of the impedance curves at higher frequencies is reported.
Energies 12 02064 g003
Figure 4. Photos of the electrophoretic deposition system for (a) TiO2 nanoparticles in ethanol and (b) Nafion solution. The images (c,d) show, respectively, the GDLs covered by TiO2 and, afterwards, by Nafion. Photos (e,f) show, respectively, the GDL covered by a Pt layer and the same covered by Nafion.
Energies 12 02064 g004
Figure 5. SEM images at two different magnifications (a,b) of pristine GDL.
Energies 12 02064 g005
Figure 6. SEM images of GDL after Pt deposition at low (a) and high (b) magnification.
Energies 12 02064 g006
Figure 7. SEM images of a GDL covered by TiO2 nanoparticles at two different magnifications (a,b).
Energies 12 02064 g007
Figure 8. SEM images of a GDL covered by TiO2 and Nafion.
Energies 12 02064 g008
Figure 9. Optical images of contact angle measurements for (a) commercial GDL and GDLs modified with (b) Nafion, (c) Pt and Nafion, and (d) TiO2 and Nafion.
Energies 12 02064 g009
Figure 10. (a) Home-made cell and (b) schematics of the configuration used for the experiments.
Energies 12 02064 g010
Figure 11. I–V curves for the water splitting tests obtained (a) with the Nexar membrane by changing the GDLs (cell configurations 1–4); (b) comparing Nexar and Nafion (cell configurations 4 and 5).
Energies 12 02064 g011
Table 1. Water uptake (%) and the number of water molecules per sulfonic-acid group (λ) for the commercial membranes.
MembraneThickness (μm)Water Uptake (%)λ
Nexar5016847
Nafion502513
Table 2. Resistance and conductivity values calculated from the impedance measurements. The conductivities are given as range of values considering the minimum and maximum thickness for dry and completely hydrated membranes, respectively.
MembraneResistance (Ohm)Conductivity (mS/cm)
Nexar0.382.63 < σ < 4.84
Nafion1.550.645 < σ < 0.703
Table 3. Amounts of deposited TiO2, Pt, and Nafion on GDLs.
GDLTiO2 (mg/cm2)Pt (mg/cm2)Nafion (mg/cm2)
N1 13.7
N2 12.4
N-Ti0.11 11.4
N-Pt 0.0313.0

