Article

Development of a Modified Plug-Flow Anaerobic Digester for Biogas Production from Animal Manures

1
ProCycla SL, Pont de Vilomara 140, 2-1, 08241 Manresa, Spain
2
Departamento de Ingeniería Agraria, Náutica, Civil y Marítima, Universidad de La Laguna, Carretera de Geneto 2, 38071 San Cristóbal de La Laguna, Spain
3
IRTA, Torre Marimon, E-08140 Caldes de Montbui, Spain
4
Aqualia I + D, Av. Camino de Santiago, 40, Edificio 3, 4ª Planta, E-28050 Madrid, Spain
*
Author to whom correspondence should be addressed.
Energies 2019, 12(13), 2628; https://doi.org/10.3390/en12132628
Submission received: 13 May 2019 / Revised: 26 June 2019 / Accepted: 27 June 2019 / Published: 8 July 2019
(This article belongs to the Special Issue Biogas for Rural Areas)

Abstract

:
Traditional plug-flow anaerobic reactors (PFRs) are characterized by lacking a mixing system and operating at high total solid concentrations, which limits their applicability for several kinds of manures. This paper studies the performance of a novel modified PFR for the treatment of pig manure, characterized by having an internal sludge mixing system by biogas recirculation in the range of 0.270–0.336 m3 m−3 h−1. The influence on the methane yield of four operating parameters (recirculation rate, hydraulic retention time, organic loading rate, and total solids) was evaluated by running four modified PFRs at the pilot scale in mesophilic conditions. While the previous biodegradability of organic matter by biochemical methane potential tests were between 31% and 47% with a methane yield between 125 and 184 LCH4 kgVS−1, the PFRs showed a suitable performance with organic matter degradation between 25% and 51% and a methane yield of up to 374 LCH4 kgVS−1. Operational problems such as solid stratification, foaming, or scum generation were avoided.

1. Introduction

Anaerobic digestion (AD) is a biological process in which organic matter breaks down naturally in the absence of oxygen to produce biogas [1]. The most common forms of large-scale anaerobic digesters are the continuously stirred tank reactor (CSTR) and plug-flow reactor (PFR) [2,3]. In a CSTR system, microorganisms are suspended in the digester through intermittent or continuous mixing, which offers good substrate–sludge contact with slight mass transfer resistance, but higher energy is required [4]. In an ideal CSTR, the concentration in any point of the reactor is identical. In contrast, in an ideal PFR, there is no lengthwise mixing of the substrates under digestion as they move through the PFR. Therefore, the concentration distribution is not uniform throughout the reactor [5]. Actually, PFR is characterized by the fact that the flow or fluid through the reactor is orderly with no element of fluid overtaking or mixing with any other element ahead or behind [6]. A PFR system is simple, economical [7], and attractive in terms of efficiency and overall bioconversion compared to CSTR [4].
The expected volatile solid (VS) conversion to gas both in CSTR and PFR with high loads is in the range of 35–45% [8], depending on the substrate. For a similar hydraulic retention time (HRT), PFR usually reaches similar or higher removal efficiencies [9,10] and a better utilization of the volume requirements due to hydraulics and the high solid concentrations [11,12,13,14] with lower initial investment and running costs than CSTR systems [4]. Moreover, no short-circuiting can happen in PFRs, and the operational energy demand is lower than CSTRs due to the mixing and heating requirements [15]. PFRs are increasingly being used, particularly in North America, for high-solid manure digestion systems [12], and these have become an industry standard in the USA for scraped-manure treatments [16]. Among this, there are different examples of efficient pilot and industrial-scale PFRs reported in the literature for AD and the co-digestion of organic wastes [10,11,12,13,17,18,19,20,21,22,23]. The PFRs are designed for manure with a high solid content in the range of 11–14% total solids (TS). Typical operational parameters are an HRT between 20 and 50 days, an organic loading rate (OLR) of 1–6 kgCOD m−3 d−1 and biogas production between 0.4 and 0.8 m3 m−3 d−1 [13,24].
However, PFRs’ drawbacks are a lower mass transfer due to lack of mixing, a lower efficiency when treating low TS content substrates (<10%), thermal stratification and solid sedimentation, or floating/scum-formation problems [13,15,25]. These problems have generated unsuccessful fermentations when treating manure feedstock in conventional biogas plants [26]. It must be noted that neither dung or manure are homogeneous liquids which contain floating solids; in the case of PFRs for such materials, a length to width ratio in the range of 2.0–2.5 has been suggested, although conventional liquid-based PFRs usually have a larger length to width ratio to avoid mixing.
The most common option to prevent solid stratification in PFRs is a partial mixing of the inner content, using mechanical mixers or biogas blower mixers, combined with a recirculation rate (RR) of the effluent [27,28,29]. Biogas blower mixers by biogas reinjection were found to be the best solution for treating diluted manures (TS of 5%, 10% and 15%) in AD for dairy cattle [27,30]. Appels et al. [30] recommended a mixing biogas flow range of 0.27–0.30 m3 m−3 min−1 for unconfined systems.
Another aspect regarding mixing is the intensity and pattern, but significant differences of values can be found. In general, mixing with an intermediate intensity and an intermittent pattern was concluded to be the most optimal in terms of biogas production [27,31]. In [32], typically, mixing power inputs between 5 and 8 W m−3 were reported; Wu [33] found that 0.5–4 W m−3 may be sufficient; and both recommendations are below the proposed range of 40–100 W m−3 by Couper et al. [34].
This work describes the assessment of a modified PFR equipped with a biogas reinjection system in order to avoid operational problems such as solid stratification, foaming, or scum generation during the anaerobic digestion of animal slurries. The effect of the effluent RR, the HRT, and the inlet TS on the methane yield (MY) was evaluated, four modified PFRs running in parallel at the pilot scale for biogas production from animal manure (pig slurry) in mesophilic conditions.

2. Materials and Methods

2.1. Biomass Sources: Animal Manure and Inoculum

Fresh pig manure (FM), selected as an example of animal slurries, was collected in an intensively rearing pig farm (Girona, Spain) five times for the experiment. FM samples were characterized and used as the influent of four PFR digesters by applying different dilutions with tap water to adjust the inlet total solid content, depending on the experimental conditions (see next section). Both fresh and diluted manure were periodically characterized; Table 1 shows the characterization of FM samples. The net methane yield (LCH4 kgVS−1), at 273 K and 1013 hPa, and the biodegradability (% COD) were calculated through biochemical methane potential assays at 35 °C on FM samples [35,36]. Inoculum (5 gVS L−1), bicarbonate (1g gCOD−1), deionized water (to accomplish a 0.5 L of medium per vial), and FM (5 gCOD L−1) were added to 1.2 L glass vials for 30 days at 35 °C. In parallel, controls were prepared to determine the residual biogas production of the inoculum. In order to calculate the methane production rate I and the lag phase (λ) of the fresh manure (see Table 1), the modified Gompertz Equation (1) was used [37]:
R t =   R 0 · e x p e x p R m a x · e R 0 λ t + 1
The inoculum used for the start-up of the digesters and for the biochemical methane potential assays was sampled in a mesophilic CSTR digester of a municipal wastewater treatment plant (WWTP) in Barcelona (Spain).

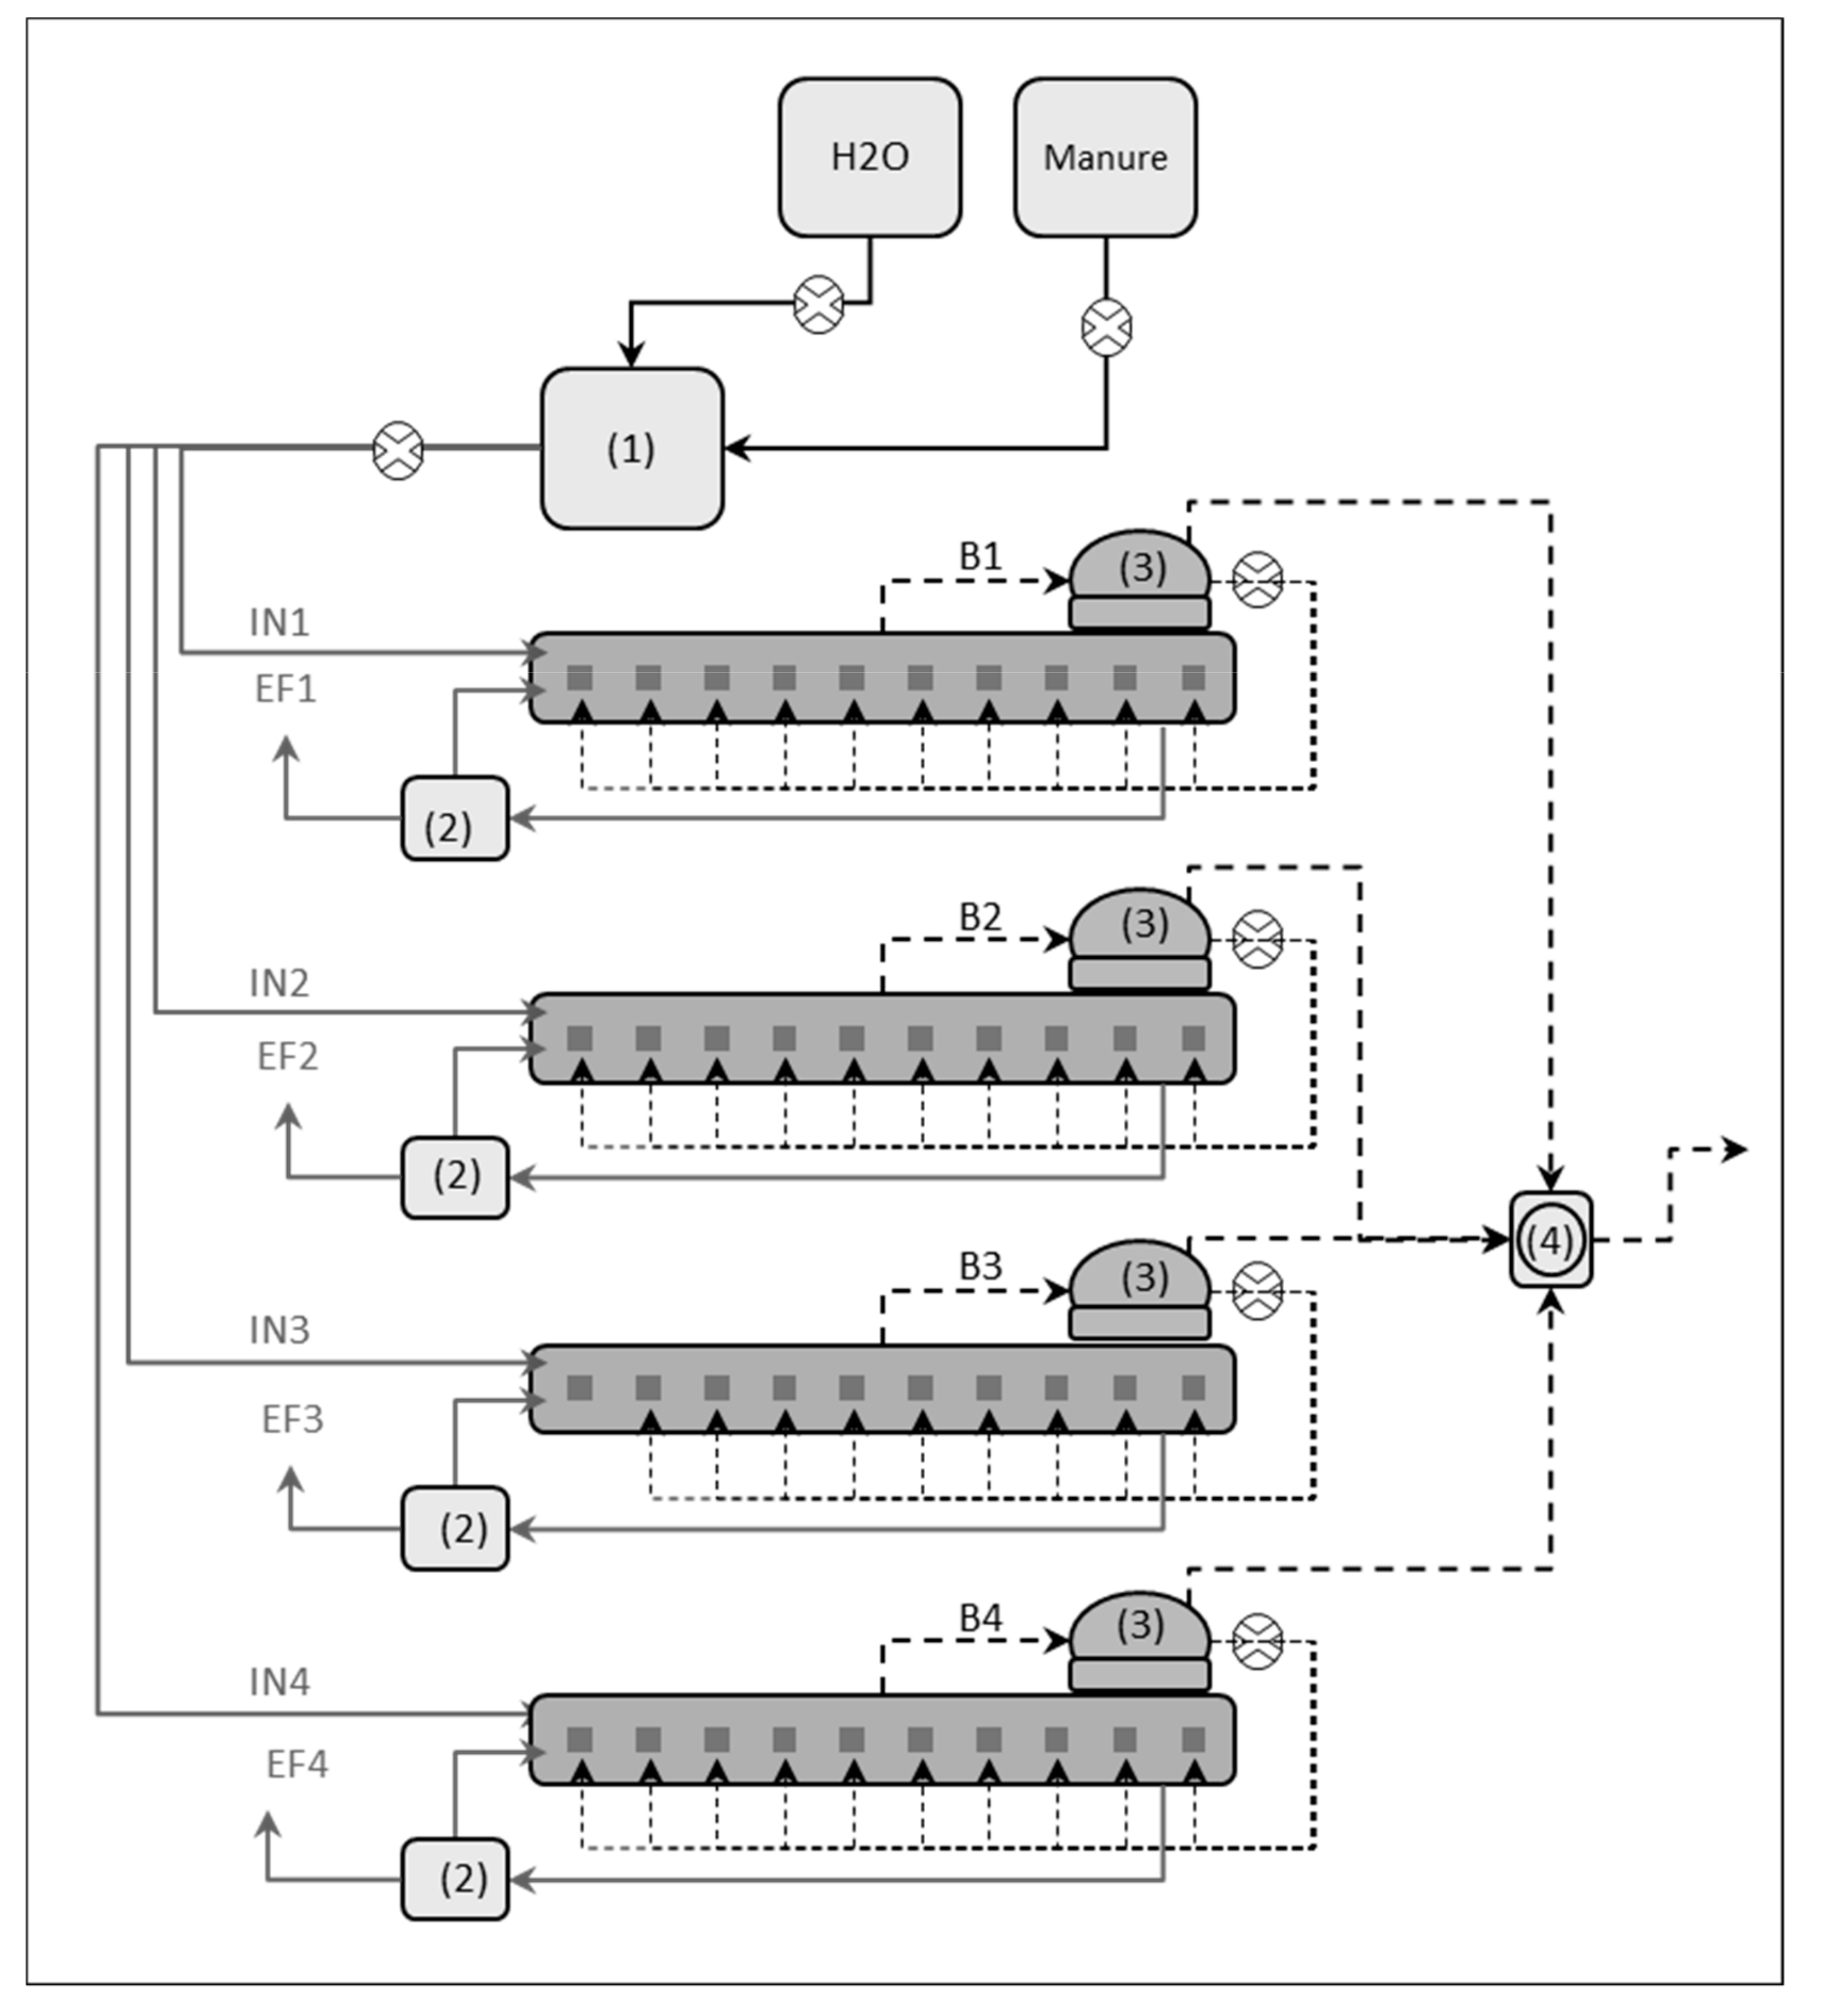
2.2. Pilot-Scale Biogas Plant

A pilot-scale plant comprised of four horizontal PFRs (R1, R2, R3, and R4), a feeding system, a heating system, a biogas flow meter, and a programmable logic controller (PLC) to automate the plant equipment (timing and data acquisition system). All recorded data (temperature profiles of each reactor, biogas flows, inlet flows, etc.) were downloaded periodically as Excel files directly from the panel. Figure 1 shows a scheme of the pilot plant.
Once collected, FM samples were stored at ambient temperature (10–40 °C) in a 1 m3 tank that was diluted with tap water daily just before the feeding of each digester. The weight of tap water and FM added to the dilution tank were registered by a weight cell BL-7 (Sensocar S.A., Terrassa, Spain). The diluted FM was stored in another 1 m3 tank, also at ambient temperature, which was periodically stirred with a waterproof pump GR BluePRO (Zenit Europe, Bascharage, Luxembourg) or a vertical rotor (dilute manure tank) during the storage.
Each PFR (2830 mm length, 646 mm width) consisted of a horizontally oriented U-shaped container of stainless steel and a methacrylate cover, which allowed periodic visual revisions of the inner material, with a working volume of 160 L (total volume of 235 L). Each PFR had its own external gas holder (flexible balloon of 100 L) located on the digester´s cover that, along with the gas headspace of the stainless tank, led to a total volume of 175 L per PFR for gas storage. A flowmeter (TG5, Ritter, Bochum, Germany) recorded the biogas flow, once the biogas passed through a silica filter. The biogas composition was measured off-line daily with a gas analyzer, equipped with electrochemical (H2S, O2) and dual-beam infrared (CH4, CO2) sensors BIOGAS5000 (Geotech Ltd., Conventry, UK). Each digester was heated with individual electric blankets For-Flex Super (Electricfor S.A., Rubí, Spain) and insulated with polyurethane boards. The working temperature was set up at 34 °C and monitored with three temperature probes Pt-100 PR-24-3-100-A-G1/4-6-150 (OMEG, Connecticut, USA) that were distributed regularly along the length of each reactor, controlled by PLC.
The biogas reinjection system was used between the feeding and effluent withdrawal operations. This system includes for each PFR, a silica filter, a gasholder, a compressor V-DTN16 (Elmo Rietschle, Gardner Denver Iberia S.L., Madrid, Spain), and inner 45 polyethylene gas diffusers of 8 mm diameter Tee quick connection (Ningmao Hydraulic Pneumatic Components Factory, Zhejiang, China), which were distributed along the digester floor, near the dividing wall. The gas pipes were made of polyamide. The diffuser distribution fitted well with recommended configurations reported in the literature [38]. The reinjected biogas, introduced perpendicularly to the PFRs, generated turbulence to mix the reactor’s content. The stored biogas was compressed to attain a specific flow range of 0.270–0.336 m3 m−3 h−1 and intermittently released (2 min h−1 and 8 times d−1), with the gas flow range being 4–5 m3 h−1. Safety valves were located along the cover of each digester in order to keep the internal pressure of each PFR ≤20 mbar (differential pressure).
Feeding, effluent recirculation and effluent withdrawal were done manually once per day, from Monday to Friday, dividing the loading equally over the 5 days. Daily flows were recorded directly in the PLC.
Sampling ports were located in the cover and in the bottom of the tank, allowing the collection of sludge samples from the initial, intermediate, and final points of the digesters. Influents and effluents of each PFR were characterized once per week by their content of total chemical oxygen demand (COD), total solids (TS), volatile solids (VS), total Kjeldahl nitrogen (TKN), and total ammonium nitrogen (TAN). Effluents were also characterized by pH, total and partial alkalinities (TA, PA), and volatile fatty acid (VFA) concentration once a week. All parameters were determined following standard methods [39], except for COD, which was determined as per Noguerol-Arias et al. [40] and VFA profile (acetic, propionic, i-butyric, n-butyric, i-valeric, n-valeric) which was determined by gas chromatography determined as per Rodríguez-Abalde et al. [35].

2.3. Experimental Conditions

Table 2 shows the recorded experimental conditions, which are also shown in Figure 2, in order to improve the understanding of the different conditions in each period and the dependence between the different experimental parameters (inlet-TS, HRT, RR and OLR) shown. The experiment was developed in four periods (P1, P2, P3, and P4), being evaluated in terms of MY (LCH4 kgVS−1, expressed at 273 K and 1013 hPa) and organic matter removal efficiency (VS removal). The length of each period was at least 2.5 × HRT or the minimum amount of time to achieve a “stable condition”, which was defined as that moment in which the biogas production and COD concentration in the effluent were inside 15% of the average value [27].
Period P1 consisted in the start-up of all four digesters (R1, R2, R3, and R4), which were inoculated with 150 L inoculum obtained from a CSTR operating at a WWTP in Barcelona (Spain). Conservative conditions were established for 25 days. Different conditions were applied for each reactor in the next periods, P2 to P4, by changing inlet-TS, HRT, and RR values. The inlet-TS content was in the range of 3.0% and 7.0%, as the representative TS range of FMs. The HRT was between 10 and 40 days, as these values were reported as the minimum for anaerobic digesters in the literature [10,12]. The RR was fixed between 20% and 50% of the influent flow to ensure a stable process through the anaerobic biomass recirculation into the reactors.
Digesters R1 and R2 were used to evaluate the effect of changing the inlet flow and/or the inlet TS concentration. In this way, in R1 a progressive increase of the inlet flow and inlet-TS content through the periods were done, which increased the OLR and decreased the HRT from period P2 to P4.
In R2, the OLR was promptly doubled by pulse additions in each period. Two additions of dilute FM were done in period P2 reaching 2.5 kgVS m−3 d−1 these days. Three pulses of different VFA (acetic acid 30 g pulse−1, propionic acid 20 g pulse−1, or butyric acid 16 g pulse−1) were done in period P3 reaching 2.5 kgVS m−3 d−1 these days. Finally, three glucose additions (30 g pulse−1) in period P4 were done reaching 2.5 kgVS m−3 d−1 these days. These increases in OLR were performed to evaluate resilience of the different group of microorganisms involved in the anaerobic digestion process: FM pulses help to evaluate reactor response focusing mainly on hydrolytic and acidogenic bacteria, VFA pulses help to evaluate reactor response focusing on methanogenic bacteria, whereas glucose pulses help to evaluate reactor response focusing on acidogenic and acetogenic bacteria.
Digester R3 was a used to evaluate possible problems at full-scale plants, such as pumping failures or feed blockages. In this way, during period P2, both feeding and recirculation of the effluent were stopped for 1 week and RR was stopped for another week at the end of this period.
Finally, digester R4 was used as a control by maintaining stable conditions, with an OLR of 1.6 kgVS m−3 d−1 and a HRT of 24–36 days. The only parameter changed was the effluent RR, varying from 50% to 25% depending on the experimental period (see Table 2).
Periodically, a mass balance calculation was done in terms of total N and COD. For that purpose, an accumulation term was estimated based on total N balance (since total N concentration is conservative in AD processes assuming a constant growth of the involved microorganisms). This accumulation was included in the COD mass balance in order to calculate both methane and biogas production. In this regard, Kinyua et al. [41] included N related compounds, such as struvite, and the presence of a dead volume inside tubular anaerobic digesters. Similarly, Jagadish et al. [26] discovered a floating layer that remained during the entire fermentation period inside horizontal PFRs when digesting a chopped blend of herbaceous terrestrial weeds and leaf biomass.

2.4. Statistical Analysis

The statistical analysis was done with the SPSS Statistics v.20.0.0 (IBM) software (Armonk, N.Y., USA). An ANOVA and HSD Tukey post-hoc analyses were performed to determine significant differences (p < 0.05) for variables whose data were normally distributed and with equal variances. For data of variables with heterogeneous variances, the Welch statistic and Games–Howell post hoc analyses were used to determine which groups were significantly different (p < 0.05). Linear correlations between control parameters and operation conditions during the assays were studied using the Pearson correlation coefficient (r). Correlations were considered significant at p < 0.05.

3. Results and Discussion

3.1. Substrate Characterization

The collected FM (Table 1) was representative of typical pig slurry or liquid manure in terms of TS content, as reported in [42]. The TS (9.9–11.3% wet weight) and TKN (6.0–6.8 gN kg−1) contents were almost constant among all experiments. The biodegradability of FM ranged between 31–47% COD with a MY between 125–184 LCH4 kgVS−1. These values were lower than the reported by Møller et al. [43] and Hansen et al. [44] when treating slurries from fattening pigs, with ranges of 47–78% COD and MY of 300–356 LCH4 kgVS−1. However, the VS and TAN contents of fresh FM varied, which could explain the different qualities regarding the biodegradability. This result is coherent with other references in the literature where the storage time in the farm facility was related with the quality and methane potential of animal slurries [45].

3.2. General Plant Performance

Pilot plant operation showed several challenges due to the complex automation and the operation of four reactors simultaneously.
During P2, P3, and P4, some problems regarding the recorded biogas flow with the flowmeter were observed, and the biogas production was lower than the calculated values by COD balance (Figure 3). Two main reasons for this were identified. The first one was caused by the compressor operation for the biogas reinjection. Because of it, a regular overpressure in the digesters was observed, causing the opening of the safety gas valves in order to keep the internal pressure below 20 mbar and losing some biogas without being recorded. Secondly, the pipe length between the gas extraction points and the gas flowmeter changed depending on the digester, leading also to some biogas losses and condensate generation inside of these pipes. For these reasons, the recorded biogas flows in the beginning (P1) were well measured in all reactors, but immediately lower in the next periods.
Reactor R4 had an extra time operation of 30 days. Before this period, a maintenance in gas piping was performed in order to avoid problems regarding the recorded biogas flow. After this maintenance, the MYs in both reactors suddenly increased (Figure 3), following a similar trend to the calculated values by COD balance. This showed the difficulty of operating an automated pilot biogas plant comprised of four different reactors, but also confirmed that the COD balance performed during the periods in which the biogas flow meter was not working appropriately, was correct and exact enough to accept methane yields obtained through this method.
The biogas reinjection flow was well adapted to the literature [38] in the range of 0.270–0.336 m3 m−3 h−1. Some of the 45 valve diffusers per reactor were clogged (10–15%), as reported in the literature [32], but no foaming or scum problems were observed in the digesters. No corrosion of gas piping and equipment was observed.
In general, the reactors showed appropriate performance, avoiding common problems associated with the operation of plug flow reactors at low inlet-TS concentrations, such as solid stratification (sedimentation or crust formation), foaming or scum generation.

3.3. Pilot Plant Monitoring

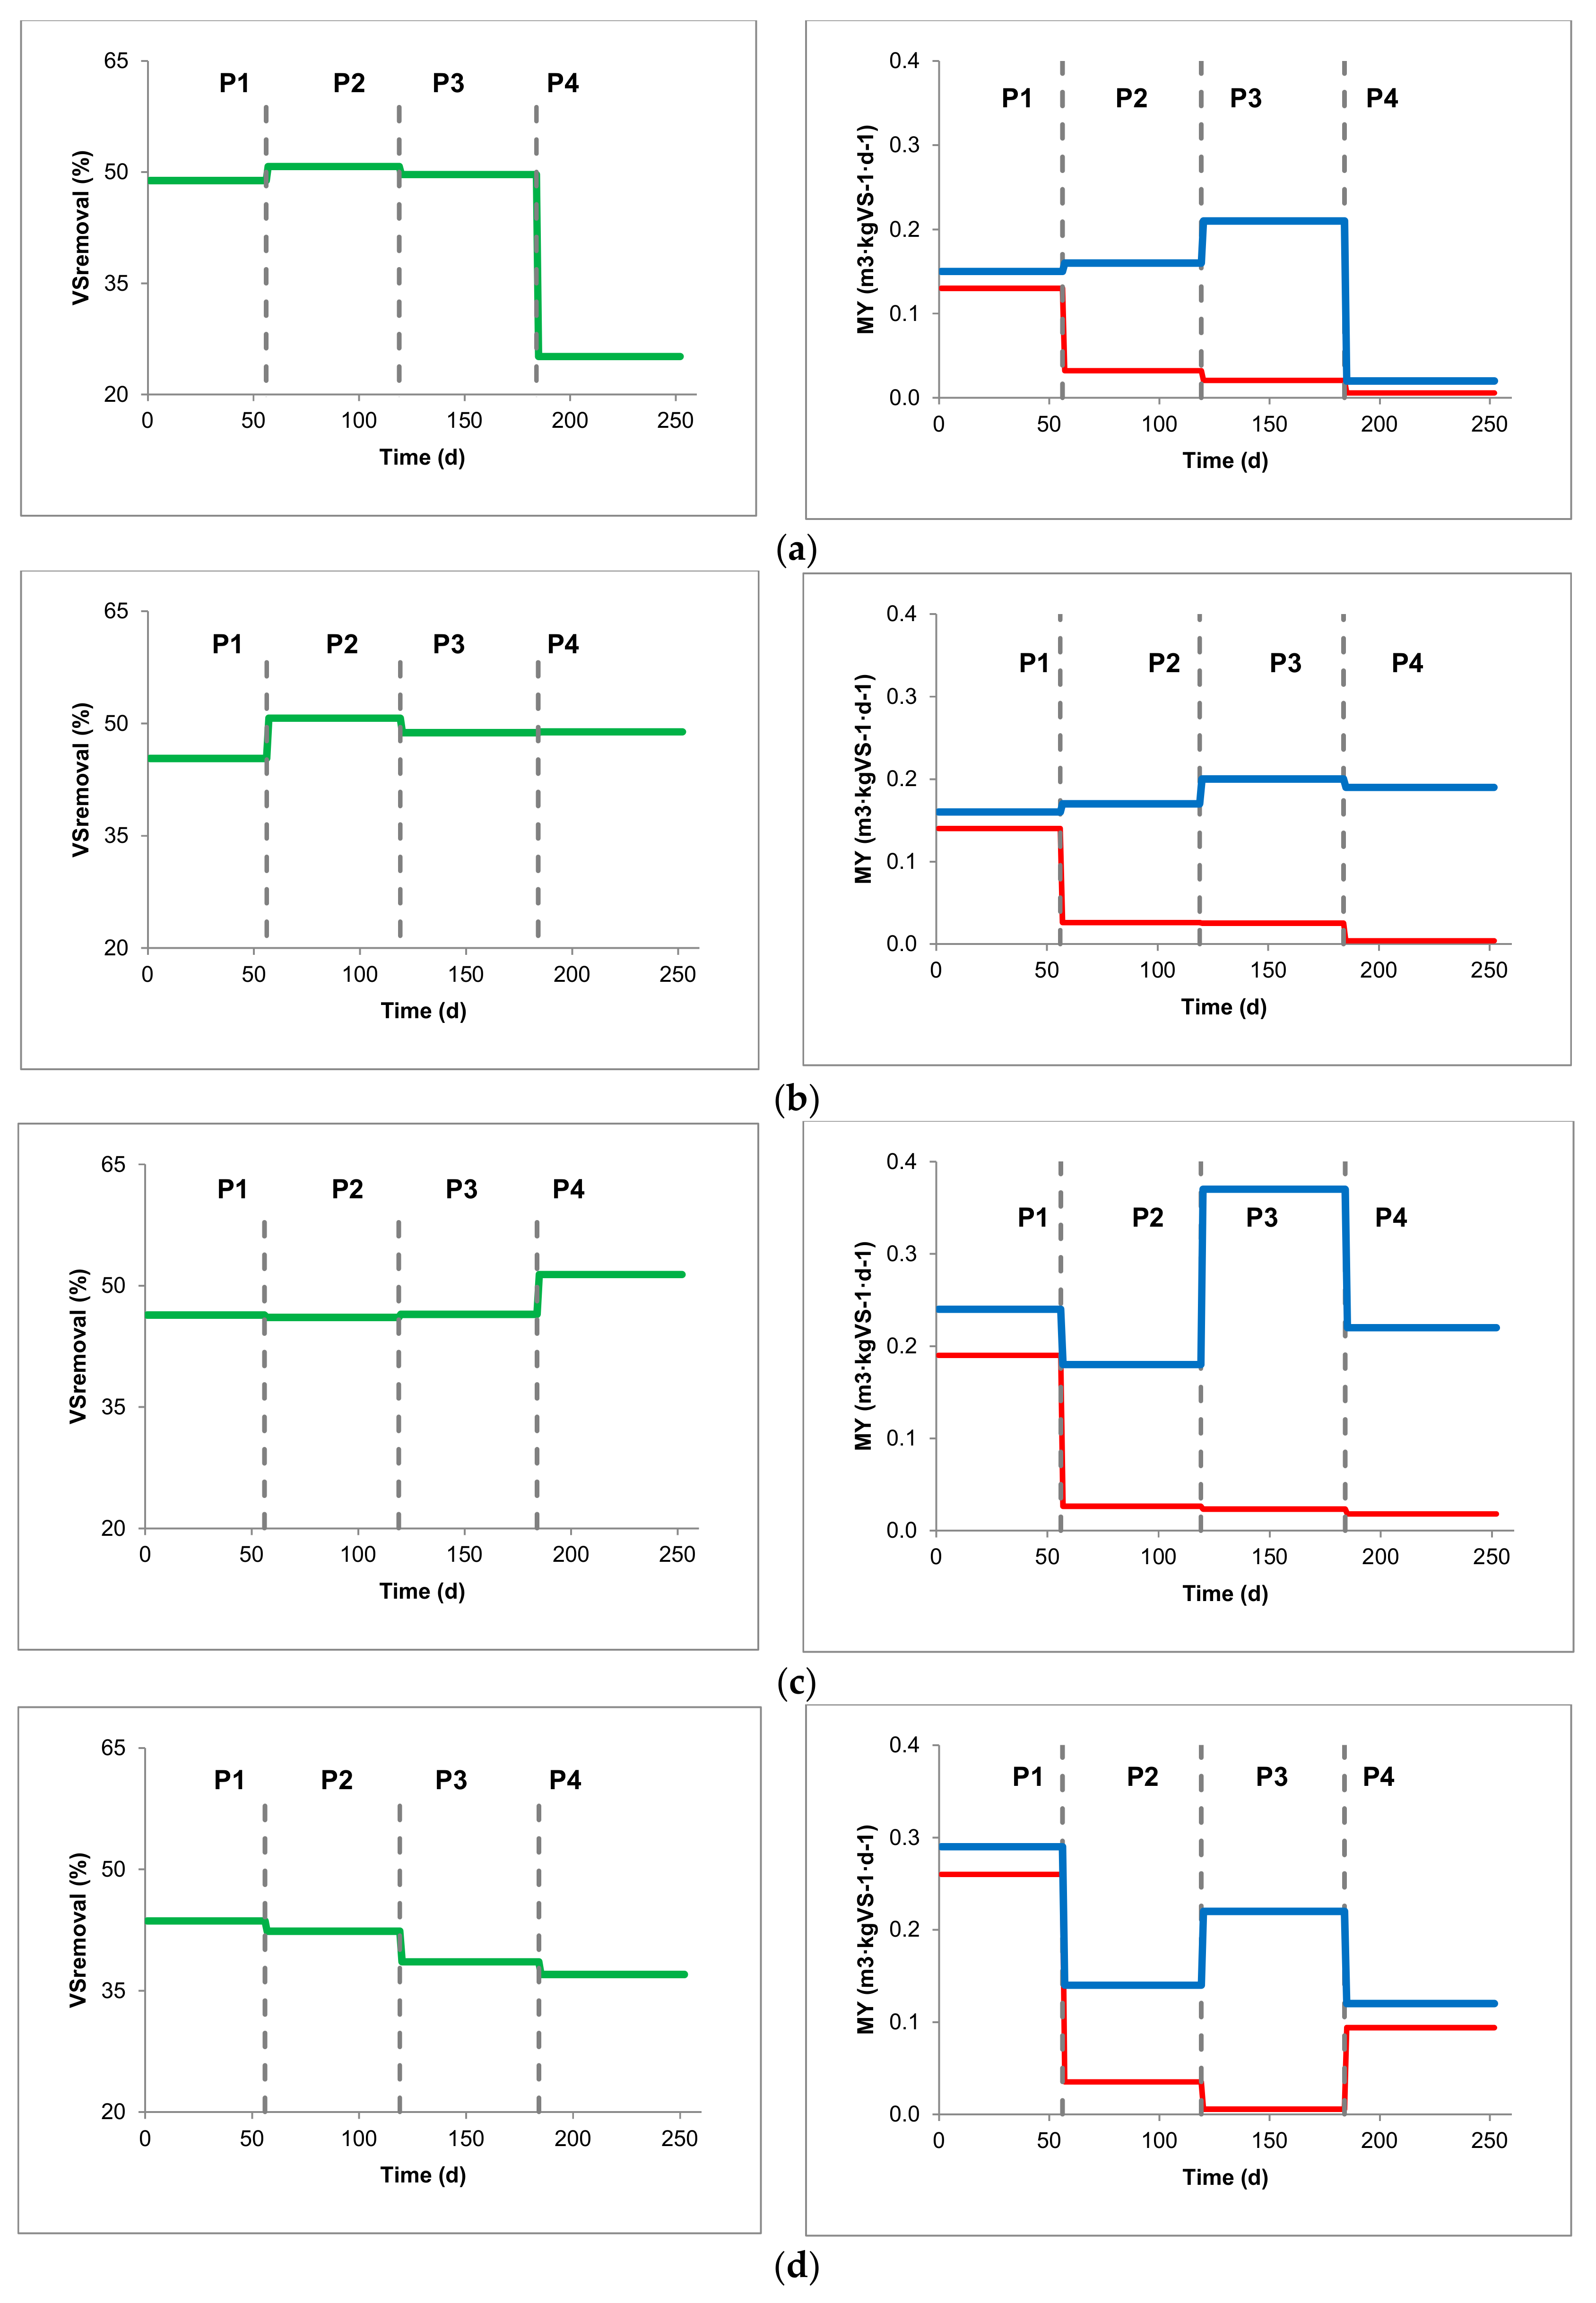
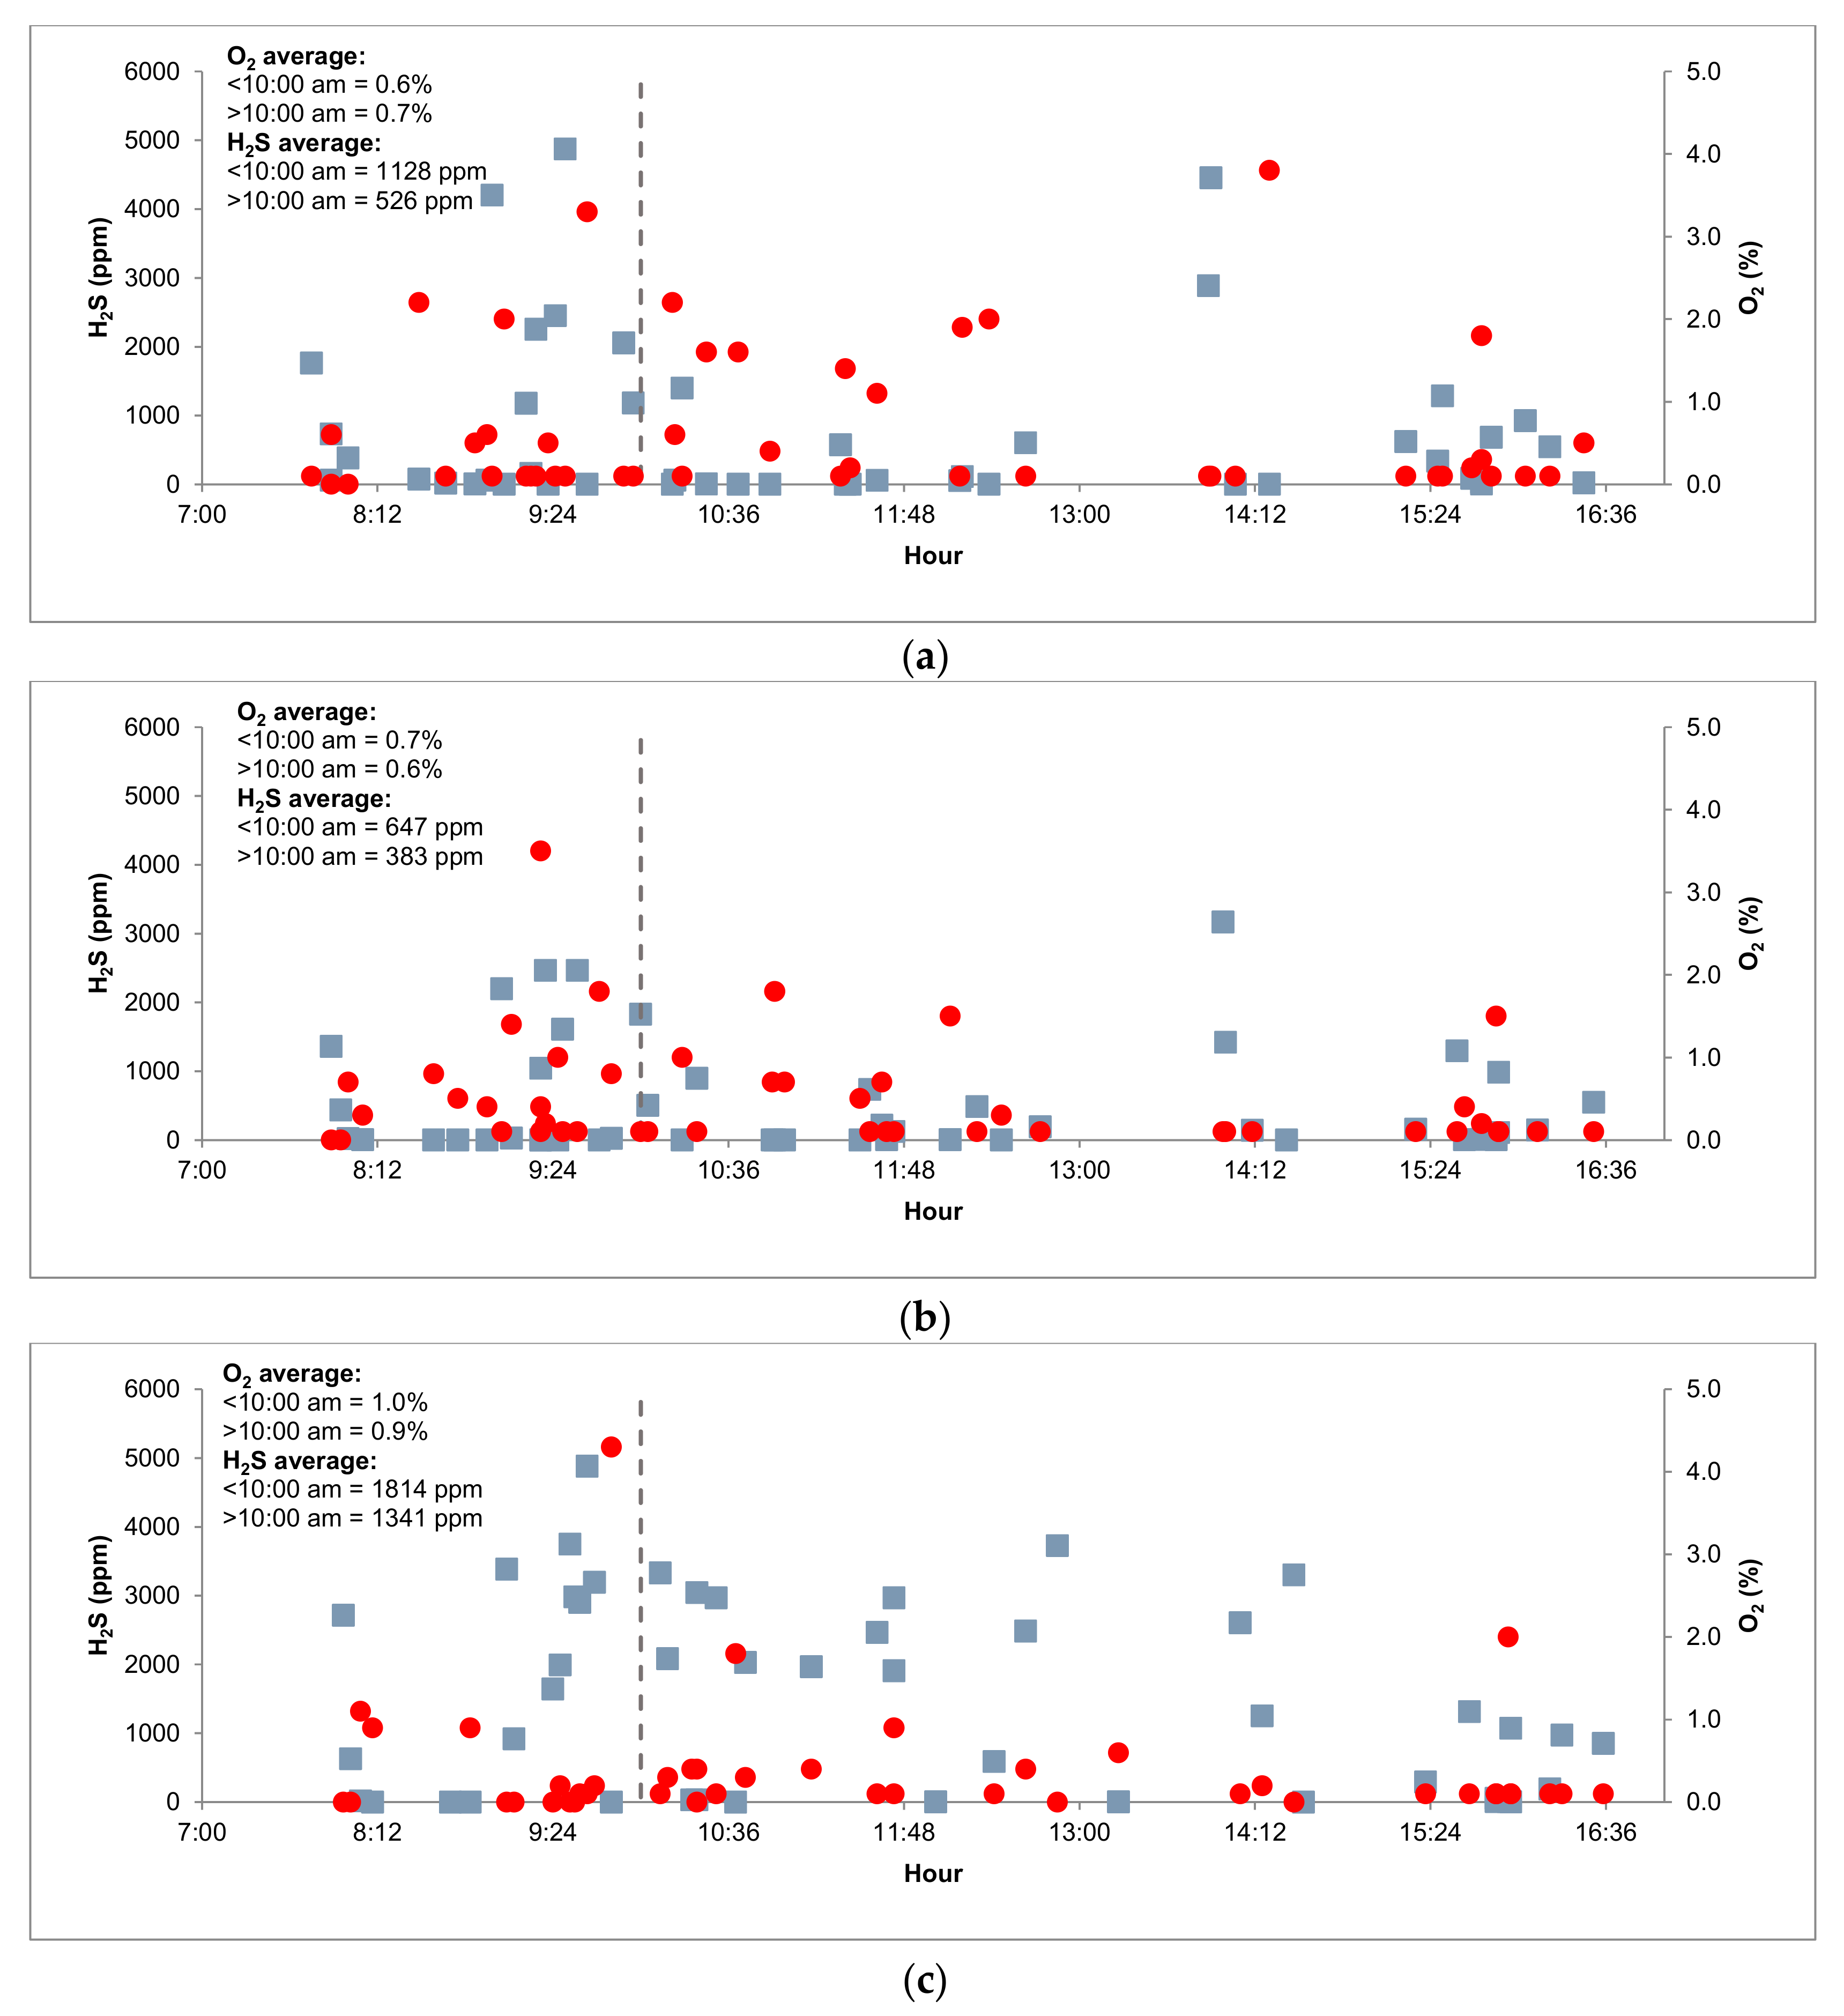
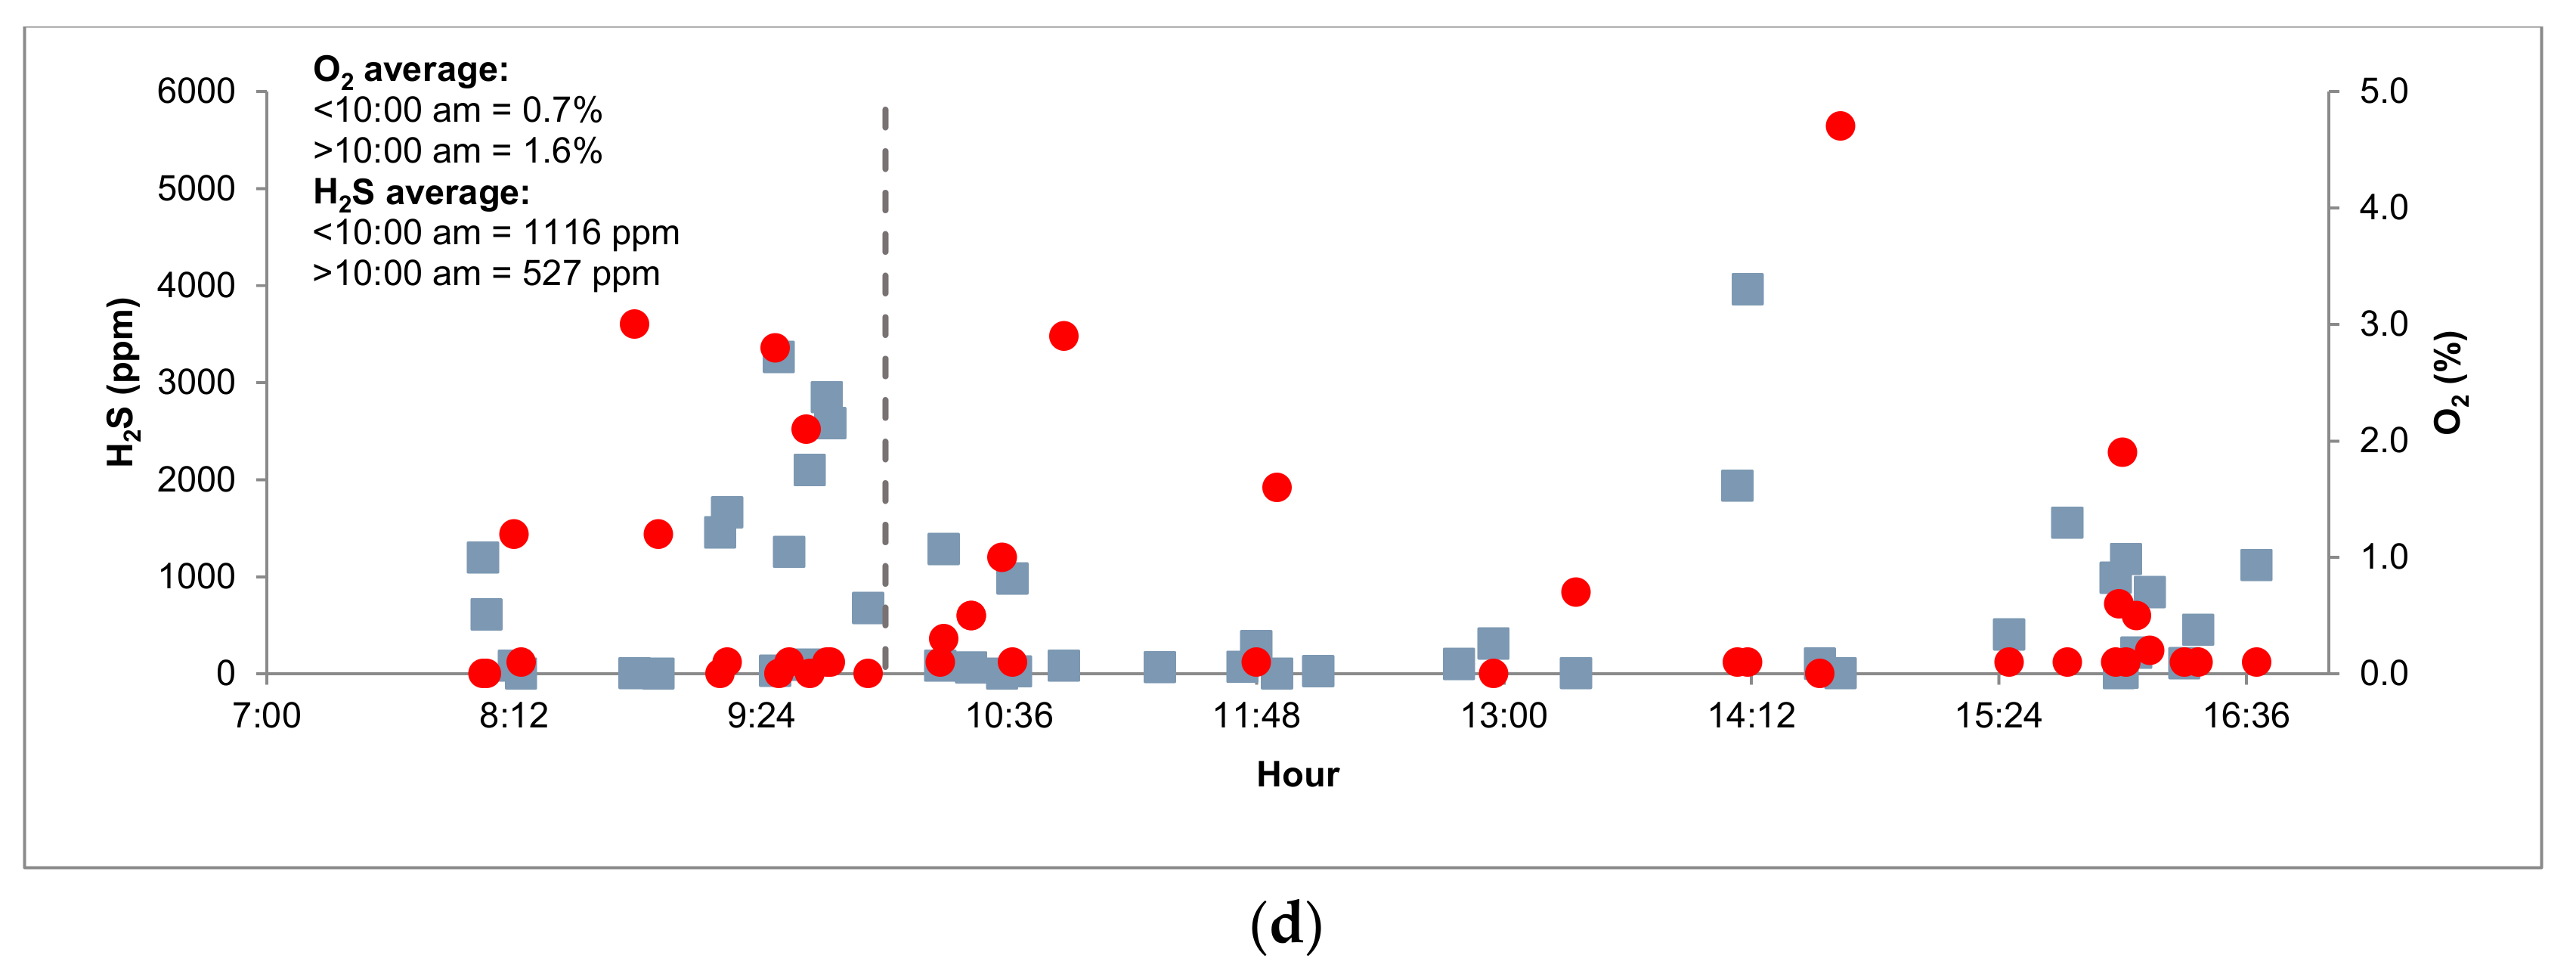
3.3.1. Biogas Composition and Organic Matter Removal

Table 3 shows the results obtained throughout the experiment regarding methane yield and methane volumetric yield, organic matter removal (VS removal) and biogas composition.
Biogas composition was similar for each period and reactor, with the highest methane content of 63.0 ± 3.3% in R1 during the P2 period and a lowest methane content of 55.0 ± 5.0% in R4 during the P3 period (Table 2). Biogas produced from animal slurries typically has a methane content of 60% [46,47] and it was shown that R1, R2, and R3 accomplish that during the P2 and P3 periods, but not during the P4 period, which is also true for the R4 reactor in any period. The unconfined gas injection mixing introduced O2 as a consequence of air inlet in the digesters. The maximum and minimum average amounts of O2 detected were 3.13 ± 3.34% in R4 during the P3 period and 0.23 ± 0.32% in R3 during the P3 period, respectively. In general, the O2 concentration was higher during the previous hours at 10:00 a.m., in accordance with the reinjection mixing cycles, with the exception of R3, in which a higher H2S concentration was evaluated during P3 and P4. It was assumed that R3 mixing was lower than other reactors, due to several mixing stoppings for different reasons such as leakage verifications, O2 concentration determination, or compressor maintenance. Although there is no correlation between O2 and H2S concentrations with experimental data (see Table 4), a decrease in H2S concentration is observed in the reactors after an increase of O2 concentration. Figure 4 shows O2 and H2S concentrations in each reactor before and after 10:00 a.m., the time in which mixing was stopped and the feeding and discharge operations were performed. This shows an average difference decrease before and after 10:00 a.m. of 602, 263, 473, and 589 ppm of H2S in reactors R1, R2, R3, and R4, respectively.
Because of operational problems regarding biogas measurements, biogas production was estimated using the COD balance. This methodology has been widely used in many publications and textbooks [48,49,50], and we validated the use of COD balance in the present work by comparing the MY values obtained during period P1 from both methods, by flowmeter and by COD balance, as in this period the flowmeter ran correctly. MY averages values are shown in Figure 3, and how a good correlation between them during this period P1 (0.15 ± 0.02, 0.16 ± 0.02, 0.24 ± 0.05, 0.29 ± 0.03 m3CH4 kgVS−1 in reactors R1, R2, R3, and R4, respectively) can be observed. This is also shown during period P4, when gas piping maintenance was performed in R4 and flows of both methods (flowmeter and COD balance) were similar. Figure 5 shows the average MY values for all periods and reactors for the different operational conditions (HRT, RR, inlet-TS, and OLR). The maximum MY values obtained were in R3 during P3, with an average of 373.7 ± 49.7 LCH4 kgVS−1, together with the lowest O2 concentrations and an organic matter removal of 46.5 ± 20.0% VS. The minimum MY values obtained were in R1 during P4, with an average of 23.5 ± 23.0 LCH4 kgVS−1, matching with the lowest organic matter removal of 25.1 ± 30.0% VS.

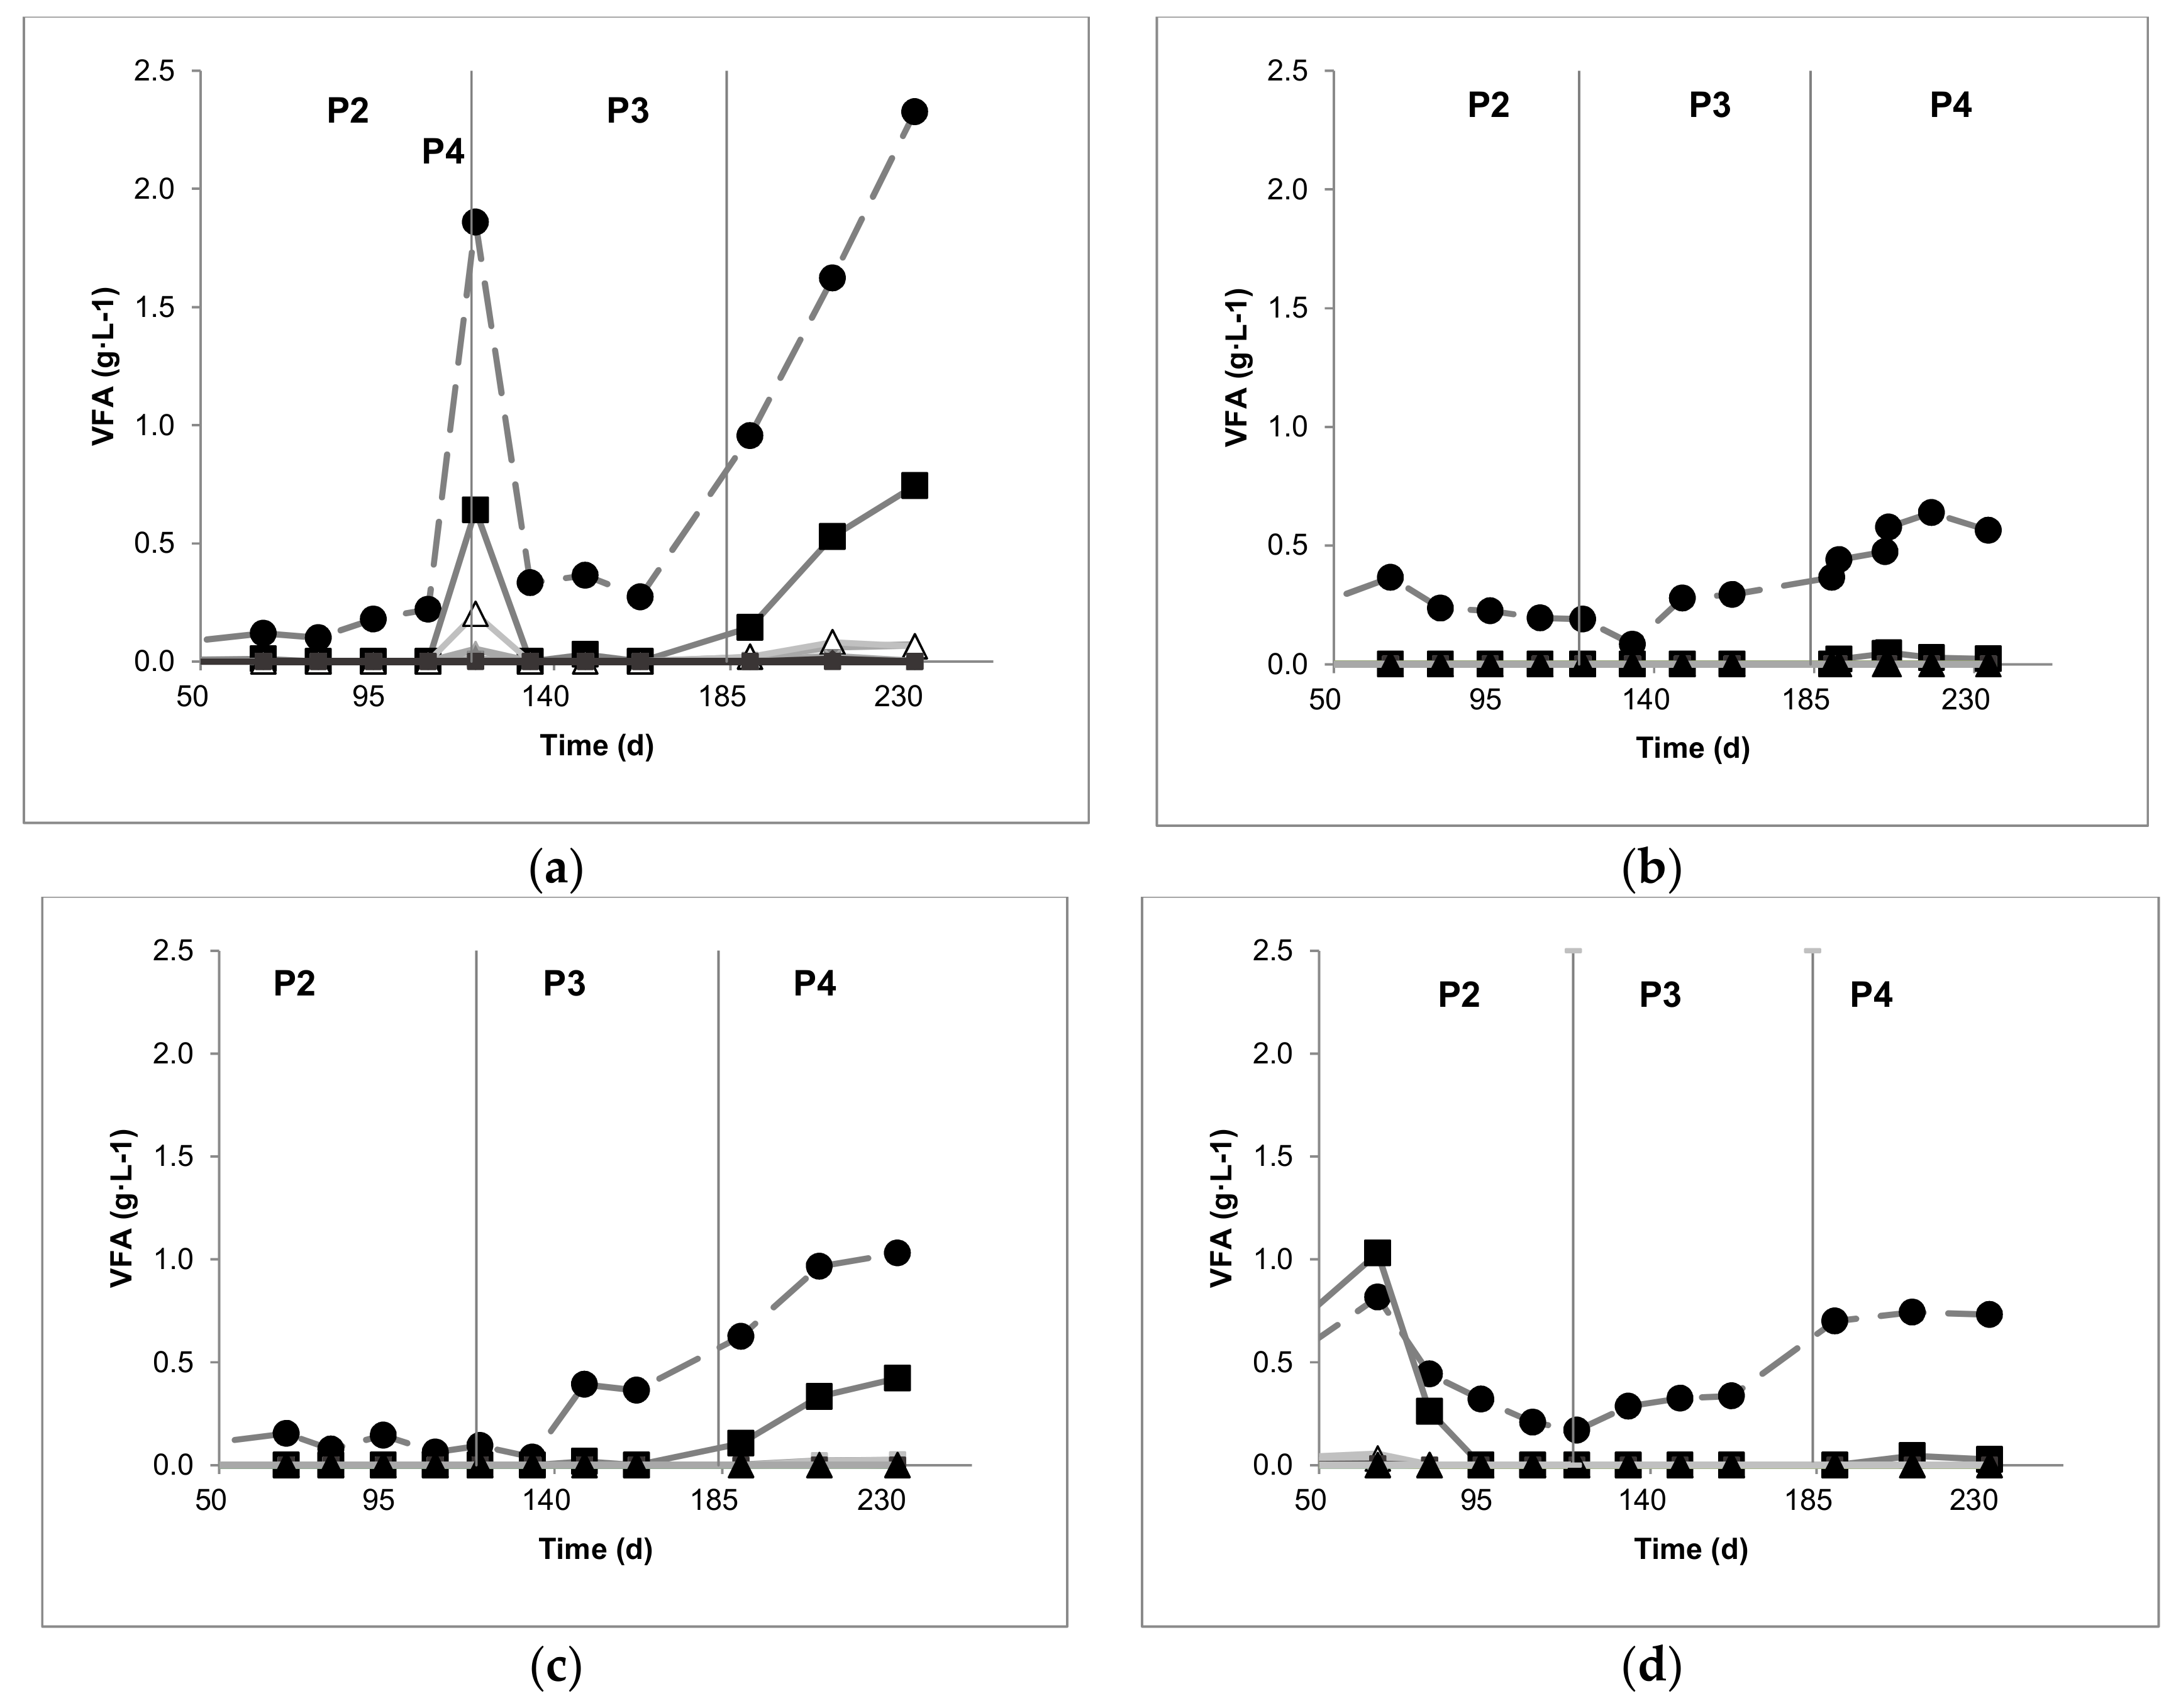
3.3.2. VFA, pH, and Alkalinity Profiles

VFA, pH, and alkalinity are important control parameters during AD [47]. The pH average values in all reactors were slightly higher (8.1 ± 0.2, 8.0 ± 0.1, 8.0 ± 0.1 and 8.0 ± 0.2 in reactors R1, R2, R3, and R4, respectively) than the range for the normal operation of AD, between 7.5 and 7.8. This was probably due to the highest TA values registered during all periods, with averages of 11.1 ± 1.9, 10.1 ± 0.6, 10.6 ± 0.7, 10.6 ± 1.1 gCaCO3 L−1 in reactors R1, R2, R3, and R4, respectively. Moreover, changes in VFA were shown to have a significant effect on TA, with the biggest fall in R1 during P3, when a decrease of VFA from 1859 to 333 mg·L−1 caused a decrease of TA from 15.7 to 9.2 gCaCO3 L−1. The percentages of acetic acid were 91 ± 10.5, 98 ± 2.5, 94 ± 9.7, and 92 ± 16.6 in reactors R1, R2, R3, and R4, respectively. These were higher than other studies reported in the literature, with ranges of 35% to 75% [51] or 60% to 75% [52]. Angelidaki et al. [53] found a common value of 1.5 g L−1 was considered to be limiting for a stable operation of AD reactors. It can be seen that total VFA concentrations in effluent (Figure 6) were lower than 2 g·L−1 in all reactors with the exception of R1 when it was operated at high OLR during the P4 period. The average total VFA values were 1.0 ± 1.0, 0.4 ± 0.2, 0.4 ± 0.5, and 0.6 ± 0.4 g·L−1 in reactors R1, R2, R3, and R4, respectively.

3.3.3. Nitrogen (TKN, TAN) Profile

In general, the inhibition of the anaerobic digestion process has been reported to start at a TAN level of 1.5–2.0 gN·L−1. However, in the case of pig manure, it has been reported to start at 3.1 gN·L−1. The registered TAN averages values were 2.1 ± 0.2, 2.1 ± 0.1, 2.7 ± 0.2, 2.9 ± 0.3 gN·L−1 in reactors R1, R2, R3, and R4, respectively. The maximum amount of TAN registered (3.8 gN·L−1) was in reactor R1 during P4, where a lower MY value was obtained (23.5 ± 23.0 LCH4 kgVS−1). That would confirm the starting TAN level of 3.1 gN·L−1 to be inhibitory for the process.

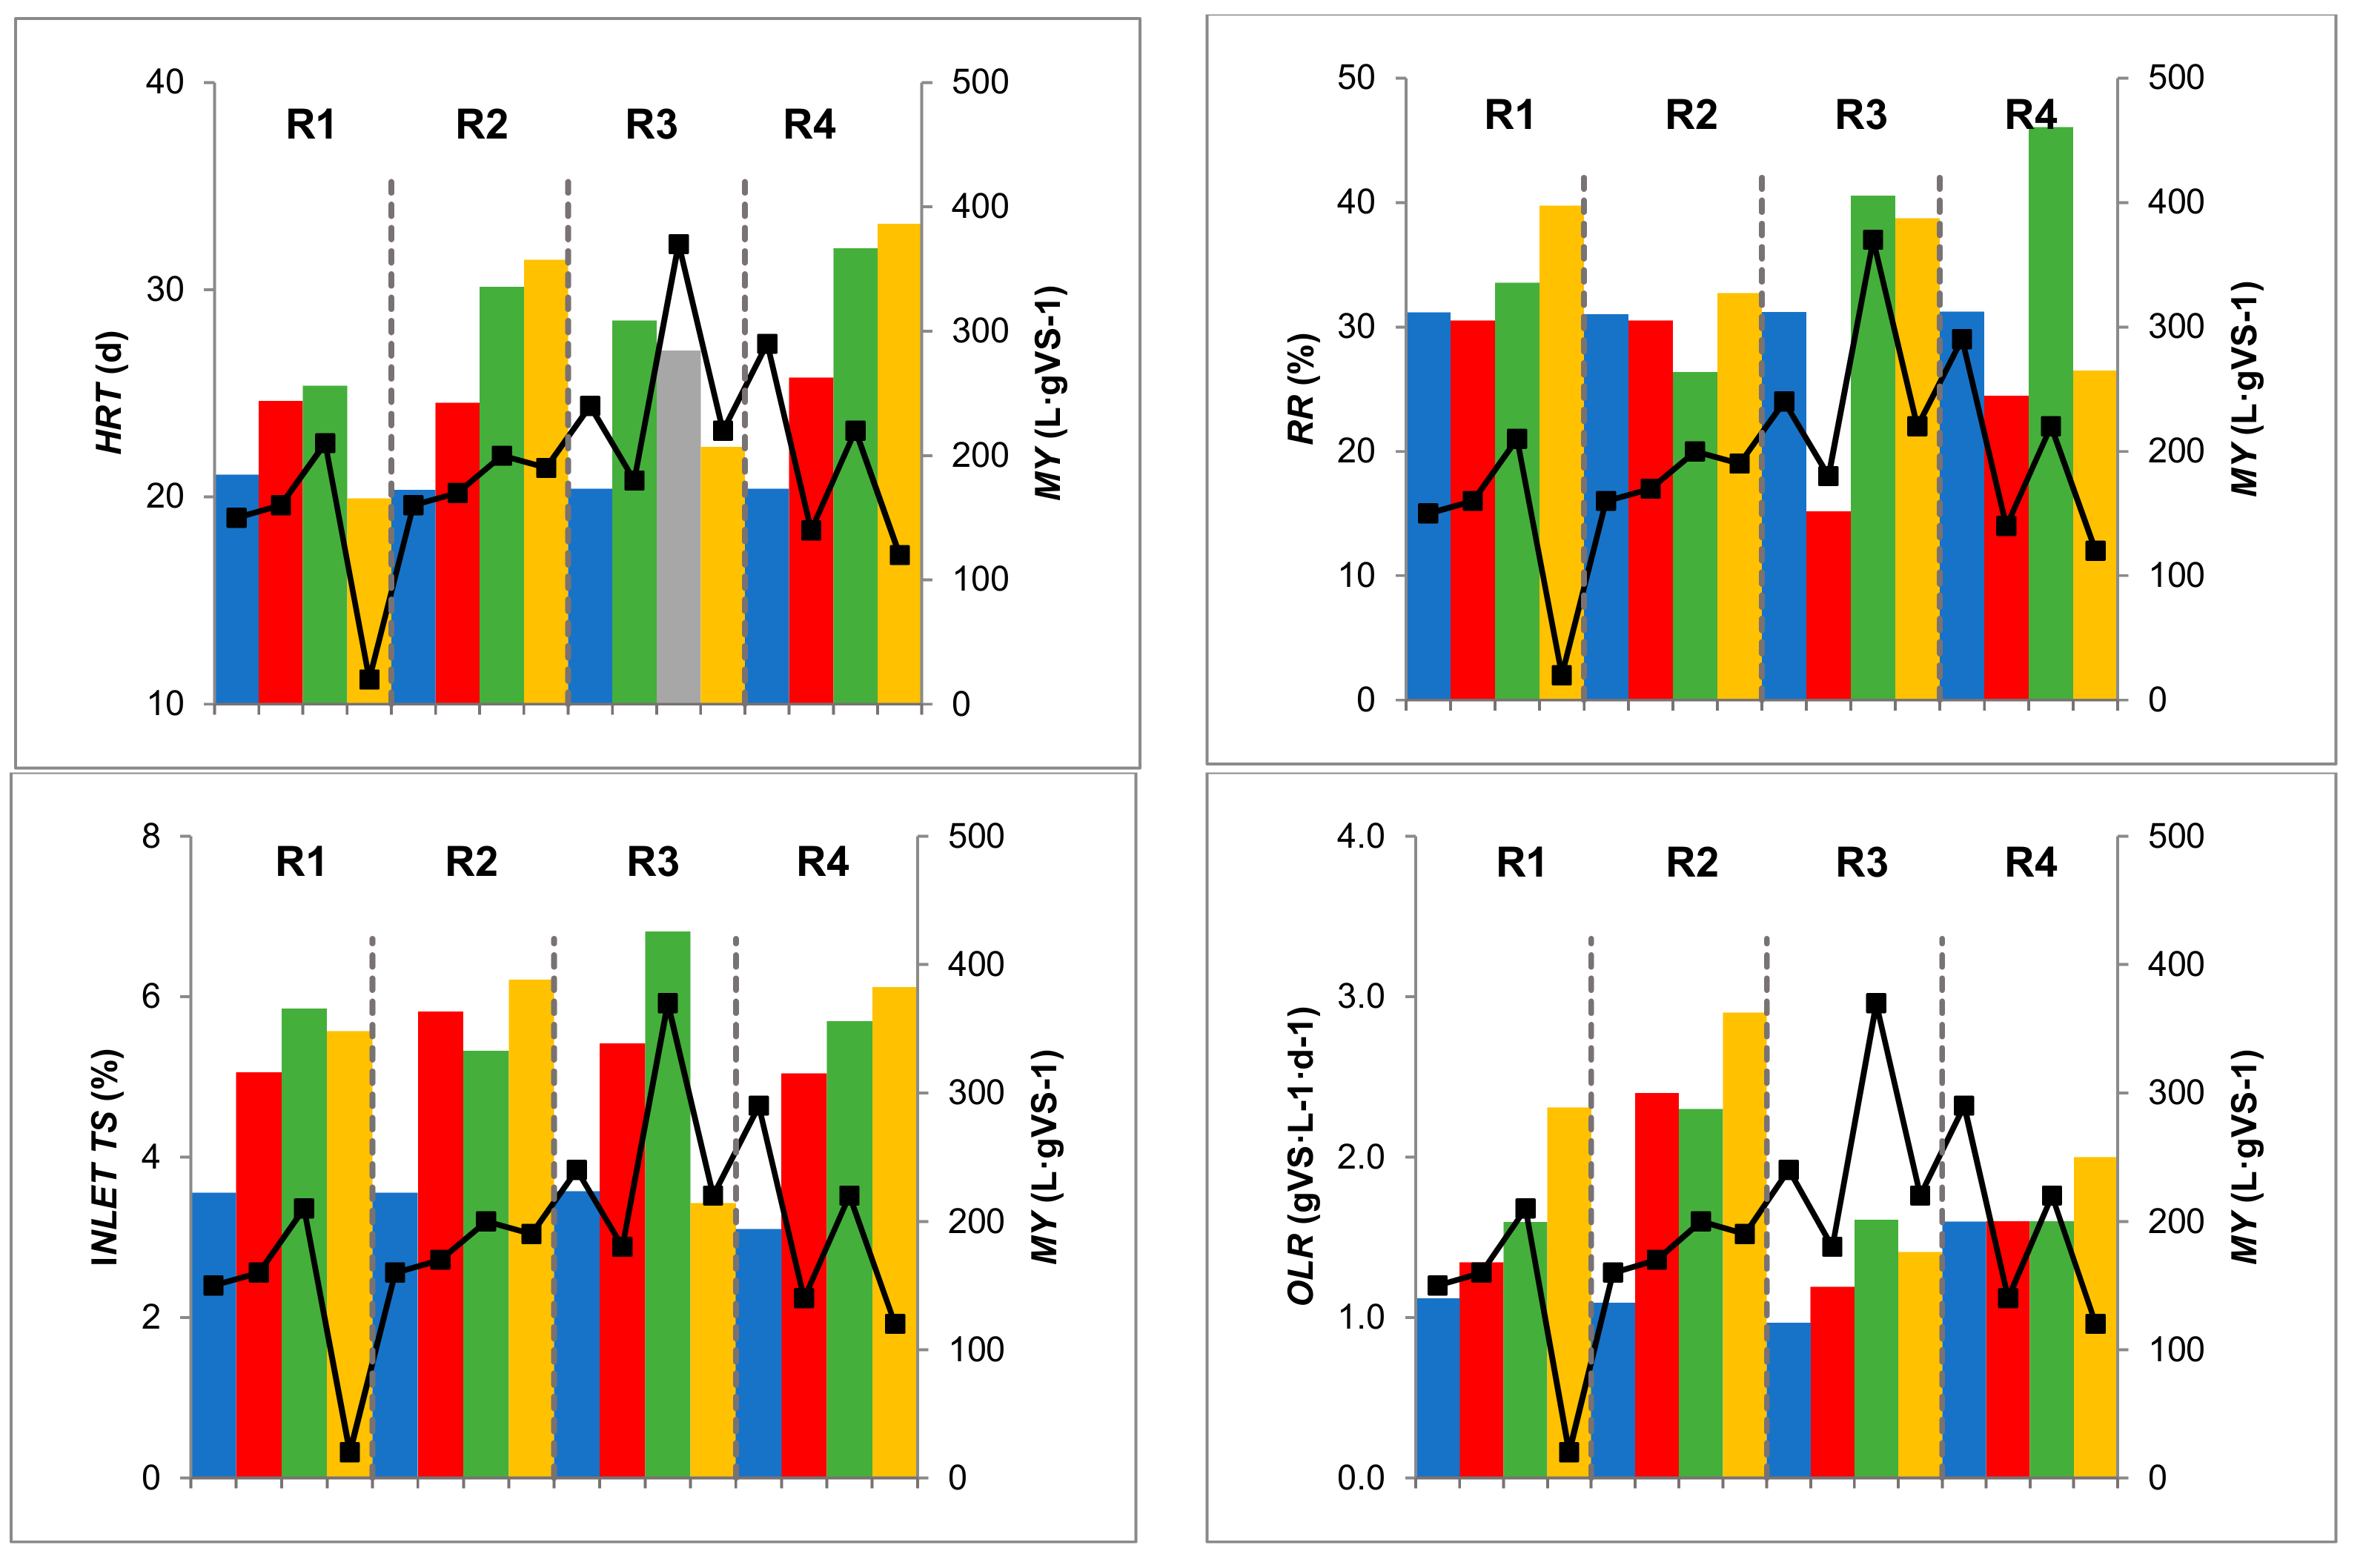
3.3.4. Effect of Recirculation

Figure 2 shows the operational parameter evolution for each period and reactor. The reported literature has confirmed positive effects by varying RR in AD, such as the liquefaction and inoculation of the fresh biogas substrate, the stabilization of biogas synthesis and the optimization of biogas production [54].
When RR decreased, VFA concentration increased. That can be seen clearly in R4, when changing from P2 to P3, the RR variation from 24.5 ± 4.2 to 46.1 ± 9.8% caused a maximum decrease of 90% of VFA. Increases in MY values were observed with higher RR values, as can be seen in R3 and R4 from P2 to P3 (increases of 105.5% and 57.1% in R3 and R4, respectively). Results suggest RR values up to 40% should be used in order to keep stable conditions of the bacterial population inside the reactor, optimizing biogas production.

3.3.5. Effect of the Organic Loading Rate

In general, the expected trend for HRT and OLR was confirmed in all reactors, as the biogas production increased when increasing HRT or OLR, with some exceptions: R1 during P4, probably due to the ammonia inhibition effects mentioned before. Also increases of OLR in R3 during P2 and in R4 during P2 and P4 did not increase the MY, probably due to the decreased RR in these reactors and periods. An increase of acetic and propionic acid concentrations was also observed with OLR increases, such as in R1 and R2 during both P3 and P4 periods.

3.3.6. Effect of Total Solid Content

As the OLR depends on inlet-TS concentration, similar performances were evaluated. At higher inlet-TS concentrations, higher MY values were obtained. The maximum MY obtained was in R3 during P3 (373.7 ± 49.7 LCH4 kgVS−1) with 6.81 ± 1.35 % TS. H.M. El-Mashad et al. [51] concluded that a higher TS content resulted in higher VFA concentrations. Although there was not a clear correlation in our results between inlet-TS contents and VFA (see Table 4), a similar trend was exhibited as the reported study of Page et al. [55]; when evaluating dairy manure effluent at 2.4% TS, a range of 89–439 mg·L−1 of VFA was obtained.

4. Conclusions

A novel modified plug-flow anaerobic reactor for treating animal slurries was developed and tested successfully with appropriate performance. The mixing power inputs and the intermittent mixing pattern allowed for the avoidance of operational problems such as solid stratification, foaming, or scum generation. In general, there was no inhibition due to ammonia concentration, except for reactor R1 during P4. VFA generation allowed stable conditions. The methane yields were optimized during some of the periods, showing how significant the operational parameters evaluated are. However, it seems that complex automation and equipment design involves facing the important problem of the scale factor.

Author Contributions

D.G., J.L.R., B.F. and F.H. wrote the paper; J.L.R. and B.F. designed the experiments; D.G., E.M., L.T. and M.R. performed the experiments.

Funding

This research was funded by private funds from ProCycla SA, a privately held company. Research was conducted in IRTA—Institut de Recerca i Tecnologia Agroalimentàries (Spain). IRTA thanks the financial support of CERCA program of the Generalitat de Catalunya.

Conflicts of Interest

The authors declare no conflicts of interest.

References

  1. Lukehurst, C.T.; Frost, P.; Al Seadi, T. Utilisation of digestate from biogas plants as biofertiliser. IEA Bioenergy 2010, 2010, 1–36. [Google Scholar]
  2. De Mes, T.Z.D.; Stams, A.J.M.; Reith, J.H.; Zeeman, G. Chapter 4: Methane production by anaerobic digestion of wastewater and solid wastes. In Bio-Methane Bio-Hydrogen: Status and Perspectives of Biological Methane and Hydrogen Production; Dutch Biological Hydrogen Foundation: The Hague, The Netherlands, 2003; pp. 58–102. [Google Scholar]
  3. Manyi-Loh, C.; Mamphweli, S.; Meyer, E.; Okoh, A.; Makaka, G.; Simon, M.; Manyi-Loh, C.E.; Mamphweli, S.N.; Meyer, E.L.; Okoh, A.I.; et al. Microbial Anaerobic Digestion (Bio-Digesters) as an Approach to the Decontamination of Animal Wastes in Pollution Control and the Generation of Renewable Energy. Int. J. Environ. Res. Public Health 2013, 10, 4390–4417. [Google Scholar] [CrossRef] [PubMed]
  4. Mao, C.; Feng, Y.; Wang, X.; Ren, G. Review on research achievements of biogas from anaerobic digestion. Renew. Sustain. Energy Rev. 2015, 45, 540–555. [Google Scholar] [CrossRef]
  5. Crittenden, J.C.; Montgomery, W.H. Water Treatment Principles and Design; John Wiley & Sons: Hoboken, NJ, USA, 2005. [Google Scholar]
  6. Levenspiel, O. Chemical Reaction Engineering, 3rd ed.; John Wiley & Sons: New York, NY, USA, 1999. [Google Scholar]
  7. Wen, Z.; Frear, C.; Chen, S. Anaerobic digestion of liquid dairy manure using a sequential continuous-stirred tank reactor system. J. Chem. Technol. Biotechnol. 2007, 82, 758–766. [Google Scholar] [CrossRef]
  8. Burke, D.A. Dairy Waste Anaerobic Digestion Handbook; Environmental Energy Company: Olympia, WA, USA, 2001; Volume 6007, pp. 17–27. [Google Scholar]
  9. Krich, K.; Augenstein, D.; Batmale, J.P.; Benemann, J.; Rutledge, B.; Salour, D. Chapter 8 Financial Analysis of Biomethane Production. In Biomethane from Dairy Waste. A Sourcebook for the Production and Use of Renewable Natural Gas in California; Western United Dairymen: Modesto, CA, USA, 2005; pp. 147–162. [Google Scholar]
  10. Li, Y.-F.; Chen, P.-H.; Yu, Z. Spatial and temporal variations of microbial community in a mixed plug-flow loop reactor fed with dairy manure. Microb. Biotechnol. 2014, 7, 332–346. [Google Scholar] [CrossRef] [PubMed]
  11. Azbar, N.; Ursillo, P.; Speece, R.E. Effect of process configuration and substrate complexity on the performance of anaerobic processes. Water Res. 2001, 35, 817–829. [Google Scholar] [CrossRef]
  12. Batstone, D.J.; Puyol, D.; Flores-Alsina, X.; Rodríguez, J. Mathematical modelling of anaerobic digestion processes: Applications and future needs. Rev. Environ. Sci. Bio/Technol. 2015, 14, 595–613. [Google Scholar] [CrossRef]
  13. Cantrell, K.B.; Ducey, T.; Ro, K.S.; Hunt, P.G. Livestock waste-to-bioenergy generation opportunities. Bioresour. Technol. 2008, 99, 7941–7953. [Google Scholar] [CrossRef]
  14. Speece, R.E.; Duran, M.; Demirer, G.; Zhang, H.; DiStefano, T. The role of process configuration in the performance of anaerobic systems. Water Sci. Technol. 1997, 36, 539–547. [Google Scholar] [CrossRef]
  15. Monnet, F. An introduction to anaerobic digestion of organic wastes. Remade Scotl. 2003, 379, 1–48. [Google Scholar]
  16. Wilkie, A.C. Anaerobic digestion of dairy manure: Design and process considerations. Dairy Manure Manag. Treat. Handl. Community Relat. 2005, 301, 312. [Google Scholar]
  17. Dvorak, S.; Frear, C. Commercial Demonstration of Nutrient Recovery of Ammonium Sulfate and Phosphorous Rich Fines from AD Effluent. 2014. Available online: http://hdl.handle.net/1813/36526 (accessed on 7 July 2019).
  18. Lansing, S.; Martin, J.F.; Botero, R.B.; da Silva, T.N.; da Silva, E.D. Methane production in low-cost, unheated, plug-flow digesters treating swine manure and used cooking grease. Bioresour. Technol. 2010, 101, 4362–4370. [Google Scholar] [CrossRef] [PubMed]
  19. Lansing, S.; Botero, R.B.; Martin, J.F. Waste treatment and biogas quality in small-scale agricultural digesters. Bioresour. Technol. 2008, 99, 5881–5890. [Google Scholar] [CrossRef] [PubMed]
  20. Martin, J.H. An Evaluation of a Mesophilic, Modified Plug Flow Anaerobic Digester for Dairy Cattle Manure; EPA Contract No. GS 10F-0036K Work Assignment/Task Order 9; East. Res. Group, Inc.: Morrisville, NC, USA, 2005. [Google Scholar]
  21. Martin, J.H. Comparison of Dairy Cattle Manure Management with and without Anaerobic Digestion and Biogas Utilization; Eastern Research Group, Inc.: Boston MA for AgStar Program; U.S. Environmental Protection Agency: Washington, DC, USA, 2003. [Google Scholar]
  22. St-Pierre, B.; Wright, A.-D.G. Metagenomic analysis of methanogen populations in three full-scale mesophilic anaerobic manure digesters operated on dairy farms in Vermont, USA. Bioresour. Technol. 2013, 138, 277–284. [Google Scholar] [CrossRef] [PubMed]
  23. Yu, Z.; Morrison, M.; Schanbacher, F.L. Production and utilization of methane biogas as renewable fuel. Biomass to biofuels Strateg. Glob. Ind. 2010, 403–433. [Google Scholar] [CrossRef]
  24. Beddoes, J.C.; Bracmort, K.S.; Burns, R.T.; Lazarus, W.F. An analysis of energy production costs from anaerobic digestion systems on US livestock production facilities. USDA NRCS Tech. Note 2007, 1, 7–10. [Google Scholar]
  25. Chynoweth, D.P.; Isaacson, R. Anaerobic Digestion of Biomass; Chynoweth, D.P., Isaacson, R., Eds.; Elsevier applied Science; Springer: Dordrecht, The Netherlands, 1987; ISBN 978-1-85166-069-8. [Google Scholar]
  26. Jagadish, K.; Chanakya, H.; Rajabapaiah, P.; Anand, V. Plug flow digestors for biogas generation from leaf biomass. Biomass Bioenergy 1998, 14, 415–423. [Google Scholar] [CrossRef]
  27. Karim, K.; Thomas Klasson, K.; Hoffmann, R.; Drescher, S.R.; DePaoli, D.W.; Al-Dahhan, M.H. Anaerobic digestion of animal waste: Effect of mixing. Bioresour. Technol. 2005, 96, 1607–1612. [Google Scholar] [CrossRef] [PubMed]
  28. Meroney, R.N.; Colorado, P.E. CFD simulation of mechanical draft tube mixing in anaerobic digester tanks. Water Res. 2009, 43, 1040–1050. [Google Scholar] [CrossRef] [PubMed]
  29. Stalin, N.; Prabhu, H.J. Performance evaluation of partial mixing anaerobic digester. ARPN J. Eng. Appl. Sci. 2007, 2, 1–6. [Google Scholar]
  30. Vesvikar, M. Understanding the Hydrodynamics and Performance of Anaerobic Digesters, Chemical Reaction Engineering Laboratory; Washingt. Univ.: St. Louis, MO, USA, 2007. [Google Scholar]
  31. Kaparaju, P.; Buendia, I.; Ellegaard, L.; Angelidakia, I. Effects of mixing on methane production during thermophilic anaerobic digestion of manure: Lab-scale and pilot-scale studies. Bioresour. Technol. 2008, 99, 4919–4928. [Google Scholar] [CrossRef] [PubMed]
  32. Agency, E.P. EPA Design Information Report–anaerobic digester mixing systems. J. Water Pollut. Control Fed. 1987, 59, 162–170. [Google Scholar]
  33. Wu, B. Large eddy simulation of mechanical mixing in anaerobic digesters. Biotechnol. Bioeng. 2012, 109, 804–812. [Google Scholar] [CrossRef] [PubMed]
  34. Couper, R.; Penney, W.R.; Fair, J.R.; Walas, S.M. Chemical Process Equipment, 2nd ed.; Elsevier Inc.: Amsterdam, The Netherlands, 2005; ISBN 978-0-7506-7510-9. [Google Scholar]
  35. Rodríguez-Abalde, Á.; Fernández García, B.; Flotats Ripoll, X. Effect of thermal pre-treatments on biogas production potential of solid slaughterhouse wastes. In Proceedings of the 17th European Biomass Conference & Exhibition—From Research to Industry and Markets, Hamburg, Germany, 29 June–3 July 2009; pp. 252–256. [Google Scholar]
  36. Soto, M.; Méndez, R.; Lema, J.M. Methanogenic and non-methanogenic activity tests. Theoretical basis and experimental set up. Water Res. 1993, 27, 1361–1376. [Google Scholar] [CrossRef]
  37. Li, P.; Li, W.; Sun, M.; Xu, X.; Zhang, B.; Sun, Y. Evaluation of Biochemical Methane Potential and Kinetics on the Anaerobic Digestion of Vegetable Crop Residues. Energies 2019, 12, 26. [Google Scholar] [CrossRef]
  38. Appels, L.; Baeyens, J.; Degrève, J.; Dewil, R. Principles and potential of the anaerobic digestion of waste-activated sludge. Prog. Energy Combust. Sci. 2008, 34, 755–781. [Google Scholar] [CrossRef]
  39. Association, A.P.H.; Association, A.W.W.; Federation, W.P.C.; Federation, W.E. Standard Methods for the Examination of Water and Wastewater; American Public Health Association (APHA): Washington, DC, USA, 2005. [Google Scholar]
  40. Noguerol-Arias, J.; Rodríguez-Abalde, A.; Romero-Merino, E.; Flotats, X. Determination of Chemical Oxygen Demand in Heterogeneous Solid or Semisolid Samples Using a Novel Method Combining Solid Dilutions as a Preparation Step Followed by Optimized Closed Reflux and Colorimetric Measurement. Anal. Chem. 2012, 84, 5548–5555. [Google Scholar] [CrossRef]
  41. Kinyua, M.N.; Rowse, L.E.; Ergas, S.J. Review of small-scale tubular anaerobic digesters treating livestock waste in the developing world. Renew. Sustain. Energy Rev. 2016, 58, 896–910. [Google Scholar] [CrossRef] [Green Version]
  42. Agency, E.P. Anaerobic Digester Conservation Practice Standard Number 366; USDA Natural Resources Conservation Service: New York, NY, USA, 2009. [Google Scholar]
  43. Møller, H.B.; Sommer, S.G.; Ahring, B.K. Methane productivity of manure, straw and solid fractions of manure. Biomass Bioenergy 2004, 26, 485–495. [Google Scholar] [CrossRef]
  44. Hansen, K.H.; Angelidaki, I.; Ahring, B.K. Anaerobic digestion of swine manure: Inhibition by ammonia. Water Res. 1998, 32, 5–12. [Google Scholar] [CrossRef]
  45. Flotats, X.; Bonmatí, A.; Fernández, B.; Magrí, A. Manure treatment technologies: On-farm versus centralized strategies. NE Spain as case study. Bioresour. Technol. 2009, 100, 5519–5526. [Google Scholar] [CrossRef]
  46. Hreiz, R.; Adouani, N.; Fünfschilling, D.; Marchal, P.; Pons, M.-N. Rheological characterization of raw and anaerobically digested cow slurry. Chem. Eng. Res. Des. 2017, 119, 47–57. [Google Scholar] [CrossRef]
  47. Nagy, G.; Wopera, A. Biogas production from pig slurry-feasibility and challenges. Mat. Sci. Eng. 2012, 37, 65–75. [Google Scholar]
  48. Muzondiwa, R.; Kamusoko, R. Methods for determination of biomethane potential of feedstocks: A review. Biofuel Res. J. 2017, 4, 573–586. [Google Scholar] [CrossRef]
  49. Sunada, N.S.; Amorim, A.C.; Previdelli, M.A.; Miranda, F.; Garófallo, R.; Mendes, A.R. Potential of biogas and methane production from anaerobic of poultry slaughterhouse effluent. R. Bras. Zootec. 2012, 41. [Google Scholar] [CrossRef]
  50. Donoso-Bravo, A.; Sadino-Riquelme, C.; Gómez, D.; Segura, C.; Valdebenito, E.; Hansen, F. Modelling of an anaerobic plug-flow reactor. Process analysis and evaluation approaches with non-ideal mixing coniderations. Bioresour. Technol. 2018, 260, 95–104. [Google Scholar] [CrossRef]
  51. El-Mashad, H.M.; Zhang, R.; Arteaga, V.; Rumsey, T.; Mitloehner, F.M. Volatile Fatty acids and Alcohols Production during Anaerobic Storage of Dairy Manure. Trans. ASABE 2011, 54, 599–607. [Google Scholar] [CrossRef]
  52. Ratanatamskul, C.; Saleart, T. Effects of sludge recirculation rate and mixing time on performance of a prototype single-stage anaerobic digester for conversion of food wastes to biogas and energy recovery. Environ. Sci. Pollut. Res. 2016, 23, 7092–7098. [Google Scholar] [CrossRef] [PubMed]
  53. Angelidaki, I.; Boe, K.; Ellegaard, L. Effect of operating conditions and reactor configuration on efficiency of full-scale biogas plants. Water Sci. Technol. 2005, 52, 189–194. [Google Scholar] [CrossRef]
  54. Michele, P.; Giuliana, D.; Carlo, M.; Sergio, S.; Fabrizio, A. Optimization of solid state anaerobic digestion of the OFMSW by digestate recirculation: A new approach. Waste Manag. 2015, 35, 111–118. [Google Scholar] [CrossRef]
  55. Page, L.H.; Ni, J.Q.; Heber, A.J.; Mosier, N.S.; Liu, X.; Joo, H.S.; Ndegwa, P.M.; Harrison, J.H. Characteristics of volatile fatty acids in stored dairy manure before and after anaerobic digestion. Biosyst. Eng. 2014, 118, 16–28. [Google Scholar] [CrossRef]
Figure 1. Scheme of the pilot plant: Numbers: (1) influent tank; (2) effluent tanks; (3) gas holder; (4) biogas flow-meter. Nomenclature: IN, influent; EF, effluent; B, biogas.
Energies 12 02628 g001
Figure 2. Operational parameter: Hydraulic retention time (HRT), recirculation rate (RR), inlet total solids content (inlet-TS), and organic loading rate (OLR) per reactor and period. (a) R1; (b) R2; (c) R3; (d) R4. Note: Vertical grey lines denote periods; black lines denote average HRT per period; green lines denote average RR per period; blue lines denote average inlet-TS per period; red lines denote average OLR per period.
Energies 12 02628 g002aEnergies 12 02628 g002b
Figure 3. Evolution of organic matter removal (VS removal) and methane yield (MY) per reactor and period: (a) R1, (b) R2, (c) R3, (d) R4. Note: Vertical grey lines denote periods; green lines denote average values of VS removal efficiency for each whole period; red and blue lines denote average values of MY registered by flowmeter and COD balance, respectively, for each whole period.
Energies 12 02628 g003
Figure 4. Evolution of H2S and O2 daily concentrations per reactor: (a) R1; (b) R2; (c) R3; (d) R3. Note: Vertical grey lines denote measurements done before and after 10:00 am; blue squares denote H2S concentrations; red circles denote O2 concentrations.
Energies 12 02628 g004aEnergies 12 02628 g004b
Figure 5. Comparison of methane yields (MY) and the hydraulic retention time (HRT), the recirculation rate (RR), the inlet total solids content (TS) or the organic loading rate (OLR). Note: Vertical grey lines denote reactors; black line denotes average values of MY registered in a whole period; blue, red, green and yellow bars denote average values of a whole period (P1, P2, P3, and P4, respectively) of the corresponding operational parameter per reactor.
Energies 12 02628 g005
Figure 6. Evolution of volatile fatty acids (VFA) per reactor and period: (a) R1, (b) R2, (c) R3, (d) R3. Symbols: Acetic (●), propionic (■), i-butyric (▲), n-butyric (○), i-valeric (x), n-valeric (∆), i-caproic (■), n-caproic (□).
Energies 12 02628 g006
Table 1. Characterization of fresh pig manure. (FM, fresh manure. COD, chemical oxygen demand. TS, VS, total and volatile solids. TKN, TAN, total Kjeldahl and ammonia nitrogen. R, methane production rate. λ, lag phase. Nd, not determined).
Fresh Manure (FM)FM1FM2FM3FM4FM5Averages
COD (gO2 kg−1)120.596.190.483.1113.5100.7 ± 14.1
TS (g kg−1)105.1105.699.3104.4113.0105.5 ± 4.4
VS (g kg−1)75.284.379.375.780.078.9 ± 3.3
TKN (gN kg−1)6.06.16.06.86.36.2 ± 0.3
TAN (gN kg−1)3.73.84.04.54.24.0 ± 0.3
Biodegrability (%COD)33%nd31%47%nd37 ± 7.0
CH4 Yield (m3CH4 kgVS−1)0.184nd0.1250.181nd0.163 ± 0.027
R (m3CH4 kgCOD−1 d−1)5.8-6.914.0-8.9 ± 4.1
λ (d)1.9-14.0--
Table 2. Operational conditions. Average values ± Standard Error. Nomenclature: inlet total solids (inlet-TS), hydraulic retention time (HRT), recirculation rate (RR), organic loading rate (OLR). Abbreviations: period (P), average (Av), volatile solids (VS).
ParametersP1P2P3P4
Time Interval (Days)1–5657–120121–186187–255
Digester R1Av. ErrorAv. ErrorAv. ErrorAv. Error
Inlet-TS (%)3.58 ±0.015.30 ±0.545.85 ±0.685.57 ±1.07
HRT (d)21.08 ±4.2624.64 ±2.8425.37 ±3.6019.94 ±2.68
RR (%effluent)31.17 ±6.2330.52 ±4.1533.55 ±5.5139.74 ±4.59
OLR (kgVS m−3 d−1)1.12 ±0.221.39 ±0.151.50 ±0.241.92 ±0.29
Digester R2
Inlet TS (%)3.68 ±0.055.64 ±0.575.45 ±0.996.21 ±0.33
HRT (d)20.35 ±4.0824.54 ±3.0030.15 ±3.8231.44 ±2.54
RR (%effluent)31.03 ±6.2130.53 ±3.9426.37 ±4.3832.71 ±4.93
OLR (kgVS m−3 d−1)1.14 ±0.232.40 ±0.132.30 ±0.602.90 ±0.50
Digester R3
Inlet TS (%)3.57 ±0.005.60 ±0.866.81 ±1.353.43 ±0.18
HRT (d)20.39 ±4.0928.51 ±4.4127.06 ±4.3722.41 ±2.24
RR (%effluent)31.21 ±6.2415.17 ±16.1540.57 ±7.9938.73 ±4.89
OLR (kgVS m−3 d−1)1.11 ±0.221.21 ±0.181.61 ±0.331.41 ±0.17
Digester R4
Inlet TS (%)3.10 ±0.005.10 ±0.405.70 ±0.696.12 ±0.31
HRT (d)20.39 ±4.0925.76 ±3.5732.01 ±4.0733.19 ±3.07
RR (%effluent)31.23 ±6.2524.46 ±4.1746.08 ±9.8126.50 ±4.78
OLR (kgVS m−3 d−1)1.60 ±0.201.60 ±0.301.60 ±0.102.00 ±0.20
Table 3. Control parameters (methane productivity and yield, and organic matter removal). Nomenclature: methane yield (MY), volumetric methane yield (VMY), period (P), average (Av).
ParametersP1P2P3P4
Time Interval (Days) 1–56 57–120 121–186 187–255
Digester R1Av. ErrorAv. ErrorAv. ErrorAv. Error
MY (m3CH4 kgVS−1)0.15 ±0.020.16 ±0.100.21 ±0.100.02 ±0.02
VMY (m3CH4 m−3 d−1)0.19 ±0.010.21 ±0.120.30 ±0.140.04 ±0.04
CH4 (%)63.01 ±1.5262.97 ±3.3461.52 ±1.6257.22 ±2.02
O2 (%)0.60 ±1.120.26 ±0.320.71 ±0.711.14 ±1.15
VSremoval (%VS inlet)48.86 ±16.5350.77 ±18.0849.68 ±16.7025.12 ±30.01
Digester R2
MY (m3CH4 kgVS−1)0.16 ±0.020.17 ±0.040.20 ±0.060.19 ±0.04
VMY (m3CH4 m−3 d−1)0.20 ±0.010.22 ±0.060.25 ±0.100.23 ±0.06
CH4 (%)61.32 ±2.1062.06 ±3.7562.90 ±1.4958.81 ±3.32
O2 (%)0.80 ±0.540.31 ±0.370.43 ±0.421.04 ±1.40
VSremoval (%VS inlet)45.34 ±9.4450.72 ±10.0548.78 ±13.8348.91 ±14.08
Digester R3
MY (m3CH4 kgVS−1)0.24 ±0.030.18 ±0.120.37 ±0.050.22 ±0.11
VMY (m3CH4 m−3 d−1)0.30 ±0.020.21 ±0.130.57 ±0.040.42 ±0.13
CH4 (%)60.12 ±2.2159.26 ±3.2962.51 ±2.3359.38 ±4.89
O2 (%)0.41 ±0.760.45 ±0.570.23 ±0.321.06 ±2.50
VSremoval (%VS inlet)46.38 ±20.1146.08 ±29.3346.47 ±20.0351.38 ±26.01
Digester R4
MY (m3CH4 kgVS−1)0.29 ±0.030.14 ±0.110.22 ±0.040.12 ±0.04
VMY (m3CH4 m−3 d−1)0.23 ±0.010.16 ±0.130.26 ±0.050.16 ±0.05
CH4 (%)56.49 ±1.7657.54 ±1.9555.01 ±5.0157.23 ±4.34
O2 (%)1.52 ±0.810.43 ±0.443.13 ±3.340.63 ±1.24
VSremoval (%VS inlet)43.62 ±20.7542.36 ±32.2938.57 ±14.6637.01 ±18.53
Table 4. Correlation coefficients (Pearson coefficients) for parameters. Note: * Significant correlation at 0.05 levels (dark grey). ** Significant correlation at 0.01 levels (light grey). Notes: (1) OLR in gVS m−3 d−1. (2) Methane yield (MY) in LCH4 gVS−1. (3) Volumetric methane yield (VMY) in m3CH4 m−3 d−1. (4) Total Kjeldahl and ammonia nitrogen (TKN, TAN) in mgN L−1. (5) Total volatile fatty acids (VFA) in geq-acetic acid L−1. (6) Intermediate alkalinity (IA) in gCaCO3 L−1.
ParameterPeriodOLR (1)HRT (d)VMY (2)MY (3)RR (%)NTK (4)TAN (4)pHIA (5)VFA (6)VS-Rem (%)CH4 (%)CO2 (%)H2S (ppm)COD-Rem (%)
Period1 0.411 **−0.086−0.115−0.1680.370 **0.306 *0.079−0.301*0.461 **0.412 **−0.213 * −0.356 *0.344 *0.535**−0.218 *
OLR (1) 1 −0.800 **−0.150 −0.2790.438 **0.636 **0.1390.0440.392 **0.684 **−0.331 *0.062−0.0730.467 **−0.339 **
HRT (d) 1 0.190 0.311 *−0.323 *−0.567 **−0.175−0.100−0.308 *−0.582**0.331 *−0.2010.205−0.1420.279
VMY (2) 1 0.972 **0.051 −0.448 **−0.243−0.240−0.191−0.275 0.596 **−0.001−0.0050.2710.812 **
MY (3) 1 −0.053 −0.502 **−0.299 *−0.247−0.233−0.329 *0.658 **−0.0730.0700.1680.866 **
RR (%) 1 0.236−0.0040.0210.1590.217−0.1560.030−0.0380.364 *−0.136
NTK (4) 1 −0.2040.0280.2590.515 **−0.2770.201−0.200−0.062−0.423 **
TAN (4) 1 0.0000.378 *0.251−0.623 **−0.1340.1290.220−0.474 **
pH 1 −0.2770.018−0.1220.008−0.002−0.251−0.343 *
IA (5) 1 0.682 **−0.367 *−0.2830.2770.219−0.266
VFA (6) 1 −0.465 **−0.2170.2120.217−0.362 *
VS-Rem (%) 1 0.112−0.1130.0370.818 **
CH4 (%) 1 −1.000 **−0.045−0.019
CO2 (%) 1 0.0230.018
H2S (ppm) 1 0.034
COD-Rem (%) 1

