Article

Effect of Mixing Regimes on Cow Manure Digestion in Impeller Mixed, Unmixed and Chinese Dome Digesters

1
Centre for Energy Research and Development, Obafemi Awolowo University, 220282 Ile-ife, Nigeria
2
sub-Department Environmental Technology, Wageningen University and Research, 6708 WG Wageningen, The Netherlands
*
Author to whom correspondence should be addressed.
Energies 2019, 12(13), 2540; https://doi.org/10.3390/en12132540
Submission received: 10 April 2019 / Revised: 13 June 2019 / Accepted: 13 June 2019 / Published: 2 July 2019
(This article belongs to the Special Issue Biogas for Rural Areas)

Abstract

:
This study examines the effect of mixing on the performance of anaerobic digestion of cow manure in Chinese dome digesters (CDDs) at ambient temperatures (27–32 °C) in comparison with impeller mixed digesters (STRs) and unmixed digesters (UMDs) at the laboratory scale. The CDD is a type of household digester used in rural and pre-urban areas of developing countries for cooking. They are mixed by hydraulic variation during gas production and gas use. Six digesters (two of each type) were operated at two different influent total solids (TS) concentration, at a hydraulic retention time (HRT) of 30 days for 319 days. The STRs were mixed at 55 rpm, 10 min/hour; the unmixed digesters were not mixed, and the Chinese dome digesters were mixed once a day releasing the stored biogas under pressure. The reactors exhibited different specific biogas production and treatment efficiencies at steady state conditions. The STR 1 exhibited the highest methane (CH4) production and treatment efficiency (volatile solid (VS) reduction), followed by STR 2. The CDDs performed better (10% more methane) than the UMDs, but less (approx. 8%) compared to STRs. The mixing regime via hydraulic variation in the CDD was limited despite a higher volumetric biogas rate and therefore requires optimization.

1. Introduction

About 2.5 billion people globally depend on traditional biomass, for example firewood, as their main source of energy for heating and cooking [1]. The use of firewood as cooking fuel has several negative effects on the environment, health and social life. The collection of firewood is sometimes done by women and children, and this activity can take many hours a day, which indirectly affects productive periods, education and leisure time. The use of firewood and other biomass for cooking produces hazardous particles [2,3], which are dangerous to human health. The use of firewood for cooking is one of the factors that causes deforestation, erosion, reduction of water resources, and indirectly contributes to climate change [2].
About 1.4 billion people worldwide will possibly be left without access to modern sources of cooking energy such as gas and clean stove, if sustainable energy sources are not made available [4]. The conversion of biomass such as agricultural waste, cow manure and pig manure to clean sources of energy such as biogas via anaerobic digestion could help to solve part of this energy problem in the rural areas of developing countries, and improve the standards of living, health, the local environment, and mitigate climate change [5].
Biogas consists of mainly methane (CH4) and carbon dioxide (CO2), with traces of ammonia (NH3), nitrogen (N2) and hydrogen sulphide (H2S). In large-scale anaerobic digesters where biogas is used for electricity and heat production, or injection into the gas network, the calorific value of biogas needs to be increased by removing the unwanted components (for example CO2 and H2S) with the use of different technologies such as water scrubbing, physical and chemical absorption, membrane technology, in situ upgrading, etc. These unwanted components are harmful to the downstream units such as microturbines and combined heat and power (CHP) [6]. However, in household anaerobic digesters, where biogas is primarily for cooking, only H2S is removed with the use of simple and cheap de-sulphuring units, e.g., by allowing biogas to pass through iron fillings.
Household biogas plants for the treatment of organic wastes such as cow manure are mostly popular in Asia. More than forty million household low-cost anaerobic digesters have been built across China and India [7,8,9], with an estimated potential of about 140 million household biogas systems in the agricultural regions in China [10]. The most popular low-cost household digesters are the Chinese dome [11,12,13,14], Indian floating drum, plug flow and Puxin digester—a prefabricated version of the Chinese dome digester [15].
These digesters are relatively inexpensive, unheated and have non-forced mixed systems, making them well suitable for farmers and people living in rural areas. However, the application and specific design of these digesters still depend on location, socio-economic context, and weather conditions of the particular location [16,17].
The anaerobic digestion process depends on mixing for distribution of the inoculum during start-up, improving contact between nutrients substrate and microorganisms, temperature equalization, removal of intermediate products and prevention of settling and floating layers [18]. The Chinese dome digester (CDD), which is the most used applied household digester is usually constructed underground with a hemispherical dome top, which serves as gas storage. Gas pressure is created as a result of biogas production, while collection in a closed environment and slurry level difference in the reactor is a result of the pressure build-up. The stored biogas pushes part of the slurry into the effluent (expansion) chamber, because water or the slurry is an incompressible liquid. During gas use, the effluent flows back into the main digester chamber creating a mixing regime [19]. Mixing in the CDD depends on the hydraulic variation in the digester during digester use and could be regarded as intermittent natural mixing. The mixing depends on the feeding regime, the gas production rate, gas use frequency, and slurry viscosity. Significant efforts have been made to evaluate the effect of mixing in mechanically mixed reactors by applying impeller mixing, slurry recirculation and biogas injection, in comparison to non-mixed reactors [20,21,22,23,24,25,26,27,28,29], but little research was done in studying mixing in naturally mixed reactors. Most of these studies focus on the effects of mixing modes and intensities on biogas yields in relation to retention time and organic loading rate. The optimum mixing mode is still a subject of debate, but most researchers found that intermittent mixing aids anaerobic digestion. Most household digesters are operated at total solid (TS) influent concentrations <7% and a long hydraulic retention time (HRT) (>40 days) [16,30,31,32,33,34,35,36,37,38,39], as compared to mechanically mixed systems, which are generally operated at an HRT ≤ 20 days at mesophilic conditions [26,40,41,42,43,44,45,46,47].
In CDDs, improved mixing might reduce applicable HRTs and therewith reactor volume and investment costs. Moreover, increasing the influent TS concentration by reduced dilution, at the same HRT, will result in an additional reduction of the reactor volume and might increase the mixing conditions due to a higher volumetric gas production. Therefore, the objective of this study was to study the performance of the Chinese dome digester and comparison with the impeller mixed digester and unmixed digester using cow manure at two different total solid (TS) concentrations at the same HRT of 30 days, to evaluate if mixing induced by hydraulic variation is sufficient to produce superior digestion efficiency.

2. Materials and Methods

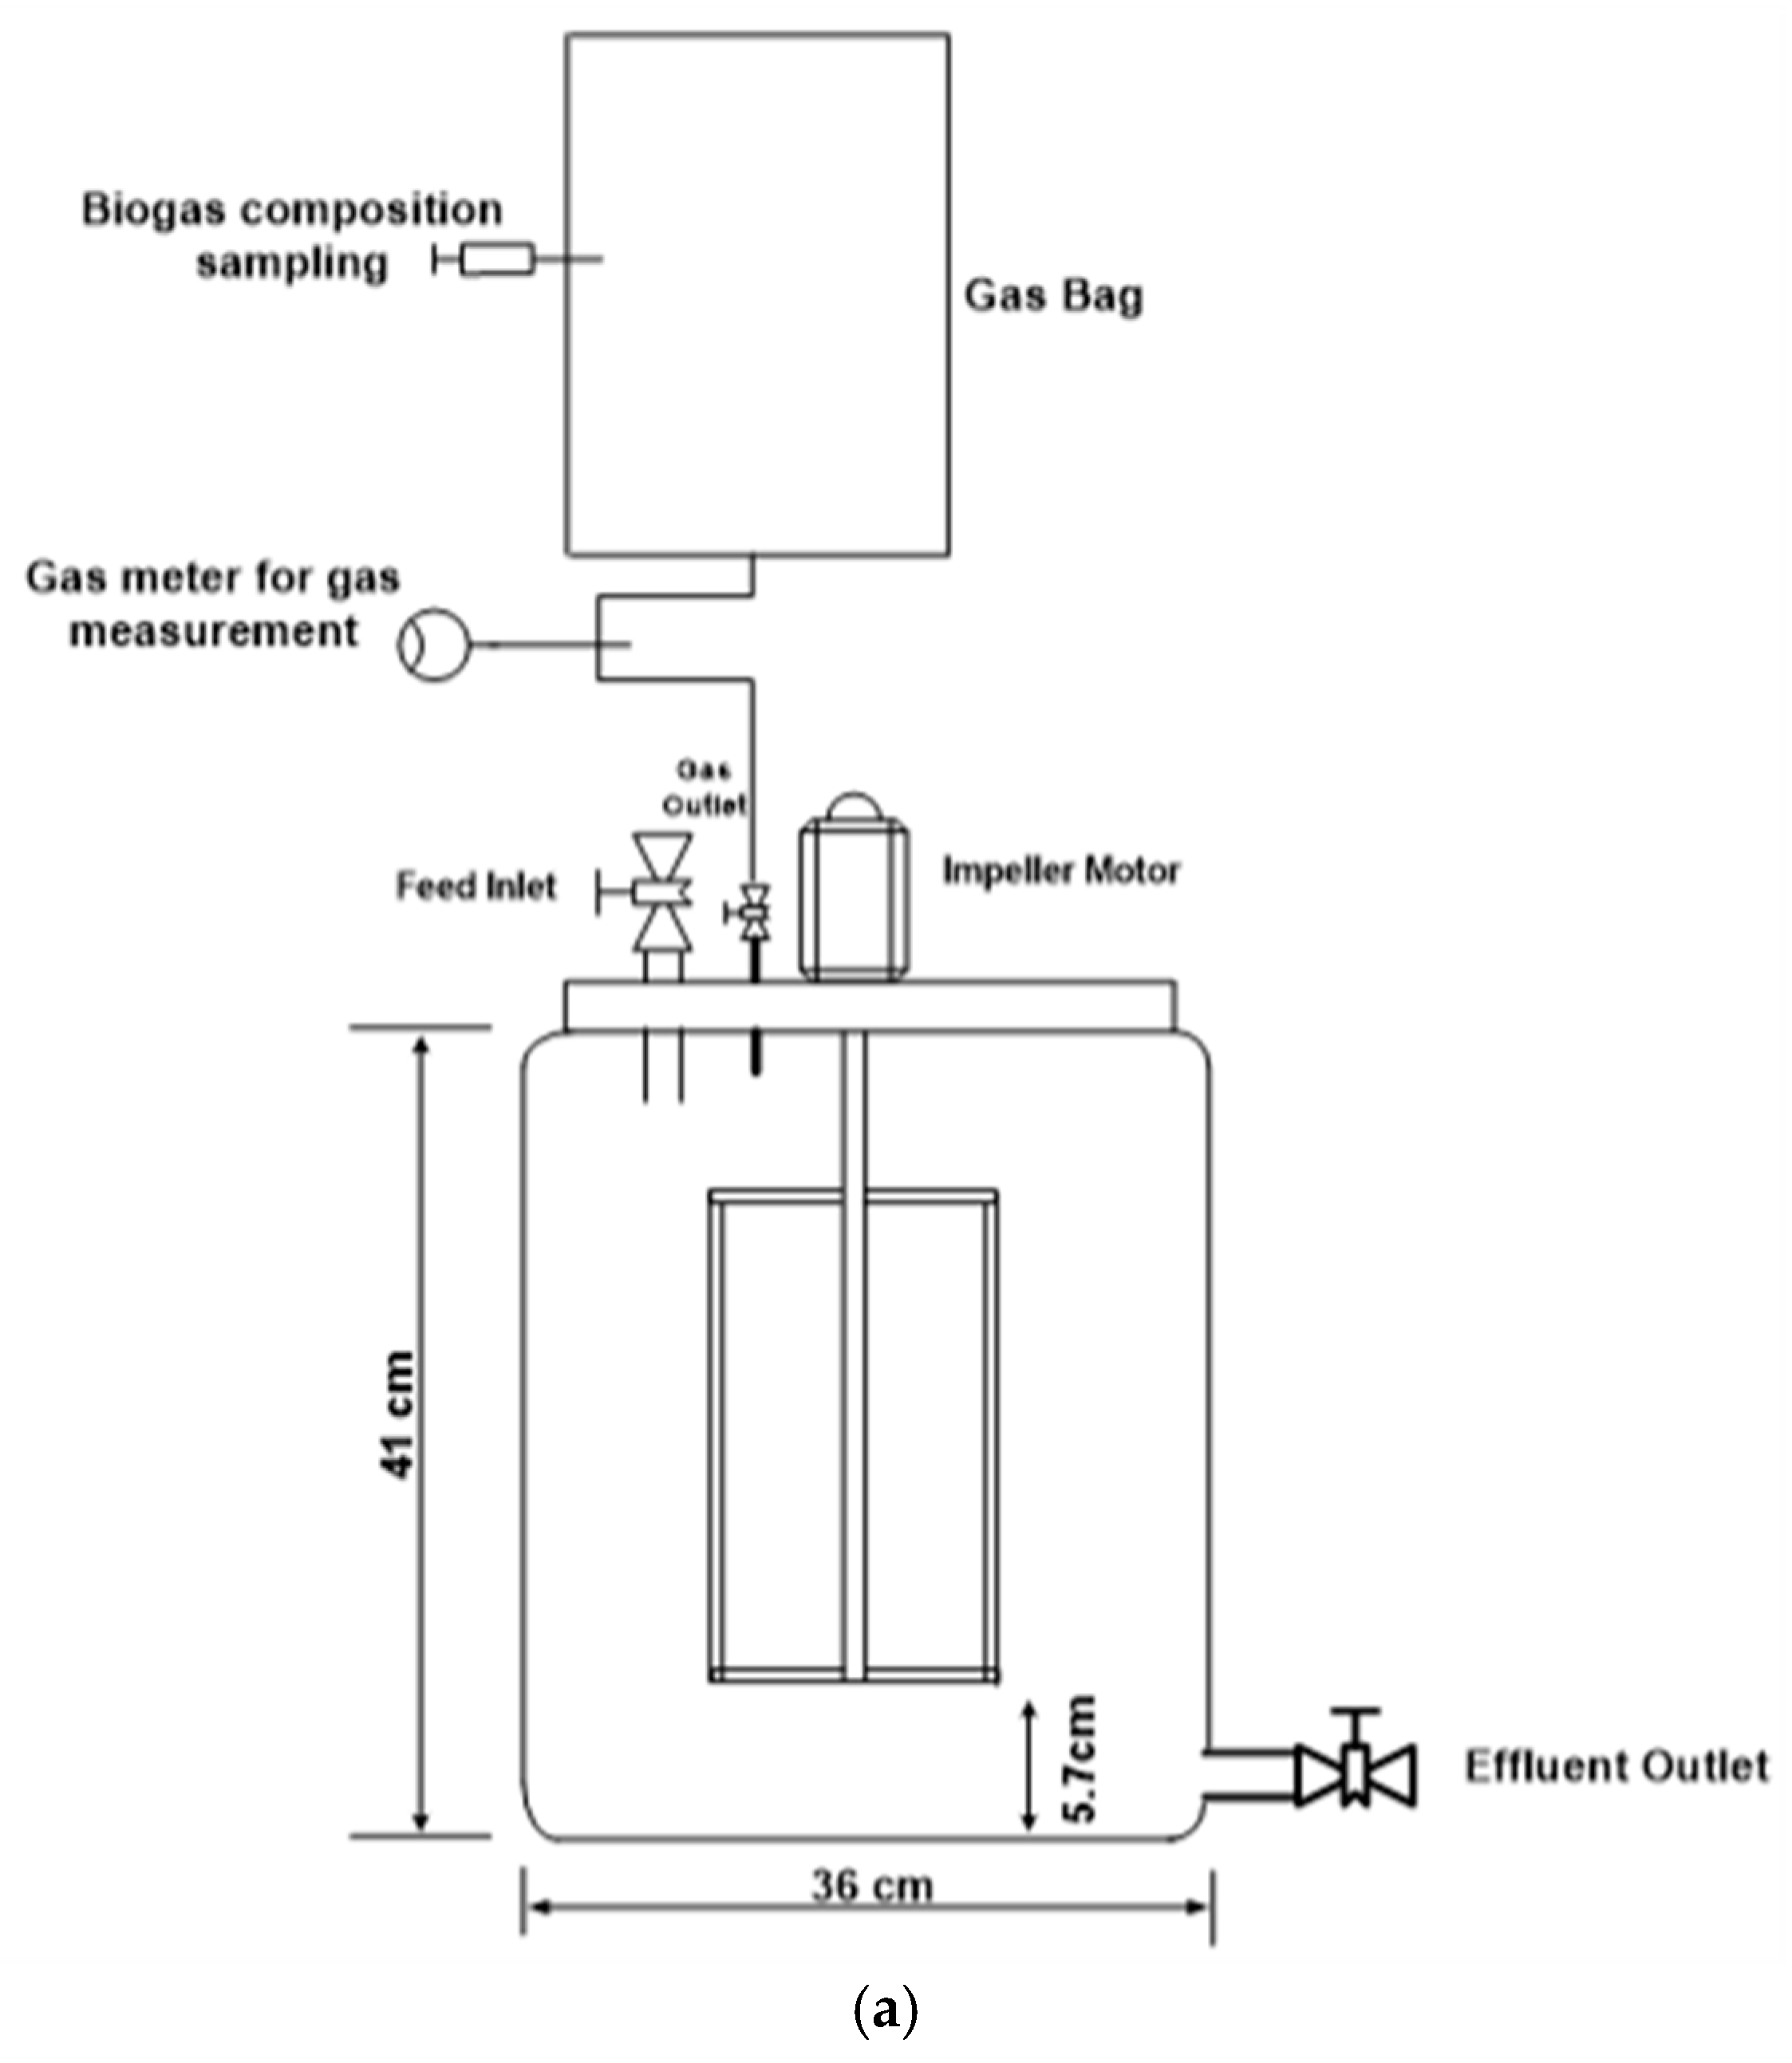
2.1. Reactor Design and Setup

The study was performed in six laboratory-scale digesters consisting of two impeller mixed digesters or stirred tank reactors (STR), two unmixed digesters (UMD) and two Chinese dome digesters (CDD). The working volume of the impeller mixed and the unmixed reactors was 39 L, while the Chinese dome digesters (CDDs) have a working volume of 39 L and an additional 10 L for the extension chamber, which is not regarded as part of the working volume of the reactors. A scheme of the three types of reactors is shown in Figure 1a–c. All digesters were constructed from polyvinyl chloride (PVC). Generated biogas was collected in plastic gas bags. Biogas produced in the impeller mixed reactors and unmixed reactors was directly collected into the gas bags while the biogas produced in the Chinese dome lab scale reactors was stored in the reactor headspace, thereby creating pressure to displace some of the reactor content to the extension chamber. Pressure was released once a day before feeding and the biogas was collected in gas bags. In addition, in the CDDs, effluents were removed from the reactors through the extension chambers. In the mechanically and non-mixed reactors, influents were added from the top and effluents withdrawn from the bottom as shown in Figure 1a,b. Biogas was collected and measured with a wet gas meter before feeding was done in all reactors daily. The two STRs were mixed with an 18 cm impeller at 55 rpm for 10 min/hour throughout the study period, based on Karim et al. [22] and Hoffmann et al. [48]. A reasonable level of intermittent mixing was achieved during reactor feeding and effluent removal from all the reactors based on the reactor’s geometry. The reactors set-up and arrangement are given in Table 1.

2.2. Manure Collection and Preparation

The inoculum used for the reactor start-up was collected from a small-scale biogas plant treating cow manure at the Agricultural Engineering Department, Obafemi Awolowo University, Nigeria, at an average ambient temperature of 32 °C and operated with an average influent concentration of 5.5% TS. The inoculum was collected on the same day the reactors were started and occupied 23% volume of each reactor during start-up. The cow manure used for feeding the reactors was collected freshly at the Obafemi Awolowo University School farm. Each batch was stored in a refrigerator at 3 °C prior to use. The manure was prepared by manual screening for stones, blending and water dilution into two total solid concentrations. The blending of the substrates was done in a household blender at about 8000 rpm for 2 min to break large pieces of manure. The characteristics of the prepared substrate feed, including the biomethane potential (BMP) before dilution, are given in Table 2. The BMP was done in triplicate as described by Anaerobic Biodegradation, Activity and Inhibition (ABAI), task group [49]. The applied organic loading rates and period of operation for each of the reactors are given in Table 3.

2.3. Operation

All reactors were operated at a hydraulic retention time (HRT) of 30 days throughout the study. About 1.3 L of effluents were daily removed from the outlet port for STR 1, STR 2, UMD 1 and UMD 2, and from the extension chambers for CDD 1 and CDD 2 after which the same quantity of freshly prepared manure was added. Reactors were considered to operate in steady state when the change in biogas production was within 15% [22]. All reactors were operated at laboratory ambient temperatures between 27 and 32 °C. All the digesters were started under similar operational conditions but with different mixing schemes and loading rates. Digesters 1 and 2 (STR 1 and 2) were mixed at 55 rpm, 10 min/hour, and the Reynolds number (Re) and power were calculated using Equations (1) and (2):
R e = N ρ D 2 K   γ n 1 ,   and
P = Np* ρ* N3 * D5,
where P is the power consumption (W), ρ is the density of manure influent (kg·m−3), N is impeller speed in S−1, D is impeller diameter in m, K is the consistency coefficient (Pa Sn), γ is shear (S−1) and n is the power-law index. Digesters 5 and 6 were mixed by hydraulic variation and the energy created and utilized consumption were calculated in the form of potential energy created as a result of slurry displacement in the extension chamber. Digesters 3 and 4 were not mixed, however all digesters could be assumed to be “mixed” intermittently once a day during effluent withdrawal and feeding. The reactors were fed, and effluents removed daily from day 1 to day 319, except for day 94 to 125 when recirculation was applied for all digesters as overloading was observed. During the recirculation period, there was no addition of new feed into the reactors but feeding of effluent. Energy consumption for STR 1 and 2 was calculated from Equation (2).
The values of parameters mentioned in the text are given in Table 4 according to Wu [50]. The power number was determined from the Np vs. Re chart [51].
During biogas production, the volume of effluent displaced in the extension chamber was stored as potential energy (P.E). During gas use, pressure would be reduced in the headspace of the CDD and would result in the follow of effluent from the extension chamber into the main digester volume in the form of kinetic energy (K.E). As a consequence, the energy created and consumed for mixing was estimated in form of potential energy and kinetic energy using Equations (3) and (4), respectively,
P.E = mgh, and
K . E = 0.5   m v 2 ,
where P.E is the potential energy (J), K.E is the kinetic energy also in J, m is the mass (kg) of the maximum volume of manure displaced during gas production (as a result of pressure build-up due to gas production) each day, g is 9.8 m·s−2, h (m) is the height of the extension chamber and v is the velocity (m·s−1). The distance is the height of extension from the base of the reactor and time is the duration it takes for the displaced slurry to flow back in the digester. These were experimentally determined as 7 s and 6 s for CDD 1 and 2, respectively. The volume of the displaced slurry in the extension chambers were calculated from the displacement to be 0.0025 and 0.0042 m3 for CDD 5 and CDD 6, respectively. The mass of the displaced slurry was estimated from the volume and density.
The gas space of the reactors was filled with nitrogen after inoculation and gas produced in the first three days was purged and not recorded. Biomethane potential of each substrate batch was measured in triplicate according to ABAI [49].

2.4. Monitoring and Analytical Methods

The laboratory temperature was monitored using an EL-USB digital temperature logger. The pH of feeds and effluents were measured using a table-top pH meter with a probe, WTW InoLab Level 1 model. The feed and effluent samples were analysed for TS, volatile solids (VS), volatile fatty acids (VFAs, acetate, propionate and butyrate) and ammonium nitrogen (NH4+-N). Generated biogas was collected in gas bags, five days a week (Monday to Friday) and measured daily using a Schlumberger Lab wet gas meter. Biogas composition was determined in terms of carbon dioxide (CO2) and methane (CH4) content. The CH4 content was indirectly measured by measuring the concentration of CO2 viz. CO2 absorption using NaOH in the gas bag once a week. TS, vs. and NH4+-N were analysed according to standard procedures [52]. Specific biogas and methane yields were expressed as daily methane produced, divided by the amount of vs. daily fed to the digester, and used to monitor the digestion efficiency of the digesters.
Concentration of volatile fatty acids (VFAs) in effluent samples were determined in triplicate using a 7890 B gas chromatograph (Agilent Technologies) equipped with an HP-5 column (30 m × 0.32 mm × 0.25 μm, Agilent Technologies) and a flame ionization detector (FID). The carrier gas was nitrogen with a flow rate of 6.5 mL/min. The operating conditions were as follows: Injector temperature, 120 °C (split-splitless); detector temperature, 250 °C; and an oven temperature program initiating at 40 °C, followed by three sequenced temperature increases (i) at a rate of 60 K/min up to 100 °C; (ii) at a rate of 50 K/min up to 150 °C; and finally (iii) at a rate of 90 K/min until 240 °C was reached. Calibration stock solution and sample preparation were done according to standard methods for the examination of water and wastewater [53].
Average steady-state biogas production data and the standard deviation over the period between 150 and 319 days of observations are presented in this paper. The specific methane yield, which was calculated as daily methane produced divided by the amount of vs. fed to the digester, was used to monitor the efficiency of the digesters as stated earlier. The digester performance was evaluated based on the effect of loading rate on methane production to volumetric gas production, volatile fatty acid concentration (VFA), treatment efficiency and energy consumption.
The energy consumption for mixing in the stirred digesters were estimated based on Equation (2), while the natural potential energy created by Chinese dome digesters (CDD) was estimated using Equation (3), but no power requirement or consumption for the non-mixed reactors were calculated because in the non-mixed reactors, no external or internal energy was applied. In the CDDs it was possible to estimate the mixing energy created as a result of slurry displacement, which would later be utilized as kinetic energy when slurry flows back into the digester.

2.5. Statistical Analysis

The statistical significance of the experimental data at steady state condition for all the digesters was performed using a one-way analysis of variance (ANOVA) statistical program (Microsoft Excel 2016).

3. Results

The six digesters exhibited different volumetric gas production and peaked at the highest organic loading rates. The highest volumetric biogas production rates for the steady state period are 0.34, 0.67, 0.23, 0.43, 0.29, and 0.53 L/L/day for digesters 1, 2, 3, 4, 5 and 6 at organic loading rates (OLRs) of 1.39 g VS/L/day for digesters 1, 3 and 5, and 2.79 g VS/L/day for digesters 2, 4, and 6 as shown in Table 5. The higher the loading rate the higher the observed volumetric biogas production. The specific methane production for the same type of digesters were comparable but different for different types of digesters. The maximum specific methane production was 0.17 ± 0.003 L/g vs. at an OLR of 1.39 g VS/L/day for STR 1, 0.16 ± 0.003 L/g vs. at 2.79 g VS/L/day for STR 2, 0.107 ± 0.003 L/g vs. at 1.39 g VS/L/day for UMD 1, 0.095 ± 0.002 L/g vs. at 2.79 g VS/L/day for UMD 2, 0.135 ± 0.003 L/g vs. at 1.39 g VS/L/day for CDD 1, and 0.126 ± 0.003 L/g vs. at 2.79 g VS/L/day for CDD 2. The methane production in all digesters increased slightly from day 260 till the end of the experiment, which is in agreement with the BMP of the applied substrates. The eighth substrate batch had the highest BMP of 0.18 L CH4/g vs. compared to earlier applied substrate. As a consequence, the highest recorded specific methane production in all the digesters was achieved during the application of the eighth substrate. The average specific methane production from highest to lowest are 0.16, 0.15, 0.13, 0.12, 0.10 and 0.09 L/g vs. for digesters 1, 2, 5, 6, 3 and 4, respectively.
At “steady state” periods, there were differences in the biogas production and methane content depending on the applied OLRs and the type of digester. The volumetric methane production increased with increasing organic loading rates (OLRs) in all digesters. The biogas production and methane composition observed during these experiments are summarized in Table 5.
The VFAs during the steady state period are 0.82 ± 0.21, 0.98 ± 0.2, 2.21 ± 0.5, 2.66 ± 0.55, 1.4075 ± 0.25 and 1.61 ± 0.26 g/L in respectively digesters 1 through 6. The observed VFA concentration in the stirred reactors (STR 1 and 2) during this period are lower compared to that in the UMD (1 and 2) and CDD (1 and 2) reactors. The average VFAs concentration in the stirred reactors are lesser or equal to 1 g/L, and they could be regarded as well-balanced digesters according to Hill et al. [54] The average of VFAs concentration in STR 2 is slightly higher but not significant (p > 0.05) than STR 1 because STR 2 had higher OLRs. The VFA concentrations differ in the reactors and are significantly higher in the unmixed and Chinese dome digesters compared to the stirred reactors.
The analysis of variance (ANOVA) using Microsoft Excel programme (2016) was performed on the specific methane production and VFA for the digesters in two different batches representing the two influent TS loading rates, the single (3–7.3% TS) and the double (6–15% TS). STR 1, UMD 1 and CDD 1 for the single and STR 2, UMD 2 and CDD 2 for the double concentrations represent the three types of mixing, impeller stirred, unmixed, and the hydraulic mixed (Chinese dome digester) investigated in this study. The digesters were compared based on OLR (single and double feeding), and the results show that the differences between each type of digester is significant for both specific methane production and VFA. Specifically, for the specific methane production, the significant differences are represented by a–d and a2–d2 for STRs, e–g and e2–g2 for UMDs and h–k and h2–k2 for CDDs, shown in Table 5.

4. Discussion

4.1. Effect of Loading Rate, Volumetric Biogas Production, VFA Concentration and Treatment Efficiency

The higher biogas production in the stirred reactors compared to the hydraulic and unstirred reactors is attributed to the impeller mixing at 55 rpm for 10 min/hour, which might have minimized stratification in the reactors. Biogas release in the liquid phase during intermittently mixed reactors has been reported to increase up to 70% during mixing in comparison to non-mixing regimes [43,55,56]. This implies gas release may be hindered in unmixed digesters, and mixing increases the chances of mass transfer from liquid phase to gas phase. This is consistent with results of Lin and Pearce, [57] and Karim et al. [22] with the conclusion that there is impact on methane production between intermittent mixing mode and unmixed systems. In addition, Stafford [58] showed that there was a gradual release of biogas from the liquid phase to the gas phase during the first minute of mixing for various intermittent mixing periods (140–1000 rpm). The Chinese dome digesters produced more methane than the unmixed digesters as seen in Table 5. The digesters also have slightly higher methane concentration compared to the unmixed digesters. Vavilin and Angelidaki [59] reported that uneven mixing in digesters can lead to the creation of initiation zones in the anaerobic digesters, where methane producing bacteria can grow and flourish and could seed the rest of the digester from these zones.
The volumetric biogas production rate increases with increasing vs. influent concentration, but the specific methane production from digesters (STR 2, UMD 2 and CDD 2) where a double loading rate was applied were lower compared to that of STR 1, UMD 1 and CDD 1. Similar observations were reported by Linke [60] and Karim et al. [22]. For the naturally mixed reactors, a higher volumetric methane production rate as a result of increased loading rate did not improve mixing in the digesters and specific methane production. For example, as seen in CDD 1 and 2, CDD 1 had a slightly higher specific methane production than CDD 2 despite the fact that it was operated at a double TS concentration and exhibited higher volumetric biogas rate. This is understandable because manure is a non-Newtonian material, the higher the solid content, the higher the apparent viscosity [61], and more force is required for mixing.
The range of specific methane production (0.10–0.16 L/g VS) in this study for all the three mixing modes is in an agreement with the BMP of the applied feeds and with specific methane gas productions measured by [62], but lower compared to many studies reported [22,28,41] with slightly different mixing modes and intensities, and a lower HRT of <20 days. However, the results from this study are higher than results (0.08–0.10 L/g VS) of Ong et al. [43] for continuous and intermittent mixing modes. The lower specific biogas production of Ong et al. [43] could be attributed to a high OLR of 7.2 g VS/L d at 10 days HRT. Lastly, difference in gas production between the CDDs and the non-mixed digesters is in agreement with the review of Lindmark et al. [63] showing that unmixed digesters will produce 10–20% lower biogas production than intermittently or mixed digesters.
The higher VFAs concentration in the UMD and CDD could be attributed to reduction of the real HRT caused by limited mixing. The limited mixing in these reactors might have created dead zones and lowered the actually working volume of the reactors. The higher levels of VFAs in the unstirred reactors (UMD 1 and 2) probably did not inhibit biogas production or biodegradation. This is coherent with the results of authors Banks et al. [64], Angelidaki et al. [65] and Ghanimeh et al. [66]. They stated that inhibition of biogas production may not occur at high VFAs (max. 4 g/L) if pH stays between 6.8 and 7.7, which is in agreement with the pH range of 6.7–7.2 in this study.
The stability exhibited by the reactors, especially the unmixed digesters (UMD 1 and 2), could be attributed to the reactor geometry in which the outlet is located at the bottom of the reactor and a relatively long HRT of 30 days. The effluent withdrawal from the bottom could have prevented strong accumulation of solids, which may have resulted in large dead zones and indirectly VFAs in the reactor beyond the tolerance level. The long HRT of 30 days applied throughout the experiments might have prevented washout of microbes. In addition, the “intermittent” mixing in the unmixed digesters (viz. feeding and effluent withdrawal) and Chinese dome digesters (viz. feeding, effluent withdrawal and hydraulic variation during gas collection) could have slowed down the fermentation processes at a higher OLR to allow large percentage of intermediates products to be consumed by methanogens and synthrophs without VFAs accumulations and toxicity effects [39].
In ideal continuously stirred tank reactors (CSTR), the removal of volatile solids (VS) should be equivalent to the methane production. Since no reactor was stirred continuously in this study, it was expected that the vs. removal may not fit completely to the methane recovery. The percentage of vs. removal in the reactors during the steady state period (day 150–318) are in Table 5 for reactors 1 to 6. Volatile solid (VS) reductions in all the reactors are different but not significant, and STR 1 exhibited the highest vs. removal, followed by digesters 2, 5, 6, 3 and 4. This trend corresponds to the specific methane production of the reactors. Both digesters 1 and 2 exhibited better vs. reduction and higher methane production because they were impeller mixed. This improved homogeneity and reduced dead zones in the digesters. STR 1 exhibited higher vs. removal compared to STR 2, despite the fact that it was fed with doubled TS content and produced double volumetric gas production. Consequently, this affirms the earlier statement that higher volumetric gas production does not improve mixing at higher OLRs, and hence specific methane production. The lower vs. removal in the unmixed digester and CDDs could be attributed to limited mixing compared to the digesters 1 and 2, because interrupted mixing or intermittent mixing has been reported to create hydraulic dead zones, which can reduce hydraulic retention time and cause effects on reaction kinetics [22,67]. Indeed, in this study, unmixed digesters exhibited a lower vs. reduction compared to the hydraulic mixed digesters (CDD) for both TS concentrations because the absence of “sufficient intermittent” mixing could have reduced the effective volume of the unstirred digesters and lead to poor vs. degradation, see Zabranska et al. [68]. In addition, the impeller mixed digester has less vs. reduction variation compared to the unmixed and Chinese dome (hydraulic mixed) digesters. The vs. reduction for the steady period are also shown in Table 5 for all the reactors.
The results of the analysis of variance (ANOVA) implies the reactors fed with single TS performed better than double-fed digesters in terms of methane recovery, with the exception of unmixed and CDD digesters at an OLR of 1.36 g VS/L/day (day 149–169) and CDD at an OLR of 1.67 g VS/L/day (day 199–159). Furthermore, digesters were compared and summarized in Table 6. Comparison of these values show that the difference between impeller and unmixed, impeller and CDD, and unmixed and CDD at both TS concentrations were significant also (p < 0.05).

4.2. Digesters Performance and Energy Consumption

The energy requirement for STR 1 and 2 were 10.5 and 42 kJ/day, while the P.E created in the CDDs were 0.74 and 1.2 J/day for reactors 5 and 6, respectively. STR 1 and 2 had higher power requirement because of the mechanical mixing with an electric motor. The applied shear would be higher in STR 2 because of the higher substrate viscosity as a result of higher TS concentration. It has been shown by El-Mashad et al. [61] and Karim et al. [22] that shear rates increase with total solid concentration. In the CDD, the energy consumed is very low because the energy is naturally created initially, and it is in the form of gravitational potential achieved by the hydraulic variation as a result of pressure build up in the reactors. The pressure increases as a result of gas production at the headspace (gas phase) and pushes some volume of the slurry, which is non-Newtonian and non-compressible material from the reactor into the extension chamber creates potential energy. The volume of slurry displaced will depend on the amount of gas produced and height of the extension chamber.
The potential and kinetic energies would depend on the viscosity or the percentage of the TS concentration of the applied feed. As discussed earlier, higher volumetric gas production did not improve mixing at a higher OLR, because slurry at higher viscosity (higher %TS) has lower velocity compared to slurry with lower %TS concentration. The mixing intensity in the stirred reactors is higher than the CDDs because the spatial coverage of mixing and duration is more than the hydraulic mixing in the CDDs. The hydraulic variation in the CDDs occurred once a day in this study. In fully operational household digesters, the hydraulic mixing occurs between two to three times a day depending on the frequency of cooking. Biogas and methane production are higher in the stirred reactors. However, the differences are not significant compared to the large difference in power utilization. As a consequence, the CDD is more energy efficient than the stirred reactors according to the results presented in this study. Both types of reactors were intermittently mixed but applying different types of mixing. The duration between each cycle in the stirred reactor was 50 min while 24 h for the CDDs.

5. Conclusions

The effect of mixing in three reactors designs using cow manure as substrate was investigated at the laboratory scale. Significant differences were observed among the three types of digesters at the different influent TS concentrations applied in this study. The impeller mixed digesters or the STRs exhibited better biogas and methane production, and treatment efficiency, followed by the Chinese dome digesters (CDDs) and the unmixed digesters (UMDs). STR 1 produced 20% more methane than the CDDs and 37% more methane than the UMDs, respectively, at steady state conditions. However, the CDDs were more energy efficient than the STRs. By applying double influent TS concentrations, the reactors showed lower specific biogas production and higher VFAs concentrations with few exceptions. The VFA accumulation was more pronounced in the unstirred digesters and Chinese dome digesters mainly because of insufficient mixing.
The results of double-fed TS concentration experiments did not produce better reactor performance (based on specific methane production and VFAs concentrations) in the CDDs despite higher volumetric biogas production rate. This implies that hydraulic variation induced by the natural mixing by biogas production at higher volumetric rate did not yield sufficient mixing and further studies could focus on improving this. The hydraulic variation in Chinese dome digesters may not suffice for the treatment of cow manure at TS concentration of 10% and above.

Author Contributions

Methodology: All authors; data curation: A.O.J.; writing—Original draft preparation: A.O.J.; writing editing: G.Z. & H.B.; funding acquisition: A.O.J. & G.Z.

Funding

This work was funded by the Netherlands Fellowship Programme (NFP), the Netherlands. Grant number: NFP-PhD 12/426.

Acknowledgments

Special thanks to the analytic/lab support team at Environmental Technology department, Wageningen University, The Netherlands. Special appreciations to the management and support staff of Biochemical Engineering laboratory, Centre for Energy Research and Development, Obafemi Awolowo University, Ile-ife Nigeria for their support.

Conflicts of Interest

The authors declare no conflict of interest.

References

  1. Yumkella, K.; Bazilian, M.; Gielen, D. Energy for all. Mak. It: Ind. Dev. 2010, 2, 22–29. Available online: http://89.206.150.89/documents/congresspapers/325.pdf. (accessed on 1 November 2016).
  2. Gautam, R.; Baral, S.; Herat, S. Biogas as a sustainable energy source in Nepal: Present status and future challenges. Renew. Sustain. Energy Rev. 2009, 13, 248–252. [Google Scholar] [CrossRef] [Green Version]
  3. Tumwesige, V.; Fulford, D.; Davidson, G.C. Biogas appliances in Sub-Sahara Africa. Biomass Bioenergy 2014, 70, 40–50. [Google Scholar] [CrossRef] [Green Version]
  4. Modi, V.; McDade, S.; Lallement, D.; Saghir, J. Energy Services for Millennium Development Goals, Achieving MGDs. Millennium Project, UNDP; World Bank and ESMAP: Washington, DC, USA, 2005. [Google Scholar]
  5. Bajgain, S.; Shakya, I.; Mendis, M.S. The Nepal Biogas Support. Program: A Successful Model. of Public Private Partnership for Rural Household Energy Supply. Report Prepared by Biogas Support. Program. Nepal; Vision Press P. Ltd.: Kathmandu, Nepal, 2005. [Google Scholar]
  6. Sun, Q.; Li, H.; Yan Ji Liu, L.; Yu, Z.; Yu, X. Selection of appropriate biogas upgrading technology—A review of biogas cleaning upgrading and utilisation. Renew. Sus Energy Rev. 2015, 51, 521–532. [Google Scholar] [CrossRef]
  7. Chanakya, H.N.; Bhogle, S.; Arun, R.S. Field experience with leaf litter-based biogas plants. Energy Sustain. Dev. 2005, 9, 49–62. [Google Scholar] [CrossRef]
  8. Lansing, S.; Martin, J.F.; Botero, R.B.; da Silva, T.N.; da Silva, E.D. Methane production in low-cost, unheated, plug-flow digesters treating swine manure and used cooking grease. Bioresour. Technol. 2010, 10, 4362–4370. [Google Scholar] [CrossRef] [PubMed]
  9. Chen, L.; Zhao, L.; Ren, C.; Wang, F. The progress and prospects of rural biogas production in China. Energy Policy 2012, 51, 58–66. [Google Scholar] [CrossRef]
  10. China, National Development and Reform Commission (NDRC). China’s Medium to Long-Term Renewable Energy Development Plan 2007. Available online: http://www.chinaenvironmentallaw.com/wp-content/uploads/2008/04/mediumand-long-term-development-plan-for-renewable-energy.pdf (accessed on 14 March 2016).
  11. Fulford, D. Running a Biogas Programme. A Handbook; Intermediate Technology Publication: London, UK, 1988. [Google Scholar]
  12. Chen, Y.; Yang, G.; Sweeney, S.; Feng, Y. Household biogas use in rural China: A study of opportunities and constraints. Renew. Sustain. Energy 2010, 14, 545–549. [Google Scholar] [CrossRef]
  13. Ghimire, P.C. SNV Supported domestic biogas programmes in Asia and Africa. Renew. Energy 2013, 49, 90–94. [Google Scholar] [CrossRef]
  14. Pérez, I.; Garfí, M.; Cadena, E.; Ferrer, I. Technical, economic and environmental assessment of household biogas digesters for rural communities. Renew. Energy 2014, 62, 313–318. [Google Scholar] [CrossRef]
  15. Arthur, R.; Baidoo, M.F.; Antwi, E. Biogas as a potential renewable energy source. A Ghanaian case study. Renew. Energ. 2011, 36, 1510–1516. [Google Scholar]
  16. Kanwar, S.S.; Guleri, R.L. Performance evaluation of a family-size, rubber-balloon biogas plant under hilly conditions. Bioresour. Technol. 1994, 50, 119–121. [Google Scholar] [CrossRef]
  17. Singh, S.P.; Vatsa, D.K.; Verma, H.N. Problems with biogas plants in Himachal Pradesh. Bioresour. Technol. 1997, 59, 69–71. [Google Scholar] [CrossRef]
  18. Deublein, D.; Steinhauser, A. Biogas from Waste and Renewable Resources; Wiley-VCH Verlag GmbH& Co. KGaA: Weinheim, Germany, 2008. [Google Scholar]
  19. Jegede, A.O.; Bruning, H.; Zeeman, G. Location of inlets and outlets of Chinese dome digesters to mitigate biogas emission. Biosyst. Eng. 2018, 174, 153–158. [Google Scholar] [CrossRef]
  20. Bridgeman, J. Computational fluid dynamics modeling of sewage sludge mixing in an anaerobic digester. Adv. Eng. Softw. 2012, 44, 54–62. [Google Scholar] [CrossRef]
  21. Gerardi, M. The Microbiology of Anaerobic Digesters; John Wiley and Sons, Inc.: Hoboken, NJ, USA, 2003. [Google Scholar]
  22. Karim, K.; Hoffmann, R.; Klasson, K.T.; Al-Dahhan, M.H. Anaerobic digestion of animal waste: Effect of mode of mixing. Water Res. 2005, 39, 3597–3606. [Google Scholar] [CrossRef]
  23. Conklin, A.S.; Chapman, T.; Zahller, J.D.; Stensel, H.D.; Ferguson, J.F. Monitoring the role of aceticlasts in anaerobic digestion: Activity and capacity. Water Res. 2008, 42, 4895–4904. [Google Scholar] [CrossRef]
  24. Halalsheh, M.; Kassab, G.; Yazajeen, H.; Qumsieh, S.; Field, J. Effect of increasing the surface area of primary sludge on anaerobic digestion at low temperature. Bioresour. Technol. 2011, 102, 748–752. [Google Scholar] [CrossRef]
  25. Gomez, X.; Cuetos, M.J.; Cara, J.; Moran, A.; Garcia, A. Anaerobic co-digestion of primary sludge and the fruit and vegetable fraction of the municipal solid wastes-conditions for mixing and evaluation of the organic loading rate. Renew. Energ. 2006, 31, 2017–2024. [Google Scholar] [CrossRef]
  26. Kim, M.; Ahn, Y.H.; Speece, R.E. Comparative process stability and efficiency of anaerobic digestion: Mesophilic vs. thermophilic. Water Res. 2002, 36, 4369–4385. [Google Scholar] [CrossRef]
  27. Ward, A.J.; Hobbs, P.J.; Holliman, P.J.; Jones, D.L. Optimisation of the anaerobic digestion of agricultural resources. Bioresour. Technol. 2008, 99, 7928–7940. [Google Scholar] [CrossRef] [PubMed]
  28. Kaparaju, P.; Buendia, I.; Ellegaard, L.; Angelidakia, I. Effects of mixing on methane production during thermophilic anaerobic digestion of manure: Lab-scale and pilot-scale studies. Bioresour. Technol. 2008, 99, 4919–4928. [Google Scholar] [CrossRef] [PubMed]
  29. Ike, M.; Inoue, D.; Miyano, T.; Liu, T.T.; Sei, K.; Soda, S.; Kadoshin, S. Microbial population dynamics during startup of a full-scale anaerobic digester treating industrial food waste in Kyoto eco-energy project. Bioresour. Technol. 2010, 101, 3952–3957. [Google Scholar] [CrossRef] [PubMed]
  30. Hamad, M.A.; Abdel Dayem AM El Halwagi, M.M. Evaluation of the performance of two rural biogas units of Indian and Chinese design. Energy Agric. 1983, 1, 235–250. [Google Scholar] [CrossRef]
  31. Polprasert, C.; Edwards, P.; Rajput, V.S.; Pacharaprakiti, C. Integrated biogas technology in the tropics 1. Performance of small-scale digesters. Waste Manag. Res. 1986, 4, 197–213. [Google Scholar] [CrossRef]
  32. Anjan, K.K. Development and evaluation of a fixed dome plug flow anaerobic digester. Biomass 1988, 16, 225–235. [Google Scholar]
  33. Xavier, S.; Nand, K. A preliminary study on biogas production from cow dung using fixed-bed digesters. Biol. Wastes. 1990, 34, 161–165. [Google Scholar] [CrossRef]
  34. Singh, R.; Anand, R.C. Comparative performances of Indian small solid-state and conventional anaerobic digesters. Bioresour. Technol. 1994, 47, 235–238. [Google Scholar] [CrossRef]
  35. Singh, L.; Maurya, M.S.; Ramana, K.V.; Alam, S.I. Production of biogas from night soil at psychrophilic temperature. Bioresour. Technol. 1995, 53, 147–149. [Google Scholar] [CrossRef]
  36. Kalia, A.K.; Singh, S.P. Horse dung as a partial substitute for cattle dung for operating family-size biogas plants in a hilly region. Bioresour. Technol. 1998, 64, 63–66. [Google Scholar] [CrossRef]
  37. An, B.X.; Preston, T.R. Gas production from pig manure fed at different loading rates to polyethylene tubular biodigesters. Livest. Res. Rural Dev. 1999, 11, 11. [Google Scholar]
  38. Ferrer, I.; Garfí, M.; Uggetti, E.; Ferrer-Martí, L.; Calderon, A.; Velo, E. Biogas production in low-cost household digesters at the Peruvian Andes. Biomass Bioenergy 2011, 35, 1668–1674. [Google Scholar] [CrossRef]
  39. Tamkin, A.; Martin, J.; Castano, J.; Ciotola, R.; Rosenblum, J.; Bisesi, M. Impact of organic loading rates on the performance of variable temperature biodigesters. Ecol. Eng. 2014, 78, 87–94. [Google Scholar] [CrossRef]
  40. Hashimoto, S.; Fujita, M.; Teral, K. Stabilization of wasteactivated sludge through the anoxic–aerobic digestion process. Biotechnol. Bioeng. 1982, 24, 1335–1344. [Google Scholar] [CrossRef] [PubMed]
  41. Stroot, P.G.; McMahon, K.D.; Mackie, R.I.; Raskin, L. Anaerobic codigestion of municipal solid waste and biosolids under various mixing conditions I: Digester performance. Water Res. 2001, 35, 1804–1816. [Google Scholar] [CrossRef]
  42. Bouallagui, H.; Ben Cheikh, R.; Marouani, L.; Hamdi, M. Mesophilic biogas production from fruit and vegetable waste in a tubular digester. Bioresour. Technol. 2003, 86, 85–89. [Google Scholar] [CrossRef]
  43. Ong, H.K.; Greenfield, P.F.; Pullammanappallil, P.C. Effect of mixing on biometha-nation of cattle-manure slurry. Env. Technol 2002, 23, 1081–1090. [Google Scholar] [CrossRef]
  44. Vesvikar, M. Understanding the Hydrodynamics and performance of Anaerobic Digesters. Ph.D Thesis, Washington University, St. Louis, MO, USA, 2006. [Google Scholar]
  45. Sulaiman, A.; Hassan, M.A.; Shirai, Y.; Abd-Aziz, S.; Tabatabaei, M.; Busu, Z. The effect of mixing on methane production in a semi-commercial closed digester tank treating palm oil mill effluent. Aust. J. Basic Appl. 2009, 3, 1577–1583. [Google Scholar]
  46. Rico, C.; Rico, J.L.; Muñoz, N.; Gómez, B.; Tejero, I. Effect of mixing on biogas production during mesophilic anaerobic digestion of screened dairy manure in a pilot plant. Eng Life Sci. 2011, 11, 476–481. [Google Scholar] [CrossRef]
  47. Chen, J.; Li, X.; Liu, Y.; Zhu, B.; Yuan, H.; Pang, Y. Effect of mixing rates on anaerobic digestion performance of rice straw. Trans. Chin. Soc. Agric. Eng. 2011, 27, 144–148. [Google Scholar]
  48. Hoffmann, R.A.; Garcia, M.L.; Veskivar, M.; Karim, K.; Al-Dahhan, M.; Angenent, L.T. Effect of shear on performance and microbial ecology of continuously stirred anaerobic digesters treating animal manure. Biotechnol. Bioenergy 2008, 100, 38–48. [Google Scholar] [CrossRef] [PubMed]
  49. DTU. Anaerobic Biodegradation, Activity and Inhibition (ABAI). Task Group Meeting 9–10 October 2006, Prague; Institute of Environment & Resources, Technical University of Denmark: Lyngby, Denmark, 2007. [Google Scholar]
  50. Wu, B. CFD simulation of mixing for high-solids anaerobic digestion. Biotechnol. Bioenergy 2012, 109, 2116–2126. [Google Scholar] [CrossRef] [PubMed]
  51. Liu, B.; Zhag, Y.; Chen, M.; Li, P.; Jin, Z. Power consumption and flow field characteristics of a coaxial mixer with a double inner impeller. Chin. J. Chem. Eng. 2015, 23, 1–6. [Google Scholar] [CrossRef]
  52. APHA. Standard Methods for the Examination of Water and Waste Water, 22nd ed.; American Public Health Association: Washington, DC, USA, 2006. [Google Scholar]
  53. APHA. Standard Methods for the Examination of Water and Waste Water, 21st ed.; American Public Health Association: Washington, DC, USA, 2005. [Google Scholar]
  54. Hill, D.T.; Cobb, S.A.; Bolte, J.P. Using volatile fatty acid relationships to predict anaerobic digester failure. Trans. Asabe 1987, 30, 496–501. [Google Scholar] [CrossRef]
  55. Mills, P.J. Minimisation of energy input requirements of an anaerobic digester. Agric. Wastes 1979, 1, 57–79. [Google Scholar] [CrossRef]
  56. Sung, S.; Dague, R.R. Laboratory studies on the anaerobic sequencing batch reactor. Water Env. Res. 1995, 67, 294–301. [Google Scholar] [CrossRef] [Green Version]
  57. Lin, K.C.; Pearce, M.E.J. Effect of mixing on anaerobic treatment of potato-processing wastewater. Can. J. Civ. Eng. 1991, 18, 504–514. [Google Scholar] [CrossRef]
  58. Stafford, D.A. The effects of mixing and volatile fatty acid concentrations on anaerobic digester performance. Biomass 1982, 2, 43–55. [Google Scholar] [CrossRef]
  59. Vavilin, V.A.; Angelidaki, I. Anaerobic degradation of solid material: Importance of initiation centers for methanogenesis, mixing intensity, and 2D distributed model. Biotechnol. Bioenergy 2005, 89, 113–122. [Google Scholar] [CrossRef]
  60. Linke, B. A model for anaerobic digestion of animal waste slurries. Environ. Technol. 1997, 18, 849–854. [Google Scholar] [CrossRef]
  61. El-Mashad, H.M.; van Loon, W.K.-P.; Zeeman, G.; Bot, G.P.A.; Lettinga, G. Design of a solar thermophilic anaerobic reactor for small farms. Biosyst. Eng. 2004, 87, 345–353. [Google Scholar] [CrossRef]
  62. Zeeman, G. Mesophilic and Psychrophilic Digestion of Liquid Cow Manure. Ph.D. Thesis, Sub-Department of Environmental Technology, Wageningen University, Wageningen, The Netherlands, 1991. [Google Scholar]
  63. Lindmark, J.; Thorin, E.; Fdhila, R.B.; Dahlquist, E. Effect of mixing on the result of anaerobic digestion: Review. Renew. Sust. Energy Rev. 2014, 40, 1030–1047. [Google Scholar] [CrossRef]
  64. Banks, C.J.; Chesshire, M.; Stringfellow, A.A. pilot-scale comparison of mesophilic and thermophilic digestion of source segregated domestic food waste. Water Sci. Technol. 2008, 58, 1475–1481. [Google Scholar] [CrossRef] [PubMed]
  65. Angelidaki, I.; Chen, X.; Cui, J.; Kaparaju, P.; Ellegaard, L. Thermophilic anaerobic digestion of source-sorted organic fraction of household municipal solid waste: Start-up procedure for continuously stirred tank reactor. Water Res. 2006, 40, 2621–2628. [Google Scholar] [CrossRef] [PubMed]
  66. Ghanimeh, S.; Fadel, M.E.; Saikaly, P. Mixing effect on thermophilic anaerobic digestion of source-sorted organic fraction of municipal solid waste. Bioresour. Technol. 2012, 117, 63–67. [Google Scholar] [CrossRef] [PubMed]
  67. Elnekave, M.; Tufekcj, N.; Kimchie, S.; Shelef, G. Tracing the mixing efficiency of a primary meshophilic anaerobic digester in a municipal wastewater treatment plant. Fresenius Environ. Bull. 2006, 15, 1098–1105. [Google Scholar]
  68. Zabranska, J.; Dohanyos, M.; Jenicek, P.; Zalpatilkova, P.; Kutil, J. The contribution of thermophilic anaerobic digestion to the stable operation of wastewater sludge treatment. Water Sci. Technol. 2002, 46, 447–453. [Google Scholar] [CrossRef]
Figure 1. (a) Impeller mixed, (b) Unmixed, and (c) hydraulic mixed (Chinese dome) digesters.
Energies 12 02540 g001aEnergies 12 02540 g001b
Table 1. Reactors set-up.
Reactor NameReactor Design% TS
STR 1Impeller mixed, 55 rpm for 10 min/hour3–7.3
STR 2Impeller mixed, 55 rpm for 10 min/hour6–15
UMD 1Unmixed3–7.3
UMD 2Unmixed6–15
CDD 1Chinese dome, hydraulically mixed3–7.3
CDD 2Chinese dome, hydraulically mixed6–15
Table 2. Applied feed characteristics before dilution for the feeding periods.
Feed ManureInitial TS (g/L)Initial vs. (g/L)BMP (Biogas) L/g vs.BMP (CH4) L/g VSNH4+–N (g/L)
1284 ± 16229 ± 140.250.172.2
2262 ± 12152 ± 20.230.152.1
3316 ± 5250 ± 10.220.152.3
4339 ± 4287 ± 70.240.161.9
5200 ± 14137 ± 20.230.152
6257 ± 1167 ± 20.250.161.8
7296 ± 13168 ± 30.250.162.2
8383 ± 13195 ± 130.280.182.1
Table 3. Influent concentrations and applied loading rates for the impeller mixed digesters or stirred tank reactors (STR 1 and 2), unmixed digesters (UMD 1 and 2), and the Chinese dome digesters (CDD 1 and 2), Digesters 1–6.
Feed ManureDayTS (g/L)vs. (g/L)OLR g VS/L/Day
1, 3, 52, 4, 61, 3, 52, 4, 61, 3, 52, 4, 6
11–35438635701.162.33
236–59408023460.771.54
360–78479437741.222.44
479–935210544881.472.94
94–125Recirculation
4126–1335210544881.472.94
5134–169306020410.681.36
6170–198408026520.861.72
7199–259448825500.831.67
8260–3197314742841.392.79
Table 4. Manure physical characteristic for energy calculation.
DigesterK (Pa Sn)n γ   ( S 1 ) ρ (kg·m−3)Reference
10.5250.533111000[50]
231.30.311~1000[50]
Table 5. Mean volumetric, specific methane production, and effluent volatile fatty acids (VFA) concentrations, volatile solids (VS) reduction at different organic loading rates (OLRs) for 6 differently operated digesters at steady state. Hydraulic retention time (HRT) = 30 days.
DayOLR g VS/L DayCH4 L/L/DayCH4 L/g VSCH4 %VFAs (g/L)VS red. (%)
(STR 1)
149–1690.680.09 ± 0.0020.13 ± 0.002 (a)670.83 ± 0.1457.17 ± 0.8
170–1980.860.12 ± 0.0020.14 ± 0.002 (b)680.97 ± 0.1363.98 ± 1
199–2590.830.12 ± 0.010.14 ± 0.01 (c)680.80 ± 0.1864.24 ± 1.7
260–3191.390.23 ± 0.0050.16 ± 0.003 (d)680.86 ± 0.2070.87 ± 1.5
(STR 2)
149–1691.360.17 ± 0.0070.12 ± 0.004 (a2)661.0 ± 0.0355.47 ± 1.6
170–1981.720.22 ± 0.0050.13 ± 0.006 (b2)661.2 ± 0.2458.76 ± 48
199–2591.670.22 ± 0.020.13 ± 0.01 (c2)660.95 ± 0.1062.07 ± 1.6
260–3192.790.43 ± 0.010.15 ± 0.003 (d2)661.03 ± 0.1768.76 ± 1.6
(UMD 1)
149–1690.680.06 ± 0.0010.08 ± 0.02 (e)632.4 ± 0.2438.35 ± 0.5
170–1980.860.08 ± 0.0030.09 ± 0.003 (f)632.7 ± 0.2540.59 ± 1.5
199–2590.830.09 ± 0.0040.09 ± 0.002 (f)632.2 ± 0.1541.74 ± 2
260–3191.390.13 ± 0.0070.10 ± 0.003 (g)632.3 ± 0.2846.80 ± 3.8
(UMD 2)
149–1691.360.12 ± 0.0020.09 ± 0.001 (e2 *)612.5 ± 0.1941.40 ± 0.4
170–1981.720.14 ± 0.0010.08 ± 0.004 (f2)613.0 ± 0.0440.51 ± 4.3
199–2591.670.13 ± 0.0040.08 ± 0.002 (f2)612.8 ± 0.1839.34 ± 1.7
260–3192.790.25 ± 0.0080.09 ± 0.002 (g2)612.81 ± 0.1943.48 ± 1.3
(CDD 1)
149–1690.680.07 ± 0.0030.09 ± 0.003 (h)651.6 ± 0.1843.97 ± 1.1
170–1980.860.09 ± 0.0040.10 ± 0.003 (i)651.5 ± 0.1247.58 ± 1.5
199–2590.830.10 ± 0.0030.11 ± 0.003 (j)651.4 ± 0.1352.70 ± 1.9
260–3191.390.18 ± 0.0050.13 ± 0.003 (k)651.44 ± 0.1058.76 ± 1
(CDD 2)
149–1691.360.13 ± 0.0030.10 ± 0.002 (h2 *)641.58 ± 0.0544.23 ± 2.8
170–1981.720.17 ± 0.0020.10 ± 0.006 (i)641.7± 0.1144.82 ± 1.9
199–2591.670.18 ± 0.0040.12 ± 0.003 (j2 *)641.65 ± 0.0150.49 ± 1.7
260–3192.790.33 ± 0.0080.12 ± 0.003 (K2)641.7± 0.1354.84 ± 1.2
* Letters in parentheses indicate significant difference between each type of digester at each OLR, (p < 0.05) for specific methane production a to k; a2 to k2. Values with the same alphabet means no significant difference. Alphabets with (*) mean value is higher and not lower.
Table 6. Methane production at steady state for single and double influent total solids (TS) concentration. The data used are presented in Table 5. p = differences in specific methane production.
% TSImpeller and UnmixedSTR and CDDUMD and CDDAll Reactors
Singlep < 0.01p < 0.01p < 0.01p < 0.0001
Doubledp < 0.01p < 0.01p < 0.01p < 0.0001

