Article

Gasification of Waste Cooking Oil to Syngas by Thermal Arc Plasma

by
Andrius Tamošiūnas
1,*,
Dovilė Gimžauskaitė
1,
Mindaugas Aikas
1,
Rolandas Uscila
1,
Marius Praspaliauskas
2 and
Justas Eimontas
3
1
Plasma Processing Laboratory, Lithuanian Energy Institute, Breslaujos str. 3, LT-44403 Kaunas, Lithuania
2
Laboratory of Heat Equipment Research and Testing, Lithuanian Energy Institute, Breslaujos str. 3, LT-44403 Kaunas, Lithuania
3
Laboratory of Combustion Processes, Lithuanian Energy Institute, Breslaujos str. 3, LT-44403 Kaunas, Lithuania
*
Author to whom correspondence should be addressed.
Energies 2019, 12(13), 2612; https://doi.org/10.3390/en12132612
Submission received: 4 June 2019 / Revised: 27 June 2019 / Accepted: 4 July 2019 / Published: 7 July 2019
(This article belongs to the Special Issue Plasma Processes for Renewable Energy Technologies)

Abstract

:
The depletion and usage of fossil fuels causes environmental issues and alternative fuels and technologies are urgently required. Therefore, thermal arc water vapor plasma for a fast and robust waste/biomass treatment is an alternative to the syngas method. Waste cooking oil (WCO) can be used as an alternative potential feedstock for syngas production. The goal of this experimental study was to conduct experiments gasifying waste cooking oil to syngas. The WCO was characterized in order to examine its properties and composition in the conversion process. The WCO gasification system was quantified in terms of the produced gas concentration, the H2/CO ratio, the lower heating value (LHV), the carbon conversion efficiency (CCE), the energy conversion efficiency (ECE), the specific energy requirements (SER), and the tar content in the syngas. The best gasification process efficiency was obtained at the gasifying agent-to-feedstock (S/WCO) ratio of 2.33. At this ratio, the highest concentration of hydrogen and carbon monoxide, the H2/CO ratio, the LHV, the CCE, the ECE, the SER, and the tar content were 47.9%, 22.42%, 2.14, 12.7 MJ/Nm3, 41.3% 85.42%, 196.2 kJ/mol (or 1.8 kWh/kg), and 0.18 g/Nm3, respectively. As a general conclusion, it can be stated that the thermal arc-plasma method used in this study can be effectively used for waste cooking oil gasification to high quality syngas with a rather low content of tars.

1. Introduction

Energy and transportation sectors face several issues on a global scale, such as a broad dependence on fossil fuels, their fluctuating prices and environmental impact. A strong global dependence on fossil fuels and their association with greenhouse gas emissions have laid emphasis on the prospects of alternative biofuels at an economically sustainable level. Regarding these goals, there have been significant achievements in the processing of biofuels. Strong attempts of commercialization of biofuels, as well as the development of compatible engines have evolved to advanced levels. Various feedstocks, such as lignocellulosic biomass (forestry residues, agricultural residues and energy crops), wastes (municipal solid waste, sewage sludge, refuse-derived fuels, animal manure, and industrial wastes), and algae, have been tested as sources in pyrolysis, gasification, liquefaction and anaerobic digestion (fermentation) to produce biofuels (biodiesel, bio-oil, bioethanol, biogas, hydrogen and/or syngas) [1,2,3,4,5].
Vegetable oils can also be considered as a potential fuel to substitute fossil fuels. In general, vegetable oil is categorized as edible and non-edible. Both may consist of triglycerides, which are derived from glycerol and the chains of three fatty acids bounded to glycerol by the carbonyl group [6]. Long-time deep-frying at high temperatures leads to the loss of the cooking oil’s properties, such as nutritional value, flavour, texture, and formation of carcinogens and other toxic compounds due to hydrolysis, oxidation, isomerization, and polymerization. As a result, the disposal of waste cooking oil (WCO) has become an unattended problem in terms of environmental and human health issues.
The worldwide production of vegetable oils has been continuously growing, reaching about 200 million metric tons (MMT) in 2018. Between 2012 and 2018, the production volume of vegetable oil increased by around 20% from 161.6 MMT to 204 MMT [7]. The consumption of vegetable oils worldwide in 2018 was 197 MMT, which consisted of palm oil (69.57 MMT), soybean oil (57.05), rapeseed oil (27.83 MMT), sunflower seed oil (17.75 MMT), palm kernel oil (7.95 MMT), peanut oil (5.53 MMT), cottonseed oil (5.15 MMT), coconut oil (3.41 MMT) and olive oil (3.07 MMT) [8]. Therefore, enormous amounts of waste cooking oil are generated globally every day at restaurants, pantry services and at massive scale frying and food processing. The annual quantity of WCO production differs in various countries and is around 18.5 million tons. Globally, the leader is the U.S., accounting for 10 million tons/year (or 55% of total production), followed by China (4.5 million tons/year), and the EU-28 (2.6 million tons/year). Japan, Malaysia, Canada and Taiwan also report some production of WCO, but only in much smaller quantities: 0.57, 0.5, 0.12 and 0.07 million tons, respectively [9].
Raw vegetable oil is not suitable for direct application in diesel engines. Problems related to using vegetable oils as engine fuel may result in short-term and long-term problems. The short-term problems are caused by its high viscosity (cold weather starting), the presence of natural gums and ash, as well as a low cetane number causing engine knocking. Long-term usage of vegetable oil may cause the coking of injectors, carbon deposition on pistons and the heads of engines due to the incomplete combustion of fuel. Moreover, failure of engine lubrication may occur due to oil polymerization [10,11].
The transesterification of vegetable oil and animal fats is one of the most commonly used methods, enabling the reduction of its viscosity, in addition to drying and condensation in cold weather. A number of different biodiesel production technologies, from vegetable oils and waste vegetable oils to animal fat, were investigated in [12,13,14,15]. However, the major challenge in the production of biodiesel from vegetable oils is the cost of raw materials and their limited availability. Fangrui and Milford [12] report that the cost of oils and fats accounts for 60% to 75% of the cost of biodiesel fuel. Therefore, the use of waste cooking oil can reduce costs, but the quality of used waste cooking oils can be poor. Waste cooking oil can also be a plausible source for the production of biolubricants [16,17].
Despite the production of biodiesel and biolubricants from WCO, it can also serve as a promising precursor for hydrogen and/or synthesis gas (syngas) production via the thermochemical pathway. Young-Doo Kim et al. [18] studied fresh and waste soybean oil gasification with air in a bench-scale fluidised-bed reactor. The effects of the equivalence ratio on the gas composition and tar content, as well as low-temperature oxidation on the fuel properties, were examined. It was stated that low-temperature oxidation of fuel improved the quality of the producer gas as the oleic and stearic acids contents in waste soybean oil increased, while the linoleic acid content decreased. Wu et al. [19] converted waste rapeseed oil to gaseous products (H2, CO, CH4, C2H2, C2H4, C2H6) using the aerosol gliding arc discharge plasma in the environment of an argon and oil mixture. It was found that 74% of the waste rapeseed oil was converted into gases at an applied voltage of 10 kV and a temperature of 800 °C. Meier et al. [20] performed WCO thermal cracking (fast pyrolysis) in a continuous tubular reactor under three isothermal temperatures (475, 500 and 525 °C) and different residence time (5–70 s). The dominant gaseous products detected were H2 and C3–C4, light hydrocarbons with concentrations of 45.7% and 48.9%, respectively, at a temperature of 500 °C. Yenumala et al. [21] conducted a thermodynamic equilibrium analysis of steam reforming (SR) and autothermal steam reforming (ASR) vegetable oils to syngas using the Gibbs free energy minimization method. The effects of a broad range of temperatures (573–1273 K) and a steam-to-carbon ratio (1:6) on the H2 yield and the selectivity of CO and CH4 were carried out. It was found that the yield of H2 increased with the increase of the steam-to-carbon ratio and temperature, but the selectivity of CH4 decreased. The optimum experimental conditions for steam reforming vegetable oil for a maximum H2 yield and a low selectivity of CH4 were found to be 875–925 K and a steam-to-carbon ratio of 5–6.
Generally, there is limited scientific literature available on the conversion of waste cooking oil for hydrogen-rich synthesis gas production via the thermochemical route of gasification. Therefore, this study focuses on the gasification of waste cooking oil to syngas using thermal arc plasma. Water vapor was used as the main plasma-forming gas with a small amount of air to protect the cathode from erosion. The gasification of WCO was quantified in terms of the producer gas concentration, the tar content in the producer gas and the condensate, the lower heating value (LHV), the H2/CO ratio, the carbon conversion efficiency (CCE), the energy conversion efficiency (ECE), and the specific energy requirements (SER).

2. Materials and Methods

2.1. Waste Cooking Oil and Its Characterization Methods

Waste cooking oil was received from a local JSC Bionova in Kaunas, Lithuania. The company collects used cooking oil from restaurants and frying and food processing companies across Lithuania. Generally, the type of used vegetable oil received could not be clearly identified. Therefore, a proximate and ultimate analysis, as well as a gas chromatography method were used to characterise the waste cooking oil. The proximate (volatile matter, fixed carbon, ash, moisture and lower heating value) and the ultimate (content of C, H, N, S, O, Cl) analyses were performed by a fuel elements analyser Flash 2000 (ThermoFisher Scientific, the Netherlands), a fuel calorimeter IKA C5000 (IKA, Germany) and a thermogravimeter TGA 4000 coupled with a gas chromatograph Clarus 680 and a mass spectrometer Clarus 600 T (Perkin Elmer, USA) according to standards LST EN ISO 16948:2015, LST EN ISO 16994:2016 [22]. A gas chromatograph Clarus 500 (Perkin Elmer, USA) was used to measure the composition of the fatty acids in the WCO according to the methodology provided in the standard LST EN ISO5508 [23].

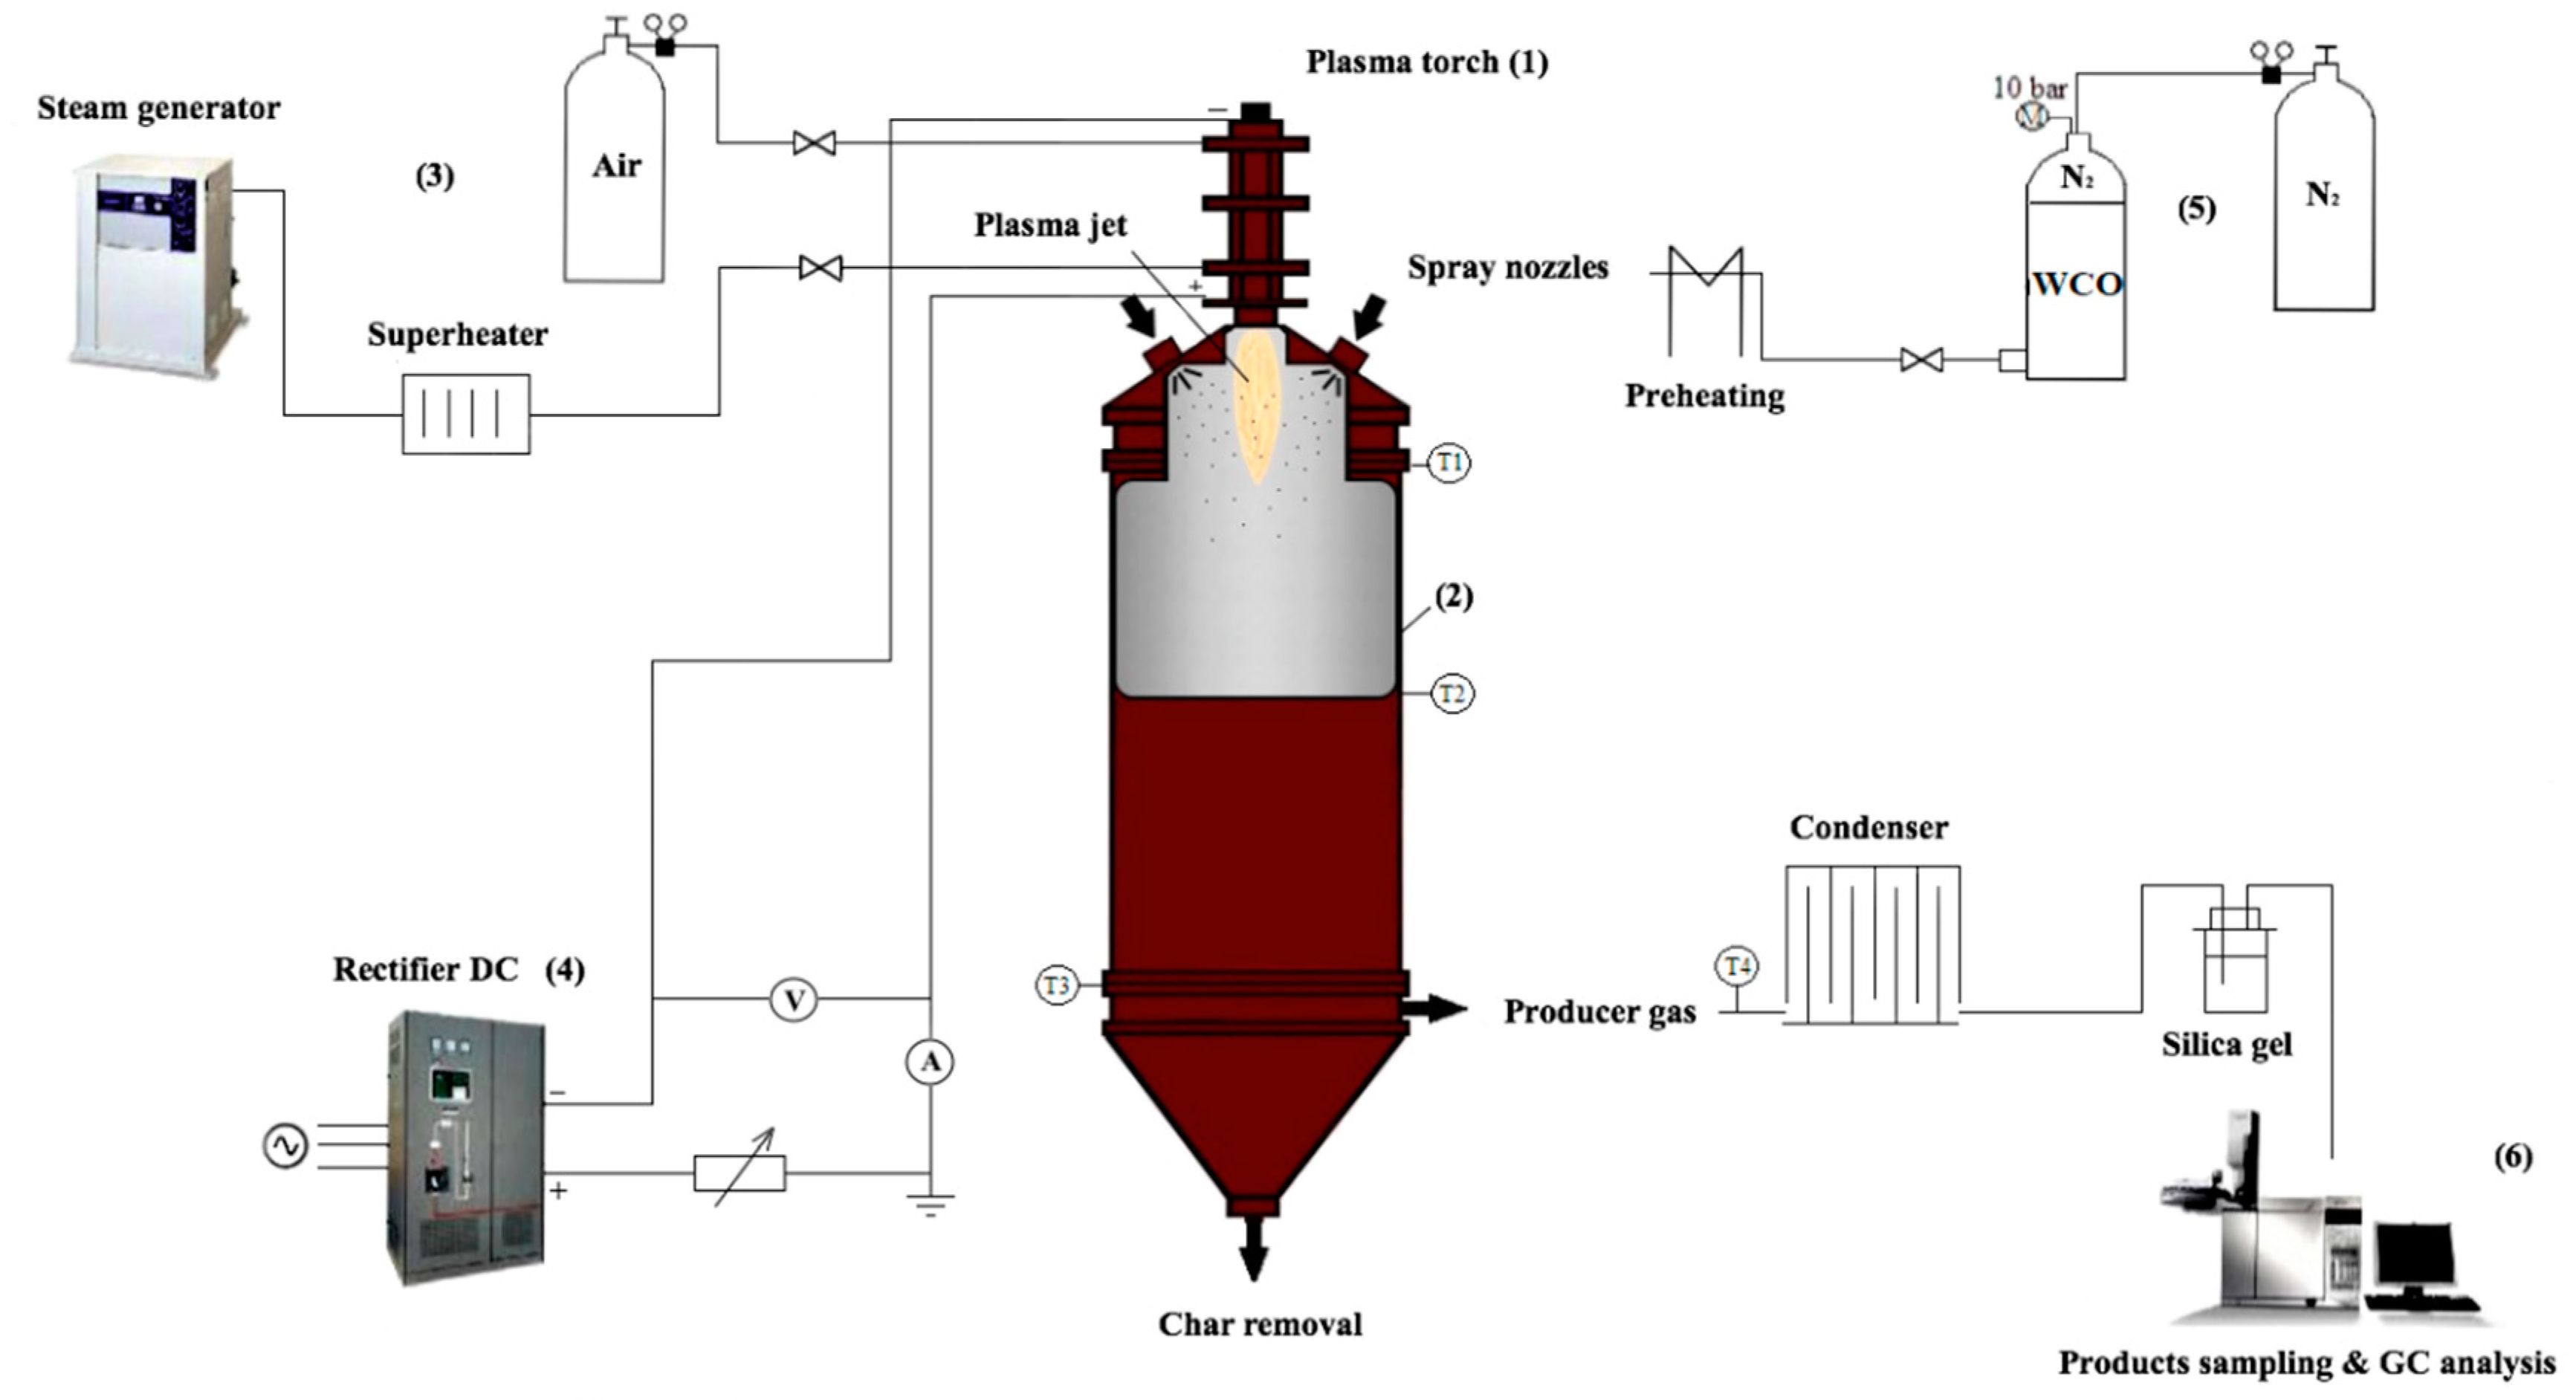
2.2. WCO Gasification Setup

For the gasification of waste cooking oil to syngas, a plasma chemical reactor of 0.0314 m3 was used. The reactor was insulated with Al2O3 ceramics, with a thickness of 25 mm. The length of the reactor was 1 m, with an inner diameter of 0.2 m. The schematic of the experimental setup is shown in Figure 1, which includes the plasma torch (1), the chemical reactor (2), the plasma-forming gas feeding system (3), the electric circuit (4), the waste cooking oil feeding with preheating (5), and a line for producer gas sampling and analysis (6). T1, T2, T3, and T4 stand for the thermocouples used to measure the temperature gradient in the reactor and the producer gas temperature. An R-type thermocouple was used to measure the temperature at the position T1, and a K-type thermocouple was used to measure the temperature at the positions T2, T3, and T4. However, temperature measurement at the position T1 was challenging, as the thermocouple over-exceeded its temperature range, reaching 1430 °C. The rest of the temperature gradient is as follows: 950 °C at T2, 700 °C at T3, and 550 °C at T4. A similar gasification system was used for waste glycerol gasification to syngas [24]. Additional information about the experimental gasification system and the plasma torch can be found in previous research [25,26,27].
A linear-type direct current (DC) arc plasma torch with 48–57.6 kW power (I = 160 A, U = 300–360 V) was used to generate plasma stream at atmospheric pressure. The electrodes of the plasma torch were made of copper and a hafnium cathode was used as an electron emitter. The anode of the torch had a stair-step shape in order to minimize the electric arc’s pulsations, thus making the operation of the plasmatron more stable. The length of the stair-step anode was 0.18 m with an inner diameter of 12 mm at the narrowest part and 18 mm at the exit nozzle. The length of the narrow part of the anode was 30 mm and the remaining wider part was 150 mm. An electromagnetic coil was also used in order to additionally increase the arc’s rotation and thus prolong the lifetime of the anode. The plasma torch was water cooled. Water vapor was used as the main plasma-forming gas, heat carrier and reactant with a small admixture of air (up to 17%) tangentially supplied near the hafnium cathode for erosion protection. A 3 kW superheater was used to overheat the water vapor to 240 °C prior to its supply to the plasma torch. This is an essential condition to avoid condensation on the inner walls of the arc discharge chamber of the plasma torch and thus prolong the lifetime of the electrodes.
The waste cooking oil was preheated to around 110 °C in order to reduce its viscosity, thus ensuring spraying stability, constant flow rate and better atomization. A special commercially available spraying nozzle by the Danfoss company with a 2.21 g/s (7.95 kg/h) capacity was used to inject the waste cooking oil into the plasma chemical reactor. A constant 10 bar pressure was kept in the WCO feeding line in order to guarantee a stable flow rate at the capacity limits of the nozzle. The spraying angle of the nozzle was 60° with an S-type solid spray pattern.
The producer gas was condensed and sent for sampling and analysis. The concentrations of gaseous products were measured by an Agilent 7890 A gas chromatograph (GC) equipped with a dual-channel thermal conductivity detector and a valve system.

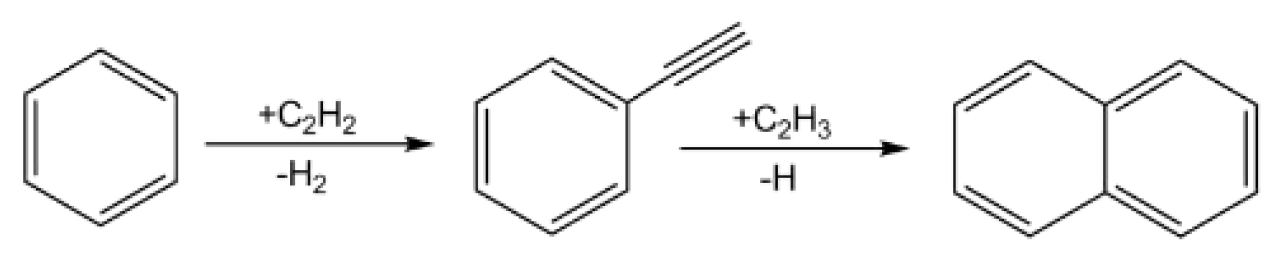
2.3. Tar Content Measurement and Formation Mechanism

The measurement of the tar content in the producer gas and the condensate was also performed. The entire procedure was done according to the standard EN 1948-2:2006 [28].
Extraction: tar extraction was performed with toluene at ambient temperature. The formed emulsion was disrupted by the addition of a saturated sodium chloride solution.
Distillation: the flask was filled with liquid and inserted into the rotary distiller. The temperature was about 60 °C and the pressure was 550 mmHg. The speed of the distillation was about 2–3 drops per second.
Analysis: Analysis of the calibrated compounds was performed with a Varian GC-3800 gas chromatograph equipped with a flame ionization detector (FID). Restek RXI-5ms universal 60 m long with a 0.25 mm inner diameter capillary column with a 0.25 μm thick (5% phenol) methylpolysiloxane layer was used for chromatographic separation of the compounds. The main conditions of the experiment are as follows: an injector temperature of −275 °C, a dilution gas ratio of 1:75, and chromatographic column temperatures from 50 °C to 325 °C (8 °C/min). The carrier gas was helium with a 1.2 mL/min gas flow. The compounds obtained during the experiment were identified by the characteristic output times obtained by analyzing the calibration mixture EPA 610.
The formation of tars starts after the linear oil’s thermal decomposition to cyclic compounds. At thermal degradation points, linear oils decompose, forming various polycyclic aromatic hydrocarbons (PAHs). The formation of PAHs may have various mechanisms, wherein hydrogen-abstraction acetylene addition is widely acknowledged. Below, a simple illustration of naphthalene generation from benzene through intermediate phenyl acetylene is shown [29].
Energies 12 02612 i001

2.4. Quantification Parameters

In order to assess the performance of any gasification system, basic measure parameters were used. These measure parameters include the concentrations of compounds present in producer gas, the syngas yield, the H2/CO ratio, the LHV, the carbon conversion efficiency (CCE), the energy conversion efficiency (ECE), and the specific energy requirements (SER). The methodology enabling the evaluation of the performance of the gasification system is discussed in more detail in [24,26].
The LHV (MJ/Nm3):
LHV = 10.78 H 2 ( % ) + 12.63 CO ( % ) + 35.88 CH 4 ( % ) + 56.5 C 2 H 2 ( % ) + 64.5 C 2 H 6 ( % ) + 93.21 C 3 H 8 ( % ) ,
where H2 (%), CO (%), CH4 (%), C2H2 (%), C2H6 (%), and C3H8 (%) are the content of gaseous products in the producer gas (vol.%).
The CCE (%):
CCE = 12 × Y dry   gas × { [ CO + CO 2 + CH 4 ] + 2 × [ C 2 H 2 + C 2 H 6 ] + 3 × C 3 H 8 22.4 × C } × 100 % ,
where Ydry gas is the dry gas yield of dry feedstock (Nm3/kg), CO, CO2, CH4, C2H2, and C2H6 are in v/v (%), and C is in wt.% of carbon in dry feedstock.
The ECE (%):
ECE = m syngas × LHV syngas P plasma + m WCO × LHV WCO × 100 % ,
where m syngas and m WCO are the mass flow rates of syngas and feedstock (kg/s), respectively. LHVsyngas and LHVWCO are the net calorific values of the produced syngas and the feedstock (MJ/kg), respectively. P is the plasma torch power (kW).
The SER (kJ/mol or kWh/kg):
SER = P plasma m syngas ,
where SER is the specific energy requirement (kJ/mol or kWh/kg), Pplasma is the plasma torch power (kJ/s), and m syngas is the mass flow rate of produced syngas (mol/s).

3. Results

3.1. WCO Characterisation

Table 1 and Table 2 present the ultimate and proximate analysis of the waste cooking oil used as a feedstock for gasification as well as the fatty acid composition in it, respectively. As can be seen from Table 1, the WCO was mostly composed of carbon, hydrogen and oxygen compounds with traces of nitrogen, sulphur and chlorine. The lower heating value of the WCO was determined to be 39.24 MJ/kg and the volatile organic matter comprised 99.15 wt.%.
Since vegetable oils are considered as a mixture of triglycerides, i.e., an ester consisting of glycerol and three fatty acids, saturated or unsaturated aliphatic hydrocarbon compounds present in the vegetable oils generally vary from 8 to 24 carbon atoms. The dominant majority of carbon atoms usually varies between 16 and 18 [21]. As can be seen from Table 2, the dominant carbon atoms in the WCO used for gasification to syngas ranged from 16 to 18. Palmitic, stearic, oleic, linoleic, and linolenic acids were the major fatty acids constituting the waste cooking oil used as a feedstock, which comprised more than 90 wt.%. It was also detected that insoluble impurities, including oxidized fatty acids, were present in the WCO, amounting to 6.31 wt.%.

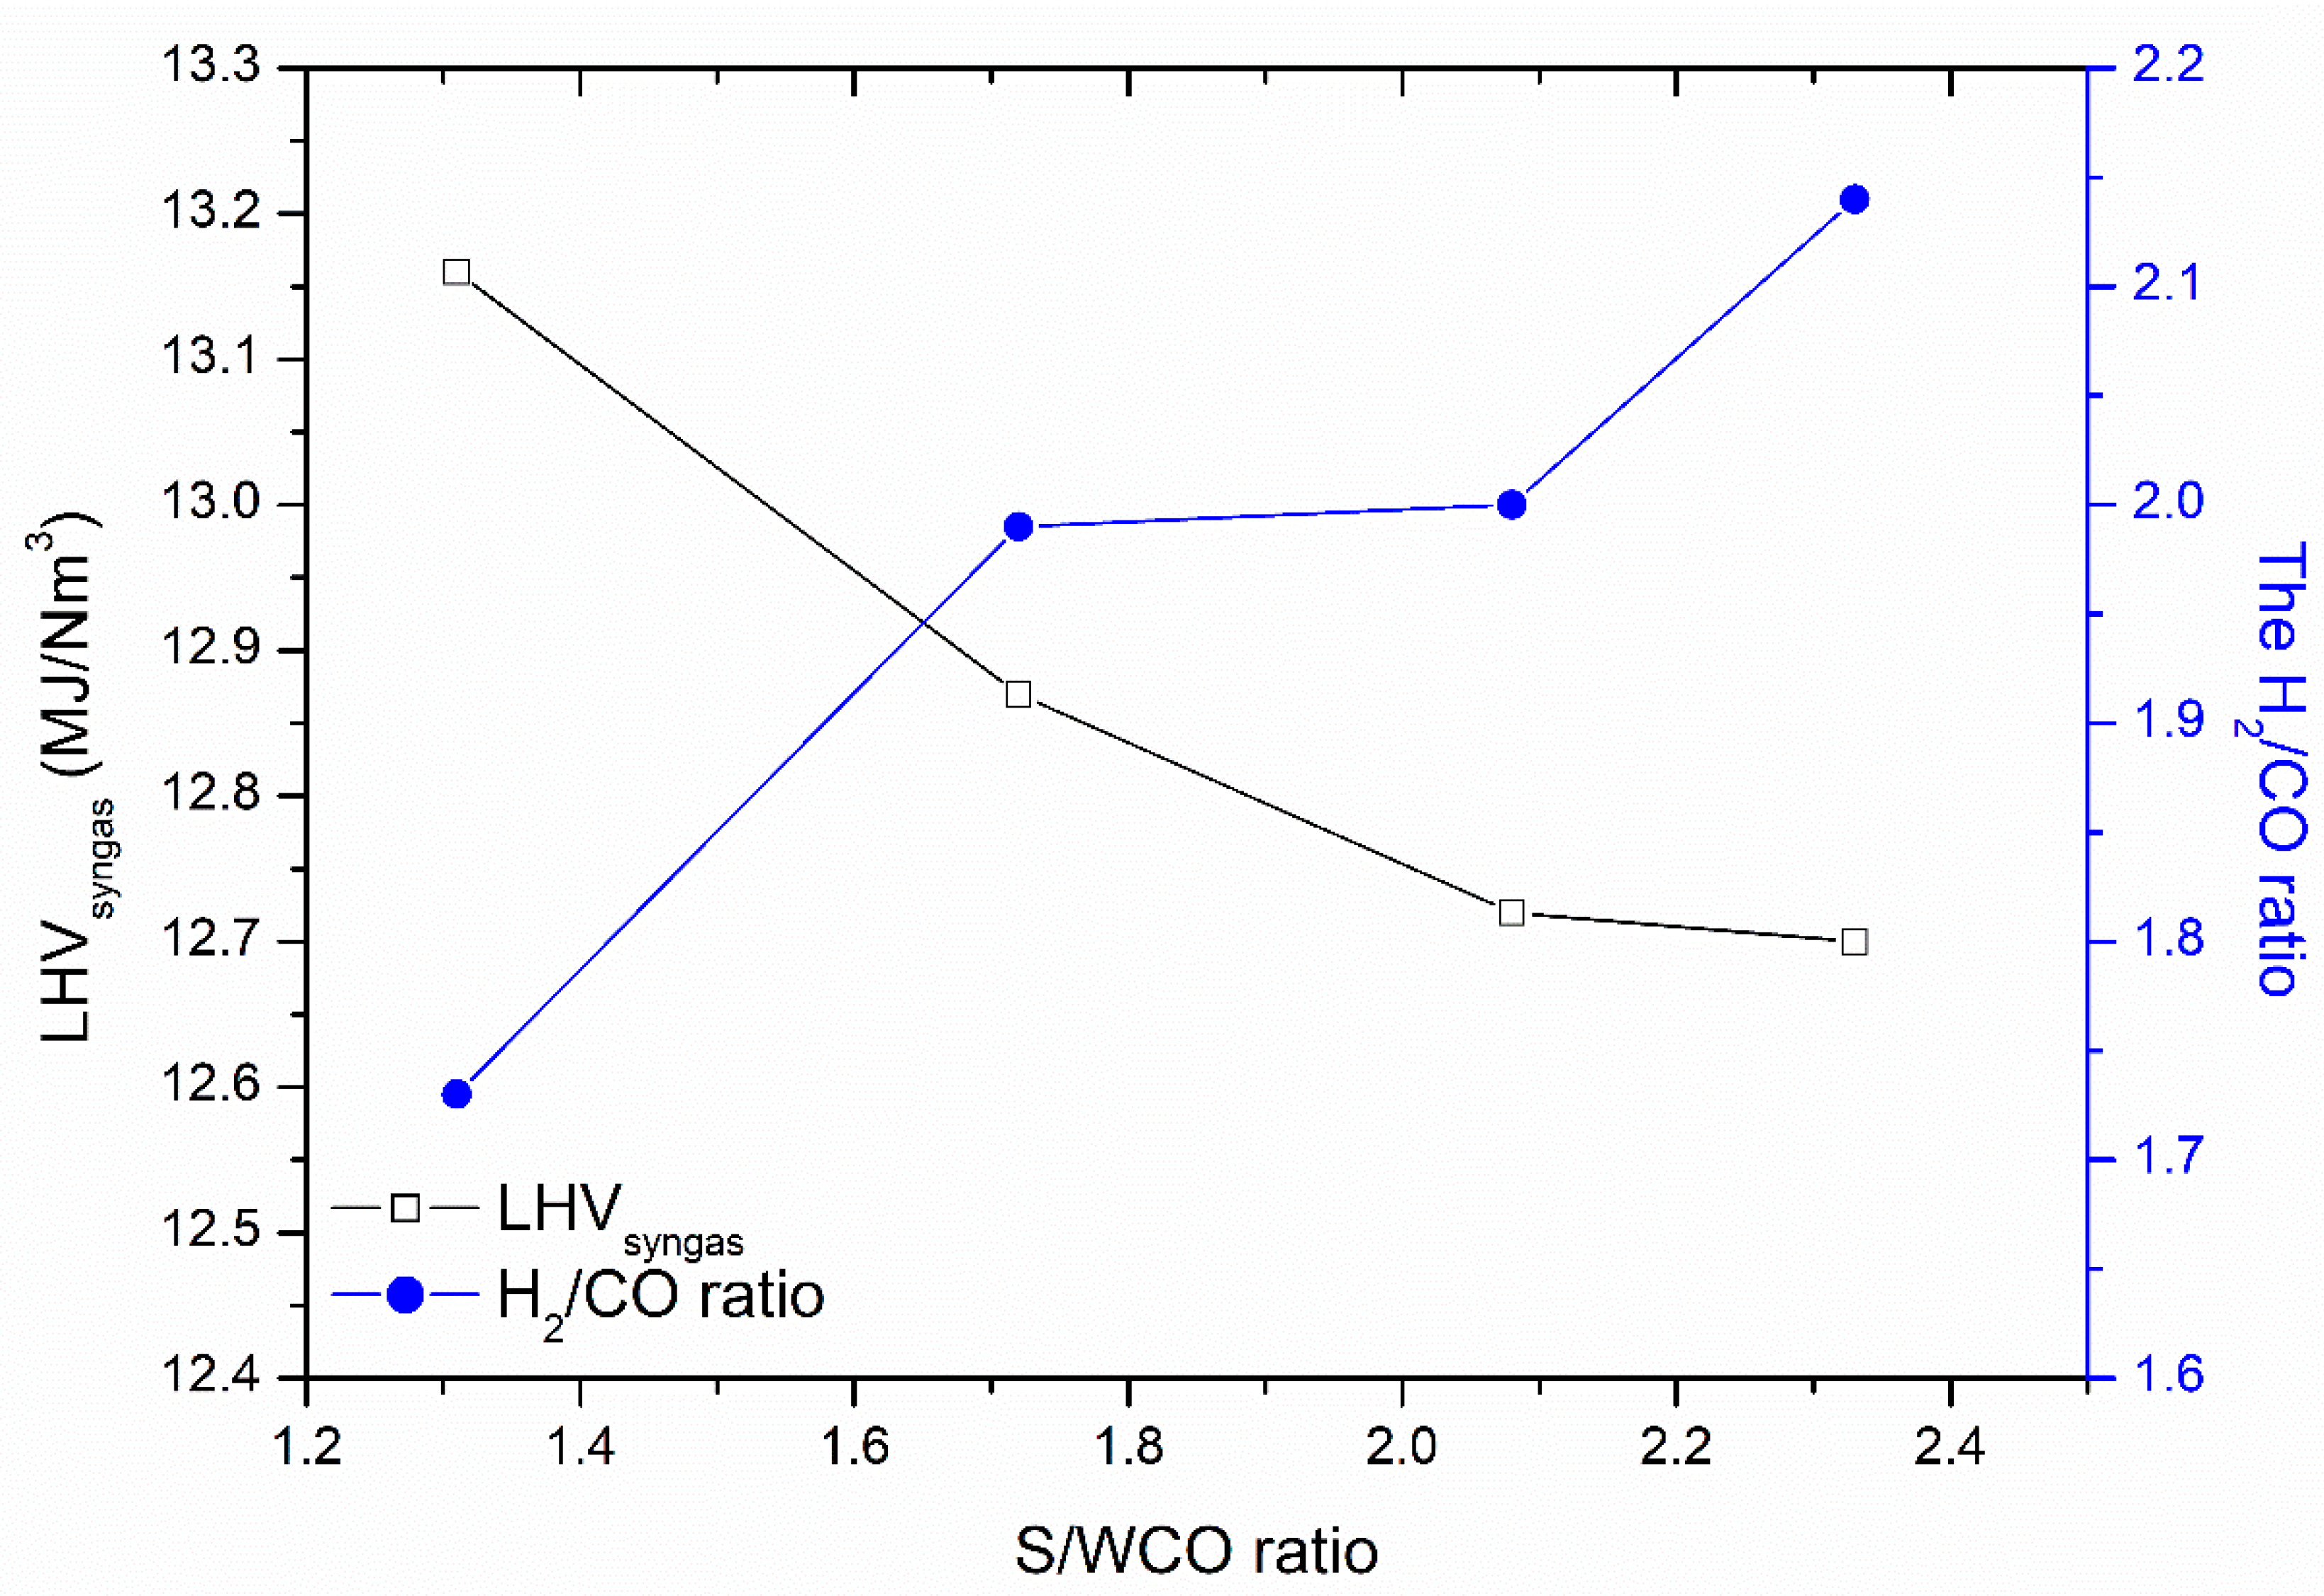
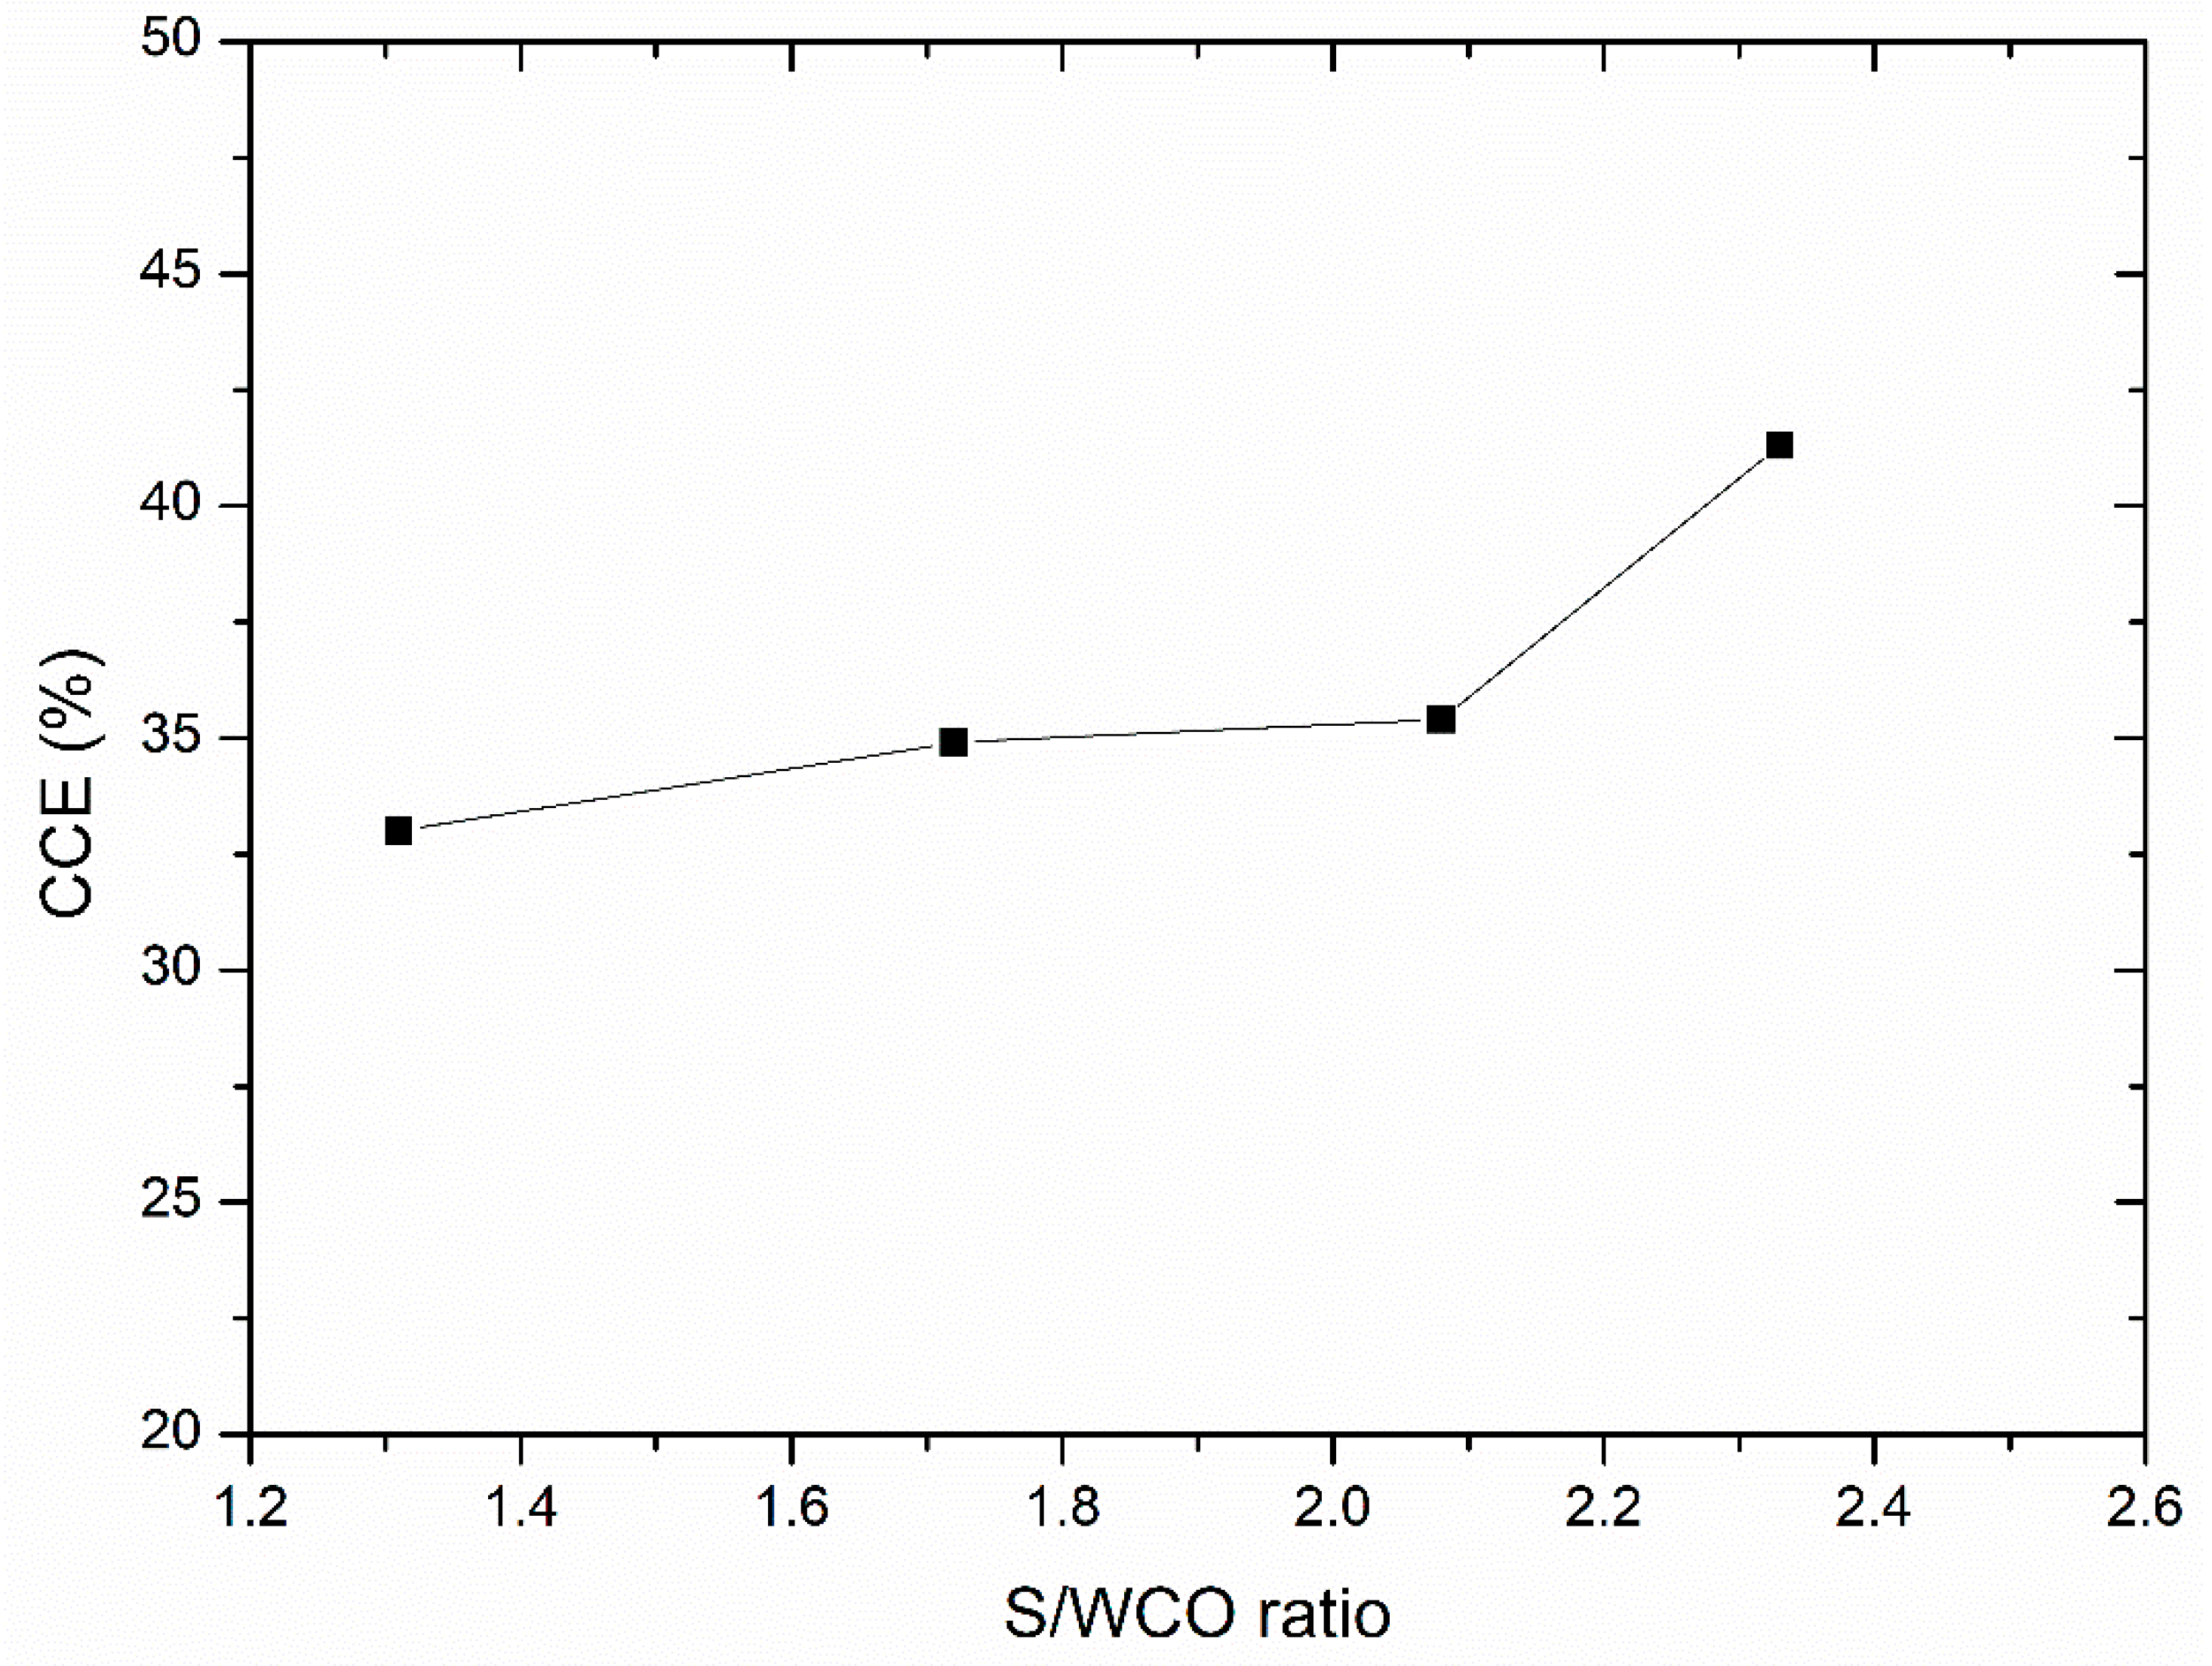
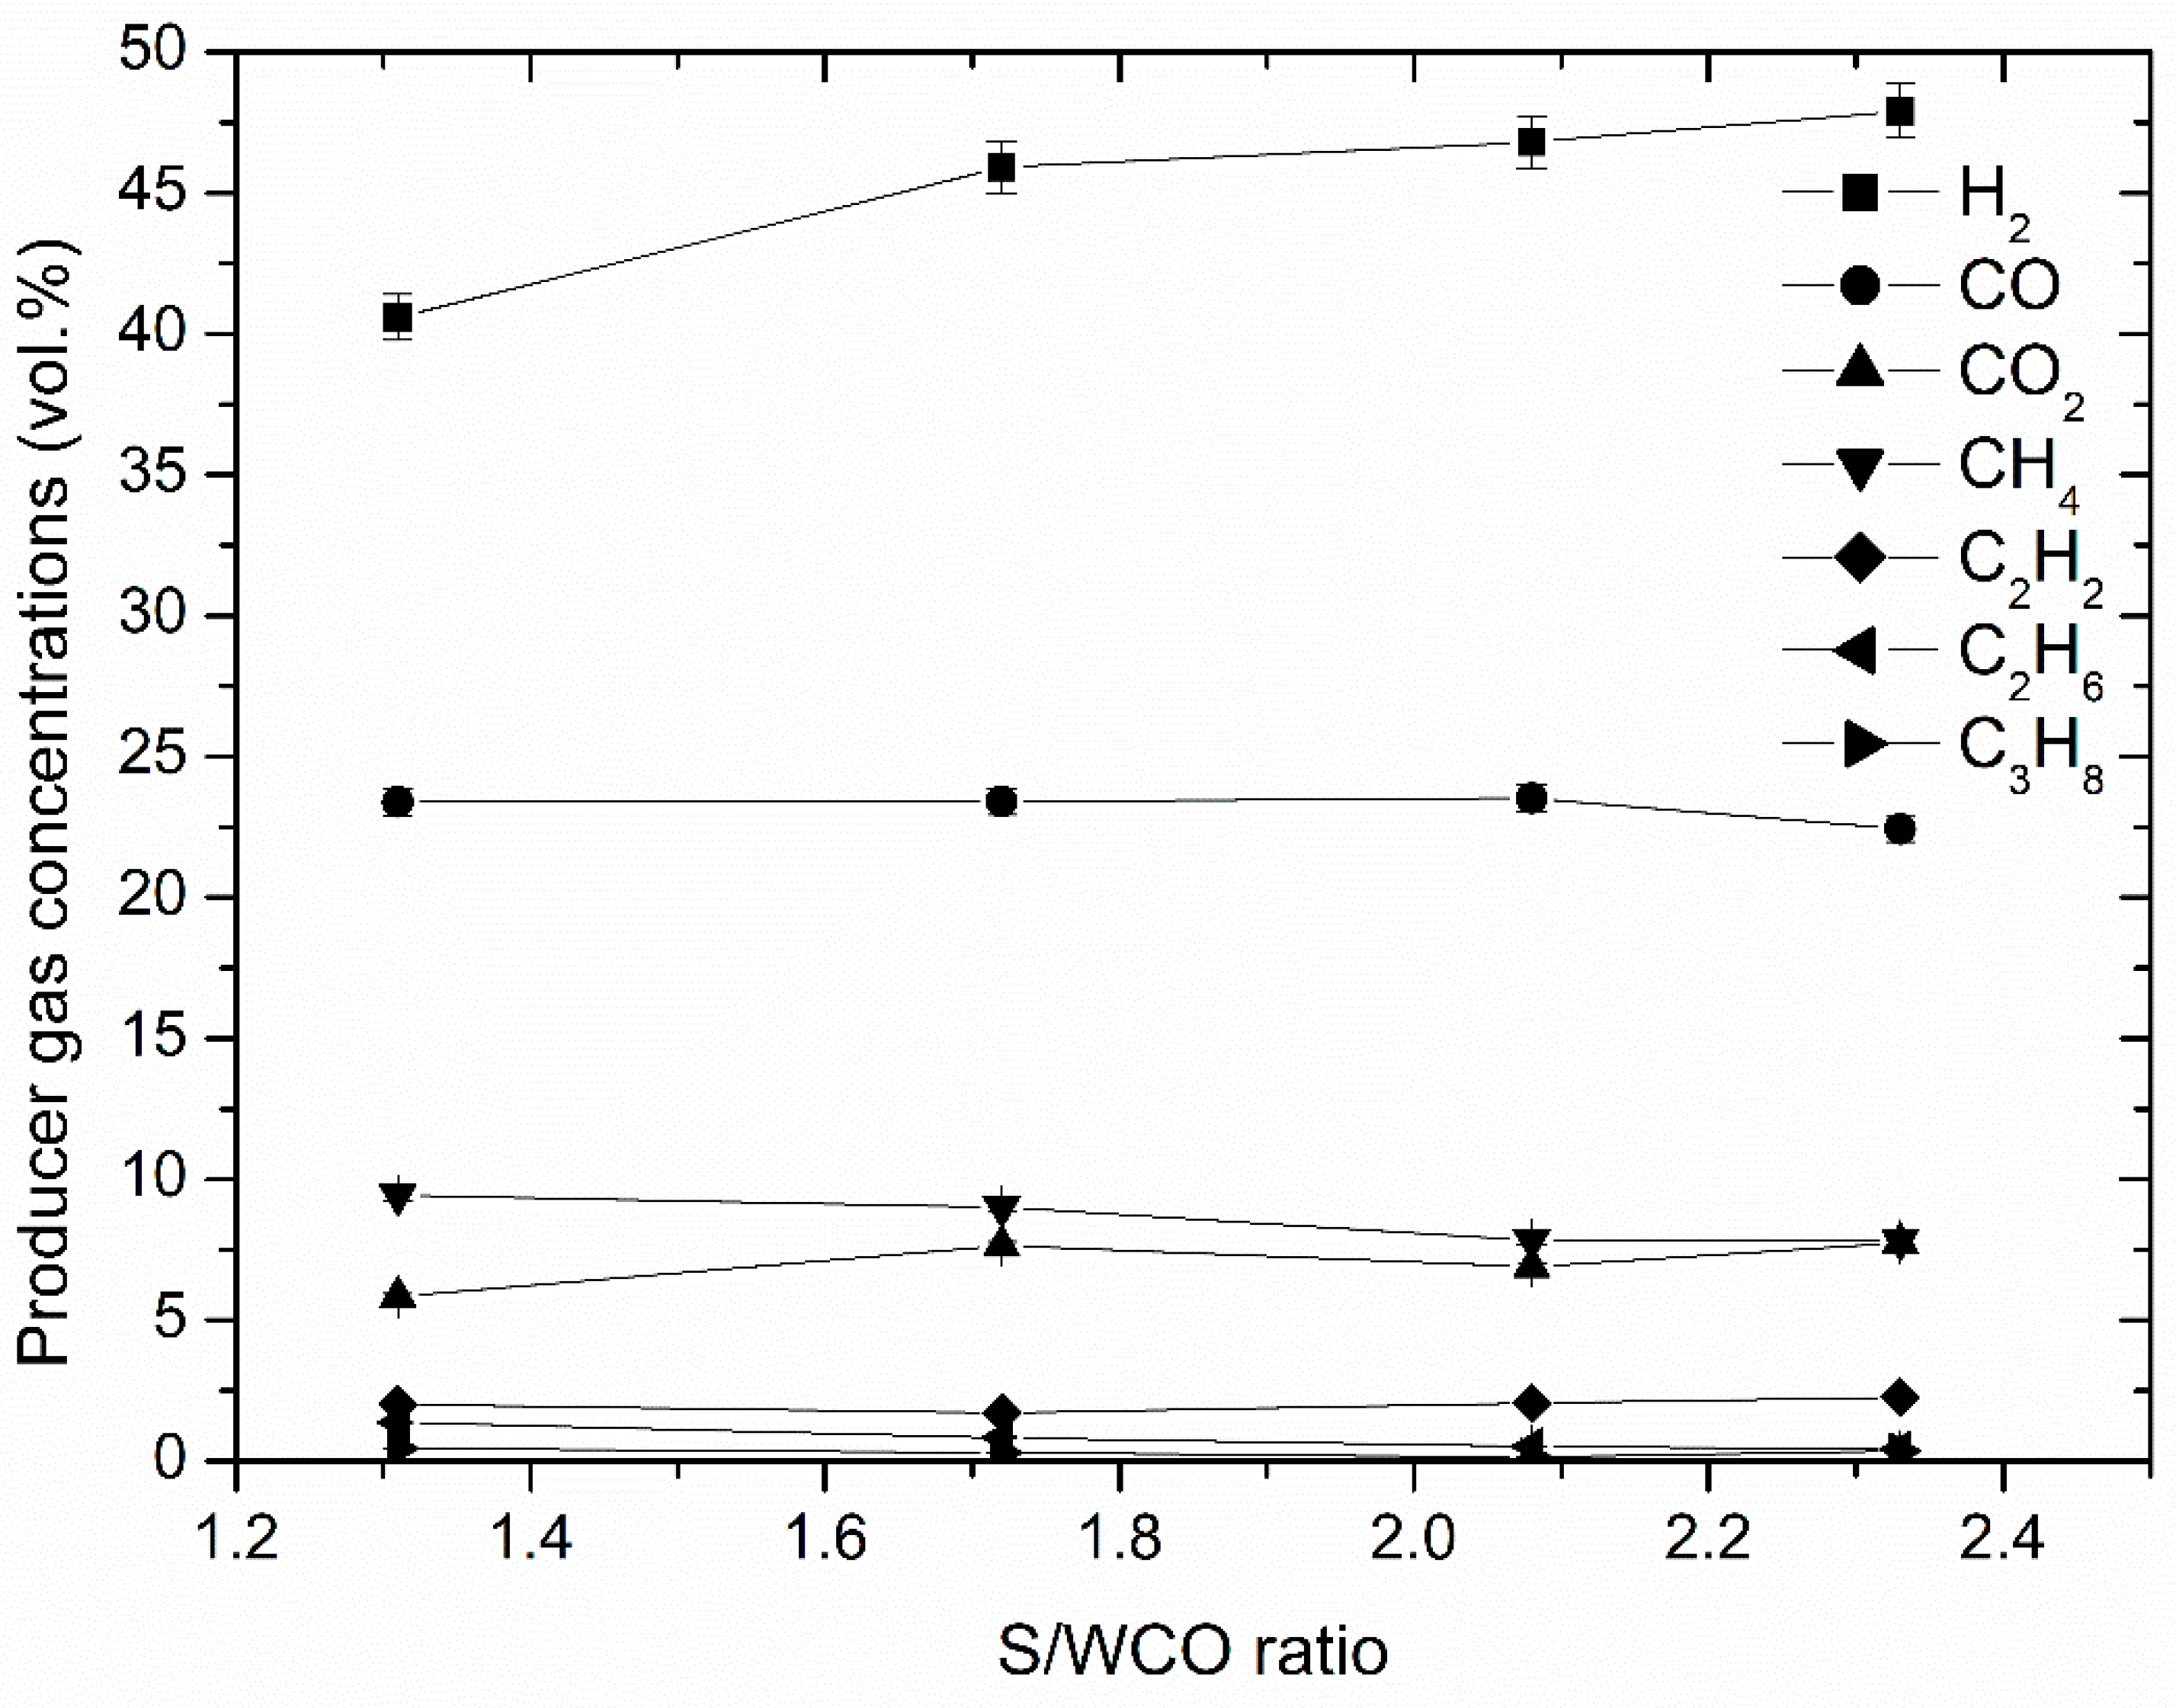
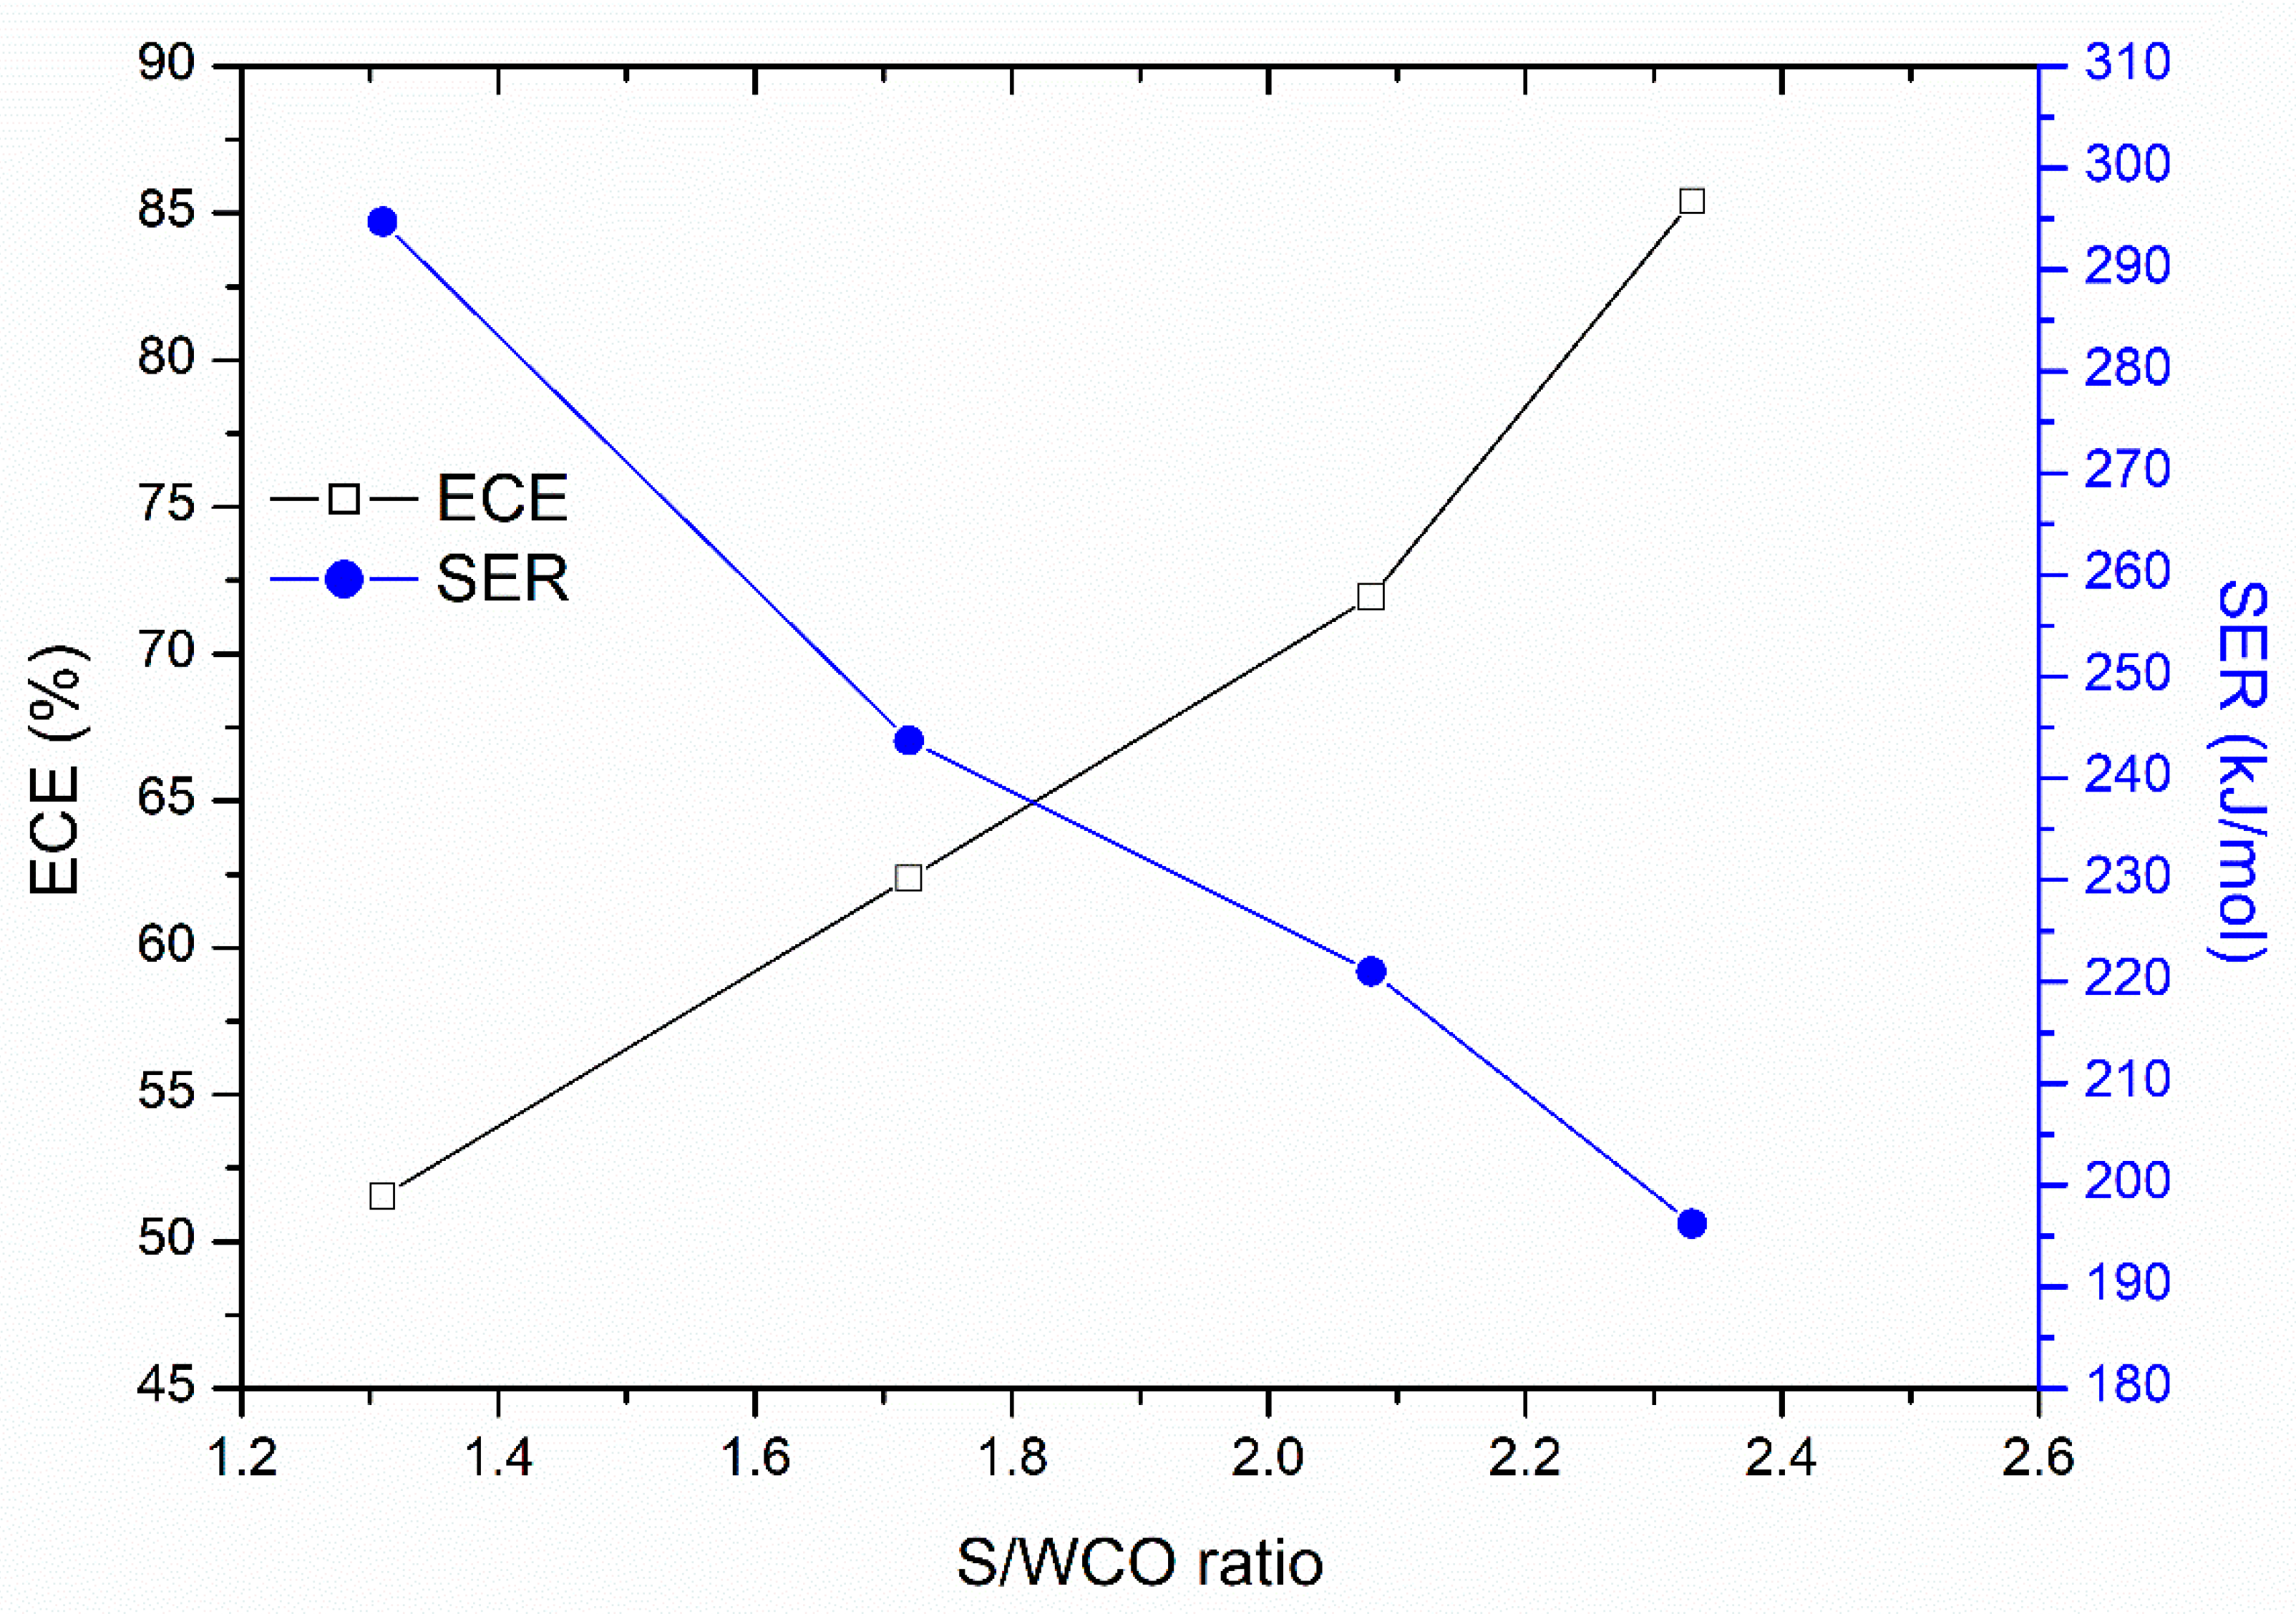
3.2. Effect of Gasifying the Agent-to-Feedstock Ratio on the Gasification Efficiency of Waste Cooking Oil

Water vapor was used as the gasifying agent, but it also served as the main plasma-forming gas and heat carrier, constituting a generated plasma stream with active radicals inside. The flow rate of the water vapor entering the plasma torch to be heated by the electric arc to form the plasma stream ranged from 2.4 g/s to 4.65 g/s, whereas the flow rate of the WCO was kept constant at 2.21 g/s. Generally, the change in the flow rate of water vapor is directly linked with the change in the power of the plasma torch through the relation P = IU. At the constant arc’s current intensity, the change in the flow rate of plasma-forming gas may increase or decrease the arc voltage. As a result, the power of the plasma torch changes. The change in the power of the plasma torch is also directly coupled with the change in the enthalpy of the generated plasma stream, and thus the temperature, due to the relation hf = f(Tf). Therefore, the effect of the water vapor-to-waste cooking ratio on the gasification process efficiency was determined. For simplicity, this ratio was chosen as a principle and is noted as an S/WCO ratio. It should be kept in mind that this ratio also corresponds (is equal) to the power-to-WCO ratio or the temperature-to-WCO ratio, as the trend of the curves in the figures remains the same. The mean temperature of the generated plasma stream entering the plasma chemical reactor was in the range of 2600–3000 ± 50 K.
The effect of the S/WCO ratio on the producer gas concentrations is shown in Figure 2. As can be seen from the figure, the prevailing producer gases were hydrogen and carbon monoxide, followed by carbon dioxide and methane, with highest concentrations of 47.9%, 22.42%, 7.74%, 7.83%, respectively, at the S/WCO ratio of 2.33. Moreover, higher hydrocarbons were also observed, such as acetylene (C2H2), ethane (C2H6) and propane (C3H8), with concentrations of 2.27%, 0.42% and 0.37%, respectively, at the same ratio. As the S/WCO ratio increased from 1.31 to 2.33 (the plasma torch power increased from 48 kW to 57.6 kW), the concentrations of the constituents in the producer gas did not change significantly. The highest increase was observed only for H2 when the concentration increased from 40.58% to 47.9%. This is mostly attributed to the dominance of steam reforming, water–gas shift (WGS) and cracking reactions [24]. The concentration of CO was almost stable at any S/WCO ratio and was around 22%–23.5%. During the WCO conversion to syngas process, the observed concentration of CH4 was rather high, up to 9.44%. The increased S/WCO ratio, from 1.31 to 2.33, led to a slight decrease in the methane content, from 9.44% to 7.83%. This can be explained by reverse methanation and hydrogenation reactions, whereby methane and water forms hydrogen, carbon monoxide or carbon dioxide. The concentration of the latter at this ratio increased from 5.83% to 7.74%. Additionally, higher hydrocarbons, such as acetylene, ethane and propane, formed due to insufficient residence time to fully convert the carboxylic acids with long aliphatic chains to simple H2, CO and CO2 molecules.
The effect of the S/WCO ratio on the quality of the produced syngas and the H2/CO ratio is shown in Figure 3. The lower heating value of the producer gas (syngas) did not change significantly over the variable range of the S/WCO ratio during the experiments. The LHV was in the range of 12.5 MJ/Nm3 to 13.2 MJ/Nm3, which shows the production of good quality syngas. This was mostly attributed to the steam reforming reaction. Since water vapor was simultaneously used as a plasma-forming gas, a heat carrier and a gasifying agent, an additional portion of hydrogen came from the water-splitting reaction to hydrogen and oxygen, induced by its passage through the high temperature electric arc discharge region. According to the thermodynamic equilibrium calculations, the content of hydrogen coming from the water vapor plasma may constitute up to 9–10% (vol.) at the mean plasma stream temperature of 2800–3000 K [30]. The obtained H2/CO ratio of 2 showed the potential of the produced syngas to be directly used for biofuels production via Fischer–Tropsch (FT) synthesis without any ratio adjustment by the WGS reaction. The only problem might be the requirement of tar removal from the syngas prior to the application of the reaction. In the case of the syngas to be used for methane production via hydrogen methanation with carbon monoxide (5) or carbon dioxide (6), the process would require a H2/CO or H2/CO2 ratio adjustment. To perform a methanation reaction (5), the stoichiometric CO:H2 ratio should be 1:3. Therefore, in this experimental case, an extra hydrogen molecule would be required to ensure the success of the reaction. A methanation reaction (6) could be of greater interest, because the H2/CO2 ratio was around 6 to 7, when the theoretically required CO2:H2 stoichiometric ratio should be at least 1:4. In this case, like in the FT synthesis, tar removal prior to syngas upgrading to methane should be ensured. The tar content in the syngas will be discussed in the next section.
CO +   3 H 2 CH 4 + H 2 O , Δ H =   206 kJ mol ,
CO 2 + 4 H 2 CH 4 + H 2 O , Δ H = 165 kJ mol ,
The effect of the S/WCO ratio on the carbon conversion efficiency is shown in Figure 4. The highest value of the CCE was obtained at the S/WCO ratio of 2.33 and exceeded 41.3%. As a result, the carbon present in the waste cooking oil was not fully converted into gaseous products. Some solid carbon deposition was observed during the experiments. Due to the presence of 18 carbon atoms in the WCO, the cracking of the long-chain hydrocarbons into smaller and simpler ones takes time. Therefore, some amounts of higher gaseous hydrocarbons as well as solid carbon were obtained.
The effect of the S/WCO ratio on the gasification process performance in terms of the energy conversion efficiency (ECE) and the specific energy requirements (SER) is shown in Figure 5. As can be seen from the figure, the increased S/WCO ratio from 1.31 to 2.33 led to an increase in the ECE and a decrease in the SER from 51.54% to 85.42% and 294.7 kJ/mol (2.73 kWh/kg) to 196.2 kJ/mol (1.82 kWh/kg), respectively. As the power of the plasma torch increased from 48 kW to 57.6 kW due to the increased flow rate of the water vapor, this should lead to a decrease in the energy conversion efficiency. However, more syngas was produced at the constant flow rate of feedstock (Equation (3)) which compensated for the energy losses and led to an increase in the ECE. All the spent energy for the process should be included in the optimized process case, which would lower the value of the ECE. This should include the energy consumed during steam production, steam superheating, feedstock heating, etc., which is not currently optimized. In addition, the utilization of the process waste heat would help to reduce the overall losses and increase the ECE. The specific energy needed to convert one mole of the waste cooking oil to syngas decreased, thus making the process more efficient, even if the power consumed to run the plasma torch increased. This was mostly attributed to the higher syngas production volume (Equation (4)).

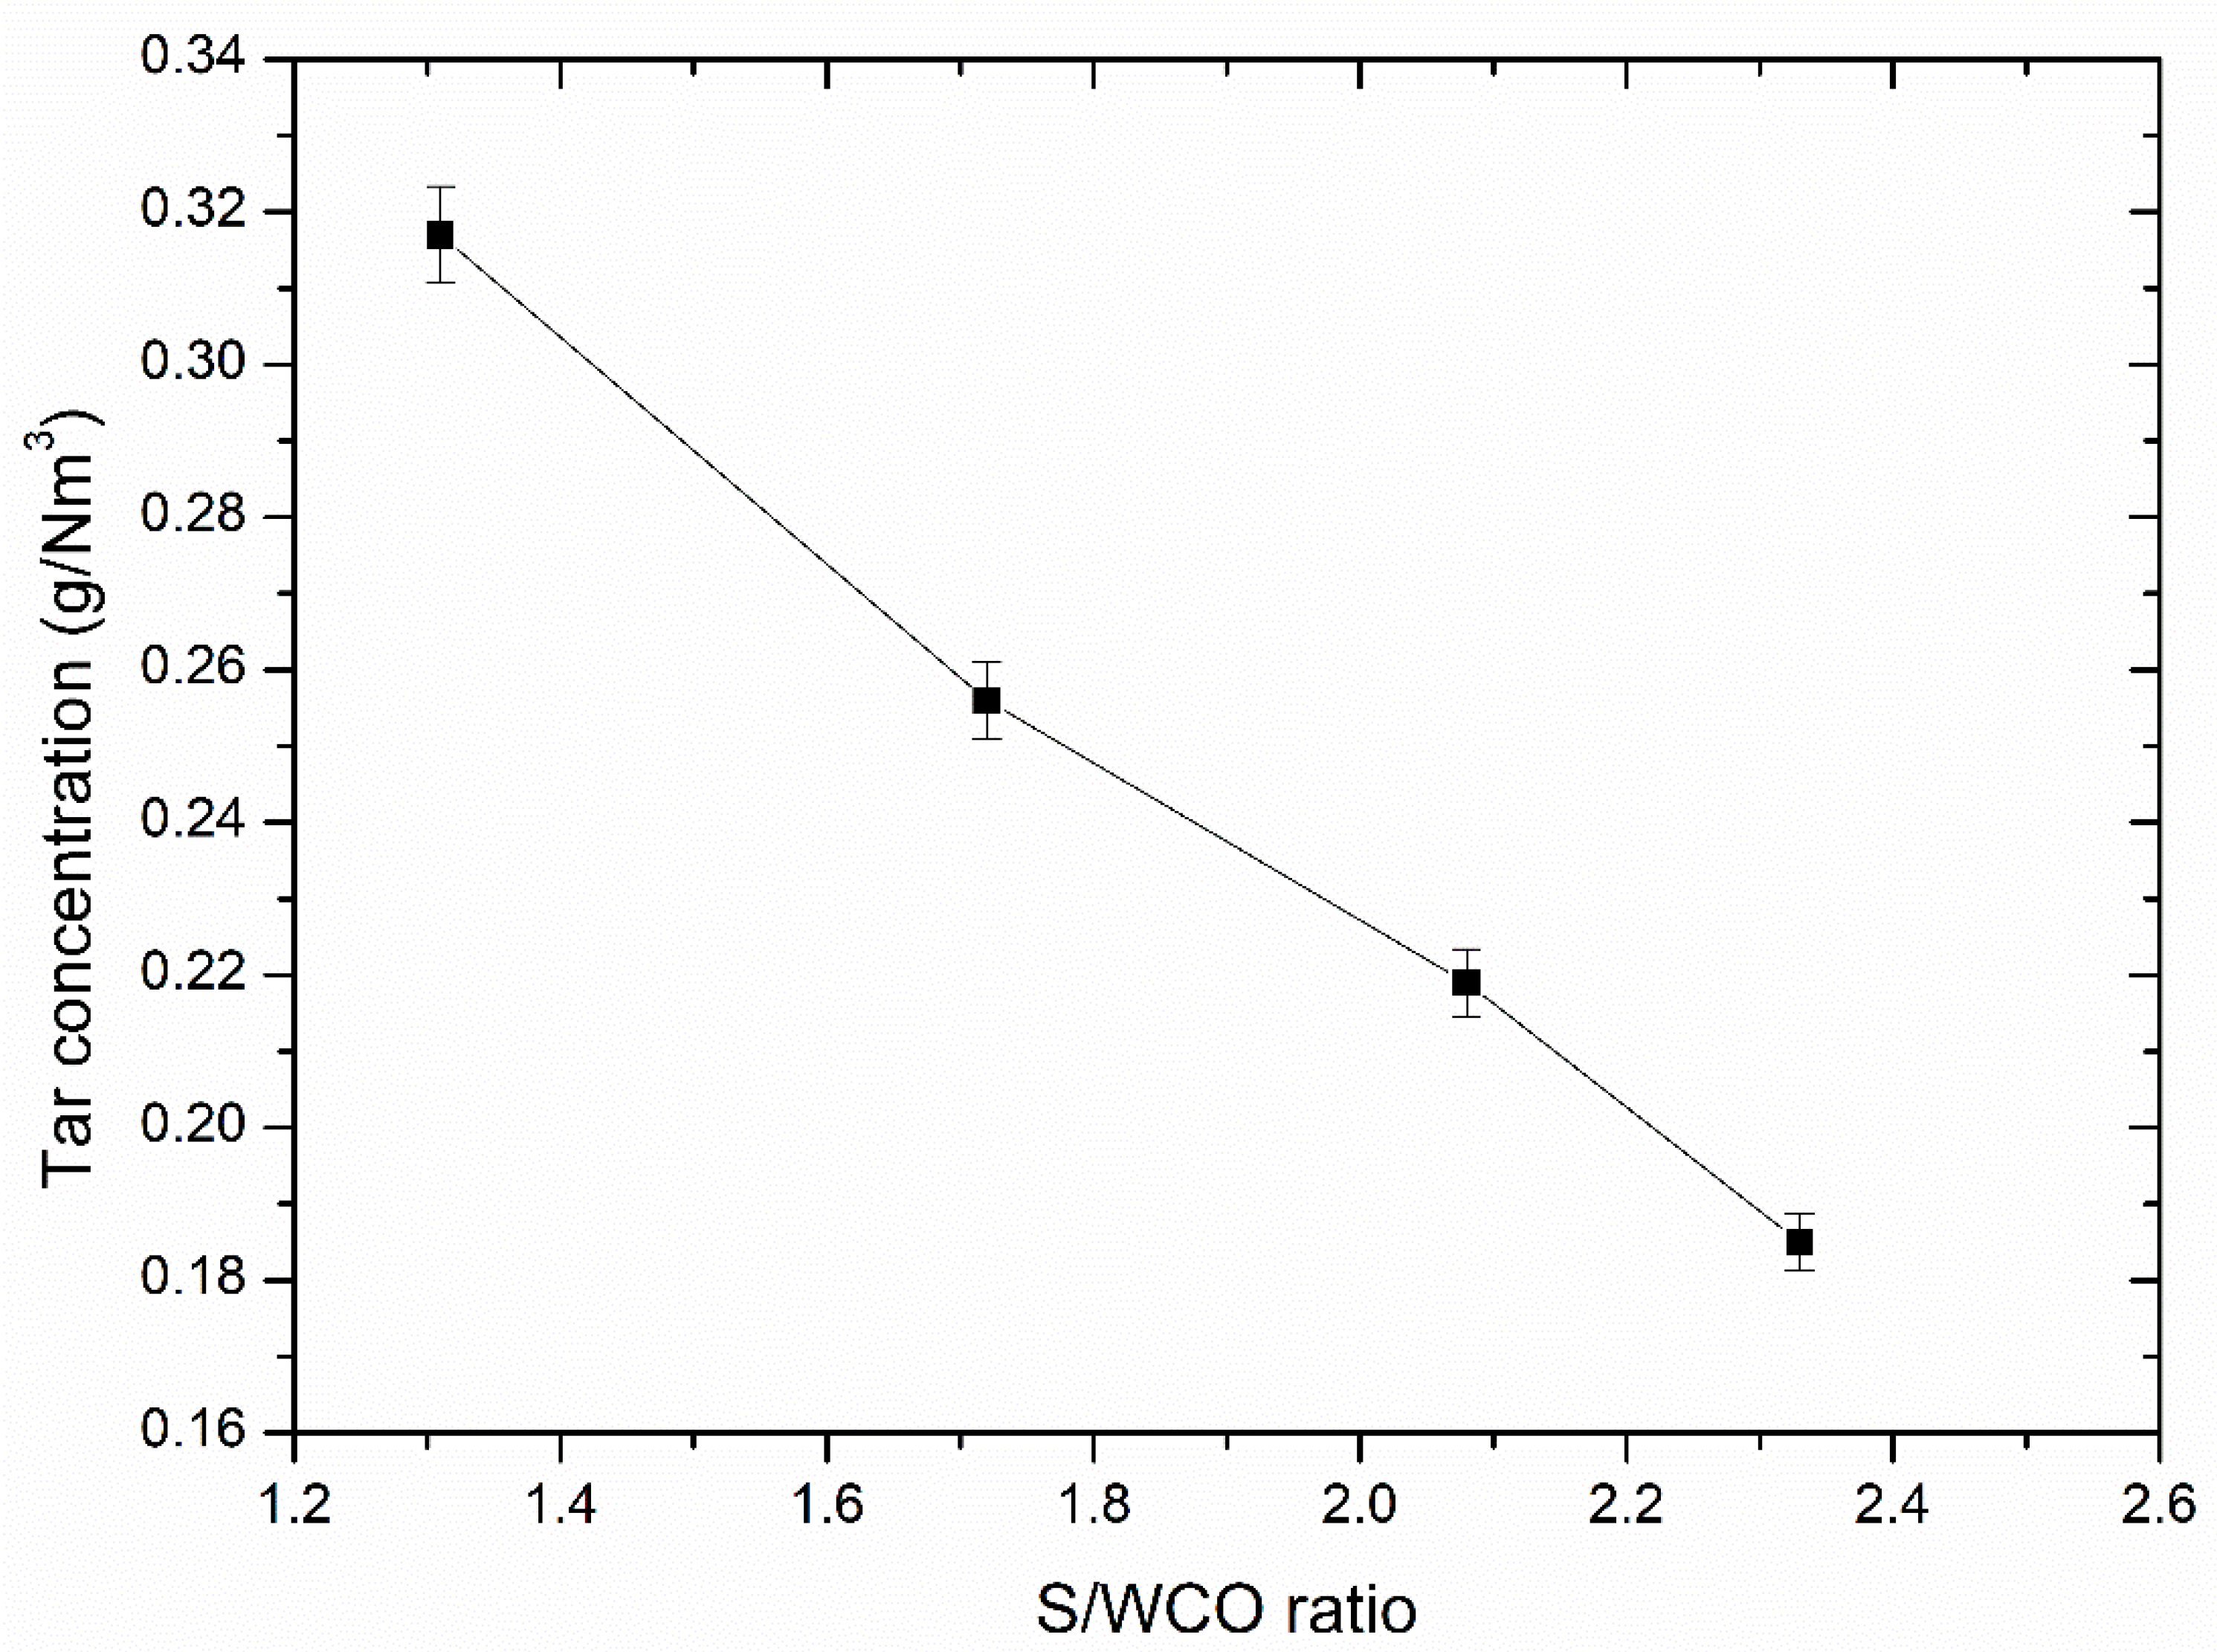
3.3. Tar Content in the Producer Gas (Syngas)

The tar content in the producer gas, as well as in syngas, is an important parameter showing how clean the produced syngas is and what kind of methods should be chosen in case of a syngas upgrade to biodiesel, methane, hydrogen or direct burning. The effect of the S/WCO ratio on the tar concentration in the producer gas (syngas) is shown in Figure 6 and the main compounds present in the tar are shown in Table 3.
A qualitative and quantitative analysis of the main tar compounds obtained in the syngas shows that naphthalene was present as the main polycyclic aromatic compound with the highest concentration exceeding around 70% of the total concentration. The remaining identified compounds, such as fluorine, fluoranthene, pyrene, benzo[ghi]perylene, antracene and phenanthrene all comprised up to 30% of the total concentration defined in the tar. The highest concentration of tar in the producer gas was obtained at the S/WCO ratio of 1.31 and was 0.317 g/Nm3, whereas the lowest content of 0.185 g/Nm3 was found at the S/WCO ratio of 2.33. Normally, if syngas is used in an internal combustion engine (ICE) for power generation, the tar content should be lower than 0.1 g/Nm3 [31]. Therefore, the produced syngas quality in this experimental research would require additional tar removal or process optimization if the syngas was planned to be used for power generation in the ICE. Kim et al. [18] used the activated carbon filter installed just after the electrostatic precipitator in the treatment of the WCO to syngas in a fluidised-bed reactor. It was reported that the filter did not affect the concentration of the syngas, but the tar content decreased significantly from 0.308 g/Nm3 to 0.069 g/Nm3. Besides the tar content, the concentration of solid particles in the producer gas is also an important parameter. The limit value of the particulates must be lower than 50 mg/Nm3 for the ICE to be powered by syngas for electricity production. However, this parameter was not determined in this study. Various gas cleaning systems might be used for tar and particle removal, as reported in [32]. Generally, the use of the plasma method may also help to reduce the tar and particulate content in the product gases without a need for filtering, catalyzing or other cleaning methods [33].

4. Conclusions

In this experimental study, waste cooking oil was gasified to syngas using the DC thermal arc-plasma method. Water vapor was simultaneously used as a gasifying agent, a heat carrier and a reactant. The gasification system was quantified in terms of several basic parameters, such as the concentration of the producer gas, the H2/CO ratio, the LHV, the CCE, the ECE, and the SER. Additionally, the tar content in the product gas was also determined. The findings show that the best process efficiency was achieved at the S/WCO ratio of 2.33, 57.6 kW plasma torch power and the mean plasma stream temperature of 2800 K. In these conditions, the content of syngas in the producer gas was around 70% (H2—47.9% and CO—22.42%) with some amounts of carbon dioxide (7.74%), methane (7.83%), acetylene (2.27%), ethane (0.42%), and propane (0.37%). The H2/CO ratio was 2.14, indicating that the produced syngas can be used for biofuels production via FT synthesis. The lower heating value of 12.7 MJ/Nm3 shows that the syngas was of a high calorific value. The highest CCE was around 41.3%, indicating that the WCO was not fully converted to gaseous products. The ECE and the SER were calculated to be 85.42% and 196.2 kJ/mol (or 1.18 kWh/kg), respectively. The tar content in the producer gas exceeded 0.18 g/Nm3.
As a general conclusion, it can be stated that the thermal arc-plasma method used in this study can be effectively applied for waste cooking oil conversion to high quality syngas with a rather moderate content of tars.

Author Contributions

Conceptualization, A.T.; methodology, D.G., M.P., J.E.; resources, M.A., R.U.; formal analysis, A.T., R.U., M.A.; writing—original draft preparation, A.T.; supervision, A.T.

Funding

This research received no external funding.

Conflicts of Interest

The authors declare no conflict of interest.

References

  1. Ro, D.; Shafaghat, H.; Jang, S.H.; Lee, H.W.; Jung, S.C.; Jae, J.; Cha, J.S.; Park, Y.K. Production of an upgraded lignin-derived bio-oil using the clay catalysts of bentonite and olivine and the spent FCC in a bench-scale fixed bed pyrolyzer. Environ. Res. 2019, 172, 658–664. [Google Scholar] [CrossRef] [PubMed]
  2. Kim, J.Y.; Lee, H.W.; Lee, S.M.; Jae, J.; Park, Y.K. Overview of the recent advances in lignocellulose liquefaction for producing biofuels, bio-based materials and chemicals. Bioresour. Technol. 2019, 279, 373–384. [Google Scholar] [CrossRef] [PubMed]
  3. Nanda, S.; Azargohar, R.; Dalai, A.K.; Kozinski, J.A. An assessment on the sustainability of lignocellulosic biomass for biorefining. Renew. Sustain. Energy Rev. 2015, 50, 925–941. [Google Scholar] [CrossRef]
  4. Tamošiūnas, A.; Valatkevičius, P.; Gimžauskaitė, D.; Valinčius, V.; Jeguirim, M. Glycerol steam reforming for hydrogen and synthesis gas production. Int. J. Hydrog. Energy 2017, 42, 12896–12904. [Google Scholar] [CrossRef]
  5. Mathimani, T.; Pugazhendhi, A. Utilization of algae for biofuel, bio-products and bio-remediation. Biocatal. Agric. Biotechnol. 2019, 17, 326–330. [Google Scholar] [CrossRef]
  6. Nanda, S.; Rana, R.; Hunter, H.N.; Fang, Z.; Dalai, A.K.; Kozinski, J.A. Hydrothermal catalytic processing of waste cooking oil for hydrogen-rich syngas production. Chem. Eng. Sci. 2019, 195, 935–945. [Google Scholar] [CrossRef]
  7. Statista. Available online: https://www.statista.com/statistics/263933/production-of-vegetable-oils-worldwide-since-2000/ (accessed on 15 May 2019).
  8. Statista. Available online: https://www.statista.com/statistics/263937/vegetable-oils-global-consumption/ (accessed on 15 May 2019).
  9. Yaakob, Z.; Mohammad, M.; Alherbawi, M.; Alam, Z.; Sopian, K. Overview of the production of biodiesel from Waste cooking oil. Renew. Sustain. Energy Rev. 2013, 18, 184–193. [Google Scholar] [CrossRef]
  10. Sonthalia, A.; Kumar, N. Hydroprocessed vegetable oil as a fuel for transportation sector: A review. J. Energy Inst. 2019, 92, 1–17. [Google Scholar] [CrossRef]
  11. Meher, L.C.; Vidya Sagar, D.; Naik, S.N. Technical aspects of biodiesel production by transesterification—A review. Renew. Sustain. Energy Rev. 2006, 10, 248–268. [Google Scholar] [CrossRef]
  12. Fangrui, M.; Milford, H. Biodiesel production: A review. Bioresour. Technol. 1999, 70, 1–15. [Google Scholar]
  13. Poudel, J.; Karki, S.; Sanjel, N.; Shah, M.; Oh, S.C. Comparison of biodiesel obtained from virgin cooking oil and waste cooking oil using supercritical and catalytic transesterification. Energies 2017, 10, 546. [Google Scholar] [CrossRef]
  14. Costarrosa, L.; Leiva-Candia, D.E.; Cubero-Atienza, A.J.; Ruiz, J.J.; Dorado, M.P. Optimization of the transesterification of waste cooking oil with mg-al hydrotalcite using response surface methodology. Energies 2018, 11, 302. [Google Scholar] [CrossRef]
  15. Leung, D.Y.C.; Guo, Y. Transesterification of neat and used frying oil: Optimization for biodiesel production. Fuel Process. Technol. 2006, 87, 883–890. [Google Scholar] [CrossRef]
  16. Wang, E.; Ma, X.; Tang, S.; Yan, R.; Wang, Y.; Riley, W.W.; Reaney, M.J.T. Synthesis and oxidative stability of trimethylolpropane fatty acid triester as a biolubricant base oil from waste cooking oil. Biomass Bioenergy 2014, 66, 371–378. [Google Scholar] [CrossRef]
  17. Chowdhury, A.; Chakraborty, R.; Mitra, D.; Biswas, D. Optimization of the production parameters of octyl ester biolubricant using Taguchi’s design method and physico-chemical characterization of the product. Ind. Crops Prod. 2014, 52, 783–789. [Google Scholar] [CrossRef]
  18. Kim, Y.D.; Jung, S.H.; Jeong, J.Y.; Yang, W.; Lee, U. Do Production of producer gas from waste cooking oil in a fluidized bed reactor: Influence of low-temperature oxidation of fuel. Fuel 2015, 146, 125–131. [Google Scholar] [CrossRef]
  19. Wu, A.; Li, X.; Yan, J.; Zhu, F.; Lu, S. Conversion of the waste rapeseed oil by aerosol gliding arc discharge-assisted pyrolysis. Int. J. Hydrog. Energy 2016, 41, 2222–2229. [Google Scholar] [CrossRef]
  20. Meier, H.F.; Wiggers, V.R.; Zonta, G.R.; Scharf, D.R.; Simionatto, E.L.; Ender, L. A kinetic model for thermal cracking of waste cooking oil based on chemical lumps. Fuel 2015, 144, 50–59. [Google Scholar] [CrossRef]
  21. Yenumala, S.R.; Maity, S.K. Reforming of vegetable oil for production of hydrogen: A thermodynamic analysis. Int. J. Hydrog. Energy 2011, 36, 11666–11675. [Google Scholar] [CrossRef]
  22. Praspaliauskas, M.; Pedišius, N.; Striuigas, N. Elemental Migration and Transformation from Sewage Sludge to Residual Products during the Pyrolysis Process. Energy Fuels 2018, 32, 5199–5208. [Google Scholar] [CrossRef]
  23. Makarevičiene, V.; Lebedevas, S.; Rapalis, P.; Gumbyte, M.; Skorupskaite, V.; Žaglinskis, J. Performance and emission characteristics of diesel fuel containing microalgae oil methyl esters. Fuel 2014, 120, 233–239. [Google Scholar] [CrossRef]
  24. Tamošiūnas, A.; Gimžauskaitė, D.; Uscila, R.; Aikas, M. Thermal arc plasma gasification of waste glycerol to syngas. Appl. Energy 2019, 251, 113306. [Google Scholar] [CrossRef]
  25. Tamošiūnas, A.; Valatkevičius, P.; Grigaitienė, V.; Valinčius, V. Operational parameters of thermal water vapor plasma torch and diagnostics of generated plasma jet. Rom. Rep. Phys. 2014, 66, 1125–1136. [Google Scholar]
  26. Tamošiunas, A.; Valatkevičius, P.; Grigaitiene, V.; Valinčius, V.; Striugas, N. A cleaner production of synthesis gas from glycerol using thermal water steam plasma. J. Clean. Prod. 2016, 130, 187–194. [Google Scholar] [CrossRef]
  27. Tamošiūnas, A.; Valatkevičius, P.; Gimžauskaitė, D.; Jeguirim, M.; Mėčius, V.; Aikas, M. Energy recovery from waste glycerol by utilizing thermal water vapor plasma. Environ. Sci. Pollut. Res. 2017, 24, 10030–10040. [Google Scholar] [CrossRef] [PubMed]
  28. Striugas, N.; Zakarauskas, K.; Stravinskas, G.; Grigaitiene, V. Comparison of steam reforming and partial oxidation of biomass pyrolysis tars over activated carbon derived from waste tire. Catal. Today 2012, 196, 67–74. [Google Scholar] [CrossRef]
  29. Shukla, B.; Koshi, M. Comparative study on the growth mechanisms of PAHs. Combust. Flame 2011, 158, 369–375. [Google Scholar] [CrossRef]
  30. Tamošiūnas, A.; Valatkevičius, P.; Valinčius, V.; Grigaitienė, V. Production of synthesis gas from propane using thermal water vapor plasma. Int. J. Hydrog. Energy 2014, 39, 2078–2086. [Google Scholar]
  31. Hasler, P.; Nussbaumer, T. Gas cleaning for IC engine applications from fixed bed biomass gasification. Biomass Bioenergy 1999, 16, 385–395. [Google Scholar] [CrossRef]
  32. Han, J.; Kim, H. The reduction and control technology of tar during biomass gasification/pyrolysis: An overview. Renew. Sustain. Energy Rev. 2008, 12, 397–416. [Google Scholar] [CrossRef]
  33. Striūgas, N.; Valinčius, V.; Pedišius, N.; Poškas, R.; Zakarauskas, K. Investigation of sewage sludge treatment using air plasma assisted gasification. Waste Manag. 2017, 64, 149–160. [Google Scholar] [CrossRef] [PubMed]
Figure 1. Experimental gasification setup of waste cooking oil.
Energies 12 02612 g001
Figure 2. Effect of the S/WCO ratio on the producer gas composition.
Energies 12 02612 g002
Figure 3. Effect of the S/WCO ratio on the producer syngas quality and the H2/CO ratio.
Energies 12 02612 g003
Figure 4. Effect of the S/WCO ratio on the carbon conversion efficiency (CCE).
Energies 12 02612 g004
Figure 5. Effect of the S/WCO ratio on the energy conversion efficiency (ECE) and the specific energy requirements (SER).
Energies 12 02612 g005
Figure 6. Effect of the S/WCO ratio on the tar content in the producer gas (syngas).
Energies 12 02612 g006
Table 1. Ultimate and proximate analysis of the waste cooking oil (WCO).
ParameterWCOStandard
Ultimate analysis, wt.%
C71.84 ± 2.99LST EN ISO 16948:2015
LST EN ISO 16994:2016
H10.14 ± 2.11
N0.06 ± 0.003
S<0.01 (0.008)
O *17.71
Cl0.003
Proximate analysis, wt.%
VOCs99.15 ± 1.0
Fixed carbon0.56 ± 0.003
Ash0.24 ± 0.004
Water content0.08
Lower heating value, MJ/kg39.24 ± 0.03
* by difference.
Table 2. Fatty acid composition of the WCO.
Fatty AcidsStructure aFormulaComposition (wt.%)Detection Method
MyristoleicC14:1C14H26O20.26 ± 0.008LST EN ISO5508
PentadecanoicC15:0C15H30O20.04 ± 0.004
PalmiticC16:0C16H32O26.85 ± 0.041
PalmitoleicC16:1C16H30O20.23 ± 0.016
StearicC18:0C18H36O22.36 ± 0.037
OleicC18:1C18H34O254.44 ± 0.775
LinoleicC18:2C18H32O227.08 ± 0.114
LinolenicC18:3C18H30O25.96 ± 0.049
ArahidicC20:0C20H40O20.86 ± 0.0082
EikosenicC20:1C20H38O21.00 ± 0.008
LignocericC24:0C24H48O20.27 ± 0.041
Insoluble impurities in the WCO b--6.31 ± 0.12LST EN ISO 663
a xx:y indicates xx carbons in the fatty acid chain with y number of double bonds. b Insoluble impurities detected in the WCO, including oxidized fatty acids.
Table 3. Composition of tars detected in the syngas at the ratio of S/WCO 1.31 and 2.33.
Identified CompoundConcentration in Syngas (g/Nm3)
S/WCO—1.31S/WCO—2.33
Naphthalene0.2220.13
Fluorene0.0220.012
Fluoranthene0.0220.013
Pyrene0.0200.012
Benzo[ghi]perylene0.0190.0011
Antracene0.0080.005
Phenanthrene0.0030.002
Total:0.3170.185

