1. Introduction
Typically, engineering, oil refinery, and chemical industries archive design drawings in the form of computer-aided design (CAD) drawings such as AutoCAD and image formats such as portable document format (PDF) or hard copy [
1]. Recently, artificial intelligence (AI) technology and big data science are emerging rapidly as a result of the Fourth Industrial Revolution. Digitization of data in PDF or hard-copy format is indispensable for the application of technology to the shipbuilding and plant engineering industries worldwide [
2].
In the digitization process of conventional design drawings, contractors first receive the imaged piping and instrumentation diagram (P&ID) drawings in formats such as portable network graphic (PNG), joint photographic experts group (JPG), and PDF as designed by clients. Design engineers then create the electronic imaged P&ID drawing based on the client-designed P&ID drawings. P&ID refers to a process flow diagram in which equipment, piping, and instruments of a certain process are described at a glance in a diagram form. Intergraph’s Smart Plant P&ID (SP P&ID), Aveva’s P&ID, and AutoCAD’s Plant P&ID are the most popular design programs for creating P&ID.
The P&ID drawing created by the contractor describes the materials and their quantities. The engineer computes the bill of materials (BOM) by manually counting the quantity data through the material take-off software tools and calculates the estimate through the BOM.
However, the conventional digitization process of design drawings has been used thus far only to check errors by visually comparing the digitized design drawings with the imaged drawings. Although P&ID is the most important information to obtain, there is a significant problem in using the data needed to automate the design [
2]. In other words, the imaged P&ID drawings must be manually compared with the new digitized drawings, which results in difficulty in obtaining mutual consistency assurance, such as checking whether the components listed on the imaged P&ID drawing match with those in the new digitized drawings. In addition, because all the materials, including valves and other similar components, must be recorded in the digitized drawings, creating new electronic drawings by manual input is a time-consuming process. It is very difficult to modify the calculated materials and to manage their updates when the layout of the piping and other components is changed thereafter.
Because of these difficulties, engineering procurement construction contractors are unable to thoroughly check the calculation results in most cases. The low accuracy and reliability of the material calculations cause serious problems, such as a delay in construction due to an error in the calculation of the material quantities.
Thus, there is an increasing and highly pervasive demand for technology that can support the digitization of the existing drawing data in traditional formats. However, the development of automatic drawing recognition technology is slow because it is difficult to generate profit using this technology in a short period of time.
2. Literature Review
As described in the previous section, project owners and contractors have made a significant investment in generating and archiving digitalized drawings in the design process for engineering industries, especially for engineering–procurement–construction (EPC) projects such as oil and gas and petrochemical fields.
Since the 1980s, when the use of personal computers became widespread in the engineering design process, researchers have investigated many approaches to convert drawings to computer-aided digitalized documents. Brown et al. [
3] and Joseph [
4] studied logical symbol and numerical character recognition systems that used optical character recognition (OCR) techniques and automated guided searching methods to convert line drawings to the CAD system format.
The approaches developed in 1990s and 2000s were more effective and robust than previous methods, and vectorization approaches using pixels were introduced with enhancement in the performance of personal computers. Lu [
5] developed an algorithm to separate text from graphics by erasing nontext regions from mixed text and graphics in an engineering drawing. Lu’s algorithm extracted Chinese and English characters, dimensions, and symbols, but its use was limited depending on the quality of the drawing and noise level. John et al. [
6] developed a region-based vectorization approach for recognizing the ensemble of pixels within line segments. Han et al. [
7] proposed an approach for the skeletonization of engineering drawings that applied a contour vectorization process to obtain the skeleton of the engineering drawing and then stored that skeleton in the form of vector. Nagasamy et al. [
8] developed the vectorization system to process engineering drawings by vectorizing scanned images of engineering drawings and transferring information to CAD/computer-aided manufacturing (CAM) applications. Their algorithm recognized the raster form of line, circles, arcs, and conic segments and converted them to vector components. Kacem et al. [
9] used a fuzzy logic algorithm to develop model learning mathematical symbols to automatically extract printed mathematical formulas.
Yu et al. [
10] developed a method to separate symbols from connection lines by recognizing generic properties of symbols and connection lines. Most connection lines consist of vertical and horizontal lines, and the connection lines end in symbols, while symbols consist of closed shapes and slant lines. Yu et al. [
11] presented an automatic recognition system that recognized a large class of engineering drawings by alternating symbols and lines. To improve accuracy, they addressed the gaps in connection lines and the gaps at the ends of connection lines. They also developed a user interface to correct residual errors and tested their system with 64 scanned images at a resolution of 150 and 300 dots per inch (dpi). Adam et al. [
12] developed the technology to recognize multi-oriented and multi-scaled patterns and applied it to the technical documents of the French Telephonic Operator, based on the Fourier–Mellin transform. They also discussed the general CAD conversion problems but did not address a global interpretation strategy.
Many researchers developed automatic analysis and integration methods in construction structural drawings and architectural working drawings by using various approaches and techniques. Ah-Soon [
13] presented a network model to recognize symbols in scanned architectural drawings. Ah-Soon’s model was based on Messmer’s [
14,
15] algorithm for exact and inexact graph matching and presented a compact representation of the symbols such as doors and windows. Lu et al. [
16] proposed a method to recognize structural objects and automatically reconstruct three-dimensional (3D) drawings by analyzing the drawings of different floors. Wenyin et al. [
17] developed an interactive example-driven approach to graphic recognition in engineering drawings, and Guo et al. [
18] improved the example-driven symbol recognition approach for CAD engineering drawings by prioritizing elements and regarding the highly prioritized elements as the root nodes for the tree structures. In their unique approach, Wei et al. [
19] presented a method to detect text in scene images based on exhaustive segmentation. They built a parallel structure to generate a character candidate region in the exhaustive segmentation.
Since 2010, many researchers have begun to use smart computer algorithms, such as neural networks [
20], machine-learning algorithms [
21], pattern recognition, and AI technologies, to recognize text, lines, and symbols from scanned images or PDFs and to automatically generate digitalized drawings. Nazemi et al. [
22] developed a mathematical information retrieval approach to extract information from scanned documents by separating the process for line segmentation from block segmentation. They implemented a support vector machine (SVM) algorithm to calculate the optimal category of new examples by using labeled training data [
22]. Using dynamic programming approaches, Saabni et al. [
23] developed two multilingual global algorithms to extract lines and texts in binary and gray-scale images. Xu et al. [
24] proposed a method to extract line segments from the voting analysis in image space and the voting distribution in Hough space. The closed-form solution determines the direction, length, and width of a line segment. Hough space analysis is a technique that uses a voting process to extract a feature in computer vision. Pham et al. [
25] presented an approach to detect junctions in line-drawing documents. They addressed the problem of junction distortion and characterized the junctions by an optimization algorithm that identifies connected component distorted zones. He et al. [
26] also developed a simple and efficient method to detect the junction in handwritten documents. Liu et al. [
27] proposed an approach to recognize and convert symbols in geographical information system vector maps. Chen et al. [
28] proposed a model-based preprinted ruling line detection algorithm and a framework of a multiline linear regression to estimate model parameters.
Fu et al. [
29] implemented a convolutional neural network (CNN) algorithm for training engineering symbol recognizers. They applied the trained CNN to the entire diagram by using a multiscale sliding window through the connected component analysis. Elyan et al. [
21] presented a semiautomatic and heuristic-based approach to detect symbols in oil and gas, construction, mechanical, and other engineering drawings. They used machine-learning algorithms to classify the symbols based on a labeled data set generated from real engineering drawings. They compared three machine-learning algorithms: random forests (RF), SVM, and CNN. According to their study results, CNN resulted in better performance than RF and SVM on the original data set prior to preprocessing.
In the past two decades, many researchers have also developed approaches to extract texts, formulae, music/engineering symbols, topologies, and lines from handwritten/hand-drawn images. For example, Miyao and Maruyama developed an online handwritten music symbol recognition system [
30]. Khusro et al. studied some technical methods for the detection of tables, detection and extraction of annotations in PDF documents [
31]. Similarly, Mandal et al. suggested a simple detection system for tables from document images [
32]. Yim et al. designed and implemented a prototype software that can be isolated and diagnosed plant control loop system automatically based on plant topology [
33]. Chowdgury et al. proposed a technique for segmenting of all sorts of graphics and texts in any orientation from document images, which made an essential contribution for better OCR performance and vectorization in computer vision applications [
34]. Cordella et al. [
35], Ablameyko et al. [
36], Foggia et al. [
37], and Ye et al. [
38] presented review summaries of the image recognition methods and algorithms developed for engineering drawings in 2000, 2007, 2014, and 2015, respectively. Ablameyko et al. [
36] categorized the graph-based techniques by their main contributions and their results.
Although significant efforts have improved the performance of the electronic conversion of the imaged drawings to digitalized drawings, the existing methods do not yet completely convert the imaged drawing to the digitalized drawing. The existing methods still do not recognize some important components and include irrelevant information, which thus requires secondary manual steps to modify the digitalized drawings [
1,
2]. Specifically, Moreno-Garcia et al. [
39] stated that although image-processing technology has recently undergone significant advancement by using the neural network algorithm and deep learning technology, the current methods and tools are still not fully automated to allow thorough completion with a perfect recognition rate.
Recently, some application studies in the biomechanical industry to take advantage of engineering digitalization in combination with CAD/CAM technology were performed by few researchers and practitioners. For example, an improved example-driven symbol recognition algorithm was proposed for CAD/CAM engineering drawings by De Santis et al. to cure different dental restorative composites [
40]. Similarly, 3D scan digitalization combined to surface texturing in the field of biomechanics were used for measuring the 3D position and area of the femoral and tibial surfaces involved in the joint [
41]. De Santis et al. [
41] analyzed natural condyles by applying a reverse engineering approach for the interpretation of the results from compression tests and local force measurements in conjunction with staining techniques.
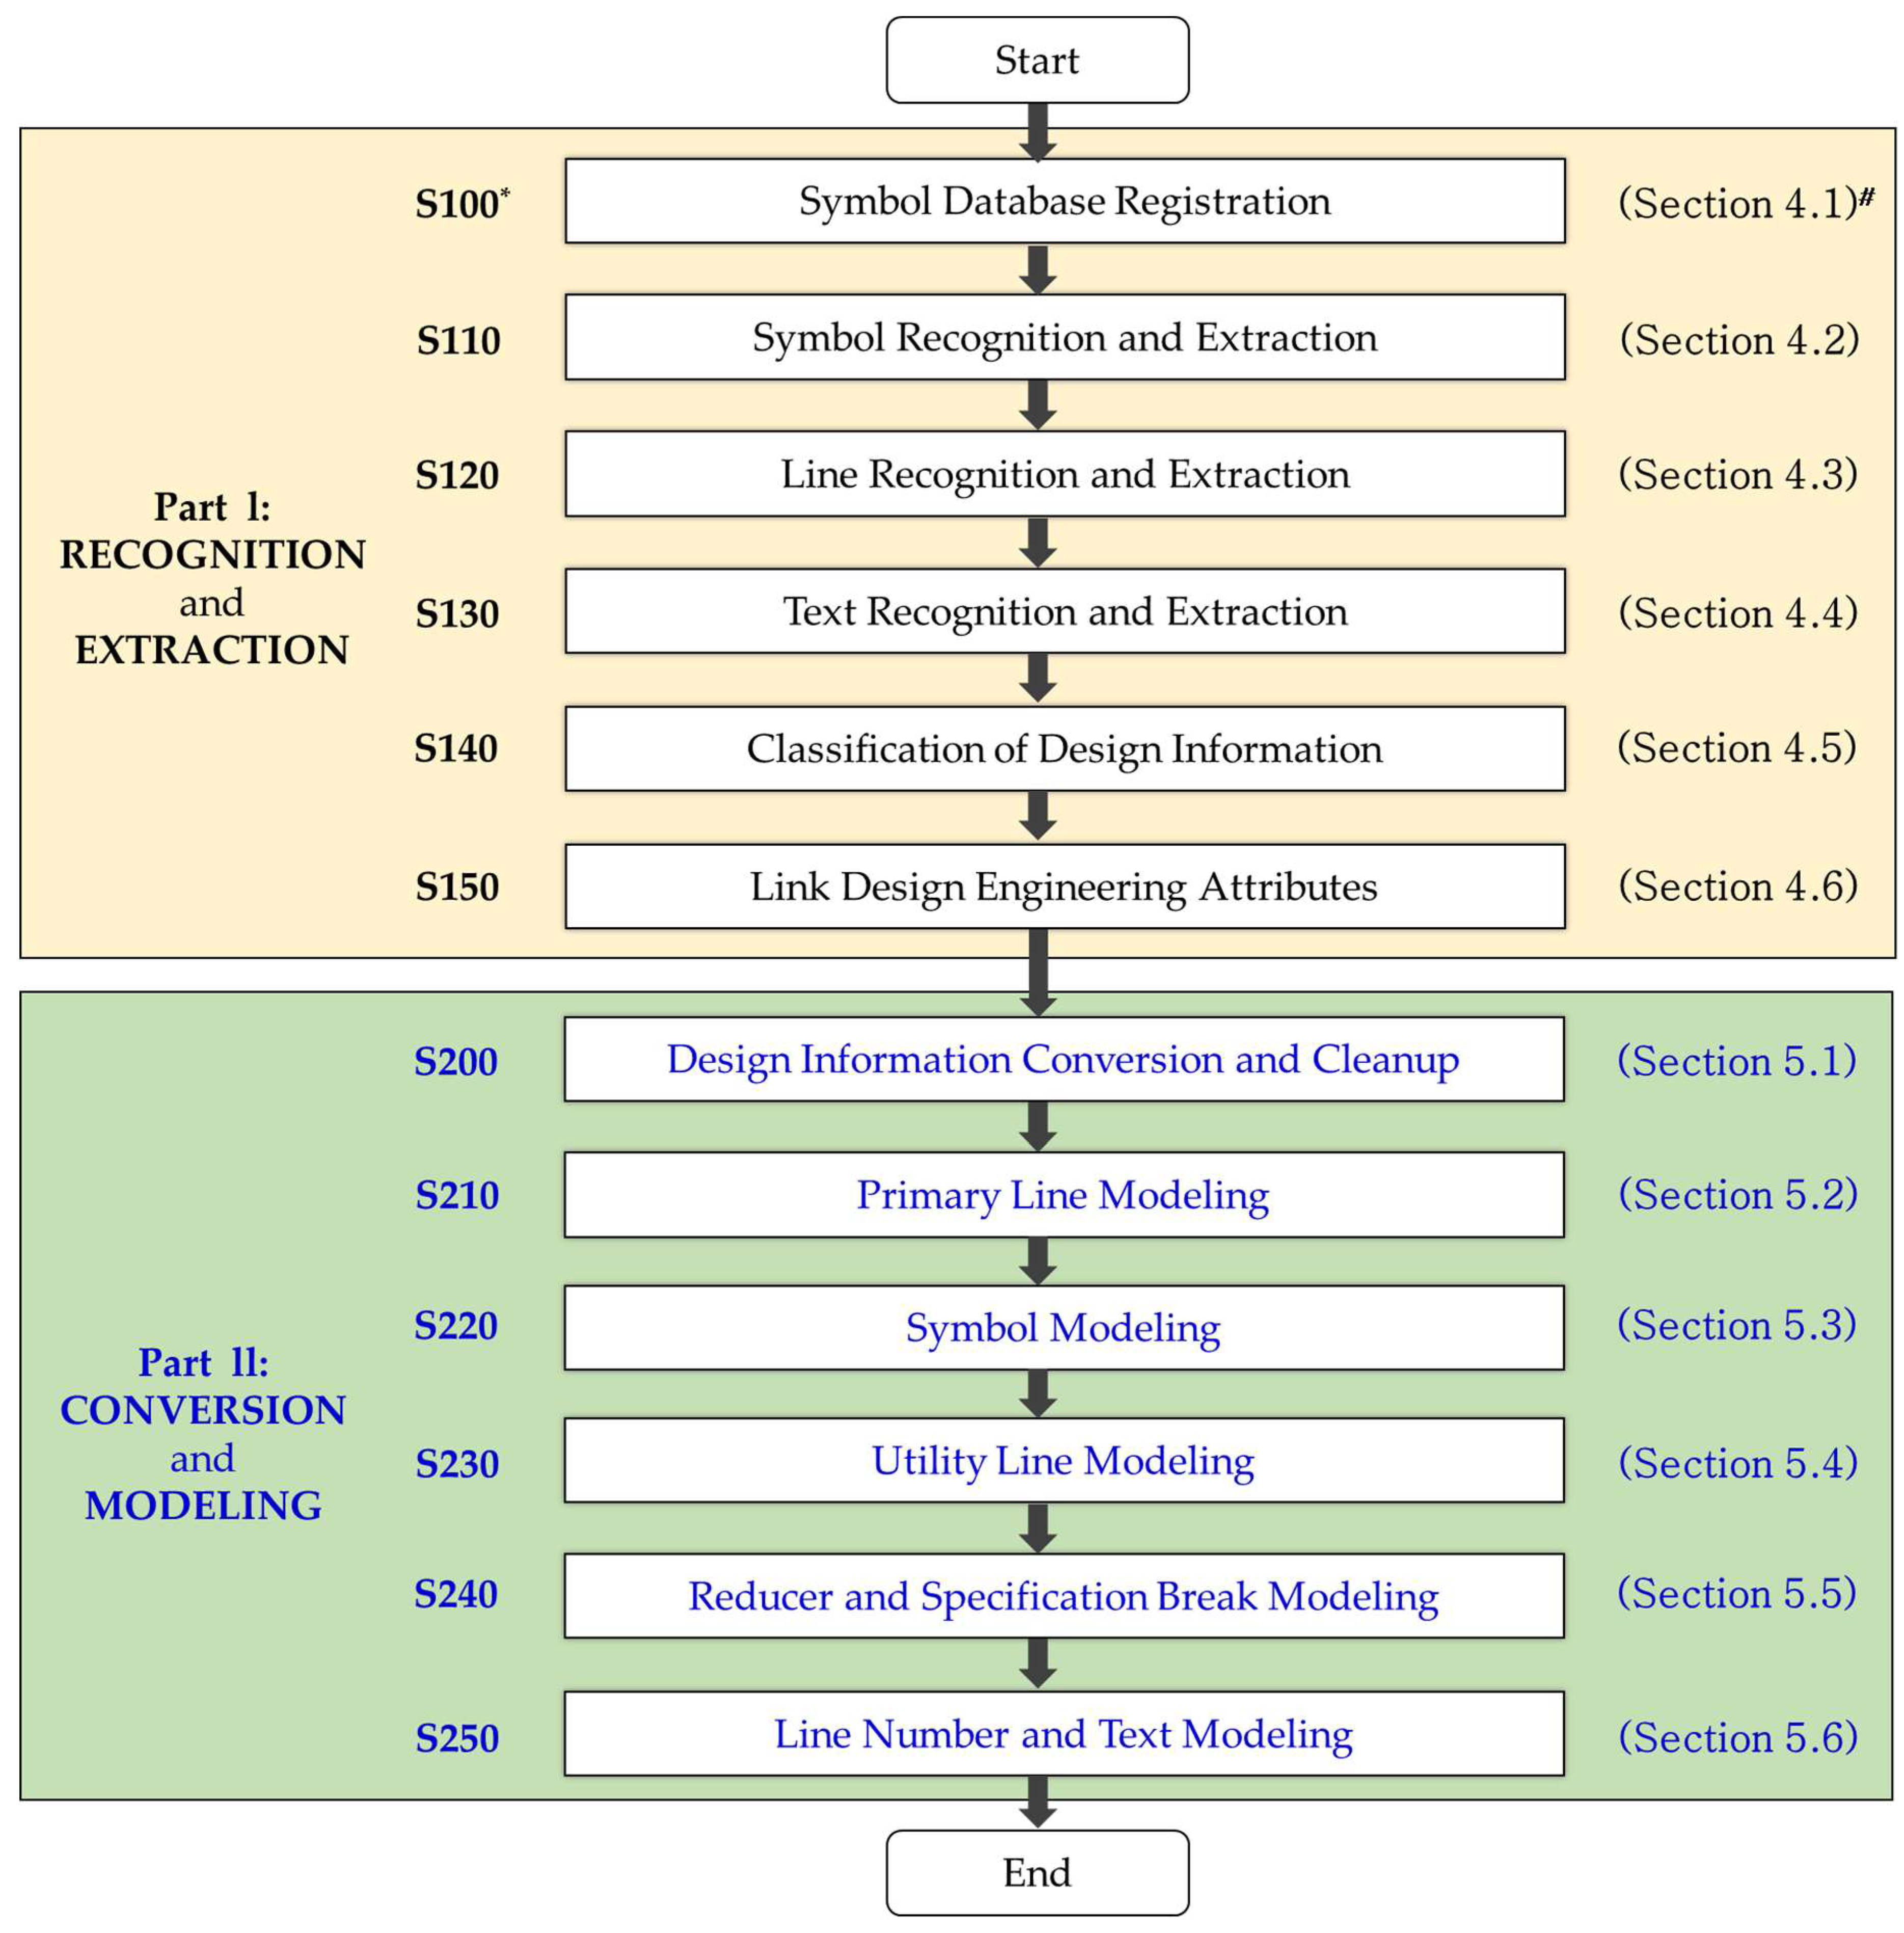
4. Part I: Recognition and Extraction Process by Element Category
The recognition and conversion of equipment symbols on image P&IDs used an image conversion technique, so-called template matching in this intelligent P&ID tool (ID2). Template matching is commonly defined in digital image processing by search engines on the web as [
42]: “
Template matching is a technique in digital image processing for finding small parts of an image which match a template image […] Feature-based approach relies on the extraction of image features such, i.e., shapes, textures, colors, to match in the target image or frame. This approach is currently achieved by using Neural Networks and Deep Learning classifiers.”.
Figure 2 shows an example of an imaged P&ID drawing that includes all symbols, lines, and text. Symbols are diagrams of materials, except for the lines and text in the drawing area. Symbols include equipment, instrument, fitting, and operation page connection (OPC).
Figure 2 shows the symbols consisting of a valve (100), an instrument (110), an equipment (120), a nozzle (130) attached to the equipment, and an OPC (140). An OPC is a symbol that displays other drawings connected to the drawing.
In addition to the direction indication of the process, the number of the connected P&ID drawing inside the OPC is described. Lines are the straight-line segments connecting the symbols and consist of process line and utility line types. The process line is the piping line that accommodates the main work of the plant. The utility line assists the operation of process lines such as an electric signal and control line. Texts describe symbols and lines and include text (150) for describing the equipment and a line number (160) for describing the line (
Figure 2).
As described above, design engineers have conventionally generated new P&ID drawings based on the existing P&ID files, which were in the form of image files, usually a PDF. Consequently, there was inconsistency in the data between design products, and unnecessary time was required for early setup of FEED. This posed a serious problem, especially for overseas projects.
To solve these problems, this paper provides the following automatic classification method. Design factors can be aggregated and used to estimate tasks in a short amount of time with high accuracy during the initial FEED process. The proposed method also eliminates simple repetitive tasks and improves work productivity and design quality.
4.1. Symbol Database Registration (Step S100)
First, a symbol to be recognized is registered in the expected symbol area. Here, the expected symbol area is automatically extracted through the contour algorithm in the entire drawing. A symbol list is created according to a predefined classification scheme in the automatically extracted symbol area, and the symbol is registered in the database based on the created symbol list.
The contour algorithm for extracting the predicted area of the symbol extracts the edge boundaries of parts with the same color or color intensity. In this paper, the expected symbol area is extracted by distinguishing the blank spaces of the drawing and the symbol area. This automated process reduces the significant time required to manually extract and register the symbols in the drawing.
Figure 3 shows an example of setting the connection information, such as an origin and connecting point in the symbol, when registering the symbol in the database. The symbol is a valve symbol. The center red point is an origin, and the blue points are the connecting points in
Figure 3. One reason for setting the connection information in the symbol is that the starting point can be set when recognizing the line through the coordinates of the connecting points of the recognized symbol. In addition, this linkage information can be used to automatically create a P&ID design drawing in the future.
If the symbol is grouped with other symbols during the registration step, this group will be registered as one symbol. As a result, the characteristics of the symbol become clear, which leads to a higher recognition rate of the symbols in the next step. Therefore, the additional symbols in the set are registered as one symbol instead of registering a small part as one symbol.
4.2. Symbol Recognition and Extraction (Step S110)
Next, the symbols are recognized and extracted in the imaged P&ID drawing based on the database where the symbols are stored. In this step, the recognized symbols are removed from the imaged P&ID drawing. This reduces the time required to recognize the trailing symbols and reduces the rate of false positives. In addition, it is possible to prevent the symbols from misrecognized as a line in a subsequent stage.
To recognize each symbol in the drawing, the drawing is rotated at 0, 90, 180, and 270 degrees. If the symbol is recognized in four directions, the recognition rate increases, and unregistered symbols will be entered into the database. Because the recognized symbols are removed immediately, individual symbols in the drawing can be rapidly identified.
During the symbol recognition step, the recognized symbols are compared with the registered symbols. The recognized symbols can be determined It can be set to determine the symbols as a registered symbol only when the matching degree of the recognized symbol is higher than the threshold value set by a user. Through this method, a user can arbitrarily set the threshold value to adjust the recognition speed and rate.
In the symbol recognition step, the symbol registered with the additional symbol is checked first, and these symbols are then recognized and removed from the drawing. This increases the recognition rate by reducing duplicate recognition and avoids recognizing basic symbols from being recognized first and erroneously.
In addition, the symbol can be recognized and extracted by enlarging/reducing the symbol image map according to the size of the symbol and the complexity of the drawing.
The symbols for equipment are inspected first, and nozzles—generally located around the equipment sections—are detected. The nozzle symbols are small and often missed when the search area is set to be as large as the entire drawing area. However, if the equipment symbols are detected and removed first, and then the nozzles are detected and extracted around the equipment section, the recognition rate of the nozzle symbols becomes higher, and the total recognition rate of the symbols can be improved.
4.3. Line Recognition and Extraction (Step S120)
In the next step, the lines connected to the connecting points of the symbols removed from the imaged P&ID drawing are recognized and extracted using the sliding window method. Small objects such as tracing lines are removed from the imaged drawing before recognizing lines.
Figure 4 shows an example of line recognition using the sliding window method, which recognizes a line by considering a block unit instead of a pixel unit. This reduces the recognition time compared with the method using pixel units. From the recognized symbols, the line is recognized by moving the sliding window up/down/left/right at the connecting point of the symbol. If a line is not found when a sliding window is moved left/right, then a sliding window is moved up/down from the endpoint to find a line. Even if a pixel is separated on a line, it is recognized as a line because the sliding window uses a block to track a line. The length of the sliding window can be arbitrarily adjusted by a user; thus, the accuracy and speed can be adjusted.
When extracting the coordinates of a line, the coordinates of the connecting point of the symbol, where the line and the symbol are connected, may not exactly match with the coordinates of the endpoint of the line because of the line’s thickness and the symbol on the image. In this case, the lines and symbols should be fine-tuned via separating by a pixel unit to the symbol’s connecting point coordinates. This step is necessary to accurately connect the lines and the symbols when creating a new P&ID using the database. The fine adjustment is applied to connect the lines when the centers are not connected because of the horizontal/vertical line thickness.
4.4. Text Recognition and Extraction (Step S130)
Next, the aspect ratio is calculated in the imaged P&ID drawing to calculate the areas where the text exists, and the text is recognized and extracted in the corresponding area. An existing text recognition program such as OCR can be used as a method of recognizing text. Text recognition methods other than OCR can also be used in this step. In P&ID drawings in which the lines, symbols, and text are mixed, the text recognition rate is lower than that of a general document in which only text exists. Therefore, there is a need for a method of extracting a region where text exists by calculating the character aspect ratio in the drawing and recognizing only the text of the region. To calculate the area, the lines and instrument bubbles are first removed by extracting the outlines. The recognized part is removed if it is outside the preset aspect ratio set of the bounding box. If the recognized part is within the preset aspect ratio range, it remains a text area. The portion recognized as a text area is dilated to a preset threshold value. Then, if the recognized part is determined to be a text area, a contour bounding box of the entire text area is created by leaving the text area in such a manner that the entire text area is extracted. The reason for setting and extracting the text area is to use the text area as a design information unit and to classify and link the attribute information extracted from the text as the next step.
After extracting the area where the text exists, the text is recognized by OCR in the image of the extracted area. However, because the recognition rate is not 100%, even with the highest level of OCR, it is necessary to increase the recognition rate by training the texts. If the text is not recognized, the text image is saved, and the characters are mapped in each image. To map characters, one can either map the characters that are closest to the characters in the image or use a method that manually specifies the characters that correspond to each character. Then, the training data are generated by using the mapping data, and the generated training data are converted into a database and applied to the text recognition.
4.5. Classification of Design Information (Step S140)
Among the extracted texts, those detected in the drawing area are classified into their respective attributes through a predefined attribute classification scheme. The drawing area is not a description but is composed of a set of symbols and lines, because attributes to be classified may be different. Text may be detected in notes, revision data, title blocks, and description areas other than the drawing area. At this time, it is determined whether the text to be detected after setting the area of each element to be recognized is included in the area and is discriminated as a recognition element. The attributes of the text detected in the drawing area are divided into line number, size, tag number, instrument type, serial number, and P&ID name. The attribute can be arbitrarily specified by a user. The line number follows the designated style by a project owner and is combined with delimiters such as size, fluid, serial number, and insulation. The size consists of a combination of numbers, special characters (/, “), and so forth. The tag number consists of a combination of alphabetical letters, numbers, and special characters (-, /, and “). The instrument type is specified in each project.
4.6. Link Design Engineering Attributes (Step S150)
The attribute information of each symbol is predefined, and the attributes corresponding to the recognized symbol and the line type are found in the drawing and are connected to the nearest attribute. By associating attributes, a user can identify the equipment and quantities needed to generate estimates. Further, when creating a new P&ID drawing in the future, a user can model symbols and lines and extract the texts describing the symbols and lines. By predefining the attribute information, it is possible to prevent an error linking the unnecessary or wrong attribute to the symbol. The extracted symbol and line are associated with the attribute of the extracted text in the nearest distance criterion. If the extracted symbol is a piece of equipment, it is linked based on the equipment name recognized in the text. For equipment, a user can use the description in the description field for the name of the equipment. Symbol and line attributes can be divided into process/utility line, reducer, equipment, nozzle, instrument, and OPC. The attribute can be arbitrarily specified by a user. The process/utility line uses the line number among attributes classified in the text column, the reducer uses the main size × sub size, and the equipment and nozzle use the tag number. The instrument uses the type and serial number, and the OPC uses the P&ID number.
Figure 5 presents an example to explain the step of linking the extracted symbol and text. “800” is the symbol of the equipment, and “E-234-009” in the description field is the equipment name. “810” represents that the line number is associated with “P-234-03303-CD3D-2”-N” and “P-234-03305-CD3D-3”-N” closest to the recognized line. “820” is a symbol of the pressure safety valve that describes the “PSV 2907” linked to the instrument type and serial number.
Using this method, a BOM can be created based on the design information associated with the attribute information. In addition, design estimates required in the FEED process can be automatically calculated using equipment and instruments. However, it is possible to create intermediate files in extensible markup language (XML) format by creating a topology by the object and its integration. This can be used to automatically create P&IDs in the future.
Figure 6 shows the linking of the design information with the lines and symbolic links to lines using a recursive algorithm. In addition, it shows that the topology generation is achieved by the object and its integration by rearranging the connected symbols in from-to order. First, the relationship between the recognition objects is defined as follows. The process/utility line may start on a piece of equipment and end on a piece of equipment, start on a line and end on a piece of equipment, or start on a line and end on a line. In addition, the equipment has nozzles that are dependent on it, and the P&ID drawing has a connection with other P&IDs. A recursive algorithm means that an arbitrary function calls itself. In this paper, it calls another symbol or line that is connected by using connection information in which an arbitrary symbol or line is stored. Thereafter, the process repeats continuously and links the lines connected to the lines and rearranges them in the order of from-to.
To create a topology, each symbol is connected to a line and a line first. The connected symbols are then rearranged according to the flow mark of the line. If the connection is broken in the process of connecting each symbol to the lines, it is necessary to adjust the coordinates based on the center line to secure the connectivity. According to the flow mark, the from–to order is searched and arranged for lines or objects connecting from-to, starting from the line connected “from” or “to.” Before sorting from
Figure 6 to the flow mark, the symbols could be formed as a topology because they are not sequentially sorted, such as extraction of 2 and 3 as the same symbols consecutively in the recognition process. However, they were arranged in order from left to right as they were aligned in the flow mark direction.
If the topology is not created in the order of from-to, a user should randomly model the symbol using only the coordinate points when creating a new P&ID based on the database. As a result, a different P&ID drawing can be created from the imaged P&ID drawing. Therefore, when creating a new P&ID drawing, it is necessary to create a topology to automatically generate a design drawing that has been created manually. In extracting the line, the process line and the utility line are not distinguished, but they may be distinguished in the process of generating the topology. There may be misspelled parts or misrecognized parts in the line distinction, because distinguishing between objects connected to the process line and the utility line is the most accurate method for processing connecting objects. If the object to be connected is an instrument, the corresponding line is the utility line; otherwise, it is classified as the process line.
In the process of connecting the equipment, the nozzle may be attached to the apparatus or included in the shape. Thus, a nozzle that overlaps the apparatus shape is found and connected to the equipment, because nozzles near the equipment are generally small in shape.
One can include the process of connecting to another P&ID using the P&ID number appearing in the OPC. If the P&ID name and the actual file name in the OPC are different, a relationship needs to be established between them. Because there may also be multiple P&IDs associated with one P&ID, the P&ID information connected to a P&ID should be stored, so that the P&ID information on another page can be obtained easily.
5. Part II: Conversion and Modeling Process for Intelligent P&ID
As described above, design engineers have conventionally rewritten P&ID drawings manually in the form of image files, usually PDF files, as new P&ID drawings. Consequently, there is inconsistency in data between design products, and time is required for early setup of FEED data. This poses serious problems, especially in overseas projects. To solve these problems, this paper provides a method for automatically creating P&ID drawings as follows. In this method, design factors can be aggregated and used for estimating tasks in a short amount of time and with high accuracy during the initial FEED process. It also eliminates engineers’ simple repetitive tasks and improves work productivity and design quality. This paper introduces an automatic drawing method using a database that includes design information. The design information in the database is automatically recognized and classified in the imaged P&ID drawing or extracted through other intelligent P&ID. The SP P&ID of the intelligent P&ID that creates the drawing is described as an example.
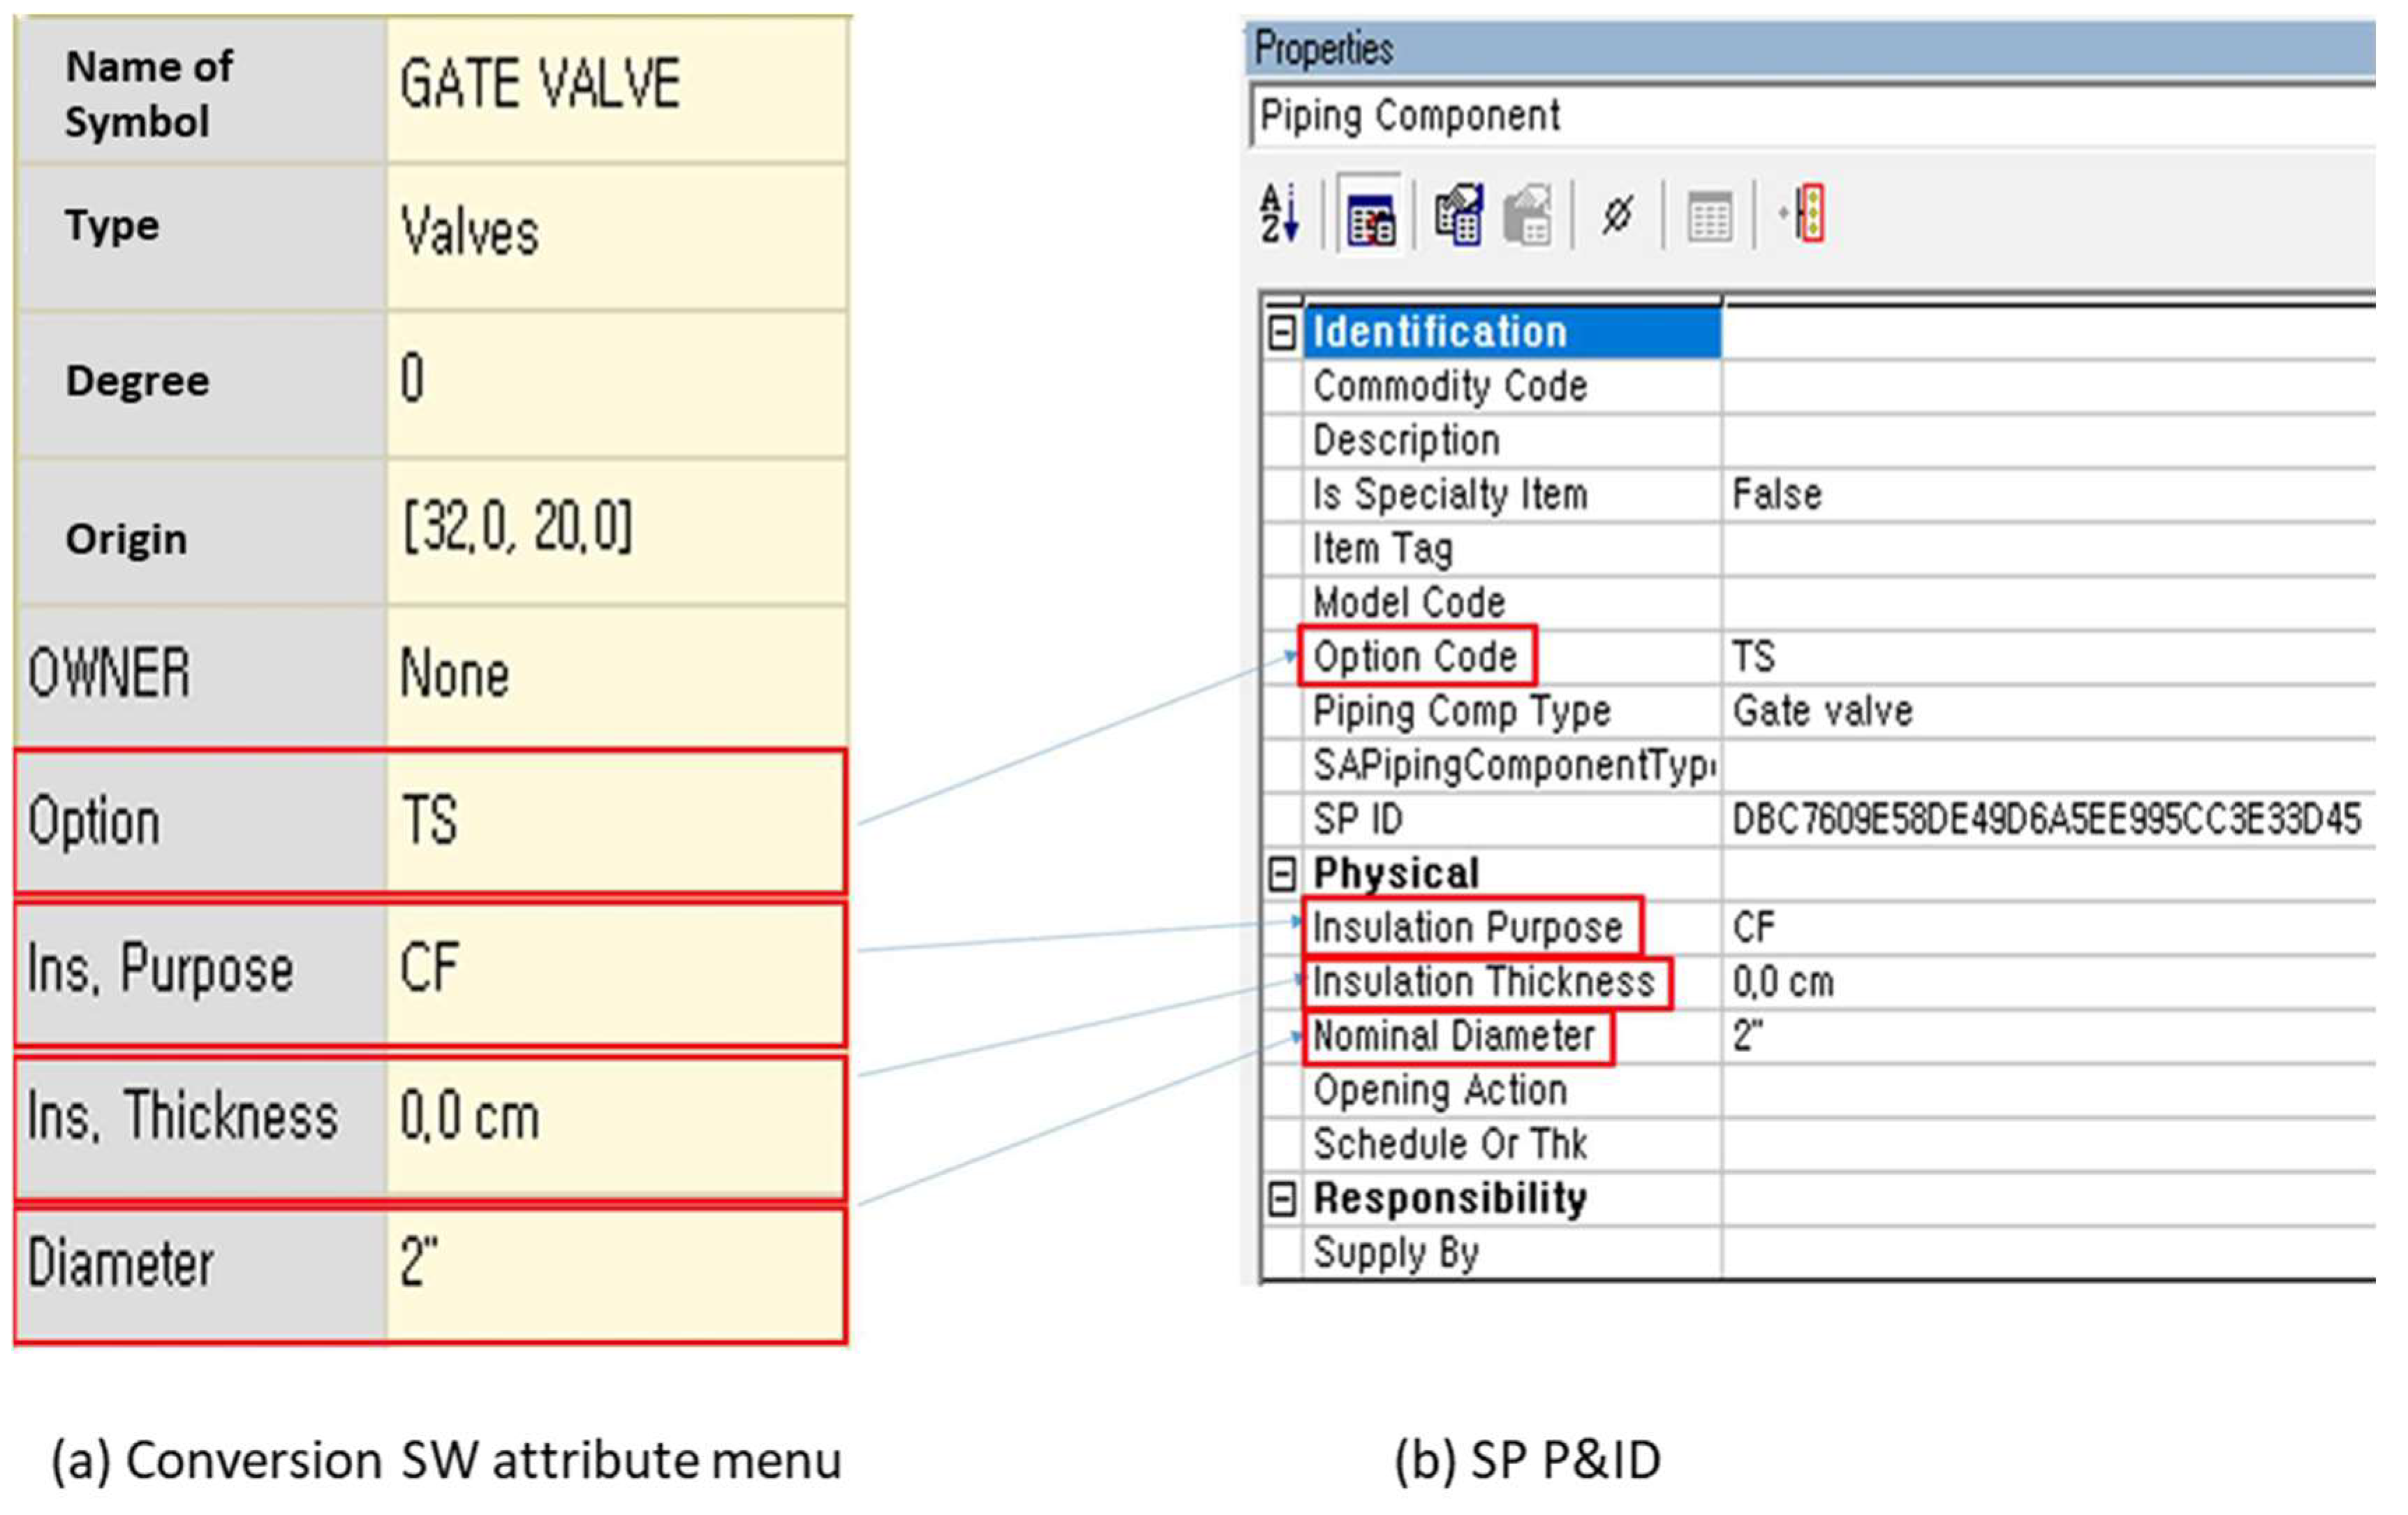
5.1. Design Information Conversion and Cleanup (Step S210)
First, the design information stored in the database is mapped to the predefined intelligent P&ID information and converted, and the relationship and information of the converted data are stored. Because the user selects and employs at will the design information stored in the database, the database can be converted and mapped to conform to the concept defined by the user. The data are then organized to convert symbol, line, line number, and text information to an intelligent P&ID item. If the design information stored in the database is the design information of the line, it is mapped with the predefined intelligent P&ID line types, such as capillary, and connected to process, electric, electric binary, guided electromagnetic, hydraulic, mechanical, pneumatic, pneumatic binary, primary, secondary, and software. After mapping the information, the line and symbol association and attribute information are converted and stored.
Figure 7 shows the map of the attribute information of the gate valve in the symbol. The attribute stored as “Option” in the database is mapped to “Option Code” according to the attribute of intelligent P&ID. Using the same method, “Ins. Purpose” is mapped to “Insulation Purpose,” “Ins. Thickness” to “Insulation Thickness,” and “Diameter” to “Nominal Diameter.” The association relationship includes connection information between the symbol and line connected to the line and connection information between the text and symbol. The database can include the process sequence of design and design information that is automatically recognized and classified in the imaged P&ID drawing. Because the size of the coordinates in the imaged P&ID drawing and the coordinate of the reference point in the intelligent P&ID are different, they are converted and stored through scale comparison and reference point symmetry.
5.2. Primary Line Modeling (Step S220)
Next, the connected lines of the primary type in the converted data by mapping with the intelligent P&ID information are combined. After modeling the main line first, a connector to which a branch line is connected is calculated, and the entire primary line is modeled. When the connected lines are not fine-tuned and cannot be combined into a group, errors occur in the data, the line is not aligned, and thus the modeling time is consumed unnecessarily. Therefore, the line position is first finely adjusted, and the connected lines are then combined into one.
The recursive algorithm, in which an arbitrary function calls itself, can be used to combine lines. In this method, another symbol or line connected is called by using connection information in which an arbitrary symbol or line is stored. Then, the process is repeated continuously to combine the line with another line.
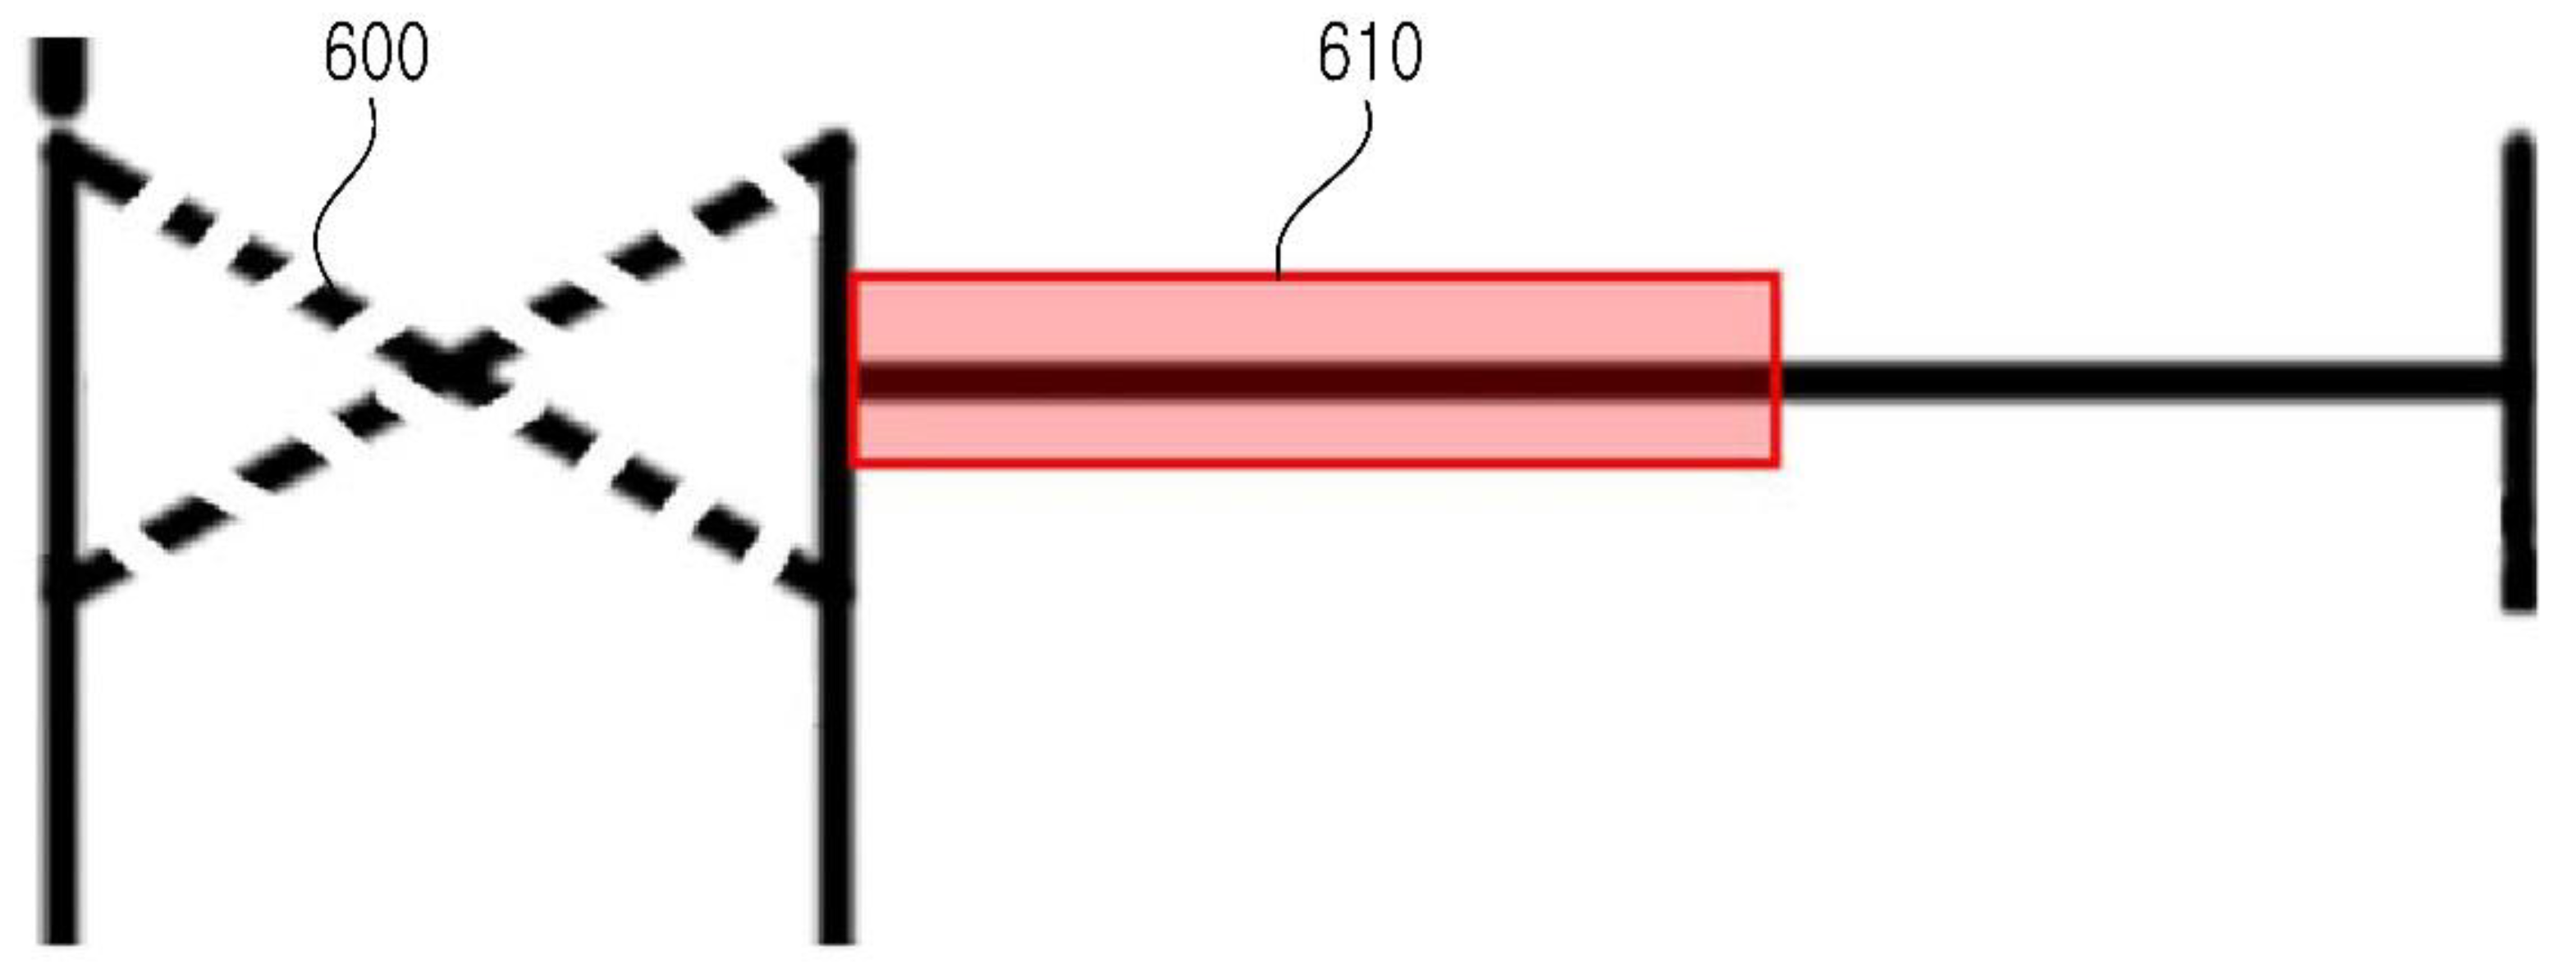
Figure 8 is an example of how to calculate a connector to connect a branch. The pipe run ID is the unique ID (UID) of the model that is combined into a group and modeled. One can check the SP_ID and representation type by querying the corresponding pipe run ID. If the representation type is “9,” it is a connector, and if it is “46,” it is a branch. The 400 is an embodiment of having only one main line. The start and endpoints have coordinates of (1, 1) and (5, 1), respectively. In addition, because the symbol and the branch line are not yet connected, if the pipeline run ID of the line is inquired, it is confirmed that there is only one connector object. The 410 is a connected branch line, and there is only one connector for the 400. Therefore, the branch line is connected by inputting the coordinates and the connector to which the branch line is connected as the connection information. At this time, after the branch line is generated, the coordinates of the branch line are stored. After connecting, we can see that one branch line object and two connector objects are created when querying the pipe run ID. When connecting a branch line to one of two connectors such as the 420, it is necessary to find a connector to which a branch line is connected. However, it is not possible to find a connector to which a branch line is connected only by using object information that has the same representation type, such as in the embodiment 410. To solve this problem, this paper uses a line-point coordinate calculation method. First, the coordinates to be connected to the branch line are extracted from the database. The start and endpoints of each connector are found using the coordinates that were saved when the branch line was connected.
5.3. Symbol Modeling (Step S230)
The line and connector are calculated to be connected to the symbol in the P&ID drawing modeled with the primary line. Then, the symbol is connected to the primary line to model the symbol. For a line for each connector of a symbol, a connector is determined based on the relation with the UID of the line and the symbol is modeled in the corresponding connector. The method of finding and modeling a connector is the same as the method for modeling a primary line. When modeling a symbol, the type that can be connected to the primary line is defined. The line type and symbol type must be the same. Therefore, if the type is the same as an instrument instead of the primary type, it will be connected to the electric line later. Therefore, the symbol is modeled at the designated position, even if it is not connected to the primary line.
In the symbol-modeling step, the symbol may not be placed on the line and may not be connected. In this case, the position of the symbol is corrected to the position of the connected primary line and modeled upon it. The method of modeling the symbol uses the connector and coordinates. If the coordinates of the symbol are different from the coordinates of the connected line, modeling is impossible, and the symbol cannot be located at the correct coordinates. It is possible to solve this problem and model the symbol by correcting the position of the symbol to the position of the connected primary line. The attribute information of the symbol in the database is stored in association with the symbol attribute of the intelligent P&ID. The symbol attribute information can be executed at a later stage, after the symbol is modeled. The symbol attribute of intelligent P&ID and the attributes stored in the database are preceded in the step of mapping and storing the database. Symbol attributes can be extracted in the drawing of intelligent P&ID by linking the attribute information of the symbol.
5.4. Utility Line Modeling (Step S230)
The utility line is modeled by combining the utility lines in the P&ID drawing with the modeled symbol into the groups of lines of the same type that can be connected to each other. Modeling the utility line is the same as modeling the primary line. The process of modeling the utility line is carried out after modeling the symbol. This is because a utility line is sometimes connected to a primary line through a symbol in the intelligent P&ID. The method allows modeling utility lines without errors. The utility line is connected to the primary line through the symbol. However, if a utility line is called without a symbol, the utility line will not be connected, and a user will be unable to proceed to the next step. Unless the utility line is connected to the primary line through the symbol, all lines including the utility line are modeled in the primary line-modeling process. If the type of utility line connected at the stage of modeling the utility line does not match the type of symbol, it is possible to output the report when the connection is not possible.
5.5. Reducer and Specification Breaker Modeling (Step S240)
If the symbol is a reducer or a specification breaker, the utility line is modeled. Then, the line and connector to which the symbol of the reducer or specification break is connected are calculated. The symbol of the reducer or specification break is connected to the primary line. Then, the newly created pipe run ID is stored, and the existing pipe run ID is modified. The difference in this method is to include a step to model the reducer or a specification break. The reducer changes the size of the piping, and the specification break the changes in the fluid type. This changes the attributes of the line after the reducer and specification break. Because of the nature of the reducer and specification break types, it is difficult to calculate the symbol and line connectors because the pipe run ID changes after the symbol of the reducer and specification break. Therefore, after modeling all symbols and lines, modeling the reducers and specification breaks can be performed. When the reducer symbol is modeled, it is separated into two different pipe runs after the reducer symbol.
5.6. Line Number and Text Modeling (Step S250)
In the intelligent P&ID drawing in which the utility line is modeled, the primary line and the utility line are modeled by linking the attribute information of the line number of the closest position using the coordinate information stored in the database. As a method of modeling the line number, the data order of the line number is checked first, and the attribute information of the matching line number is confirmed. After that, the connector closest to the position where the line number will be inserted is found. Subsequently, the line number attributes corresponding to the line number are connected to the connector and modeled. Furthermore, in the step of modeling the line number, if the value of the attribute information does not match the item attribute of the intelligent P&ID, the report can be outputted. By outputting the report to the user, it is possible to confirm whether or not the data are correctly inputted to the database, and the attribute information can be post-verified. Text other than the line number is modeled on the coordinates stored in the database. In the case of equipment among text, except for the line number, link the modeled text with the equipment symbol. In the step of modeling the line number and text, the text is characterized by modeling the coordinates stored in the database. Text is sometimes compared with drawings that are subject to comparison for design product consistency, such as imaged P&ID drawings. At this time, it is easy to compare the consistency of the design product because it can be compared at the same position.
6. Case Studies for Validation
6.1. P&IDs Used in the Case Study
A case study was conducted on the P&ID/scanned P&ID of three levels of complexity (simple, intermediate, and complex) converted using CAD. A given P&ID was converted into an image with a resolution of 500 dpi and processed in the order of the symbol, text, and line (
Figure 9).
6.2. Performance of Digitalization and Conversion
The symbol was recognized through template matching, and it showed 93% accuracy. The symbols shown in
Figure 10 are registered before the symbol recognition, and when one symbol on the image is composed of a plurality of symbols in the SP P&ID, the basic symbol and the additional symbols are configured when the symbol is registered.
The symbol that appeared in each drawing is registered, and the equipment is recognized. The accuracy of the symbol recognition is calculated by the number of symbols correctly recognized with respect to the number of symbols existing in the drawing. The symbols with ambiguous features such as nozzles and flanges have lower than average recognition rates. For nozzles, the recognition area of the equipment was extended to recognize the nozzle in the expanded area; therefore, the misjudgment rate of the nozzle was reduced.
Text recognition was performed using the Tesseract OCR engine and showed an accuracy of 82%. Recognition using the basic language data set provided by Tesseract was low, but the recognition rate was improved by repeatedly learning the misrecognized text through OCR training (
Figure 11).
In the text recognition process, when the symbol overlaps with the text, when the text rotates, or when the distance between the texts is long, the recognition rate of the text is low. To remove these factors, the symbols were removed before the recognition of the text, or the direction of the text was detected, and then the text was recognized by rotating the text if it was in the vertical direction. The orientation of the text is distinguished as horizontal or vertical using the aspect ratio of the text.
Table 1 summarizes the recognition results of symbols, lines, and text in CAD-converted PDFs and scanned PDFs.
As a summary of the recognition validation study, the recognition rates for symbols were 93% and 87% for CAD-converted PDFs and image-scanned PDFs, respectively. The recognition rates for lines were 93% and 89% for CAD-converted PDFs and image-scanned PDFs, respectively. Lastly, the recognition rates for text were 87% and 82% for CAD-converted PDFs and image-scanned PDFs, respectively. Because the CAD-converted PDF is the electronic version with high resolution, the recognition rates from these PDF files were higher than those from the image-scanned PDF files. Furthermore, in contrast to the authors’ expectations, the recognition rates of text were lower than those of symbols and lines, even though the best-known OCR engines such as Abbyy OCR [
43] were adopted to improve recognition accuracy.
The following were the most commonly unrecognized or misrecognized elements:
- (a)
Small, non-featured symbols such as nozzles or flanges
- (b)
Diagonal lines, either horizontal or vertical, and separated lines
- (c)
Text overlapped by a symbol, similar characters due to font types (I/1, O/0, etc.), and errors due to case (S/s, O/o, etc.)
After both symbols and text are recognized, the recognition of the line connected with the symbol is performed. To show the characteristics of the P&ID line, the line type is applied so that not all lines are displayed as solid lines but are instead cut off in the middle. To recognize these lines, the image is read in the unit of a blob, and cases in which the image is broken in the middle are also solved. At this time, depending on the characteristics of the symbol connected to the line, the line is automatically classified into a primary line and secondary line. The data are converted to SP P&ID using the recognition result. The recognition result is generated as an intermediate file in XML format (
Figure 12).
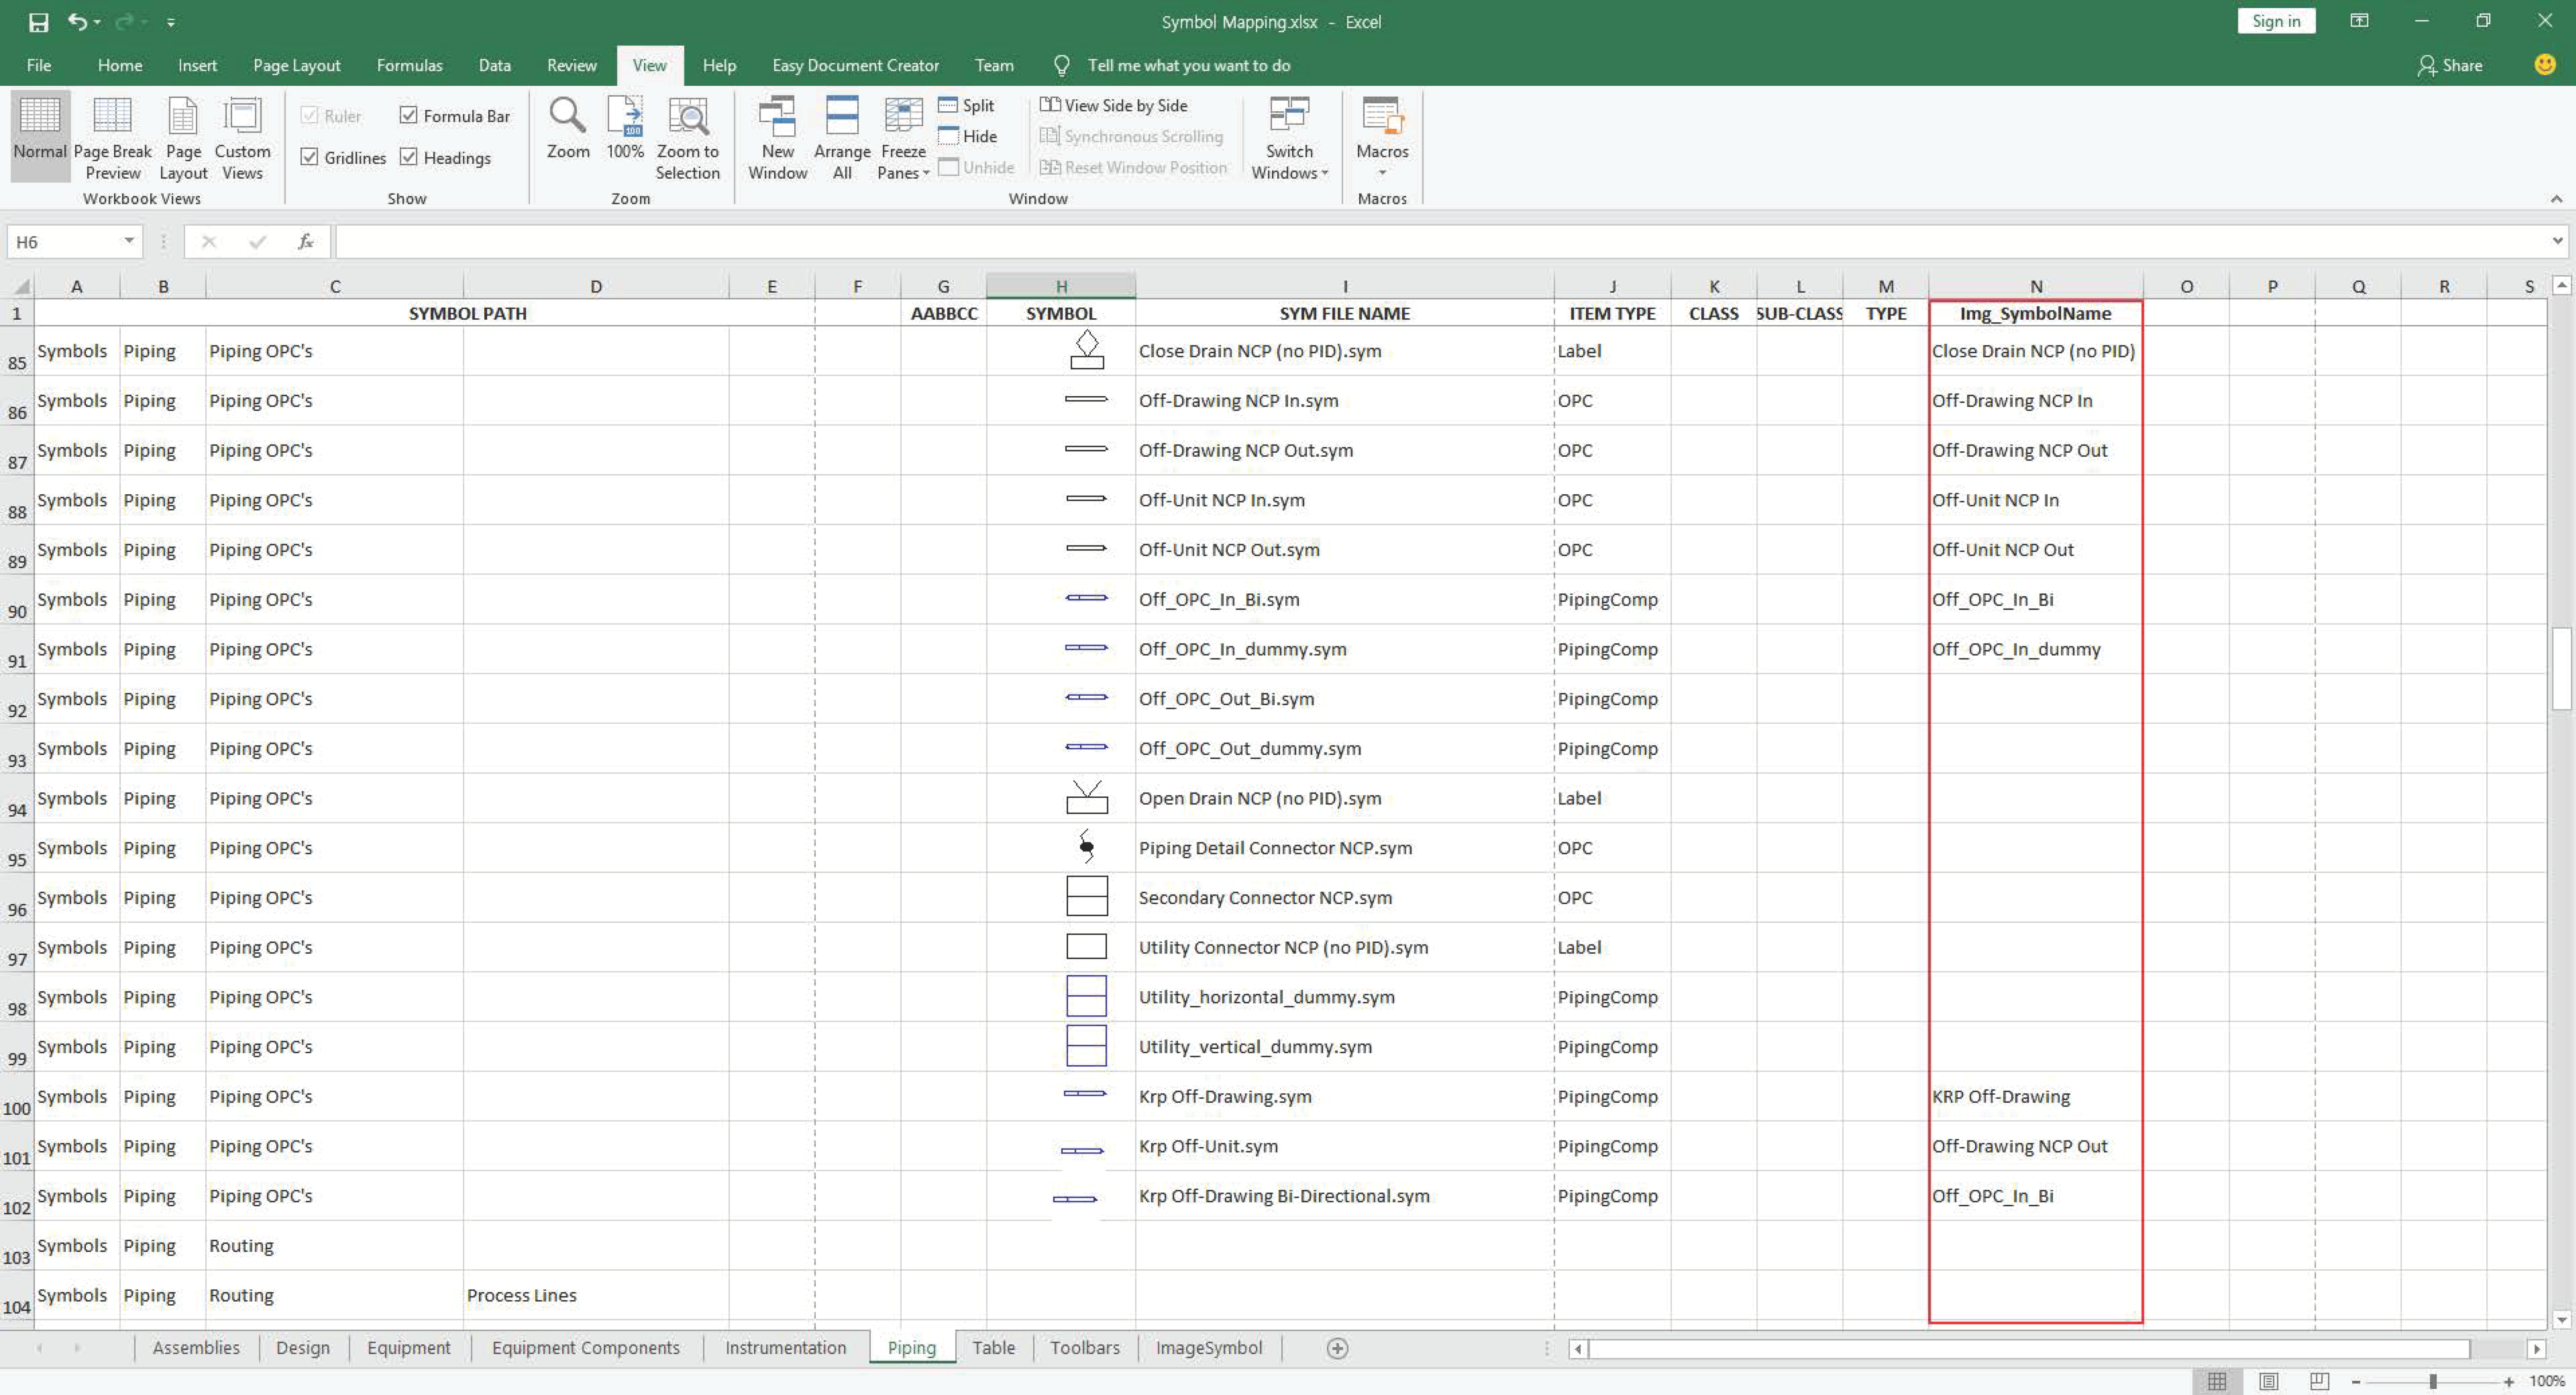
Because the symbols recognized in the image and the symbols used in the SP P&ID are different from each other, symbol mapping is performed before the conversion process. Symbol mapping is performed by writing the recognized symbol name used by the SP P&ID in the Excel file. Furthermore, a graphical user interface is provided for the user’s convenience so that mapping can be done more easily (
Figure 13).
The design information recognized in the image is converted into the symbol, line, and text. All the perceived information has been converted into elements of SP P&ID. The connection of the recognized symbol and property is confirmed in the SP P&ID (
Figure 14).
6.3. Comparison of Man-Hours Required Between Manual Drawing and Automatic Conversion
The developed intelligent P&ID recognition and conversion system, as reported in this paper, was named as “ID2”, Image Drawing to intelligent Drawing” as a prototype software tool. The comparison of the man-hours needed to draw a number of P&ID drawings between (1) the traditional manual drawing method by inputting piece-by-piece electronically using some kind of commercial P&ID software tools such as SP P&ID or Aveva P&ID; and (2) the automatic recognition and conversion using the developed tool (ID2) was performed briefly for a case study project in the practice. The case study contained 400 sheets of P&ID drawings on average, with an assumption of 5 engineers needed to draw the electronic P&ID manually based off images or hard copy of drawings provided by the project owner in the bid stage to convert the files to electronic forms such as SP P&ID files. As summarized in
Table 2, the manually drawing the P&IDs required about 3200 man-hours (i.e., 3.8 months of time by 5 engineers), whereas the process of automatic recognition and conversion using the tool (ID2) took only 200 man-hours (i.e., 5 days with one engineer). Using this case study, the comparison indicated that the automatic and intelligent P&ID with ID2 was approximately 16 times faster than manual and traditional P&ID input methods, resulting in a huge reduction in the amount of time needed for drawing the inputs and a significantly shortened duration in the detailed engineering stage. Most of the time spent using the intelligent tool (ID2) was in preprocessing the symbol registration, post-processing the error checks, and fine-tuning the final completion of the remaining work (i.e., incomplete conversion).
6.4. Threshold Criteria for the Optimized Digitalization
Based on the validation case studies summarized above, few suggestions were derived to reduce practical errors or to optimize the efficiency of symbols recognition and digitized conversion, as lessons-learned threshold criteria, as following:
Firstly, the introduced P&ID digitalization methodology is best suitable for relatively well standardized equipment symbols such as for oil and gas production and processing plants and petrochemical plants, compared to other types of industrial plants such as coal-based power plants and iron and steel making plants. The main reason is that oil and gas production plants adopted internationally high-level of standard equipment symbols in their P&IDs, whereas power plants and steel plants used limited standard equipment symbols yet. For example, major equipment for power plant projects such as boilers, turbines, and generators were designed and engineered by suppliers and makers with their own specific engineering criteria. Therefore, the accuracy of symbol registration and recognition/extraction by the template matching scheme for digitalization of theses maker-driven P&IDs (i.e., power plants) is relatively lower, and therefore requires more manual error-checking and adjustment process in the digitized conversion.
Secondly, the resolution and format of image-based P&IDs sources is an influencing parameter for the success rate of the introduced P&ID digitalization method. For example, imaged P&IDs in a PDF format originally saved from commercial P&ID tools, (although they do not contain any engineering entity or attribute characteristics electronically as a plain engineering drawing), is relatively better for the introduced digitalization process than the hard copy of scanned P&IDs. Similarly, the higher resolution of source P&IDs, either hard copy of scanned/imaged or electronically saved in to PDF, ends up with better rate of the P&ID digitalization process. From a practical point of view approximately 200 dpi resolution in a PDF format at minimum is required to secure reliable result of the P&ID digitalization technology.
Thirdly, the type of commercial P&ID engineering software tools has some impact on the conversion of the recognized drawing entities, as the conversion of the digitized entities (i.e., symbols, lines, text, and their attributes) to the commercial tools, as the digitalization scheme needs to use specific codes for API (Application Programming Interface) for the interface access eventually. For example, the validation case studies indicated that commercial tools such as Aveva’s P&ID provides more open APIs, which helps convert and transfer from a neutral format file to the software entities and attributes automatically, compared to SP P&ID and AutoCAD’s Plant P&ID with stricter and more conservative provision of APIs.
7. Conclusions and Future Research
7.1. Conclusions
This paper provided a method for recognizing and classifying design information by automatically digitizing design information in imaged P&ID drawings with high precision in a short amount of time. In addition, we provided a method for obtaining the digitized drawing from the database that is saved in image P&ID drawing or text form by modeling the symbol, line, and text in an intelligent P&ID. The method of automatically recognizing and classifying design information in an imaged P&ID drawing is as follows. The symbol area is extracted from the drawing, the origin and connecting point of the corresponding symbol in the symbol area are set, and the symbol is automatically registered in the database. The preregistered symbol in the imaged P&ID drawing is identified and then extracted from the imaged P&ID drawing. A line is recognized and extracted using the sliding window method, which calculates a blob unit instead of a pixel unit in an imaged P&ID drawing from which a symbol is removed. The aspect ratio is calculated in the imaged P&ID drawing from which the symbol is removed. The region where the text exists is calculated, and the text in the region is recognized and extracted. The text detected in the drawing area is classified among the extracted texts into its respective attributes through a predefined attribute classification scheme. The extracted symbol and line are associated with the attribute of the extracted text based on the closest reference and are then associated with the extracted symbol. If the extracted symbol is the equipment, the equipment name is recognized in the text.
The method of automatically creating an intelligent P&ID drawing using the design information stored in the database is as follows. The design information stored in the database is mapped to predefined intelligent P&ID information and stored in the association and information of the converted data. Modeling the primary line that composes the design target process from the converted data is performed by mapping with the intelligent P&ID information, connecting the main lines by combining the process lines, connecting a branch line for branching from a main line to a branch line, and modeling the primary lines by connecting a branch line using a connector of a main line as a linkage information. In the intelligent P&ID drawing modeled by the primary line, the lines and connectors to which the symbol will be connected are calculated. Then, the symbol is modeled to connect the symbol to the primary line. A utility line is modeled by combining utility lines into a group of mutually connectable lines of the same type with the modeled symbol and the primary lines in the diagram in the intelligent P&ID drawing by using the coordinate information stored in the database and the attribute information of the line number in the closest position, and association with each other.
If a drawing is digitized automatically, most of the tasks can be automatically generated, such as the drawing creation, material calculation, equipment list, line list, and instrument list calculation with high accuracy in a short amount of time. This also helps to improve the productivity of advanced engineers by eliminating the simple and repetitive tasks of manually calculating design elements. Moreover, if the drawing is automatically generated by using the data generated by the new method rather than the existing method of manually drawing directly from the imaged P&ID, the quality of the design product can be improved by maintaining the consistency of the design product. This solves problems associated with manual drawings, such as time consumption, missing items, and misspelling of the plant engineering companies.
7.2. Future Research
As a follow-up study based on this paper, machine-learning technology, which is a popular AI method used in big data analysis, is being applied by the authors to improve processing speed and accuracy. The authors expect that the machine-learning approach will enhance the performance of the automated recognition process by decreasing the rates of both misrecognition and unrecognition.
The fundamental aspects and technology of the recognition and conversion of imaged P&IDs to digitized elements, as reported in this paper, might be applicable and expanded to other engineering disciplines such as HVAC (Heating, Ventilation, and Air Conditioning), civil and structure, and electrical and instrumentational wiring with some relevant adjustments.


