Article

Considering Well-to-Wheels Analysis in Control Design: Regenerative Suspension Helps to Reduce Greenhouse Gas Emissions from Battery Electric Vehicles

1
School of Mechanical Engineering, Beijing Institute of Technology, Beijing 100081, China
2
School of Automobile, Chang’an University, Xi’an 710064, China
*
Author to whom correspondence should be addressed.
Energies 2019, 12(13), 2594; https://doi.org/10.3390/en12132594
Submission received: 20 April 2019 / Revised: 2 June 2019 / Accepted: 1 July 2019 / Published: 5 July 2019
(This article belongs to the Section B: Energy and Environment)

Abstract

:
Recent research has investigated the energy saving potential of regenerative suspension. However, the greenhouse gas (GHG) emission mitigation potential of regenerative suspension in battery electric vehicles (BEVs) has not been considered. Life cycle assessment (LCA) is a typical method for evaluating GHG emissions but is rarely used in vehicle control design. Here we explore the effects of regenerative suspension on reducing the GHG emissions from a BEV, whose control design considers well-to-wheels (WTW) analysis. The work first conducts the WTW analysis and modelling of the GHG emissions from a BEV equipped with regenerative suspension. Based on the models, the relation between suspension control parameters and GHG emissions is obtained. To reach a compromise between dynamic performance and environmental benefit, two types of control parameters are recommended and their switch rules during the operation are proposed. Finally, we take a case study with different driving cycles, road levels and country contexts. The results show that considering WTW analysis in control design can contribute to GHG emission mitigation, especially for countries that have a high-carbon intensity of the electricity grid. These findings provide a quantitative reference for technology path decision on regenerative suspension. This paper may provide a new insight for employing LCA in vehicle design.

1. Introduction

Zero exhaust emissions during the use phase are a significant advantage of battery electric vehicles (BEVs) compared with internal combustion engine vehicles. However, from a life cycle perspective, BEVs may cause serious energy and environmental issues in China [1,2]. One of the most crucial reasons is that the Chinese electricity grid is dominated by coal power [2]. For this reason, one solution is to optimize the power structure, and another solution is to focus on the power saving during the use phase in order to decrease greenhouse gas (GHG) emissions [1]. To achieve GHG emission reduction through reducing the electricity consumption, converting kinetic energy into electrical energy is a recommendable way, such as braking energy regeneration [3]. In addition to regenerating braking energy, power regeneration from vehicle suspension is also an effective way.

1.1. Regenerative Suspension

Regenerative suspension absorbs the suspension vibration energy and converts the recovered energy into electrical energy to support the power demand of vehicles.
A great number of fundamental studies are focused on the energy benefits from vehicle suspension. Múčka quantifies the power dissipated in a damper of vehicle suspension to estimate the energy recovery potential of a passenger car more accurately [4]. Zhang et al. analyse the energy harvest potential of various types of vehicle suspension system. They find that regenerative suspension systems have a good application prospect in vehicles with large mass, relatively high driving speed, and poor driving conditions [5]. Audi’s engineers conduct diverse road tests to indicate the suspension energy recovery potential of passenger cars. They find that the average regenerated power is around 150 W when the passenger car travels on German roads [6].
Under the basic theory of suspension energy harvesting, some research regarding the design and optimization of a regenerative shock absorber has also been conducted. Karnopp first proposes a linear electromagnetic absorber consisting of moving coils with a magnetic field around them [7]. Suda et al. develop a hybrid suspension system and use a linear DC generator to recover energy from vibration [8]. Zuo et al. design an electromagnetic energy harvester and build a 1:2 scale prototype to show its ability to generate electricity under vibration [9].
In particular, the application of a regenerative shock absorber in electric vehicles has been explored. Montazeri-Gh et al. try to apply energy-harvesting suspension to a parallel hybrid electric vehicle [10]. Shi et al. explore the influence of energy harvesting suspension on the fuel economy of a power split hybrid electric vehicle. The relations between control parameters and different suspension performances are analysed comprehensively [11]. Pham et al. provide an integrated vehicle model that simulates simultaneously the driver, powertrain, chassis, body, road conditions, vehicle dynamics and the active suspension system with or without an energy harvesting module [12]. Zhang et al. present a high-efficiency energy harvesting shock absorber employing rack and pinion with supercapacitor, in order to extend the battery cruising range of a BEV [13].
However, previous research on regenerative suspension has not pay attention to the GHG emission reduction potential of regenerative suspension.

1.2. Life Cycle Assessment (LCA)

The GHG emissions of vehicles is typically assessed over the LCA method. There are numerous LCA research studies into electric vehicles in the literature. For instance, Hawkins et al. confirm that BEVs employing European grid electricity can potentially achieve a decrease of up to 29% in emissions compared with conventional vehicles [14], while Qiao et al. compare the life cycle energy consumption and GHG emissions of vehicle production between battery electric and internal combustion engine vehicles in China’s context, finding that the energy consumption and GHG emissions of a BEV production range are about 50% higher than those of an internal combustion engine vehicle [15]. Also, Yuan et al. estimate the energy consumption and well-to-wheels (WTW) CO2 emissions of BEV range in China. They find that low speeds and short driving range can contribute to reducing the environmental impact [16]. Lewis et al. assess the potential of mass reduction and electrified vehicles for reducing life cycle energy and GHG emissions [17]. Zackrisson et al. identify the key issues regarding the life cycle assessment of lithium-ion batteries for plug-in hybrid electric vehicles [18].
In addition, there are many studies concerning the use of parametric approaches to link LCA with design. Lee et al. use a parametric modelling approach to evaluate economic and environmental life cycle trade-offs of medium-duty electric trucks in comparison with nine non-electric technologies [19]. Miller et al. conduct the parametric modelling of life cycle GHG emissions from photovoltaic power and analyse the impacts of photovoltaic power developments on GHG emissions [20]. Yao et al. develop a novel parametric analysis framework to identify research development priorities of emerging technologies. They try to address the challenge of modelling the relationships between life cycle inventory data and key technical parameters in the traditional LCA method [21]. Niero et al. discuss the use of parameterisation within the life cycle inventory in the wooden pallet sector, for the purpose of testing the effectiveness of life cycle inventory parametric models to calculate the environmental impacts of similar products [22].
Previous researchers mostly employ the LCA method to evaluate consumption and emissions from vehicles and identify environmental hot-spots, but there is no consideration given to the utilization of LCA in vehicle control design.

1.3. Contribution of This Paper

From the perspective of regenerative suspension, although much research focus on its energy saving potential, its GHG emission mitigation potential is rarely considered. From the perspective of LCA, the introduction of the LCA method in the control design of regenerative suspension has not been taken into account.
To fill these research gaps, we investigate the regenerative suspension control design coupled with the LCA method and explore the GHG emission reduction potential of regenerative suspension. For the purpose of the calculation of GHG emissions, the modelling of the well-to-wheels (WTW) GHG emissions from a BEV using regenerative suspension is conducted. Based on these models, the relation between control parameters and GHG emissions is obtained, which is the point of the control design coupled with the LCA method. In order to illustrate the GHG emission reduction potential of regenerative suspension, the comparison study is carried out under different driving cycles, road levels and country contexts.
The major contribution of this work includes: (1) the control design coupled with LCA for regenerative suspension, which extends the utilization of the LCA method into the control design of vehicles for both performance and environmental benefits; (2) the investigation of GHG emission reduction potential of regenerative suspension, which confirms that regenerative suspension tends to be a new solution to reducing WTW emissions of GHG from BEVs, especially for countries that have high-carbon intensity of the electricity grid. This work provides a quantitative reference for technology path decisions on regenerative suspension.
The remainder of this paper is organized as follows. Section 2 illustrates the method for the control design of regenerative suspension coupled with LCA. In particular, the research boundary and the overall calculation method of WTW GHG emissions from a BEV using regenerative suspension are presented in Section 2.1. The modelling of vehicle specification including powertrain and regenerative suspension are proposed in Section 2.2. Based on Section 2.1 and Section 2.2, the regenerative suspension control design coupled with LCA is conducted in Section 2.3. Section 3 presents research results including: the obtained control parameters of regenerative suspension in Section 3.1 and the GHG emission reduction potential of regenerative suspension in different case studies in Section 3.2 and Section 3.3. Section 4 provides the discussion and concluding remarks.

2. Methods

2.1. Boundary and Modelling of WTW GHG Emissions

The main purpose of this paper is to explore the application of the LCA method in the control design of regenerative suspension. The impact of control design on BEV life cycle GHG emissions occurs only during the use phase. Therefore, only the use phase of the BEV life cycle is considered in this study instead of the phases including extraction of raw materials, manufacturing, distribution, maintenance and repair. In fact, a BEV emits zero exhaust emissions during the use phase, and its GHG emissions during the use phase are derived from the life cycle GHG emissions of the consumed electricity. Consequently, WTW analysis of a BEV using regenerative suspension becomes the focus of this study.
In this study GHG emissions are defined as a combination of CO2, CH4 and N2O emissions. CO2, CH4 and N2O emissions are converted into CO2 equivalent (CO2eq), and the global warming potentials are 1, 25 and 298 [23].
As shown in Figure 1, the WTW GHG emissions of a BEV consist of two stages. One is upstream well-to-tank (WTT) stage (e.g., feedstock extraction, feedstock transport, electricity generation and electricity delivery), which increases GHG emissions. The other is on-road tank-to-wheels (TTW) stage (e.g., vehicle use phase). During the TTW stage, electrical energy stored in the battery is used to drive the wheels, and the recovered braking energy is stored in the battery. Meanwhile, the regenerative suspension absorbs the suspension vibration energy and converts the recovered energy into electrical energy to support the power requirements of the suspension actuator and the vehicle drive, thereby reducing the vehicle’s overall power consumption and thus reducing GHG emissions. It should be noted that the recovered energy requires an energy storage system. Supercapacitors are used as energy storage systems for recovered energy due to their superior characteristics including high efficiency, long life cycle, high power density and fast charge/discharge response [24].
The WTW GHG emissions for each BEV using regenerative suspension GE (g) can be calculated using Equation (1).
G E = ( E C P o w e r t r a i n + E C S u s ) E F
where ECPowertrain (kW h) is the electricity consumption of the BEV powertrain, which also covers the electricity consumption of all auxiliary systems except the regenerative suspension. ECSus (kW h) is the electricity consumption of the regenerative suspension. EF (g CO2eq/kW h) represents the life cycle GHG emission factor of electricity. ECPowertrain (kW h) and ECSus (kW h) will be obtained in Section 2.2.

2.2. Modelling of Vehicle Specification

For the vehicle specification, this study focuses on a light-duty BEV and takes one Nissan Leaf as an example for illustration. The effects of regenerative suspension on the WTW GHG emissions from a light-duty BEV are investigated based on the models of the powertrain and regenerative suspension.

2.2.1. Modelling of the Powertrain

The following formulas are introduced to calculate the electricity consumption of the powertrain of each light-duty BEV (ECPowertrain).
First of all, the power at the wheels can be written as:
P W h e e l s ( t ) = ( m a ( t ) + m g cos ( θ ) C r 1000 ( c 1 v ( t ) + c 2 ) + 1 2 ρ A i r A f C D v 2 ( t ) + m g sin ( θ ) ) v ( t )
where m is the vehicle mass in (kg). a(t) = dv(t)/dt is the acceleration of the vehicle in (m/s2) (a(t) takes negative values when the vehicle decelerates). g represents the gravitational acceleration. θ represents the road grade. Cr, c1 and c2 are the rolling resistance parameters that vary as a function of the road surface category, road situation and vehicle tire category. ρAir represents the air mass density in kg/m3. Af represents the frontal area of the car in m2, and CD represents the aerodynamic drag coefficient of the car. v(t) represents the vehicle speed in (m/s).
Given the power at the wheels, the electric motor power PElectric_motor (t) is calculated by Equation (3), considering the driveline efficiency ηDriveline and the efficiency of the electric motor ηElectric_motor.
P E l e c t r i c _ m o t o r ( t ) = P W h e e l s ( t ) η D r i v e l i n e η E l e c t r i c _ m o t o r .
In traction mode, the electric motor power is assumed to be positive, described as PElectric_motor_con (t). During the regenerated braking mode, the electric motor power is assumed to be negative and is calculated considering the brake regeneration efficiency (ηrb) by Equation (4).
P E l e c t r i c _ m o t o r _ n e g ( t ) = P E l e c t r i c _ m o t o r ( t ) η r b .
Referring to [25], the regenerative brake energy efficiency ηrb is computed by Equation (5).
η r b ( t ) = { [ e ( 0.0411 | a ( t ) | ) ] 1 a ( t ) < 0 0 a ( t ) 0 .
Based on Equations (2)–(4), the electric power consumed by the powertrain P P o w e r t r a i n ( t ) (W) can be obtained by Equation (6).
P P o w e r t r a i n ( t ) = ( P E l e c t r i c _ m o t o r _ c o n ( t ) + P E l e c t r i c _ m o t o r _ n e g ( t ) + P A u x i l i a r y ) / η B a t t e r y
where ηBattery is the battery efficiency and PAuxiliary is the power consumed by the auxiliary systems.
Given the PPowertrain(t), it is possible to compute the electricity consumption of the powertrain ECPowertrain in (kW h) using Equation (7).
E C P o w e r t r a i n = 1 3 , 600 , 000 0 t P P o w e r t r a i n ( t ) d t .

2.2.2. Modelling of Regenerative Suspension

This section describes the method for calculating the electricity consumption of regenerative suspension of each light-duty BEV (ECSus), consisting of two main steps.
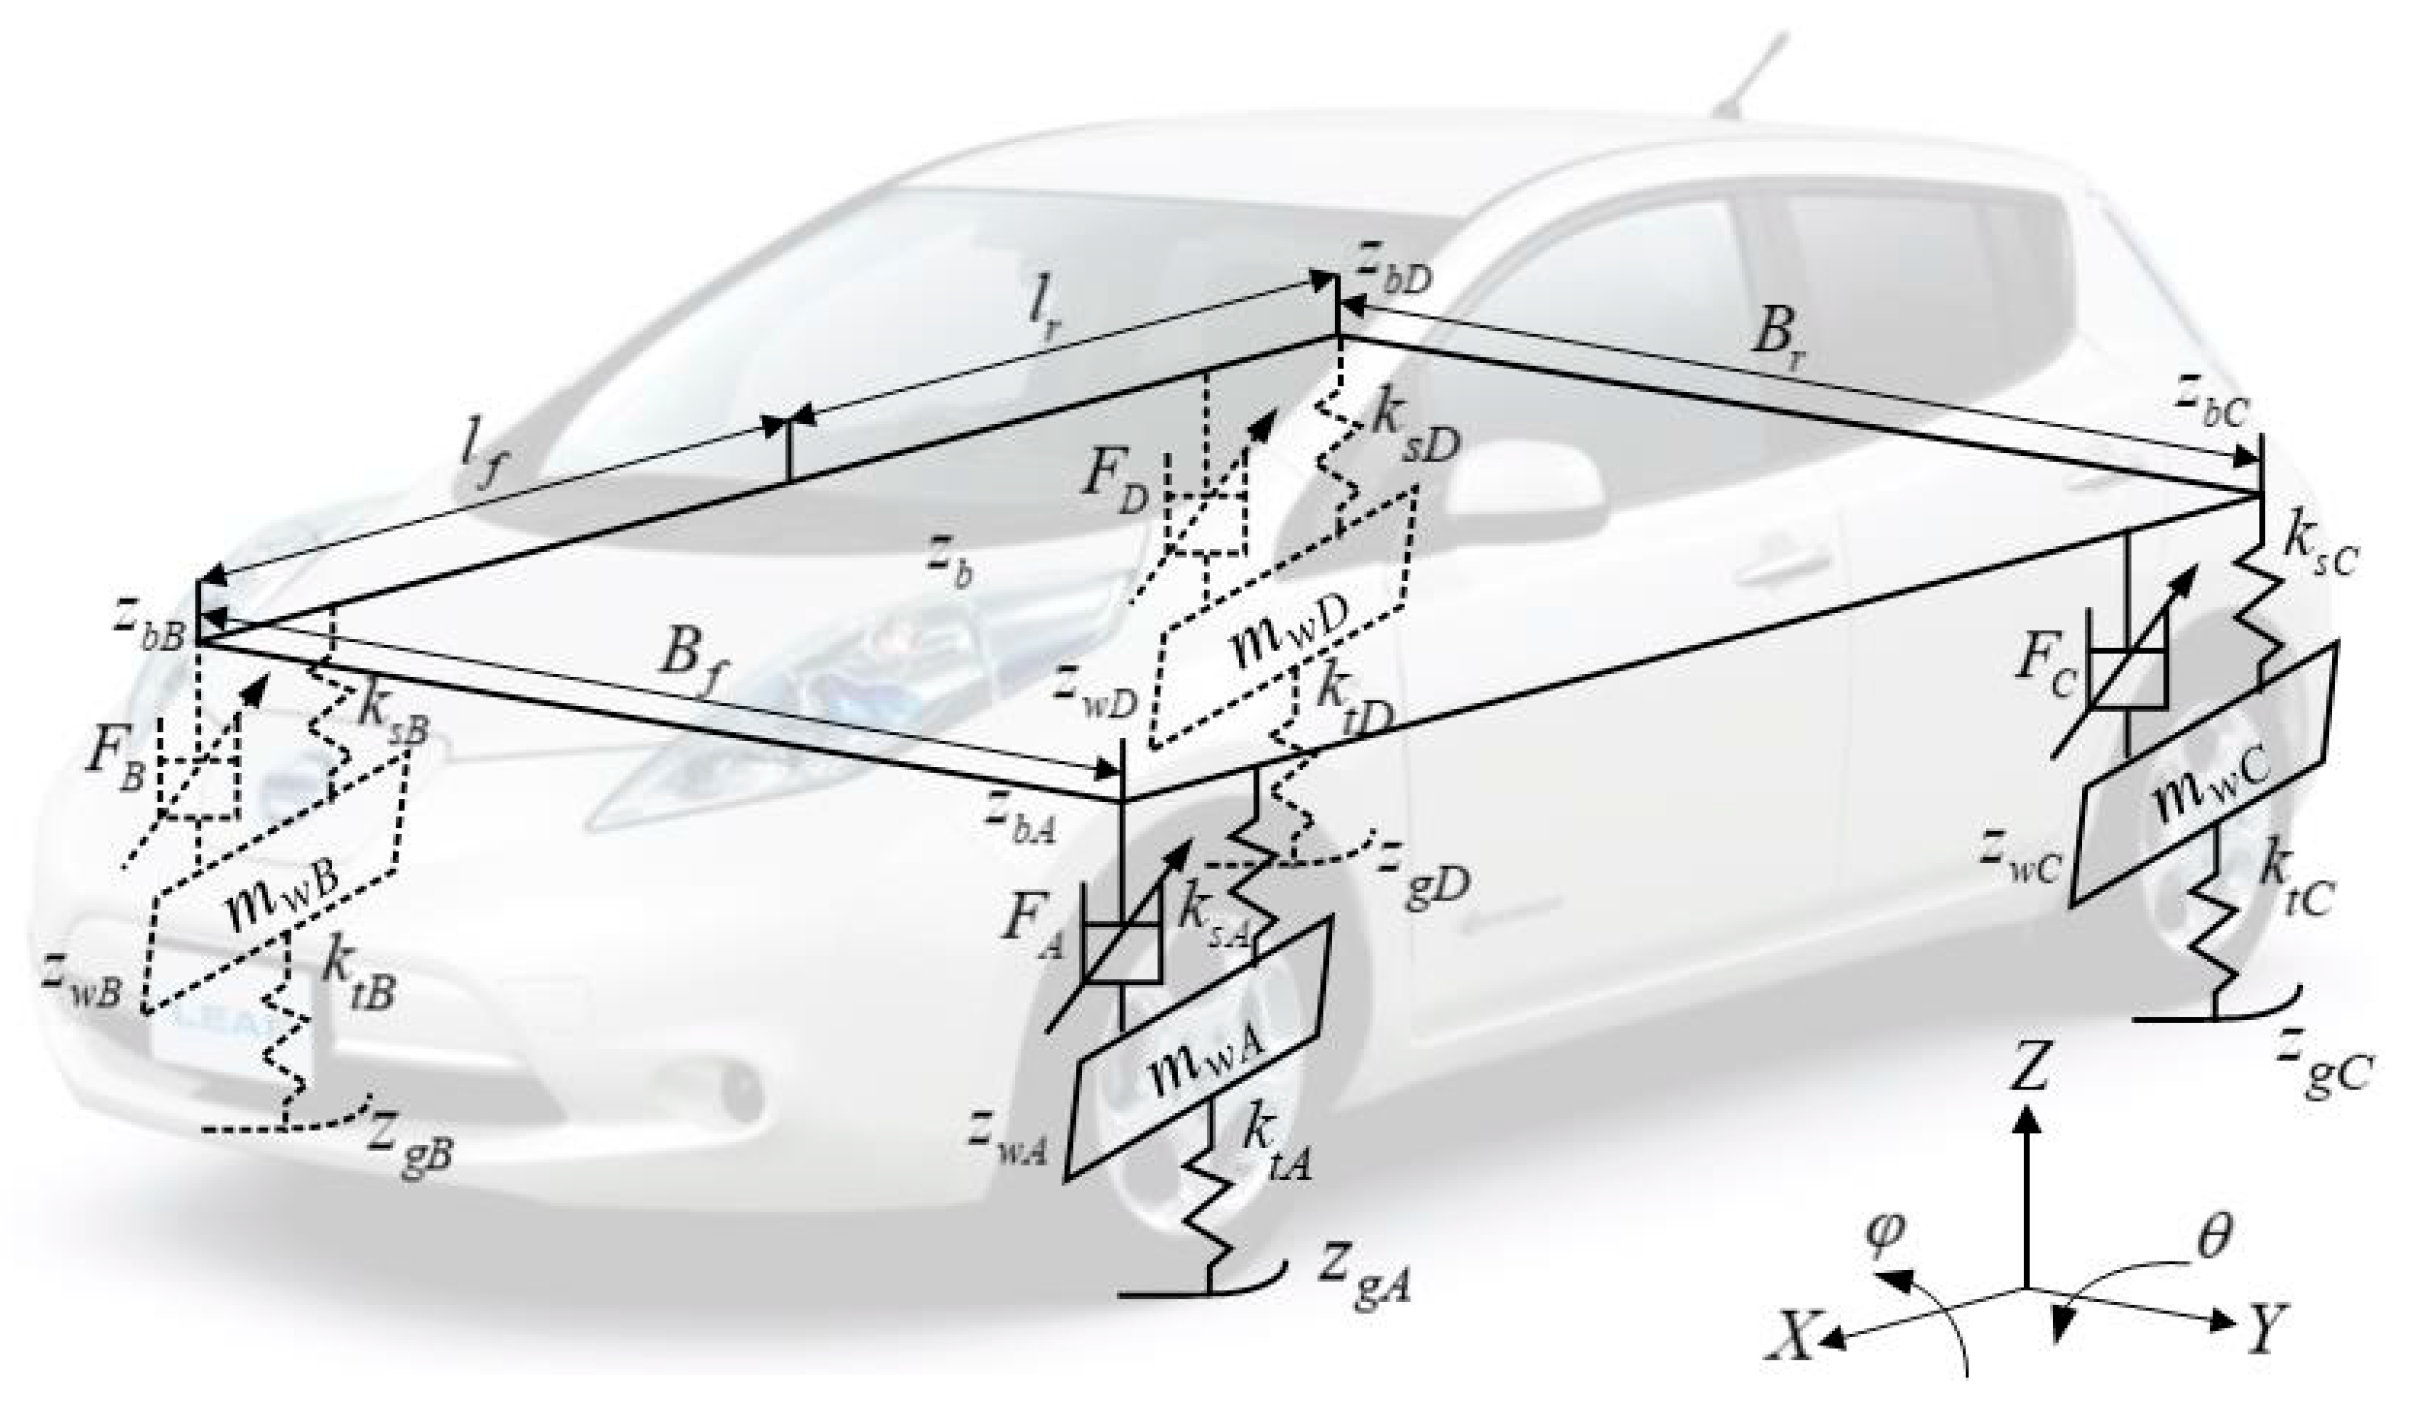
Step 1: Figure out the desired active force of regenerative suspension based on the vehicle dynamic performance requirements. The point is the development of the vertical full vehicle model (see Figure 2), comprised of kinematic equations and dynamical equations. Firstly, kinematic equations (due to the vehicle geometry) are provided. Each corner of the car is symbolized by i index, and i = [A, B, C, D] constitutes the front left, front right, rear left and rear right. Since the roll and pitch angles are small enough, the kinematic equations can be written as:
{ z b A ( t ) = z b ( t ) l f θ ( t ) + t f φ ( t ) 2 z b B ( t ) = z b ( t ) l f θ ( t ) t f φ ( t ) 2 z b C ( t ) = z b ( t ) + l r θ ( t ) + t r φ ( t ) 2 z b D ( t ) = z b ( t ) + l r θ ( t ) t r φ ( t ) 2
where zb (t) is the vertical displacement of the sprung mass at the centre of gravity. φ ( t ) (resp. θ(t)) is the pitch (resp. roll) angle of the sprung mass at the centre of gravity. lf, lr, t f = B f 2 and t r = B r 2 define the vehicle geometrical properties (Figure 2).
Secondly, the dynamical equations are given by:
{ m b z ¨ b ( t ) = F s A ( t ) F s B ( t ) F s C ( t ) F s D ( t ) m w i z ¨ w i ( t ) = F s i ( t ) F t i ( t ) I y θ ¨ ( t ) = l f ( F s A ( t ) + F s B ( t ) ) l r ( F s C ( t ) + F s D ( t ) ) I x φ ¨ ( t ) = t f ( F s B ( t ) F s A ( t ) ) + t r ( F s D ( t ) F s C ( t ) )
where mb and mwi represent the sprung mass and unsprung mass, respectively. The vehicle inertia in the x-axis (resp. y-axis) is denoted by Ix (resp. Iy).
The vertical tyre force Fti(t) and suspension force Fsi(t) are defined as:
{ F s i ( t ) = k s i ( z b i ( t ) z w i ( t ) ) + F i ( t ) F t i ( t ) = k t i ( z w i ( t ) z g i ( t ) )
where ksi and kti are the linearized suspension and tyre stiffness coefficients respectively. zwi(t) holds for the vertical displacement of the unsprung mass. zgi(t) is the vertical displacement input caused by road roughness, and in this study it is assumed that zgA(t) = zgB(t) = zgC(t) = zgD(t).
The active force Fi (t) provided by the motor is written as:
F i ( t ) = c s z ˙ b i ( t ) + c g z ˙ w i ( t )
where cs and cg represent control parameters of velocity of sprung mass and unsprung mass, respectively. By setting the control parameters properly, a compromise between ride comfort performance and road-holding performance can be reached. Generally, cs > 0 and cg ≤ 0 are needed for the purpose of the suspension stability. Meanwhile, cg can be represented by cg = −ncs. This control strategy provides quantitative and convenient relations between suspension control parameters and various assessment standards [11].
The road profile input used for this study is based on GB 7031-86 [26]. According to this standard, road profiles are classified into A–H to describe various road roughness levels. In this study widely used road levels A–D are selected. The classification criteria for road levels A–D are shown in Table 1, in which Gq (n0) is the road roughness coefficient, and n0 represents the spatial frequency value. The road vertical displacement input of each wheel zgi(t) can be obtained by Equation (12) [11,27].
z ˙ g i ( t ) = 0.111 [ 40 w 0 ( t ) G q ( n 0 ) v ( t ) v ( t ) z g i ( t ) ]
where z ˙ g i ( t ) represents the road vertical velocity input of each wheel. w0(t) is the Gaussian white noise with zero mean value and v(t) represents the vehicle speed in (m/s).
Step 2: Work out the electricity consumption of regenerative suspension used to provide the desired active force and the electricity recovery of regenerative suspension. Regenerative suspension can be classified into three main categories according to different working principles: hydraulic, electromagnetic and mechanical designs [13]. The electromagnetic damper is chosen in this study is the same as Reference [28]. This damper consists of a DC motor, a ball screw and a nut. The ball screw and the nut help transform the linear motion into rotary motion. The DC motor provides the active force required by the vehicle dynamic performance. Referring to Reference [28], the induced voltage em(t) and the output active force Fi(t) of the motor can be obtained according to the following relations:
e m ( t ) = ϕ ( z ˙ b i ( t ) z ˙ w i ( t ) )
F i ( t ) = ϕ i ( t )
where ϕ is called motor constant. ( z ˙ b i ( t ) z ˙ w i ( t ) ) represents the suspension velocity and i(t) is the current.
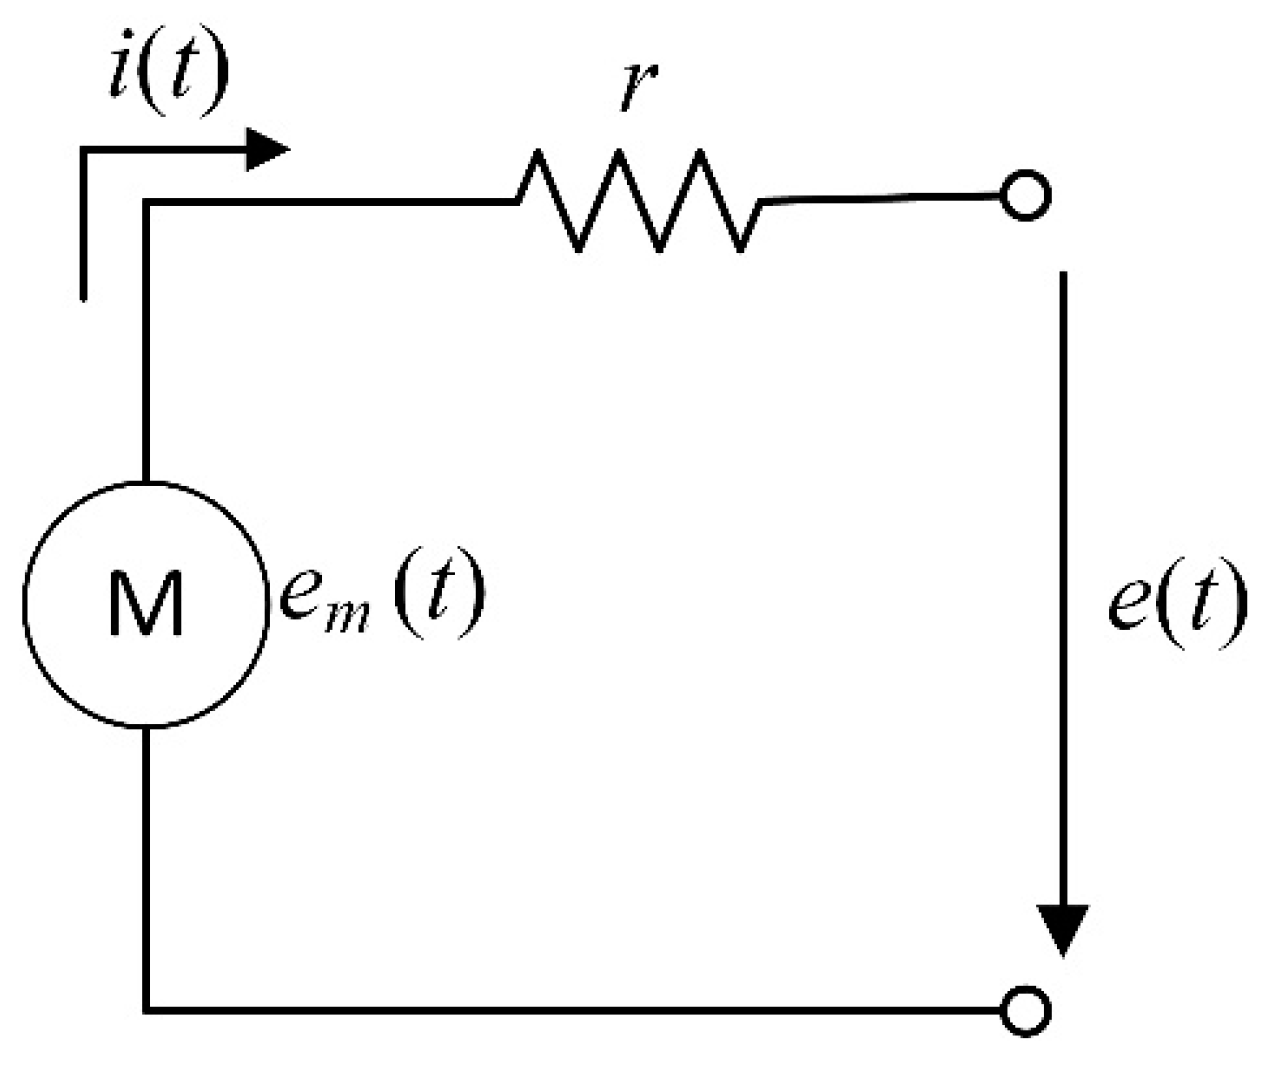
The equivalent circuit of the DC motor is described by Figure 3. To get the desired active force Fi(t), the following voltage of the power source e(t) is required.
e ( t ) = e m ( t ) + i ( t ) r = ϕ ( z ˙ b i ( t ) z ˙ w i ( t ) ) + F i ( t ) ϕ r
While the motor offers the desired active force, the overall power consumption PSus(t) is:
P S u s ( t ) = i e ( t ) i ( t ) = i ( ϕ ( z ˙ b i ( t ) z ˙ w i ( t ) ) + F i ( t ) ϕ r ) F i ( t ) ϕ .
In power consumption mode, PSus(t) > 0 and is written as PSus_pos(t), in which electrical energy from the battery is transformed into mechanical energy and heat. PSus(t) = 0 represents that the motor is in break, or all mechanical energy is turned into heat without using electrical energy. In regeneration mode, PSus(t) < 0 and is written as PSus_neg(t), which means that a portion of the suspension vibration energy is converted into electrical energy and stored in the supercapacitor. The power transferred to the supercapacitor PSus_reg(t) is described as:
P S u s _ r e g ( t ) = P S u s _ n e g ( t ) η S u s _ r e g .
According to Reference [28], the efficiency of the recovery ηSus_reg = 35%, defined as the ratio of the recovered energy to the total absorbed energy.
Using Equations (16,17) it is possible to calculate the final net electric power of regenerative suspension, which is written as:
P S u s _ n e t ( t ) = P S u s _ p o s ( t ) + P S u s _ r e g ( t ) .
Finally, the overall electricity consumption of regenerative suspension (ECSus) in (kW h) can be obtained using Equation (19).
E C S u s = 1 3 , 600 , 000 0 t P S u s _ n e t ( t ) d t .

2.3. Control Design of Regenerative Suspension

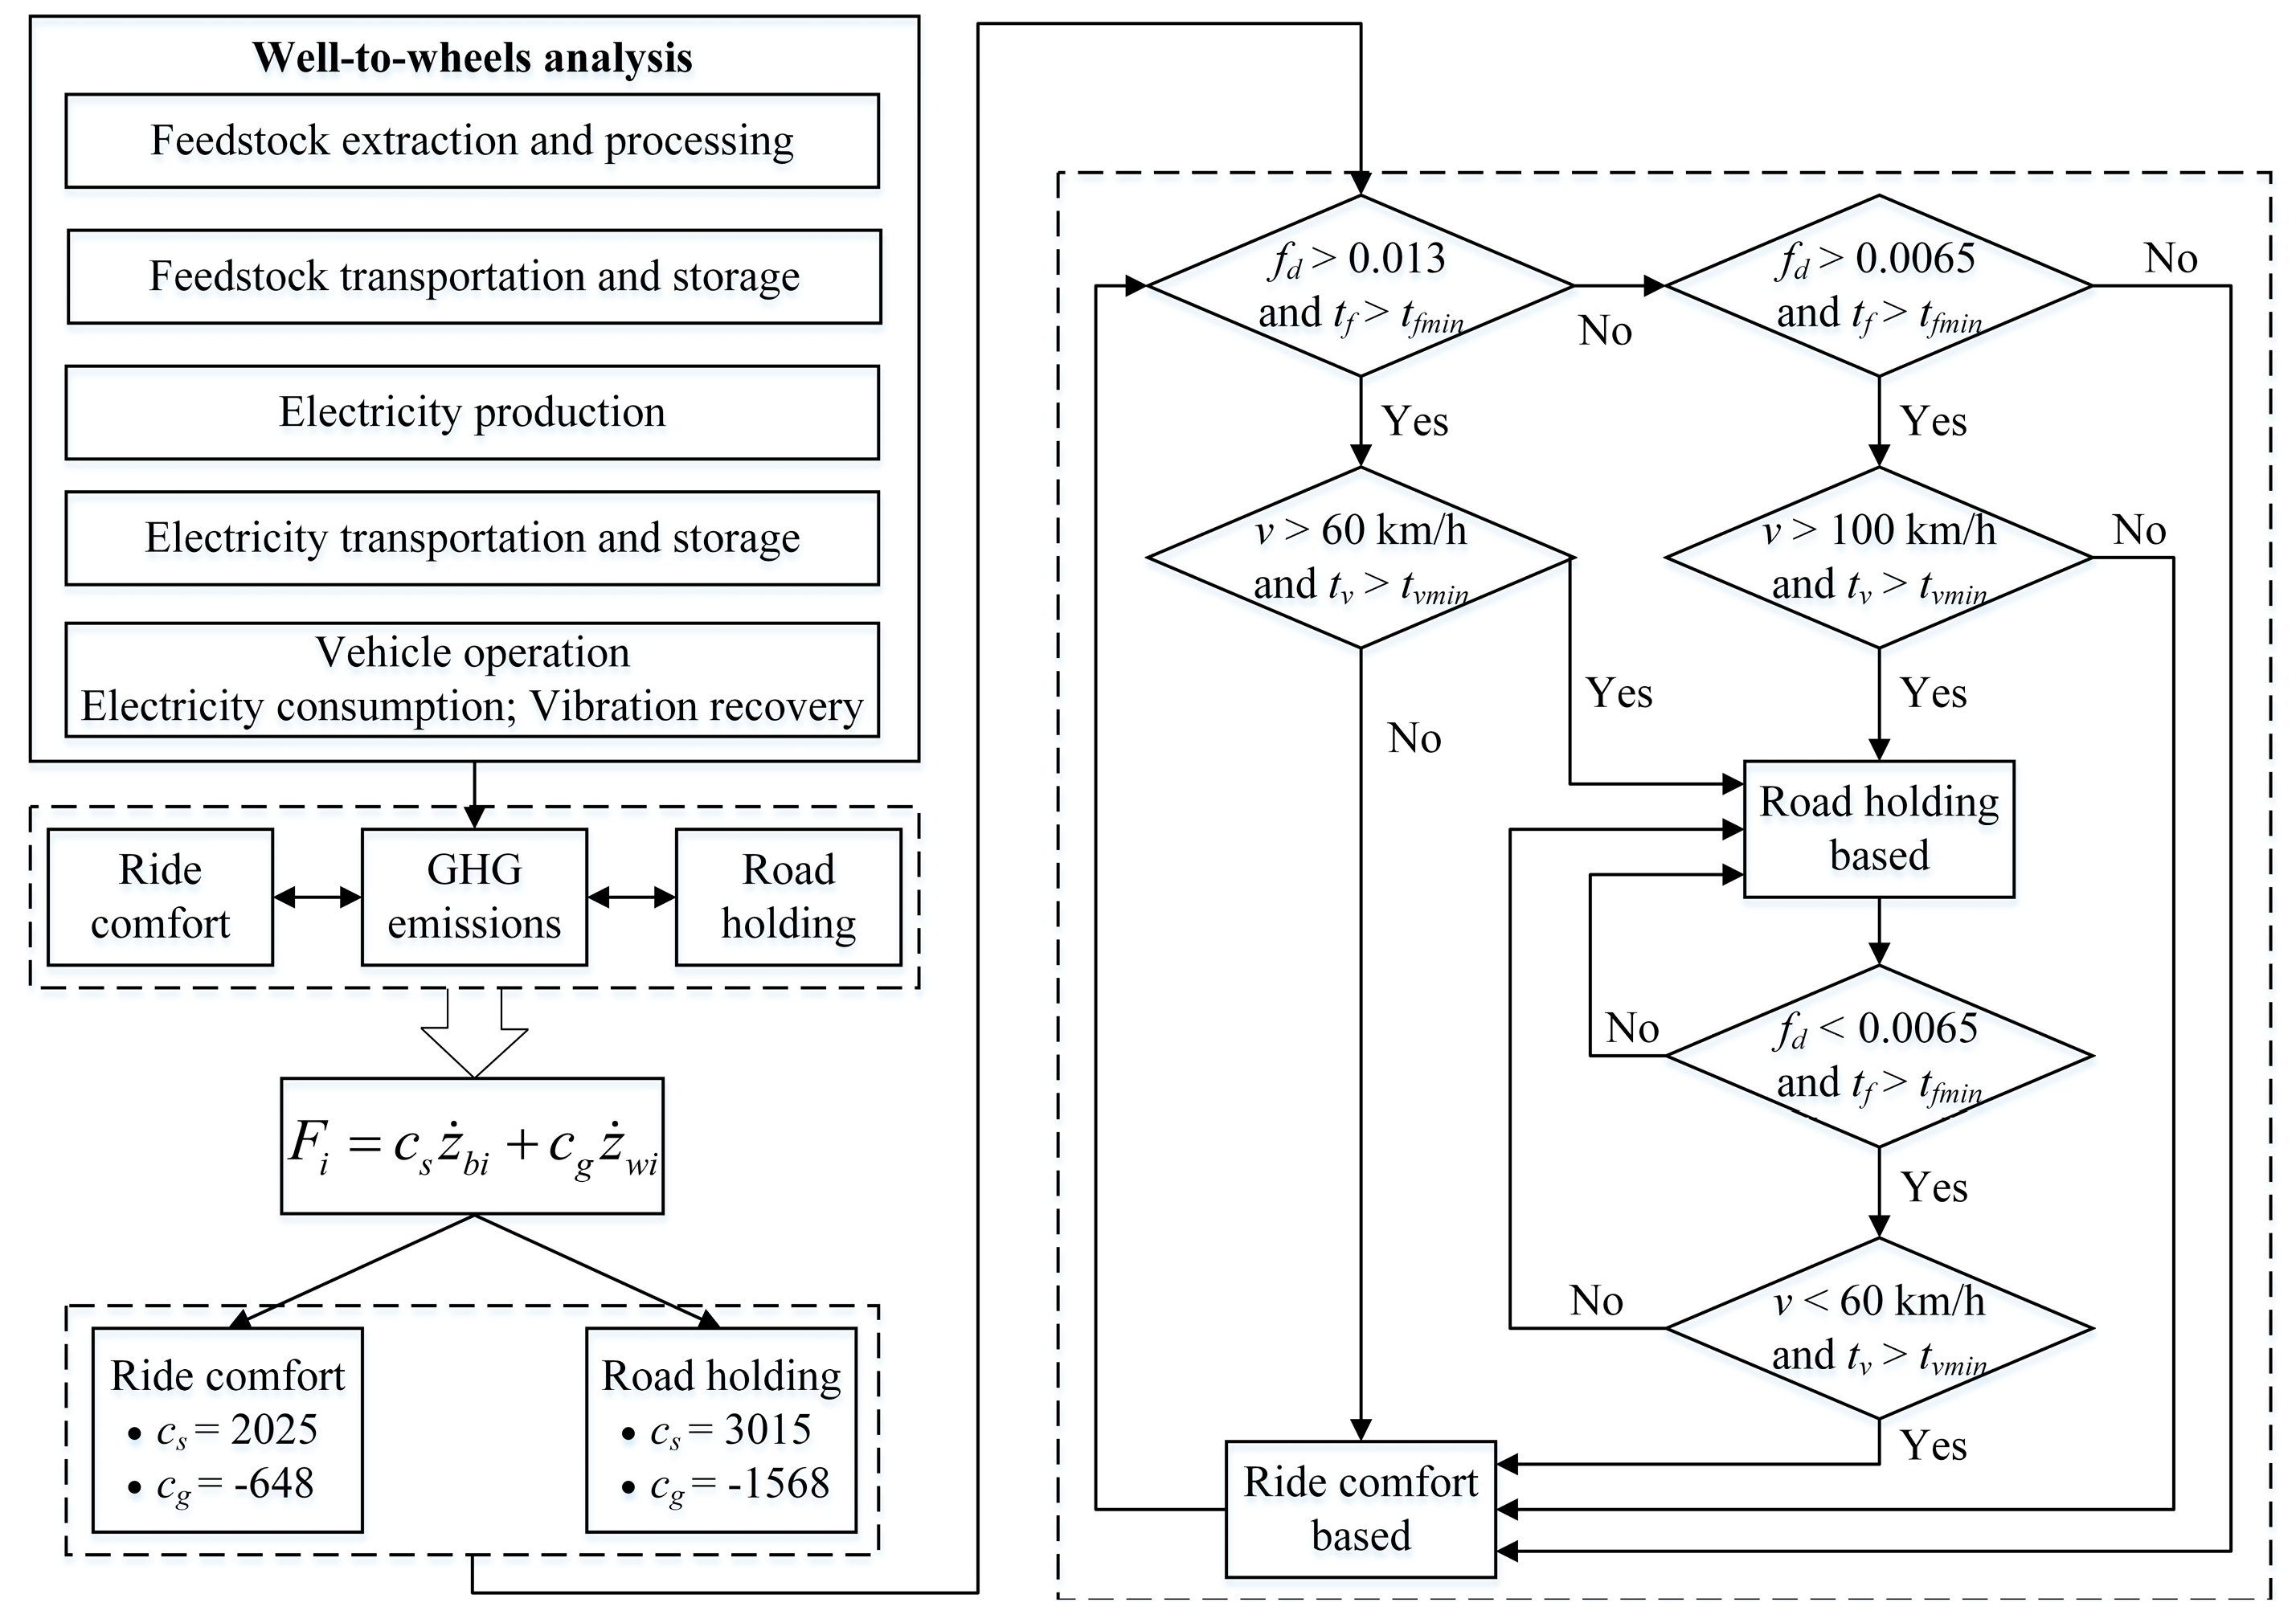
Based on the models obtained from Section 2.1 and Section 2.2, the following will describe the control design of regenerative suspension when considering WTW analysis. The block diagram of the control structure is shown in Figure 4.
Firstly, based on the model of WTW GHG emissions (Figure 1), Equations (11), (16) and (19), the WTW analysis was conducted to get the relation between suspension control parameters (cs and cg) and the GHG emissions of the electricity consumed by regenerative suspension GESus (g), which is written as:
{ G E S u s = ( 1 3 , 600 , 000 0 t ( P S u s _ p o s ( t ) + P S u s _ n e g ( t ) η S u s _ r e g ) d t ) E F P S u s ( t ) = i ( ϕ ( z ˙ b i ( t ) z ˙ w i ( t ) ) + F i ( t ) ϕ r ) F i ( t ) ϕ F i ( t ) = c s z ˙ b i + c g z ˙ w i .
Meanwhile, based on the vertical full vehicle model and Equation (11), the effects of suspension control parameters on the vehicle dynamic performance, including ride comfort and road holding, were taken into account. In order to reach a compromise among GHG emissions, ride comfort and road holding, suspension control parameters are divided into two main categories including ride comfort-based parameters (CPRC) and road holding based parameters (CPRH) (whose values are shown in the Results section).
Finally, the decision-making rules between CPRC and CPRH are discussed. The decision rules used at the beginning of this research was based on the literature [11]. The rules decided the suspension control parameters based on vehicle velocities and road levels. The different road levels are represented by the suspension deflection fd [11]. Therefore, the choice of CPRC or CPRH at the beginning were decided by vehicle velocities v and suspension deflection fd as shown in Figure 4. The rules were extended in this study with a consideration of the switch from CPRH to CPRC (and from CPRC to CPRH) during the operation. When CPRH was switched to CPRC, it was essential to ensure the suspension deflection (less than 0.0065 m) and the vehicle velocity (less than 60 km/h) were both small enough for the purpose of guaranteeing the vehicle stability, especially in cornering. When CPRC was switched to CPRH, the switch rules during the operation were the same as the decision rules at the beginning. Also, a minimum time interval tvmin and tfmin is necessary for the retention time of vehicle velocity tv and suspension deflection tf for the purpose of preventing frequent switching and interference, for example occasional uneven road interference. Here tfmin was set for 0.3 s and tvmin was 3 s.

3. Results

3.1. Control Parameters of Regenerative Suspension

The following introduces the selection process of suspension control parameters cs and cg. The recommended suspension control parameters were firstly selected in the time domain according to the root mean square (RMS) values of dynamic performance indicators, including body vertical acceleration, tyre dynamic load and suspension deflection. Small body vertical acceleration means good ride comfort. Small tyre dynamic load and suspension deflection indicate good road holding performance. Then, we analysed the effects of the recommended control parameters on suspension frequency responses to determine its feasibility.
Table 2 shows the vehicle model parameters required for both the suspension control parameter selection process in this section and the case study in the next sections. The model parameters concerning vehicle specification were based on Nissan Leaf. The damping coefficient of passive suspension for comparison is 1500 N s/m. In this section the car was assumed to drive on a B level road at a speed of 80 km/h in the context of China in 2016, and here EF is 834.5 g CO2eq/kW h adopted from Reference [15].
To estimate the improvement of the dynamic performance, the improvement index γ is written as:
γ = ( λ p λ r ) λ p
where λ r is the RMS value of dynamic performance indicators from regenerative suspension, λ p is the RMS value of dynamic performance indicators from passive suspension.
The passive suspension is used as a benchmark. When γ > 0, the RMS values of regenerative suspension are smaller than those of passive suspension, this means that regenerative suspension dynamic performance is improved. The baseline of dynamic performance RMS values and WTW GHG emissions from the electricity consumed by suspension is presented by Table 3. The baseline of WTW GHG emissions was zero because there is no energy consumption in passive suspension.
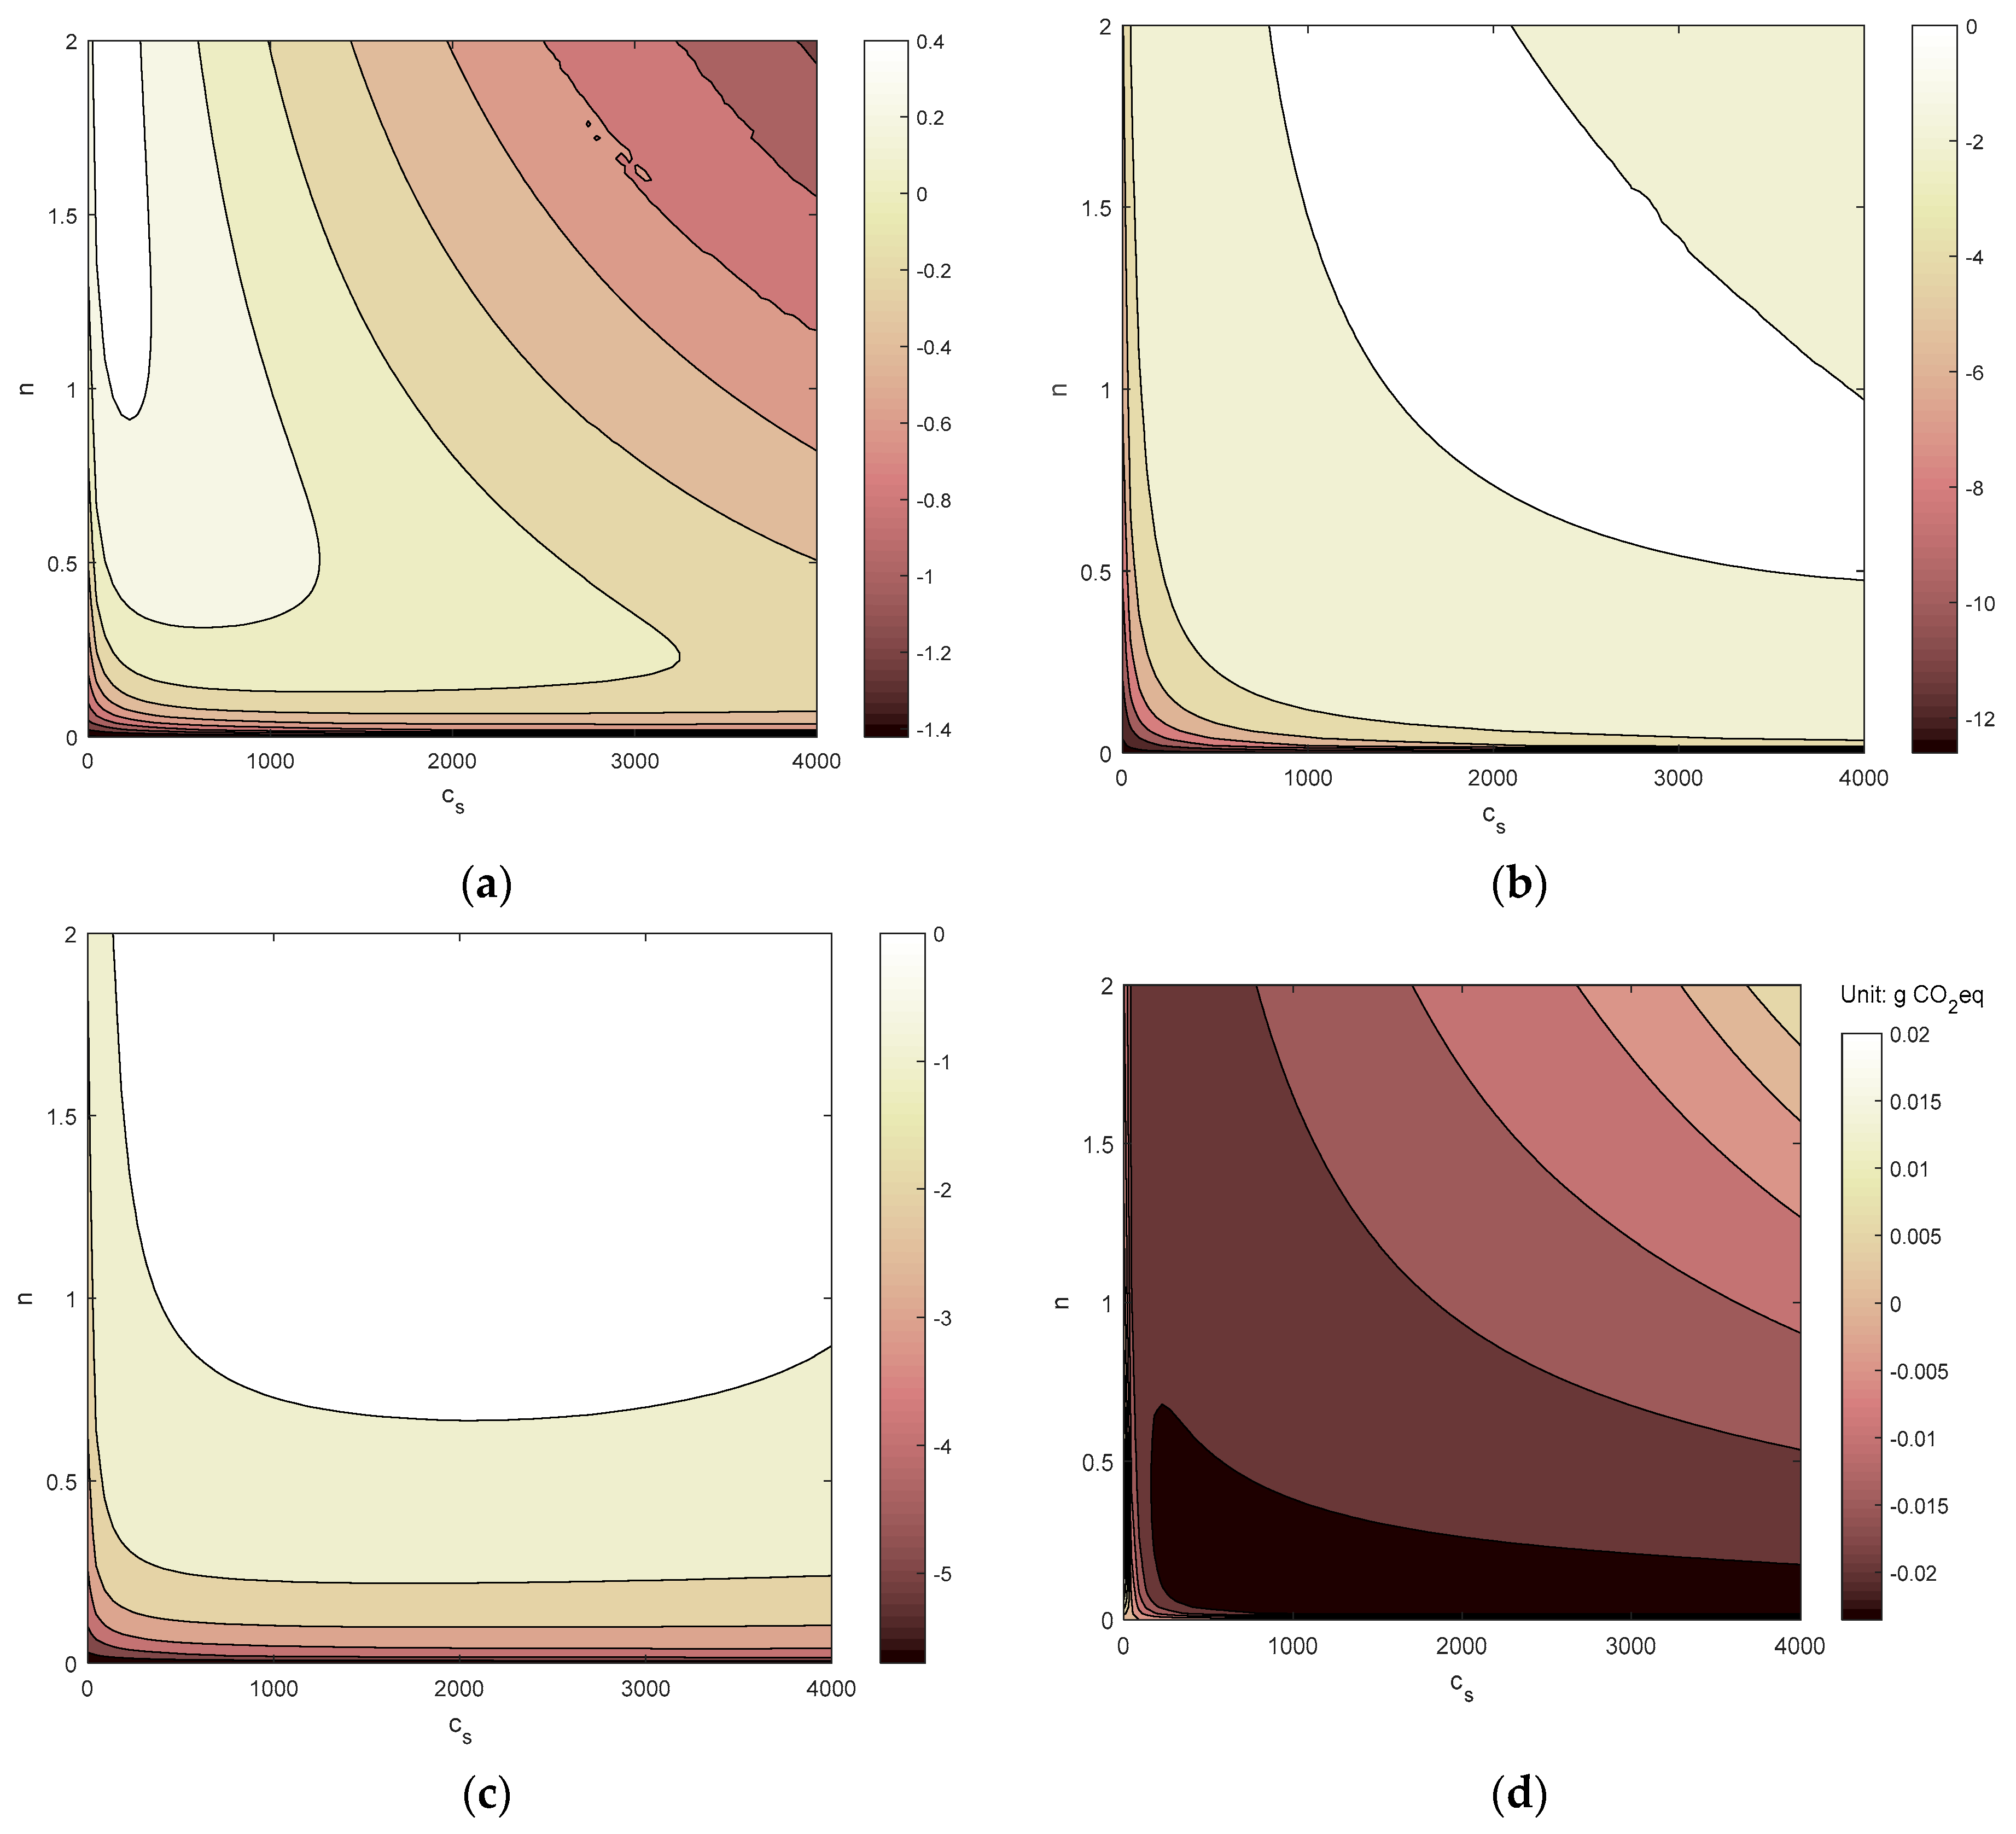
Figure 5 shows the relations between control parameters and different suspension performance indicators. The improvement of ride comfort is described by the negative improvement index of body vertical acceleration, as depicted in Figure 5a. Further analysis of tyre dynamic load and suspension deflection was needed to estimate the road holding performance. Figure 5b,c shows the improvement index of tyre dynamic load and suspension deflection at the front left wheel. For environmental benefit, Figure 5d depicts the WTW GHG emissions (negative value indicates reduction) of the electricity consumed by regenerative suspension (unit: g CO2eq) in 10 s.
As shown in Figure 5, high quality areas of different performance indicators vary with cs and cg (cg = −ncs). Careful selection of cs and cg was required to achieve a good compromise among ride comfort, road holding and environmental benefit. From Figure 5a,d, we find that small n benefitted the decrease of body vertical acceleration and WTW GHG emissions. Nevertheless, small n made a substantial increase of tyre dynamic load (Figure 5b) and suspension deflection (Figure 5c), which caused road holding performance deterioration and puts handling and safety at risk. Conversely, when road holding takes precedence, the control parameters cannot ensure the improvement of ride comfort and environmental benefit.
Consequently, it was necessary to classify the control parameters into two categories to meet different performance requirements. When a vehicle is at low velocity range, it is acceptable that the increases in tyre dynamic load and suspension deflection are in a suitable limit. Small cs and n can be selected for improving ride comfort. These control parameters are also beneficial to GHG emission reduction. When the vehicle travels at high velocity range, the vehicle road holding becomes worse. The decrease of tyre dynamic load will be given priority to ensure vehicle safety. From Figure 5, we conclude that large cs and n close to 0.5 was a more appropriate option to reconcile road-holding with ride comfort and environmental benefit. Therefore, when the control parameters were ride comfort based, cs was 2025 N s/m and n was set to be 0.32. When the control parameters were road holding based, cs and n were 3015 N s/m and 0.52, respectively.
The following paragraph explores the feasibility of the recommended control parameters in the frequency domain. The power spectrum density (PSD) of different suspension dynamic performance criteria for CPRC and CPRH was compared to the passive counterpart. From Figure 6a, we found that the magnitude of body vertical acceleration with CPRC decreased at almost all frequencies compared to that of the passive counterpart. For tyre dynamic load (Figure 6b) and suspension deflection (Figure 6c), the CPRC had smaller magnitudes at the frequency 1–4 Hz but larger magnitudes at the frequency around 10 Hz than passive suspension. Fortunately, the acceptable increases in suspension deflection and tyre dynamic load at the frequency around 10 Hz will not cause road holding performance to deterioration. When CPRH is employed, the magnitudes of all three dynamic performance criteria at the frequency 1–4 Hz were smaller than those of the passive suspension. In addition, at the frequency around 10 Hz, the CPRH also guaranteed results comparable to those of the passive counterpart. According to the above analysis, it can be confirmed that the selected control parameters were suitable.

3.2. A Case Study: WLTC and C Level Road in China 2016

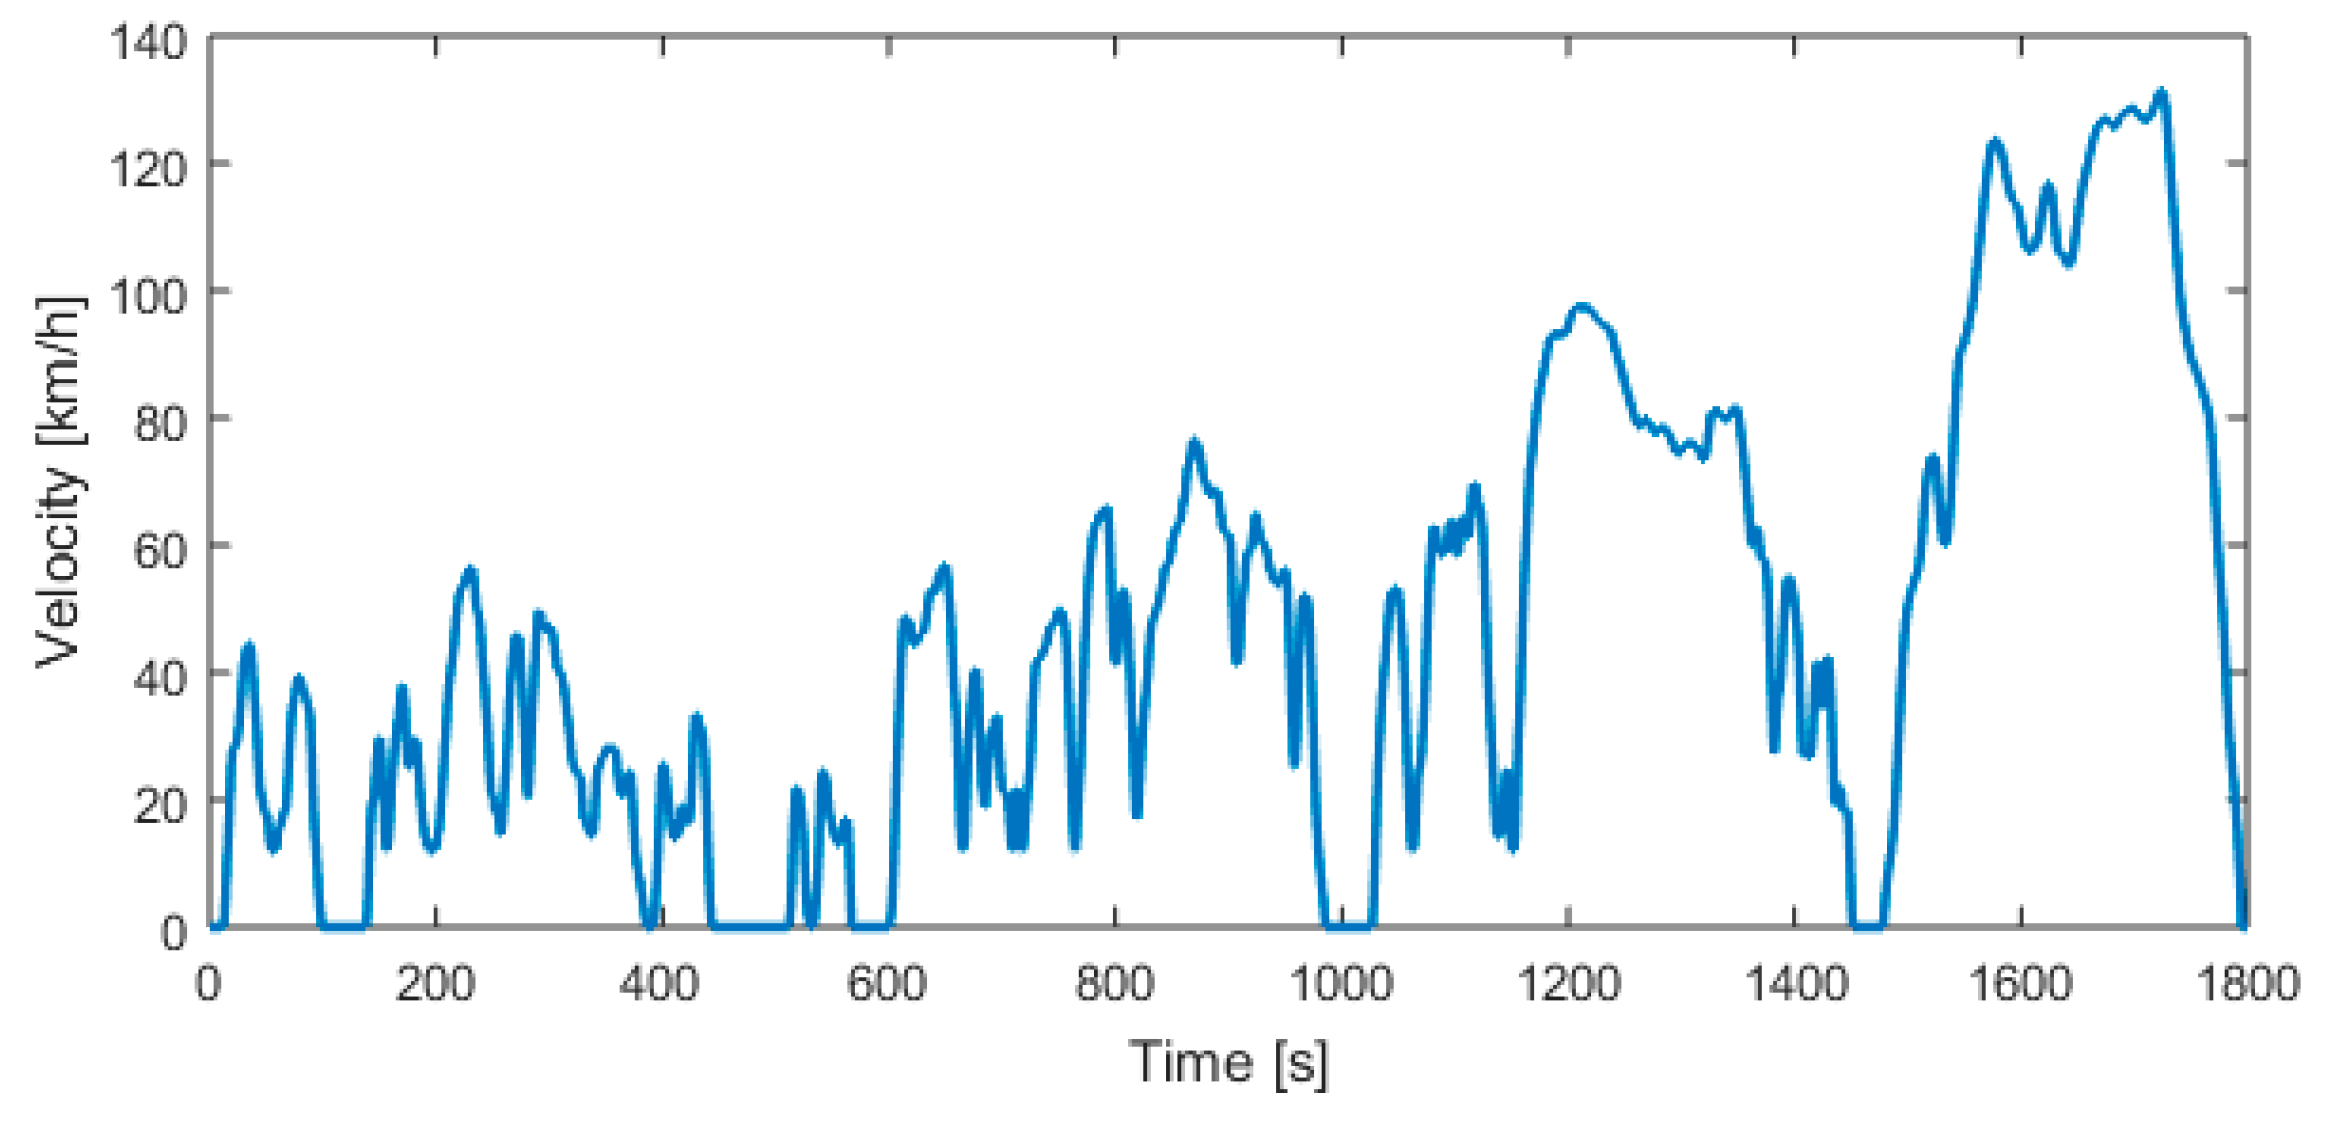
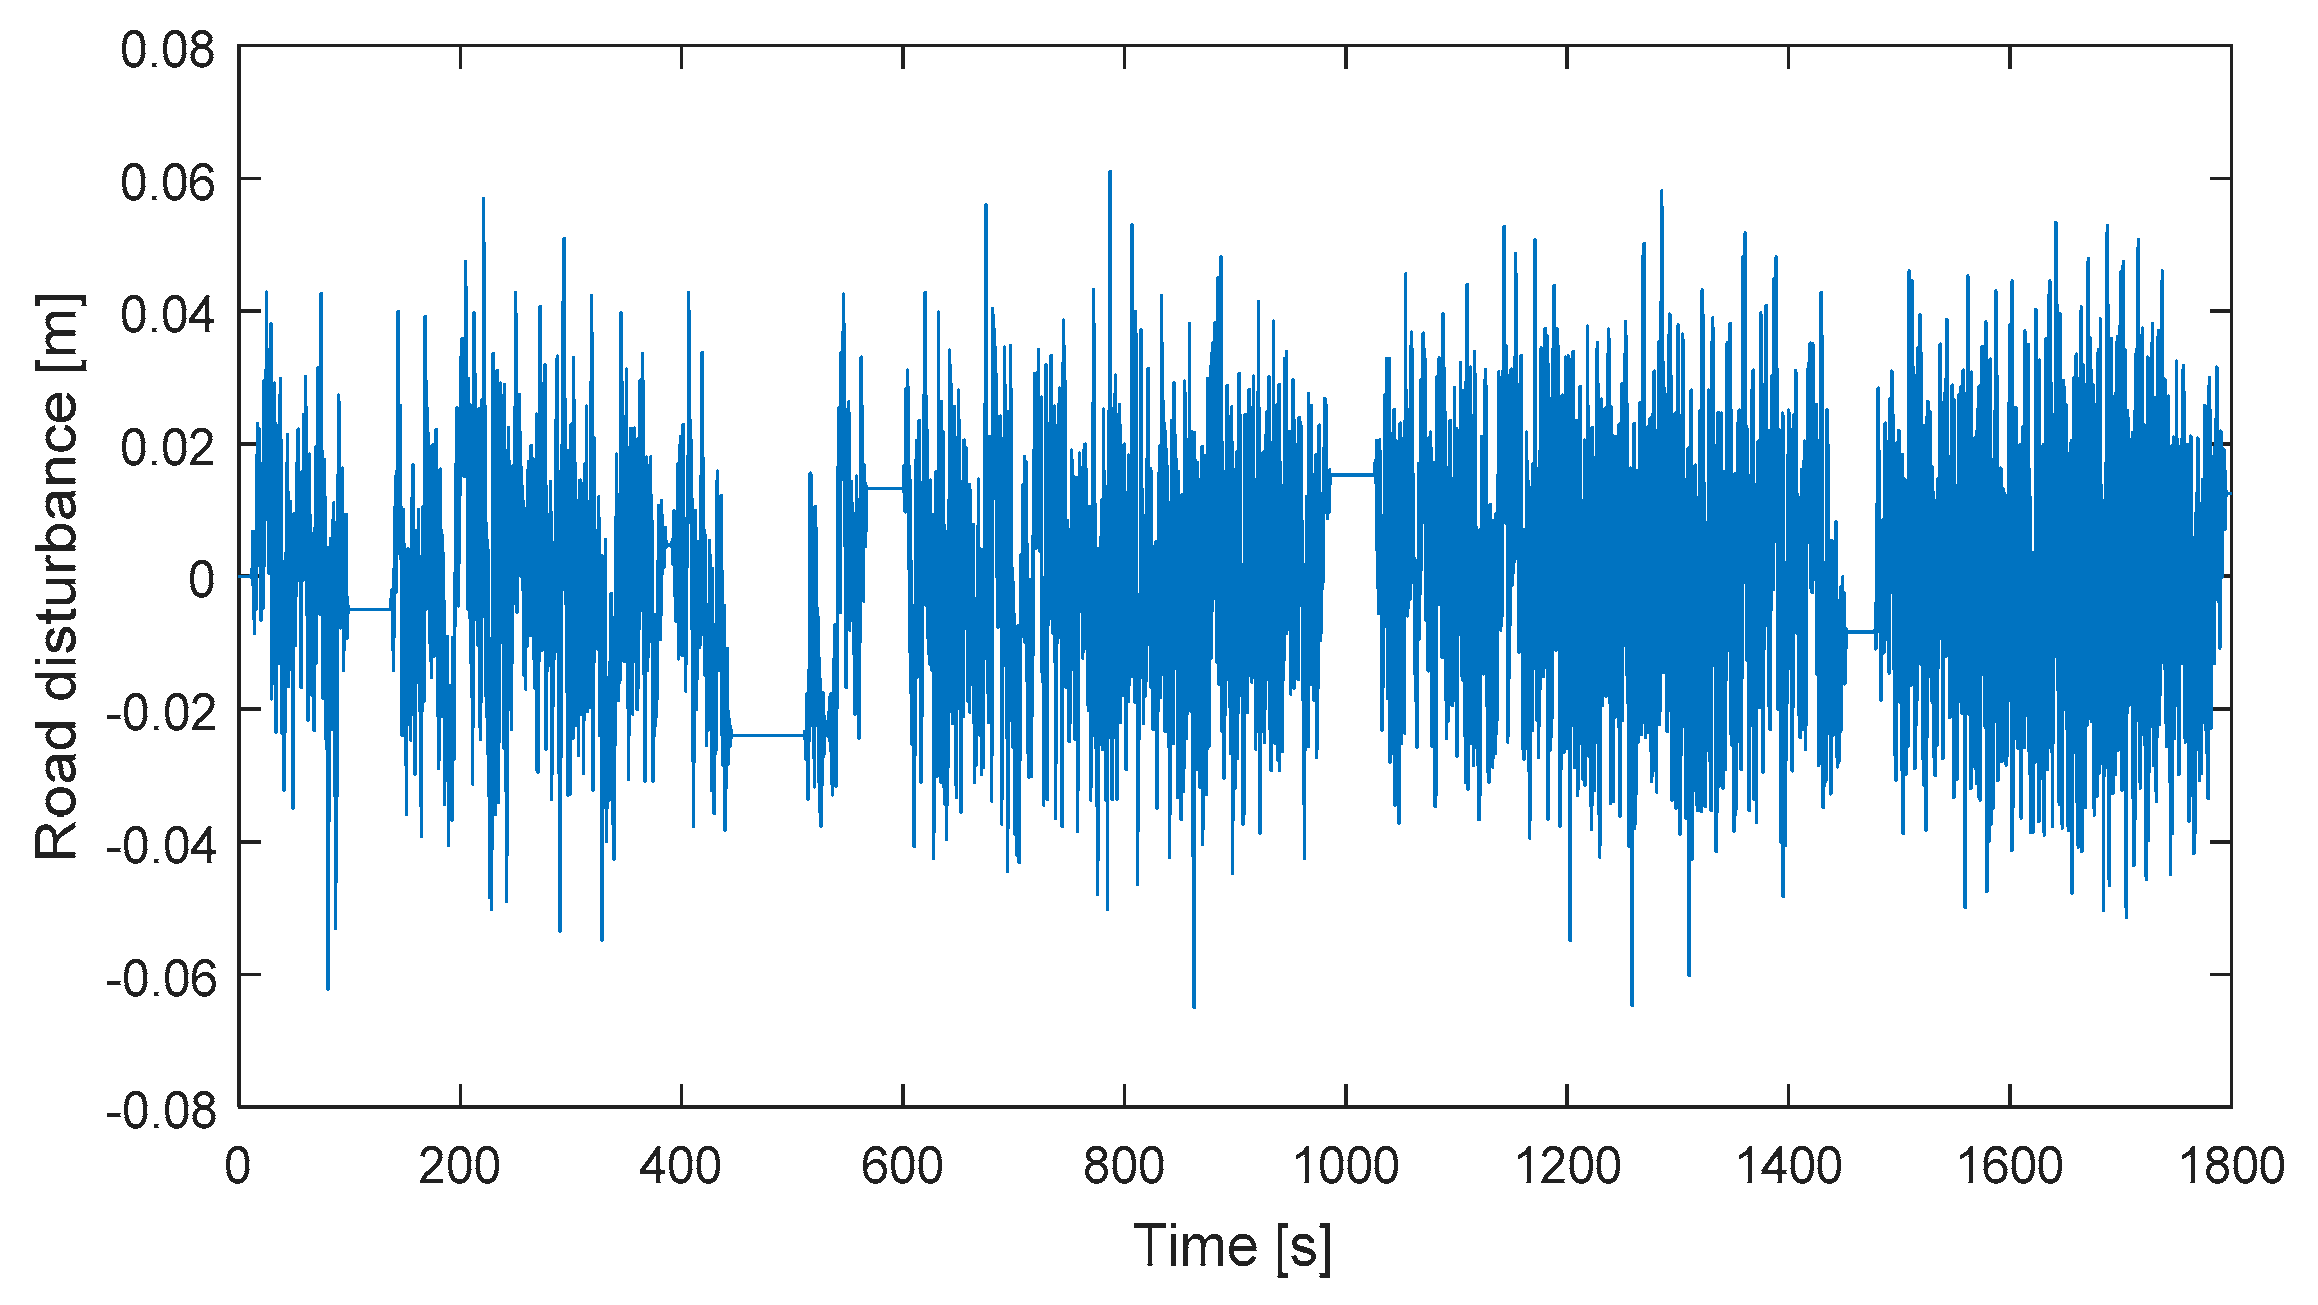
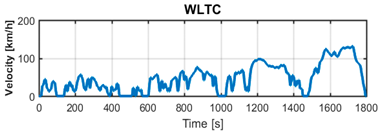
The following paragraphs present a specific case study using the worldwide harmonised light duty driving test cycle (WLTC) and a C level road in the context of China in 2016. The WLTC driving cycle (Figure 7) can better serve as a real-world driving situation [35] and was selected as the input of vehicle velocity. The vertical displacement input of a C level road was obtained by combining with the WLTC driving cycle, as shown in Figure 8. In the context of China in 2016, EF was 834.5 g CO2eq/kW h according to Reference [15].
In this case study, the vertical acceleration of the vehicle body and tyre dynamic load, representative characteristics of ride comfort and road holding, were investigated. As described by Figure 9, we compared the time responses of regenerative suspension to the passive counterpart. Meanwhile, the negative and positive value for mode represent the control mode using CPRC and CPRH, respectively. From Figure 9 and Table 4, we found that ride comfort was significantly improved prior to the control mode switching. During the control mode using CPRC, a decrease of 29.33% in vehicle body vertical acceleration was realized, however, tire dynamic load increased by 30.8%. That is acceptable for low speed driving but dangerous for high speed driving. After the control mode switching, the suspension with CPRH made the road holding performance comparable to that of the passive counterpart, as well as the vehicle body vertical acceleration drop slightly.
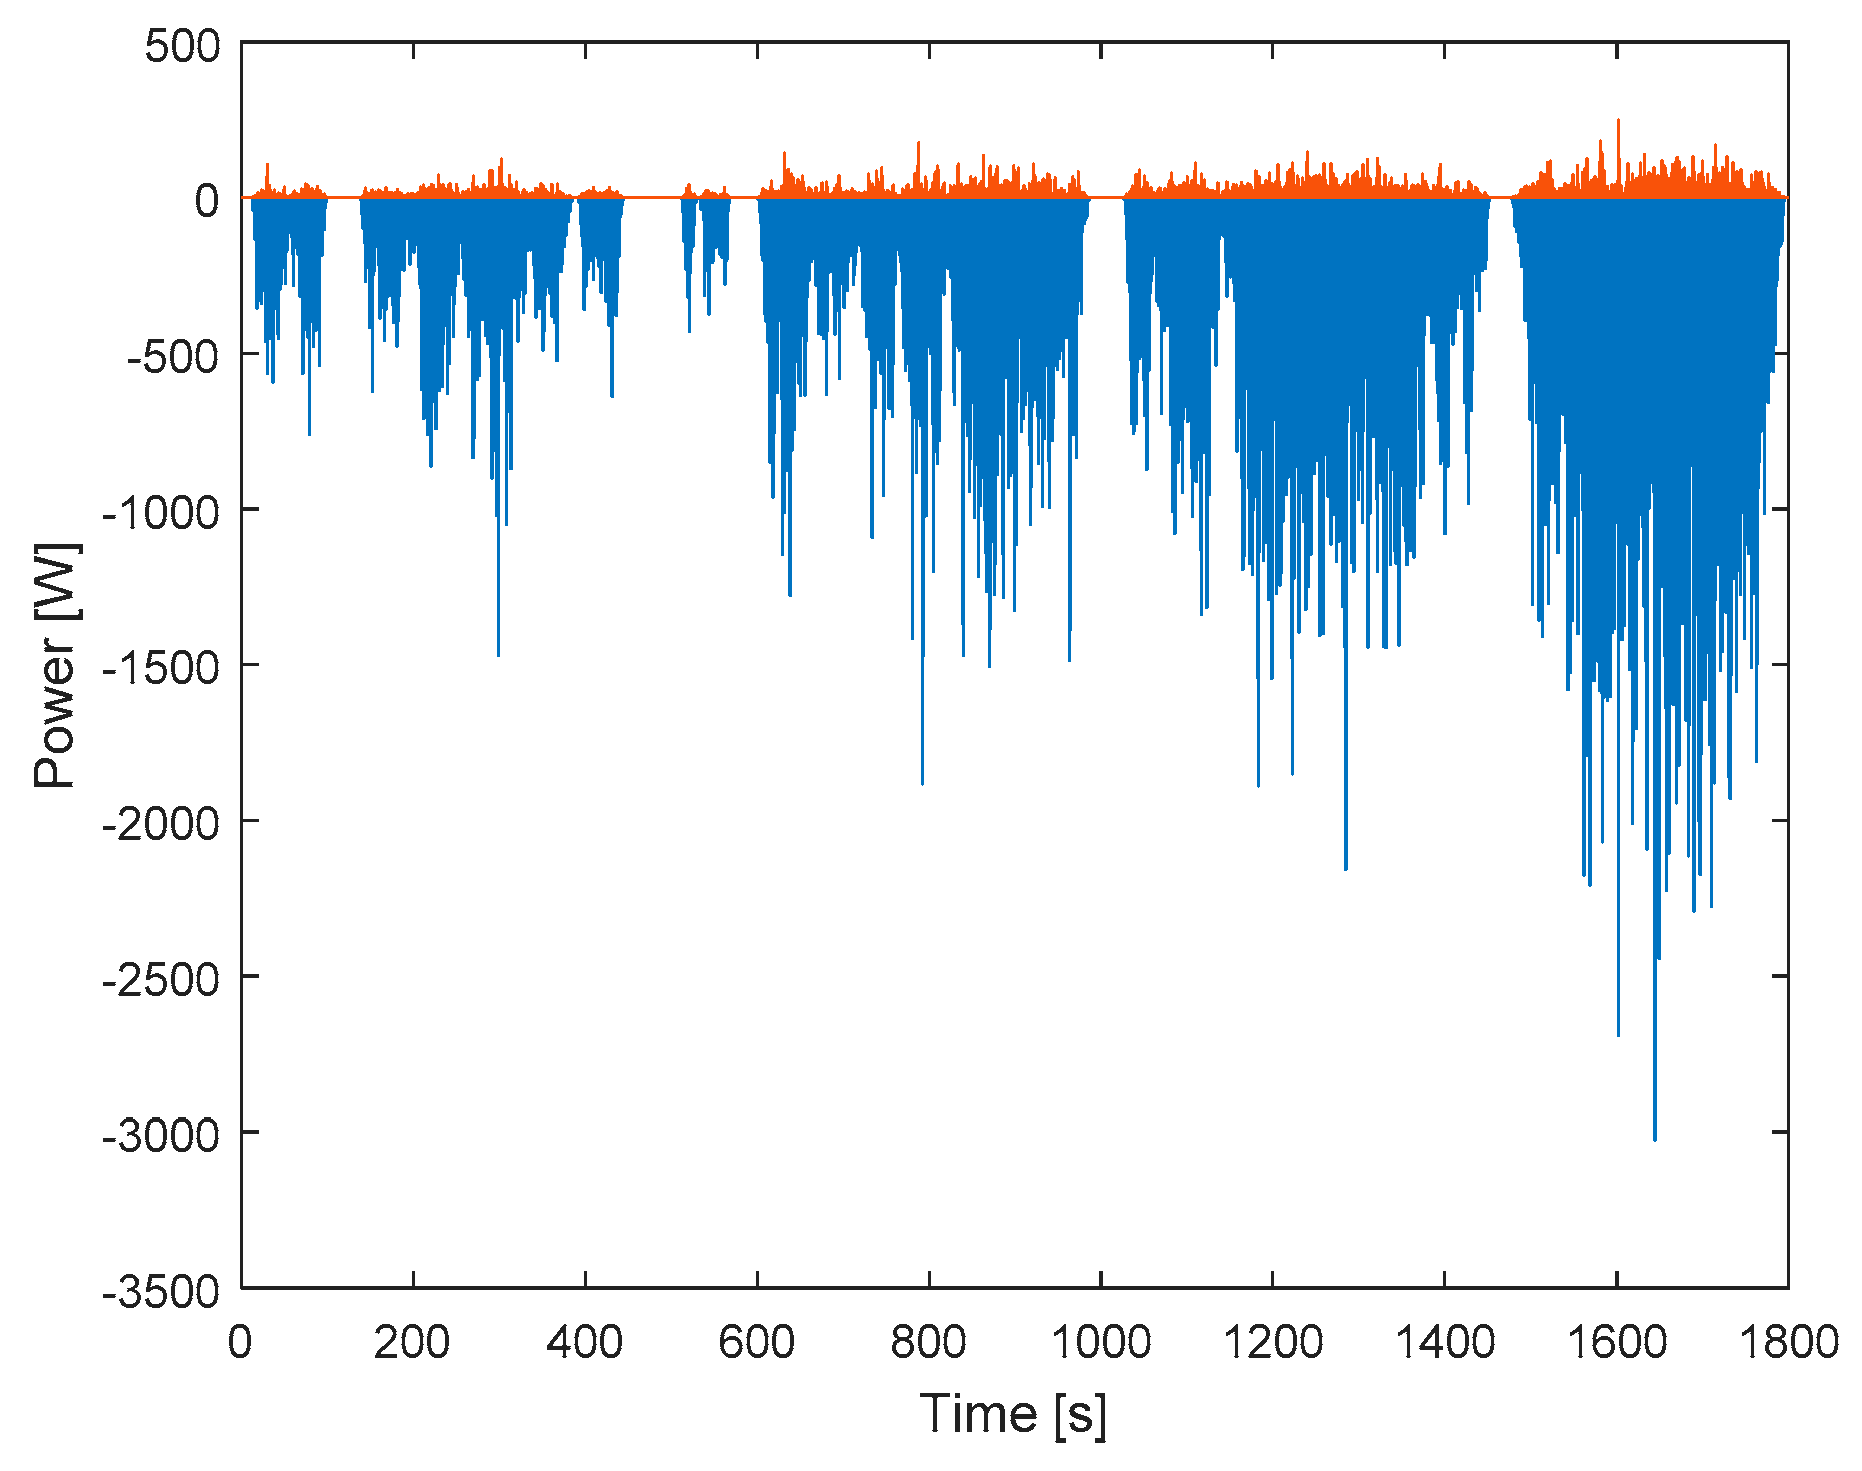
In order to investigate the environmental benefit of the recommended suspension control parameters, we also explored the detailed power of regenerative suspension and the WTW GHG emissions of the electricity consumed by regenerative suspension. As shown in Figure 10, negative power occupied almost all time ranges. At negative power moments, the suspension vibration energy is converted into electricity, which facilitates the reduction of GHG emissions. Figure 11 describes WTW GHG emissions from electricity consumed by regenerative suspension. For general passive suspension widely used in a light-duty BEV, the WTW GHG emissions from its energy consumption is 0 g CO2 eq, which can be regarded as a base value. But for regenerative suspension, as shown in Figure 11, it can help each light-duty BEV (Nissan Leaf in this study) to reduce GHG emissions up to nearly 31 g CO2 eq (negative value means reduction) in the whole WLTC.

3.3. Comparison Study of Different Cases

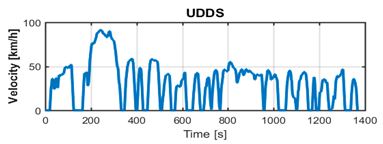
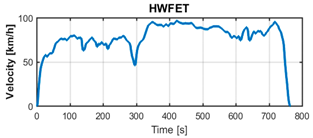
We also analysed the environmental benefit from the recommended suspension control parameters in more various cases besides the case in Section 3.2. These cases were generated by the combinations of different driving cycles and road levels. The driving cycles included the Urban Dynamometer Driving Schedule (UDDS), the Highway Fuel Economy Test Cycle (HWFET) and the New European Driving Cycle (NEDC) besides WLTC. The road levels included A, B, C and D.
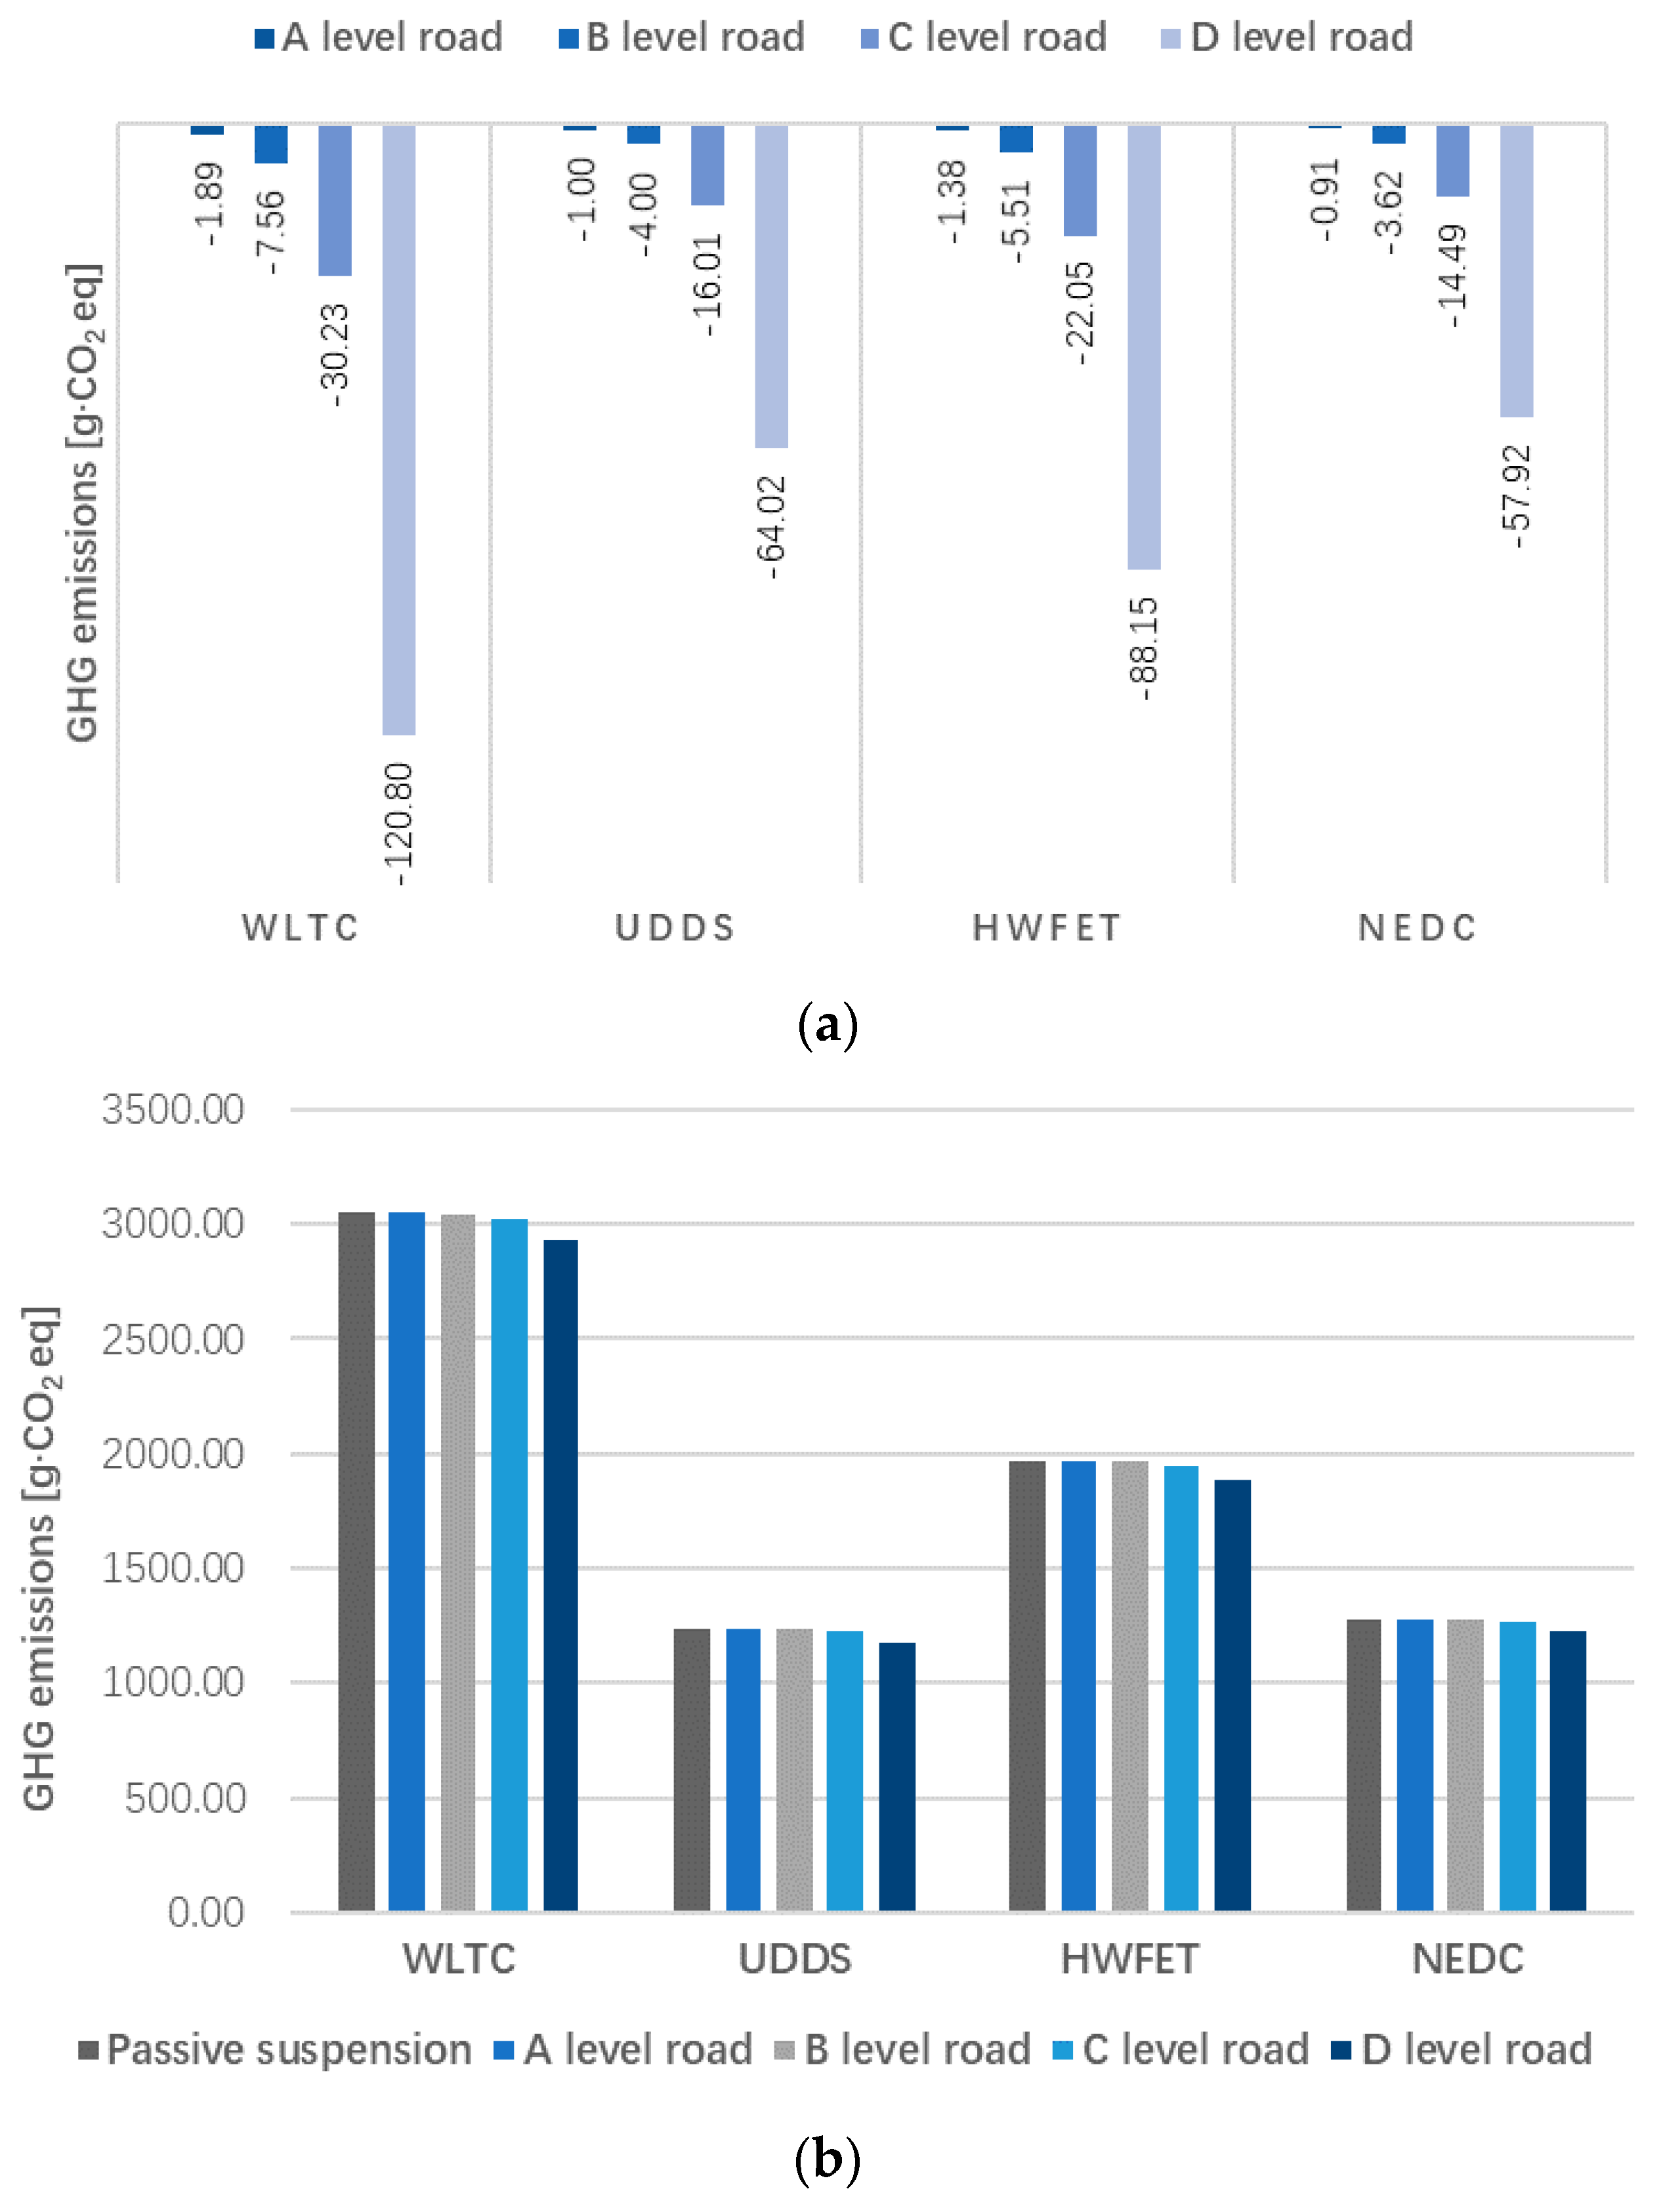
First of all, in the context of China 2016, the cases concerning different driving cycles and road levels are discussed. The detailed combinations of driving cycles and road levels in these cases are shown in Table 5. The results of various cases are illustrated in Figure 12 for comparison. Figure 12a describes the GHG emission reduction achieved by regenerative suspension, and Figure 12b compares the WTW GHG emissions for each light-duty BEV using regenerative suspension and each light-duty BEV using passive suspension. It was found that the GHG emission reduction caused by regenerative suspension on the A level road was much lower than that on the D level road (Figure 12a), and there was a similar trend for the carbon mitigation benefit to the whole light-duty BEV (Figure 12b). In addition, since WLTC has a longer driving distance than the other three kinds of driving cycles, it is reasonable to calculate the WTW GHG emission reduction per kilometre to represent the carbon mitigation benefit of regenerative suspension. On the D level road, the largest GHG emission reduction in these four kinds of road roughness inputs, the WTW GHG emission reduction per kilometre for each light-duty BEV in WLTC, UDDS, HWFET, and NEDC was 5.19 g CO2eq, 5.34 g CO2eq, 5.34 g CO2eq and 5.25 g CO2eq respectively, accounting for about 4.5% of the total GHG emissions per light-duty BEV.
Furthermore, we explored the GHG emission reduction achieved by regenerative suspension under different country contexts. Figure 13 shows that there was a growing trend towards the GHG emission mitigation potential (on the D level road) from Europe (2014) to Australia (2009). This was mainly due to the increase of the GHG intensity of the electricity grid from Europe’s 600 g CO2eq/kW h in 2014 [36] to Australia’s 1048 g CO2eq/kW h in 2009 [35] (the US in 2014: 623 g CO2eq/kW h [37]; China in 2016: 834.5 g CO2eq/kW h [15]). These findings demonstrate that regenerative suspension (whose control design considers WTW analysis) especially contributes to the GHG emission mitigation of the countries with high-carbon intensity power structures.

4. Discussion and Conclusion

In this study, the impacts of regenerative suspension, whose control design considers WTW analysis, on WTW GHG emissions of a light-duty BEV were researched. We first analysed and modelled the WTW GHG emissions of a light-duty BEV employing regenerative suspension.
Based on the models we conducted the control design of regenerative suspension coupled with the LCA method. The effects of suspension control parameters on GHG emissions and vehicle dynamic performance were analysed, especially the relation between suspension control parameters and GHG emissions was obtained. In order to achieve the trade-off among ride comfort, road holding performance and GHG emissions, suspension control parameters were classified into two types (CPRC and CPRH). Furthermore, we extended the existing decision rules of these two types of control parameters with a consideration of the switch from CPRH to CPRC (and from CPRC to CPRH) during the operation.
To explore the GHG emission reduction potential of regenerative suspension, we conducted a case study. A specific case study with WLTC and a C level road in the context of China in 2016 was investigated. We found that the WTW GHG emissions from a light-duty BEV can be decreased with regenerative suspension utilized, and the ride comfort and road holding performances were also improved compared with a passive suspension. Moreover, comparison study of different cases was further conducted. We found that regenerative suspension helps to reduce the GHG emissions about 4.5% of the total GHG emissions per light-duty BEV on a D level road, and there was a growing trend towards the GHG emission mitigation potential with a rougher road and higher carbon intensity of electricity grid.
These findings extend the path to reducing GHG emissions from a BEV, confirming that using regenerative suspension in a BEV tends to be an effective way to achieve carbon mitigation. Besides China, these findings especially benefit the countries heavily dependent on coal power, such as Australia or India. In addition, considering well-to-wheels analysis in the control design of regenerative suspension extends the LCA method from the identification of environmental hot-spots to vehicle control design, which may provide a new insight for applying the LCA method in vehicle design stage.
Further research is recommended to explore the impacts of regenerative suspension on GHG emissions of a BEV considering other life cycle phases, such as vehicle production. In addition, real car experiments to test the effectiveness of the control is needed.

Author Contributions

Conceptualization, X.H.; funding acquisition, L.G.; investigation, X.H. and Q.L.; methodology, X.H. and J.S.; writing—original draft, X.H.; writing—review and editing, J.S. and Y.C.

Funding

This research received no external funding.

Acknowledgments

This work was funded by the Noise and Vibration Control Centre at Beijing Institute of Technology. The authors would like to thank the reviewers for their precious reviews and comments.

Conflicts of Interest

The authors declare no conflict of interest.

References

  1. Wu, Z.; Wang, M.; Zheng, J.; Sun, X.; Zhao, M.; Wang, X. Life cycle greenhouse gas emission reduction potential of battery electric vehicle. J. Clean. Prod. 2018, 190, 462–470. [Google Scholar] [CrossRef]
  2. Wang, D.; Zamel, N.; Jiao, K.; Zhou, Y.; Yu, S.; Du, Q.; Yin, Y. Life cycle analysis of internal combustion engine, electric and fuel cell vehicles for China. Energy 2013, 59, 402–412. [Google Scholar] [CrossRef]
  3. Li, N.; Zhang, J.; Zhang, S.; Hou, X.; Liu, Y. The influence of accessory energy consumption on evaluation method of braking energy recovery contribution rate. Energy Convers. Manag. 2018, 166, 545–555. [Google Scholar] [CrossRef]
  4. Múčka, P. Energy-harvesting potential of automobile suspension. Veh. Syst. Dyn. 2016, 54, 1651–1670. [Google Scholar] [CrossRef]
  5. Zhang, Y.; Guo, K.; Wang, D.; Chen, C.; Li, X. Energy conversion mechanism and regenerative potential of vehicle suspensions. Energy 2016, 119, 961–970. [Google Scholar] [CrossRef]
  6. Audi’s New Suspension Tech Can Generate Electricity From Movement. 2016. Available online: https://www.cnet.com/roadshow/news/audis-new-suspension-tech-can-generate-electricity-from-movement/ (accessed on 11 August 2016).
  7. Karnopp, D. Permanent magnet linear motors used as variable mechanical dampers for vehicle suspensions. Veh. Syst. Dyn. 1989, 18, 187–200. [Google Scholar] [CrossRef]
  8. Suda, Y.; Nakadai, S.; Nakano, K. Hybrid suspension system with skyhook control and energy regeneration (Development of self-powered active suspension). Veh. Syst. Dyn. 1998, 29, 619–634. [Google Scholar] [CrossRef]
  9. Zuo, L.; Scully, B.; Shestani, J.; Zhou, Y. Design and characterization of an electromagnetic energy harvester for vehicle suspensions. Smart Mater. Struct. 2010, 19, 1007–1016. [Google Scholar] [CrossRef]
  10. Montazeri-Gh, M.; Soleymani, M. Investigation of the energy regeneration of active suspension system in hybrid electric vehicles. IEEE Trans. Ind. Electron. 2010, 57, 918–925. [Google Scholar] [CrossRef]
  11. Shi, D.; Pisu, P.; Chen, L.; Wang, S.; Wang, R. Control design and fuel economy investigation of power split HEV with energy regeneration of suspension. Appl. Energy 2016, 182, 576–589. [Google Scholar] [CrossRef]
  12. Pham, T.H.; Jacob, J.; Wilkins, S.; Lauwerys, C.; Dhaenset, M. Integrated model for battery Electric Vehicles with energy harvesting active suspension system. In Proceedings of the Twelfth International Conference on Ecological Vehicles and Renewable Energies, IEEE, Monte Carlo, Monaco, 11–13 April 2017. [Google Scholar] [CrossRef]
  13. Zhang, Z.; Zhang, X.; Chen, W.; Rasim, Y.; Salman, W.; Pan, H.; Yuan, Y.; Wang, C. A high-efficiency energy regenerative shock absorber using supercapacitors for renewable energy applications in range extended electric vehicle. Appl. Energy 2016, 178, 177–188. [Google Scholar] [CrossRef]
  14. Hawkins, T.R.; Singh, B.; Majeau-Bettez, G.; Strømman, A.H. Comparative environmental life cycle assessment of conventional and electric vehicles. J. Ind. Ecol. 2012, 17, 53–64. [Google Scholar] [CrossRef]
  15. Qiao, Q.; Zhao, F.; Liu, Z.; Jiang, S.; Hao, H. Cradle-to-gate greenhouse gas emissions of battery electric and internal combustion engine vehicles in China. Appl. Energy 2017, 204, 1399–1411. [Google Scholar] [CrossRef]
  16. Yuan, X.; Li, L.; Gou, H.; Dong, T. Energy and environmental impact of battery electric vehicle range in China. Appl. Energy 2015, 157, 75–84. [Google Scholar] [CrossRef]
  17. Lewis, A.M.; Kelly, J.C.; Keoleian, G.A. Vehicle lightweighting vs. electrification: Life cycle energy and GHG emissions results for diverse powertrain vehicles. Appl. Energy 2014, 126, 13–20. [Google Scholar] [CrossRef]
  18. Zackrisson, M.; Avellán, L.; Orlenius, J. Life cycle assessment of lithium-ion batteries for plug-in hybrid electric vehicles—Critical issues. J. Clean. Prod. 2010, 18, 1519–1529. [Google Scholar] [CrossRef]
  19. Lee, D.Y.; Thomas, V.M. Parametric modeling approach for economic and environmental life cycle assessment of medium-duty truck electrification. J. Clean. Prod. 2017, 142, 3300–3321. [Google Scholar] [CrossRef] [Green Version]
  20. Miller, I.; Gencer, E.; Vogelbaum, H.S.; Brown, P.R.; Torkamani, S.; O’Sullivan, F.M. Parametric modeling of life cycle greenhouse gas emissions from photovoltaic power. Appl. Energy 2019, 238, 760–774. [Google Scholar] [CrossRef]
  21. Yao, Y.; Huang, R. A Parametric life cycle modeling framework for identifying research development priorities of emerging technologies: A case study of additive manufacturing. In Proceedings of the 26th CIRP Conference on Life Cycle Engineering (LCE) Purdue University, West Lafayette, IN, USA, 7–9 May 2019. [Google Scholar]
  22. Niero, M.; Di Felice, F.; Ren, J.; Manzardo, A.; Scipioni, A. How can a life cycle inventory parametric model streamline life cycle assessment in the wooden pallet sector. Int J. Life Cycle Assess. 2014, 19, 901–918. [Google Scholar] [CrossRef]
  23. Intergovernmental Panel on Climate Change (IPCC). Fourth Assessment Report (AR4), Working Group 1 (WG1), Chapter 2, Changes in Atmospheric Constituents and in Radiative Forcing, Table 2.14, page 212. 2007. Available online: https://www.ipcc.ch/report/ar4/syr/ (accessed on 30 May 2019).
  24. Khaligh, A.; Li, Z. Battery, ultracapacitor, fuel cell, and hybrid energy storage systems for electric, hybrid electric, fuel cell, and plug-in hybrid electric vehicles: state of the art. IEEE Trans. Veh. Technol. 2010, 59, 2806–2814. [Google Scholar] [CrossRef]
  25. Fiori, C.; Ahn, K.; Rakha, H.A. Power-based electric vehicle energy consumption model: Model development and validation. Appl. Energy 2016, 168, 257–268. [Google Scholar] [CrossRef]
  26. GB/T 7031-2005/ISO 8086:1995. Mechanical vibration-road surface profiles—Reporting of measured data.
  27. Wu, Z.; Chen, S.; Yang, L.; Zhang, B. Model of road roughness in time domain based on rational function. Trans. Beijing Inst. Tech. 2009, 29, 795–798. [Google Scholar]
  28. Nakano, K. Combined type self-powered active vibration control of truck cabins. Veh. Syst. Dyn. 2004, 41, 449–473. [Google Scholar] [CrossRef]
  29. De Gennaro, M.; Paffumi, E.; Martini, G.; Manfredi, U.; Vianelli, S.; Ortenzi, F.; Genovese, N. Experimental test campaign on a battery electric vehicle: Laboratory test results (Part 1). SAE Int. J. Altern. Powertrains 2015, 4, 100–114. [Google Scholar] [CrossRef]
  30. Rakha, H.A.; Ahn, K.; Moran, K.; Saerens, B.; Van den Bulck, E. Virginia tech comprehensive power-based fuel consumption model: Model development and testing. Transport. Res. Part D Transp. Environ. 2011, 16, 492–503. [Google Scholar] [CrossRef]
  31. SAE International. Nissan Leaf Vehicle Overview; SAE International: Warrendale, PA, USA, 2011. [Google Scholar]
  32. Rydh, C.J.; Sandén, B.A. Energy analysis of batteries in photovoltaic systems. Part I: Performance and energy requirements. Energy Convers. Manag. 2005, 46, 1957–1979. [Google Scholar] [CrossRef]
  33. Szadkowski, B.; Chrzan, P.J.; Roye, D. A study of energy requirements for electric and hybrid vehicles in cities. In Proceedings of the 2003 International Conference on Clean, Efficient and Safe Urban Transport, Gdansk, Poland, 4–6 June 2003. [Google Scholar]
  34. Suda, Y.; Suematsu, K.; Nakano, K.; Taichi, S. Study on electromagnetic suspension for automobiles-simulations and experiments of performance. In Proceedings of the 5th International Symposium on Advanced Vehicle Control, Ann Arbor, Michigan, USA, 22–24 August 2000; pp. 699–704. [Google Scholar]
  35. Wolfram, P.; Wiedmann, T. Electrifying Australian transport: Hybrid life cycle analysis of a transition to electric light-duty vehicles and renewable electricity. Appl. Energy 2017, 206, 531–540. [Google Scholar] [CrossRef] [Green Version]
  36. Bauer, C.; Hofer, J.; Althaus, H.J.; Del Duce, A.; Simons, A. The environmental performance of current and future passenger vehicles: Life cycle assessment based on a novel scenario analysis framework. Appl. Energy 2015, 157, 871–883. [Google Scholar] [CrossRef]
  37. Miotti, M.; Supran, G.J.; Kim, E.J.; Trancik, J.E. Personal vehicles evaluated against climate change mitigation targets. Environ. Sci. Technol. 2016, 50, 10795–10804. [Google Scholar] [CrossRef]
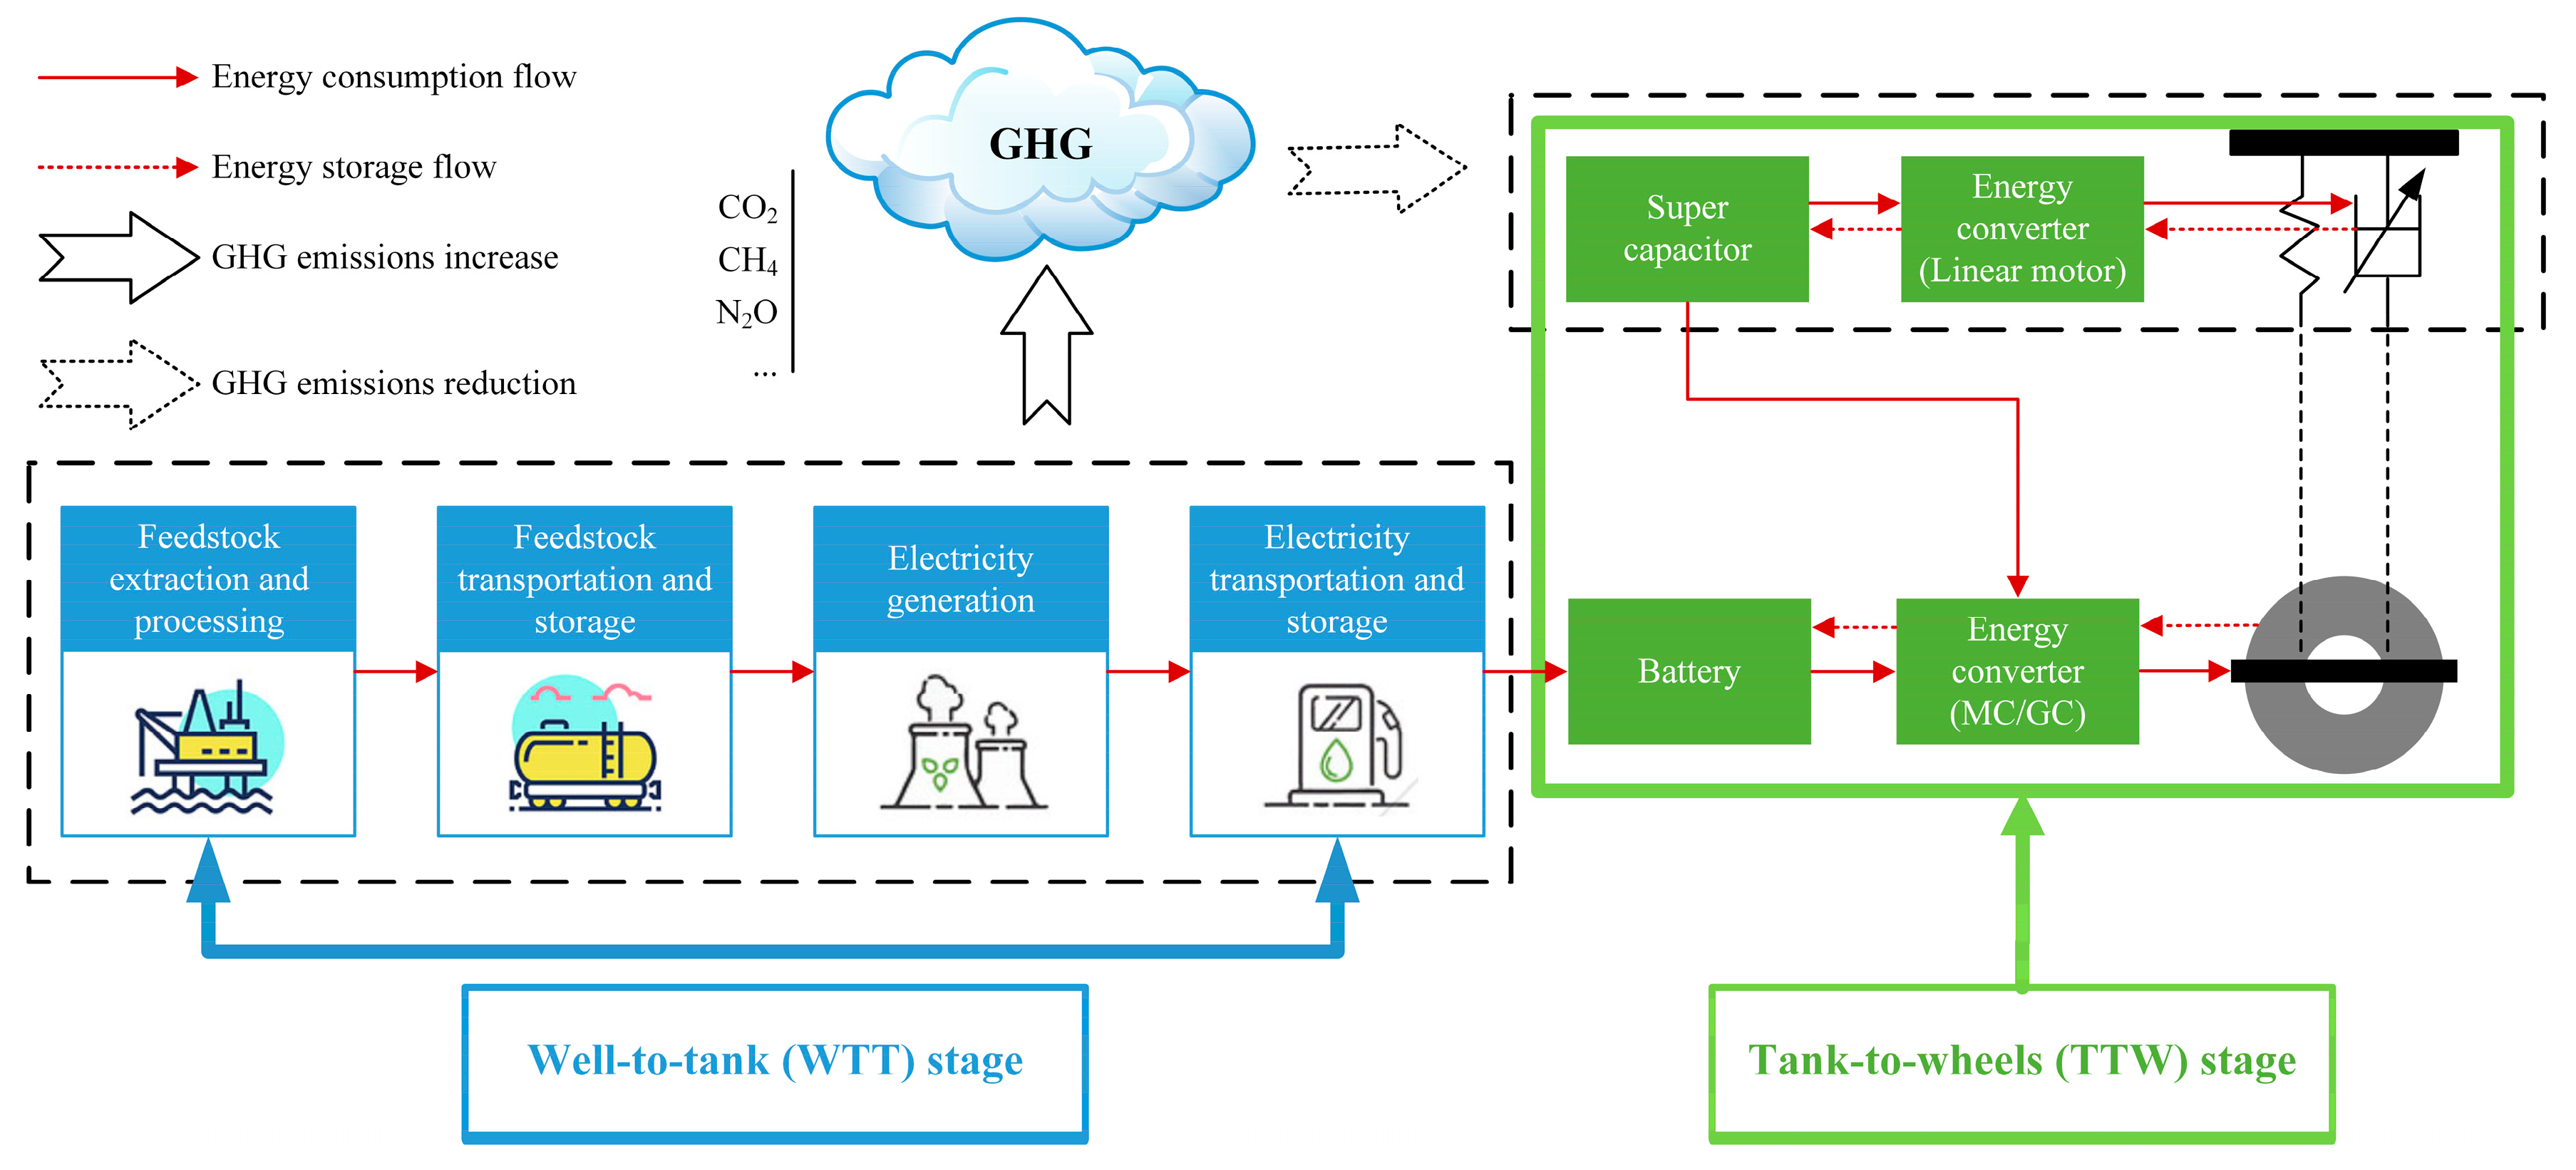
Figure 1. Well-to-wheels (WTW) greenhouse gas (GHG) emissions of a battery electric vehicles (BEV) using regenerative suspension.
Energies 12 02594 g001
Figure 2. Full vehicle model of regenerative suspension.
Energies 12 02594 g002
Figure 3. Equivalent circuit of the DC motor.
Energies 12 02594 g003
Figure 4. Control scheme of regenerative suspension.
Energies 12 02594 g004
Figure 5. The relations between control parameters and different suspension performance criteria with regenerative suspension compared with passive suspension. (a) Vertical acceleration of the vehicle body; (b) tyre dynamic load at the front left wheel; (c) suspension deflection at the front left wheel; (d) WTW GHG emissions of the electricity consumed by regenerative suspension.
Energies 12 02594 g005
Figure 6. The power spectrum density (PSD) of different suspension dynamic performance criteria. (a) Vertical acceleration of the vehicle body; (b) tyre dynamic load at the front left wheel; (c) suspension deflection at the front left wheel.
Energies 12 02594 g006
Figure 7. Worldwide harmonised light duty driving test cycle (WLTC) driving cycle.
Energies 12 02594 g007
Figure 8. The C level road input coupled with WLTC.
Energies 12 02594 g008
Figure 9. The time responses of regenerative suspension and passive counterpart. (a) Vertical acceleration of the vehicle body; (b) tyre dynamic load.
Energies 12 02594 g009
Figure 10. Power of regenerative suspension.
Energies 12 02594 g010
Figure 11. WTW GHG emissions from electricity consumed by regenerative suspension.
Energies 12 02594 g011
Figure 12. Comparative results for different cases. (a) Suspension GHG emission reduction; (b) WTW GHG emissions of a light-duty BEV.
Energies 12 02594 g012
Figure 13. WTW GHG emission reduction from regenerative suspension under different country contexts.
Energies 12 02594 g013
Table 1. Classification standard of road levels A–D.
LevelDegree of Roughness Gq(n0) (10−6m2/m−1) n0 = 0.1 m−1
Lower LimitGeometric MeanUpper Limit
A81632
B3264128
C128256512
D51210242048
Table 2. Vehicle model parameters. 1 i = A, B, C, D.
PowertrainRegenerative Suspension
ParameterValueParameterValue
m1521 kgmb1398 kg
g9.8066 m/s2 [25]Ip2240 kg·m2
Cr1.75 [25]Ir380 kg·m2
c10.0328 [25]mwA/mwB40.5 kg
c24.575 [25]mwC/mwD45.4 kg
ρAir1.2256 kg/m3 [29]ksA/ksB17 kN/m
Af2.3316 m2 [29]ksC/ksD22 kN/m
CD0.28 [29]kti1192 kN/m
ηDriveline92% [30]lf1.25 m
ηElectric_motor91% [25,31]lr1.51 m
ηBattery90% [32]Bf/Br1.48 m
PAuxiliary700 W [33]ϕ120 N·A [34]
r2 Ω [34]
Table 3. The baseline of performance improvement.
IndicatorBaseline
RMS value of body vertical acceleration (m/s2)0.64
RMS value of tyre dynamic load (N)416.48
RMS value of suspension deflection (m)0.0065
WTW GHG emissions (g CO2eq)0
Table 4. Comparison of dynamic performance improvement before and after the mode switching.
IndicatorBefore Switching (%)After Switching (%)
Body vertical acceleration29.335.96
Tyre dynamic load−30.800.80
Table 5. Different cases of driving cycles and road levels.
CaseDriving CycleRoad Level
1 Energies 12 02594 i001A
2B
3C
4D
5 Energies 12 02594 i002A
6B
7C
8D
9 Energies 12 02594 i003A
10B
11C
12D
13 Energies 12 02594 i004A
14B
15C
16D