Article

Modelling Energy Consumption and Energy-Saving in High-Quality Olive Oil Decanter Centrifuge: Numerical Study and Experimental Validation

1
Department of Agricultural and Environmental Science, University of Bari Aldo Moro, Via Amendola 165/A, 70126 Bari, Italy
2
Department of Agriculture, Environment and Food, University of Molise, Via De Sanctis. n.c., 86100 Campobasso, Italy
3
Department of Biosciences and Territory, University of Molise, C.da Fonte Lappone, 86100 Pesche (IS), Italy
4
Department of Soil, Plant and Food Sciences, Food Science and Technology section, University of Bari Aldo Moro, Via Amendola 165/A, 70126 Bari, Italy
*
Author to whom correspondence should be addressed.
Energies 2019, 12(13), 2592; https://doi.org/10.3390/en12132592
Submission received: 11 May 2019 / Revised: 25 June 2019 / Accepted: 1 July 2019 / Published: 5 July 2019
(This article belongs to the Section F: Electrical Engineering)

Abstract

:
In this study, an energy consumption model of a decanter centrifuge was proposed, in particular for a technologically evolved machine equipped with an electromechanical recovery system. This model should be suitably coupled with an auto-adaptive controlling technique used to accurately manage the olive oil process. To achieve this goal, a solid physical and theoretical basis that simple to implement is required. To date there have only been limited scientific studies modelling energy consumption applied to the machines used in olive oil extraction processes. Therefore, the model was developed using fluid dynamic analysis and physical constraints to give it a solid basis. It was then simplified sufficiently for future implementation in automatic machine systems. The empirical model was validated through power measurements conducted in two harvesting seasons under varying operating conditions. The model estimates the power absorbed by the bowl and that produced and recovered by the screw, with high accuracy in each harvesting season. When considering the two harvesting seasons as a single season, the prediction accuracy remains considerable, despite a marginal increase in errors (correlation coefficient greater than 0.90). Finally, the model indicates that the screw conveyor speed is the most important parameter to achieve the desired energy recovery level, while the differential speed, which is a process parameter, has only a negligible impact on energy saving.

1. Introduction

Manufacturing systems typically convert raw materials into products using electrical energy while simultaneously generating waste and emissions [1,2]. As electrical energy resources are predominantly generated using fossil fuels, the consumption of electrical energy in manufacturing generates CO2 emissions; therefore, there is an increasing requirement to reduce the energy consumption in manufacturing [3]. Therefore, improving energy efficiency in machining processes can reduce energy consumption, minimize environmental impact, and assist sustainable manufacturing [4,5]. The motivation for this study was to improve the modelling capability for energy requirements in mechanical processing for the virgin olive oil (VOO) sector, and in particular, the centrifugal extraction through a decanter centrifuge. This particular sector requires a significant effort to bridge the gap between new technologies and validations by scientific studies. Increasing studies in this specific field could allow for faster technological development and greater knowledge of both manufacturers and operators in the sector.
Morello [6] studied continuous low working capacity plants (approximately 1500 kg/h), and reported that the utilization of the installed electrical power varied between 20% and 40, with minimum utilization (20–25%) of the extraction equipment resulting in an inefficient use of energy. More recently, a number of authors [7,8,9,10] analyzed the energy use in the olive oil production chain and reported that it consumes significant amounts of both electricity and thermal energy. In particular, centrifugal extraction is characterized by the highest total energy requirements and sub-utilization of the installed power. In addition, it is noted that the following aspects should be considered in an energy study of a plant or machine in the food industry:
(1)
The proposed solutions must be simple and inexpensive and compatible with the added value of the produced food to make the machine or the plant competitive on the market in relation to both purchasing and management costs [7,10];
(2)
Energy recovery solutions must be validated by mathematical models and experimental tests that consider the production process and quantitative aspects related to the product obtained [11,12]; and
(3)
More so than in the bulk of other plants, that the quality of the processed food has to be high in relation to the machine performance and energy requirements [13].
In particular, the decanter centrifuge for olive oil production is typically designed with two key goals: (1) to ensure the cleanliness of the discharged liquids with appropriate sedimentation of the solids; and (2) to guarantee the highest olive oil extraction efficiency and quality.
Nowadays, common components used in state-of-the-art decanters are double planetary gear trains coupled to an electromechanical brake, or electric or hydraulic motors, to support the rotation of the screw [14,15]. This enables automation of the differential speed setting. However, lack of knowledge or prediction capability of the possible consequences of using automation systems could result in poor optimization techniques, lower energy savings, and higher production costs.
Increasing attention has recently been focused on the use of decanter machines that use energy and water resources efficiently, as well as the promotion of sustainable consumption [13,16,17,18,19,20,21,22]. The specific decanters are characterized by the large application of the three-phase water saving and two-phase decanters [23,24]. Previous studies highlighted the high extraction efficiency of these machines in an industrial environment, allowing the operators to work over a wide range, which allowed high performance [14,16,18,25,26]. In particular, more recently Tamborrino et al. [15] reported that these machines were able to maintain an extraction efficiency of between 86.4% and 90.8% across a wide range of feed mass flow rates (4075–5820 kg/h) and differential bowl (ωB) and screw conveyor (ωS) speeds Δn (15.5–26.0 rpm).
Therefore, the optimization of the centrifugal extraction process (decanter), in terms of both energy consumption and olive oil quality, could be of significant importance in the total energy balance and net production costs of extra VOO, as well as on the environmental impact. Numerous machines used in the food industry, such as re-reeling machines, coil-winders, flywheels, presses, turntables, lifting equipment, and centrifuges, cyclically generate electricity from the kinetic energy accumulated during their primary movement, and this energy can be controlled and managed. As opposed to this, conventional systems used as braking resistors simply dissipate the regenerated energy in heat sinks with an evident economic and environmental impact.
Regenerative braking is widely used in the design of hybrid and ground vehicles [27]. During the braking process, the electric motor works as an electric generator converting kinetic energy into electric energy; therefore, the recycled energy can be stored in a battery for vehicle reacceleration [28]. This is an important way to save energy in hybrid electric vehicles and electric vehicles (EV), because it significantly reduces the amount of energy consumed by braking, particularly in urban driving [29]. As an example, other applications consider the reduction of energy consumption of electro-hydraulic tooling [27] and engine idling of refrigerator trucks [30].
With the invention of the variable frequency drive for electric and high-torque hydraulic motors, it is now possible to continuously tune the differential speed of the decanter centrifuge during operation [31]. Although the latest generation of decanter centrifuges may be equipped with regenerative back drives, which are able to recover energy from screw motors and feed it back to the main motor, there have only been limited scientific studies modelling instantaneous energy regeneration. In addition, for EVs, there have been limited studies that propose a method to instantly evaluate the regenerative braking; typically, average regenerative braking energy efficiencies or regenerative braking factors are used [32].
In addition, to date, studies regarding centrifugal separation modelling [33,34,35,36,37,38] and energy saving [39] are rare. However, these authors only used fluid dynamic analysis of centrifugal separation [35,36,37,38] or mechanical balance equations (torque and energy: [33,34]) of the rotating elements, obtaining only partial results.
It is essential to produce such a model so that it can be used in eco-friendly process planning to estimate the electricity footprint for processed products [40]. In particular, a new model is also required if one wants to improve automation capability using predictive modelling and adaptive techniques (e.g., machine learning). Jimenez et al. [41] developed a three-layer artificial neural network model whose input variables were those in the fluid-dynamics laws used for a physical model of a two-phase olive oil decanter centrifuge. These predictive analysis tools, which use machine learning techniques, clearly represent the new frontier of machine and plant automation However, they require appropriate input variables to ensure satisfactory prediction. To this end it is essential to have reliable physical models that describe the functioning of the system of interest.
In this study, an energy consumption model of a decanter centrifuge is proposed, in particular for a technologically evolved machine equipped with an electromechanical recovery system. The proposed model requires a solid physical and theoretical basis, while being simple enough to implement, particularly if an auto-adaptive optimization technique is used to accurately manage the process. In this case, a simple and quick auto-adaptive predictive model could be suitably coupled with machine learning techniques and implemented for auto-adaptive control of the machine.
In this model we combine both fluid-dynamic and mechanical balance sets of equations. We then solve them analytically, with the appropriate hypothesis, to obtain a simplified but accurate and physically correct model, suitable for application for the automatic control of a decanter centrifuge.
The model could also be used as a tool in the design stage of a decanter centrifuge. It is noted that although there have been developments in all technologies to improve the efficiency of the primary components of a decanter centrifuge, design methods have remained essentially the same since the modern decanter was developed in the 1970s [42]. For the design, we could refer only to the Decanter Centrifuge Handbook [43].
Finally, it is common knowledge that among other variables, even the machine settings can significantly influence the product characteristics [13,44,45,46,47]. Consequently, a comprehensive study should not neglect the possible impact of the engineering aspects on the VOO quality. Therefore, in this study, we also assess the quality of the extracted VOO under the operating conditions of the machines.

2. Materials and Methods

2.1. Decanter Machine Equipped with an Electro-Mechanical Recovery System

The horizontal decanter system used here as a case study is an industrial decanter centrifuge with continuous differential speed settings (∆n = (60 ∆ω)/2π, where ∆n is in rpm, and ∆ω = ωBωS > 0 in rad·s−1) is the difference between the bowl (ωB) and screw conveyor (ωS) speeds. As mentioned above, the differential speed is responsible for conveying the sediment or husk (Figure 1) in the opposite direction to the prevailing fluid motion. Both the bowl and the screw conveyor rotate at high angular speeds to separate the solids from the liquids, and partially, the oil from the vegetable water.
The studied decanter has olive oil and pitted pulp and water semifluid fraction outlets at the end of the cylindrical section of the bowl. The input section of the malaxed olive paste is approximately one-third along the screw conveyor hollow shaft, measured from the outlet of the oily phase (Figure 1). The outlet of the husk conveyed by the screw is on the opposite side (the conical section of the decanter).
While the bowl and screw rotate in the same direction in the fixed reference system, as shown in Figure 1, the screw rotates in the opposite direction in the moving reference system synchronous with the bowl, as it is slower than the bowl in the fixed frame. Therefore, the separated liquid phase moves along the channel formed by the screw flights in the same direction (and higher velocity) of the apparent motion of the screw in the moving frame, generating a driving torque that assists the screw rotation. On the other hand, the conveyed husks behave as a resistance torque, thereby reducing the driving effect of the liquids. The overall torque applied to the screw conveyor is typically a driving torque.
Numerous commercial machines, which have only one electric motor, use this positive effect indirectly and the differential speed is fixed through a planetary gear box (or, at most, modifiable by changing the transmission ratio of the belt transmissions). Other machines are equipped with two motors for both bowl and screw conveyor, where the second one is typically used as an electromagnetic brake dissipating the recovered energy.
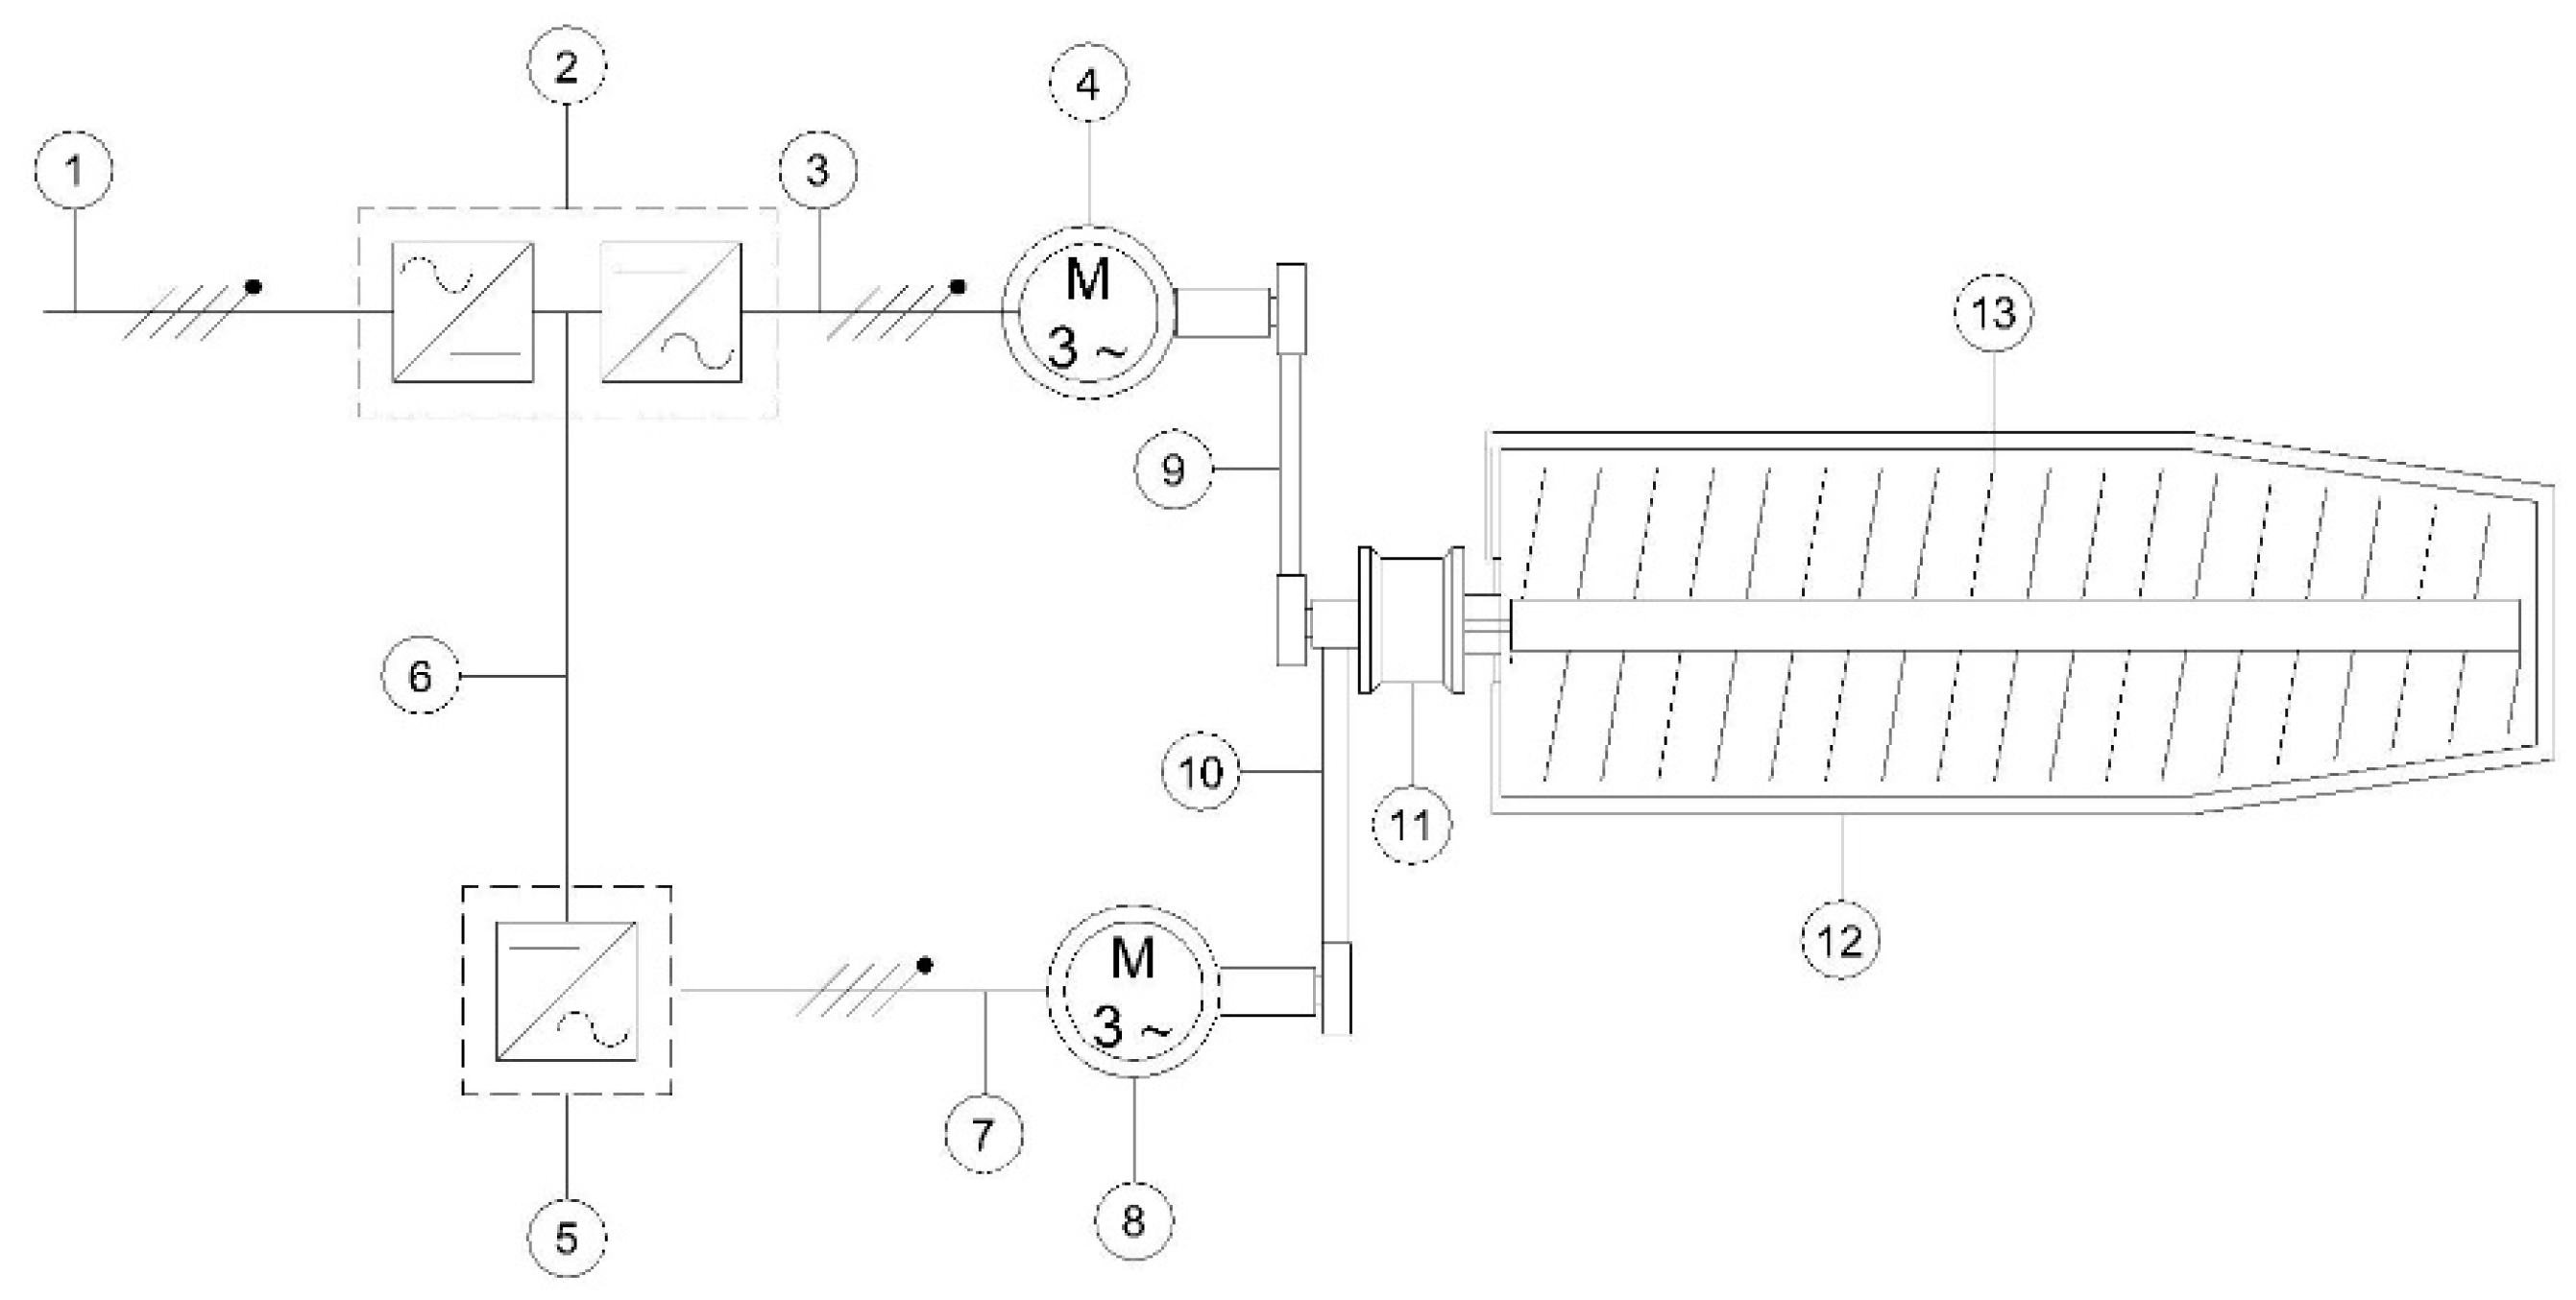
In the studied machine the bowl and screw were connected through a cycloidal gearbox and two belt transmissions, with each one connected to an electric motor (Figure 2). Table 1 presents the primary characteristics of the decanter.
An inverter, controlled by a manual potentiometer to continuously modify the rotation speed, powers the electric motor of the bowl, and therefore, the retention time of the olives. Similarly, two inverters, one of which is a recovery inverter, control the supply of the screw conveyor electric motor. By controlling the frequency of the inverters of the two electric motors, the system controls the rotation speeds of the bowl and the screw until they reach a defined ∆n value.

2.2. Decanter Basic Model

The fluid-dynamic analysis of the solid-liquid separation by centrifugation can be performed using either computational fluid-dynamic techniques or simplified models [36,48]. The simplified models are of particular use when an analytical solution is required to obtain a phenomenological but accurate model of the machine performance. One possible way to model a decanter is to consider the centrifuge as a cylindrical free surface canal where the solid particles settle under the centrifugal force instead of gravity [49,50]. This results in an approximately accurate analysis when dealing only with separation efficiency, however, it does not account for strain distribution and torque calculation.
Using this approach, as only the tangential velocity is considered, the only forces considered are the radial (centrifugal force) and tangential components of the stress tensor. If a more accurate analysis is required, we have to consider this condition as approximatively correct only for the space ( r e < r < r B ) between the inner surface of the bowl ( r B ) and at, or close to, the tip of the screw flights ( r e ). In fact, on the one hand the olive paste flows along the longitudinal axis of the canal limited by two consecutive flights. On the other hand, the fluid close to the tip of the flights should theoretically move at the same velocity as the screw (no slip condition). On the contrary, because of the relatively high velocity gradient, the solids particles that accumulate close to the inner surface of the bowl tend to roll on it and on the tip surfaces of the flights. This produces an apparent “group” velocity relative to the screw that nullifies the no-slip condition in a volume of height h > r B r e close to the inner surface of the bowl. The cylindrical surface located at height h represents the inversion surface, which is the surface where the fluid is, on average, stationary (Figure 1). The depth h (average solid phase thickness) is determined according to the method reported by Amirante and Catalano [36]:
h = Δ ω f 1 V ˙ + f 2 Δ ω r B
where V ˙ is the olive paste flow rate, f 1 and f 2 depend on the ratio r i / r B , and r i is the radial coordinate of the fluid free surface.
Moving towards the inside of the liquid ring, the velocity field has the same direction as the apparent screw speed (in the bowl reference system). The variation Δ h of h with the flow rates V ˙ and Δ ω should have little influence on the flow field, and consequently, on the torque calculation, as Δ h < h ( r B h ) r i is the height of the lower part of the screw surface. On the contrary, moving towards the inner bowl surface, the velocity field is reversed and the variation Δ h with flow rates V ˙ and Δ ω has a significant influence on the torque calculation because of the thinness of the space between r B h and r B as Δ h h = r B ( r B h ) , and the height of the upper part of the screw surface.
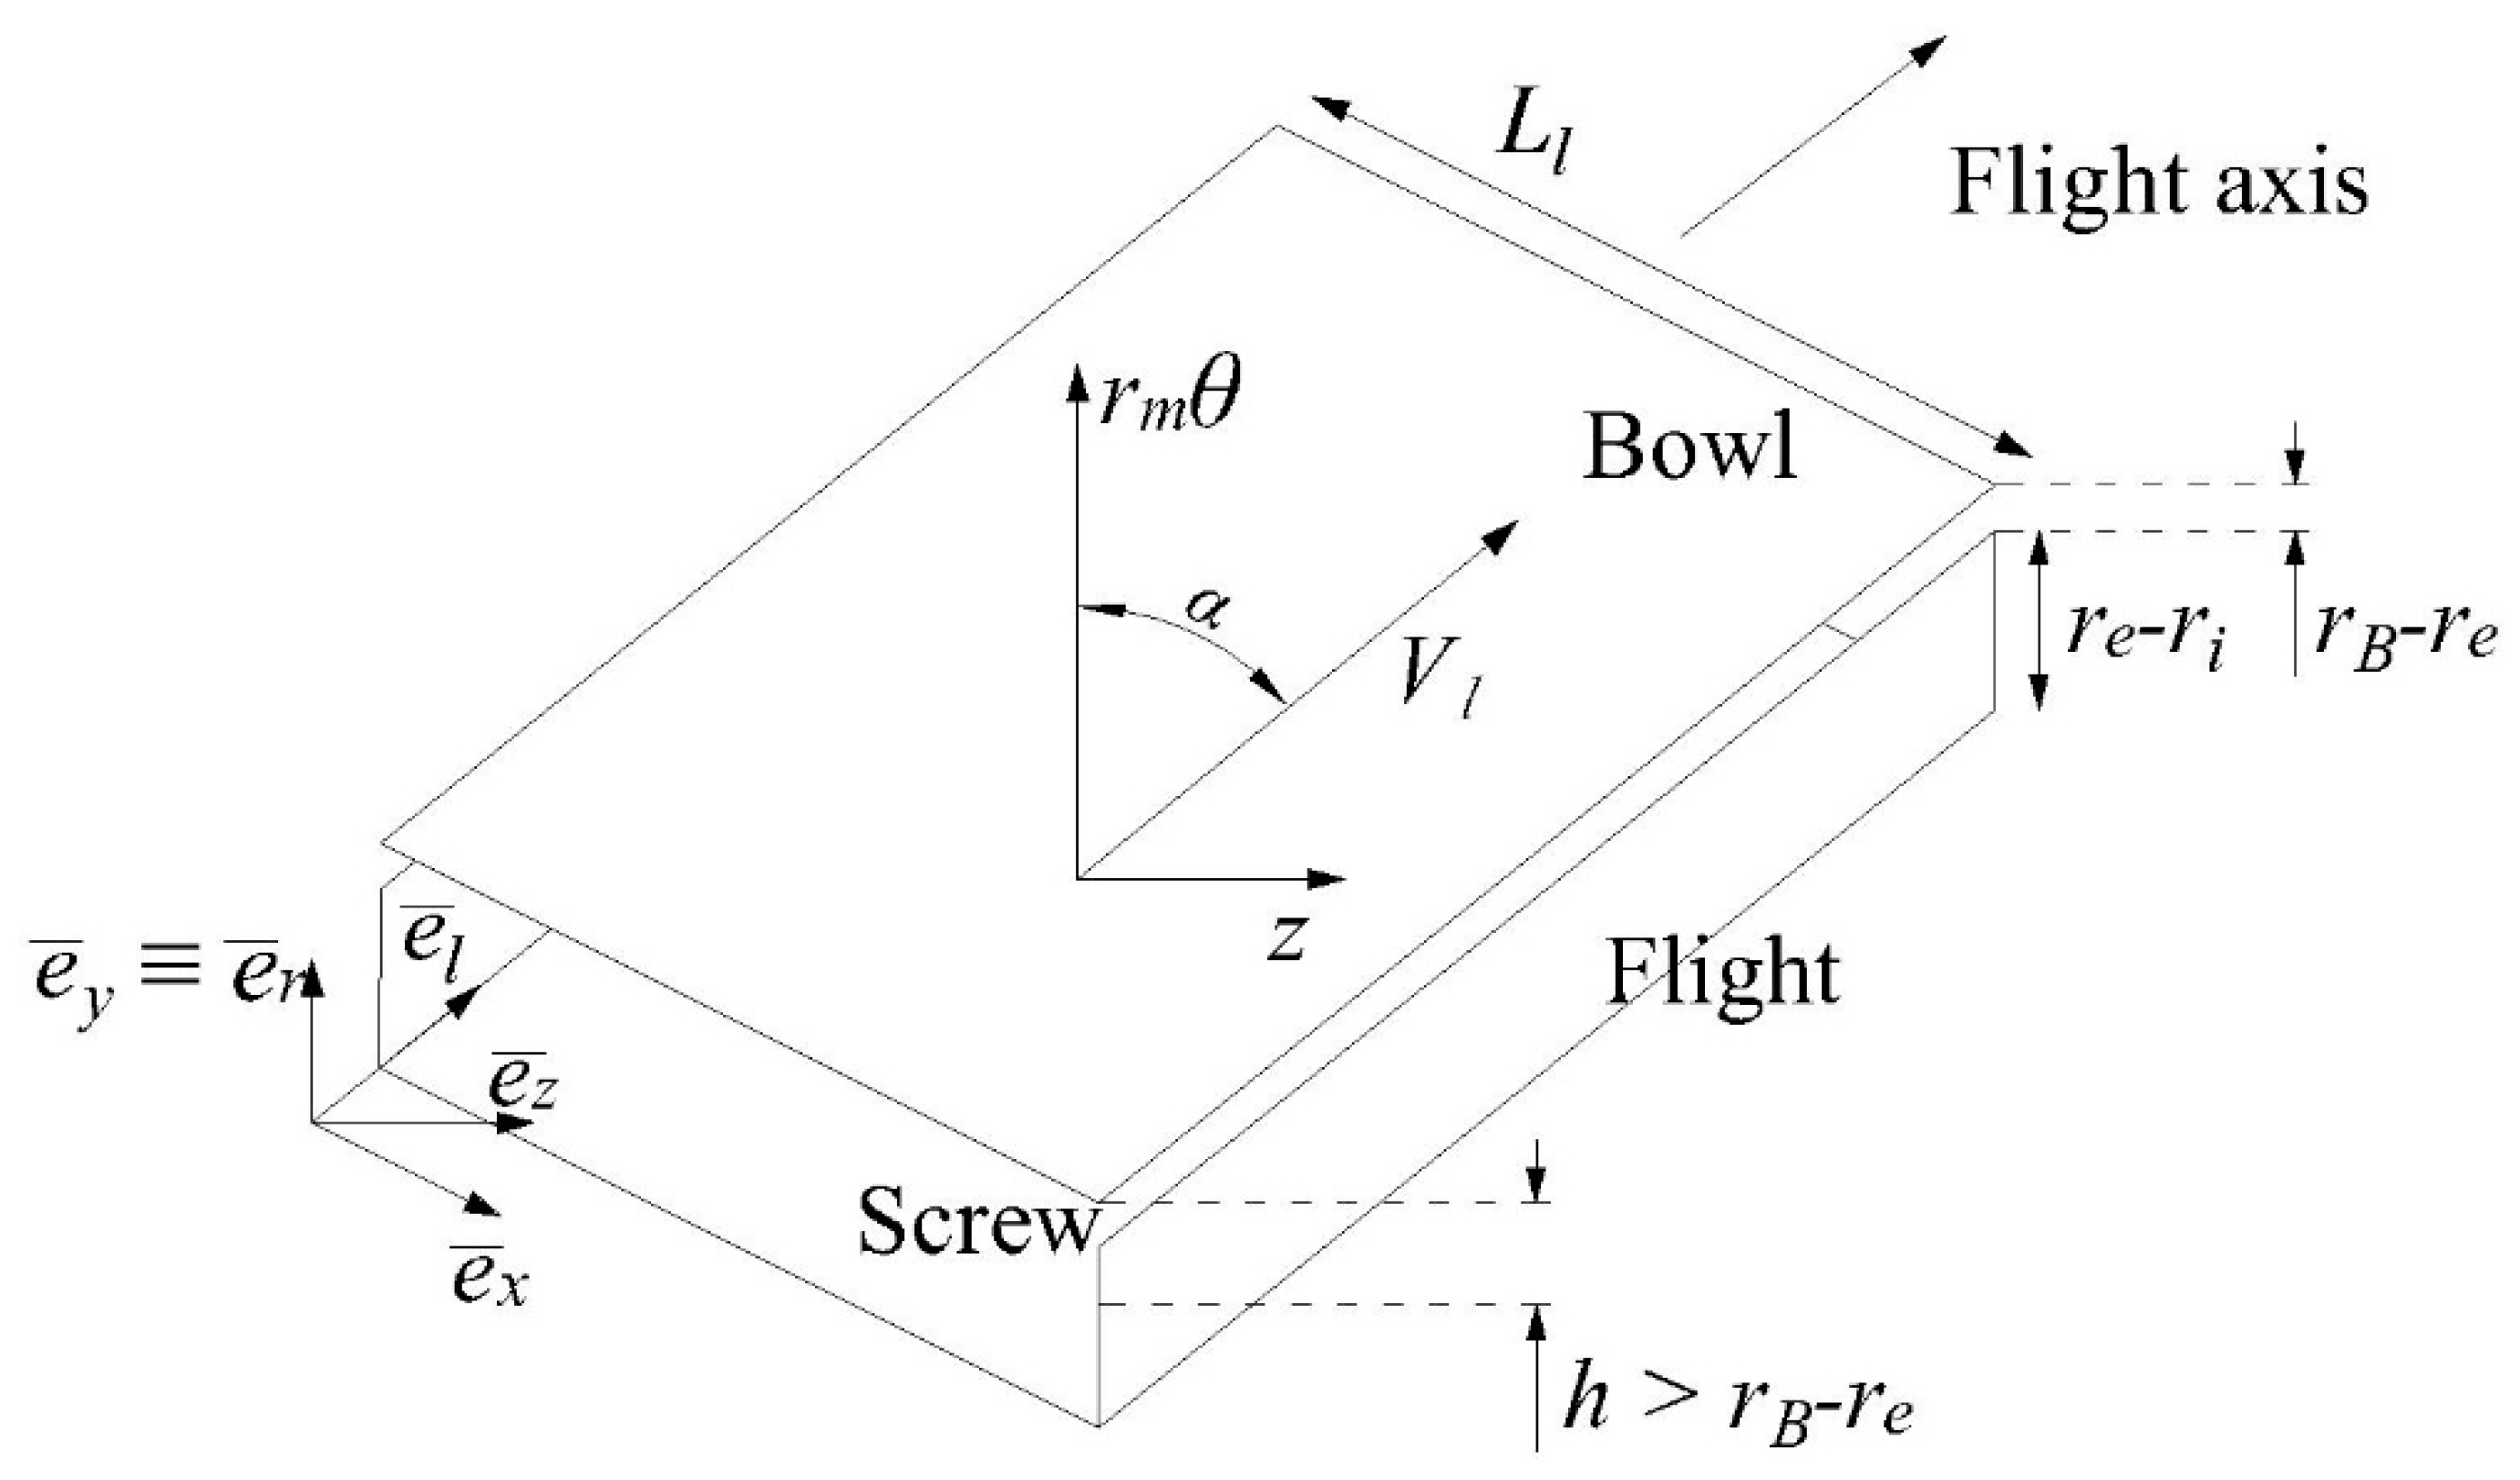
Another important hypothesis is to neglect the curvature of the profiles of the flights in the cross-section (normal to the helical coordinate l) when r i / r e 1 , as is typically observed in the bulk of machines [36,48], including the one tested here. Therefore, the cross-section can be considered to be approximatively rectangular [49]. The continuity and momentum equations, under both steady and laminar conditions, can now be written using the coordinate system defined in Figure 3 and rotating at the same velocity ω S e ¯ z as the screw conveyor, where the minus sign is because of the chosen direction of the z-axis.
This case is different from the one using the bowl frame (rotating at ω B e ¯ z in the fixed system), which is useful when considering driving and resistance torques acting on the screw. In this study, the default reference frame will be that of the screw conveyor, except when the bowl reference frame is explicitly indicated. The continuity and momentum equations written in the screw frame are:
{ ¯ Δ w ¯ = 0 ρ w ¯ Δ ¯ w ¯ + ρ ( ω S e ¯ z ) × w ¯ ρ ω S 2 y e ¯ y = ¯ p + μ ¯ 2 w ¯
where e ¯ y and e ¯ z are the unit vectors of the y- and z-axes, respectively, w ¯ is the fluid velocity vector, ρ and μ are the fluid density and viscosity, respectively, and p is the fluid pressure.
The hypothesis of steady conditions is justified even during transient operations when modifying processing characteristics, as flow variations are slow enough to be neglected. Laminar conditions result from the significant olive paste viscosity leading to a low general Reynold number [36,51]. As already stated regarding Equation (4), this is a widely accepted approximation, as the highest speed in the decanter is very low due to the low feed flow rate (6000 kg/h < 3 m3/s) and a very high dynamic viscosity (consistency coefficient > 1000, even for diluted paste or almost separated vegetation water). This gives a low General Reynolds number < 10 for diluted vegetation water (only in the very last section of the decanter, near the outlets) and < 0.1 in the all other sections of the machine, even for highly diluted paste [52].
The following transformations are used between cylindrical (r, θ, z) and screw coordinates (x, y, l) [50] (Figure 3):
{ ( x y l ) = ( 0 sin α cos α 1 0 0 0 cos α sin α ) ( r r m θ z ) ( r r m θ z ) = ( 0 1 0 sin α 0 cos α cos α 0 sin α ) ( x y l )
where r m = r i + r e 2 , and α is the slope of the screw flights with respect to the decanter cross-section (Figure 1). The use of the Navier–Stokes equations is justified by the following widely accepted hypothesis [36,37,50,52,53]:
  • even if the bulk of organic fluids are non-Newtonian, this has little influence on the velocity profile because of the high value of the apparent viscosity μ in any position in the decanter; in the screw coordinate system this also implies wx = wy = 0, as the secondary motions of high viscosity fluids are negligible;
  • the viscosity μ depends on the concentration of the suspended solids, however, the bulk of the solids settle close to the olive paste inlet; this allows the assumption of small changes of μ with the position, and therefore, it can be taken as approximately constant.
Under these hypotheses, for riyrBh (Volume 1) the system of Equation (2) becomes
{ w ¯ l = 0 p x = 0 p y = ρ μ ω S ( 2 w l c o s α ω S y ) 2 w l x 2 + 2 w l y 2 = 1 μ p l
Regarding boundary conditions, we have to consider that the bowl rotates at a speed relative to the screw conveyer Δω = ωBωS. As discussed above, the fluid close to the tips of the flights moves at the same velocity as the screw for riyrBh (no-slip boundary condition: w l ( 0 , y ) = w l ( L l , y ) = 0 , because in the selected reference frame the screw is motionless). At the inversion surface (y = rBh, Figure 1 and Figure 3), where the fluid is, on average, stationary, the boundary condition is w l ( x , r B h ) = 0 ). At y = ri, the boundary condition is the “free surface” one: τ = ( x , r i ) Δ e ¯ y = 0 , where τ = is the stress tensor. Finally, for riyrBh, the boundary conditions are:
{ w l ( x , r B h ) = 0 w l ( 0 , y ) = w l ( L l , y ) = 0 τ = ( x , r i ) · e ¯ y = 0
Equation (4), valid for the region ri ≤ ry ≤ rB − h, has the following analytical solution (intermediate mathematical steps are omitted for the sake of brevity and ease of reading):
w l = L l 2 2 μ p l { n = 1 [ 1 n π s i n ( n π L l x ) c o s h ( n π L l y ) t a n h ( n π L l r i ) s i n h ( n π L l y ) c o s h ( n π L l ( r B h ) ) t a n h ( n π L l r i ) s i n h ( n π L l ( r B h ) ) ] + ( x L l ) 2 ( x L l ) }
where p l = K w l , and K is a constant depending on fluid characteristics and decanter geometry. The fluid flow rate is determined as follows:
V ˙ = 0 L r i r e w l ( x , y ) d x d y = 1 K V   p l
where K V is another constant depending again on fluid characteristics and decanter geometry. The stress tensor τ = becomes:
τ = = μ ( 0 0 w l x 0 0 w l y w l x w l y 0 )
The torque acting on the screw (Volume 1) is computed by calculating the stress component t ¯ acting on the screw surface and integrating the surfaces of the flights after the cross-production with the radial vector y e ¯ y = ( 0 y 0 ) and projection onto the z-axis. Therefore, the first screw torque component T ¯ S 1 acting on the screw flights is:
T ¯ S 1 = T S 1 e ¯ z = r i r B h 0 2 π t ¯   × y e ¯ y   r m cos α [ 1 + ( L z 2 π r m ) 2 ] d y d θ e ¯ z = K S 1 V ˙ e ¯ z
where KS1 should be a positive ( T S 1 = K S 1 V ˙ > 0 ) constant: as discussed above, the fluid drives the screw because, in the bowl reference system, it flows in the same direction as the screw up to the inversion surface located at y = rBh [36]. The value of KS1 depends primarily on the geometrical characteristics of the centrifuge and the fluid characteristics, but only negligibly on h.
On the other hand, in Volume 2, closer to the inner surface of the bowl than the inversion surface (rBh < r = yre; Figure 1 and Figure 3), the fluid motion, primarily the husk, is characterized by cylindrical symmetry. This is because the screw conveys the husk backwards. In fact, wr = 0, wz = −LzΔωx, θ, r in the screw cylindrical reference system, because of the dragging of the screw conveyor [36]. In addition, when the screw is fixed (screw conveyor moving frame), the bowl rotates as shown in Figure 1 and the fluid, primarily the liquid phase, flows along the cylindrical surface in the opposite direction to reach the fluid exits.
In Volume 2, an apparent “group” velocity, because of the rolling solid particles relative to the screw, nullifies the no-slip condition. This corresponds to a sliding wall condition for both the tip of the flights and the inner bowl surface. However, the actual fluid velocity is only known for the bowl surface and not at the tips of flights, where only a periodic boundary condition can be stated:
w l ( 0 , y ) = w l ( L l , y )
The Navier–Stokes Equation (2) is written under the same hypotheses as before, however, with significantly different boundary conditions:
{ w ¯ l ( r B h ) = 0 w ¯ l ( r B ) = r B Δ ω e ¯ z w l ( 0 , y ) = w l ( L l , y )
In this case, one is led to assume that the second screw torque component T ¯ S 2 = T S 2 e ¯ z acts on the screw, and even more so on the bowl, as a resistance in Volume 2; the fluid in this small volume moves, in the bowl reference system, in the opposite direction to the screw (dragging effect). However, if we calculate T ¯ S 2 as before (calculating the stress component t ¯ acting on the screw surface and integrating the surface of the flights after the cross-production with the radial vector y e ¯ y and projection on the z-axis), we would obtain a more complex equation, which is not shown for the sake of brevity and ease of reading. The difference with the calculation of T ¯ S 1 , in this case, is that the dependence on h of w l , and therefore, of t ¯ , is clear: t ¯ increases with h, which in turn decreases with V ˙ and increases with Δ ω (see Equation (1)), leading to a non-linear equation in these two variables. However, linearization is possible and will be verified by comparing theoretical results with experimental data. Therefore, after linearization the dependence of T ¯ S 2 on V ˙ and Δ ω is linear, leading to the final equation for T ¯ S 2 :
T ¯ S 2 = ( K S 2 V ˙ + K S 3 Δ ω ) e ¯ z
where KS2 should be a positive constant (as it results in a reduction of h, and consequently of the resistance of the screw), and KS3 should be a negative constant (as it corresponds to an increase in h, and therefore of the resistance of the screw). Both constants depend on the geometrical characteristics of the centrifuge and the fluid characteristics. Finally, the total torque acting on the screw is:
T ¯ S = T ¯ S 1 + T ¯ S 2 = [ K S V ˙ + K S 3 Δ ω ] e ¯ z
where K S = K S 1 + K S 2 . If K S V ˙ + K S 3 Δ ω is positive, then torque T ¯ S acts as a driving force on the screw that transmits this driving power to the screw motor (Figure 2), which in turn behaves as a generator. The opposite would happen when K S 1 V ˙ + K S 2 Δ ω is negative—the screw motor drives the screw.
The torque T ¯ B = T B e ¯ z acting on the internal surface of the bowl can be also computed by calculating the stress component t ¯ acting on the bowl surface and integrating (after cross-production with the radial vector y e ¯ y ) on the inner surface (Volume 2) of the bowl itself (y = rB). The same calculations can be performed for T ¯ B but results opposite conclusions, as the bowl in the screw frame still moves in the same direction as in the fixed frame, even if the velocity is reduced ( ω B Δ ω ):
T ¯ B = ( K B 1 V ˙ + K B 2 Δ ω ) e ¯ z
where KB1 should be a positive constant (drives the bowl), and KB2 should be a negative constant (behaves as a resistance for the bowl). Both constants depend on the geometrical characteristics of the centrifuge and the fluid characteristics, and not on h after linearization.
Finally, the torque balance equations for both screw and bowl can be written as follows:
{ J S d ω S d t = T S + T S C J B d ω B d t = T B + T C B
where J S and J B are the screw and bowl moments of inertia with respect to the z-axis, respectively, and T ¯ S C = T S C e ¯ z and T ¯ C B = T C B e ¯ z are the torque on the cycloidal disc (screw) and the ring gear (bowl) of the cycloidal drive, respectively.
In addition, the two terms J S d ω S d t and J B d ω B d t become zero (the first one), or at the most, negligible (the second one), as during the experimental trials the angular velocity of the bowl (ωB) was held constant during each harvesting season and that of the screw (ωS) was changed slowly (as commonly happens during normal processing operations). Therefore:
{ T S C = T S T C B = T B
{ ω S C = ω S ω C B = ω B
where ω S C and ω C B are the angular velocities of the cycloidal disc and the ring gear of the cycloidal drive, respectively.
A 1:1 (transmission ratio τ S = 1 ) belt transmission connects the cycloidal drive main shaft to the screw electric motor (generator):
{ T E M S =     T S D C     = T S C   T C B Δ ω = ω B ω S = 1 τ C ( ω B ω S D C )   ω E M S = ω S D C
where [54] T E M S = T S D C = T S C T C B are the electromagnetic torques driving the screw motor ( T E M S ) and cycloidal drive main shaft ( T S D C ), respectively, ω E M S = ω S D C = ω B τ C Δ ω (Equation (17)) are the angular velocities of the screw electromagnetic motor and the cycloidal drive main shaft, respectively, and τ C = 87 is the transmission ratio of the cycloidal drive.
On the other hand, a double belt transmission (transmission ratio τ B = 224 132 250 200 2.1 ; Figure 2) connects the shaft of the ring drive to the bowl electric motor:
{ T E M B   = 1 τ B T C B ω E M B = τ B ω C B
where TEMB and ω E M B are the electromagnetic torque acting on the asynchronous bowl electric motor and its angular velocity, respectively.
Substituting Equations (13), (14), (16), and (17) into Equation (18) and computing the power by multiplying, respectively, by ω S D C and ω B (considering the rotation direction of the bowl), we have:
{ T E M S ω E M S = [ ( K B 1 K S ) V ˙ + ( K B 2 K S 3 ) Δ ω ] ω S D C = P E M S ( t ) T E M B ω E M B = ( K B 1 V ˙ + K B 2 Δ ω )   ω B = P E M B ( t )
where PEMS is the electromagnetic power recovered by the screw motor (operating as generator), and PEMB is the electromagnetic power driving the bowl motor.
It is not necessary to integrate the previous system, as we acquired V ˙ , ωS, and ωB (and also Δω) during each test with a sampling time of 0.2 s, and therefore, we have twice as many equations as samples. Therefore, the system of differential Equation (19) becomes an overdetermined system of linear algebraic equations in the four unknowns—KB1, KB2, KS, and KS3—which can be solved by the least square method.

2.3. Measurement Acquisition System

To evaluate the power consumption of the system, a measuring system was installed during actual industrial operation, using the built-in frequency, current, and voltage digital outputs of the KEB COMBIVERT F6-K inverter in the studied plant, and a personal computer for data storage and processing [55]. The frequencies of the input voltage of the two electrical motors of both the screw conveyor and bowl were varied to regulate the differential speed in each test. The screw motor frequency varied from 33 Hz to 70 Hz and the bowl motor frequency varied from 46 Hz (first harvesting season) to 51 Hz (second harvesting season). These values were monitored continuously during the tests.

2.4. Experimental Design and Operative Parameters Set

The experiments were conducted in an industrial olive oil mill located in Trani (BA), in southern Italy. The extraction plant was also equipped with a hammer crusher followed by a set of malaxer machines connected in series for olive paste preparation. The tests were conducted during two consecutive harvesting seasons under different throughput values in the range of 4075–6000 kg·h−1, and for each mass flow rate the differential speed between the bowl and screw conveyor was changed from 15.50 rpm to 26 rpm (Table 2). For each trial the working parameters were set during the ongoing process, without stopping the machine.
In the first harvesting season, the decanter was tested at medium–high paste mass flow rates (4075 kg/h and 4800 kg/h) and ∆n (15.5 rpm and 19.5 rpm), which represent the most common operating conditions of the machine depending on the olive paste characteristics. The second test cycle (second harvesting season) was conducted with higher feed paste rates (4900 kg/h and 6000 kg/h) than the maximum flow rate used in the first test cycle. The ∆n sets in the second cycle were comparable or higher (18 rpm, 22 rpm, and 26 rpm) than those of the first season and were chosen considering the new olive paste characterized by a higher solids content. In fact, it is well known that this characteristic requires higher paste flow rate and differential speed [36,47].
Virgin olive oil analyses were performed during the second harvesting season as the processing conditions represented the worst case for the studied machine.

2.5. VOO Analyses

Free fatty acids (FFA), peroxide values (PV), and specific extinction coefficients at 232 nm and 270 nm (K232 and K270, respectively) were measured in accordance with the European official methods [56]. The determination of the total phenolic content (TPC), tocopherols, and the sensory analysis was conducted as reported by [57,58]. Each measurement was repeated three times and reported as a mean value and standard deviation.
The experimental data of the quantitative parameters were analyzed using analysis of variance (ANOVA) and Duncan’s test with p < 0.05. The experimental data of the qualitative VOO parameters were analyzed using two-way ANOVA and the Fisher’s least significant difference (LSD) test for multiple comparisons and using Minitab 17 as statistical software (Minitab Inc., State College, PA, USA).

3. Results

3.1. Model Validation

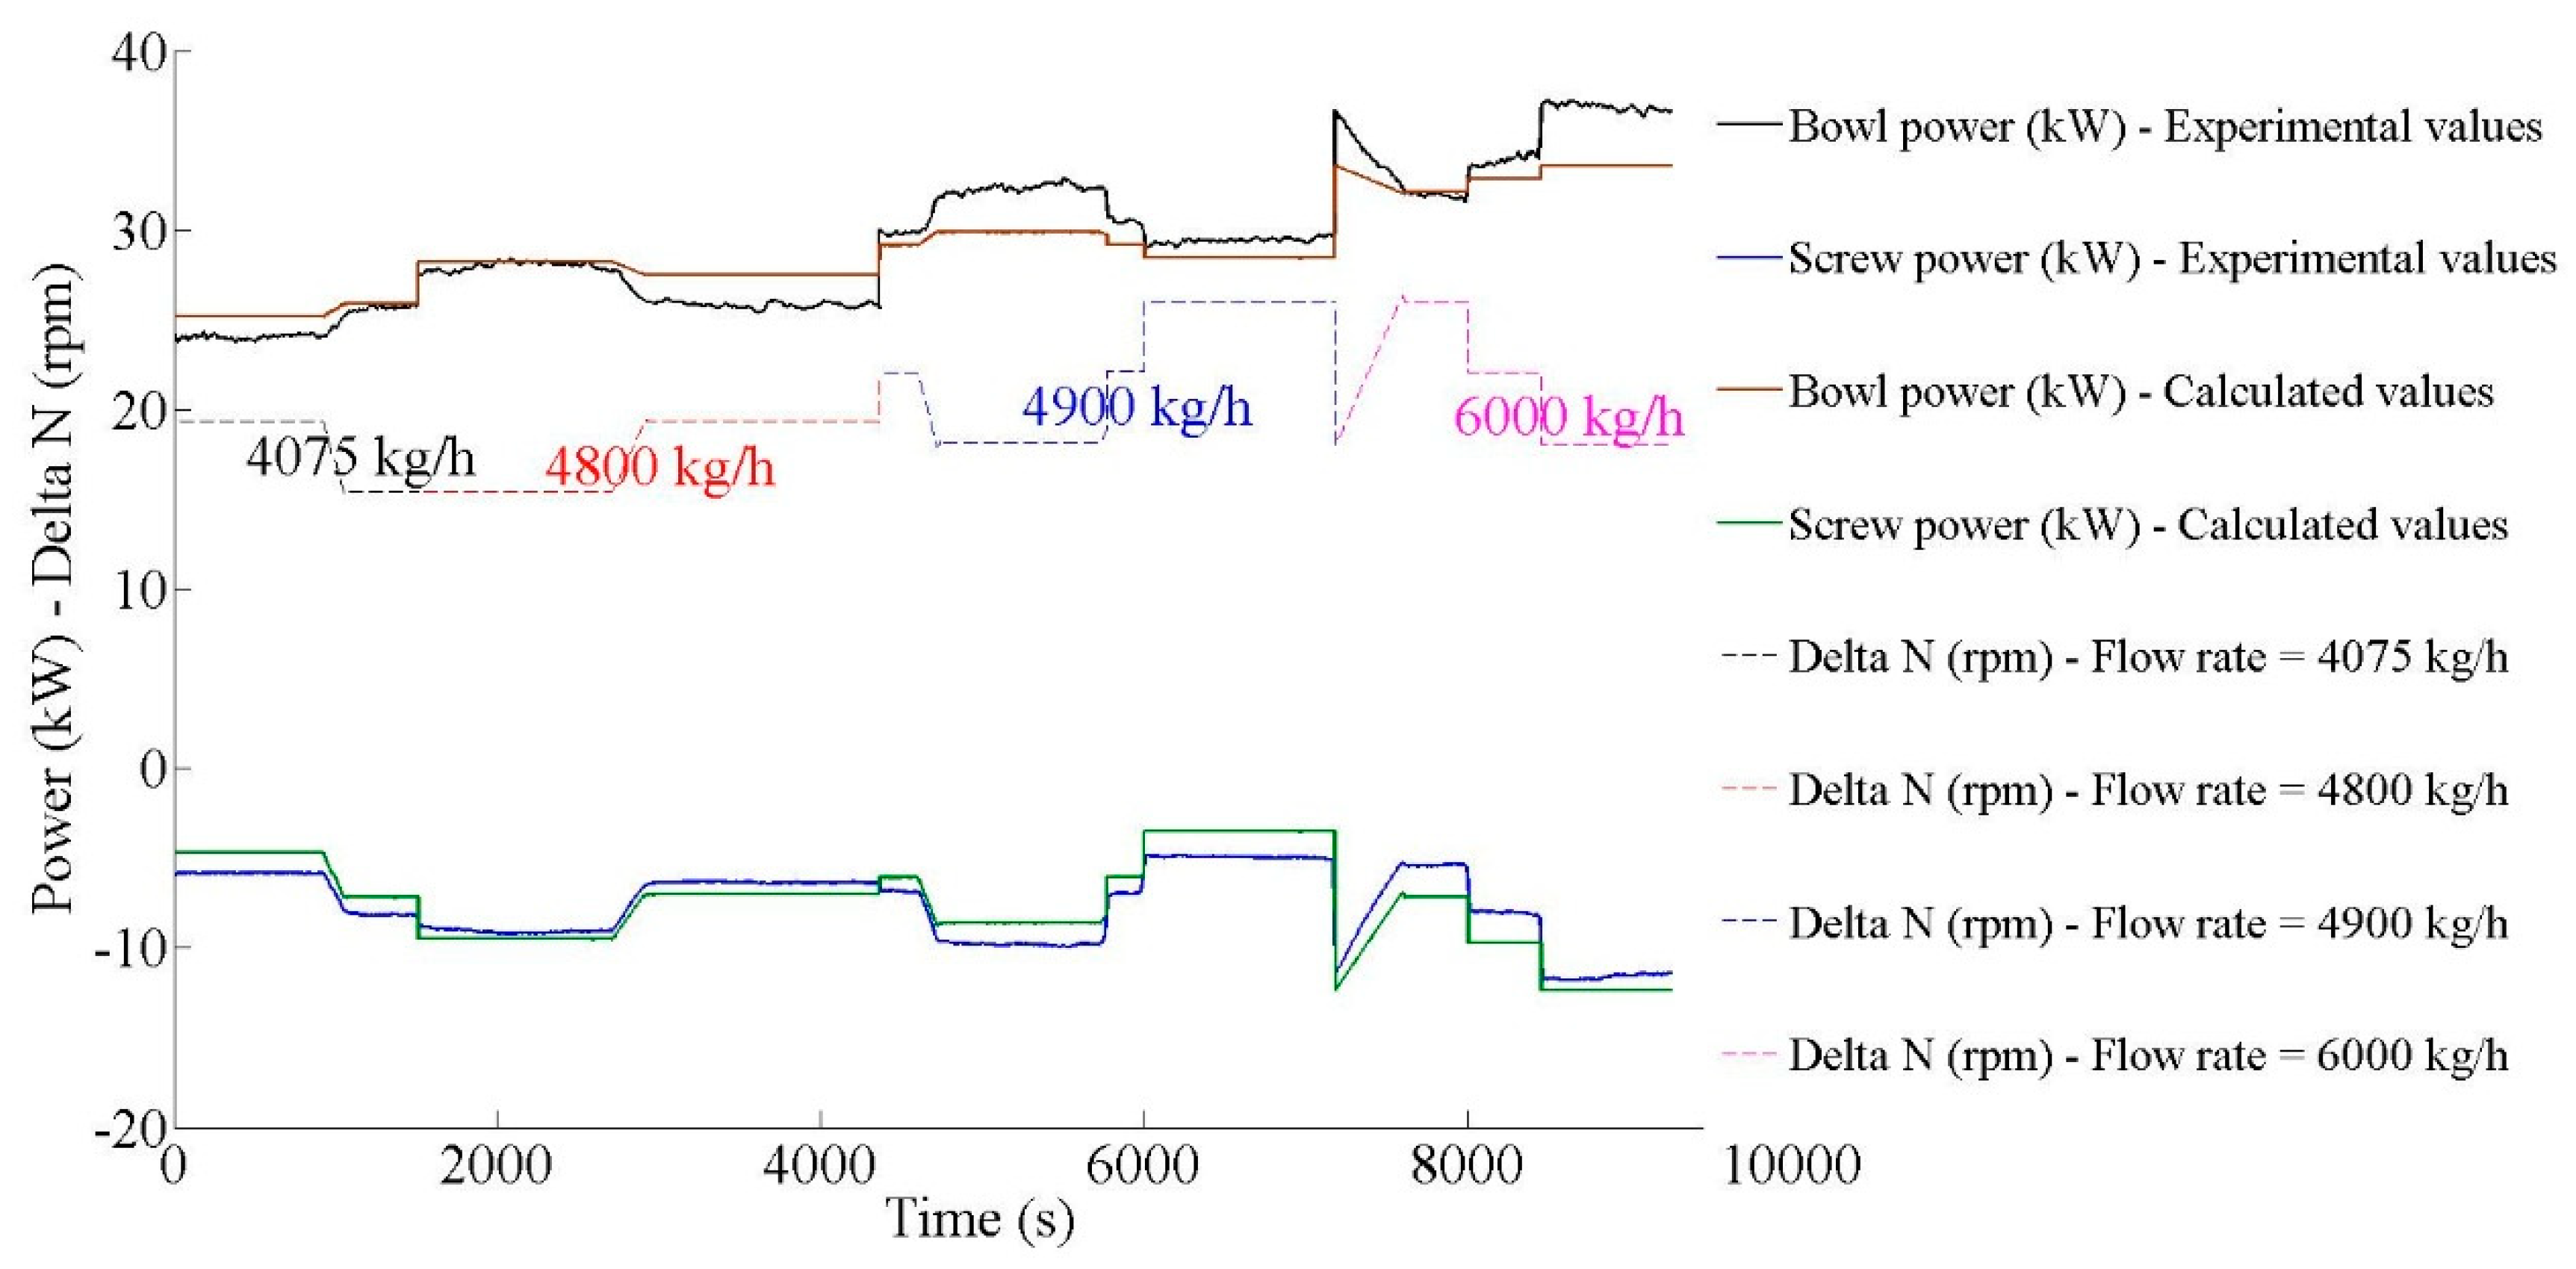
The first test cycle (first harvesting season) was conducted with common amounts of feed paste V ˙ (4075 kg/h and 4800 kg/h) and differential speed ∆n between the bowl and screw (15.50–19.50). Figure 4 (left-hand side) shows the trends of the active electric power ( P E M S and P E M B , both experimental and calculated values) during these two test periods. In particular, to allow an easy comparison of the data, they are plotted as if they were a single test, with the second harvesting season immediately following the first one. Figure 4 (the so-called “two-fit” case) also shows the trend of the differential speed ∆n divided into four groups, one for each flow rate. The first two values correspond to the first harvesting season and the last two to the second harvesting season.
Therefore, calculated values corresponding to the first two feed flow rates are obtained solving Equation (19) using only experimental values acquired during the first harvesting season. The error is less than 5% with a high correlation coefficient (r2 > 0.90). The model behaves accurately and the linearization process has little effect on the power prediction error. In Table 3, the two sets of calculated unknowns for both harvesting seasons are shown with many clear differences between the two sets because of the different fluid characteristics.
The tests conducted in the second harvesting season were characterized by large amounts of feed paste (4900 kg/h and 6000 kg/h) and high ∆n. It is noted that the maximum flow rate given by the manufacturer, 6000 kg/h (right-hand side of Figure 4), and Δn = 26 rpm correspond to a significantly short solids retention time. The results confirm what was highlighted during the first test cycle, even if they were obtained by processing a paste with different characteristics.
In this case, the model is in good agreement with the experimental values acquired during the second harvesting season (the “two-fit” case in Figure 4), again with a high correlation coefficient (r2 > 0.90). It is clear that fitting the model with the experimental data for the two harvesting seasons separately results in relatively good performance of the model with the calculated values similar to the experimental ones during both the regime and transient phases, with high correlation coefficients.
However, it is possible to use all data acquired during both seasons to solve Equation (19) and calculate model coefficients as if they were obtained in a single continuous test. Figure 5 (as the so-called “all-fit” case) shows the same experimental data as Figure 4, but with the new calculated data obtained using the parameters presented in Table 4. The error clearly increases marginally with respect to the error obtained by the separate fitting of the two sets of experimental data, particularly regarding bowl power modelling. This difference is because of the evident variation in rheological characteristics of the olive paste between the two seasons. In fact, the increase of the paste solids content in the second year (data not shown) with respect to that of the first year corresponds to a higher viscosity of the olive paste [53]. Therefore, the calculated torque (and the power, of course) could be slightly higher than the true one, with an increased error in the “all-fit” case with respect to the “two-fit” case. However, the percentage error remains less than 10%, even in the “all-fit” case, with a high correlation coefficient r2 > 0.90.

3.2. VOO Quality Assessment

The quality parameters of the VOOs together with the ANOVA model summary are presented in Table 5. Typically, the oils produced were of good quality, having values of Free Fatty Acids (FFA), Peroxide Value (PV), and spectrophotometric constants under the maximum limits set for extra VOO [56]. The antioxidant equipment was remarkable considering both hydrophilic and lipophilic compounds, with phenolic and tocopherol contents greater than 500 mg·kg−1 and 120 mg·kg−1, respectively.
The engineering variables resulted in only marginal changes to the quality of the oils, and the changes were attributed, in particular, to the different decanter feed rates. However, the p-values show that the feed rate considerably influenced the PV, K232, and TPC, while no influences were because of the differential speed and the interaction of these factors. More specifically, the higher mass feed rates resulted in typically higher peroxide levels, however, the absorption at 232 nm decreased. In addition, the TPC only decreased when working at Δn = 18, and the amount was not significant with smaller samples. A general phenolic reduction was also observed when working at higher Δn values, irrespective of the mass flow rate. These findings agree with those previously reported by Squeo et al. (2017), in which a reduction in TPC was observed when the decanter machine worked at higher feed rates and Δn values.
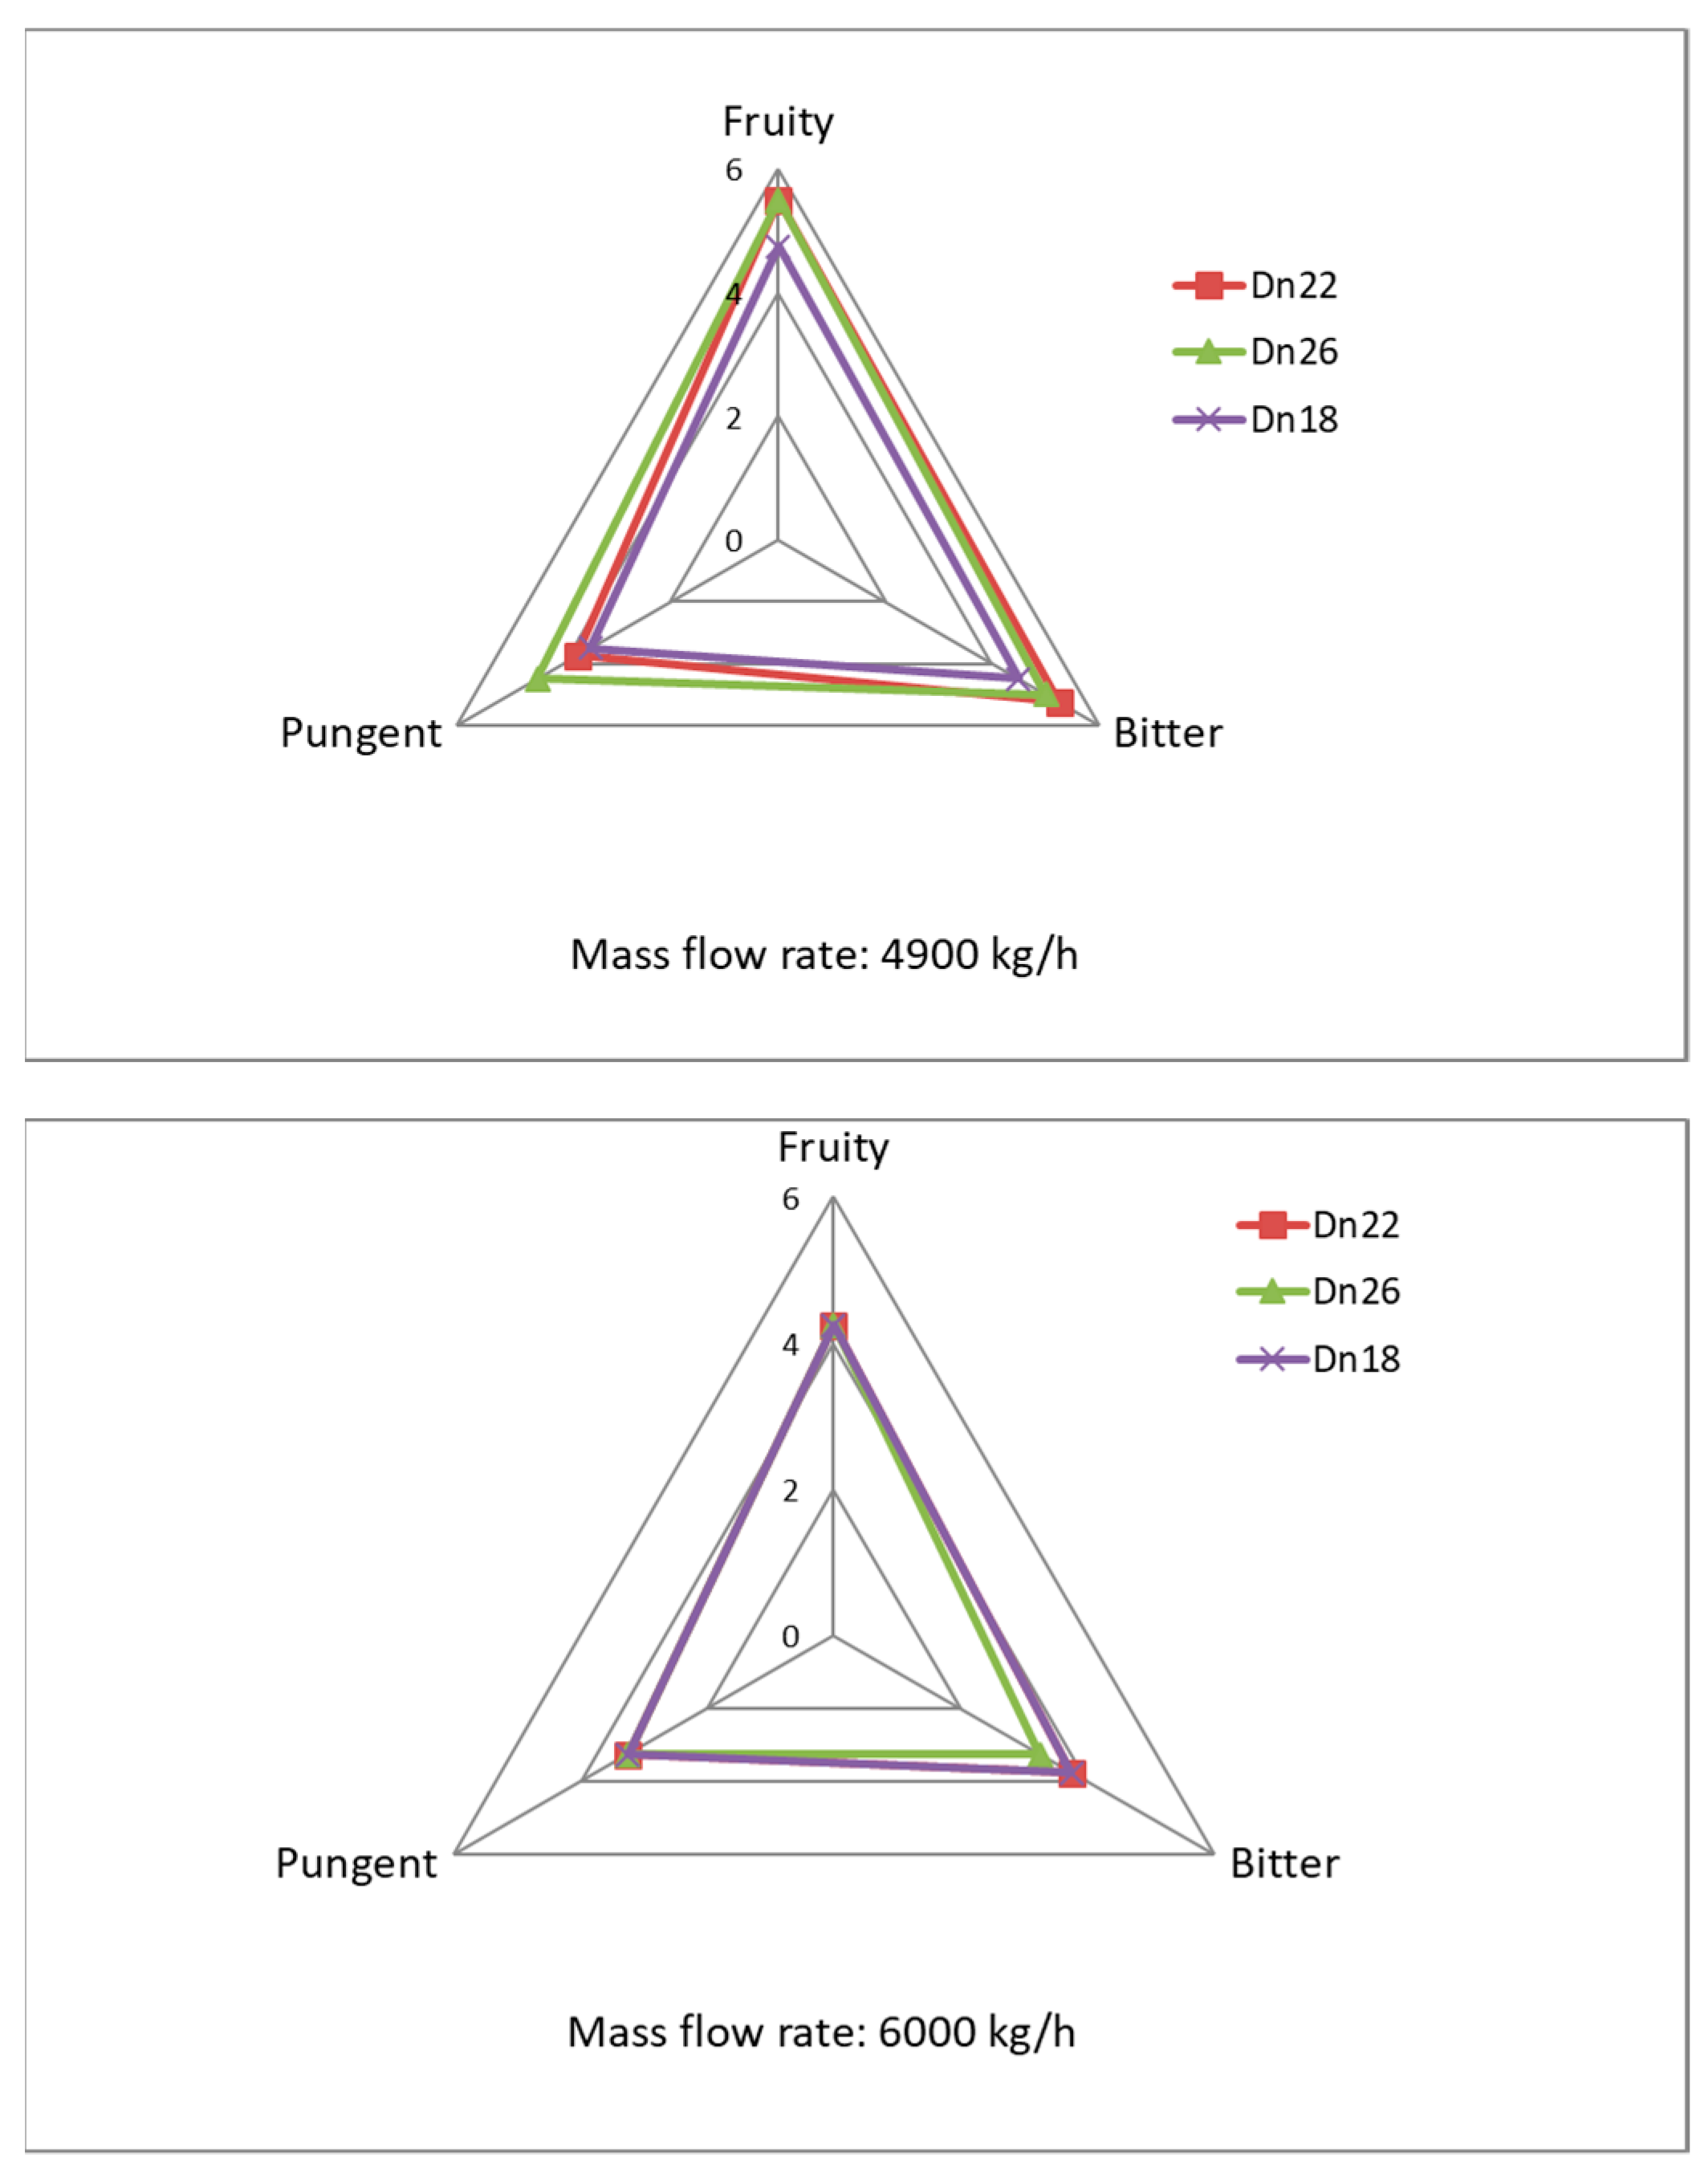
Figure 6 shows the sensory profile of the two samples, where it can be seen that the differential speed causes no differences in the sensory profile for each trial. The above results ensure that all the processing conditions of the machine have either no, or an insignificant, effect on the quality of the olive oil.

4. Discussion

From the above results, the model is validated by experimental data with an accuracy that is satisfactory for adaptive optimization and automation techniques. As the second equation of the boundary conditions (Equation (11)) shows, the solids have to rotate at the same angular speed as the bowl, thereby dragging and forcing the screw to rotate at the same angular speed ( ω S ). On the contrary, it is set to be lower than that of the bowl ( ω B ) through the gearbox (Figure 2), allowing it to correctly and continuously discharge the solids from the conical end of the decanter. Therefore, on the one hand the screw is dragged by the fluid motion, and on the other hand, it is slowed down by the gearbox, which forces the screw motor to behave as a generator by means of the recovery inverter. The active power on the screw conveyor motor is negative, as also confirmed by Equation (19), where the coefficients of both the feed rate V ˙ and the differential speed Δω are negative.
The variations in both differential speed (∆n) and mass flow rate influence the active power absorption of the bowl and screw. Mass flow rate ( ρ V ˙ ) variations have less influence on the screw than on the bowl. In fact, when the paste flow rate increases from 4075 kg/h to 4800 kg/h (first harvesting season) and ∆n remains constant (Figure 4 and Figure 5), the active power absorbed by the bowl increases by at least 3.0 kW compared with the screw-recovered power of approximately 2.0 kW. The model confirms this small difference. Even if the constant remains the same ( K S 1 ), the mass flow rate is multiplied by K B 1 ω B and ( K B 1 K S ) ω S D C in the bowl and the screw equations, respectively, with K B 1 ω B > | K B 1 K S | ω S D C = | K B 1 K S | ( ω B τ C Δ ω ) . The increase in paste flow rate from 4900 kg/h to 6000 kg/h (second harvesting season) leads to a clearer increase in power absorption of the bowl. On the other hand, the variation in the power production of the recovery system is negligible. Under these higher values, the linearized model does not correctly consider this negligible influence on the flow rate and differential speed on the model parameters. As a result, the model exhibits a marginally greater variation than the actual one because of the weak non-linearity neglected in the linearization of the system of equations. However, this trend (nominal flow rate), while not commonly encountered and only occurring when the processed paste has specific uncommon rheological characteristics [14,15], is fitted accurately enough by the model, allowing its use with auto-adaptive automation techniques, even in this worst case.
On the other hand, the energy recovered by the screw conveyor inverters ranges from 5 kW to 9 kW during the first harvesting season, with the highest values corresponding to the lowest Δn: 15.5 rpm. When decreasing the screw motor speed ω S D C , the differential speed Δ ω increases, however, the term | ( K B 2 K S 3 ) Δ ω | ω S D C decreases globally. Therefore, the generated power and the active power absorbed by the bowl decrease as ( K B 2 Δ ω ) ω B < 0 , which maintains an approximately constant total energy consumption. In addition, during the second harvesting season, the electric power recovered by the screw conveyor increases again with decreasing differential speed (Figure 4 and Figure 5); a similar observation was made when the model was employed. The maximum energy recovered is approximately 12 kW and is obtained by working with the lowest Δn (18 rpm) and with the maximum allowable flow (6000 kg/h: nominal flow rate). A comparison of these results with those of the previous season show that a significant increase in flow rate results in a greater recovered power by the screw conveyor. In particular, at 4900 kg/h the value of 9.4 kW is similar to the 9 kW of the previous year, obtained with 4800 kg/h and a different paste.
Therefore, it is the screw conveyor motor speed that is the most important parameter for recovered energy control, and not the differential speed, which instead directly controls the solids extraction (processing parameter) depending on the rheological characteristics of the olive paste.
In this way, the recovery system allows the whole machine to use an approximately constant total electric energy (sum of the bowl and screw power consumption) from the public grid, which is less than theoretical requirements ( P E M B ). In fact, the total active power stabilizes at approximately 23 kW during the first harvesting season with variations of approximately ±1 kW, and the energy consumption of the machine tends to stabilize rapidly (Figure 4 and Figure 5). During the second harvesting season, when the device works at the maximum flow rate, the active power absorbed is 27.5 kW compared with the 22 kW absorbed at 4900 kg/h (Figure 4). This last value can be compared to the one registered the previous year, even though the paste was different.
The energy recovery system allows an approximately constant global consumption with respect to ∆n, however, it is clearly lower than theoretical value if no recovery system is used, which confirms that the energy consumption of the machine tends to stabilize rapidly. The analysis of the results also indicates that it is possible to vary the process parameters in the optimal ranges to maximize the production yield without affecting the quality of the oil and the energy consumption of the machine. Finally, the model proposed in this study and validated under different experimental operating conditions on a full scale plant allows for a real-time prediction of the power consumption trend of the decanter when varying its working conditions. This has been validated on a two-exit decanter with a low feed flow rate, as is widely used in the olive oil industry. In particular, the tested flow rates are probably the highest, for which the model is well-validated. This information can be used as input data to a machine learning algorithm, continuously updating the process parameters to simultaneously optimize the energy consumption of the machine.

5. Conclusions

In this study, an energy consumption and saving prediction model for a decanter centrifuge was proposed. In particular, the model was developed for a decanter for olive oil production equipped with regenerative braking. To date there have been only limited scientific studies modelling instantaneous energy recovery and typical energy consumption and torque of these centrifuges. The proposed model was developed using fluid dynamic analysis and torque balance equations together with physical considerations to provide a solid basis, and then simplified and experimentally validated to make it simple enough to be implemented in an automatic management system of the machine. Therefore, this could help during both the design stage and operating management of the machine.
The empirical model was validated through power measurements in two different harvesting seasons and by varying the operating conditions (rheological characteristics of the olive paste, mass flow rate, and differential speed of the bowl and screw).
The accuracy of the model for the power absorbed by the bowl and produced and recovered by the screw in each harvesting season is high, with errors less than 5% and high correlation coefficients ( r 2 > 0.90) in each harvesting season. The error increased marginally, although remained below 10%, when the two harvesting seasons were considered together. This error was primarily because of the different rheological characteristics of the olive paste from the two different seasons, which marginally modified the constants in the model. The constants in the mathematical model were also dependent on the geometry of the decanter centrifuge.
Once the throughput characteristics were defined, the screw conveyor motor speed was the critical parameter for directly controlling higher energy recovery. However, the differential speed was found to be a process parameter primarily.
As a final result, this model, coupled with machine learning techniques, could become a suitable tool during the design phase and processing operations to optimize the energetic performance of the machine.

Author Contributions

All authors contributed equally to this work.

Funding

This research received no external funding.

Acknowledgments

The authors are grateful to Domenico Tarantino for technical support.

Conflicts of Interest

The authors declare no conflict of interest.

Nomenclature

e ¯ unit vector
f 1 , f 2 functions depending on the ratio r i / r B
h height of the inversion surface of the flow field (m)
Jmoment of inertia (kg·m2)
Kvarious constants depending on subscript
lhelical coordinate (m)
Ldistance between two consecutive flights (m)
nangular velocity (rpm)
p pressure (bar)
Ppower (W)
r radial coordinate (m)
ttime (s)
Ttorque (Nm)
V ˙ feed flow rate (kg/h)
w ¯ velocity vector (m·s−1)
x x coordinate (m)
y y coordinate (m)
z z coordinate (m)
Greeks
α slope of screw flights with respect to decanter cross-section (rad)
θ angular coordinate (rad)
λ = K B K S 2 constant
μ viscosity (Pa s)
ρ density (kg·m−3)
τtransmission ratio
τ = stress tensor (N·m−2)
ω angular velocity (rad·s−1)
Subscripts
Bbowl
Ccycloidal drive
eexternal: tip of the screw flights
EMelectromagnetic
θ angular axis
iinner surface of the fluid ring (free surface)
lhelical axis
mmean value
r radial axis
S, S1, S2screw conveyor
Vflow rate
yy axis
zz axis
Operators
¯ Nabla
Δ difference

References

  1. Yuan, C.; Zhai, Q.; Dornfeld, D.A. Three dimensional system approach for environmentally sustainable manufacturing. CIRP Ann. Manuf. Technol. 2012, 61, 39–42. [Google Scholar] [CrossRef]
  2. Bianchi, B.; Cavone, G.; Cice, G.; Tamborrino, A.; Amodio, M.; Capotorto, I.; Catalano, P. CO2 Employment as Refrigerant Fluid with a Low Environmental Impact. Experimental Tests on Arugula and Design Criteria for a Test Bench. Sustainability 2015, 7, 3734–3752. [Google Scholar] [CrossRef]
  3. Perone, C.; Catalano, F.; Tamborrino, A.; Giametta, F.; Bianchi, B.; Ayr, U. Study and Analysis of a Cogeneration System with Microturbines in a Food Farming of Dry Pasta. Chem. Eng. Trans. 2017, 58, 499–504. [Google Scholar] [CrossRef]
  4. Pusavec, F.; Krajnik, P.; Kopac, J. Transitioning to sustainable production e Part I: Application on machining technologies. J. Clean. Prod. 2010, 18, 174–184. [Google Scholar] [CrossRef]
  5. Bianchi, B.; Papajova, I.; Tamborrino, R.; Ventrella, D. Characterization of composting mixtures and compost of rabbit by-products to obtain a quality product and plant proposal for industrial production. Riv. Vet. Ital. 2015, 51, 51–61. [Google Scholar] [CrossRef]
  6. Morello, G.; Peri, G.; Planeta, A. Aspetti energetici dell’estrazione dell’olio di oliva in impianti a ciclo continuo. Aspetti Energ. Del. Sist. Agro-Ind. E Loro Influ. Sul. Territ. 1994, 1, 199–215. [Google Scholar]
  7. Özilgena, M.; Sorgüvenb, E. Energy and exergy utilization, and carbon dioxide emission in vegetable oil production. Energy 2011, 36, 5954–5967. [Google Scholar] [CrossRef]
  8. Cappelletti, G.M.; Ioppolo, G.; Nicoletti, G.M.; Russo, C. Energy Requirement of Extra Virgin Olive Oil Production. Sustainability 2014, 6, 4966–4974. [Google Scholar] [CrossRef] [Green Version]
  9. Alta, Z.D.; Ertekin, C. A review on exergy analysis of food production processes. In Proceedings of the International Conference of Agricultural Engineering, Zurich, Switzerland, 6–10 July 2014. [Google Scholar]
  10. Baptista, F.J.; Murcho, D.; Silva, L.L. Efficient Olive oil mills Handbook. TESLA project (Intelligent Energy Europe), IEE/12/758/SI2.644752. 2014. Available online: http://teslaproject.chil.me/download-doc/63246 (accessed on 1 February 2014).
  11. Ho, J.C.; Chandratilleke, T.T. Thermodynamic analysis applied to a food-processing plant. Appl. Energy 1987, 28, 35–46. [Google Scholar] [CrossRef]
  12. Miah, J.H.; Griffiths, A.; McNeill, R.; Poonaji, I.; Martin, R.; Yang, A.; Morse, S. Heat integration in processes with diverse production lines: A comprehensive framework and an application in food industry. Appl. Energy 2014, 132, 452–464. [Google Scholar] [CrossRef]
  13. Caponio, F.; Squeo, G.; Brunetti, L.; Pasqualone, A.; Summo, C.; Paradiso, V.M.; Catalano, P.; Bianchi, B. Influence of the feed pipe position of an industrial scale two-phase decanter on extraction efficiency and chemical-sensory characteristics of virgin olive oil. J. Food Eng. 2018. [CrossRef] [PubMed]
  14. Bianchi, B.; Tamborrino, A.; Santoro, F. Assessment of the energy and separation efficiency of the decanter centrifuge with regulation capability of oil water ring in the industrial process line using a continuous method. J. Agric. Eng. 2013, 278–282. [Google Scholar] [CrossRef]
  15. Tamborrino, A.; Leone, A.; Romaniello, R.; Catalano, P.; Bianchi, B. Comparative experiments to assess the performance of an innovative horizontal centrifuge working in a continuous olive oil plant. Biosyst. Eng. 2015, 129, 160–168. [Google Scholar] [CrossRef]
  16. Tamborrino, A.; Squeo, G.; Leone, A.; Paradiso, V.M.; Romaniello, R.; Summo, C.; Pasqualone, A.; Catalano, P.; Bianchi, B.; Caponio, F. Industrial trials on coadjutants in olive oil extraction process: Effect on rheological properties, energy consumption, oil yield and olive oil characteristics. J. Food Eng. 2017, 205, 34–46. [Google Scholar] [CrossRef]
  17. Leone, A.; Romaniello, R.; Peri, G.; Tamborrino, A. Development of a new model of olives destoner machine: Evaluation of electric consumption and kernel characterization. Biomass Bioenergy 2015, 81, 108–116. [Google Scholar] [CrossRef]
  18. Leone, A.; Romaniello, R.; Zagaria, R.; Tamborrino, A. Mathematical modelling of the performance parameters of a new decanter centrifuge generation. J. Food Eng. 2015, 166, 10–20. [Google Scholar] [CrossRef]
  19. Ayr, U.; Tamborrino, A.; Catalano, P.; Bianchi, B.; Leone, A. 3D computational fluid dynamics simulation and experimental validation for prediction of heat transfer in a new malaxer machine. J. Food Eng. 2015, 154, 30–38. [Google Scholar] [CrossRef]
  20. Leone, A.; Romaniello, R.; Tamborrino, A. Development of prototype for extra virgin olive oil storage, with online control system of the nitrogen injected. Trans. ASABE Am. Soc. Agric. Biol. Eng. 2013, 56, 1–8. [Google Scholar]
  21. Leone, A.; Romaniello, R.; Zagaria, R.; Sabella, E.; De Bellis, L.; Tamborrino, A. Machining effects of different mechanical crushers on pit particle size and oil drop distribution in olive paste. Eur. J. Lipid Sci. Technol. 2015, 117, 271–1279. [Google Scholar] [CrossRef]
  22. Leone, A.; Tamborrino, A.; Zagaria, R.; Sabella, E.; Romaniello, R. Plant innovation in the olive oil extraction process: A comparison of efficiency and energy consumption between microwave treatment and traditional malaxation of olive pastes. J. Food Eng. 2015, 146, 44–52. [Google Scholar] [CrossRef]
  23. Alburquerque, J.A.; Gonzálvez, J.; Garcıa, D.; Cegarra, J. Agrochemical characterisation of “alperujo”, a solid by-product of the two-phase centrifugation method for olive oil extraction. Bioresour. Technol. 2004, 91, 195–200. [Google Scholar] [CrossRef]
  24. Kalogeropoulos, N.; Kaliora, A.C.; Artemiou, A.; Giogios, I. Composition, volatile profiles and functional properties of virgin olive oils produced by two-phase vs three-phase centrifugal decanters. LWT Food Sci. Technol. 2014, 58, 272–279. [Google Scholar] [CrossRef]
  25. Altieri, G.; Di Renzo, G.C.; Genovese, F. Horizontal centrifuge with screw conveyor (decanter): Optimization of oil/water levels and differential speed during olive oil extraction. J. Food Eng. 2013, 119, 561–572. [Google Scholar] [CrossRef]
  26. Altieri, G.; Genovese, F.; Tauriello, A.; Di Renzo, G.C. Innovative plant for the separation of high quality virgin olive oil (VOO) at industrial scale. J. Food Eng. 2015, 166, 325–334. [Google Scholar] [CrossRef]
  27. Pugi, L.; Pagliai, M.; Nocentini, A.; Lutzemberger, G.; Pretto, A. Design of a hydraulic servo-actuation fed by a regenerative braking system. Appl. Energy 2017, 187, 96–115. [Google Scholar] [CrossRef]
  28. Li, L.; Li, X.; Wang, X.; Song, J.; He, K.; Li, C. Analysis of downshift’s improvement to energy efficiency of an electric vehicle during regenerative braking. Appl. Energy 2016, 176, 125–137. [Google Scholar] [CrossRef]
  29. Li, L.; Wang, X.; Xiong, R.; He, K.; Li, X. AMT downshifting strategy design of HEV during regenerative braking for process for energy conservation. Appl. Energy 2016, 183, 914–925. [Google Scholar] [CrossRef]
  30. Fard, S.M.; Khajepour, A. An optimal power management system for a regenerative auxiliary power system for delivery refrigerator trucks. Appl. Energy 2016, 169, 748–756. [Google Scholar] [CrossRef]
  31. Cooperstain, J.L. (Alfa Laval) Variable Frequency Centrifuge Control. U.S. Patent 5,203,762, 20 April 1993. [Google Scholar]
  32. Fiori, C.; Ahn, K.; Rakha, H.A. Power-based electric vehicle energy consumption model: Model development and validation. Appl. Energy 2016, 168, 257–268. [Google Scholar] [CrossRef]
  33. Hermeler, J.; Horstkötter, L.; Hartmann, T. New decanter generation with improved energy efficiency. FS Filtr. Sep. 2013, 13, 30–37. [Google Scholar]
  34. Larsen, J.A.; Alstrøm, P. Online Paramter Estimation for a Centrifugal Decanter System. In Proceedings of the 19th World Congress of the International Federation of Automatic Control, Cape Town, South Africa, 24–29 August 2014. [Google Scholar]
  35. Cheng, O.; Liu, H.; Tian, Y. An Analysis on the Velocity Field of Decanter Centrifuge on the Basis of Fluent. Int. J. Eng. Adv. Res. Technol. (IJEART) 2016, 2, 58–61. [Google Scholar]
  36. Amirante, R.; Catalano, P. Fluid Dynamic Analysis of the Solid-liquid Separation Process by Centrifugation. J. Agric. Engng Res. 2000, 77, 193–201. [Google Scholar] [CrossRef]
  37. Boncinelli, P.; Catalano, P.; Cini, E. Olive paste rheological analysis. Trans. ASABE 2013, 56, 237–243. [Google Scholar] [CrossRef]
  38. Bell, G.R.A.; Symons, D.D.; Pearse, J.R. Mathematical model for solids transport power in a decanter centrifuge. Chem. Eng. Sci. 2014, 107, 114–122. [Google Scholar] [CrossRef]
  39. Altieri, G.; Di Renzo, G.C.; Genovese, F. Preliminary Results about the Energy Saving Applied to the Decanter Centrifuge Used in Olive Oil Extraction. In Proceedings of the International Conference Ragusa SHWA2010, Ragusa, Italy, 16–18 September 2010. [Google Scholar]
  40. Balogun, V.A.; Mativenga, P.T. Modelling of direct energy requirements in mechanical machining processes. J. Clean. Prod. 2013, 41, 179–186. [Google Scholar] [CrossRef]
  41. Jiménez, A.; Beltrán, G.; Aguilera, M.P.; Uceda, M. A sensor-software based on artificial neural network for the optimization of olive oil elaboration process. Sens. Actuators B: Chem. 2008, 129, 985–990. [Google Scholar] [CrossRef]
  42. Sutherland, K. Filtration and separation technology: What’s new with centrifuges? Filtr. Sep. 2009, 46, 30–32. [Google Scholar] [CrossRef]
  43. Records, A.; Sutherland, K. Decanter Centrifuge Handbook, 1st ed.; Elsevier: Amsterdam, Netherlands, 2001. [Google Scholar]
  44. Caponio, F.; Summo, C.; Paradiso, V.M.; Pasqualone, A. Influence of decanter working parameters on the extra virgin olive oil quality. Eur. J. Lipid Sci. Technol. 2014, 116, 1626–1633. [Google Scholar] [CrossRef]
  45. Squeo, G.; Tamborrino, A.; Pasqualone, A.; Leone, A.; Paradiso, V.M.; Summo, C.; Caponio, F. Assessment of the influence of the decanter set-up during continuous processing of olives at different pigmentation index. Food Bioprocess Technol. 2017, 10, 592–602. [Google Scholar] [CrossRef]
  46. Di Giovacchino, L.; Costantini, N.; Ferrante, M.L.; Serraiocco, A. Influence of malaxation time of olive paste on oil extraction yields and chemical and organoleptic characteristics of virgin olive oil obtained by a centrifugal decanter at water saving. Grasas Y Aceites 2002, 53, 179–186. [Google Scholar] [CrossRef]
  47. Catalano, P.; Pipitone, F.; Calafatello, A.; Leone, A. Productive Efficiency of Decanters with Short and Variable Dynamic Pressure Cones. Biosyst. Eng. 2003, 86, 459–464. [Google Scholar] [CrossRef]
  48. Salem, A.I.; Okoth, G.; Thöming, J. An approach to improve the separation of solid-liquid suspensions in inclined plate settlers: CFD simulation and experimental validation. Water Res. 2011, 45, 3541–3549. [Google Scholar] [CrossRef] [PubMed]
  49. Ajayi, O.A. Newtonian flow in an inter-meshing counter-rotating twin screw extruder. J. Mater. Process. Technol. 2002, 128, 196–204. [Google Scholar]
  50. Yu, Q.; Hu, G.H. Development of a helical coordinate system and its application to analysis of polymer flow in screw extruders Part, I. The balance equations in a helical coordinate system. J. Non-Newton. Fluid Mech. 1997, 69, 155–167. [Google Scholar] [CrossRef]
  51. Singh, P.R.; Heldman, D.R. Introduction to Food Engineering, 4th ed.; Food Science and Technology, International Series; Academic Press, Elsevier: Amsterdam, The Netherlands, 2009. [Google Scholar]
  52. Kostic, M. Influence of viscosity function simplification on non-Newtonian velocity and shear rate profiles in rectangular ducts. Int. Commun. Heat Mass Transf. 1993, 20, 515–525. [Google Scholar] [CrossRef]
  53. Boncinelli, P.; Daou, M.; Cini, E.; Catalano, P. A simplified model for designing and regulating centrifugal decanters for olive oil production. Trans. ASABE Am. Soc. Agric. Biol. Eng. 2009, 52, 1961–1968. [Google Scholar] [CrossRef]
  54. Blagojevic, M.; Marjanovic, N.; Djordjevic, Z.; Stojanovic, B.; Disic, A. A New Design of a Two-Stage Cycloidal Speed Reducer. J. Mech. Des. 2011, 133. [Google Scholar] [CrossRef]
  55. Catalano, P.; Fucci, F.; Giametta, F.; La Fianza, G.; Bianchi, B. Vibration analysis using contatctless acquisition system. In Proceedings of the Sensing Technologies for Biomaterial, Food, and Agriculture 2013, Yokohama, Japan, 17 May 2013; pp. 1–7. [Google Scholar] [CrossRef]
  56. Official Journal of the European Communities. European Community Regulation No. 25,68/1991, N.L. 248 of September 5th; Publications Office of the European Union: Bruxelles, Belgique, 1991. [Google Scholar]
  57. Caponio, F.; Durante, V.; Varva, G.; Silletti, R.; Previtali, M.A.; Viggiani, I.; Squeo, G.; Summo, C.; Pasqualone, A.; Gomes, T.; et al. Effect of infusion of spices into the oil cs. Combined malaxation of olive paste and spices on quality of naturally flavoured virgin olive oils. Food Chem. 2016, 202, 211–228. [Google Scholar] [CrossRef] [PubMed]
  58. Squeo, G.; Silletti, R.; Summo, C.; Paradiso, V.M.; Pasqualone, A.; Caponio, F. Influence of calcium carbonate on extraction yield and quality of extra virgin oil from olive (Olea europaea L. cv. Coratina). Food Chem. 2016, 209, 65–71. [Google Scholar] [CrossRef]
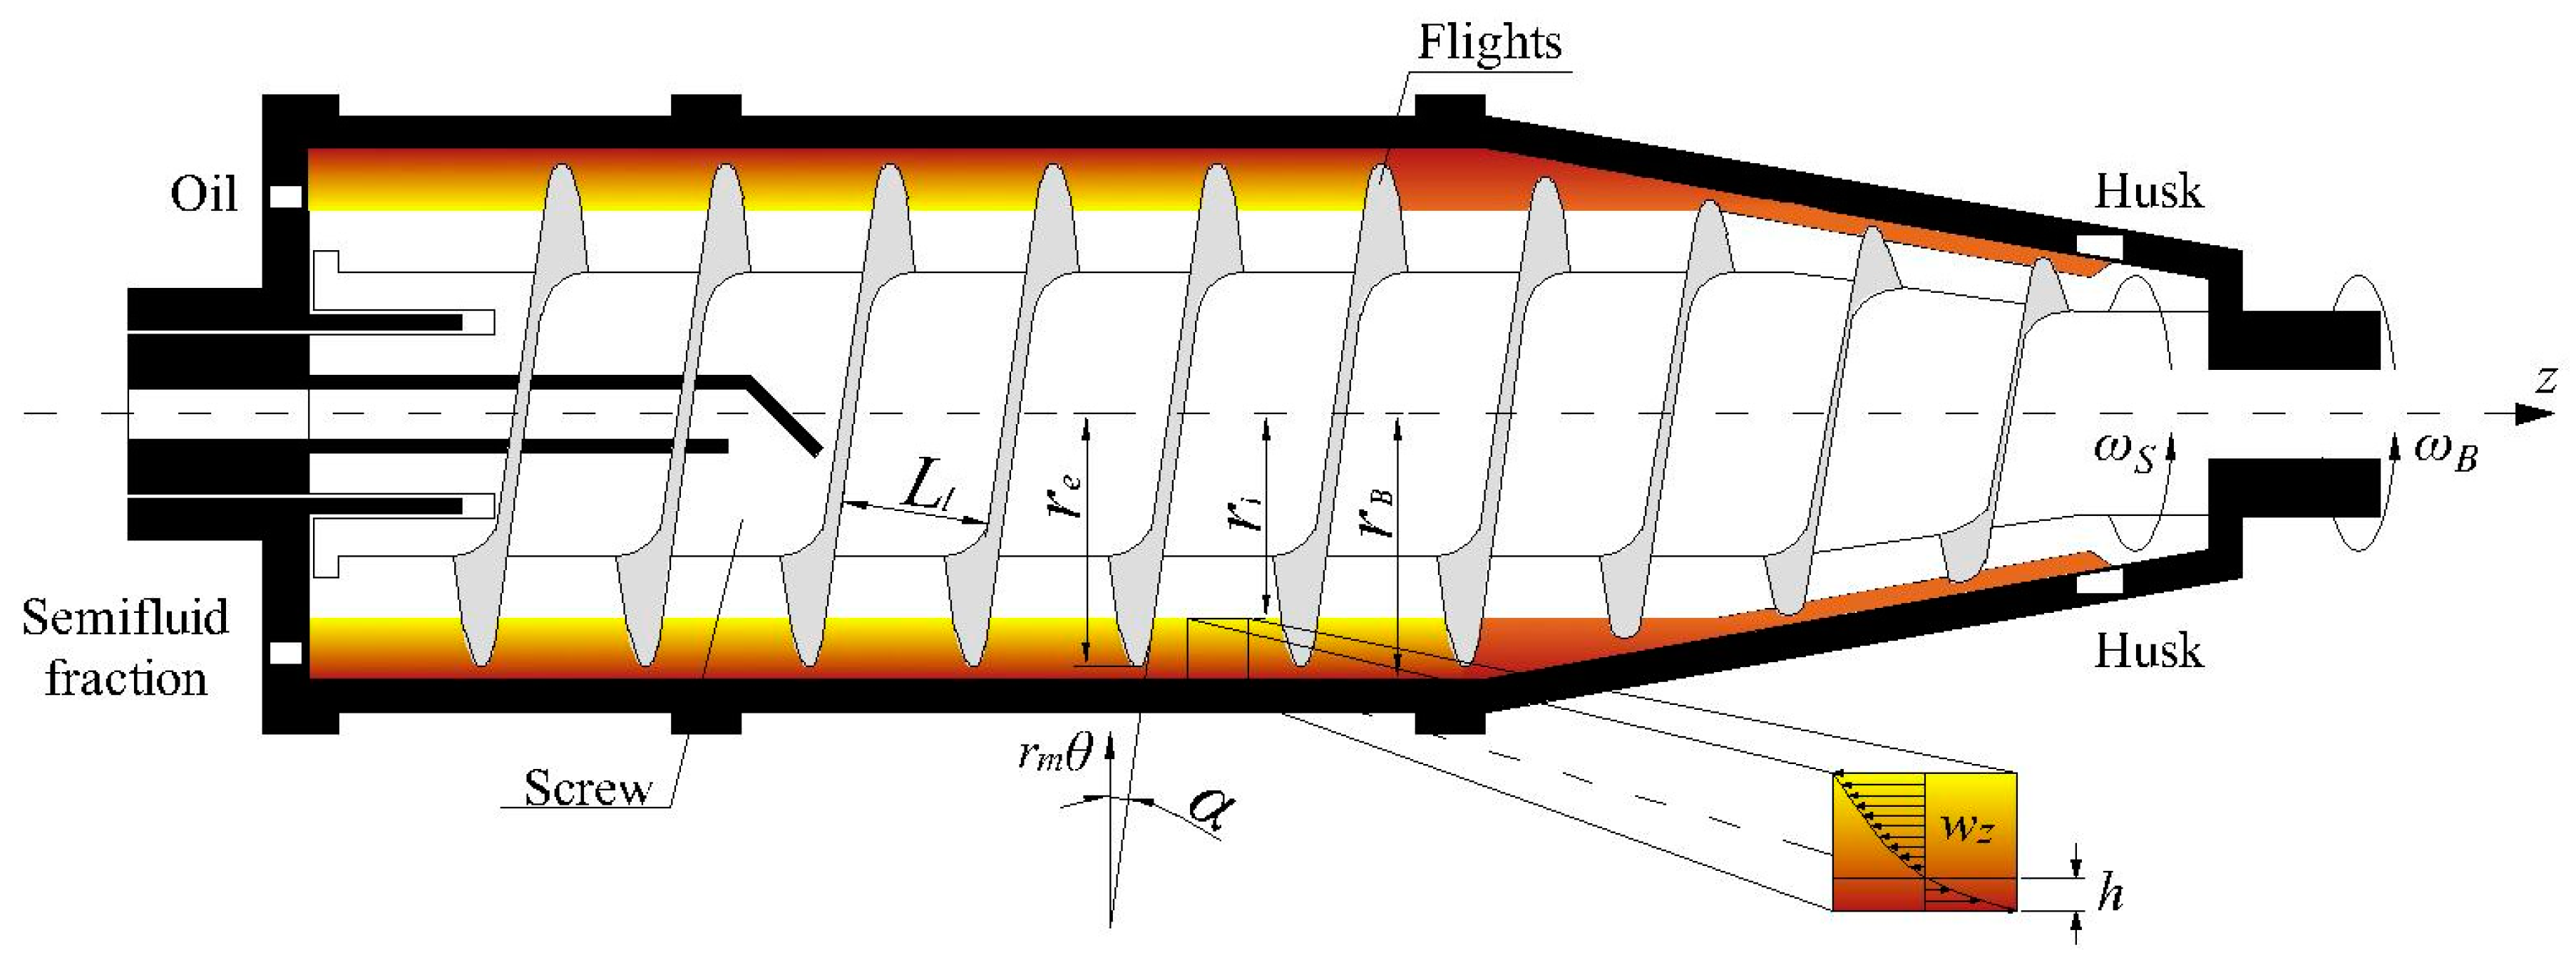
Figure 1. Scheme of the horizontal decanter system used.
Energies 12 02592 g001
Figure 2. Decanter electro-mechanical transmission: (1) power supply; (2) screw energy recovery inverter; (3) screw electric motor power supply; (4) screw electric motor; (5) bowl inverter; (6) inverter series connection; (7) bowl electric motor power supply; (8) bowl electric motor; (9) screw conveyor belt transmission (τ_S = 1); (10) bowl belt transmission ( τ B = 2.1); (11) planetary gearbox (Δn/n bowl = 1:87); (12) bowl; and (13) screw conveyor.
Energies 12 02592 g002
Figure 3. Coordinate system of screw conveyor.
Energies 12 02592 g003
Figure 4. “Two-fit” case plot: calculated values corresponding to each harvesting season are obtained using separate experimental values acquired during two harvesting seasons.
Energies 12 02592 g004
Figure 5. “All-fit” case plot: calculated values corresponding to each harvesting season are obtained using experimental values acquired during two harvesting seasons, as if they are from a single harvesting season.
Energies 12 02592 g005
Figure 6. Star plot of scores of positive sensory attributes of Virgin Olive Oils (VOOs) from V ˙ = 4900 kg/h and V ˙ = 6000 kg/h trials as functions of differential speed values. Differences were not significant (p ≤ 0.05).
Energies 12 02592 g006
Table 1. Parameter values and nominal operating conditions for the decanter system.
ParameterNominal Operating Conditions
Maximum work of throughput6500 kg/h
Main electric power75 kW
Supply voltage380 V 3-phases
Rated power asynchronous bowl electric motor45 kW
Rated current bowl electric motor80 A
cos ϕ bowl electric motor0.87
Rotational speed of the bowl electric motor1475 rev·min−1
Rated power asynchronous screw conveyor electric motor30 kW
Rated current screw conveyor electric motor54.4 A
cos ϕ screw conveyor electric motor0.87
Rotational speed of the screw conveyor electric motor1470 rev·min−1
Drive ratio of the planetary gear box1/87
Table 2. Experimental parameters.
Mass Flow Rate (kg/h)Harvest SeasonΔn
48001st19.50
48001st15.50
40751st19.50
40751st15.50
49002nd26
49002nd22
49002nd18
60002nd26
60002nd22
60002nd18
Table 3. Sets of calculated unknowns calculated separately for both harvesting seasons (“two-fit” case).
Harvesting Season K B 1 K B 2 K S K S 3
First0.0846−0.00220.1323−0.0012
Second0.0883−0.00420.1065−0.0008
Table 4. Sets of calculated unknowns calculated using all the data available from both harvesting seasons (“all-fit” case).
K B 1 K B 2 K S K S 3
0.0866−0.00330.1336−0.0019
Table 5. Two-way ANOVA model summary, quality indices of the oils (mean ± standard deviation, n = 2), and results of the Fisher’s least significant difference (LSD) test for multiple comparisons.
Parameters V ˙ n V ˙ · n V ˙ = 4900   kg / h V ˙ = 6000 kg/h
p-Values182226182226
FFA (% oleic acid)1.0000.9640.8700.35 ± 0.110.32 ± 0.080.31 ± 0.070.32 ± 0.080.32 ± 0.050.34 ± 0.08
PV (meq O2 kg−1)0.0180.6840.8932.31 ± 0.931.97 ± 0.212.07 ± 0.133.32 ± 0.222.94 ± 0.873.41 ± 0.64
K2320.0010.2310.1181.650 ± 0.021ab1.694 ± 0.029a1.623 ± 0.066abc1.428 ± 0.084d1.506 ± 0.011cd1.564 ± 0.038bc
K2700.2210.8130.5890.161 ± 0.0200.186 ± 0.0180.170 ± 0.0110.148 ± 0.0490.140 ± 0.0020.164 ± 0.035
TPC (mg·kg−1)0.0090.1660.883651 ± 28a598 ± 34ab649 ± 48a581 ± 5ab522 ± 59b554 ± 19b
Tocopherols (mg·kg−1)0.3720.4620.665119.93 ± 13.82132.28 ± 22.26127.57 ± 9.70134.17 ± 14.53142.51 ± 6.30125.12 ± 3.13
Note: V ˙ = mass flow rate; ∆n =18, 22, and 26 are the lowest, medium, and highest differential speeds between the bowl and the screw conveyor, respectively; FFA = free fatty acids; PV = peroxide value; K232 = extinction coefficient at 232 nm; K270 = extinction coefficient at 270 nm; TPC = total phenolic content. When statistically significant, different letters on the same row indicate differences at p ≤ 0.05.