1. Introduction
The interest towards the application of ceramic coatings above all into the aerospace section grows year by year; consequently, techniques which are able to detect small defects must be more sophisticated [
1].
The manufacture of ceramic materials is very complex also because they are not limited to the aerospace section, but they have the opportunity to be applied in many advanced engineering applications [
2,
3,
4,
5,
6]. Insulation properties spelt out in the thermal barrier factor hold bright prospects [
7]. A major drawback, is that they catastrophically fail upon reaching critical stress limits, and manufacturing processes or in-service conditions may introduce flaws [
8].
Coating functions must be well understood in order to examine or determine its qualities. Decorative or ornamental coatings must meet different requirements to protect against wear and temperature [
9]. As described in [
10], numerous factors are important to determining coating qualities.
Non-destructive testing (NDT) is coming into wide use to determine coating thickness and detect coating flaws. Its primary advantage is that the object tested remains intact after testing and can continue in service [
11]. “Flaws” change the properties of the component and may arise both during the manufacture and operation stages. This happens more and more for components subjected to high-stress, such as those in the aerospace sector. These require a pronounced safety standard, which can be linked to NDI (inspection) and NDE (evaluation) reasons. The present paper proposes a technique that offers advantages for a smart detection and subsequent evaluation of damages caused during operation, while meeting prerequisites for the understanding of component failures and/or lifetimes [
12].
Defects in sandwich materials may arise during the same steps above-mentioned for ceramic coatings [
13]. Sandwich structures made in composite materials are usually realized by two thin and relatively stiff skins having the lightweight property; in the middle, there is a thick (called core material) that normally has the low strength property. Greater thicknesses, greater bending stiffness and overall low density are at the basis of sandwich composites. Concerning structural applications, sandwich materials are characterized by high stiffness, fatigue resistance, and lightness which provide an increased uniformity in terms of mechanical properties [
14,
15].
In the present case under analysis, the alumina component has been used as “coating” function, by simulating, e.g,, the AETB-8 material (Alumina Enhanced Thermal Barrier). It is important to remark that by adding Al
2O
3 into the component, the main thermal properties increase; in addition, the weight remains practically the same, as well as the resistance. [
16]. An adhesive tape was placed between the sandwich structure and the alumina tile in order to fix them each other.
Due to the complexity of material structure and bonding process in production, several types of defects that affect the load carrying capacity may occur during the manufacturing process, such as void, inclusion, and disbonding. A kissing bond is a special type of disbond, which is crucial in terms of structural integrity as they can deteriorate due to in-service loading or environmental conditions [
17,
18,
19]. Detecting a kissing bond is a challenge because there is no air pocket or void that can be detected thanks to pulsed thermography (PT) and acousto-ultrasonics (AU) techniques.
The defect detection in this study involved scratch, inclusion, and material loss, which may be caused by high-speed impact in-service. The test analyzed the complex structure by using the above-mentioned NDT techniques. The purpose was to identify every possible defect using an integrated approach.
Both the sandwich structure in carbon fiber reinforced plastic (CFRP) and the alumina tile are presently in common use in the aerospace industry and were provided by the Thales Alenia Space Company.
It is well-known that space structures are strongly subjected to sudden fluctuations of ambient conditions, therefore, safe operation requires that damage must be recognized quickly to prevent catastrophic component failure [
20]. NDT techniques may help a lot to guarantee the structural integrity. Early imperfection detection in materials and construction is critical. Component diversity and complexity demand skills in several complementary inspection methods [
21,
22,
23,
24,
25]. Thermographic tests are increasingly important in composite material inspections. On the one hand, these tests have a lot of pros, although a number of technical problems limit their use. These limitations are now being overcome [
26,
27,
28,
29,
30,
31,
32,
33]. On the other hand, AU technique, which is based on digital signal processing and pattern recognition algorithms, is able to characterize the defects detected in the component under inspection.
This manuscript reports on a proposed integrated testing approach using both IRT and AU for complex sandwich structures manufactured on the basis of advanced aerospace materials. It explores their potential in detecting various defects.
2. Sandwich Structure Sample Construction and General Characteristics
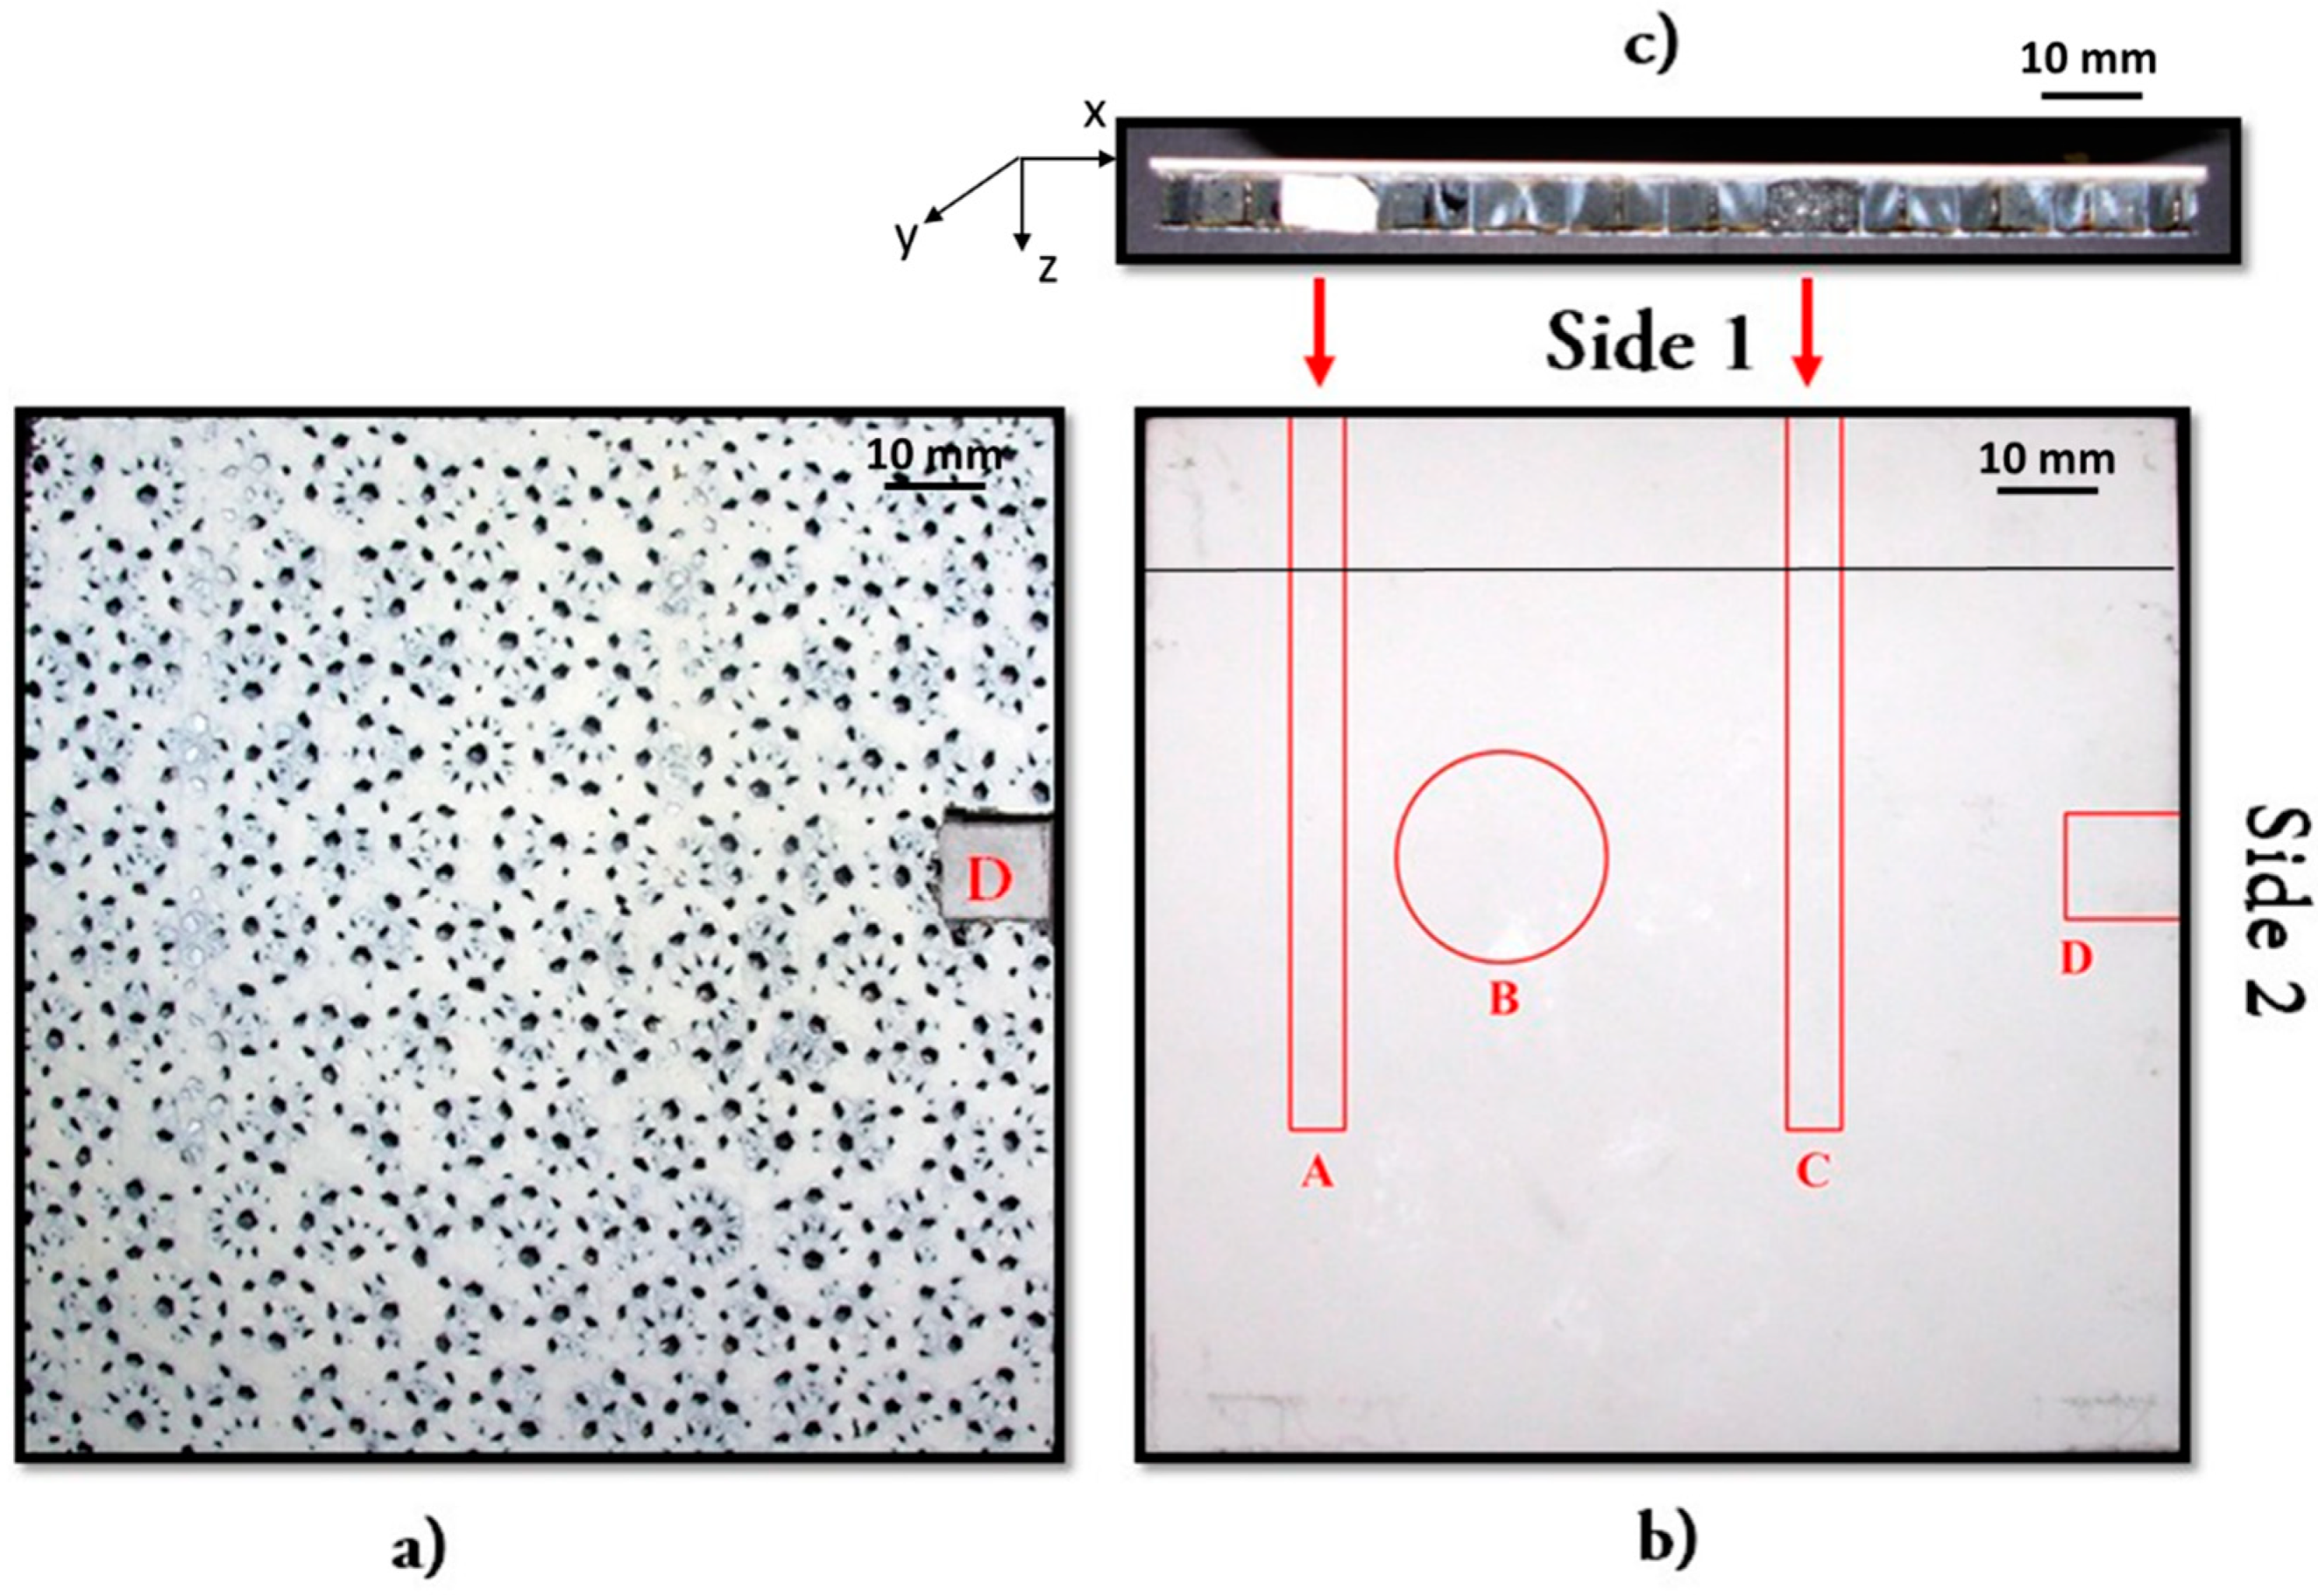
The sample used in this study is 102 mm × 102 mm × 7 mm and is illustrated in
Figure 1. The materials composing the sample are a honeycomb core made by carbon fibers which is located in the middle between two 6 mm-thick CFRP layers (0, 90). This component was linked to a 1 mm-thick alumina ceramic plate through a double-sided adhesive tape. A 3M
TM Scotch-Weld
TM structural adhesive film AF 191 was used into the entire component. The sample core was pierced from side 1. These are hole defects A and C (
Figure 1b,c), although they seem to be cylindrical defects looking at side 1. This is caused by the fact that the materials used for the inclusions are very elastic and they adapt the shape to the cells present on the sides of the sample. Both holes were diameter (φ = 5 mm), length (L = 70 mm), and depth (z = 0.5 mm). The holes were realized by using a drill after the fabrication of the sample. Both were filled with Teflon-covered sponges, which mimic inclusions. Another fabricated defect was realized on side 2 (see defect D in
Figure 1a,b). In the latter case, a 10 mm × 11 mm × 6 mm part of the sandwich was cut to simulate a post-impact material loss. Point B shows a small, thin scratch on the rear side of the alumina ceramic plate, which appears to have no NDT relevance and is reported in
Figure 1 for the sake of completeness.
The complex sandwich structure sample had three layers:
A thin-film ceramic (alumina) substratum (99.6%) (
Figure 1b): interested readers may consult [
34,
35] In order to deepen thermal and mechanical characteristics.
Double-sided adhesive tape, (
Figure 1c) to simulate adhesive between the CFRP material and the alumina layer; and
Sandwich structure (
Figure 1a) that comes from a spacecraft antenna reflector. The fabric material has several openings. It allows noise to be transmitted and dissipated through them. Contextually, it dissipates heat in a very simple way. The outer layer openings are aligned with the inner layer openings to form several openings through the reflector membrane. In the real case, the antenna reflector works into the microwave frequency band. It is worth to be mentioned that the outer layer is strictly in contact with the inner layer.
From a physical and technical point-of-view, more information concerning the antenna reflector structure taken under consideration can be found in [
36]. In particular, it clarify the role of the intersection of the 3 fibers oriented tri-axially along the three main directions of the second microwave reflective layer.
3. Pulsed Thermography
Infrared pulsed thermography (PT) is a simple, rapid non-destructive evaluation (NDE) technique. It offers non-contact detection of the piece being inspected. IRT is often influenced by many conditions, such as reflections of lens and surrounding heat source, surface non-uniformity, and uneven heating. Some control over these influences is possible. Non-uniform heating is an unavoidable problem, which can be minimized, but not overcome, when carrying out the experiment. Data processing can mitigate the effects. Several proposed techniques can reduce the impact of these influences.
3.1. Heat Conduction Theory
The Fourier’s law three-dimensional heat diffusion in a solid can be written as [
37]:
where ∇ is the 3D del operator,
T is temperature,
t is the time,
[m
2/s] is the thermal diffusivity of the material being inspected,
[W/m·K] is thermal conductivity,
[kg/m
3] is density, and
[J/kg·K] is specific heat at constant pressure.
The Fourier’s Law one-dimensional solution for a Dirac pulse propagating through a semi-infinite homogeneous material is given by [
37]:
where
T [K] is the temperature at position
z and time
t;
[K] is the initial temperature;
Q [J/m
2] is the energy absorbed by the surface;
[m] is effusivity, which is a thermal property that measures the material’s ability to exchange heat with its surroundings; and exp is the natural exponential function. A Dirac heating pulse is an ideal waveform, which is defined as an intense unit-area pulse [
38]. Normally the power source produces a squarish pulse.
At the surface (
z = 0 mm), Equation (2) can be rewritten as follows [
37]:
where
is the temperature at the surface (
z = 0 mm) and time
t. Equation (3) is only an approximate solution of the complex three-dimensional heat conduction described by Fourier’s law—Equation (1). Many PT processing techniques are based on this simplification to perform qualitative and quantitative analysis.
3.2. Data Acquisition
The sample surface was submitted to a high-energy stimulation source. There are different excitation sources, basically: pulsed or modulated. Step heating is also found in the literature, referring to a long pulse excitation [
39]. In this study, two high-energy halogen lamps (each provided 1000 watts of power) were used to generate a long pulse heating. Over time, the thermal front travels through the sample. Surface temperature should decrease
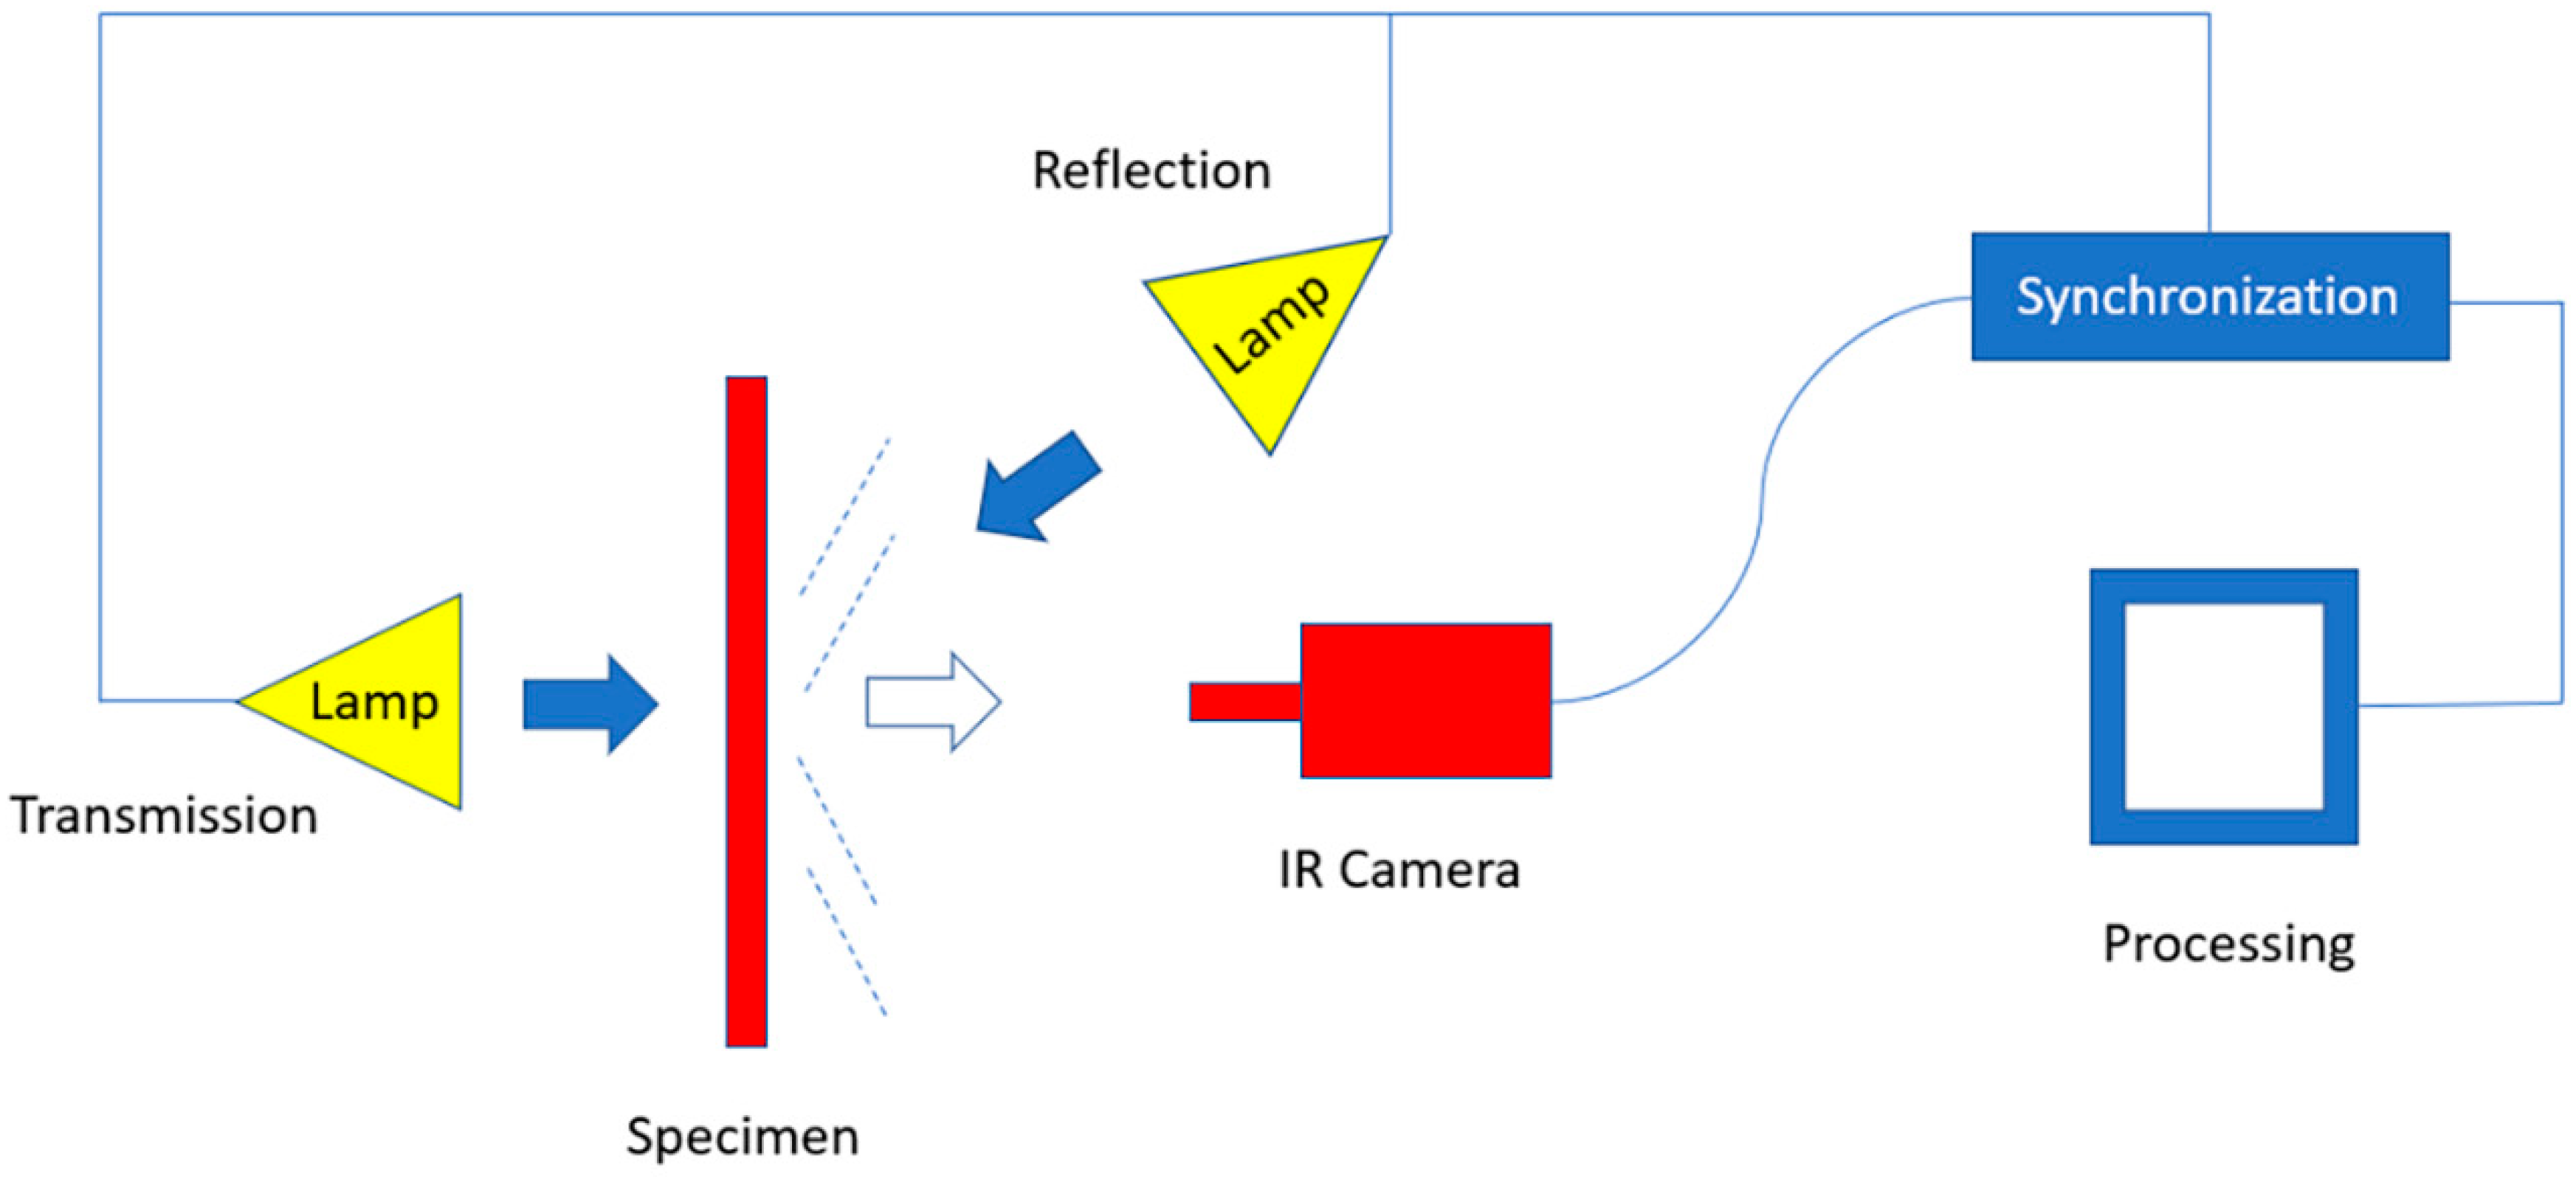
uniformly over time if there are no flaws. Subsurface discontinuities, such as porosity, delamination, disbonding, fibre breakage, and inclusions, can be viewed as resistance to heat flows that produce abnormal temperature patterns at the surface. There are two configurations in which PT inspection can be performed: 1) reflection mode, i.e., excitation and data acquisition are carried out on the same side; 2) transmission mode, i.e., the sample is stimulated from one side whilst data is recorded on the opposite side (
Figure 2). The distance between the lamps and the detected surface was about 1.2 m. Thermal changes were acquired using a cooled focal plane array infrared camera (Phoenix, InSb, 3 to 5 μm) with a 640 × 512 pixels array. A synchronization unit was needed to control the time between the launch of the thermal pulse and recording. Data was stored as a 3D matrix where
x and
y are the spatial coordinates, and
t is time. Temperature decreases approximately at
t1/2, at least early in the process, as predicted by Equation (3), except for the defective areas, where the cooling rates differed. Once data was acquired, it was available for qualitative and quantitative analysis.
Considering the low thermal conductivity of ceramic materials, which acts as a resistance to the thermal front, the transmission mode was used to detect the sample. In the reflection mode, heat propagates from the surface to defect locations and then travels back to the sample surface. The situation is different in the transmission mode where heat travels from the rear surface to the front, considerably reducing the energy requirements for defect detection.
3.3. Pulsed Phase Thermography
In pulsed phase thermography [
40,
41], data is transformed from the time domain to the frequency spectra, using a one-dimensional discrete Fourier transform (DFT):
where
n designates the frequency increment (
n = 0, 1, …
N),
is the sampling interval,
k is the number of the thermal image,
N is the total number of thermal images,
j is the imaginary number (
j2 = −1), and
and
are the real and the imaginary parts of the transformation, respectively.
Real and imaginary parts of the complex transform are used to estimate the amplitude
, and the phase
:
where tan
−1 denotes arctan function. Equation (4) is slow, but useful. A fast Fourier transform (FFT) algorithm is available in many software packages.
The phase, Equation (6), is of particular interest in NDE as it is less affected than raw thermal data by uneven heating. These phase characteristics are very attractive in qualitative inspections and for quantitative characterization of materials [
42,
43].
3.4. Principal Component Thermography (PCT)
A Fourier transformation is a valuable tool for converting the signal from the temperature-time space to a phase-frequency space. It does so through the use of sinusoidal basis functions. This may not be the ideal choice for representing transient signals such as temperature profiles, typically found in PT. Singular value decomposition (SVD) is an alternative tool to extract spatial and temporal data from a matrix in a compact or simplified manner. Rather than relying on a basis function, SVD is an eigenvector-based transformation that forms an orthonormal space. SVD is close to principal component analysis (PCA) with the difference that SVD simultaneously provides the PCAs in both row and column spaces.
The SVD of an
matrix
A (
) can be calculated as follows [
44]:
where
U is an
orthogonal matrix,
R is a diagonal
matrix with singular values of
A present in the diagonal, and
VT is the transpose of an
orthogonal matrix (characteristic time).
In order to apply SVD to thermographic data, a 3D thermogram matrix representing time and spatial variations must be restated into a 2D
matrix
A. This is done by rearranging the thermograms for every time as columns in
A in such a way that time variations occur column-wise, while spatial variations occur row-wise. In this configuration, the
U columns represent a set of orthogonal statistical modes known as “empirical orthogonal functions” (EOFs), which describe spatial variations of data [
45]. Principal components (PCs), represent time variations, and are arranged row-wise in matrix
VT. The first EOF will represent the most characteristic variability of the data. The second EOF contains the second most important variability. Original data can usually be adequately represented by a few EOFs. Typically, a 1000-thermogram sequence can be replaced by 10 or fewer EOFs [
43].
4. Acousto-Ultrasonics (AU)
AU attempts to quantify damage in composite materials. It involves the ultrasonic excitation, via a special piezo-ceramic transducer, of selected or known points, on the material surface, and the reception, using a similar transducer, of the resulting transient elastic waves at another spot on the material surface. A pulsing transducer introduces broadband Dirac-type pulsed ultrasonic waves into the sample. These waves propagate along the sample length to the receiver transducer. The following paragraph discusses the experimental aspects of data acquisition by AU regarding our sample [
46,
47,
48,
49].
During an AU test, a broadband transducer was used as a pulser and another pico transducer, also broadband, was used as a receiver. Both are manufactured by PAC (Physical Acoustics Corporation USA) and provided by Envirocoustics (Greece).
The transducers were clamped to the sample at 50 mm for each AU measurement. The acquisition board was a 16-bit PCI-2 by PAC. Pre-amplification of 40 dB and band-pass filtering at 20–1200 kHz was performed by 2/4/6-AST preamplifiers, also manufactured by PAC. Δt front end filtering excluded recordings out of the gauge length. The recording parameters peak definition time (PDT), hit definition time (HDT), and hit lockout time (HLT) were set at the following values: PDT = 50 μsec; HDT = 200 μsec; and HLT = 800 μsec. The recording threshold was set at 40 dB.
The positioning of the pulser/receiver system onto the actual surface was significant, as in most qualitative NDT methods. A number of characteristic (signature) signals derived from a healthy, non-defected area had to be obtained. These signals were subsequently compared to the various acquired signals from other locations on the structure under investigation. It has to be stressed that this technique is not static, i.e., the sensors are not mounted onto the surface, but rather moved in every direction, in a scanning manner (either sweep or point modes).
In real test conditions, the initial assumption is that the structure is generally defect-free. From a methodological point of view, the baseline/healthy state signal features needed to be determined first. Then, a scan of the structure was carried out, in either a sweep or grid (canvas) point realization. Signals having features deviating from the healthy state could be used for damage identification and location.
5. Comparisons
The sample was inspected in transmission mode, heated for 3 min with two halogen lamps worked at the maximum power of 1000 watts per lamp. Considering the low thermal conductivity of ceramic materials, the data collection time was set to 7 min. Data acquisition frequency was set to 3 Hz.
Figure 3 presents the result image and profiles obtained by PT in transmission mode. The defects A and C were not quite visible on the raw thermal image (
Figure 3a). The temperature over time of the three defects A, C, and D, and non-defective area appear in
Figure 3b. The profiles corresponding to the defects and non-defective area are separately presented. The curves of defects A and C are indistinguishable because of their similar thermal properties. The cooling curves tended to converge to one line after 420 s. This indicated that 7 min data acquisition time was adequate. It should be noted that infrared radiation from the object was sampled along with the unit digital level (DL). Specimen infrared emissivity was not calibrated. DL was used as the unit of temperature in this study. In infrared thermography, we focused on the temperature difference of the defective region and non-defective region, instead of the measured temperature values. The temperature values may change in different experiments due to the heating conditions and ambient temperature change [
50,
51]. However, our repeated experiments under the proper heating energy and data acquisition time setting showed that the difference between the defective area and the non-defective area are always detectable.
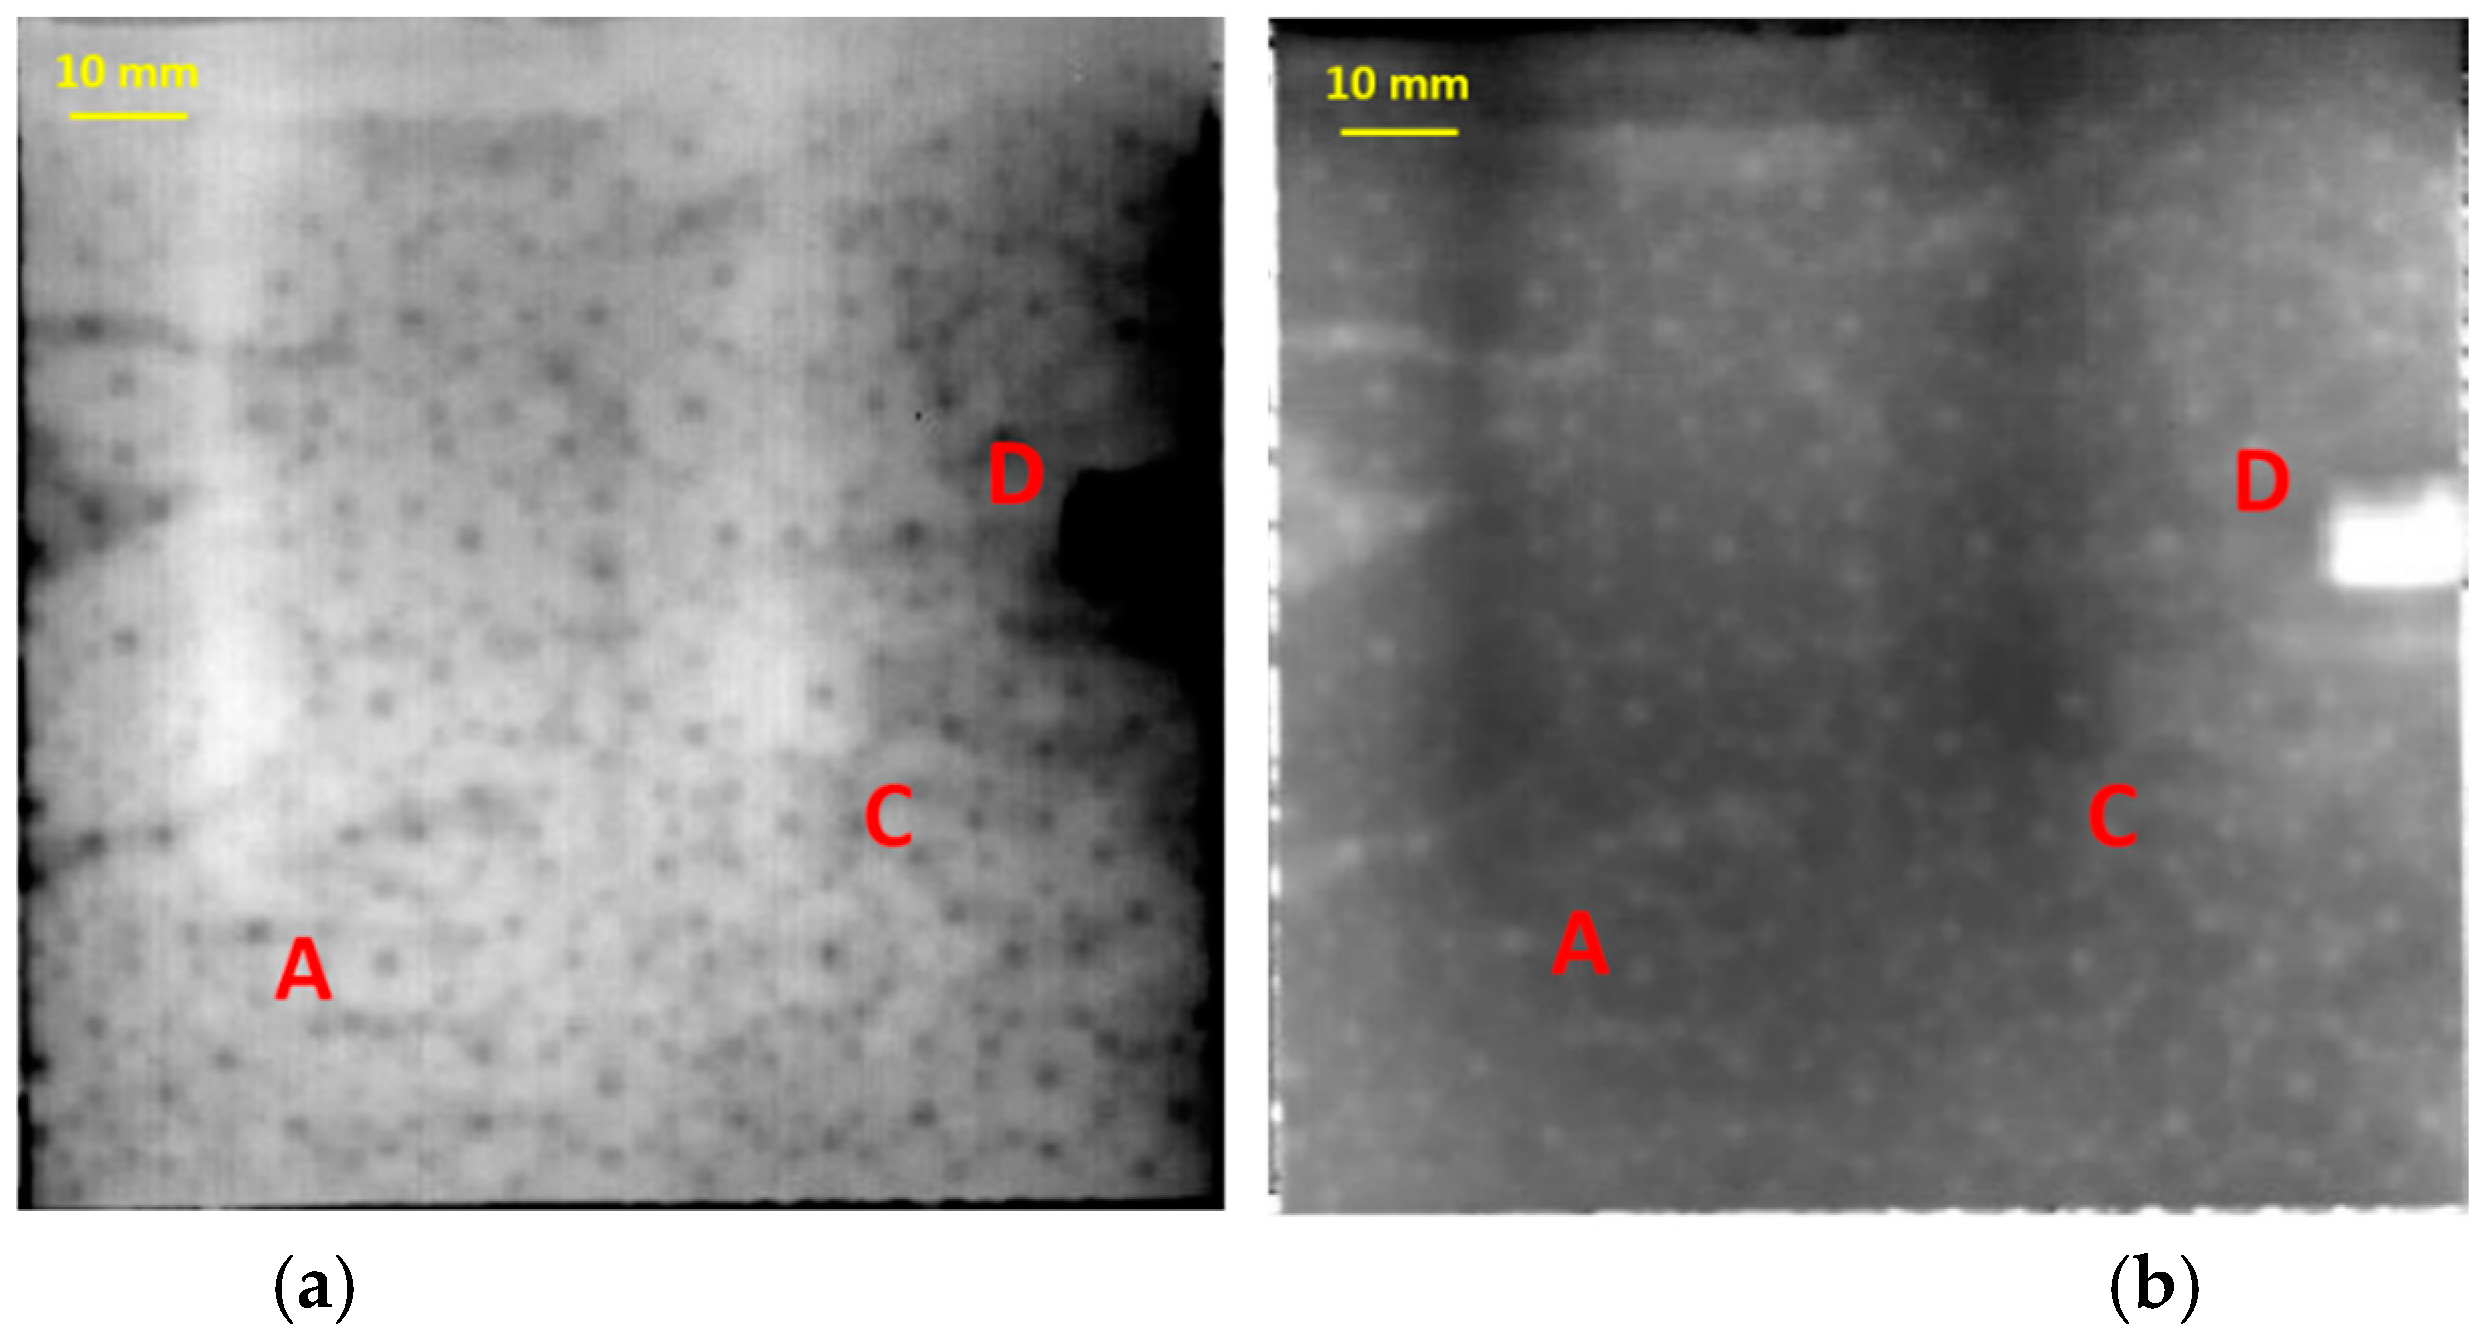
Data was processed by PCT and PPT. The third empirical orthogonal function obtained by PCT appears in
Figure 4a. Defects A, C and D were detected. The honeycomb structure was also seen. A PPT result is shown in
Figure 4b, in which the same features can be seen.
In contrast to the reflection mode, the transmission mode lost depth information. However, for the thick or low thermal conductivity samples, the transmission mode is recommended.
Defect B was not detected by either PT (
Figure 3 and
Figure 4) or AU. The latter technique was conducted to identify and confirm the defects found by the techniques previously described (
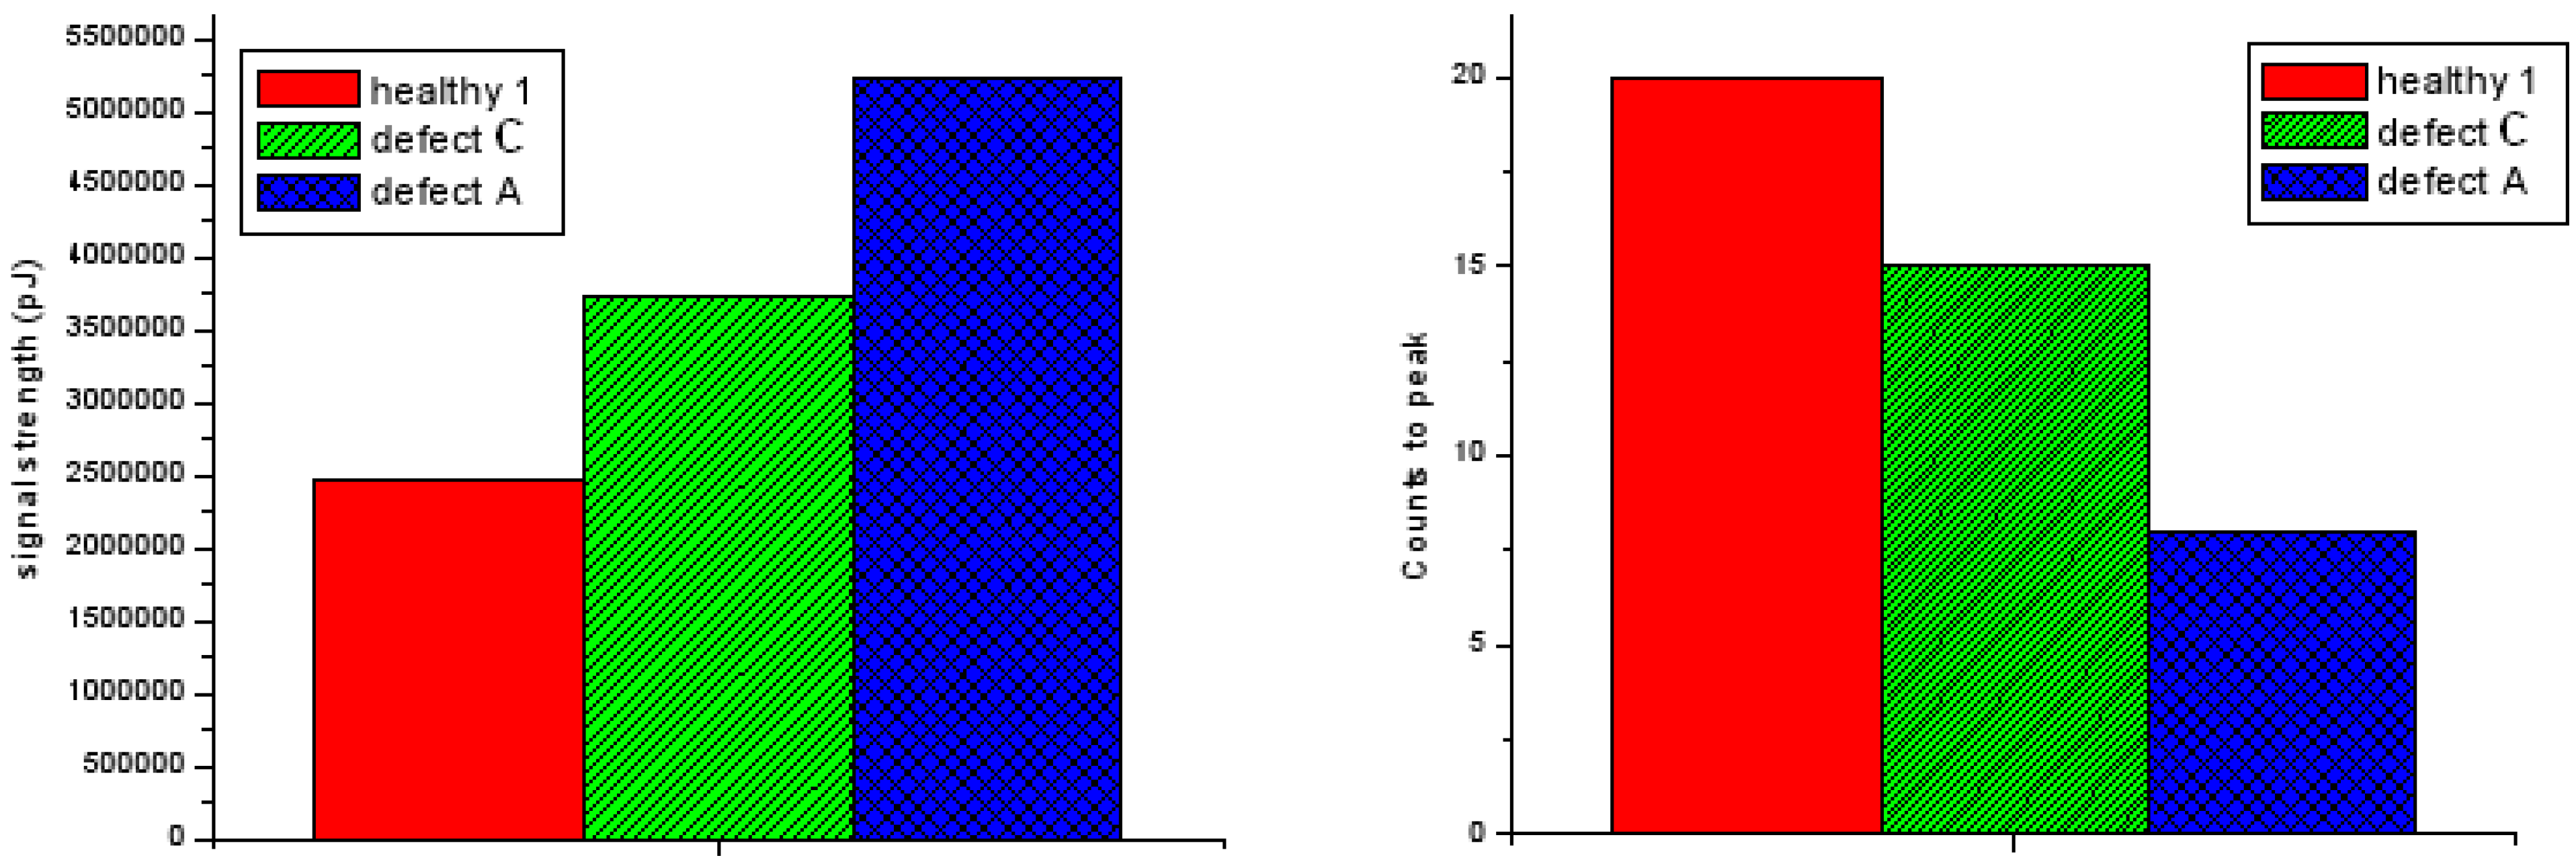
Figure 5). A comparison of defects A and C with the healthy state appears in
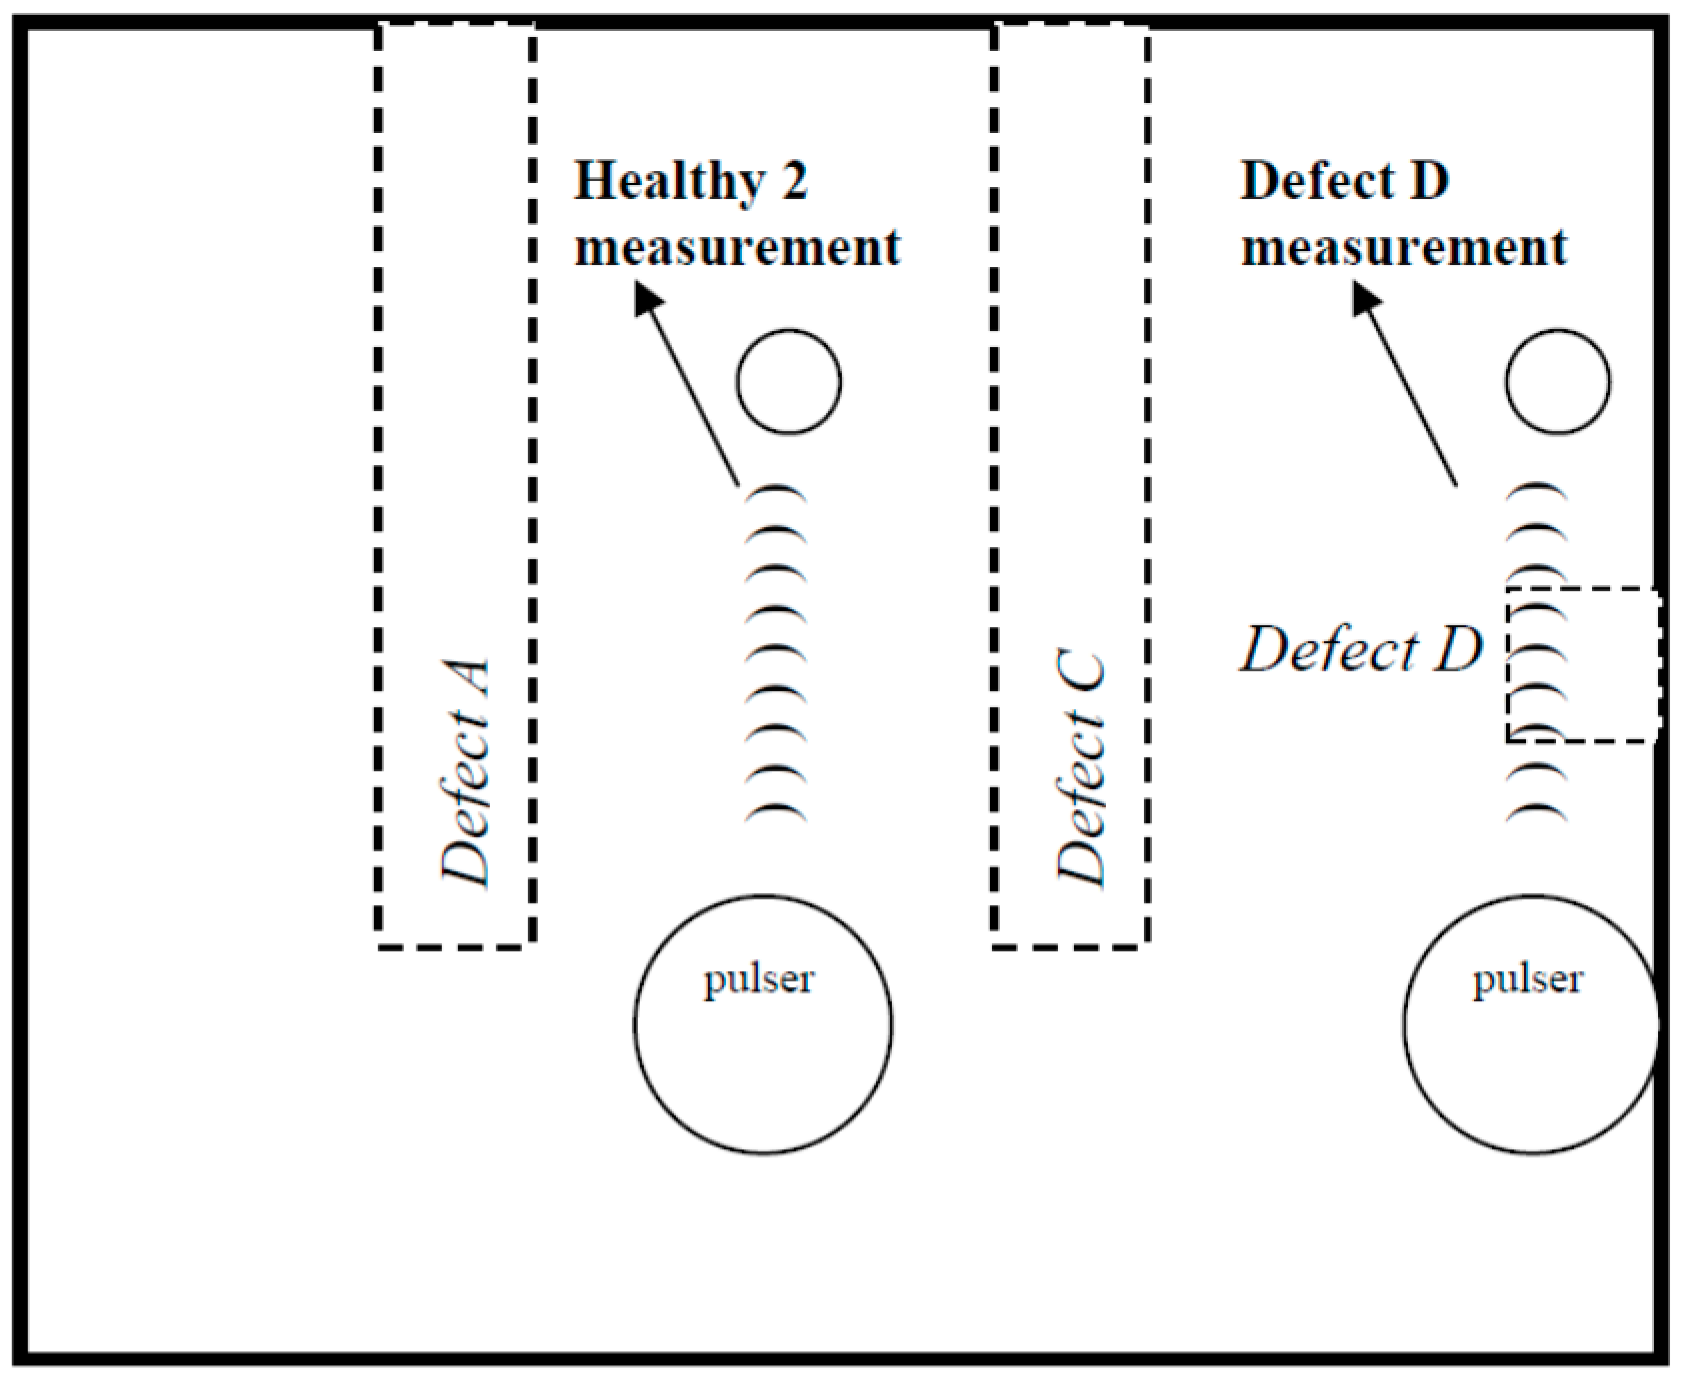
Figure 6. The pulser and receiver distance was always carefully kept constant for the measurements between the healthy and the defected state. In the measurements of defects A and C, and the healthy area, the two sensors were kept 45 mm apart (
Figure 5). In each position at least 15 AU waveforms were recorded. The differences in each defect with the undamaged region were quantified after the extraction of several characteristic parameters from the AU signals.
Parameter mean values were calculated.
Figure 6 shows signal strength and count-to-peak differences. Defects A and C were geometrically similar but entailed sponge material of different densities to simulate different foreign inclusions. The different density changed the acoustic impedance of each defect changing and, in turn, the characteristics of the interaction with the propagating plane wave. So the signal strength and counts-to-peak were different than for defect A and defect C.
For the assessment of defect D compared to the non-defective measurements assessments appear in
Figure 7. The distance of pulser and receiver was kept 40 mm apart in the measurements of defect D and healthy area.
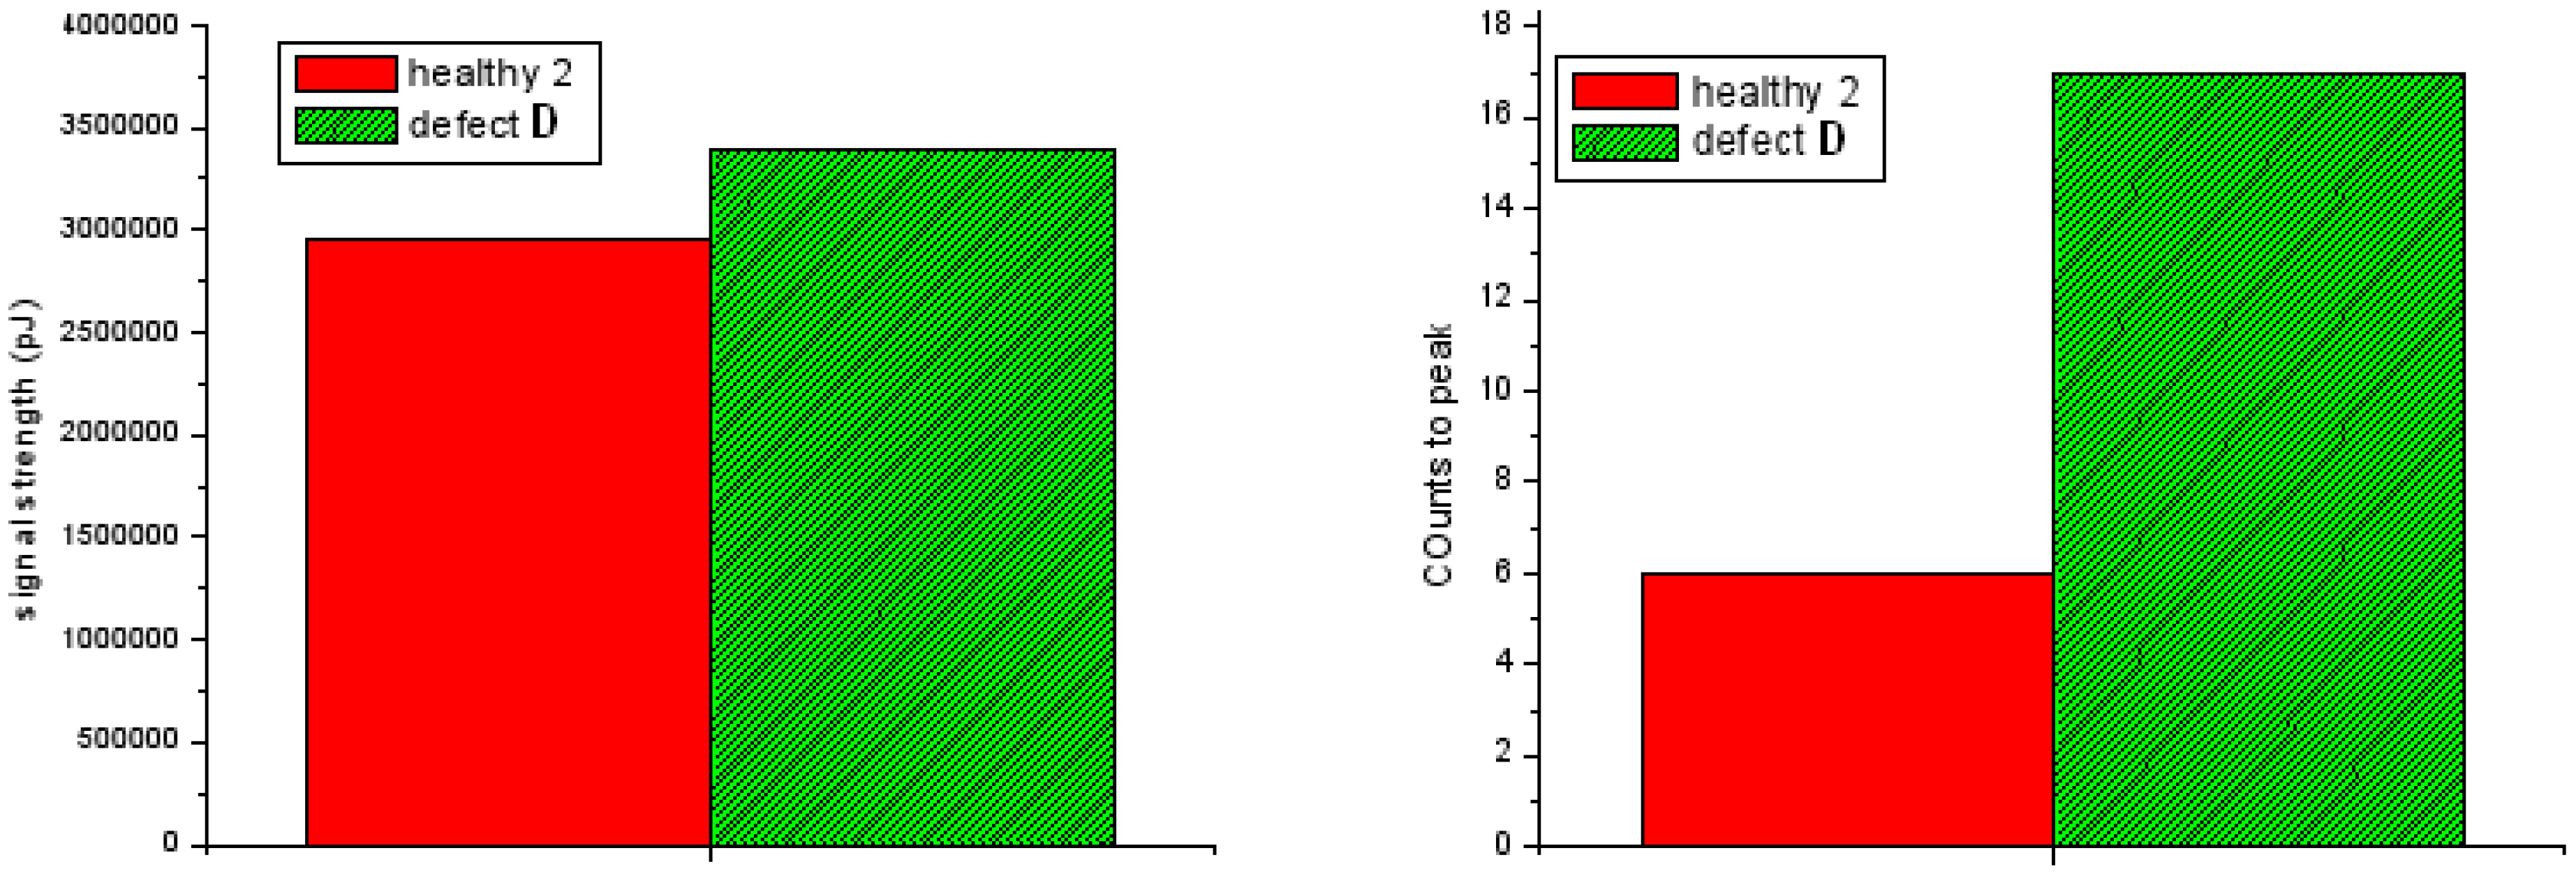
Figure 8 shows signal strength and count-to-peak differences of defect D and healthy area.
Regarding the difference between different healthy areas, in terms of signal features (signal strength and counts to peak), this is due to differences in the distance between the pulser and the receiver. It should be noted that the signal strengths and counts-to-peak values may change in different experiments, due to the differences in the distance between the pulser and the receiver. However, our repeated experiments show that AU can always detect the difference between the defective area and the non-defective area.
6. Conclusions
This study used IRT and AU to evaluate a complex sandwich structure sample. It is concluded that IRT and AU are well-suited for NDT of a complex sandwich structure using a bonded alumina layer.
It was possible to detect perforated honeycomb cells, φ = 5 mm in diameter, of two sponges covered by Teflon, defects A and C, using IRT and AU. Integrating and applying these techniques assists in identifying the greatest number of two kinds of defects, including inclusion and missing material. All these considerations provide a hint of the complementarity of these two techniques for the NDT of materials.
This study qualitatively compared the capability of PT and AU on ceramic-coated sandwich structures detection. Further research will be carried out to quantitively compare the reliability of detection of PT and AU using probability of detection analysis. Moreover, in order to obtain repetitive signal feature values and facilitate scanning, we will fix the pulser and receiver in given mounting points on a holder in the real inspection.
Author Contributions
Y.D., H.Z., S.S., N.P.A. and C.I.-C. conceived of, designed and performed the infrared experiments, analyzed the data and wrote the paper; T.H.L., G.S. and V.K. provided the ultrasound testing; H.F. and F.I.P. provided the assistance to the research; H.Z. and X.P.V.M. are the research supervisors; The manuscript was discussed by all the coauthors.
Funding
This research is supported by the Canada Research Chair in Multipolar Infrared Vision (MiViM) and the Natural Sciences and Engineering Research Council (NSERC) Canada through a Discovery Grant.
Acknowledgments
The authors would like to thank the Thales Alenia Space company—Factory in L’Aquila (Italy)—for providing both the sandwich structure in CFRP and the alumina tile used in this work.
Conflicts of Interest
The authors declare no conflict of interest. The funders had no role in the design of the study; in the collection, analyses, or interpretation of data; in the writing of the manuscript, or in the decision to publish the results.
References
- Chaki, S.; Marical, P.; Panier, S.; Bourse, G.; Mouftiez, A. Interfacial defects detection in plasma-sprayed ceramic coating components using two stimulated infrared thermography techniques. NDT E Int. 2011, 44, 519–522. [Google Scholar] [CrossRef]
- Yao, R.; Liao, S.Y.; Dai, C.L.; Liu, Y.C.; Chen, X.Y.; Zheng, F. Preparation and characterization of novel glass-ceramic tile with microwave absorption properties from iron ore tailings. J. Magn. Magn. Mater. 2015, 378, 367–375. [Google Scholar] [CrossRef]
- Zhang, X.M.; Meng, F.G.; Yang, C.; Seo, H.J. Temperature dependence of luminescence properties of Sr3P4O13:Eu2+ polycrystalline ceramics. J. Lumin. 2013, 140, 74–77. [Google Scholar] [CrossRef]
- Luo, Z.W.; Lu, A.X.; Qu, G.; Lei, Y.J. Synthesis, crystallization behavior, microstructure and mechanical properties of oxynitride glass-ceramics with fluorine addition. J. Non-Cryst. Solids 2013, 362, 207–215. [Google Scholar] [CrossRef]
- Zhou, C.R.; Cen, Z.Y.; Yang, H.B.; Zhou, Q.; Li, W.Z.; Yuan, C.L.; Wang, H. Structure, electrical properties of Bi(Fe, Co)O-3-BaTiO3 piezoelectric ceramics with improved Curie temperature. Phys. B Condens. Matter 2013, 410, 13–16. [Google Scholar] [CrossRef]
- Xu, Q.; Lin, H.; Teng, H.; Chen, C.; Zhou, S.M. Energy transfer mechanisms of quantum cutting near infrared luminescence in Ho3+/Yb3+ co-doped Y2O3 transparent ceramics. J. Non Cryst. Solids 2014, 403, 84–87. [Google Scholar] [CrossRef]
- TTaylor, A.; Bergeron, C.G.; Eppler, R.A. Ceramic coatings. In Metals Handbook, 9th ed.; Zorc, T.B., Ed.; ASM International: Metals Park, OH, USA, 1982; Volume 5, pp. 532–547. [Google Scholar]
- Pascual-Cosp, J.; del Valle, A.R.; Garcıa-Fortea, J.; Sánchez-Soto, P.J. Laser cutting of high-vitrified ceramic materials: Development of a method using a Nd: YAG laser to avoid catastrophic breakdown. Mater. Lett. 2002, 55, 274–280. [Google Scholar] [CrossRef]
- Velde, B.; Druc, I.C. Archaeological Ceramic Materials: Origin and Utilization; Springer Science & Business Media: Berlin/Heidelberg, Germany, 2012. [Google Scholar]
- Kalpakjian, S.; Vijai Sekar, K.S.; Schmid, S.R. Manufacturing Engineering and Technology; Pearson: London, UK, 2014. [Google Scholar]
- Baker, A.; Gunnion, A.J.; Wang, J. On the certification of bonded repairs to primary composite aircraft components. J. Adhes. 2015, 91, 4–38. [Google Scholar] [CrossRef]
- Bhanushali, R.; Ayre, D.; Nezhad, H.Y. Tensile response of adhesively bonded composite-to-composite single-lap joints in the presence of bond deficiency. Procedia CIRP 2017, 59, 139–143. [Google Scholar] [CrossRef]
- He, L.H.; Deng, L.W.; Luo, H.; He, J.; Li, Y.H.; Xu, Y.C.; Huang, H.X. Broadband microwave absorption properties of polyurethane foam absorber optimized by sandwiched cross-shaped metamaterial. Chin. Phys. B 2018, 27, 127801. [Google Scholar] [CrossRef]
- Nezhad, H.Y.; Zhao, Y.; Liddel, P.D.; Marchante, V.; Roy, R. A novel process-linked assembly failure model for adhesively bonded composite structures. CIRP Ann. 2017, 66, 29–32. [Google Scholar] [CrossRef]
- Deardorff, J.R. Non-destructive testing for protective coatings, implementing a lifetime corrosion prevention program. Met. Finish. 2009, 107, 31–39. [Google Scholar] [CrossRef]
- Zhang, H.; Robitaille, F.; Grosse, C.U.; Ibarra-Castanedo, C.; Martins, J.O.; Sfarra, S.; Maldague, X.P. Optical excitation thermography for twill/plain weaves and stitched fabric dry carbon fibre preform inspection. Compos. Part A Appl. Sci. Manuf. 2018, 107, 282–293. [Google Scholar] [CrossRef]
- Wang, F.; Wang, Y.H.; Liu, J.Y.; Wang, Y. Theoretical and experimental study on carbon/epoxy facings-aluminum honeycomb sandwich structure using lock-in thermography. Measurement 2018, 126, 110–119. [Google Scholar] [CrossRef]
- Zhang, H.; Sfarra, S.; Osman, A.; Szielasko, K.; Stumm, C.; Genest, M.; Maldague, X. An Infrared-Induced Terahertz Imaging Modality for Foreign Object Detection in a Lightweight Honeycomb Composite Structure. IEEE Trans. Ind. Inf. 2018, 14, 5629–5636. [Google Scholar] [CrossRef]
- Gurrappa, I.; Rao, A.S. Thermal barrier coatings for enhanced efficiency of gas turbine engines. Surf. Coat. Technol. 2006, 201, 3016–3029. [Google Scholar] [CrossRef]
- Duan, Y.; Zhang, H.; Maldague, X.V.; Ibarra-Castanedo, C.; Servais, P.; Genest, M.; Sfarra, S.; Meng, J. Reliability assessment of pulsed thermography and ultrasonic testing for impact damage of CFRP panels. NDT E Int. 2019, 102, 77–83. [Google Scholar] [CrossRef]
- Liu, B.; Cao, Y.; Zhang, H.; Lin, Y.R.; Sun, W.R.; Xu, B. Weak magnetic flux leakage: A possible method for studying pipeline defects located either inside or outside the structures. NDT E Int. 2015, 74, 81–86. [Google Scholar] [CrossRef]
- Liu, Y.; Meng, X.L.; Liu, J.Y.; Wang, Y.H.; Xu, H.T.; Wang, Y. Simulation and experimental investigation of turbid medium in frequency-domain photoacoustic response induced by modulated laser. Infrared Phys. Technol. 2018, 92, 109–114. [Google Scholar] [CrossRef]
- Ahi, K. Mathematical modeling of THz point spread function and simulation of THz imaging systems. IEEE Trans. Terahertz Sci. Technol. 2017, 7, 747–754. [Google Scholar] [CrossRef]
- Ahi, K.; Shahbazmohamadi, S.; Asadizanjani, N. Quality control and authentication of packaged integrated circuits using enhanced-spatial-resolution terahertz time-domain spectroscopy and imaging. Opt. Lasers Eng. 2018, 104, 274–284. [Google Scholar] [CrossRef]
- Ahi, K. A method and system for enhancing the resolution of terahertz imaging. Measurement 2018, in press. [Google Scholar] [CrossRef]
- Zhang, H.; Yu, L.; Hassler, U.; Fernandes, H.; Genest, M.; Robitaille, F.; Joncas, S.; Holub, W.; Sheng, Y.; Maldague, X. An experimental and analytical study of micro-laser line thermography on micro-sized flaws in stitched carbon fiber reinforced polymer composites. Compos. Sci. Technol. 2016, 126, 17–26. [Google Scholar] [CrossRef]
- Zhang, H.; Sfarra, S.; Saluja, K.; Peeters, J.; Fleuret, J.; Duan, Y.; Fernandes, H.; Avdelidis, N.; Ibarra-Castanedo, C.; Maldague, X. Non-destructive investigation of paintings on canvas by continuous wave terahertz imaging and flash thermography. J. Nondestruct. Eval. 2017, 36, 34. [Google Scholar] [CrossRef]
- Yang, B.; Xu, J.; Wu, H.; He, Y. Magnetic field shielding technique for pulsed remote field eddy current inspection of planar conductors. NDT E Int. 2017, 90, 48–54. [Google Scholar] [CrossRef]
- Peeters, J.; Ibarra-Castanedo, C.; Khodayar, F.; Mokhtari, Y.; Sfarra, S.; Zhang, H.; Maldague, X.; Dirckx, J.J.; Steenackers, G. Optimised dynamic line scan thermographic detection of CFRP inserts using FE updating and POD analysis. NDT E Int. 2018, 93, 141–149. [Google Scholar] [CrossRef]
- Feng, Q.; Gao, B.; Lu, P.; Woo, W.L.; Yang, Y.; Fan, Y.; Qiu, X.; Gu, L. Automatic seeded region growing for thermography debonding detection of CFRP. NDT E Int. 2018, 99, 36–49. [Google Scholar] [CrossRef]
- Zhu, Y.; Gao, B.; Wu, S.; Zhang, Y.; Wang, M.; Woo, W.L.; Liao, Y. A design of multi-mode excitation source for optical thermography nondestructive sensing. Infrared Phys. Technol. 2018, 94, 23–31. [Google Scholar] [CrossRef]
- Zhang, H.; Sfarra, S.; Osman, A.; Szielasko, K.; Stumm, C.; Sarasini, F.; Santulli, C.; Maldague, X. Terahertz Amplitude Polynomial Principle Component Regression for Aramid-Basalt Hybrid Composite Laminate Inspection. IEEE Trans. Ind. Inform. 2018, 14, 5601–5609. [Google Scholar] [CrossRef]
- Zhang, X.; He, Y.; Chady, T.; Tian, G.Y.; Gao, J.; Wang, H.; Chen, S. CFRP Impact Damage Inspection Based on Manifold Learning Using Ultrasonic Induced Thermography. IEEE Trans. Ind. Inform. 2018, in press. [Google Scholar] [CrossRef]
- Richerson, D.W. Modern Ceramic Engineering: Properties, Processing and Use in Design; Marcel Dekker Inc.: New York, NY, USA, 1992; 860p, ISBN 0 8247 8634 3. [Google Scholar]
- King, A.G. Ceramic Technology and Processing; William Andrew Publishing: Norwich, NY, USA, 2002; p. 512. ISBN 0 8155 1443 3. [Google Scholar]
- Available online: https://patents.google.com/patent/US9685710 (accessed on 5 November 2009).
- Carslaw, H.S.; Jaeger, J.C. Conduction of Heat in Solids, 2nd ed.; Clarendon Press: Oxford, UK, 1986. [Google Scholar]
- Bracewell, R. The Fourier Transform and Its Applications; McGraw-Hill: New York, NY, USA, 1965. [Google Scholar]
- Ibarra-Castanedo, C.; Grinzato, E.; Marinetti, S.; Bison, P.; Genest, M.; Grenier, M.; Piau, J.M.; Bendada, A.; Maldague, X. Recent progresses in the inspection of aerospace components by infrared thermography. In Proceedings of the 17th World Conference on Nondestructive Testing, Shanghai, China, 25–28 October 2008. [Google Scholar]
- Maldague, X.; Marinetti, S. Pulse phase infrared thermography. J. Appl. Phys. 1996, 79, 2694–2698. [Google Scholar] [CrossRef]
- Ibarra-Castanedo, C.; Maldague, X. Pulsed phase thermography reviewed. Quant. Infrared Thermogr. J. 2004, 1, 47–70. [Google Scholar] [CrossRef]
- Ibarra-Castanedo, C. Quantitative Subsurface Defect Evaluation by Pulsed Phase Thermography: Depth Retrieval with the Phase. Ph.D. Thesis, Laval University, Quebec City, QC, Canada, 2005. Available online: http://www.theses.ulaval.ca/2005/23016/23016.pdf (accessed on 5 November 2009).
- Zhang, H.; Sfarra, S.; Sarasini, F.; Ibarra-Castanedo, C.; Perilli, S.; Fernandes, H.; Duan, Y.; Peeters, J.; Avdelidis, N.P.; Maldague, X. Optical and mechanical excitation thermography for impact response in basalt-carbon hybrid fiber-reinforced composite laminates. IEEE Trans. Ind. Inform. 2018, 14, 514–522. [Google Scholar] [CrossRef]
- Rajic, N. Principal component thermography for flaw contrast enhancement and flaw depth characterisation in composite structures. Compos. Struct. 2002, 58, 521–528. [Google Scholar] [CrossRef]
- Marinetti, S.; Grinzato, E.; Bison, P.G.; Bozzi, E.; Chimenti, M.; Pieri, G.; Salvetti, O. Statistical analysis of IR thermographic sequences by PCA. Infrared Phys. Technol. 2004, 46, 85–91. [Google Scholar] [CrossRef]
- Guo, N.; Cawley, P. Lamb wave propagation in composite laminates and its relationship with acousto-ultrasonics. NDT E Int. 1993, 26, 75–84. [Google Scholar] [CrossRef]
- Finlayson, R.D.; Friesel, M.; Carlos, M.; Cole, P.; Lenain, J.C. Health monitoring of aerospace structures with acoustic emission and acousto-ultrasonics. Insight 2001, 43, 155–158. [Google Scholar]
- Philippidis, T.P.; Aggelis, D.G. An acousto-ultrasonic approach for the determination of water-to-cement ratio in concrete. Cem. Concr. Res. 2003, 33, 525–538. [Google Scholar] [CrossRef]
- Sfarra, S.; Bendada, A.; Ibarra-Castanedo, C.; Avdelidis, N.P.; Loutas, T.H.; Sotiriadis, G.; Kostopoulos, V.; Ambrosini, D.; Paoletti, D.; Maldague, X. Experimental comparison of infrared thermography, holographic interferometry and acousto-ultrasonics on a complex sandwich structure sample. In Proceedings of the 10th European Conference on Non-Destructive Testing, Moscow, Russia, 7–11 June 2010. [Google Scholar]
- Sfarra, S.; Cicone, A.; Yousefi, B.; Ibarra-Castanedo, C.; Perilli, S.; Maldague, X. Improving the detection of thermal bridges in building via on-site infrared thermography: the potentialities of innovative mathematical tools. Energ. Buildings 2019, 182, 159–171. [Google Scholar] [CrossRef]
- Perilli, S.; Sfarra, S.; Ambrosini, D.; Paoletti, D.; Mai, S.; Scozzafava, M.; Yao, Y. Combined experimental and computational approach for defect detection in precious walls built in indoor environments. Int. J. Therm. Sci. 2018, 129, 29–46. [Google Scholar] [CrossRef]
© 2019 by the authors. Licensee MDPI, Basel, Switzerland. This article is an open access article distributed under the terms and conditions of the Creative Commons Attribution (CC BY) license (http://creativecommons.org/licenses/by/4.0/).
