1. Introduction
With the rapid development of the Chinese economy, the coal demand and production capacity continue to grow, and the world’s coal production reached 5,481 million tons in 2017. Of this amount, 2,541 million tons of coal was produced in China, accounting for 46.4% of the world’s total coal production. China’s annual coal consumption accounts for 50.7% of the world’s total coal consumption, making it the largest coal consumer in the world [
1]. With the continuous deepening of the coal mining depth and the continuous expansion of the production scope, the geological conditions of coal mines are becoming increasingly complex. Especially in east China, north China, central China, and southwest China, most coal mine fault structures have become well developed. The mining activities of many mines have been transferred from simple mining areas in the early stage to complex mining areas. The in situ stresses of the coal seam have increased, and geological structures such as faults and folds are widely distributed. Therefore, mining under complex conditions is very common in these areas [
2,
3,
4].
The fault structure has a great influence on the mining design, panel layout, safety, production, mining technology, and mine output. Production practices and monitoring analysis show that faults near the panel have an essential impact on the mining stress and dynamic phenomena [
5]. Affected by the DF4 fault, the energy level and frequency of microseismicity events in the Gucheng coal mine of Shandong Province increased significantly, and multiple rockbursts occurred. Of the 50 rockbursts in the Longfeng coal mine, 36 (72%) occurred in the roadway near the fault, and 31 (62%) occurred in the roadway within a range of 5 ~ 25 m from the fault [
6]. The Panel 2408 of the Huafeng coal mine is buried approximately 700 m deep. 150 m above the coal seam is a thick conglomerate layer, the rock layer thickness is 550 m, and the uniaxial compressive strength of the conglomerate layer reaches 80 MPa. The 2408 panel is intersected by a normal fault with a throw of 4 m. When the panel was mined through the fault 50 m, the strenuous movement of the thick conglomerate layer caused a longwall shield collapse accident that was accompanied by water inrush from the roof.
To better understand the mechanism of fault-induced underground mine disasters, many studies have been carried out. Wang used a similar material simulation method to study roof breakage and movement under the influence of faults. The research showed that fault break the integrity of the roof, resulting in more violent roof movement [
2,
3]. Ortlepp et al. [
7,
8,
9] used microseismicity monitoring technology to analyze the microseismicity events in a mine. The research showed that most high-energy microseismicity events are caused by a fault slip. Pan [
10] preliminarily explained the intermittent occurrence of fault rockbursts by establishing a stick-slip instability model. Song [
11] studied the transient process of a joint sliding rockburst by conducting direct shear friction tests with a biaxial servo-controlled rock testing system. Theoretical analysis and physics-based experimental methods have advantages in establishing fault instability models and analyzing fault-slip behaviors, but to analyze the influence of faults on the stope in engineering, the numerical simulation method has obvious advantages because many geological and engineering factors need to be considered, such as the nature of the fault zones, the ground stress distribution, and the spatial extent of mining. Therefore, many scholars have used numerical simulation methods to study the effects of the fault dip, length, and physical and mechanical parameters on the mining stress distribution and fault-slip characteristics [
12,
13,
14,
15,
16]. Studies show that the characteristic parameters of faults have a significant impact on the distribution of mining stresses and the magnitude of fault shear slips.
The ore body of the Lucky Friday Mine was cut by faults, and the microseismic activity, the surrounding rock movement, and the rockburst potential were significantly affected by the faults. By establishing a numerical simulation model of the Lucky Friday Mine, Sainoki studied the influence of fault-slip waves on the rockburst potential under mining activities. It is shown that the shear movement of the fault significantly contributes to the increase in deviatoric stress around the fault, thus suggesting damage to the rockmass and the generation of seismically active zones [
17,
18]. The research of Jiao [
19] and Jiang [
20] by numerical simulation shows that the existence of faults increases the concentration of abutment stress in the stope, and the degree of the stress concentration is positively correlated with the rockburst potential. Excavating orebodies will cause stress redistribution and change the stress state of the faults near the stope. When the shear stress of the faults reaches the peak shear strength, the slip of the faults will produce seismic waves and induce serious rockburst. Therefore, it is impossible to accurately assess the impact risk of a stope by only studying the influence of the fault structure on the distribution of the abutment stress and neglecting the influence of fault-slip processes. Especially for some mines with a dense fault distribution, the panels must pass through faults for recovery. The mining activities during the process of the panel crossing the fault cause continuous disturbances to the fault, and the stress variation of the faults is very complicated. Moreover, if the direction of the panel being mined through the fault is different, the stress variation of the fault is also obviously different. Although the situation of a coal seam intersecting a fault and panel mined through the fault is very common in the field, research on the behaviors of faults and the mechanisms of fault-slips during the mining of a panel through a fault is still insufficient. Therefore, Panel 14310 of the Dongtan coal mine is taken as a case study, and FLAC3D numerical simulation software was used to simulate the stress distribution and fault-slip behavior when mining the panel through a fault. Panel 14310 has a depth of 540 m, a width of 230 m and a strike length of 800 m. The geological structure of the panel is complicated, in which the NF6 normal fault intersects the panel with a dip angle of 60° and a throw of 6 ~ 10 m. The panel is mined through the fault from the footwall, and microseismicity events frequently occur as the panel crosses the fault. The slip mechanisms at different locations of the fault are studied, and the influence of the mining direction is compared to find the connection between the mining activity and fault-slips. The mining stress distribution and fault-slip behavior under the influence of mining are studied, which provides a basis for controlling fault-slip disasters. It is also of great significance to ensure the safe production of mines with dense fault distributions to increase the coal production and ensure the energy supply.
2. Engineering Geological Overview and Microseismicity Data
2.1. Geological and Geotechnical Overview of Dongtan Coal Mine
The Dongtan coal mine is in Jining, Shandong Province, China, where the coal seam is nearly horizontal. The mining technology is fully mechanized coal mining, and all panels in this mine use the retreating longwall method to extract the coal seam. The mining coal seam has an average thickness of 8 m. The fault structure in the minefield is developed and thus has a significant influence on the roadway layout and safe production.
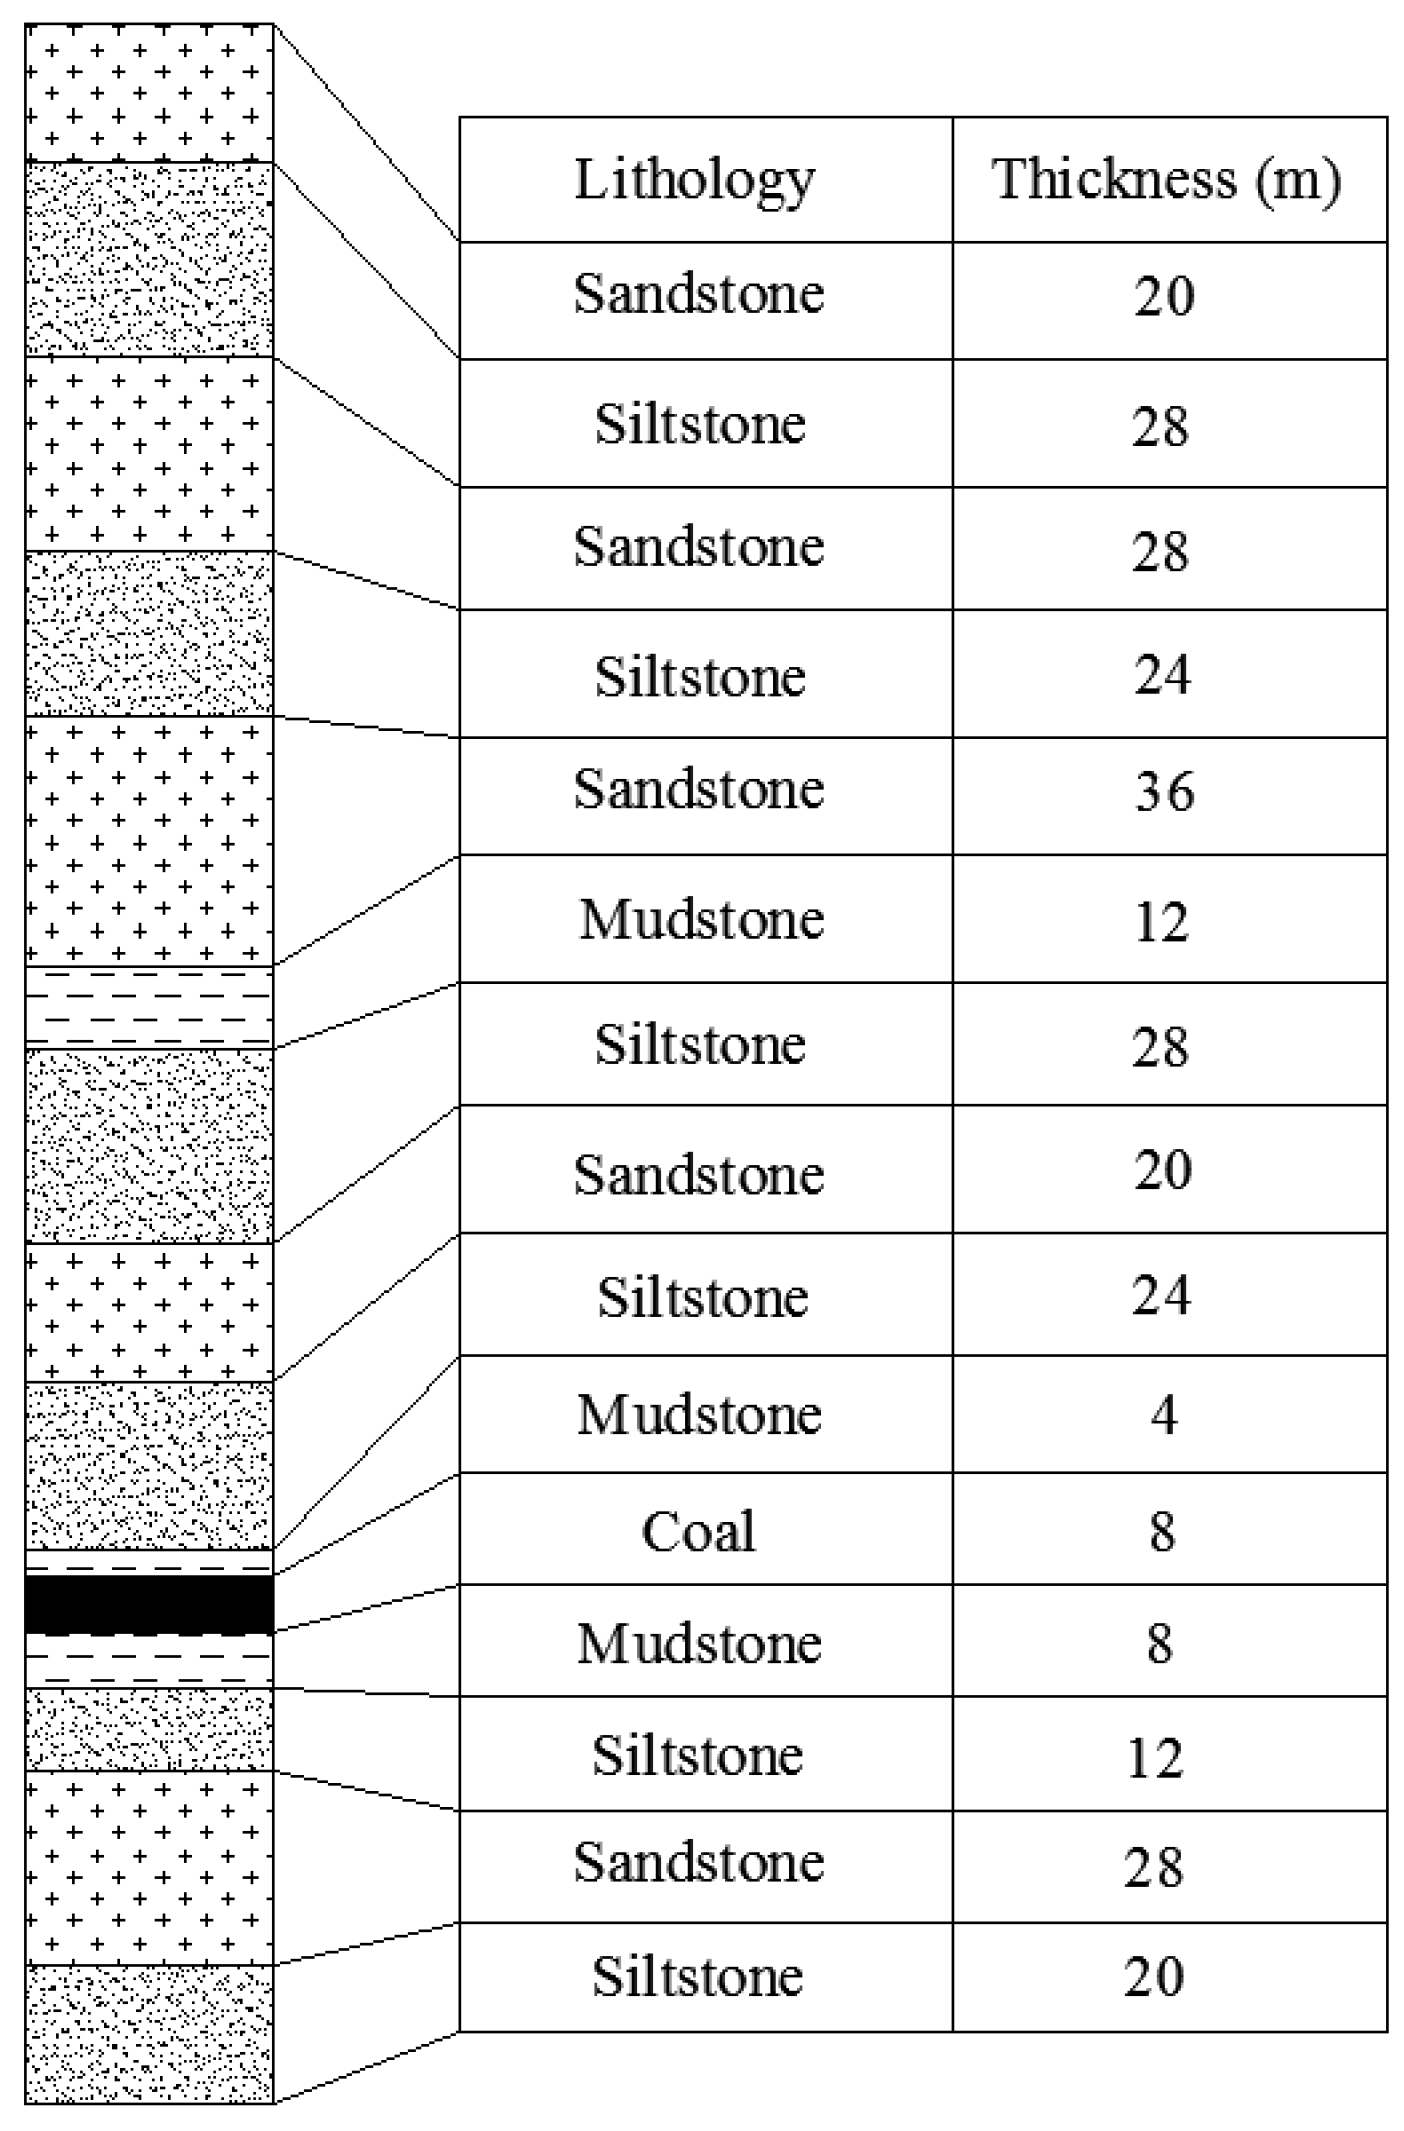
The average thickness of the coal seam of Panel 14310 is 8 m. The rock layer above the coal seam is approximately 4 m of siltstone, and the rock layer above the mudstone is mainly siltstone and sandstone. A typical geological column based on core logging is shown in
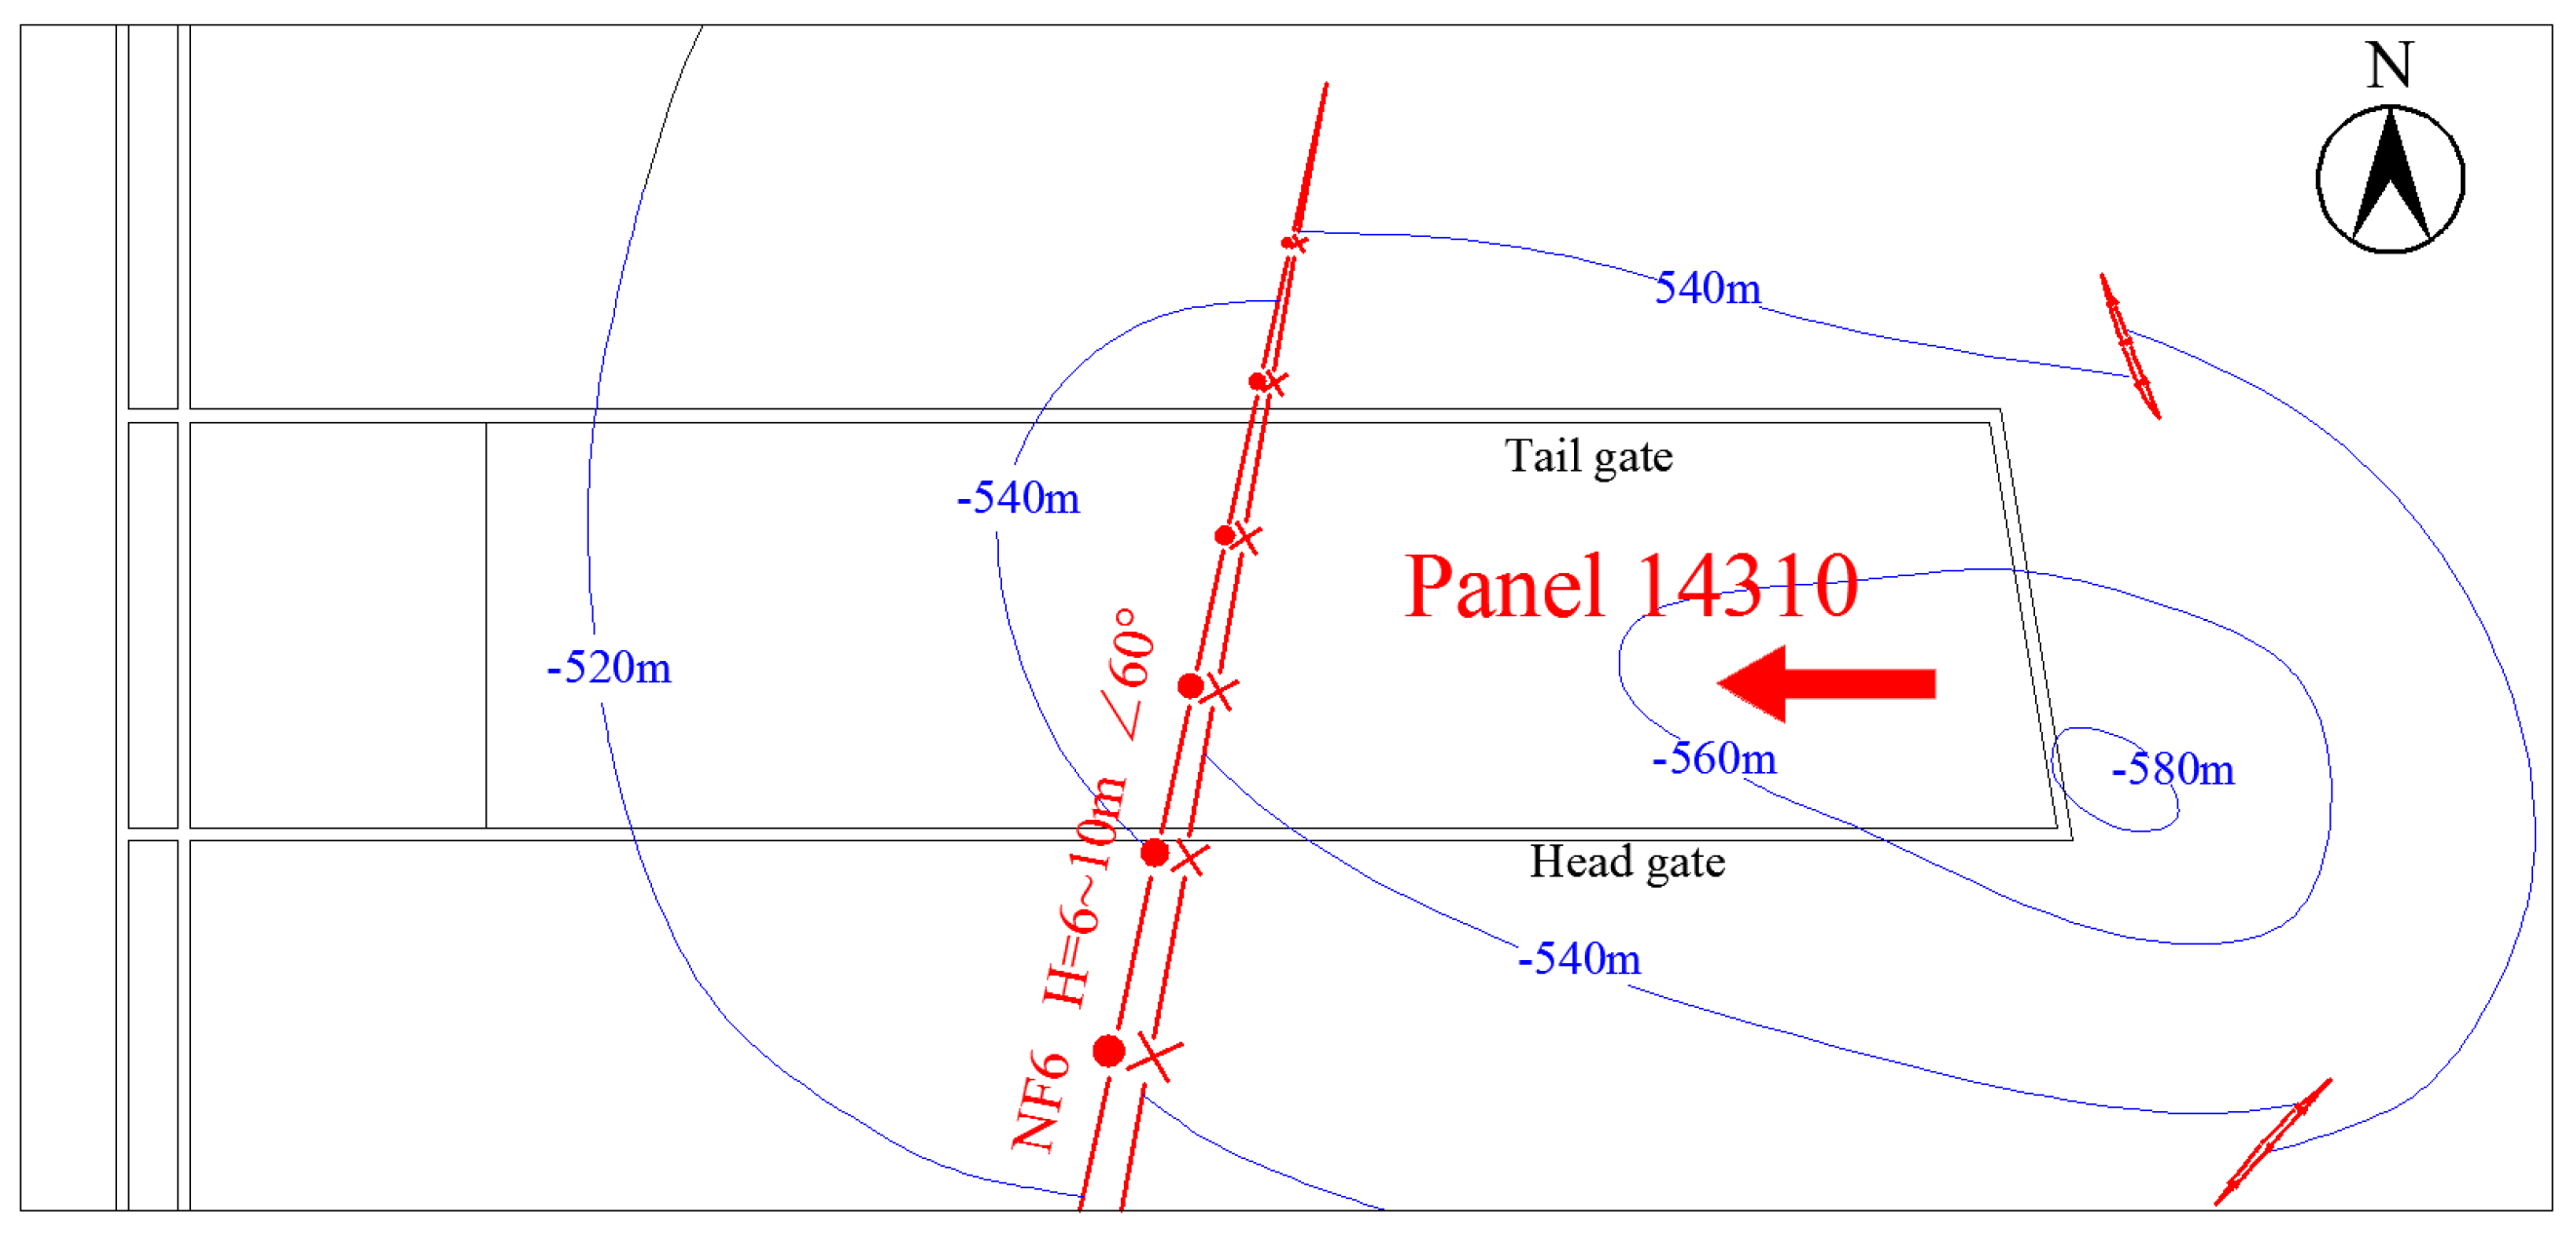
Figure 1. The depth of the panel is 540 m, the width is 220 m, and the strike length is 1000 m, and solid coal surrounds the panel. The geological structure of the panel is complex, with the NF6 normal fault intersecting the panel at a dip angle of 60° with a throw of 6 ~ 10 m. The panel is mined through the fault from the footwall, and the layout of the panel is shown in
Figure 2. The depth contours in
Figure 2 are for the lower layer of the coal seam.
2.2. Microseismicity Data
Underground rocks and coal strata are stressed by a large overburden pressure and tectonic stresses. The sequence of mining excavation perturbs the initial stress field, which may trigger the formation or re-opening and movement of fractures around the excavation openings and beyond, manifesting as microseismicity activities. In this process, the stored strain energy in the immediate vicinity of the event focal region is radiated. Most of the energy is dissipated through the plastic deformation of rock material or transformed into heat or sound, while the remaining part is released in the form of seismic waves and propagates in the subsurface. The induced vibration can be recorded by detection probes and marked as one microseismicity event. In adverse geological environments, the nucleation and connection of large numbers of neighboring microseismicity emissions may give rise to the catastrophic failure of the rock mass in a violent manner, such as through rockbursts [
21,
22,
23].
At the end of May 2010, the Dongtan coal mine began to install and operate the SOS (seismological observation system) system, a microseismicity monitoring system developed by Poland. The system mainly consisted of a central computer, a real-time monitoring recorder server, sensors, and a digital transmission system. There were two main types of sensors: geophones and monitoring probes. The monitoring frequency range of the single sensor was 0~150 Hz, with a sensibility of 110 Vm/s ± 10%, sampling rate of 500 Hz, 2-bit A/D converter, response range of hundreds of meters, and minimum positioning energy of 100 J. The signal was converted into a digital signal by a digital transmission system, which transmitted the data to a real-time monitoring recorder server or central computer via a cable.
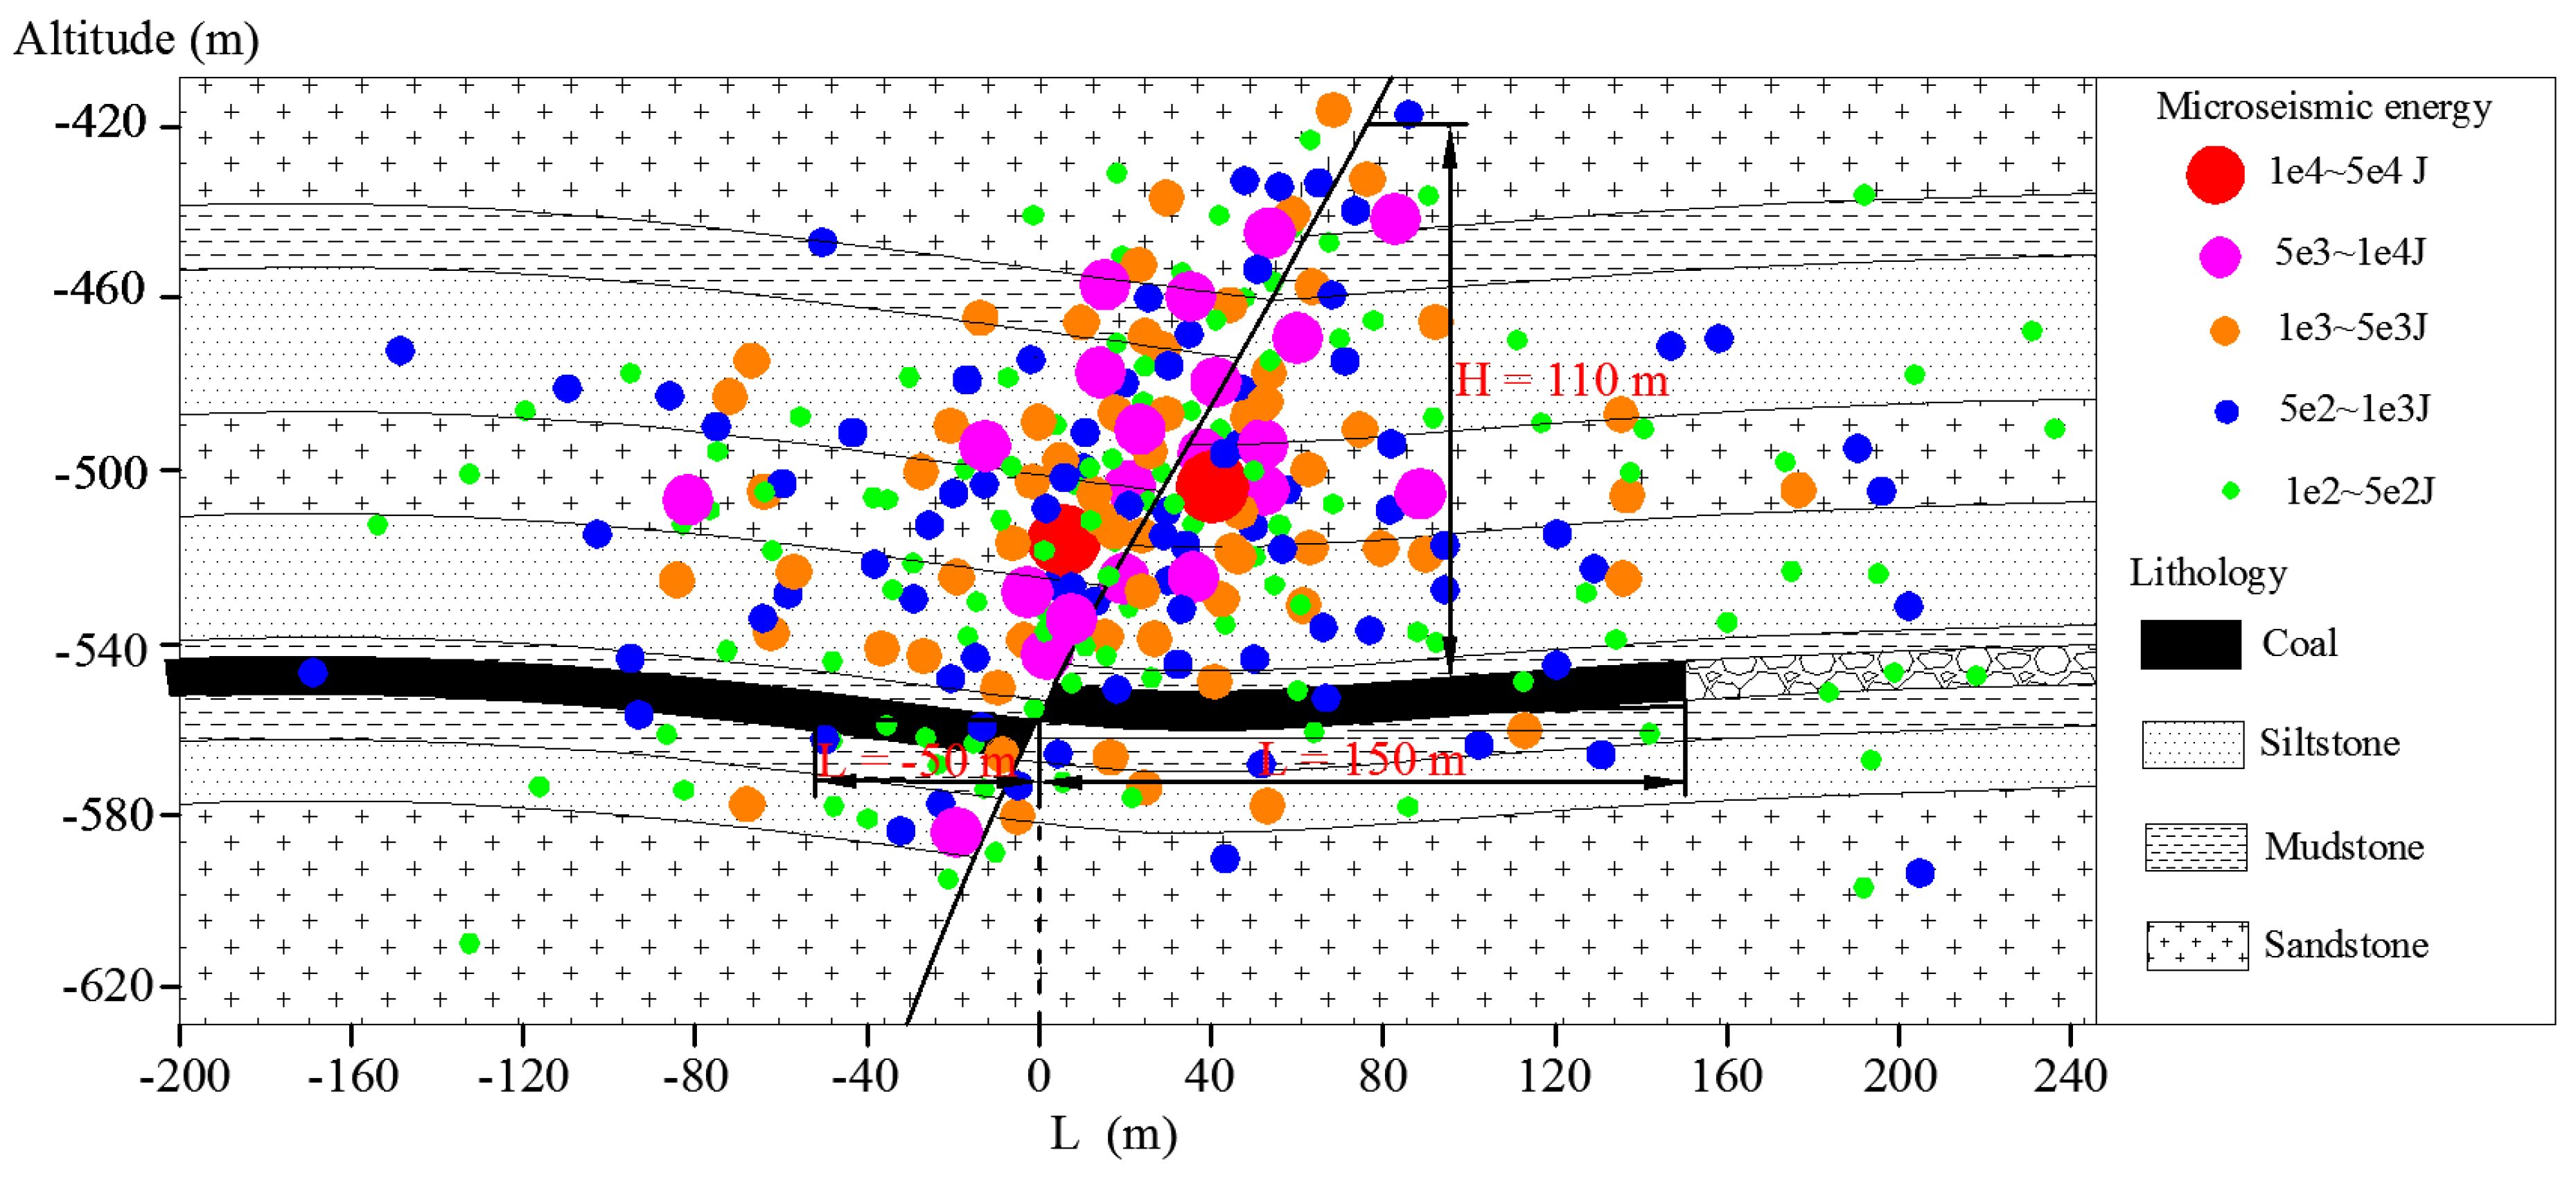
Figure 3 shows the distribution of microseismicity events during the period of mining the panel through the fault (−50 m <
L < 100 m), where
L is the distance of the working face from the fault. When
L is positive, the working face has not been mined through the fault, and when
L is negative, the working face has been mined through the fault.
H represents the distance of the fault or rock layer from the coal-seam roof. When
H is positive, the fault or the rock layer is higher than the coal-seam roof, and when
H is negative, the fault or the rock layer is lower than the coal-seam roof. It can be seen from
Figure 3 that the microseismicity events occurred frequently during the mining of the panel through the fault. The count and energy level of the microseismicity events on the roof are much higher than those of the microseismicity events on the floor, and the microseismicity events with energy levels greater than 5×10
3 J are concentrated near the fault. Two microseismicity events with energy levels greater than 1e4 J occurred near the roof of the fault during the mining of the panel through the fault. Studies have shown that microseismicity event energy levels greater than 1 × 10
4 J can trigger rockburst events [
24,
25,
26]. The height
H of the microseismicity event near the fault reaches 110 m, which is much larger than the height of the microseismicity event in the complete roof layer.
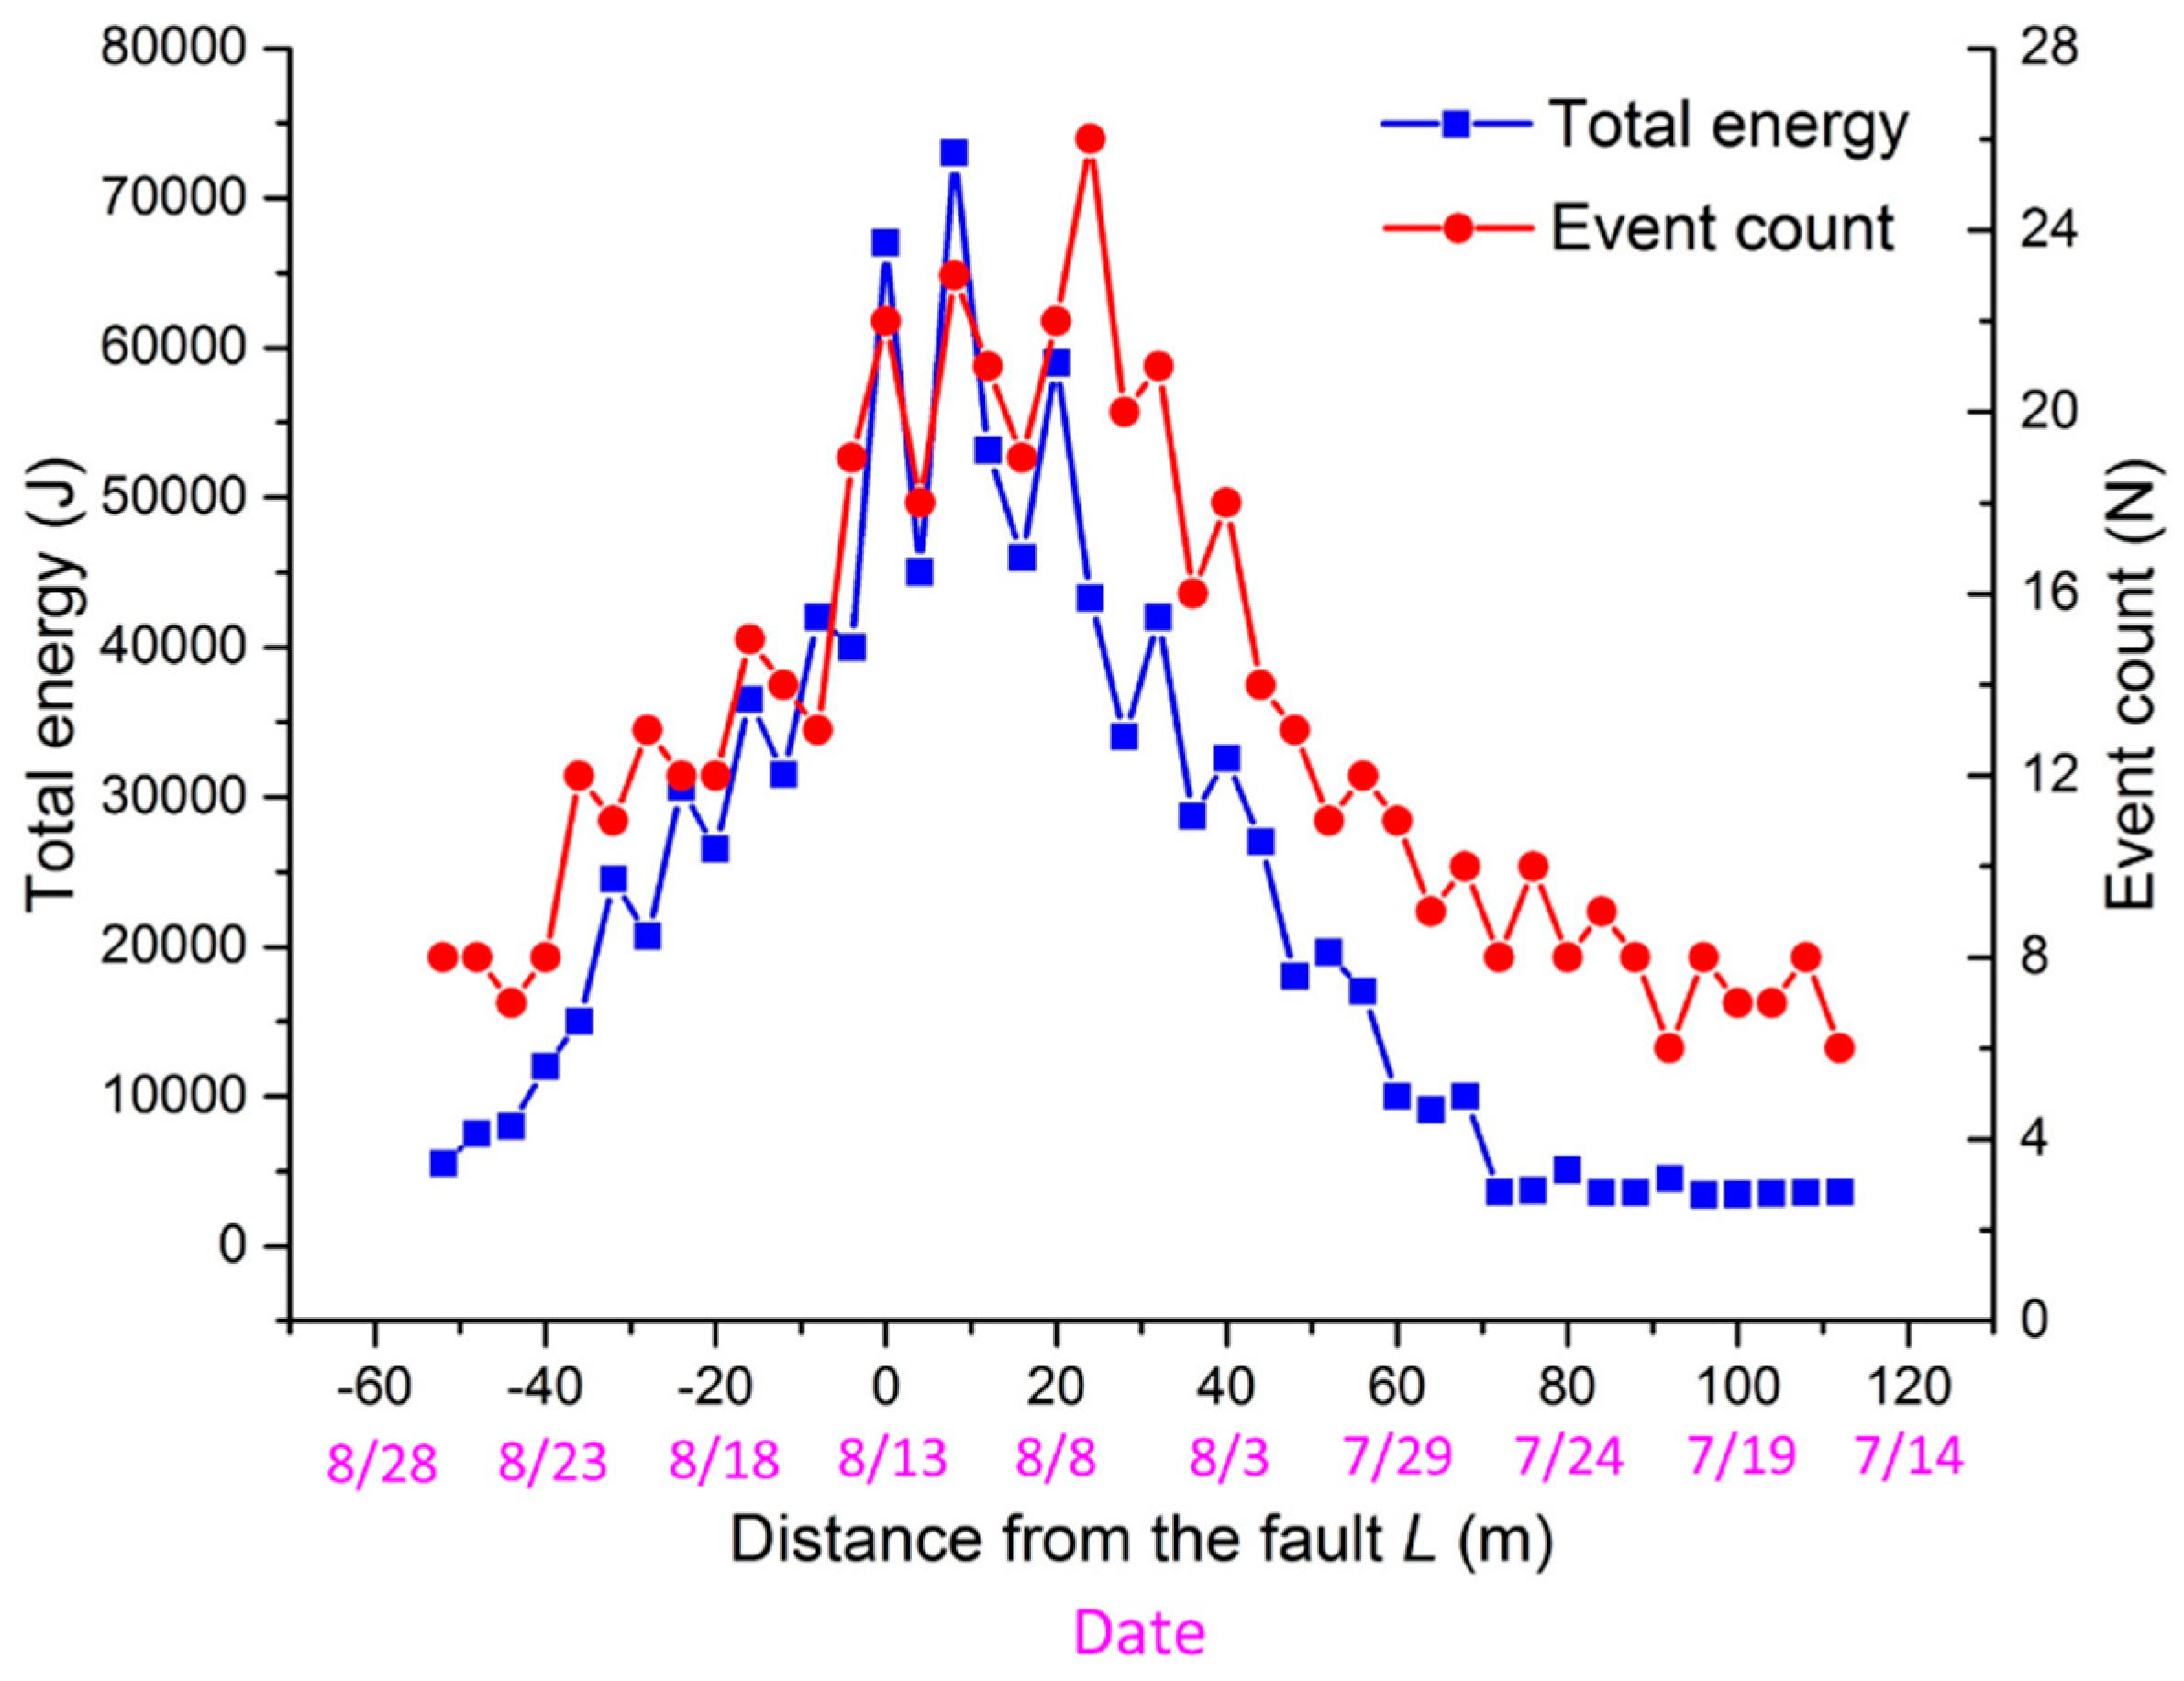
Figure 4 displays a graph showing the total daily microseismicity energy and the count of microseismicity events during the mining of the panel through the fault. It can be seen from the figure that when the panel is greater than 40 m from the fault (
L > 40 m), the daily microseismicity count and the daily microseismicity total energy are small. When the panel is mined from
L = 40 m to
L = 0 m, the count of daily microseisms and the total daily microseismicity energy increase significantly, indicating that the fault is affected by the mining and that the fault is active. The total daily energy of the microseismicity reaches a maximum of 7.3 × 10
4 J when
L = 10 m, and the count of microseismicity events on that day reaches 23. After the panel is mined through the fault, the total energy of the daily microseismicity events and the count of microseismicity events are reduced.
3. Methodology
3.1. Model Description
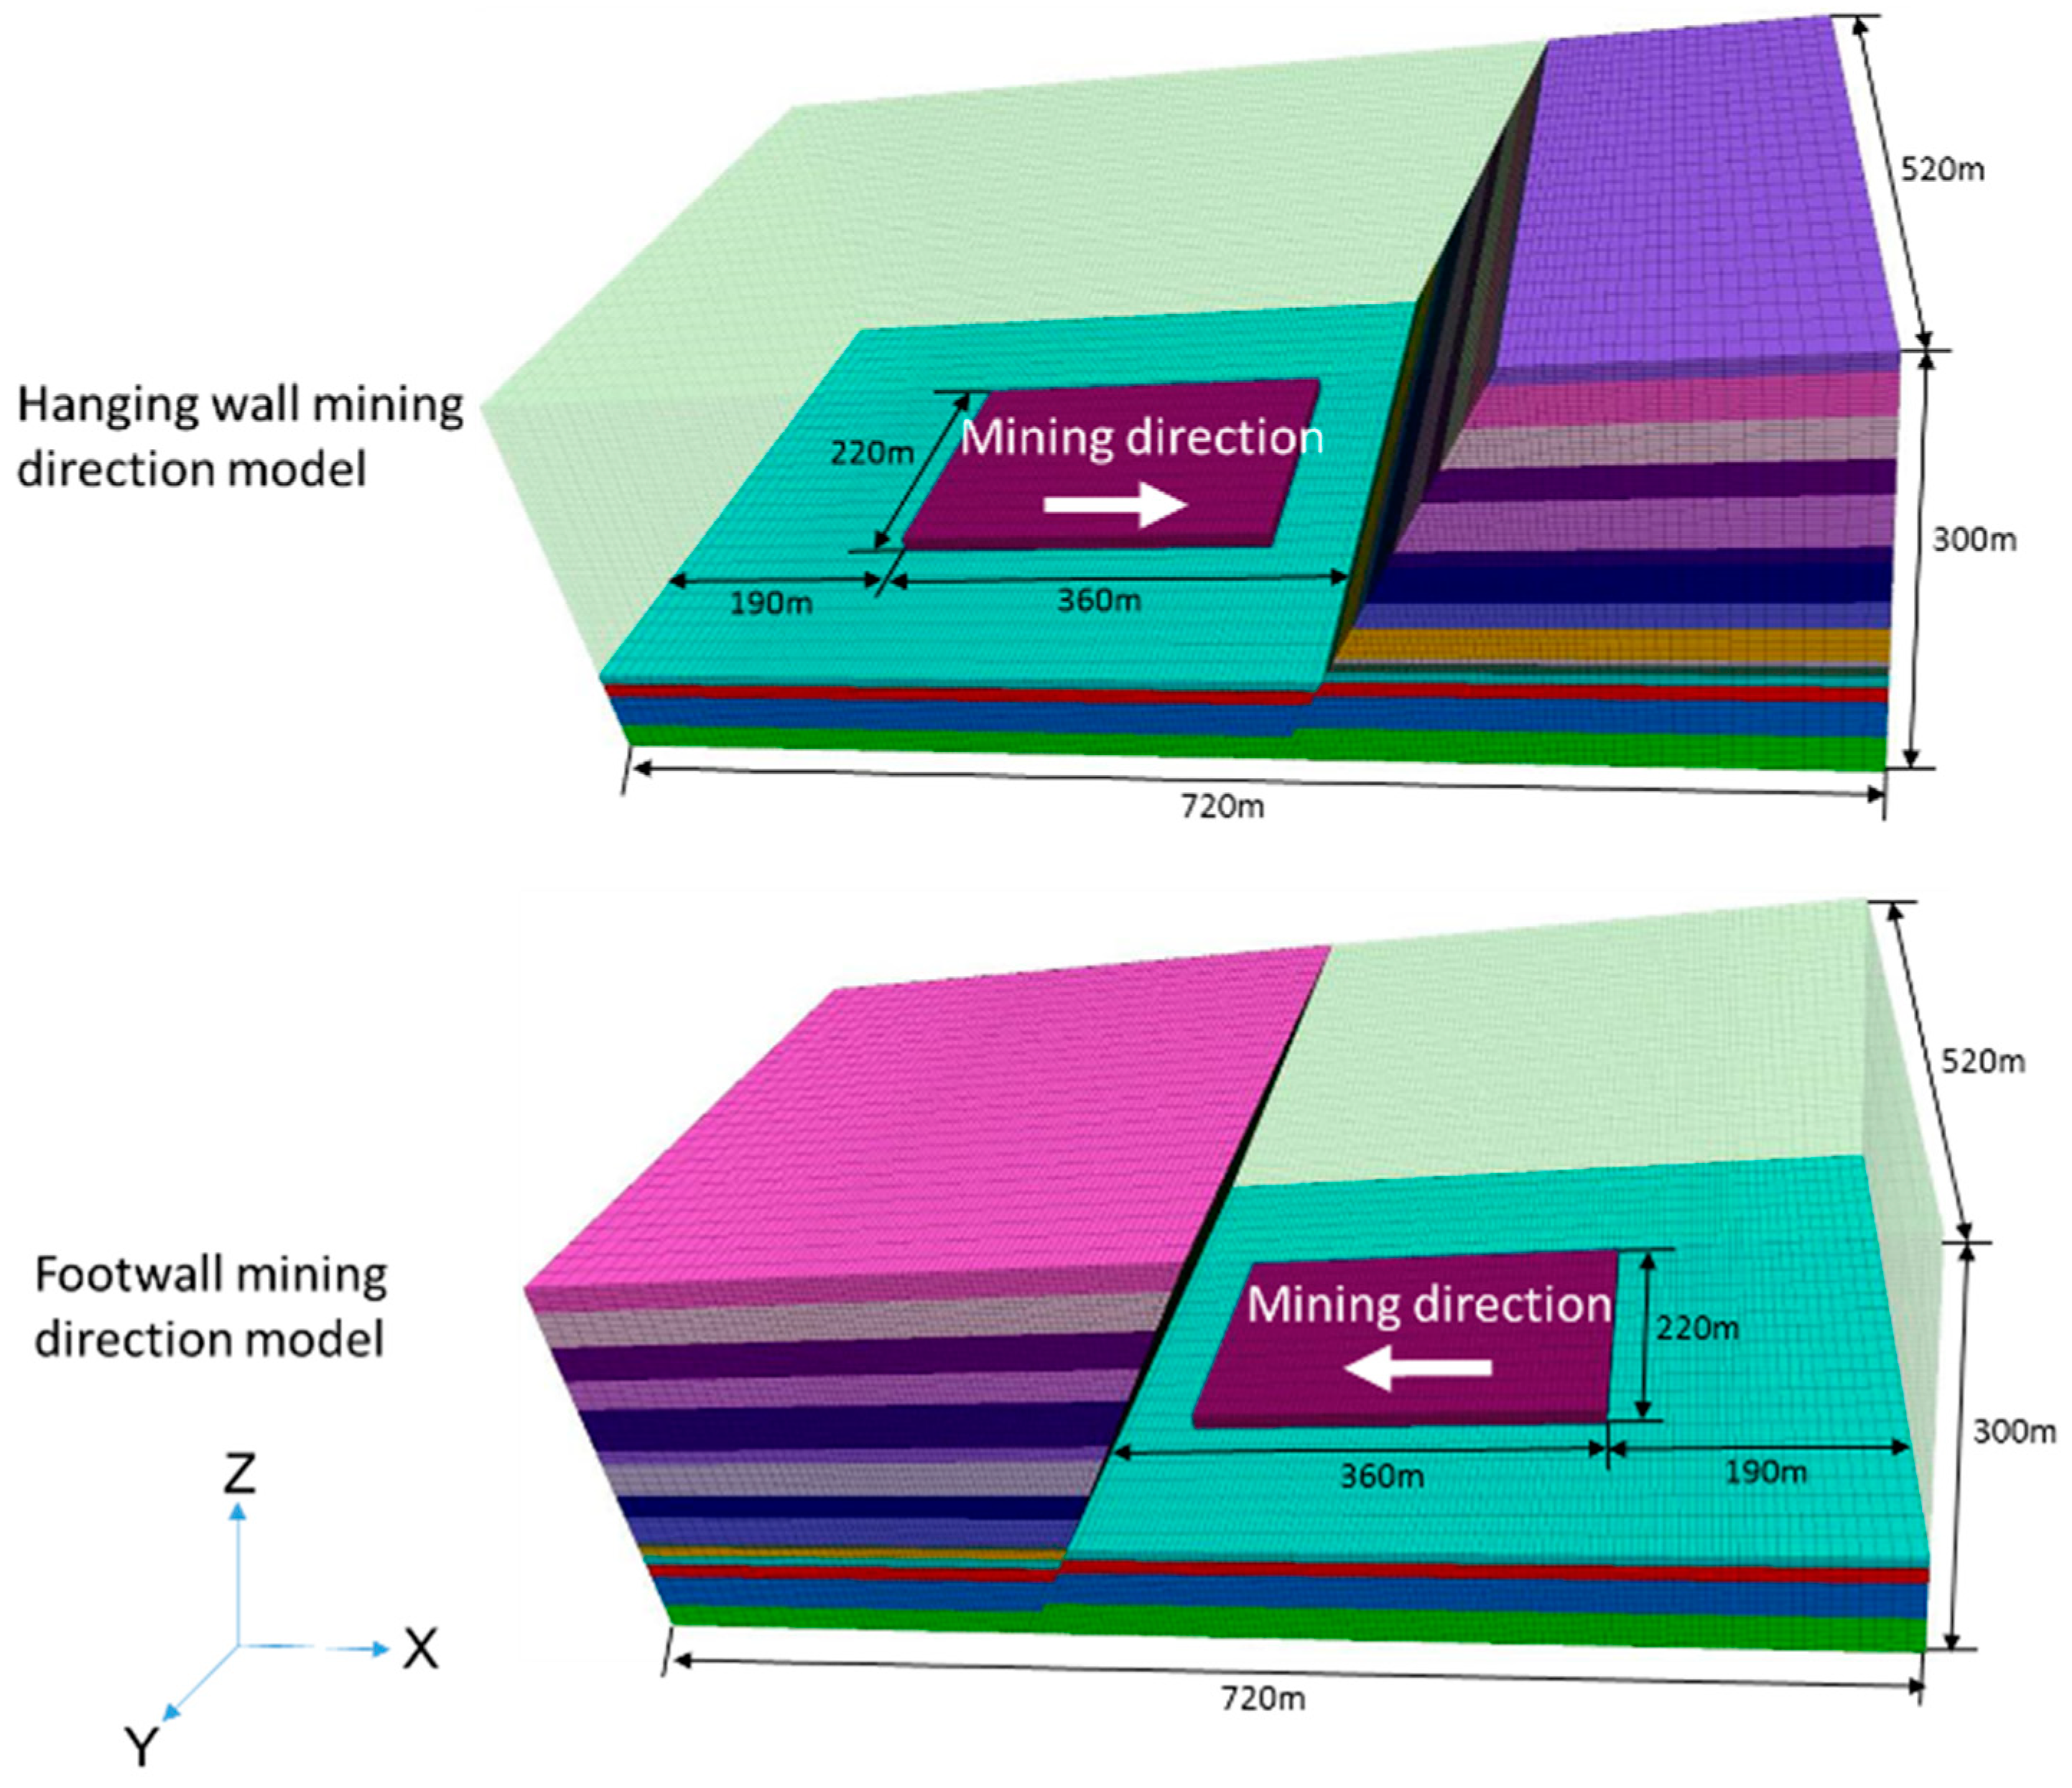
Taking Panel 14310 as a case study, two 3D mine-wide models encompassing the major geological structures are constructed by means of FLAC3D code. FLAC3D is chosen because of its strength in efficiently simulating a large-scale and multiple-excavation model. To compare and analyze the distributions of the mining stress and fault-slip mechanisms during the panel mining through fault under different advancing directions, two numerical simulation models are established. In model 1, the panel is mined through the fault from the hanging wall, and in model 2, the panel is mined through the fault from the footwall. The two models are both 790 m long, 520 m wide and 300 m high, and the dimensions of the two models and the excavation range of the panels are as shown in
Figure 5. The dimensions of the model are determined while considering the following two aspects: minimizing the model boundary effect on the deformation and stress of the geological structure and maintaining the computation time within a realistic range. The distance between the panel and the boundary of the model is not less than 100 m. The buried depth of the simulated coal seam is 540 m, and the unsimulated rock layer above the model is replaced by an equivalent load of 8 MPa. The unit weight of the unsimulated rock layer is assumed to be 0.025 MN/m
3 [
27]. Previous research done by E.M. Anderson [
28] shows that the maximum principal stress
σ1 in the normal fault is in the vertical direction and can be caused by the gravity of the rock stratum or vertical crustal movement. The normal fault in the coal-bearing stratum is mainly formed by gravity. The field stress measurement in the Dongtan coal mine shows that the maximum principal stress of the NF6 normal fault is vertical stress. The minimum principal stress
σ3 is the horizontal stress perpendicular to the direction of the fault, and
σ3 is 0.6 times
σ1. The maximum principal stress
σ2 is the horizontal stress parallel to the direction of the fault, and
σ2 is 0.8 times
σ1. Thus, in the two calculation models, the horizontal-to-vertical stress ratios are set to 0.6 and 0.8, respectively, in the x- and y-directions according to the in situ stress measurement.
3.2. Mechanical Properties of Rockmass
The properties of the rockmasses in the mine were estimated based on the complete rock properties and the generalized Hoek-Brown failure criteria [
29]. The mechanical parameters of the rock specimens and rock mass are shown in
Table 1. Because it is generally difficult to estimate the values of
cr and
εp of a strain-softening model, in many previous ground control studies of coal mining, strain-softening models with assumed
cr and
εp values were employed. The assumed residual-to-peak cohesion ratio ranges from 1/2 [
30] to 1/40 [
31]. Based on this information, we considered a reasonable ratio of 1/5 in the current study.
3.3. Mechanical Model for Fault
The simulated fault dip is 60°, with a throw of 8 m. The fault is simulated using the interface contact surface command. The contact surface is an element with no thickness, and the constitutive model is a Coulomb shear model. For the Coulomb sliding contact surface elements, there are two states: intact and broken. According to the Coulomb shear strength criterion, the shear force
Fsmax required for the relative sliding of the contact surface can be obtained as [
32]:
where
cif is the contact surface cohesion;
A is the area represented by the contact surface node;
φf is the friction angle of the contact surface node;
Fn is the normal force; and
μ is the pore pressure.
When the shear force on the contact surface is smaller than the maximum shear force (|Fs| < Fsmax), the contact surface is in the elastic stage. When the shear force on the contact surface equals the maximum shear force (|Fs| = Fsmax), the contact surface enters the plastic stage.
As an interface is used to model the fault, the shear and normal stiffness of the fault need to be considered. The shear and normal stiffness of the fault are set at two-tenths of the shear modulus and elastic modulus of the surrounding rockmass due to the cracks and fractures that exist in the fault zones [
33,
34]. Thus, the shear and normal stiffness of the fault are 0.54 × 10
9 and 1.34 × 10
9, respectively. In most cases, the cohesion and tensile strength of the fault are very small, so they are set to 0. The basic friction angles of typical rock joints fall between 21° and 38° [
35]. Considering the data, the friction angle of the fault is set at 25°, and therefore the frictional coefficient tan
φ is 0.47.
4. Evolution Behavior of the Abutment Stress under Different Mining Directions
Mining practice proves that the induction of rockbursts is closely related to the distribution of the abutment stress and its dynamic evolution. In general, areas with a high degree of concentrated stress tend to accumulate a large amount of elastic strain energy, and the potential for a rockburst is higher. Therefore, according to numerical calculation, the abutment stress distribution of the stope is simulated, and the evolution of the advance abutment stress during mining is analyzed.
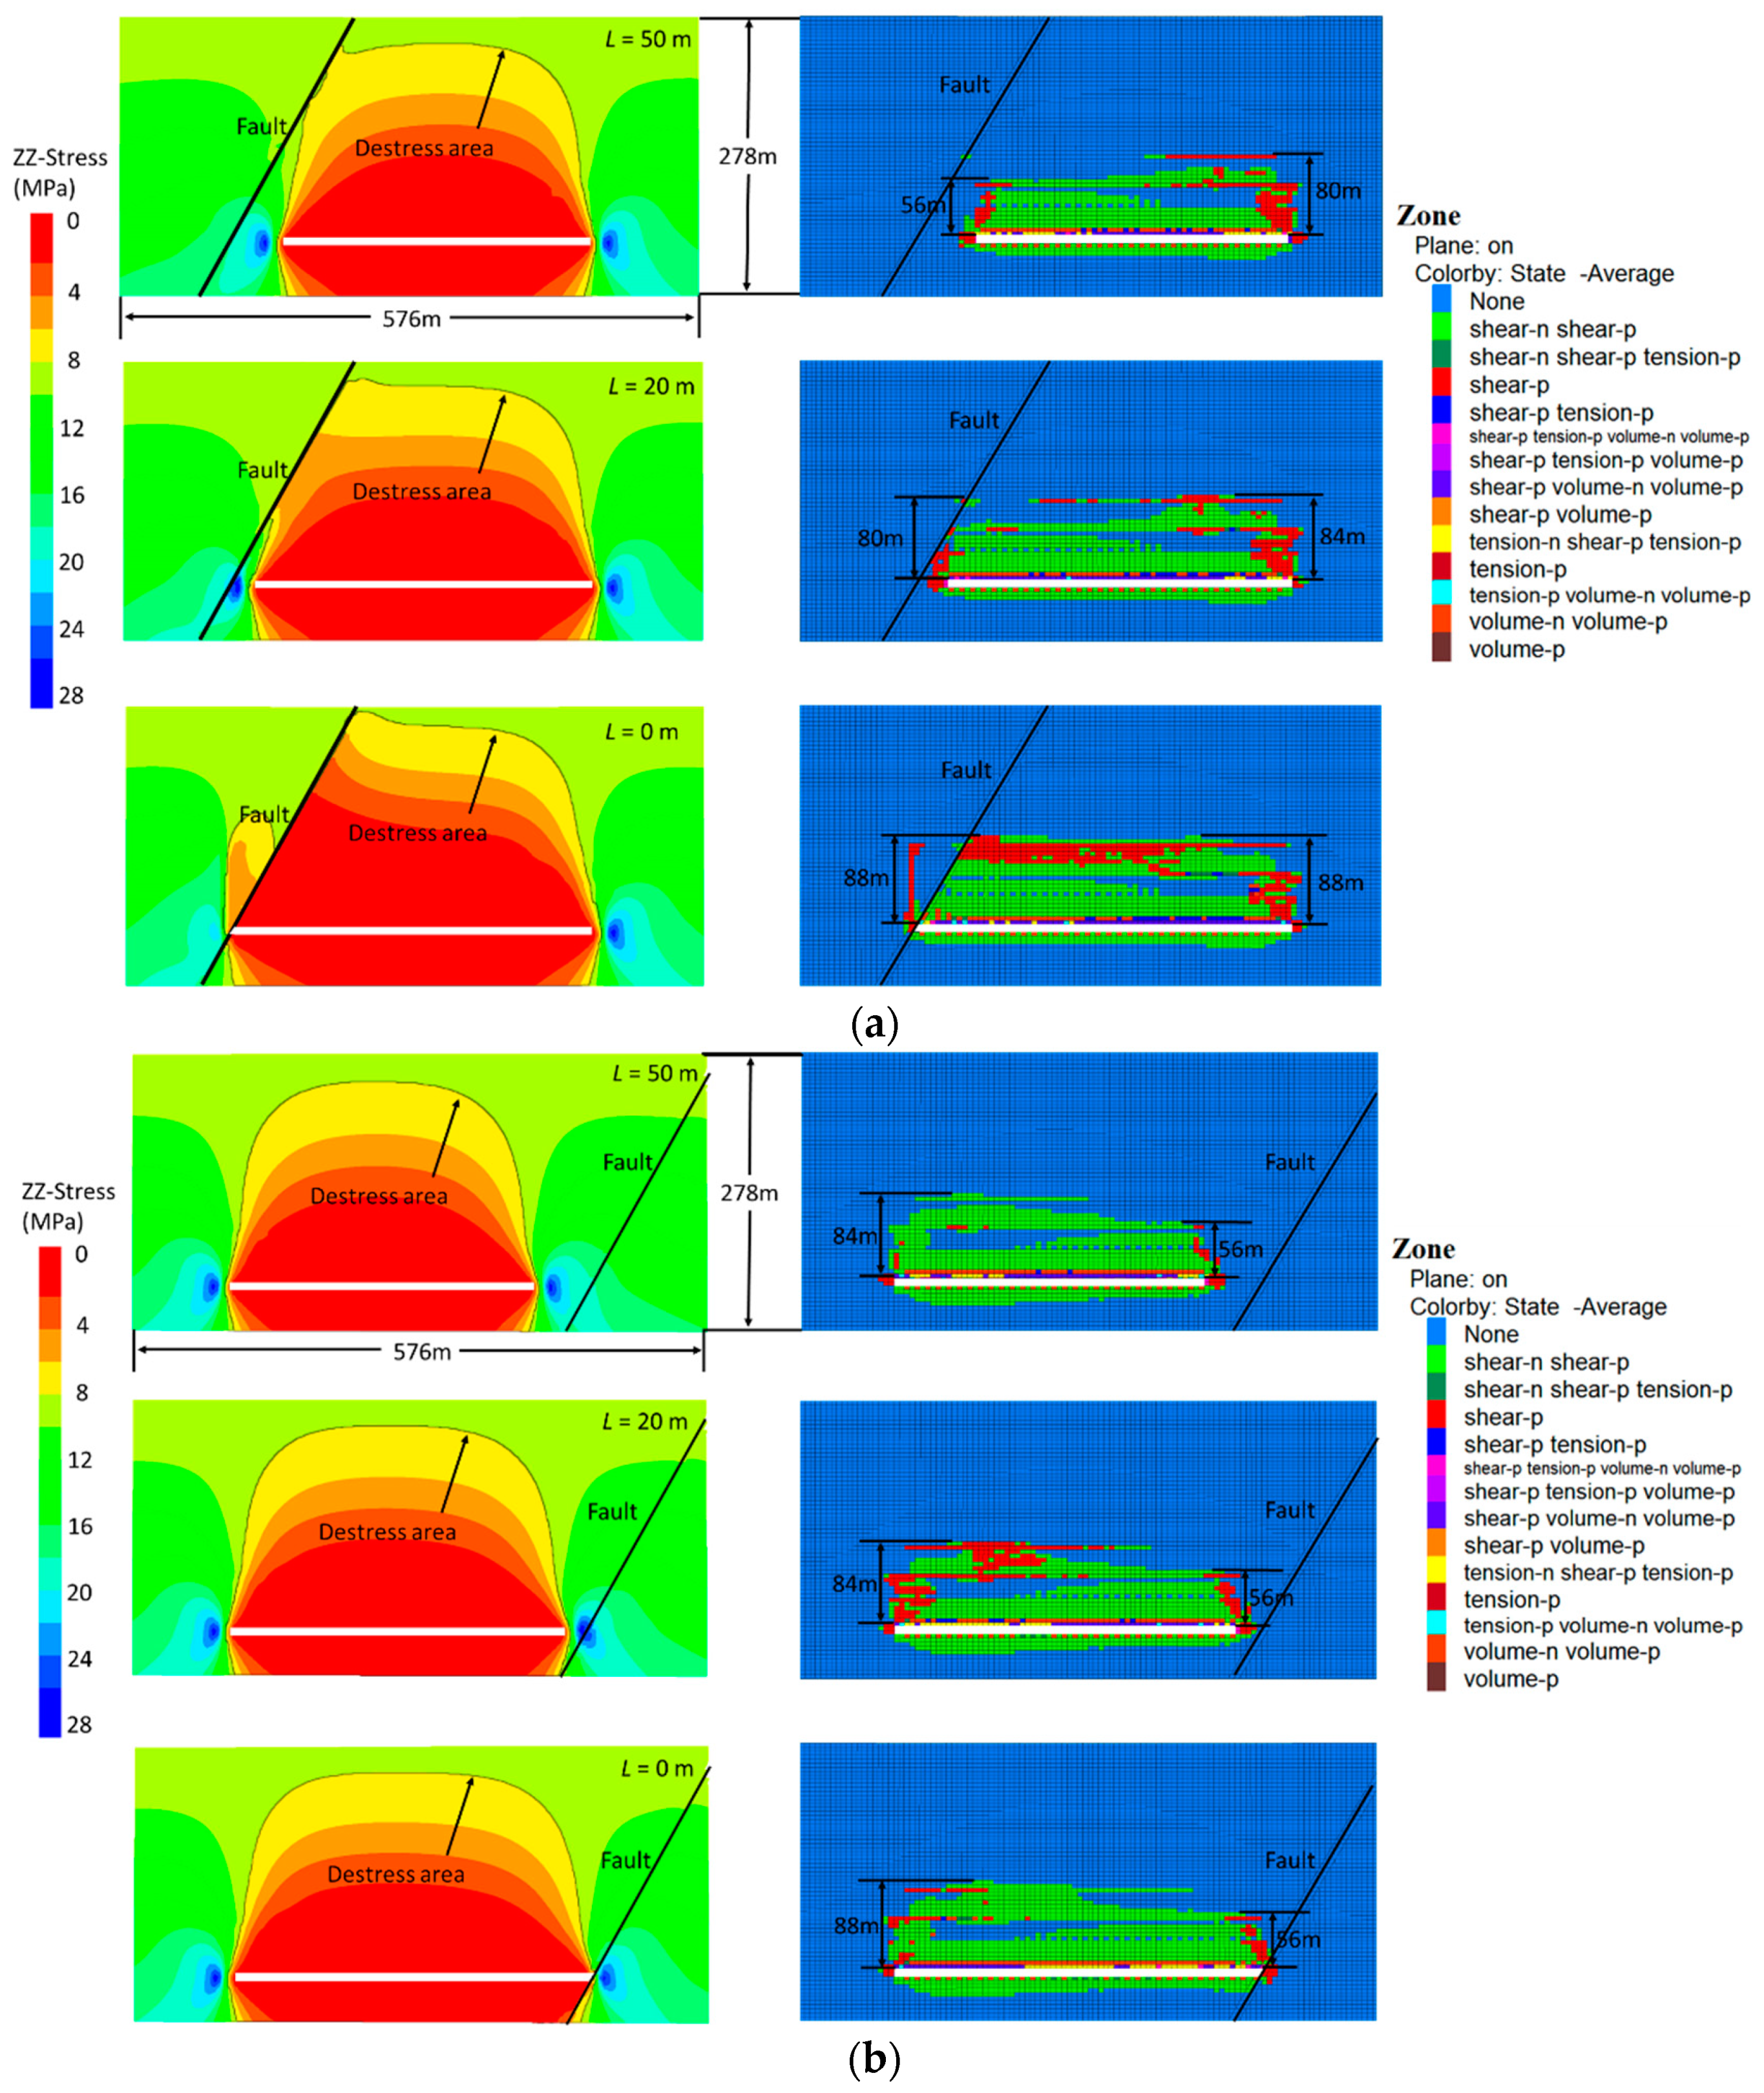
Figure 6a shows the distribution of the abutment stress and the plastic zone when
L = 50 m,
L = 20 m and
L = 0 m when the panel is mined through the fault from the footwall. It can be seen that the fault has an obvious influence on the destress area. The area in the black line is the destress area, which represents the area where the stress after mining is less than the initial stress. Due to the influence of the fault tendency, when the panel is mined through the fault from the footwall, the fault has an obvious influence on the destress area. The footwall of the fault is in the destress area, and the fault inhibits the development of the destress area towards the hanging wall. When
L = 50 m,
L = 20 m and
L = 0 m, the height of the plastic zone on the fault side roof is 56 m, 80 m, and 88 m, respectively. The height of the plastic zone development increases significantly as the distance between the working face and the fault decreases. When the panel is mined to the fault location, the mining activity causes a large-scale plastic zone in the footwall rock mass and hanging wall rock mass.
Figure 6b shows the distribution of the abutment stress and the plastic zone when
L = 50 m,
L = 20 m and
L = 0 m when the panel is mined through the fault from the hanging wall. It can be seen that the destress area of the stope is little affected by the fault, and the range of the destress area of the roof is similar to that of the complete roof. The development height of the plastic zone of the fault side roof remains unchanged with the advancement of the working face by 56 m. When the panel is mined to the fault location, the plastic zone does not extend over a large area to the rock mass near the fault.
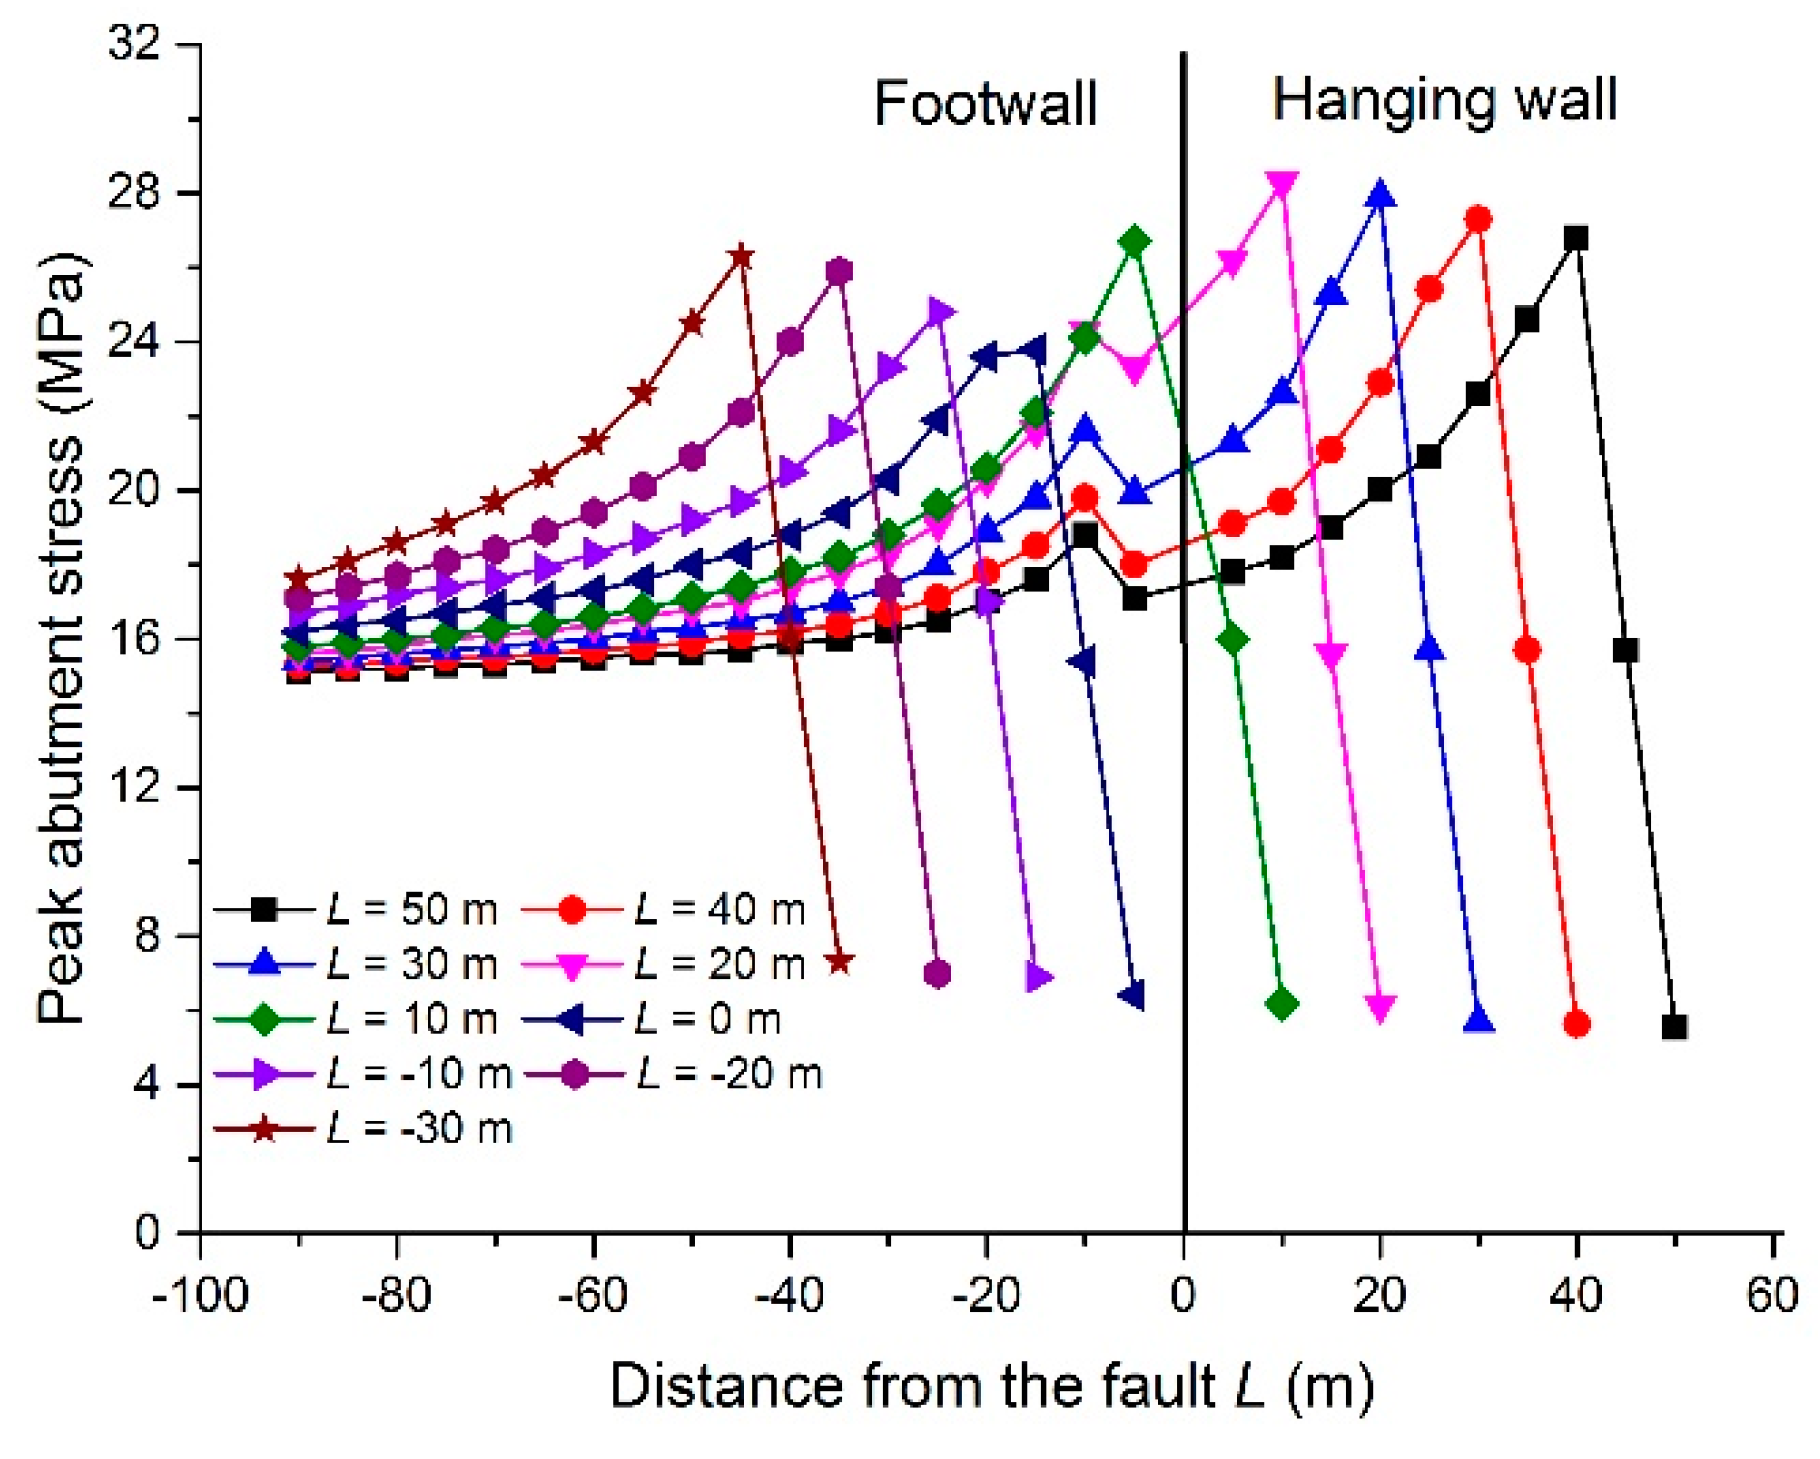
Figure 7 shows the distribution and evolution of the advance abutment stress under different positions of the panel when mining the panel through the fault from the footwall. The monitoring line is placed in the middle of the working face (y = 260 m). It can be seen from
Figure 7 that when
L = 50 m, the peak of the advance abutment stress is located 15 m in front of the working face, and the value is 26.9 MPa. When
L = 20 m from the fault, the peak of the advance abutment stress reaches 28.3 MPa, which is the maximum value during the period of mining the panel through the fault. When
L = 10 m, the coal pillar undergoes plastic failure, the bearing capacity of the coal pillar decreases sharply, the peak value abutment stress of the coal pillar decreases to 17.0 MPa, and the influence of mining on the hanging wall increases. The peak of the abutment stress is transferred to the hanging wall and is 26.7 MPa. When
L = 0 m, the peak value of the advance abutment stress is sharply reduced to 23.8 MPa, which is significantly lower than that of the working face 20 m away from the fault. After the panel is mined through the fault, the peak value of the advance abutment stress increases to 26 MPa as the working face continues to advance.
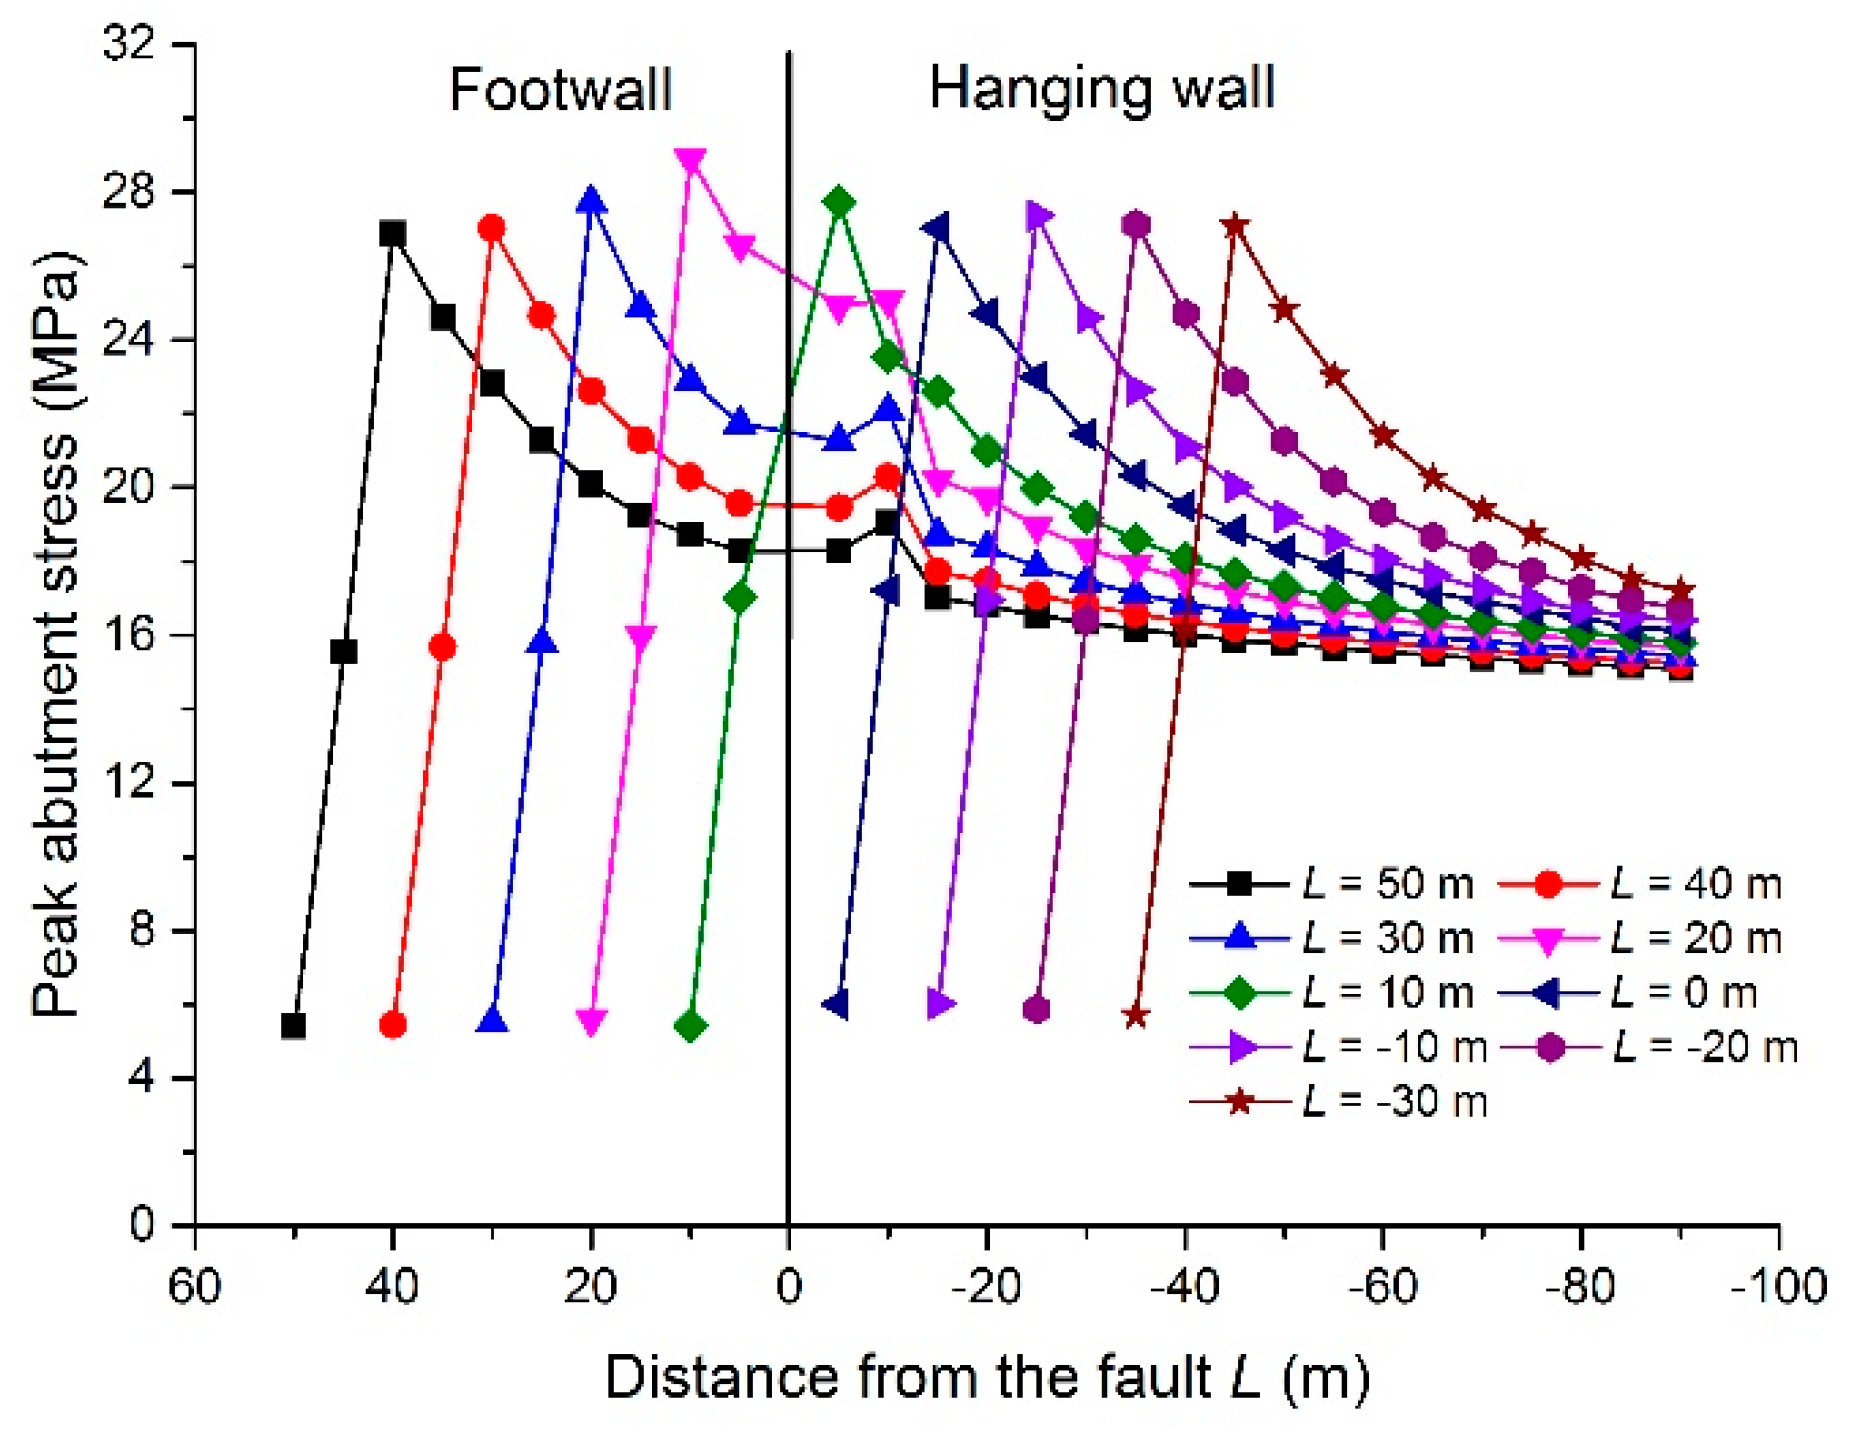
Figure 8 shows the distribution and evolution of the advance abutment stress under different positions of the working face when mining the panel through the fault from the hanging wall. It can be seen that when
L ≥ 10 m, the variation in the advance abutment stress is similar to that from mining the panel through the fault from the footwall. When
L = 0 m, the reduction of the peak value of the abutment stress is small, and therefore the variation in the peak value of the abutment stress is small during the panel mining through the fault from the hanging wall.
5. Fault-Slip Behavior under Different Mining Directions
5.1. Shear Displacement of the Fault under Different Mining Directions
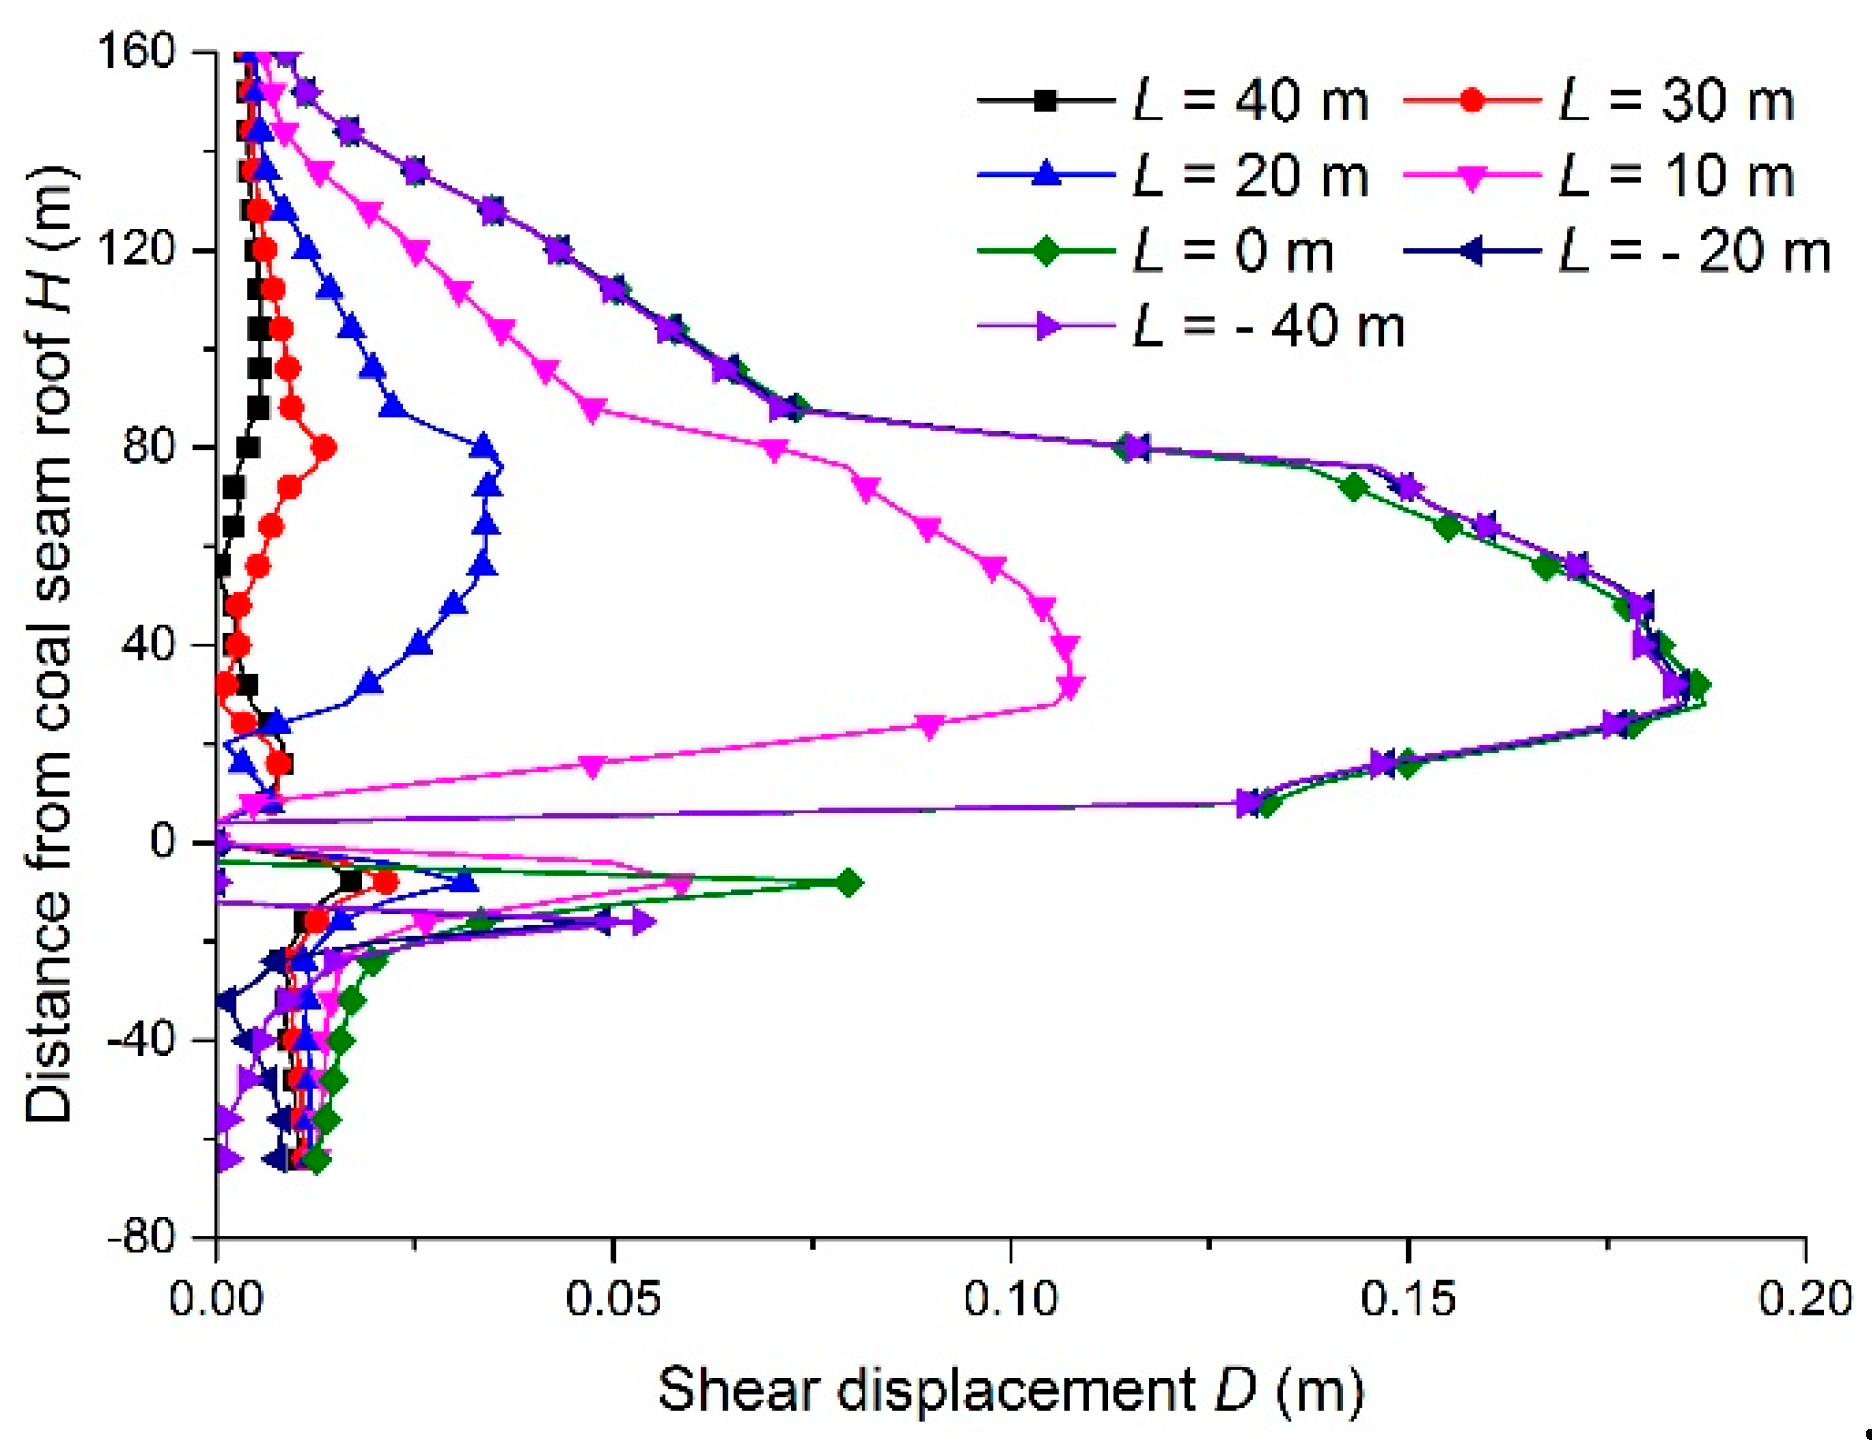
Figure 9 shows the shear displacement of the fault under different positions of the working face when the panel is mined through the fault from the footwall. The abscissa
L is the magnitude of the shear displacement, and the ordinate
H is the distance of the fault plane from the roof of the coal seam. It can be seen that when the panel is mined to the fault location, the magnitude of the shear displacement and the range of the fault slip increase. When
L = 30 m, the shear displacement is small. The maximum shear displacement of the coal-seam roof fault occurs 8 m below the coal-seam roof and is only 0.02 m. When
L = 20 m, the maximum shear displacement of the fault is located 76 m above the coal-seam roof, and the maximum shear displacement increases to 0.036 m. When
L = 10 m and
L = 0 m, the shear displacement of the fault increases significantly, and the fault-slip position extends from the high roof area to the vicinity of the coal-seam roof. The shear displacement of the fault reaches 0.107 m and 0.187 m, respectively, and the maximum shear displacement position of the fault is 32 m and 28 m above the coal-seam roof. As the panel is mined to the fault location, the magnitude of the shear displacement and the shear slip range of the coal-seam floor fault are increased, but the increases are much smaller than those for the coal-seam roof fault. When the panel is mined through the fault, the magnitude of the shear displacement does not increase further and remains basically stable.
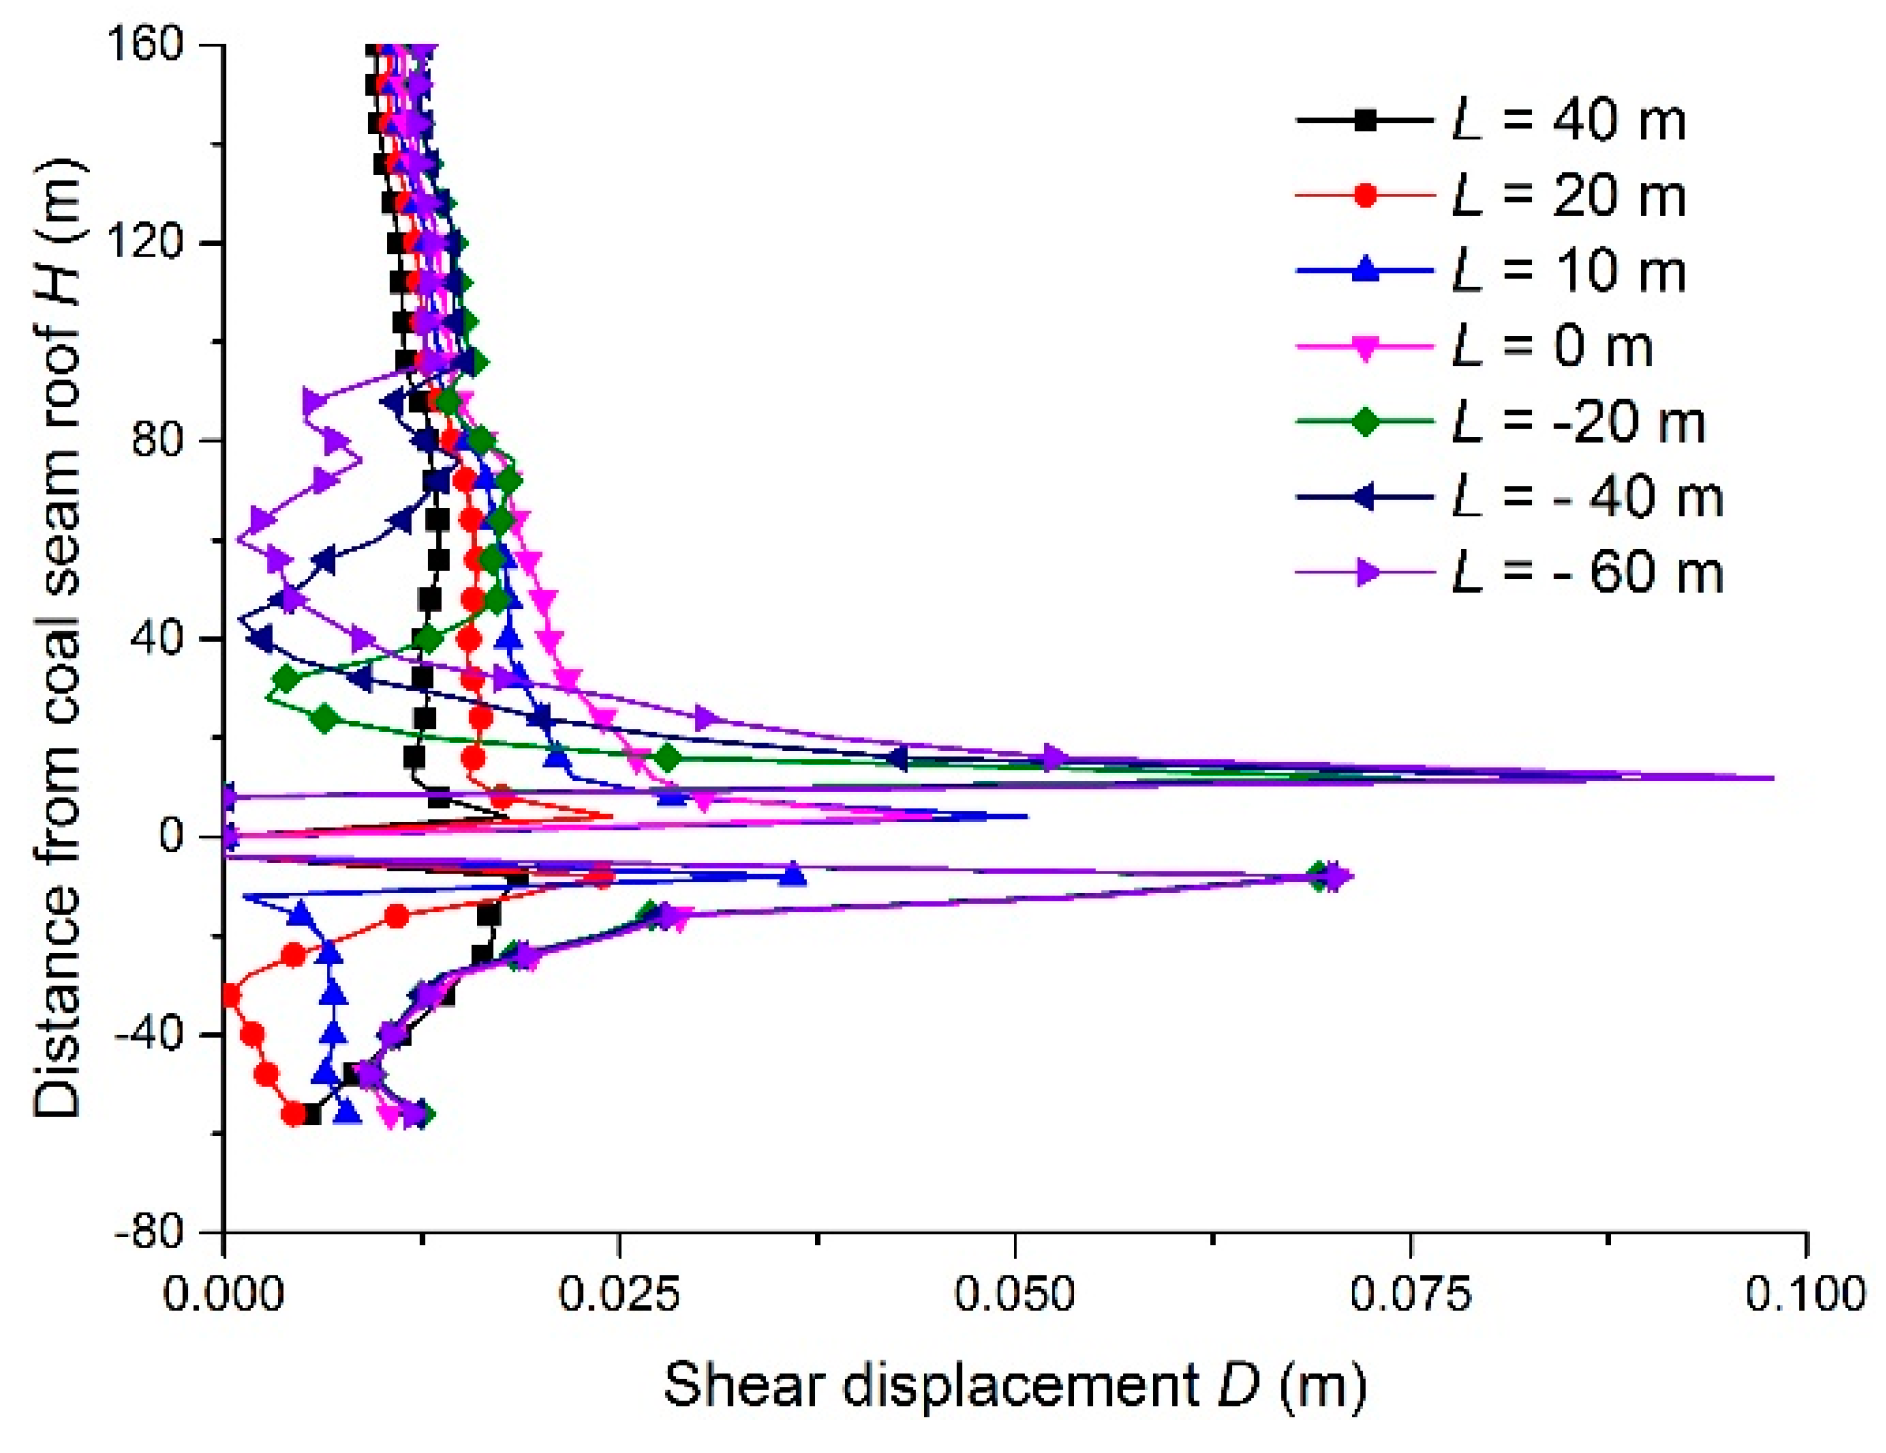
Figure 10 shows the shear displacement of the fault under different positions of the working face when the panel is mined through the fault from the hanging wall. Compared with the panel mined through the fault from the footwall, the variation in the shear displacement of the fault is more complicated, but the magnitude of the shear displacement is significantly smaller. The maximum shear displacement of the coal-seam roof fault is only 0.09 m when the panel is mined through the fault at 60 m (
L = −60 m). The maximum shear displacement position of the coal-seam roof fault is near the coal-seam roof and is only 0.07 m. It can be seen that when the panel is mined through the fault from the hanging wall, the fault can maintain a stable structure, and its shear displacement is small.
5.2. Fault-Slip Potential under Different Mining Directions
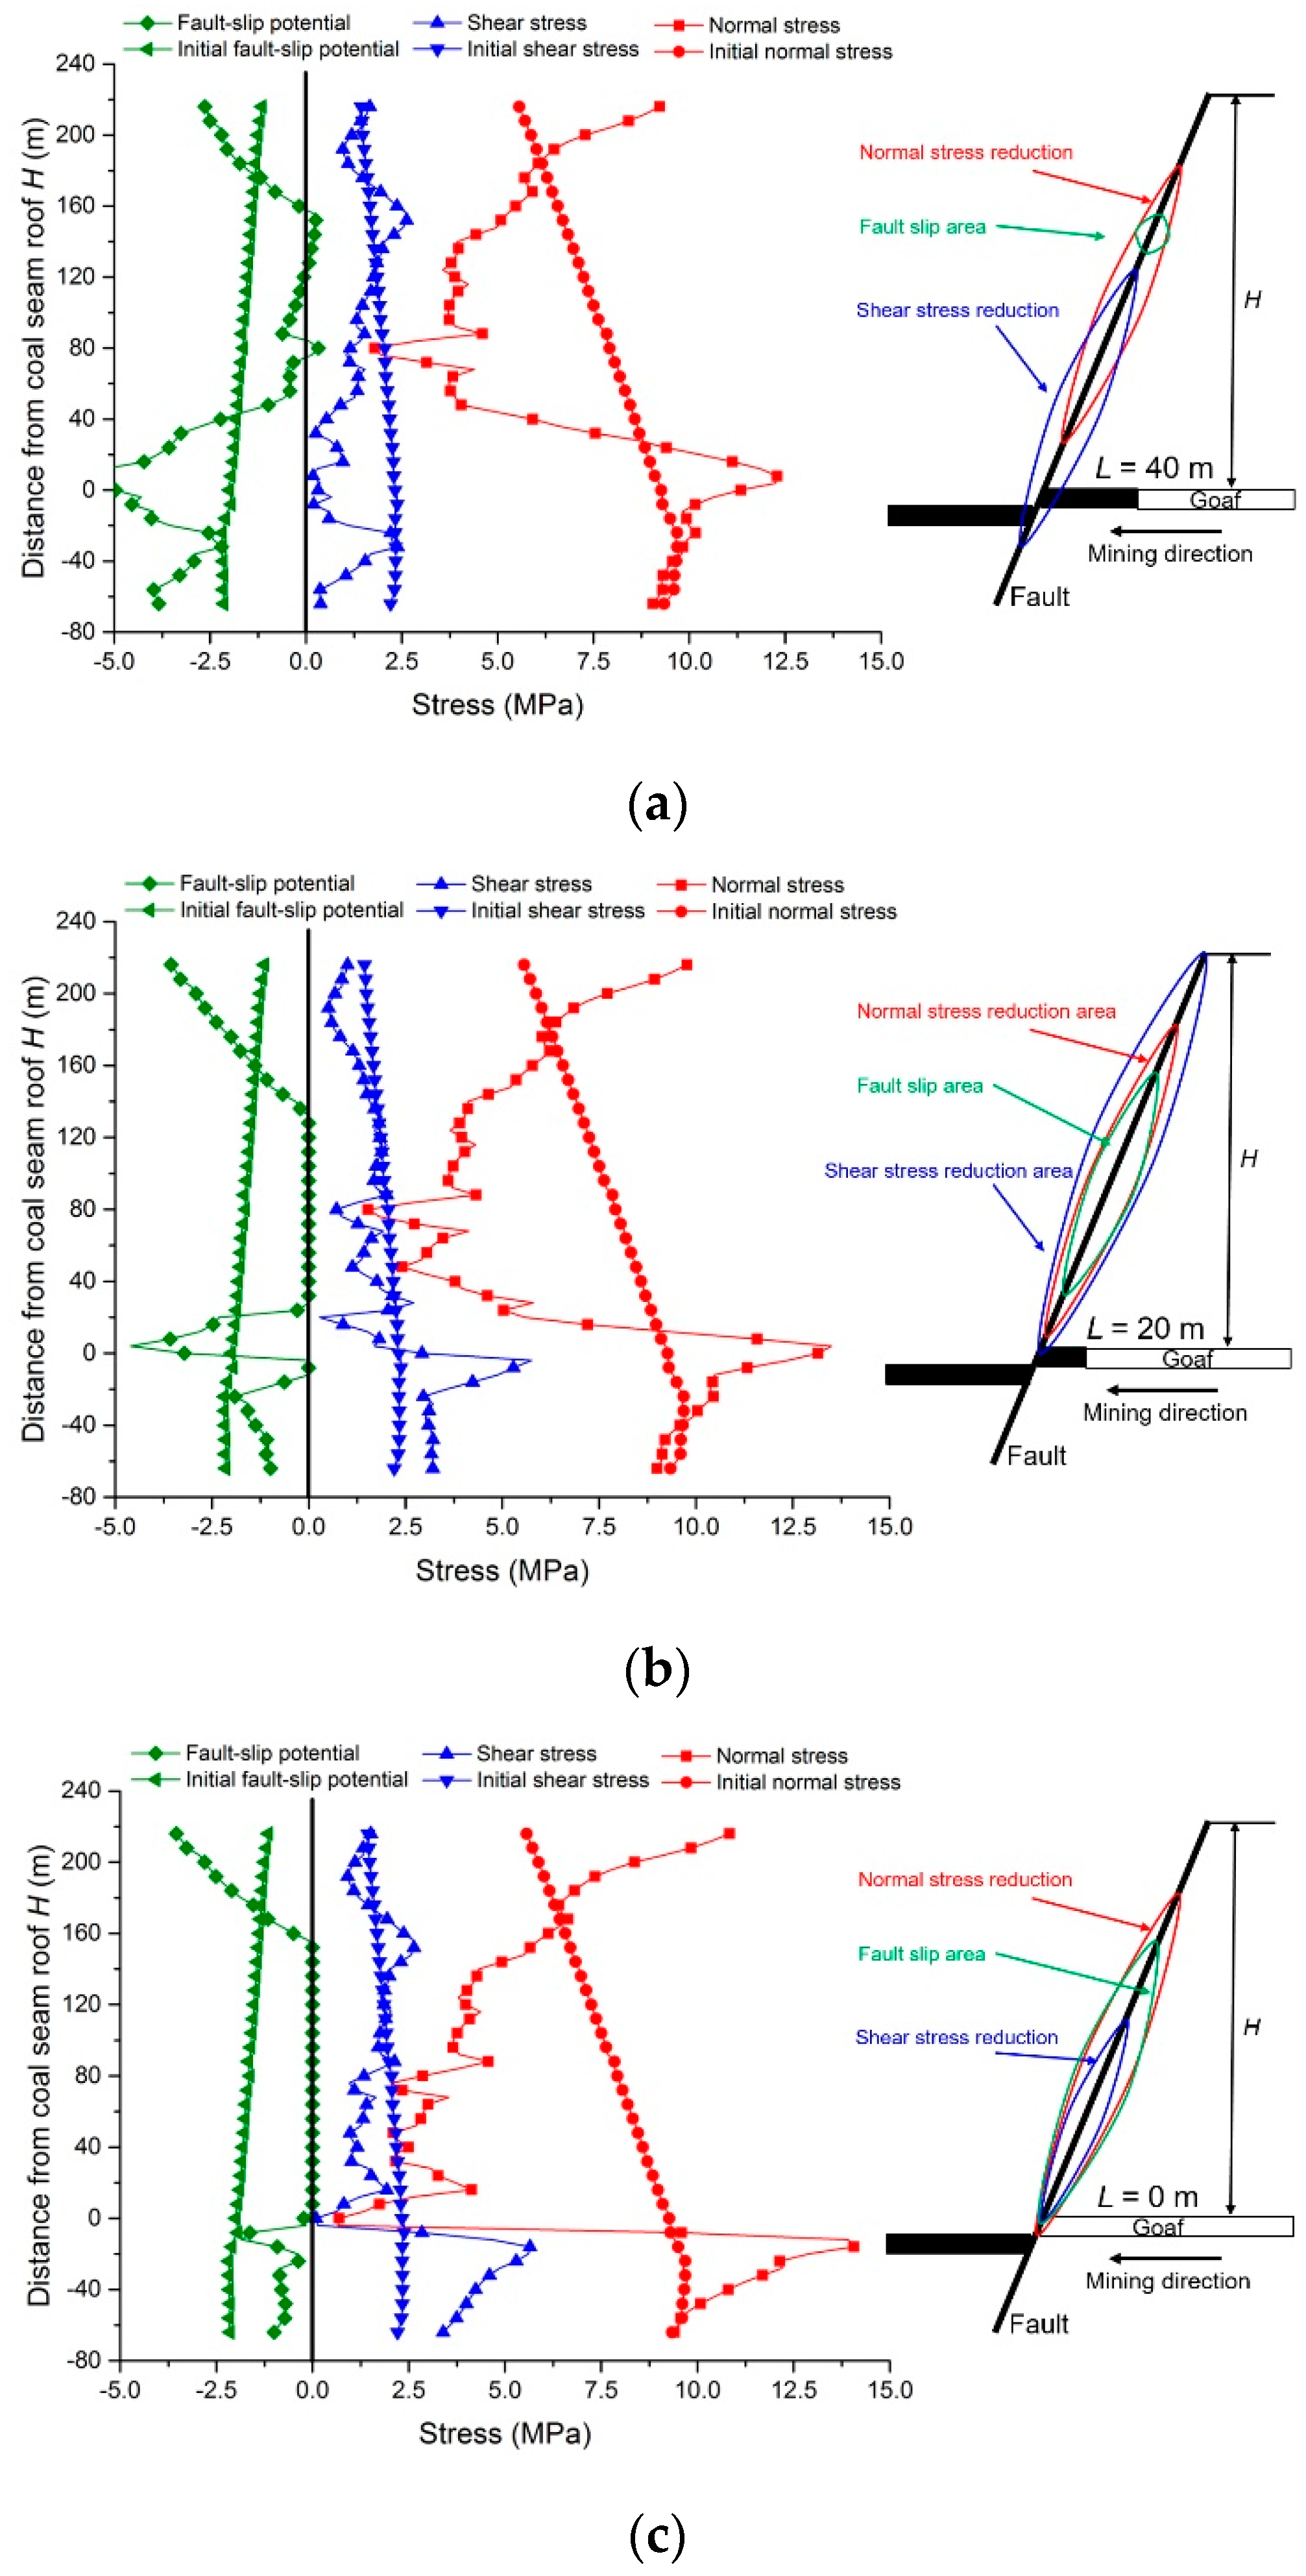
To study the fault-slip range and the stress distribution characteristics of the fault during the period of mining the panel through the fault, we extracted the normal and shear stresses of the fault when
L = 40 m, 20 m, 0 m, and −20 m. The monitoring line is arranged on the fault at y = 260 m.
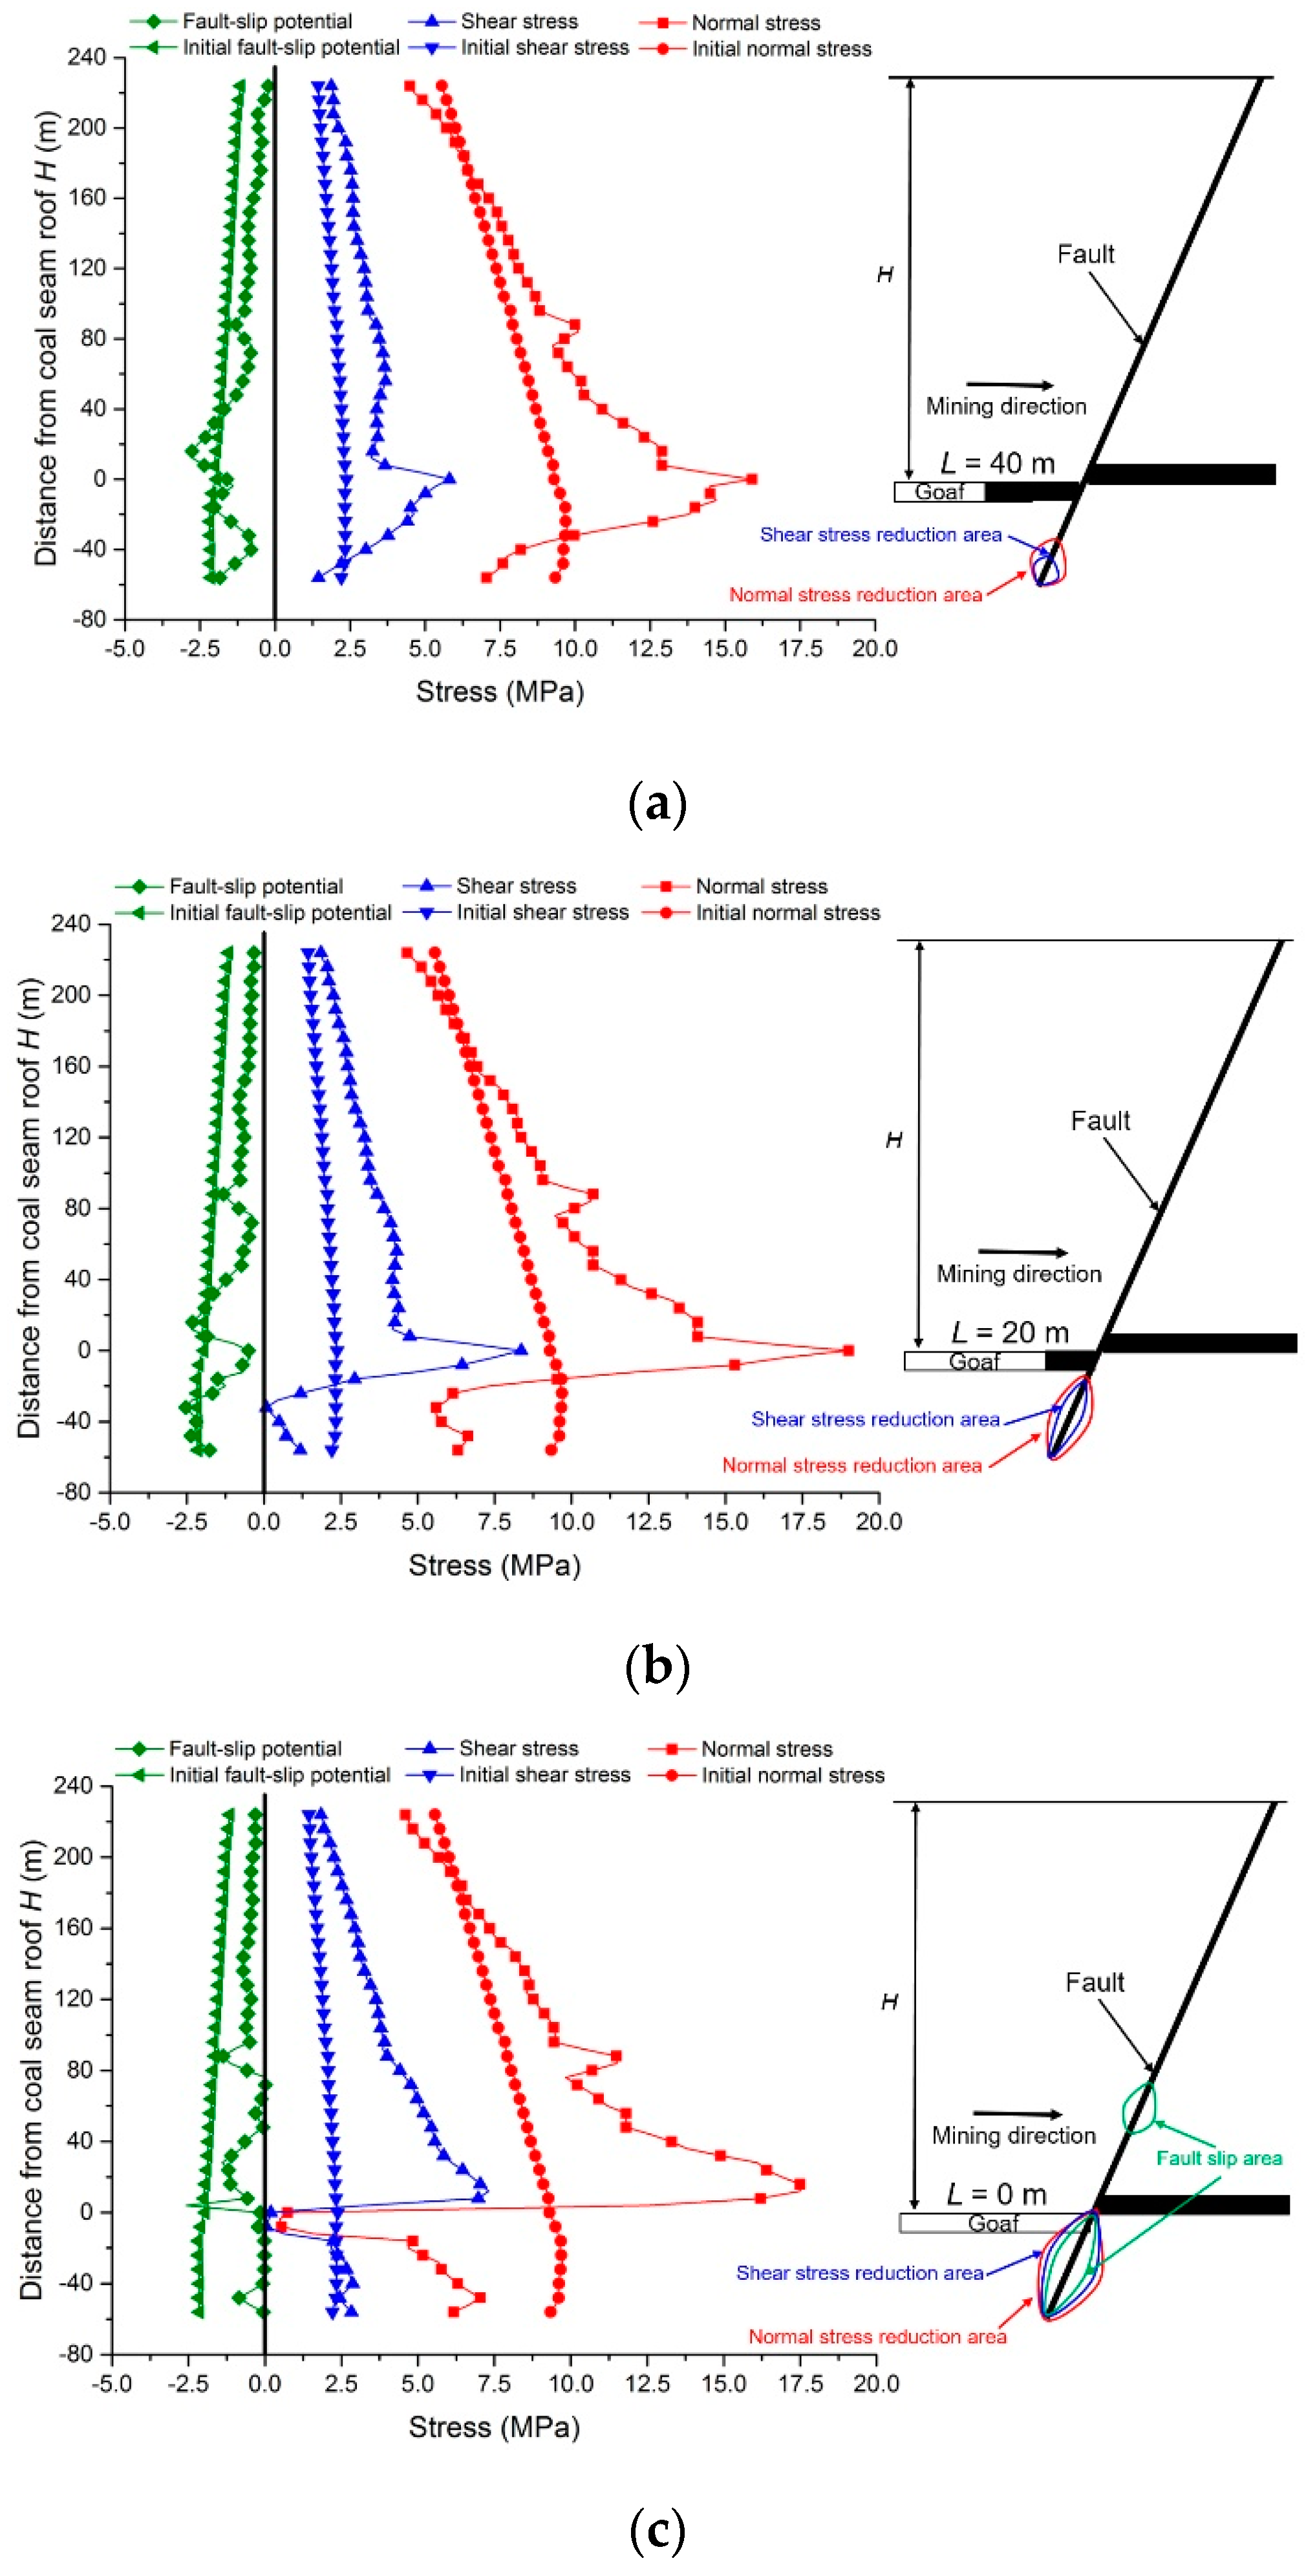
Figure 11 shows the stress distribution of the fault when the panel is mined through the fault from the footwall, and
Figure 12 shows the stress distribution when the panel is mined through the fault from the hanging wall. In addition to monitoring the shear stress and normal stress of the fault, the fault-slip potential is also calculated. The fault-slip potential (
τp) is computed by subtracting the maximum shear strength determined by the Mohr–Coulomb failure criterion from the shear stress [
36]:
When
τp is less than 0, a fault slip does not occur, and a fault-slip occurs when
τp is 0; thus, the closer
τp is to 0, the higher the fault-slip potential is. In
Figure 11 and
Figure 12, the area where the normal stress is reduced is represented by a red line, the area where the shear stress is reduced is represented by a blue line, and the area represented by the green line is the fault-slip area (or the area where a fault slip has occurred before).
From
Figure 11, it can be seen that the normal stress and shear stress of the coal-seam roof fault are generally reduced compared with the initial values when the panel is mined through the fault from the footwall. The fault areas, whose normal and shear stress are all higher than its initial value, only appear near the coal seam. As the panel is mined step-by-step in the simulation, the area in which the stress is increased decreases, and the area in which the stress is reduced increases. The reduction of the normal stress causes the shear strength of the fault to decrease, so that the coal-seam roof fault has a large area of slipping in the region where the normal stress is reduced. Contrary to the normal stress variation behavior of the coal-seam roof fault, the normal stress of the coal-seam floor fault is mainly increased, so the fault-slip area of the coal-seam floor fault is small.
It can be seen from
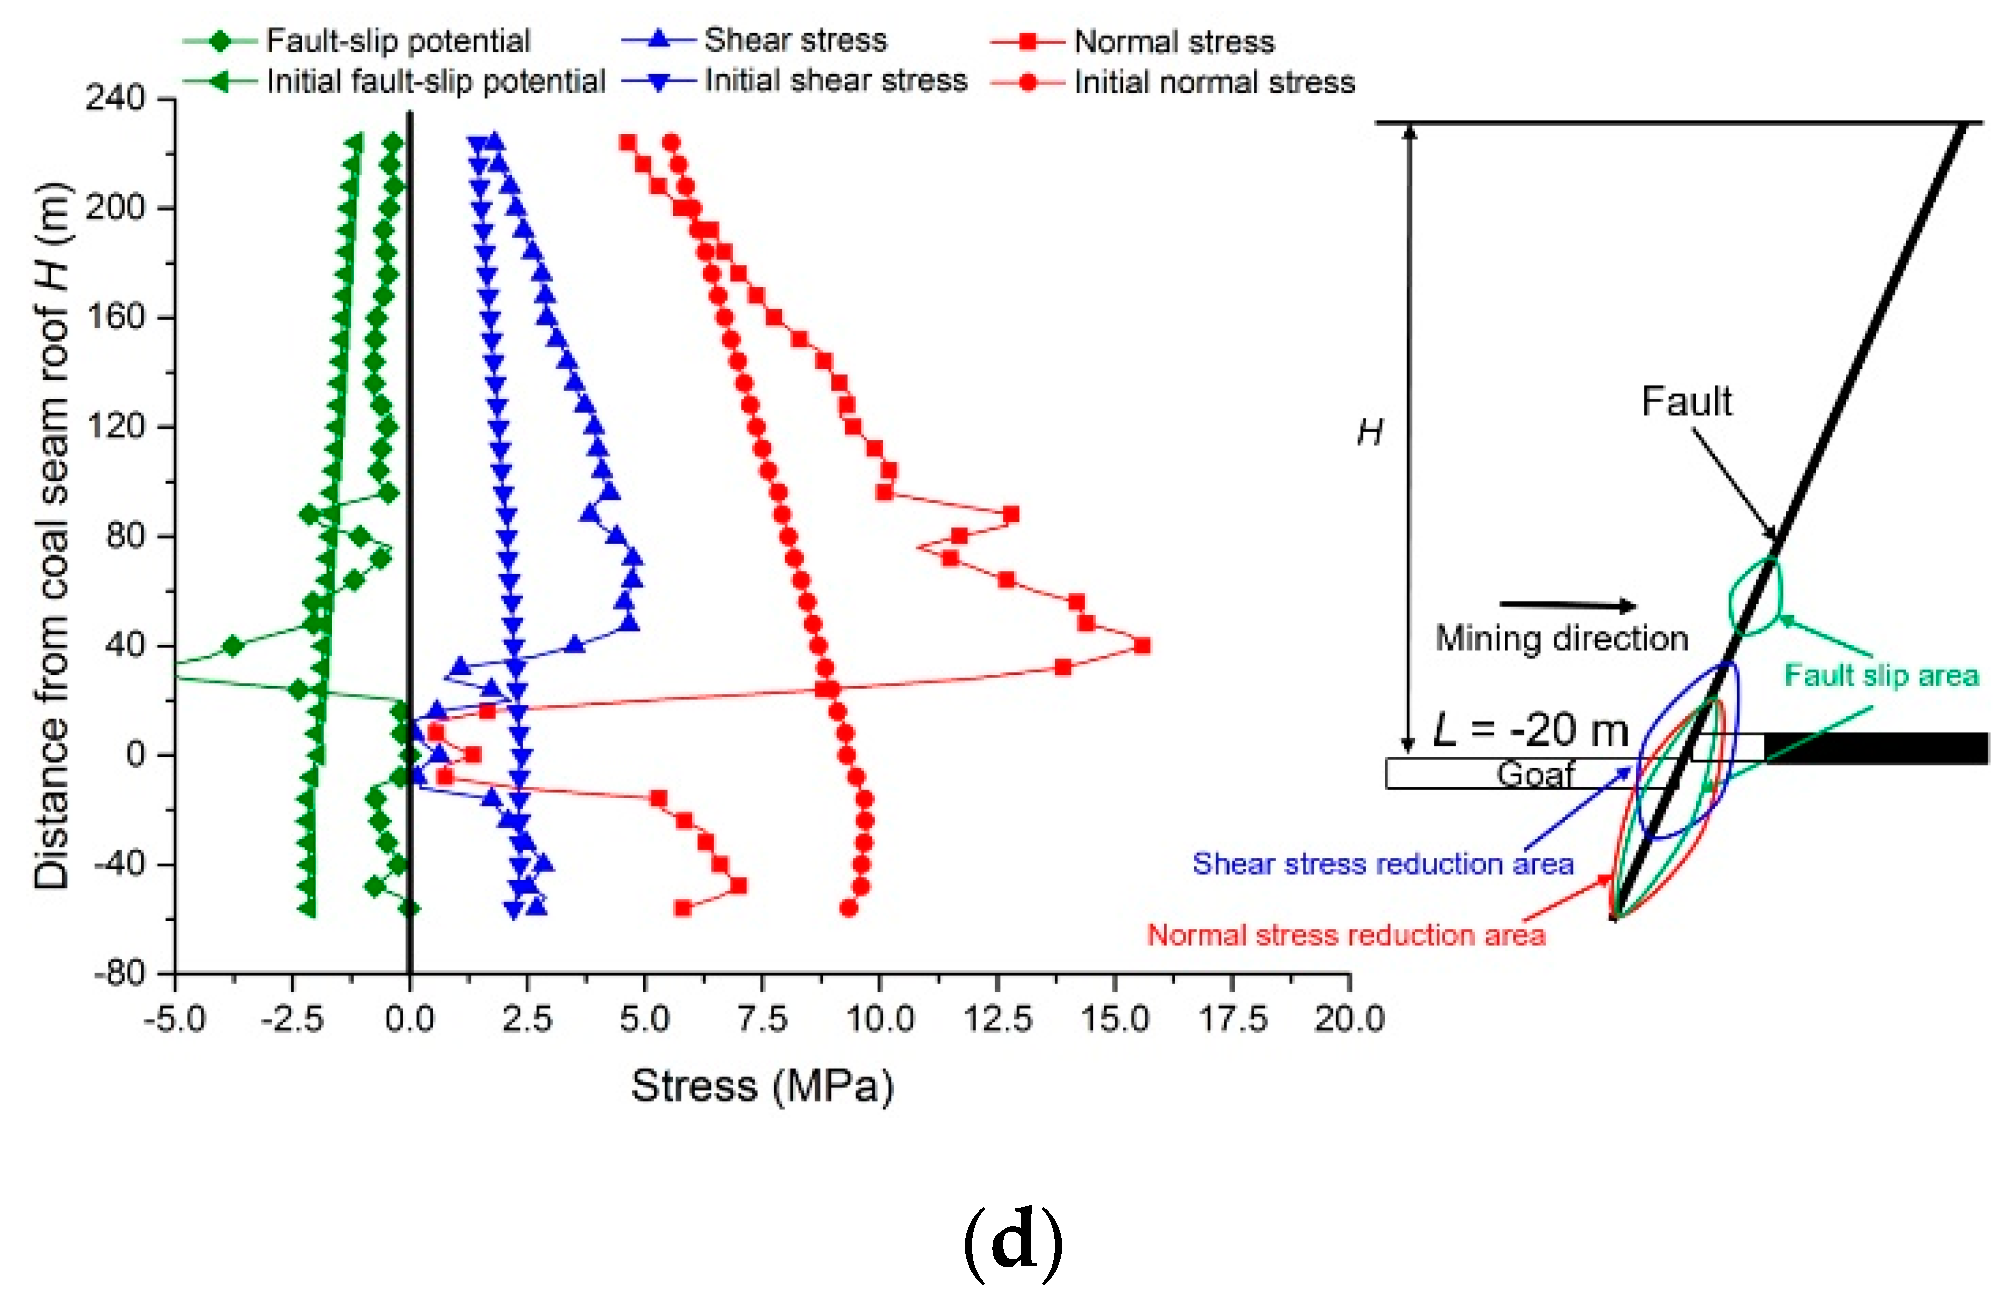
Figure 12 that when the panel is mined from the hanging wall to the fault position, the normal stress and shear stress of the coal-seam roof fault are increased compared with the initial stresses. The closer a fault is to the coal seam, the greater the increases in the stresses are. When the panel is mined from the fault 40 m to the fault location, the maximum normal stress increases from 15.9 MPa to 17.5 MPa, and the maximum shear stress increases from 5.81 MPa to 7.31 MPa, increases of 10% and 26%, respectively. The increase of the maximum shear stress is greater than the increase of the maximum normal stress. After the panel is mined through the fault, the maximum shear stress and the maximum normal stress of the roof are reduced, but the normal stress and shear stress of the coal-seam roof fault are still generally increased compared with the initial values. It can be seen that upon mining the panel through the fault from the hanging wall, the roof fault accumulates energy, and the accumulated energy reaches its maximum when the panel is mined to the fault location. After the panel is mined through the fault, the roof fault still accumulates a great deal of energy. During the period of mining the panel through the fault, the areas where the shear stress and normal stress decrease are mainly concentrated in the position of the coal floor fault, and the range of the normal stress and shear stress reduction area increase with the continuous mining of the panel. When the panel is mined through the fault from the hanging wall, the increase of the normal stress of the roof fault causes the shear strength of the roof fault to increase, which is beneficial to maintaining the stability of the roof fault. The normal stress of the floor fault is reduced, the shear strength of the floor fault is reduced, and the floor fault is more prone to slipping. Therefore, when the panel is mined through the fault from the hanging wall, the roof fault maintains its stability. There is only a small area in the roof fault where slip occurs, and most of the roof fault areas do not have slipping. The fault-slip area is mainly concentrated in the floor fault, where the normal stress of the fault is reduced.
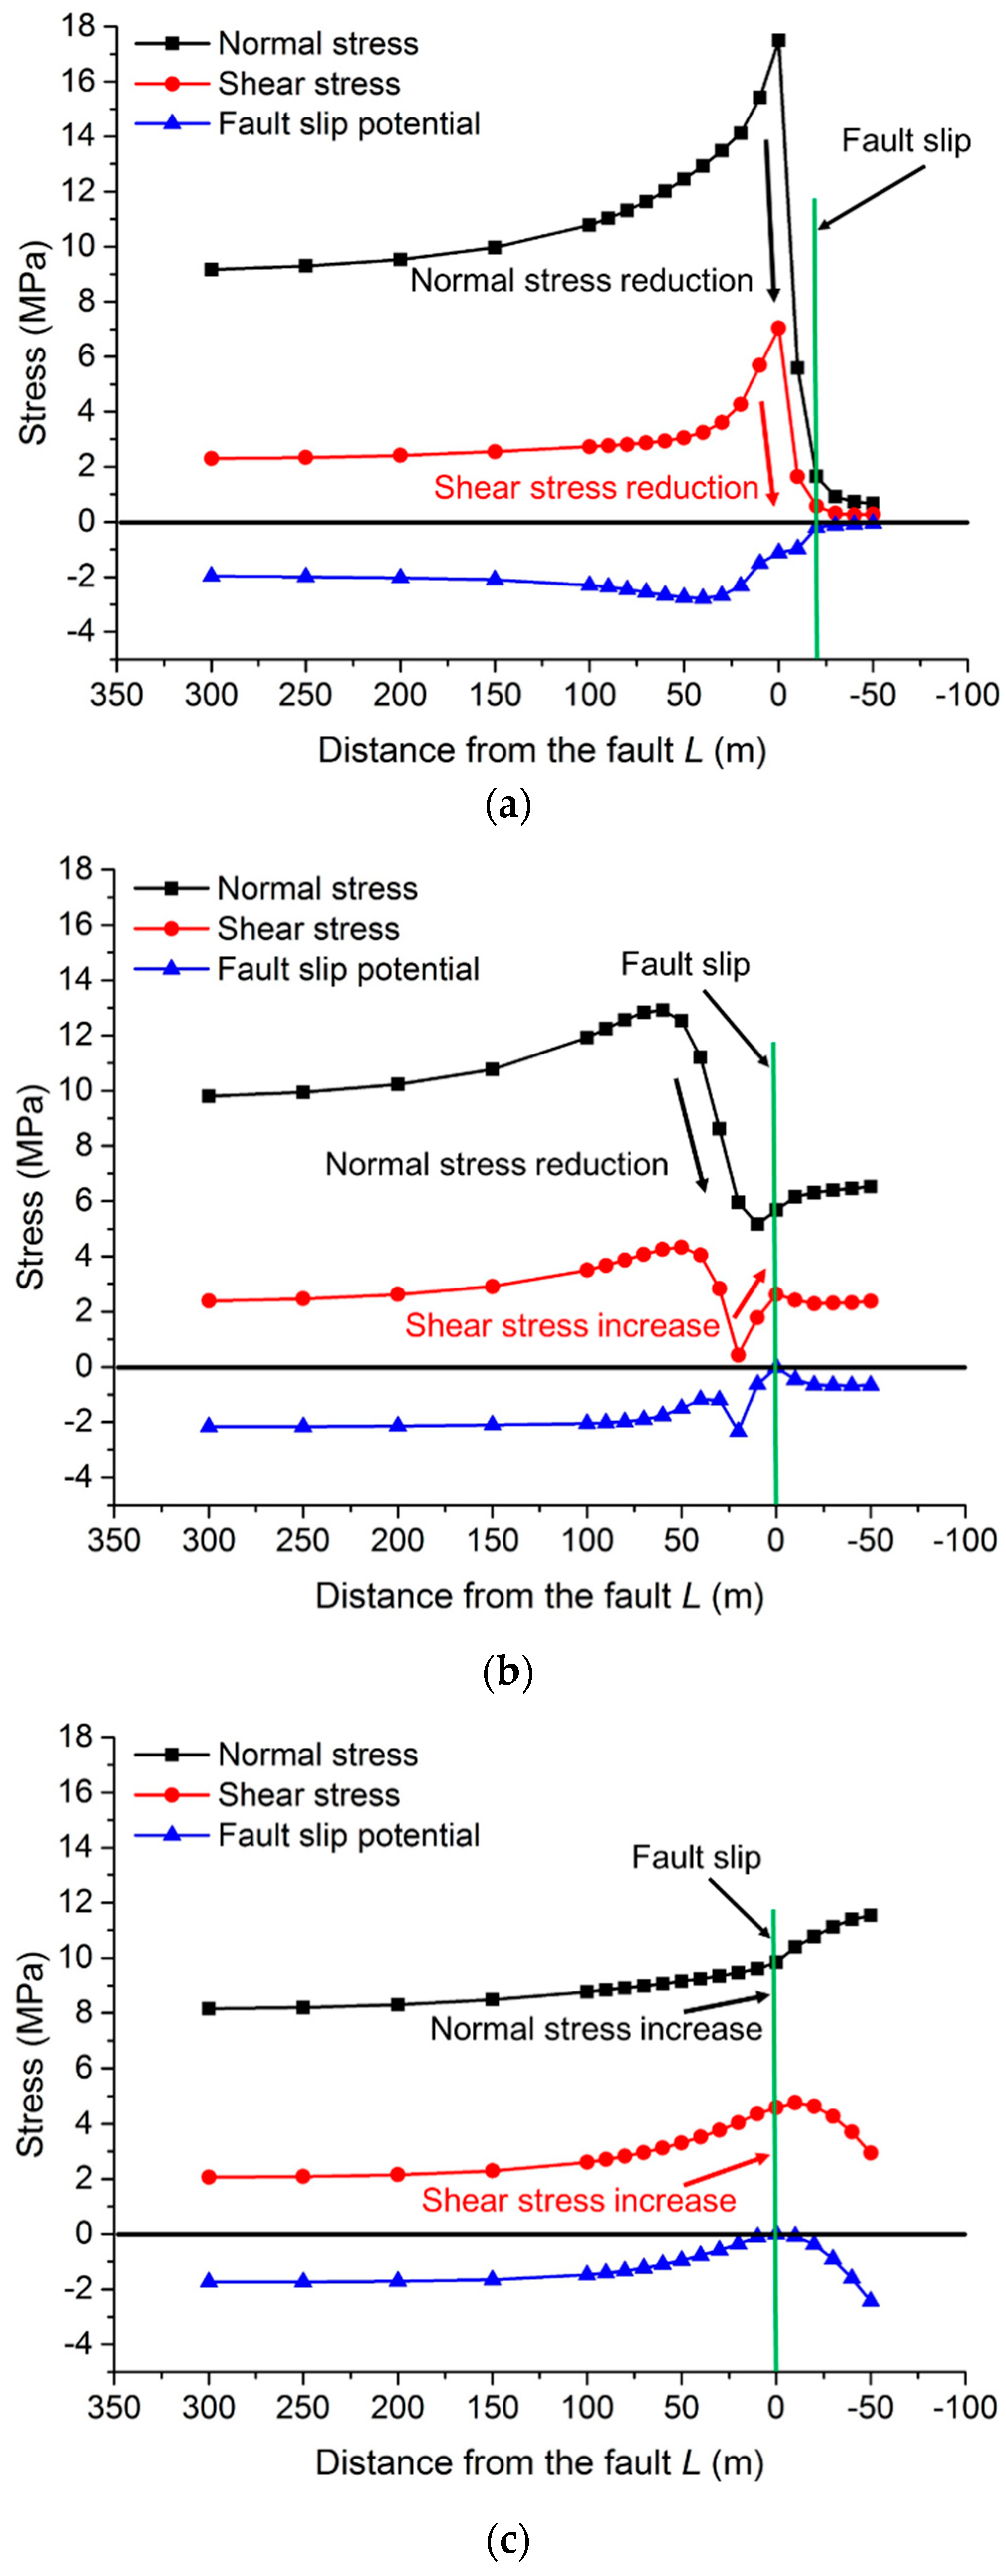
5.3. Fault-Slip Mechanism
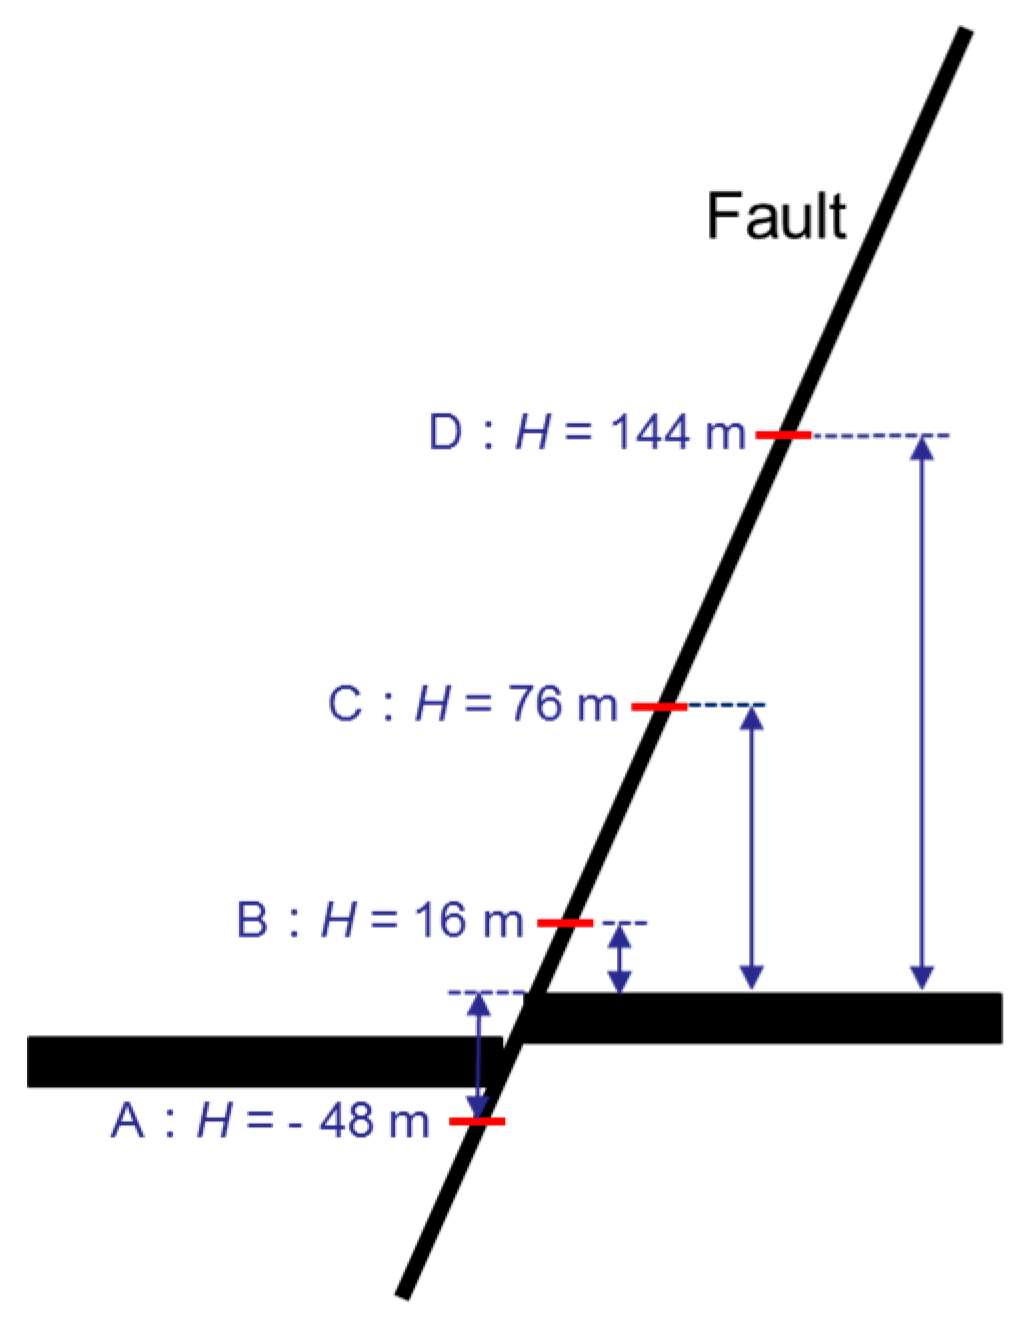
To more accurately study the fault-slip mechanisms of different locations of the fault, the normal and shear stresses are measured at different fault locations during the period of mining the panel through the fault. The measurement points are arranged as shown in
Figure 13, and the changes of the stress state during the period of mining the panel through the fault are analyzed.
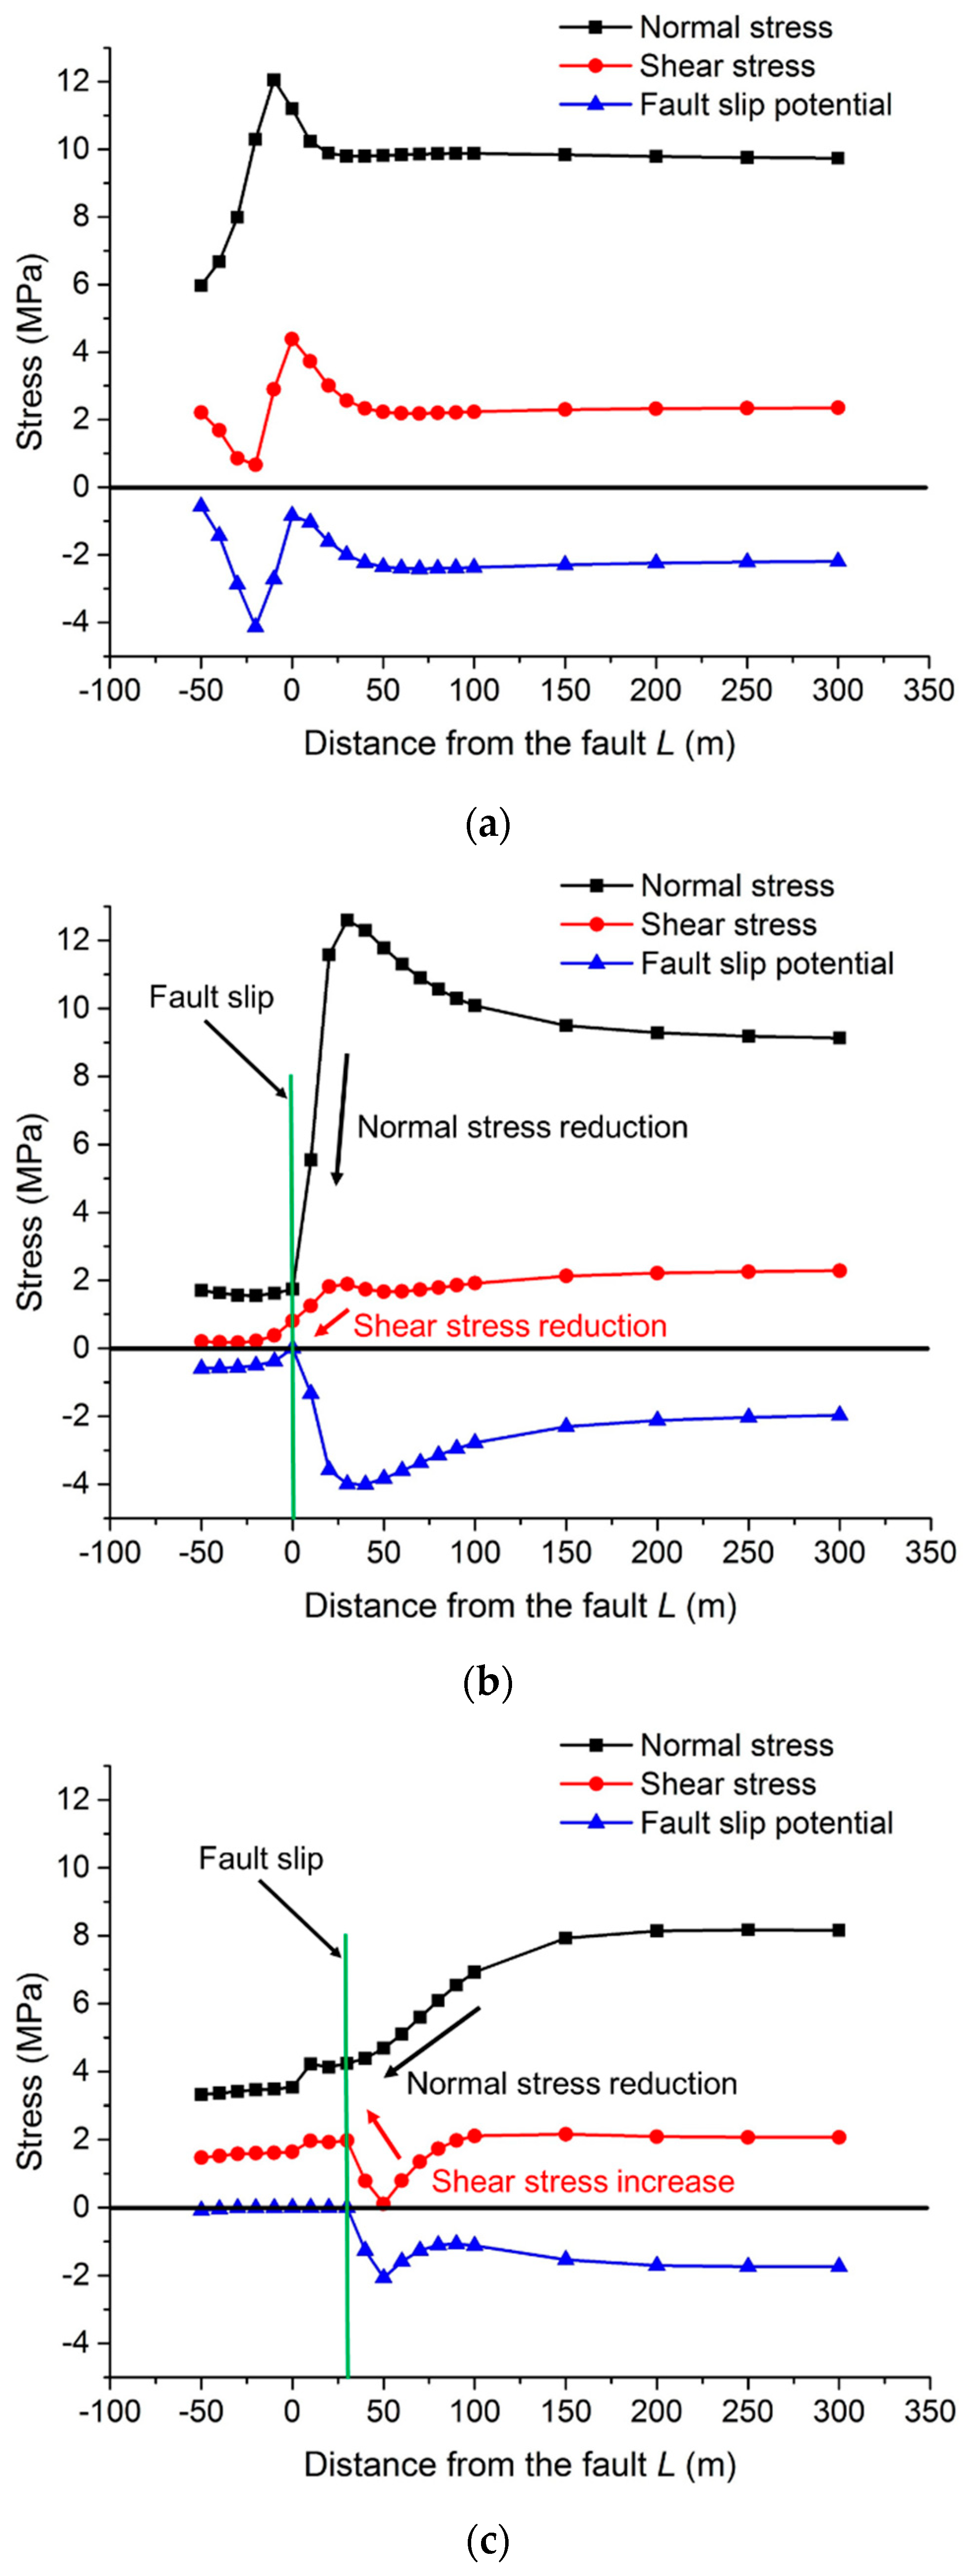
Figure 14 shows the evolution of the fault stress at different measuring points when the panel is mined through the fault from the footwall. It can be seen that the A-position fault does not slip during the panel mining through the fault and maintains its stability, but a shear slip occurs in the fault at the other three measuring points. In the B-position fault, when the panel is mined to 30 m from the fault, the normal stress increases to 12.6 MPa, and the shear stress does not change much, remaining basically stable at approximately 1.8 MPa. Fault slip occurs when the working face is mined from
L = 30 m to
L = 0 m. Since this position of the fault is close to the goaf, when the panel is mined to the vicinity of the fault, the normal stress of the fault suddenly decreases to 1.7 MPa, a reduction of 87%, and the shear stress is reduced from 1.9 MPa to 0.8 MPa, a reduction of 58%. The reduction of the normal stress is much larger than the reduction of the shear stress. Therefore, the slip mechanism of the fault is abruptly reduced in terms of both the normal stress and the shear stress, but the reduction of the normal stress is greater than that of the shear stress. The normal stress of the C-position fault continues to decrease when the panel is mined to
L = 30 m. When the panel is mined to
L = 50 m, the shear stress decreases, but when the panel is mined from
L = 50 m to
L = 30 m, the shear stress increases from 0.11 MPa to 1.97 MPa, which is an increase of nearly 17 times. Therefore, the fault-slip mechanism at this position is a sharp increase in the shear stress and a continuous decrease in the normal stress. The normal stress of the D-position fault continues to decrease when the panel is mined to
L = 10 m, and the normal stress decreases and tends to be stable. When the panel is mined from
L = 80 m to
L = 10 m from the fault, the shear stress increases from 0.2 MPa to 2.0 MPa, which is an increase of 9 times. Therefore, the C-position fault plane and the D-position fault plane slip mechanisms are similar, with both due to a sharp increase in the shear stress and a continuous decrease in the normal stress.
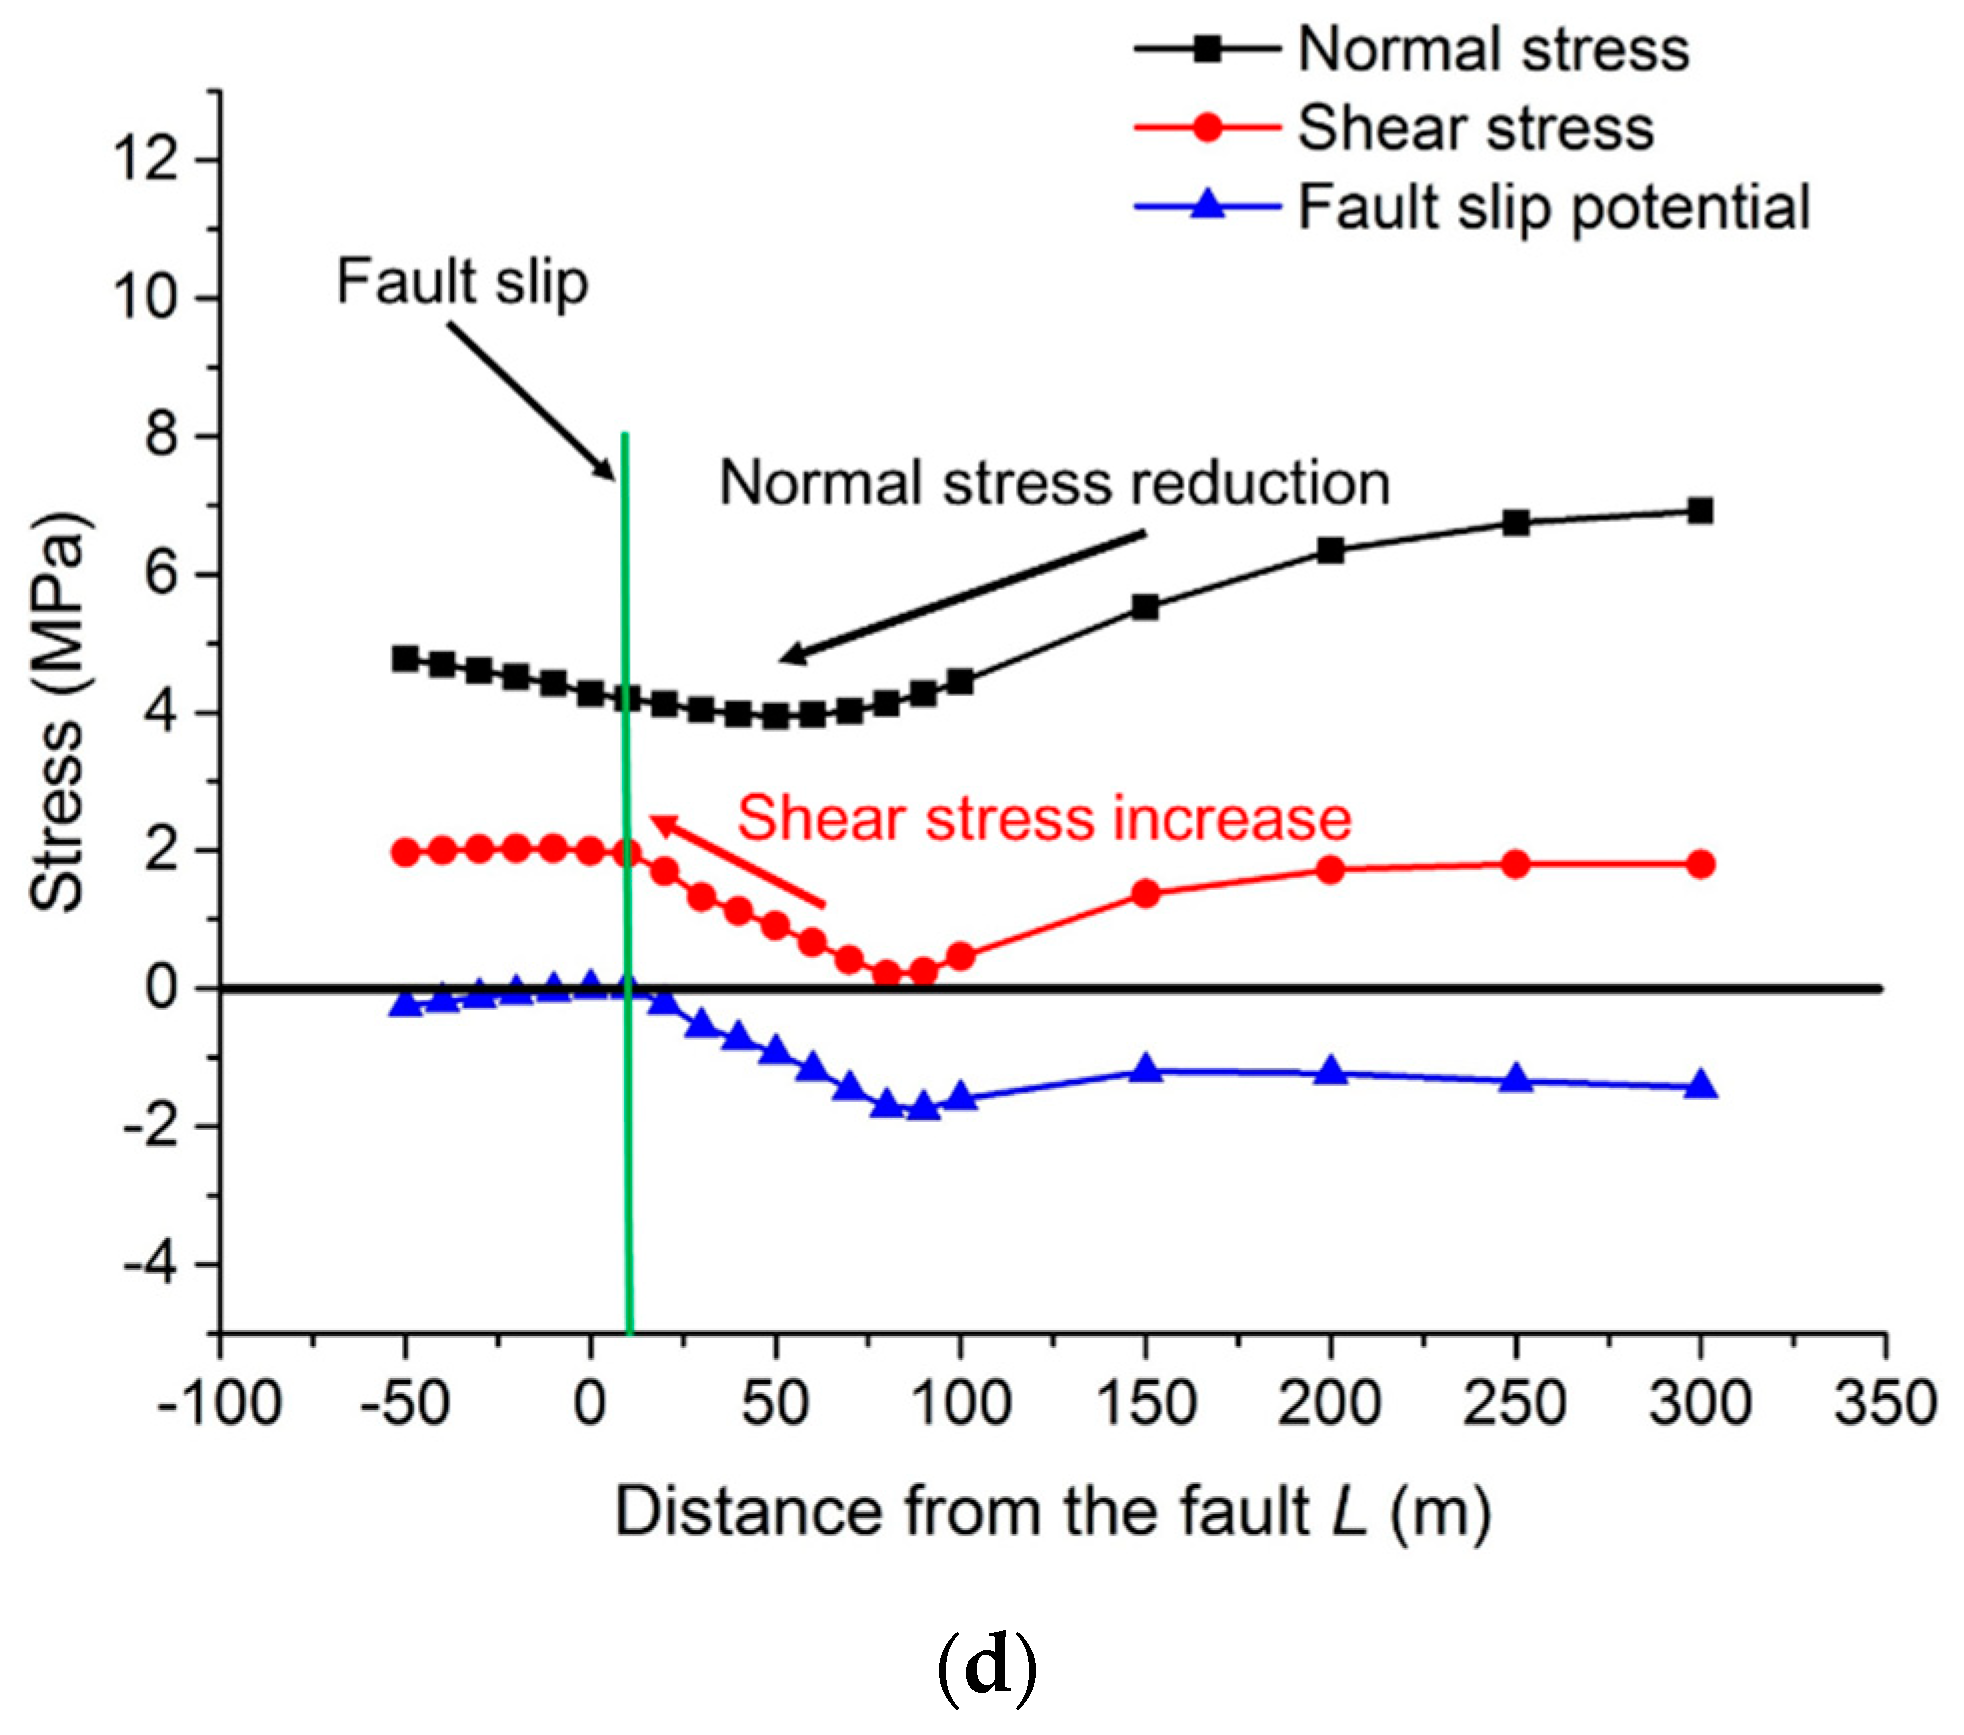
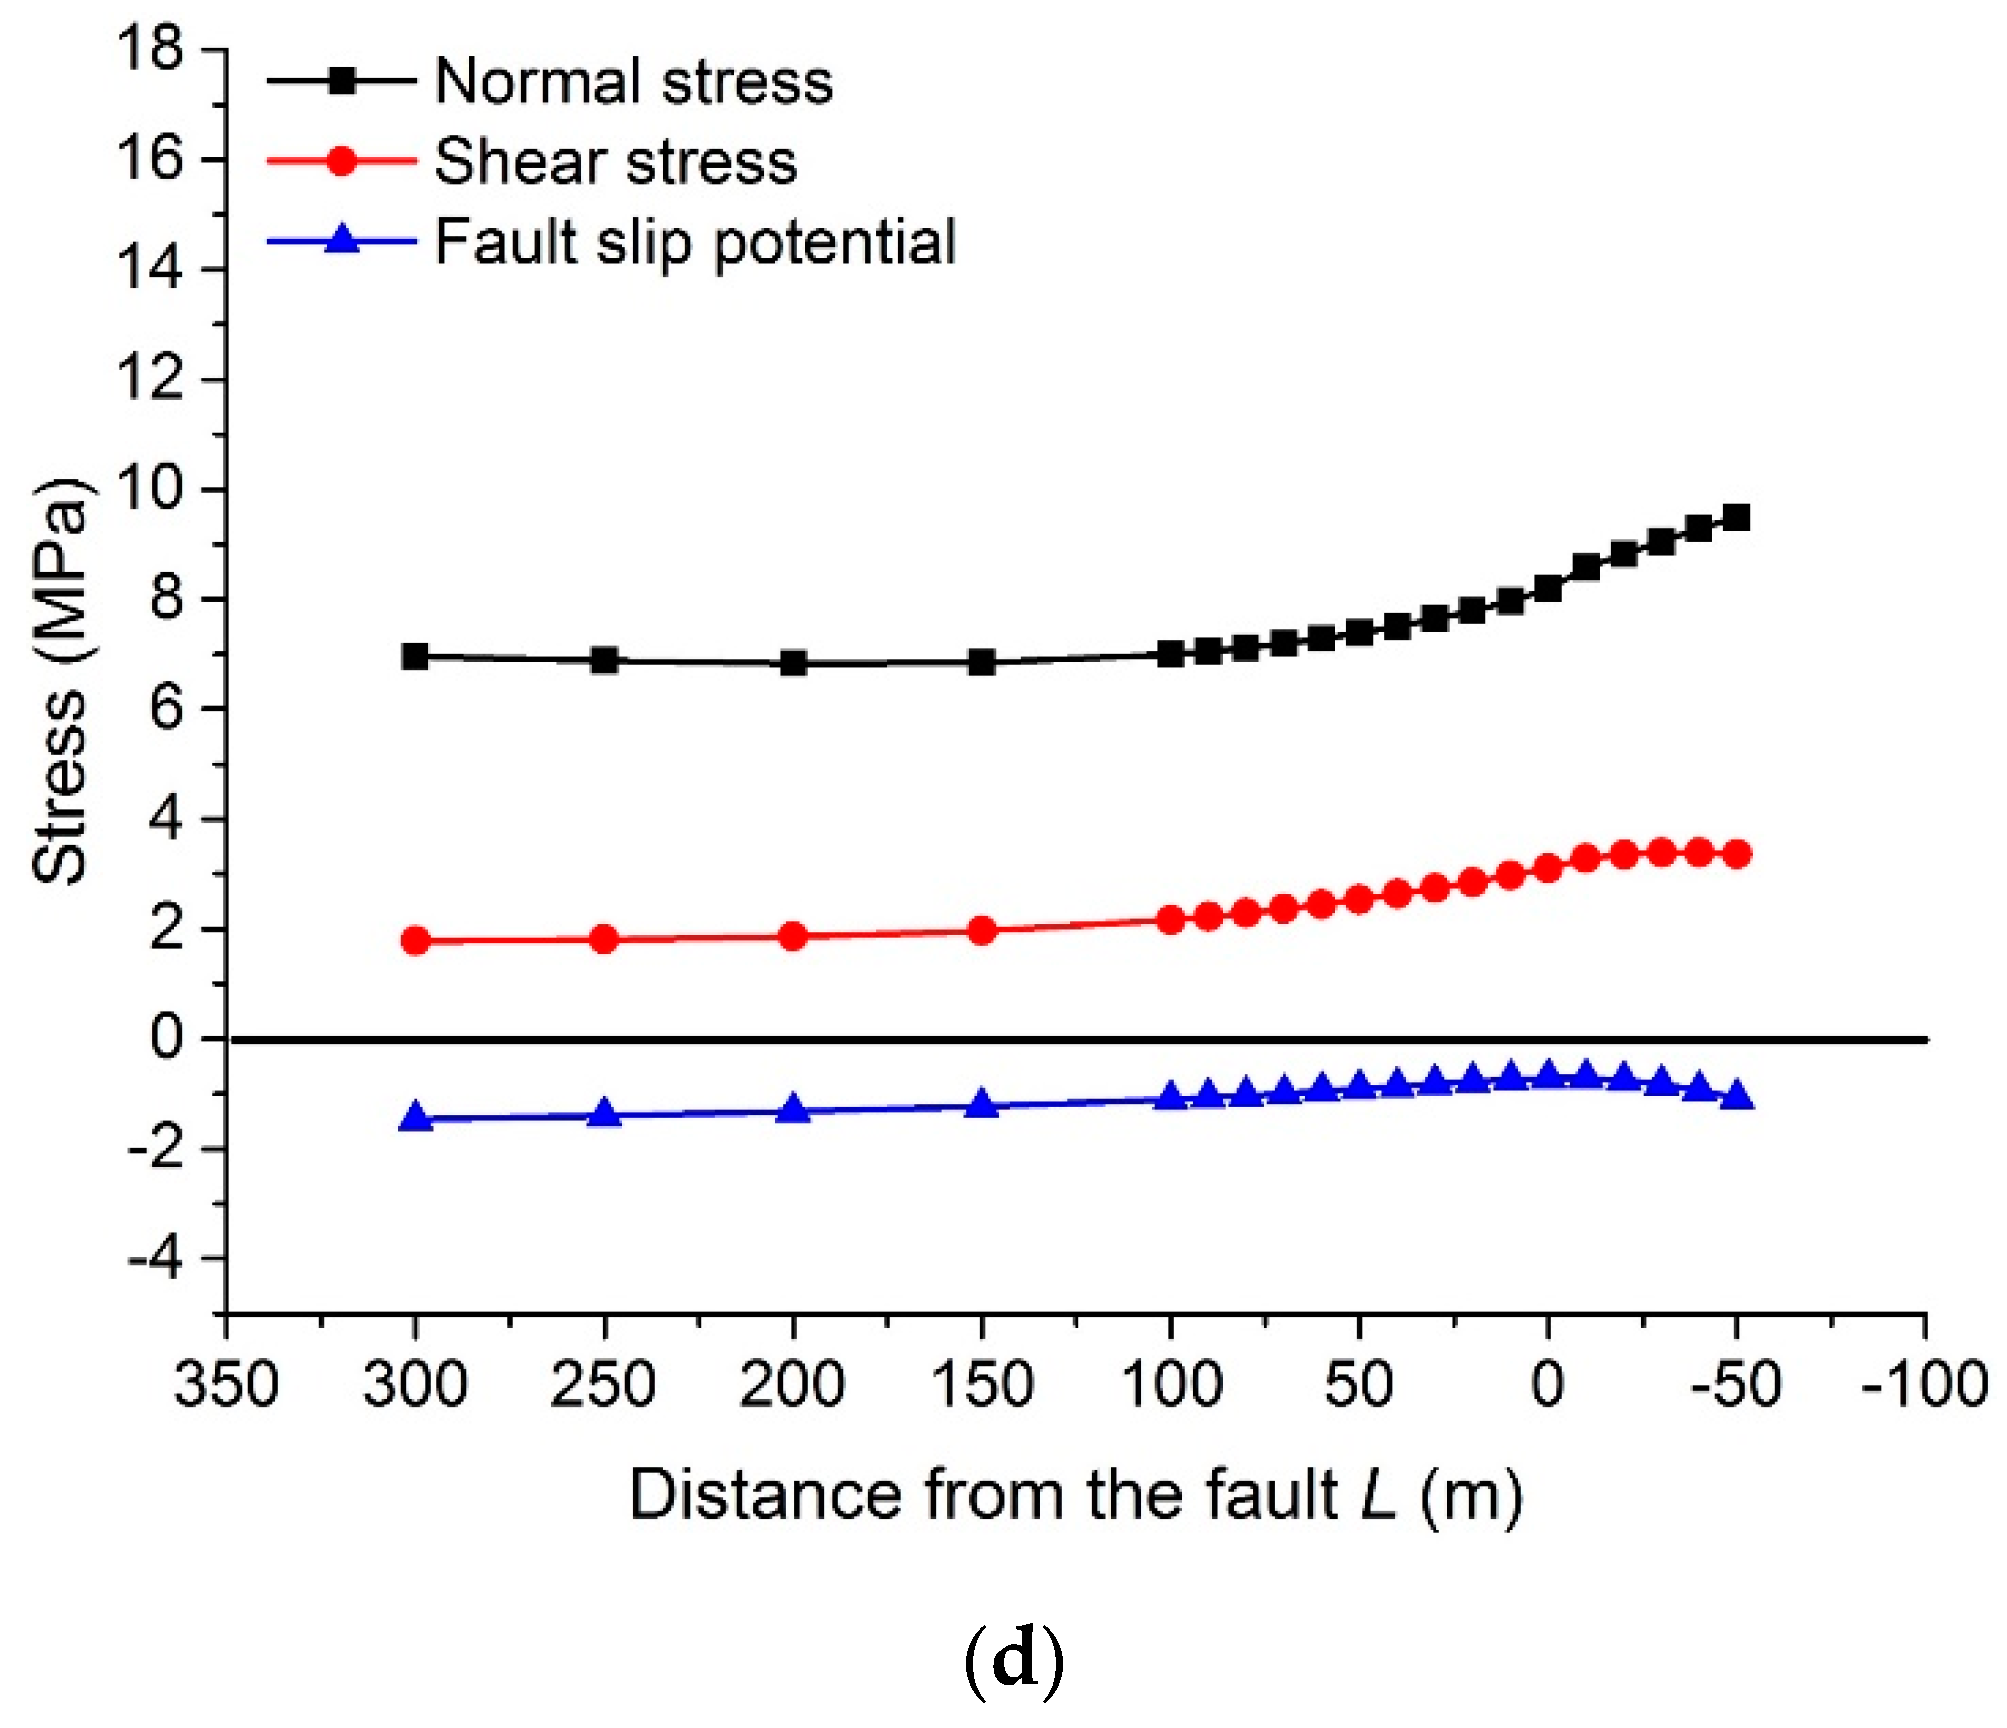
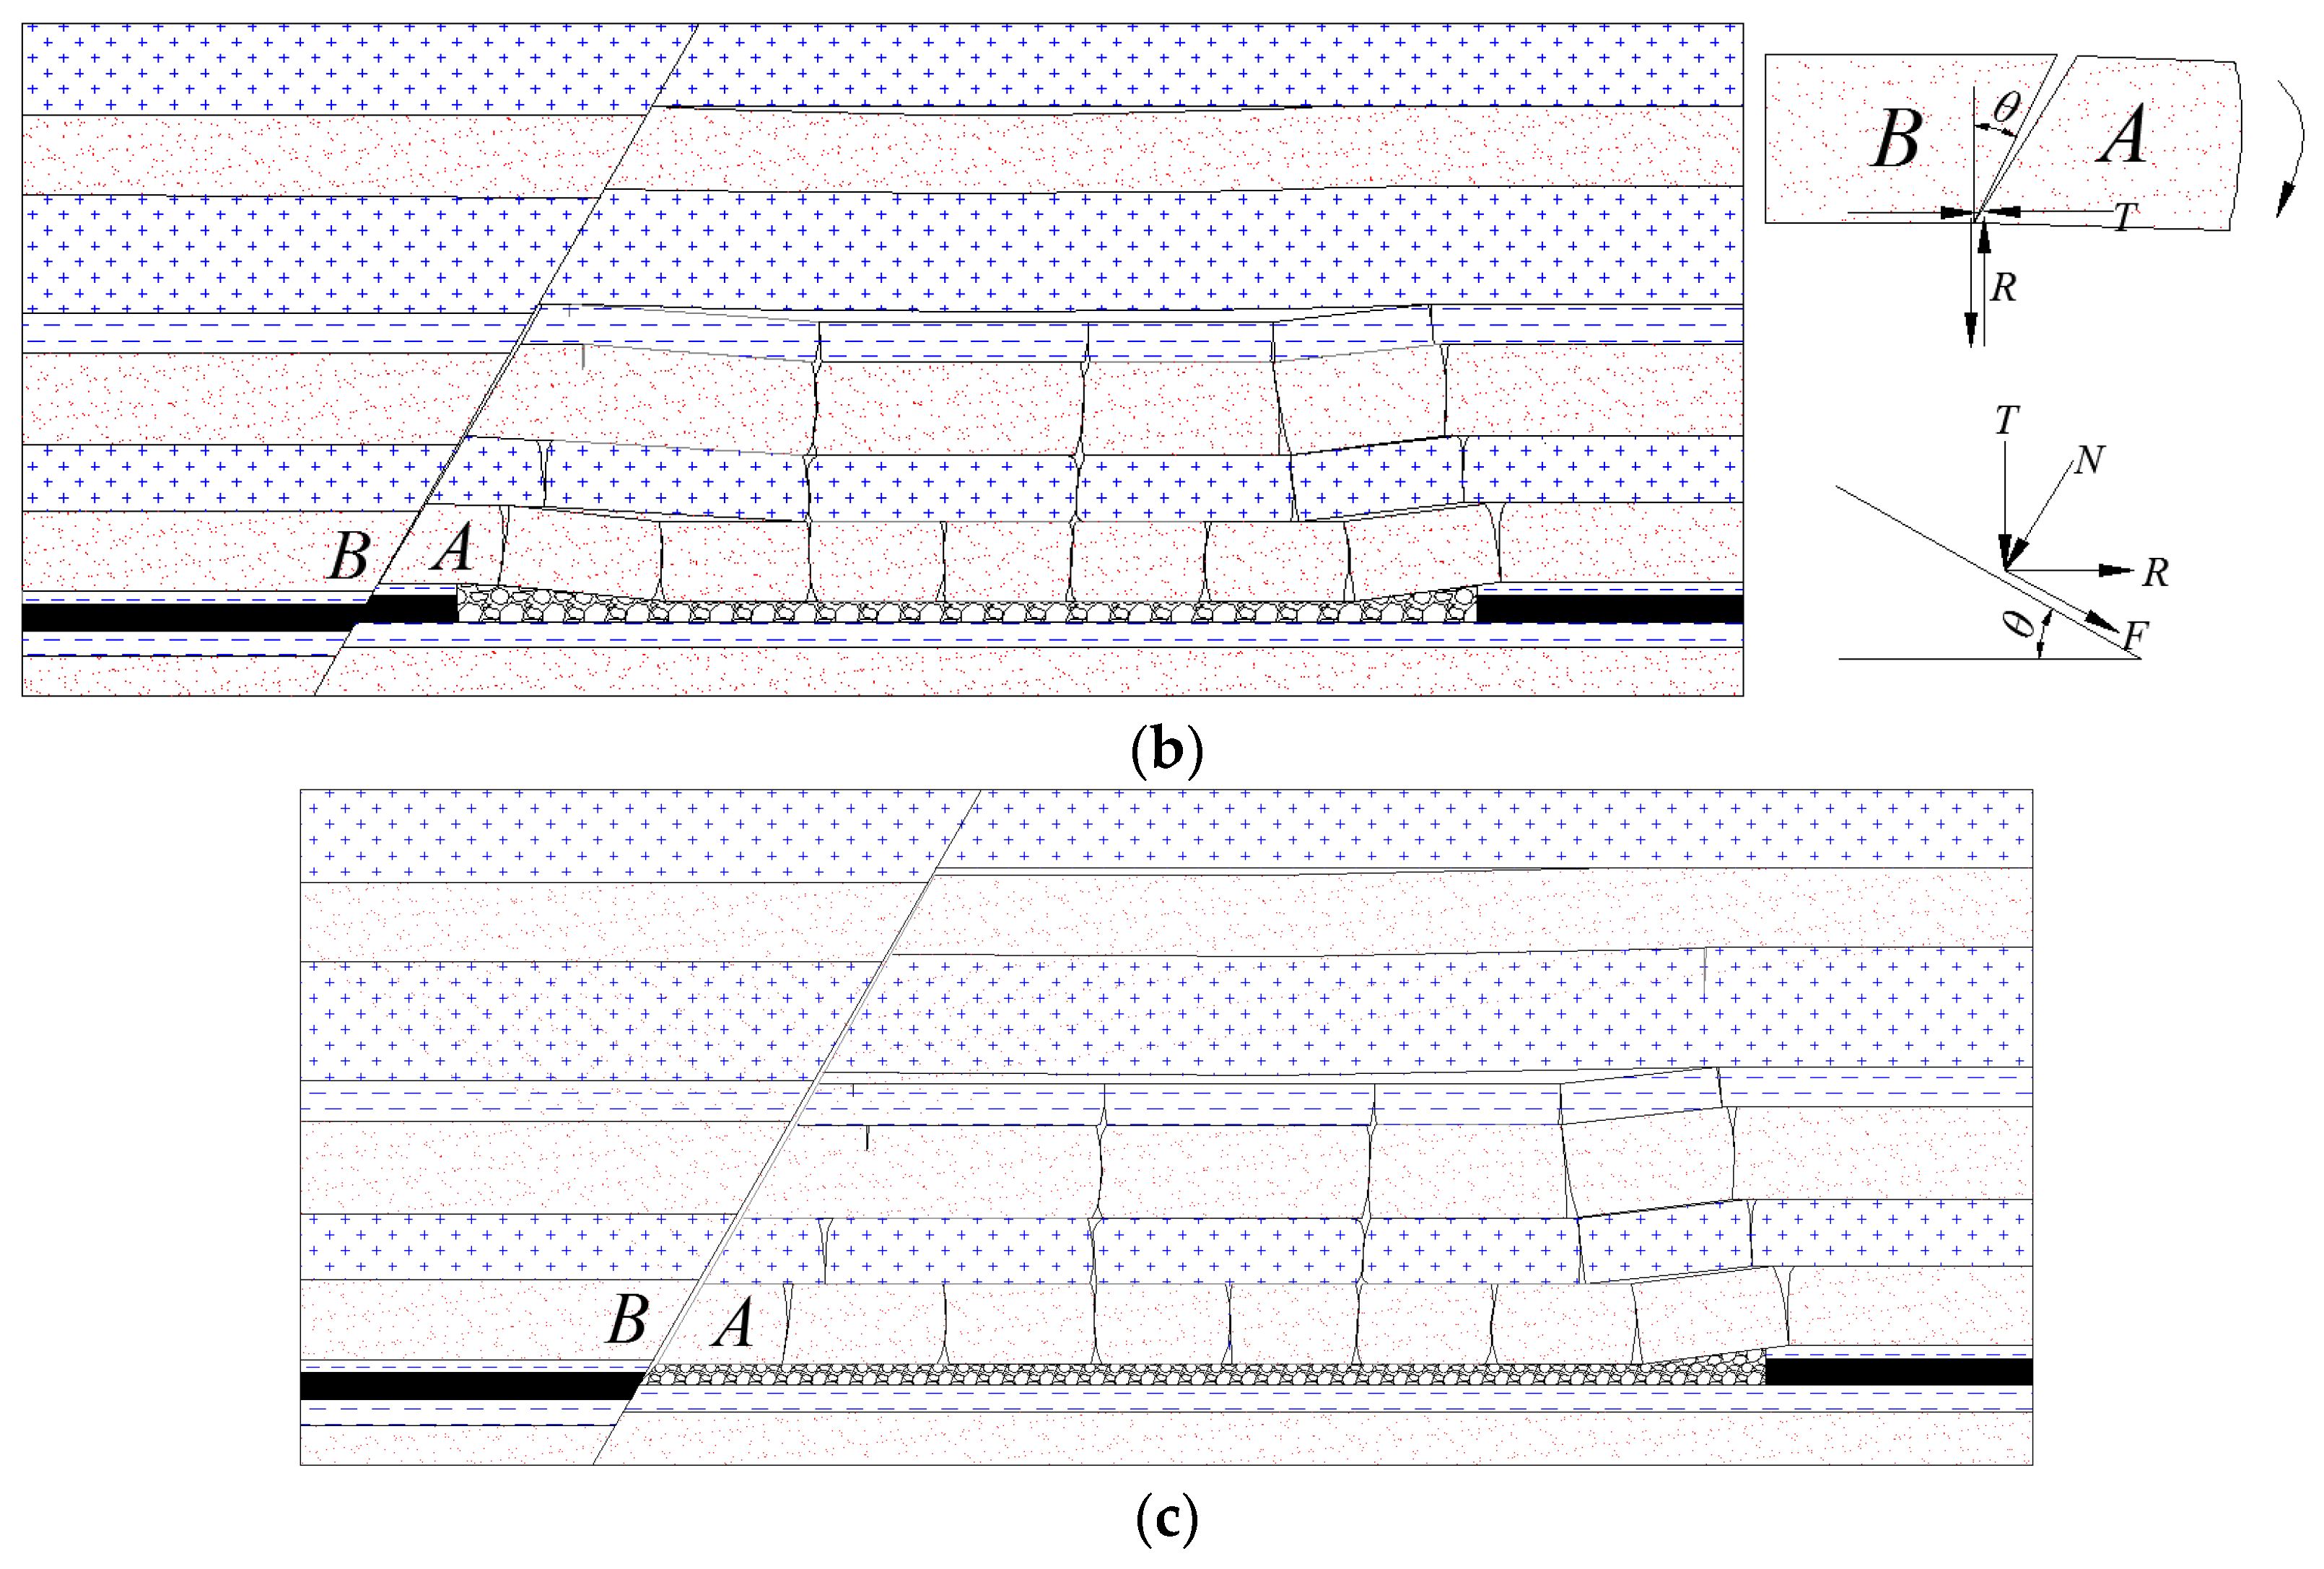
Figure 15 shows the evolution behavior of the fault stress at different measuring points when the panel is mined through the fault from the hanging wall. It can be seen that as with the case for the panel mined through the fault from the footwall, when the panel is mined through the fault from the hanging wall, the fault-slip mechanisms and stress states of the fault at different positions vary greatly. It can be seen from
Figure 15d that there is no slip in the high-level fault when the panel is mined through the fault from the hanging wall, and the slip range of the roof fault is small. The slip of the floor fault (A-position fault) is mainly due to the continuous reduction of the normal stress, which causes the shear strength of the fault plane to decrease. When the panel is mined from
L = 20 m to
L = 0 m, the shear stress suddenly increases sharply. The B-position fault decreases significantly with the normal stress and shear stress as the panel is mined, but the reduction of the normal stress is greater than that of the shear stress, causing the shear slip of the fault. However, a shear slip occurs when the panel is mined through the fault 20 m (
L = −20 m). The C-position fault is the only slip area in which the normal stress is higher than the initial value. When the panel is mined to the fault, the normal stress increases from 8.17 MPa to 9.84 MPa, and the shear stress increases from 2.07 MPa to 4.58 MPa, increases of 20% and 121%, respectively. The increase of the shear stress is greater than that of the normal stress, causing the fault slip.
Therefore, the slip mechanism of the fault can be divided into three types. I: The normal stress and shear stress decrease abruptly, but the reduction of the normal stress is greater than that of the shear stress. This situation only occurs in a fault close to the position of the goaf. II: The normal stress is continuously reduced, the shear strength of the fault is decreased, and the shear stress is suddenly increased, causing the shear stress to be greater than the shear strength of the fault. This situation is the most common and mainly occurs in a roof fault when the panel is mined through the fault from the footwall and in a floor fault when the panel is mined through the fault from the hanging wall. III: Both the normal stress and the shear stress increase, but the increase of the shear stress is greater than that of the normal stress. This situation is rare and occurs only in a small part of the roof fault when the panel is mined through the fault from the hanging wall.
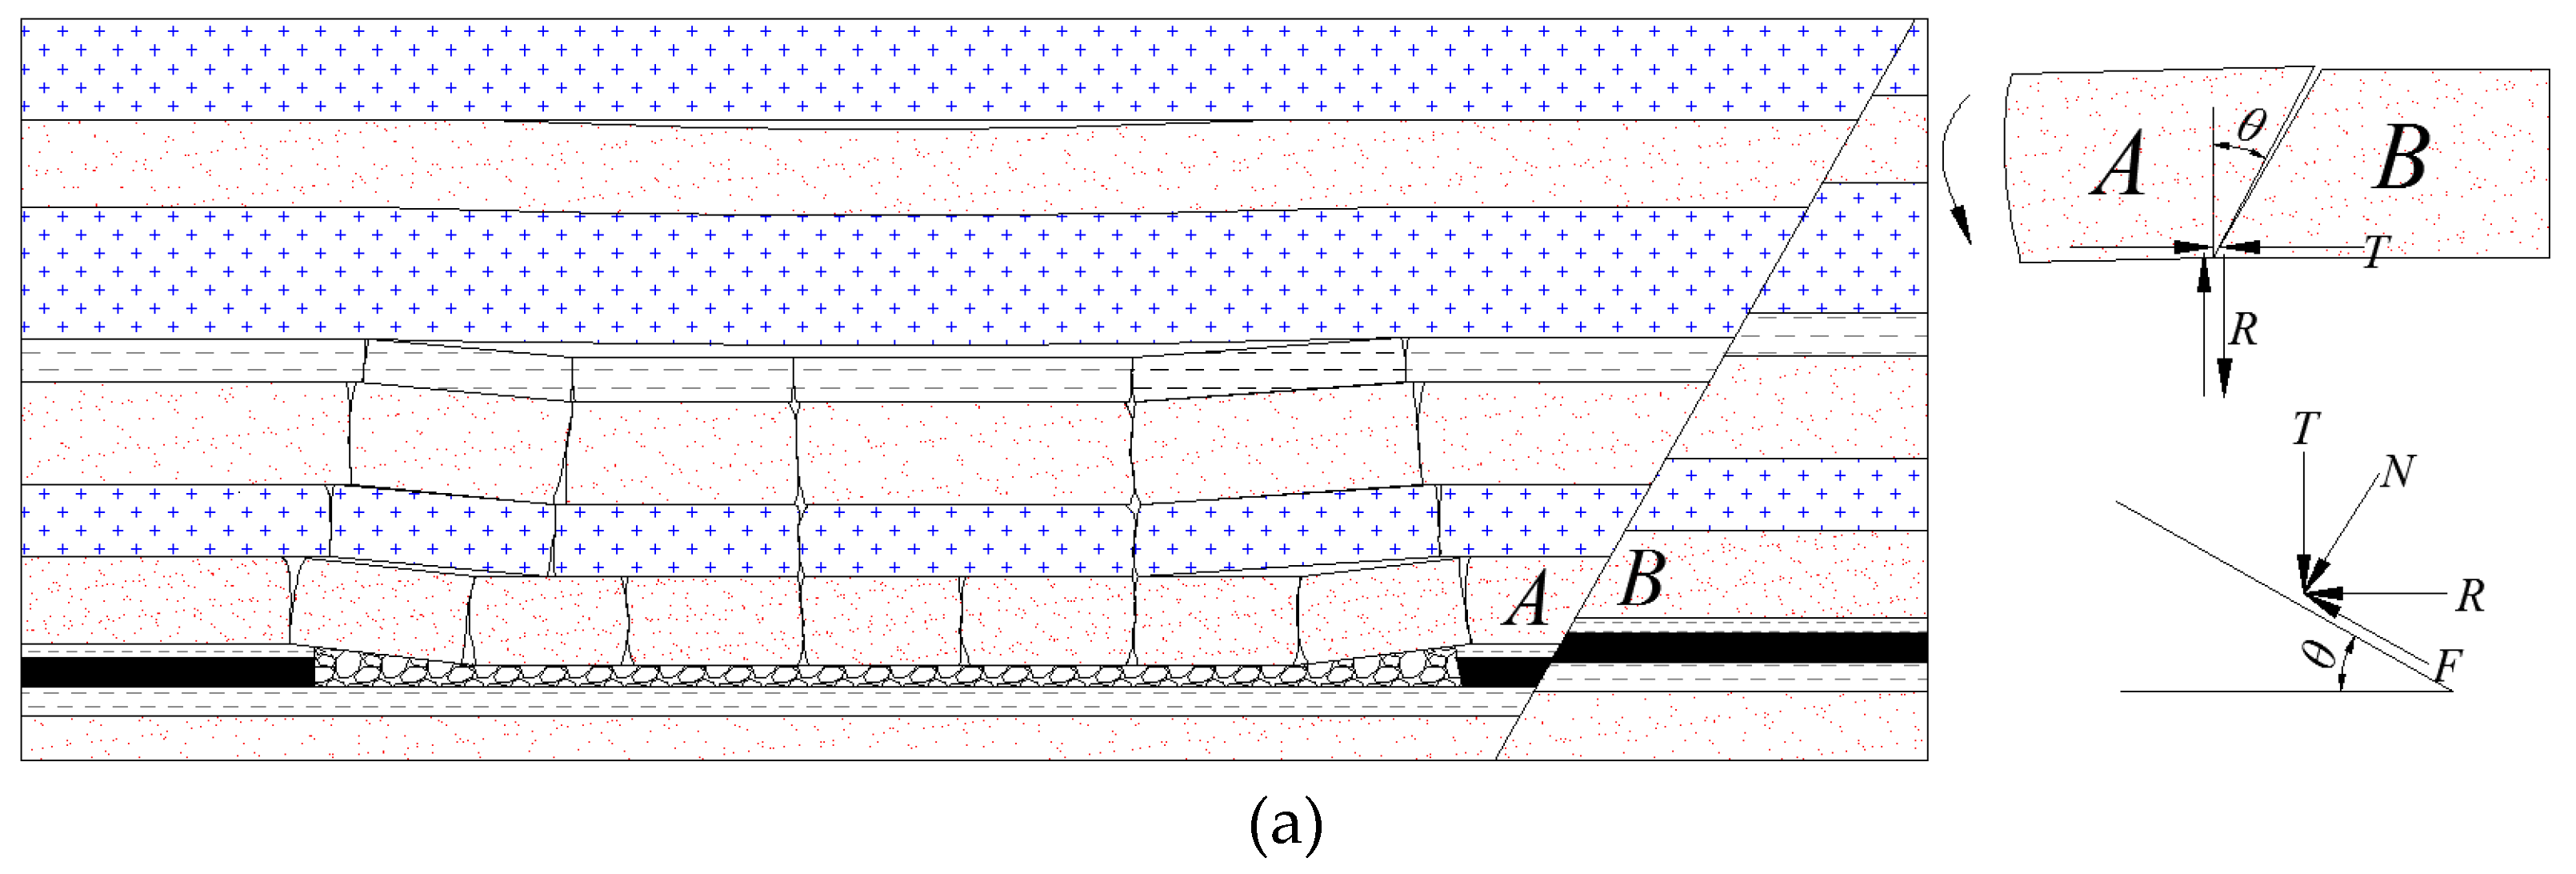
6. Caving and Mechanical Analysis of Roof under Different Mining Directions
According to the above simulation results, it is known that when mining the panel through the fault from the footwall, the fault-slip range and the magnitude of the shear displacement are large, and the distribution of the roof pressure relief area is significantly affected by the mining. When the working face continues to advance, the roof rock layer periodically breaks. As the panel is mined to the vicinity of the fault, due to the cutting action of the fault, the complete roof is broken, and the roof rock layer near the fault is less likely to undergo other fractures. Therefore, the roof rock layer takes the fault in front of the working face as the contact surface of the occlusion point to form a hinged structure. The model shown in
Figure 16a,b show the roof sinking model when the working face advances to the vicinity of the fault after the last breaking of the roof sandstone before the panel is mined through the fault. The model position of
Figure 16c is a schematic diagram of the sinking of the roof when the panel is mined through the fault from the footwall and the working face is advanced to the fault position. The extent of roof failure in the figure refers to the developmental range of the plastic zone in the numerical simulation analysis. Since the breaking step and the failure mode of the coal seam roof after the excavation of the panel are difficult to accurately quantify,
Figure 16 is only an abstract analysis model for a better comparison of the effects of mining on a fault under different mining directions.
As shown in
Figure 16a, when the panel is mined through the fault from the hanging wall, the caving area of the roof rock layer is not easily affected by the fault because the direction of the panel is opposite to the tendency of the fault. When the panel is mined to the vicinity of the fault, the impact of the mining on the fault is still small. It can be seen from (b) and (c) that when the panel is mined through the fault from the footwall, the caving area of the roof rock layer is easily affected by the fault because the direction of the working face is consistent with the tendency of the fault. When the panel is mined to the vicinity of the fault, the roof rock layers on both sides of the fault undergo shear slipping along the fault. When the panel is mined to the fault position, the fault-slip range extends from the high position of the fault to the coal-seam roof position of the fault. The roof rock layer on the fault side cannot form an alternate interior fracture structure from bottom to top, but it slips with the fault as the boundary, so that the entire footwall is in the pressure relief area.
If the angle between the fault and the vertical plane is
θ and the fault is taken as the contact surface of the occlusion point with the hinged structure, the force at the occlusion point is as shown in
Figure 16.
In the model shown in
Figure 16a, the normal stress of the fault is:
The shear stress of the fault is:
The equilibrium condition is:
In the model shown in
Figure 16b, the normal stress of the fault is:
The shear stress of the fault is:
The equilibrium condition is:
Here, T is the horizontal pressure, R is the shear stress at the occlusion point, φ is the friction angle of the fault, θ is the angle between the fault and the vertical plane, F is the shear stress of the fault, and N is the normal stress of the fault.
For model b, it can be seen from Equation (10) that when θ = φ, no matter how large the horizontal pressure T is, the rock mass cannot maintain a balanced structure. In general, the friction angle of the fault is 21° ~ 38°, so when the fault angle is less than 52° ~ 69°, the rock block will be unstable. Moreover, the horizontal pressure T decreases as the panel is mined through the fault from the footwall. The roof rock mass is easily slipped, rotated and broken using the fault structure, and the roof rock block cannot easily achieve equilibrium. For model a, it can be seen from Equation (6) that the roof rock block can more easily maintain a stable structure, and as the panel is mined to the fault, the horizontal pressure T increases, further suppressing the slipping of the fault. Therefore, the theoretical analysis results show that compared with the condition of the panel is mined through the fault from hanging wall, the fault is more likely to slip when the panel is mined through the fault from footwall, which is consistent with the numerical simulation results.
7. Discussion
Rockbursts are generally characterized into 3 types, namely strain bursts, pillar bursts, and fault-slip bursts. Among the types of rockbursts, fault-slip bursts could cause the most significant damage to large areas that extend over several levels in underground mines given that intense seismic waves arise from the fault-slip. In such a case, seismic waves play a critical role in causing damage to mining openings. Therefore, how to take reasonable measures to control the occurrence of rockbursts induced by fault activation is the key to ensuring the safe recovery of the working face near the fault. The following sections summarize the main technical measures for controlling the rockbursts induced by fault slip.
7.1. Destressing Techniques
The research in Chapter 4 shows that when the panel is mined to the vicinity of the fault, the stress concentration of the abutment stress is increased. At the same time, shear slip occurs in the fault as the working surface approaches the fault. The high static load is affected by the dynamic load of the fault activation, and it is more prone to impact rockbursts. Destressing techniques aim to release the strain energy stored in the coal and rock mass by inducing fracturing and/or allowing the mass to yield without storing large amounts of energy, thereby achieving the goal of preventing and controlling the rockbursts. These techniques include destress blasting, destress drilling, hydraulic fracturing, and water infusion.
7.2. Measures to Control Fault Slip
It can be seen from the analysis in Chapter 5 that when the panel is mined through the fault from the hanging wall, the fault slip is much less severe than when the panel is mined through the fault from the footwall. Therefore, in the panel design, the panel should first be considered to be mined through the fault from the hanging wall, and the impact of the fault-slip dynamic load on the stope should be reduced. In addition, properly reducing the width of the panel can effectively reduce the concentration of the abutment stress and reduce the extent of fault slip while the working face crosses the fault. The longwall panel is mined by the filling method, and the breaking range of the roof and the violent course of the roof movement are significantly reduced, so the severity of the fault slip as the panel is mined through the fault can be significantly reduced.
7.3. Reasonable Support Measures
Due to the unpredictability of rockburst occurrences, ground support is usually the final line of protection to ensure safety in high risk zones. A panel mined through a fault resulting in fault slip and releasing a seismic wave influences the roadway of the stope. Therefore, to ensure the stability of the roadway, reasonable roadway support measures should be taken. A constant-resistance large-deformation anchor (cable) capable of providing constant resistance and a good extension amount also contributes to the prevention and control of the impact of rockburst disasters. In addition, when a panel is mined through a fault, the support strength and support distance of the panel ahead of the working face should be strengthened to ensure the stability of the roadway.
8. Conclusions
In this study, the microseismicity events during the mining of a panel through a fault from the footwall were analyzed. The study shows that the count of daily microseismicity events and the total daily microseismicity energy increase significantly when the panel is mined from L = 40 m to L = 0 m, and the count and energy level of the microseismicity events on the roof are much larger than those of the microseismicity events on the floor. The height of the microseismicity events near the fault is much greater than that of the microseismicity events in the complete roof layer. After the panel is mined through the fault, the total daily microseismicity energy and the count of daily microseismicity events are reduced.
The distribution of the mining stress and the behavior of the fault slip under two different mining directions are studied by numerical simulation. When the panel is mined through the fault from the footwall, the fault has a greater influence on the destress area of the stope. The destress area of the roof is divided by the fault, and the destress area is mainly located in the footwall. When the panel is mined through the fault from the hanging wall, the destress area of the stope is little affected by the fault, and the range of the destress area of the roof is similar to that of the complete roof. Under the two mining directions, when the panel is 20 m away from the fault, the peak value of the advance abutment stress reaches the maximum. When the panel is mined through the fault from the footwall, the peak value of the advance abutment stress decreases, and the reduction is greater than when the panel is mined through the fault from the hanging wall.
The magnitude of the shear displacement of the fault when the panel is mined through the fault from the footwall are significantly larger than those when the panel is mined through the fault from the hanging wall. Under the two mining directions, the variations in the normal stress and shear stress of the fault are quite different. When the panel is mined through the fault from the footwall, the normal stress and shear stress of the coal-seam roof fault are reduced compared with the initial values, and the normal stress and shear stress of the coal-seam floor fault are generally increased compared with the initial values. When the panel is mined through the fault from the hanging wall, the normal stress and shear stress of the coal-seam roof fault are generally increased compared with the initial values, and the normal stress and shear stress of the coal-seam floor fault are generally reduced compared with the initial values. The fault slip mainly occurs in the fault region where the normal stress is reduced. Therefore, the fault slip occurs mainly in the coal-seam roof fault when the panel is mined through the fault from the footwall. The fault slip occurs mainly in the coal floor fault area when the panel is mined through the fault from the hanging wall. The variations in the normal stress and shear stress at different positions of the fault during the period of mining the panel through the fault are analyzed. There are differences in the mechanism of the fault slip at different fault locations. According to the variations in the normal stress and shear stress during the period of mining the panel through the fault, the mechanism of the fault slip can be divided into three categories. I: The normal stress and shear stress decrease abruptly, but the reduction of the normal stress is greater than that of the shear stress. This situation only occurs in a fault close to the position of the goaf. II: The normal stress is continuously reduced, the shear strength of the fault is decreased, and the shear stress is suddenly increased, causing the shear stress to be greater than the shear strength of the fault. This situation is the most common and mainly occurs in a roof fault when the panel is mined through the fault from the footwall and in a floor fault when the panel is mined through the fault from the hanging wall. III: Both the normal stress and the shear stress increase, but the increase of the shear stress is greater than that of the normal stress. This situation is rare and occurs only in a small part of a roof fault when the panel is mined through the fault from the hanging wall.
The roof structure is different when mining the panel through a fault from different directions. When the panel is mined through a fault from the footwall, the roof rock block easily slips with the fault, and the roof rock block is not easy to balance. When the panel is mined through a fault from the hanging wall, the roof block easily forms a stable structure. Therefore, when the panel is mined through the fault from the hanging wall, the occurrence of a fault-slip disaster can be reduced. These research results can be used as a reference for the prediction and prevention of disaster accidents caused by fault-slips under similar mining conditions, and the layout of the panel near the fault can be optimized. In addition, according to the research results of this paper, we discuss the control technology of the impact pressure induced by fault slip, which can ensure the safe production of mines with dense fault distributions, the increase of coal production and a secure energy supply.
Author Contributions
Methodology, P.K., L.J.; software, P.K.; validation, J.S., L.W.; investigation, P.K., L.J.; resources, L.J.; data curation, J.S., L.W.; Writing—Original Draft preparation, P.K.; Writing—Review and Editing, L.J.; visualization, P.K., J.S., L.W.; funding acquisition, L.J.
Funding
The research for this study was sponsored by the National Natural Science Foundation of China (Grant No. 51704182, 51574155), the Natural Science Foundation of Shandong Province (ZR2017BEE050), This study is supported by Opening Foundation of Shandong Key Laboratory of Civil Engineering Disaster Prevention and Mitigation (CDPM2019KF08), and the Graduate Innovation Fund of Shandong University of Science and Technology (SDKDYC190344).
Conflicts of Interest
The authors declare no conflict of interest.
References
- Dudley, B. BP Statistical Review of World Energy 2017; British Petroleum Co.: London, UK, 2018. [Google Scholar]
- Wang, P.; Jiang, L.S.; Jiang, J.Q.; Zheng, P.Q.; Li, W. Strata behaviors and rock burst–inducing mechanism under the coupling effect of a hard, thick stratum and a normal fault. Int. J. Geomech. 2018, 18, 04017135. [Google Scholar] [CrossRef]
- Wang, P.; Jiang, L.; Li, X.; Qin, G.; Wang, E. Physical simulation of mining effect caused by a fault tectonic. Arab. J. Geosci. 2018, 11, 741. [Google Scholar] [CrossRef]
- Wu, Q.S.; Jiang, L.S.; Kong, P.; Wang, P.; Xu, C.W. Effects characteristics of fault pillar and its dip angle on mining-induced stress and energy distribution. J. Min. Safety Eng. 2018, 35, 709–716. [Google Scholar]
- Stewart, R.A.; Reimold, W.U.; Charlesworth, E.G.; Ortlepp, W.D. The nature of a deformation zone and fault rock related to a recent rockburst at western deep levels gold mine, witwatersrand basin, south africa. Tectonophysics 2001, 337, 173–190. [Google Scholar] [CrossRef]
- Cai, W. Fault Rockburst Induced by Static and Dynamic Loads Superposition and its Monitoring and Warning. Ph.D. Thesis, China University of Mining and Technology, Xuzhou, China, 2015. [Google Scholar]
- Ortlepp, W.D.; Stacey, T.R. Rockburst mechanisms in tunnels and shafts. Tunn. Undergr. Sp. Tech. 1994, 9, 59–65. [Google Scholar] [CrossRef]
- Hossein, H.; Felix, H.; Catherine, A.; Stefan, B. Migration-based microseismic event location in the schlema-alberoda mining area. Int. J. Rock Mech. Min. Sci. 2018, 110, 161–167. [Google Scholar]
- Potvin, Y.; Jarufe, J.; Wesseloo, J. Interpretation of seismic data and numerical modelling of fault reactivation at EI teniente, reservas Norte sector. Min. Technol. 2010, 1993, 175–181. [Google Scholar] [CrossRef]
- Pan, Y.S.; Wang, L.G.; Zhang, M.T.; Xu, B.Y. The theoretical and testing study of fault rockburst. Chin. J. Rock Mech. Eng. 1998, 17, 642–649. [Google Scholar]
- Song, Y.M.; Ma, S.P.; Yang, X.B.; Jiang, Y.D. Experimental investigation on instability transient process of fault rockburst. Chin. J. Rock Mech. Eng. 2011, 30, 812–817. [Google Scholar]
- Ji, H.G.; Ma, H.S.; Wang, J.A.; Zhang, Y.H.; Cao, H. Mining disturbance effect and mining arrangement analysis of near-fault mining in high tectonic stress region. Saf. Sci. 2012, 50, 649–654. [Google Scholar] [CrossRef]
- Jiang, L.; Wang, P.; Zheng, P.; Luan, H.; Zhang, C. Influence of Different Advancing Directions on Mining Effect Caused by a Fault. Adv. Civ. Eng. 2019, 2019, 1–10. [Google Scholar]
- Manouchehrian, A.; Cai, M. Numerical modeling of rockburst near fault zones in deep tunnels. Tunn. Undergr. Sp. Tech. 2018, 80, 164–180. [Google Scholar] [CrossRef]
- Shu, J.; Jiang, L.; Kong, P.; Wang, Q. Numerical Analysis of the Mechanical Behaviors of Various Jointed Rocks under Uniaxial Tension Loading. Appl. Sci. 2019, 9, 1824. [Google Scholar] [CrossRef]
- Wang, X.; Cai, M. Numerical modeling of seismic wave propagation and ground motion in underground mines. Tunn. Undergr. Sp. Tech. 2017, 68, 211–230. [Google Scholar] [CrossRef]
- White, B.G.; Whyatt, J.K. Role of fault slip on mechanisms of rock burst damage, Lucky Friday Mine, Idaho, USA. In Implementing Rock Engineering Knowledge, Proceedings of the 2nd Southern African Rock Engineering Symposium, Johannesburg, South Africa, 13–15 September 1999; National Institute for Occupational Safety and Health: Spokane, WA, USA, 1998. [Google Scholar]
- Sainoki, A.; Mitri, H.S. Influence of mining activities on the reactivation of a footwall fault. Arab. J. Geosci. 2017, 10, 99. [Google Scholar] [CrossRef]
- Jiao, Z.H.; Zhao, Y.X.; Jiang, Y.D.; Wang, H.; Lu, Z.G.; Wang, X.Z. Fault damage induced by mining and its sensitivity analysis of influencing factors. J. China Coal. Sci. 2017, 42 (Suppl. 1), 36–42. [Google Scholar]
- Jiang, L.; Wu, Q.S.; Wu, Q.L.; Wang, P.; Xue, Y.; Kong, P.; Gong, B. Fracture failure analysis of hard and thick key layer and its dynamic response characteristics. Eng. Fail. Anal. 2019, 98, 118–130. [Google Scholar] [CrossRef]
- Guo, W.Y.; Tan, Y.L.; Yu, F.H.; Zhao, T.B.; Hu, S.C.; Huang, D.M.; Qin, Z.W. Mechanical behavior of rock-coal-rock specimens with different coal thicknesses. Geomech. Eng. 2018, 15, 1017–1027. [Google Scholar]
- Jiang, B.Y.; Gu, S.T.; Wang, L.G.; Zhang, G.C.; Li, W.S. Strainburst process of marble in tunnel-excavation-induced stress path considering intermediate principal stress. J. Central South Univ. 2019, 26, 984–999. [Google Scholar] [CrossRef]
- Golsanami, N.; Sun, J.; Liu, Y.; Yan, W.; Chen, L.J.; Jiang, L.; Dong, H.; Zong, C.; Wang, H. Distinguishing fractures from matrix pores based on the practical application of rock physics inversion and NMR data: A case study from an unconventional coal reservoir in China. J. Nat. Gas Sci. Eng. 2019, 65, 145–167. [Google Scholar] [CrossRef]
- Wang, J.; Ning, J.G.; Qiu, P.Q.; Yang, S.; Shang, H.F. Microseismic monitoring and its precursory parameter of hard roof collapse in longwall faces: A case study. Geomech. Eng. 2019, 17, 375–383. [Google Scholar]
- Wang, J.; Ning, J.; Jiang, L.S.; Jiang, J.Q.; Bu, T.T. Structural characteristics of strata overlying of a fully mechanized longwall face: A. case study. J. S. Afr. Inst. Min. Metall. 2018, 118, 1195–1204. [Google Scholar] [CrossRef]
- Dou, L.M.; He, H.; He, J.; Wang, Z.Y. New method of rockburst risk assessment using relative stress concentration factor superposition. J. China Coal Soc. 2018, 43, 327–332. [Google Scholar]
- Jiang, L.; Kong, P.; Shu, J.; Fan, K. Numerical analysis of support designs based on a case study of a longwall entry. Rock Mech. Rock Eng. 2019. [Google Scholar] [CrossRef]
- Jaeger, J.C. Fundamentals of Rock Mechanics; Champman & Hall: London, UK, 1976. [Google Scholar]
- Hoek, E.; Brown, E.T. Practical estimates of rock mass strength. Int. J. Rock Mech. Min. Sci. 1997, 34, 1165–1186. [Google Scholar] [CrossRef]
- Kong, P.; Jiang, L.; Shu, J.; Sainoki, A.; Wang, Q. Effect of fracture heterogeneity on rock mass stability in a highly heterogeneous underground roadway. Rock Mech. Rock Eng. 2019. [Google Scholar] [CrossRef]
- Jiang, L.; Sainoki, A.; Mitri, H.S.; Ma, N.; Liu, H.; Hao, Z. Influence of fracture-induced weakening on coal mine gateroad stability. Int. J. Rock Mech. Min. Sci. 2016, 88, 307–317. [Google Scholar] [CrossRef]
- Itasca. FLAC3D-Fast Lagrangian Analysis of Continua; Itasca Consulting Group Inc.: Minneapolis, MN, USA, 2009. [Google Scholar]
- Brady, B.H.G.; Brown, E.T. Rock Mechanics: For Underground Mining; Chapman & Hall: London, UK, 1993. [Google Scholar]
- Sainoki, A.; Mitri, H.S. Simulating intense shock pulses due to asperities during fault-slip. J. Appl. Geophys. 2014, 103, 71–81. [Google Scholar] [CrossRef]
- Barton, N.; Choubey, V. The shear strength of rock joints in theory and practice. Rock Mechanics 1977, 10, 1–54. [Google Scholar] [CrossRef]
- Sainoki, A.; Mitri, H.S. Back analysis of fault-slip in burst prone environment. J. Appl. Geophys. 2016, 134, 159–171. [Google Scholar] [CrossRef]
Figure 1.
Typical geological column.
Figure 1.
Typical geological column.
Figure 2.
Layout of Panel 14310 in the Dongtan coal mine.
Figure 2.
Layout of Panel 14310 in the Dongtan coal mine.
Figure 3.
Distribution of microseismicity events during the period of mining the panel through the fault.
Figure 3.
Distribution of microseismicity events during the period of mining the panel through the fault.
Figure 4.
Daily energy and count of microseismicity events during the mining of the panel through the fault.
Figure 4.
Daily energy and count of microseismicity events during the mining of the panel through the fault.
Figure 5.
Numerical model.
Figure 5.
Numerical model.
Figure 6.
Mining stress and plastic zone distribution in different mining sequences. (a) mining the panel through the fault from the hanging wall; (b) mining the panel through the fault from the footwall.
Figure 6.
Mining stress and plastic zone distribution in different mining sequences. (a) mining the panel through the fault from the hanging wall; (b) mining the panel through the fault from the footwall.
Figure 7.
Evolution of the advance abutment stress when mining the panel through the fault from the footwall.
Figure 7.
Evolution of the advance abutment stress when mining the panel through the fault from the footwall.
Figure 8.
Evolution of the advance abutment stress when mining the panel through the fault from the hanging wall.
Figure 8.
Evolution of the advance abutment stress when mining the panel through the fault from the hanging wall.
Figure 9.
Shear displacement of the fault under different positions of the working face when the panel is mined through the fault from the footwall.
Figure 9.
Shear displacement of the fault under different positions of the working face when the panel is mined through the fault from the footwall.
Figure 10.
Shear displacement of the fault under different positions of the working face when the panel is mined through the fault from the hanging wall.
Figure 10.
Shear displacement of the fault under different positions of the working face when the panel is mined through the fault from the hanging wall.
Figure 11.
Stress distribution of the fault when the panel is mined through the fault from the footwall. (a) L =40 m; (b) L = 20 m; (c) L= 0 m; (d) L= −20 m.
Figure 11.
Stress distribution of the fault when the panel is mined through the fault from the footwall. (a) L =40 m; (b) L = 20 m; (c) L= 0 m; (d) L= −20 m.
Figure 12.
Stress distribution of the fault when the panel is mined through the fault from the hanging wall. (a) L = 40 m; (b) L = 20 m; (c) L= 0 m; (d) L= −20 m.
Figure 12.
Stress distribution of the fault when the panel is mined through the fault from the hanging wall. (a) L = 40 m; (b) L = 20 m; (c) L= 0 m; (d) L= −20 m.
Figure 13.
Measurement points of stress on the fault.
Figure 13.
Measurement points of stress on the fault.
Figure 14.
Evolution of the fault stress at different measuring points when the panel is mined through the fault from the footwall. (a) A-position fault; (b) B-position fault; (c) C-position fault; (d) D-position fault.
Figure 14.
Evolution of the fault stress at different measuring points when the panel is mined through the fault from the footwall. (a) A-position fault; (b) B-position fault; (c) C-position fault; (d) D-position fault.
Figure 15.
Evolution of the fault stress at different measuring points when the panel is mined through the fault from the hanging wall. (a) A-position fault; (b) B-position fault; (c) C-position fault; (d) D-position fault.
Figure 15.
Evolution of the fault stress at different measuring points when the panel is mined through the fault from the hanging wall. (a) A-position fault; (b) B-position fault; (c) C-position fault; (d) D-position fault.
Figure 16.
Caving and mechanical analysis of the roof under different mining directions. (a) mining the panel through the fault from the hanging wall; (b) and (c) mining the panel through the fault from the footwall.
Figure 16.
Caving and mechanical analysis of the roof under different mining directions. (a) mining the panel through the fault from the hanging wall; (b) and (c) mining the panel through the fault from the footwall.
Table 1.
Rock mass properties.
Table 1.
Rock mass properties.
| Lithology | Ei (GPa) | υ | C (MPa) | σt (MPa) | φ (deg.) | cr (MPa) | εp (%) |
|---|
| Sandstone | 10.5 | 0.22 | 3 | 0.62 | 34.5 | 0.6 | 0.01 |
| Siltstone | 6.7 | 0.24 | 2.1 | 0.37 | 31 | 0.42 | 0.01 |
| Mudstone | 2.9 | 0.28 | 1.2 | 0.2 | 29 | 0.24 | 0.01 |
| Coal | 1.1 | 0.34 | 0.9 | 0.12 | 26 | 0.18 | 0.01 |
© 2019 by the authors. Licensee MDPI, Basel, Switzerland. This article is an open access article distributed under the terms and conditions of the Creative Commons Attribution (CC BY) license (http://creativecommons.org/licenses/by/4.0/).


