Article

Investigation of Temperature Effect on Start-Up Operation from Anaerobic Digestion of Acidified Palm Oil Mill Effluent †

by
Muhammad Arif Fikri Hamzah
1,
Jamaliah Md Jahim
1,2,*,
Peer Mohamed Abdul
1,2 and
Ahmad Jaril Asis
3
1
Research Centre for Sustainable Process Technology (CESPRO), Faculty of Engineering and Built Environment, Universiti Kebangsaan Malaysia (UKM), Bangi 436000 UKM, Selangor, Malaysia
2
Chemical Engineering Program, Faculty of Engineering and Built Environment, Universiti Kebangsaan Malaysia (UKM), Bangi 436000 UKM, Selangor, Malaysia
3
Sime Darby Research Sdn Bhd, Lot 42700, Pulau Carey, Banting 42960, Selangor, Malaysia
*
Author to whom correspondence should be addressed.
This paper is an extended and revised article presented at the International Conference on Sustainable energy and Green Technology 2018 (SEGT 2018) on 11–14 December 2018 in Kuala Lumpur, Malaysia.
Energies 2019, 12(13), 2473; https://doi.org/10.3390/en12132473
Submission received: 23 April 2019 / Revised: 29 May 2019 / Accepted: 31 May 2019 / Published: 27 June 2019
(This article belongs to the Special Issue Biomass Processing for Biofuels, Bioenergy and Chemicals)

Abstract

:
Malaysia is one of the largest palm oil producers worldwide and its most abundant waste, palm oil mill effluent (POME), can be used as a feedstock to produce methane. Anaerobic digestion is ideal for treating POME in methane production due to its tolerance to high-strength chemical oxygen demand (COD). In this work, we compared the culture conditions during the start-up of anaerobic digestion of acidified POME between thermophilic (55 °C) and mesophilic (37 °C) temperatures. The pH of the digester was maintained throughout the experiment at 7.30 ± 0.2 in a working volume of 1000 mL. This study revealed that the thermophilic temperature stabilized faster on the 44th day compared to the 52nd day for the mesophilic temperature. Furthermore, the thermophilic temperature indicated higher biogas production at 0.60 L- CH 4 /L·d compared to the mesophilic temperature at 0.26 L- CH 4 /L·d. Results from this study were consistent with the COD removal of thermophilic temperature which was also higher than the mesophilic temperature.

1. Introduction

Malaysia is the main producer of palm oil in the world, with ~19.9 million tons of crude palm oil generated in 2017 [1]. However, palm oil mills create waste such as palm oil mill effluent (POME), which must be treated because it can pollute the environment. POME appears as brownish liquid, has high chemical oxygen demand (COD), and is usually discharged directly at high temperatures [2]. To solve this problem, anaerobic digestion is a method that can be used to treat organic wastes for the production of methane [3]. In the future, methane can potentially replace fossil fuel as a source of energy. Methane is an inexpensive fuel source that can be produced continuously, while fossil fuels will be depleted someday. Palm oil mills in Malaysia have generally used close tank in POME treatment to maximize methane collection. Until 2013, about 50% of palm oil mills still applied the pond system to treat POME without capturing methane gas [4] because a considerable amount of land is available in Malaysia [5]. The challenge in the construction of biogas plants is the high investment needed compared to the open pond system, because investors consider this project a high risk due to the utilization of POME as a new method of biogas production.
In theory, many parameters can affect anaerobic digestion. For example, operating temperature has a remarkable impact on methanogen reactions. High temperatures allow mixed microflora, including microorganisms responsible for the degradation of organic matter, to flourish and produce methane at a high rate. Generally, methanogens are active under two temperature categories: mesophilic (35–37 °C) and thermophilic (55–60 °C) [6]. Thermophilic digesters have higher biogas production and a faster biochemical reaction rate, whereas mesophilic digesters require lower input energy for operation [6,7]. Jeong et al. [8] compared the performance between mesophilic and thermophilic anaerobic reactors and reported that thermophilic reactors could produce 32.5% more biogas than mesophilic reactors at an organic loading rate (OLR) of 15 kg COD/ m 3 /d.
The start-up is the key to achieving successful anaerobic digestion [9]. The study of acclimatization includes monitoring the operational conditions and bacterial community involved in the production of methane [10]. The mixed culture must comprise a stable community between methanogenic and non-methanogenic bacteria to attain a stable digestion process. Methanogens need a long time to activate. Therefore, anaerobic digestion cannot begin with a high OLR during the early period of acclimatization [9] because methanogen growth will be disrupted, thereby affecting its performance. Typically, the period of acclimatization can be shortened by utilizing stepped-loading OLR to ensure that methanogens can grow efficiently with sufficient food. Anaerobic digestion of POME requires approximately 3 months for completion, to achieve high biogas production and efficient COD removal [9].
Running a larger system is more complicated than operating lab or pilot scales, due to the bigger number of aspects that require control. Overall, a common problem that happens in a large digester is when a sample is not mixed well and the reaction culminates in the lack of organic matters that can eventually inhibit methanogens [11]. Mixing properly in the digester is important to avoid the feed from being concentrated only in certain areas of the reactor. Low volatile suspended solid (VSS) reduction and COD removal occur due to poor mixing on the level of a large-scale operation, leading to low biogas production. For instance, Massé et al. [12] reported that an anaerobic bench-scale reactor (ABSR) with a 12 m 3 volume yielded higher COD removal (76.7% ± 4.3%) than 8 m 3 of its working volume counterpart (76.9 ± 4.2%). In addition, before constructing a large-scale biogas plant, its operating conditions must be verified first on a laboratory scale because optimization from small scale can reduce operating cost and allow multiple experiments to operate simultaneously. Factors that need to be considered in upscaling digesters include hydraulic retention time (HRT), OLR, mixing condition, and temperature [13].
To obtain successful anaerobic digestion, the effect of temperature must be fully understood. However, limited publications are available on the comparison of acclimatization between mesophilic and thermophilic conditions. By contrast, the focus has been only on the specific temperature condition during anaerobic digestion. For instance, Alrawi et al. [14] only investigated the start-up of methane production under mesophilic condition. Understanding the temperature effect on anaerobic digestion can improve its performance and productivity. Hence, this study aims to compare the performance between mesophilic and thermophilic conditions during the start-up period. The stability of digesters was monitored by analyzing parameters such as pH, total alkalinity, and volatile fatty acid (VFA). Any disturbance, especially the accumulation of VFA, during this period must be solved rapidly to prevent system failure.

2. Material and Methods

2.1. Seed Sludge and Substrate

The seed sludge was obtained from the anaerobic digestion pond located at Sime Darby palm oil mill in Tennamaram, Selangor, Malaysia. The seed sludge had pH and VSS of 7.25 and 10.5 g/L, respectively. This sludge was acclimatized by using acidified POME as the sole substrate. The acidified POME was collected from the effluent based on the previous study by Maarof et al. [2], wherein a biohydrogen fermenter was fed with raw POME. Table 1 summarizes the overall characteristics of the acidified POME. The acidified POME was characterized by its yellowish brown color and sour smell. Its VFA concentration was higher than that of raw POME, thereby allowing more degradation substrates to generate higher biogas production. It was stored in the chiller at 4 °C to reduce bacterial activity. Prior to feeding, it was heated in a water bath to maintain the temperature of the culture in the digester [15]. The volume of the acidified POME that fed into the digester was measured using a measuring cylinder, and was stirred homogeneously before feeding into the digester.

2.2. Experimental Set-Up and Digester Operation

In this experiment, anaerobic digestion was performed in Schott Duran bottles under sequencing batch mode with 1000 mL of working volume in mesophilic and thermophilic conditions. Figure 1 shows the experimental setup, which comprises Schott Duran bottles, a gas collector, and a water bath shaker (model SW22, 230 V/50e60 Hz). A rubber tubing was utilized for the purposes of liquid sampling and providing a pathway for the biogas to flow into the gas collector. Tubing inspection was performed daily to prevent any outside air from entering the bottle. The existing biogas in the gas collector was stored inside the acidified water (pH = 2.50 ± 0.5), as suggested by Ergüder et al. [16], to avoid dissolution into water. Prior to digestion, nitrogen gas was purged to allow the process to operate under anaerobic conditions. The bottles were then incubated in a separated water bath shaker with temperatures of 55 °C and 37 °C, and agitated at 80 rpm. Anaerobic digestion began with a HRT of 30 days and OLR ranged between 1.1–1.3 g COD/L·d by diluting the feed as done by Badiei et al. [17]. Feeding took place every two days. During each feeding, 7% of the medium was removed and replaced with the same volume of the new substrate. Liquid and gas samples were obtained prior to feeding and subjected to analysis. Mesophilic and thermophilic operations stopped upon reaching the steady state wherein biogas volume and volatile suspended solids (VSS) had less than 10% in variation.

2.3. Analytical Method

The liquid samples were subjected to pH, total alkalinity, and VSS analysis based on American Public Health Association (APHA) [18]. Total nitrogen in the acidified POME was determined using the method suggested by HACH. VFAs were analyzed via high-performance liquid chromatography (Agilent 1200, California, USA). The HPLC system was run with a REZEX ROA column (Phenomenex, USA) and operated at a fixed flow rate of 0.6 mL/min. The mobile phase used in the system was 5 mmol/L sulfuric acid. Furthermore, chemical oxygen demand was analyzed using the dichromate method operating with a COD analyzer (DR 2800, HACH). The biogas flow rate was measured at a specific time interval using Equation 1 [19]. The samples were collected and analyzed via gas chromatography (GC, model SRI 8600C, USA) by a helium ionization detector equipped with a thermal conductivity detector. The sample was injected into the GC at an oven temperature and pressure of 40 °C and 2.7 psi for 5 min. Helium gas, with a purity of 99.99%, was used as the carrier gas and set at a flow rate of 25 mL/min. The temperature was ramped at 30 °C per minute and maintained for 10 min once the temperature reached 220 °C. Liquid and gas samples were analyzed in triplicate.
V H , i =   V H , i 1 + C H , i ( V g , i V g , i 1 ) + V H ( C H , i C H , i 1 )
where V H , i = the cumulative methane gas volume (mL); V g , i = the cumulative biogas volume (mL); and C H , i = methane gas composition fraction and i denote at the current time, while i − 1 denote previous time interval.

3. Results and Discussion

3.1. Start-Up Experiments

Start-up duration is vital in anaerobic digestion for methanogens to adapt well in a new environment so that the duration of a start-up can be shortened and anaerobic digestion can be operated smoothly. Abd Nasir et al. [20] recommend that the experiment should start with a low OLR to avoid organic matter overload and enable rapid growth of methanogens in the new environment. In addition, the biomass could washout when functioning at a high OLR and disturb the start-up operation. Productive acclimatization was demonstrated by Abd Nasir et al. [20], wherein acclimatization was operated at low OLR (0.5 g COD/L·d) and successfully attained 3.59 L-CH4/d of biogas production. Moreover, Seadi et al. [21] reported that HRT should be long enough to ensure a remarkably higher rate of methanogen reproduction than the death rate so that methanogens could fully utilize the substrate. Methanogens differ from other microorganisms involved in anaerobic digestion because of their slower regeneration time, which takes approximately 5–16 days to reproduce [22]. Few hydrogenotrophic species such as Methanococcus maripaludis only take 2 hours to regenerate [23]. Thus, low OLR (1.1–1.3 g COD/L·d) was applied in this study to allow methanogens to grow effectively. As proof, both mesophilic and thermophilic digestions were positively tested and obtained satisfactory biogas production and COD removal at the end of the start-up period. Subsequently, the digesters also revealed that no VFA accumulation occurred during this period.

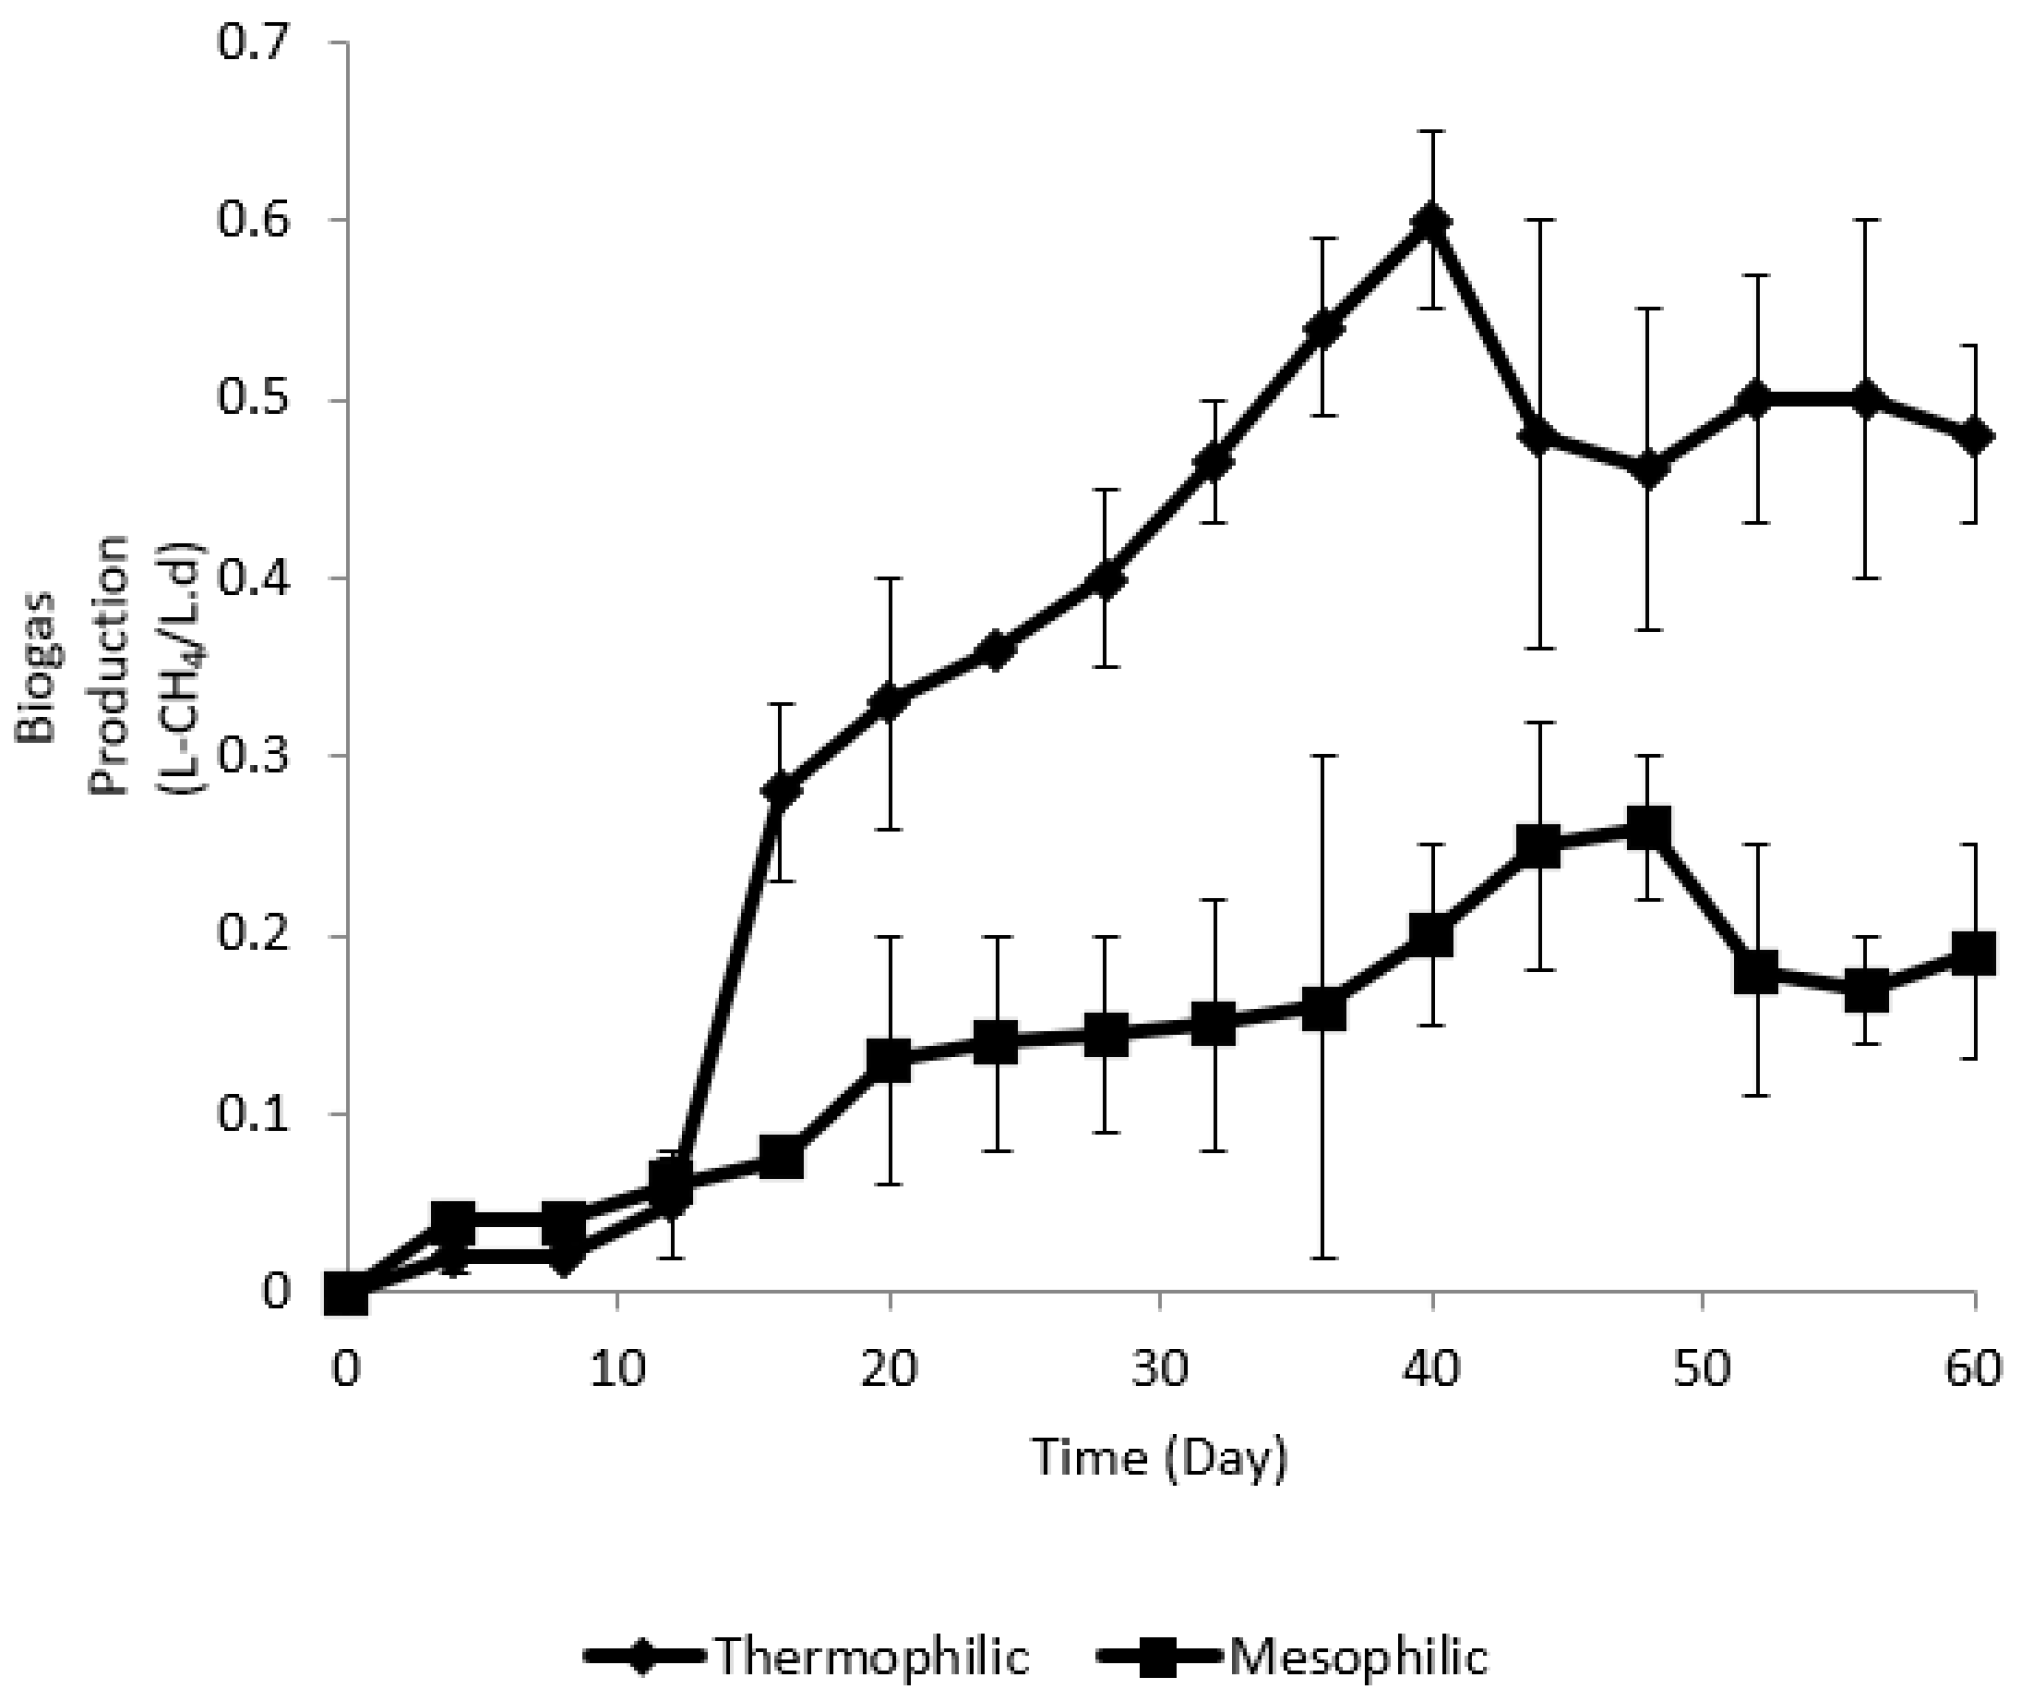
3.2. Biogas Productivity

The production profile of biogas expressed in L- CH 4 /L·d for both mesophilic and thermophilic conditions as illustrated in Figure 2 indicates that the biogas production increased from the initial anaerobic digestion until the biogas production stabilized at the end of the acclimatization period. Mesophilic and thermophilic trials had a significant increase after the 16th and 12th days, respectively, and corresponded to VSS, which also increased during the same period. Biogas production under thermophilic conditions increased from 0.05 L- CH 4 /L·d to 0.28 L- CH 4 /L·d. By contrast, the mesophilic digester increased from 0.08 L- CH 4 /L·d to 0.13 L- CH 4 /L·d. Wong et al. [24] reported that increased biogas production could be clarified by the methanogens that started to act in this period and began to consume VFAs to produce methane. This trend was consistent with the study by Yacob et al. [25] who proposed that increased biogas production during the start-up operation could be attributed to high microbial activity and stability in the system, thereby accelerating the breakdown rate. To achieve steady biogas production during the start-up period, anaerobic digestion should run under optimal conditions during hydrolysis, acidogenesis, acetogenesis, and methanogenesis phases [26]. Hence, monitoring operating conditions such as temperature, pH, and HRT is crucial to maintaining the system’s stability.
Biogas production under mesophilic and thermophilic conditions then began to decline by 20% and 30% on the 48th and 40th days, respectively. Both mesophilic and thermophilic conditions reached their peak (0.60 L- CH 4 /L·d and 0.26 L- CH 4 /L·d for thermophilic and mesophilic conditions, respectively) before biogas production started to decline. Alrawi et al. [14] demonstrated that decreased biogas production during acclimatization could be due to the low availability of organic matters to produce additional methane. Based on the experimental values, the result was corroborated by the low COD effluent in the final period of acclimatization in this study for both thermophilic and mesophilic conditions. Methanogens must be supplied with sufficient substrate to achieve stable biogas production because a low concentration of substrate will limit the performance and activity of methanogens.
At the end of the acclimatization period, thermophilic and mesophilic conditions registered stable biogas production with less than 10% variation as observed from the 44th and 52nd days onwards, respectively. The thermophilic digester recorded biogas production of 0.50 ± 0.04 L- CH 4 /L·d while the mesophilic one was 0.20 ± 0.08 L- CH 4 /L·d during the steady state. The results were consistent with the observation by Alrawi et al. [14], who stated that biogas production increased until substrate insufficiency became the limiting factor for methanogens to thrive. However, Alrawi et al. [14] reported only the mesophilic condition (37 °C) that took nearly 45 days to acclimatize completely. By contrast, the results from the present study showed that the mesophilic condition took a much longer time (52 days) to acclimatize compared to Alrawi et al.’s [14] study, which was 45 days due to the difference in operational conditions (OLR, HRT, and working volume) that may affect methanogens activity. OLR represents the organic matter inside the digester, while HRT influences the contact time between microorganism and feedstock. Feeding that occurs above sustainable OLR and HRT can upset the anaerobic digestion due to the production of inhibiting substances inside the digester that can disturb methanogen activity.
During the experiment, we observed that biogas production was 2.5 times higher under thermophilic condition than under mesophilic condition, wherein a larger difference of biogas production can be seen at the end of the start-up period, particularly on the 40th day. An underlying reason for this observation could the significant degradation rate of organic matters at high temperatures [6]. This can be enlightened by the high COD removal that allowed the degradation of more substrates into methane. High temperatures cause rapid reaction rates, leading to the removal of large amounts of organic matters.

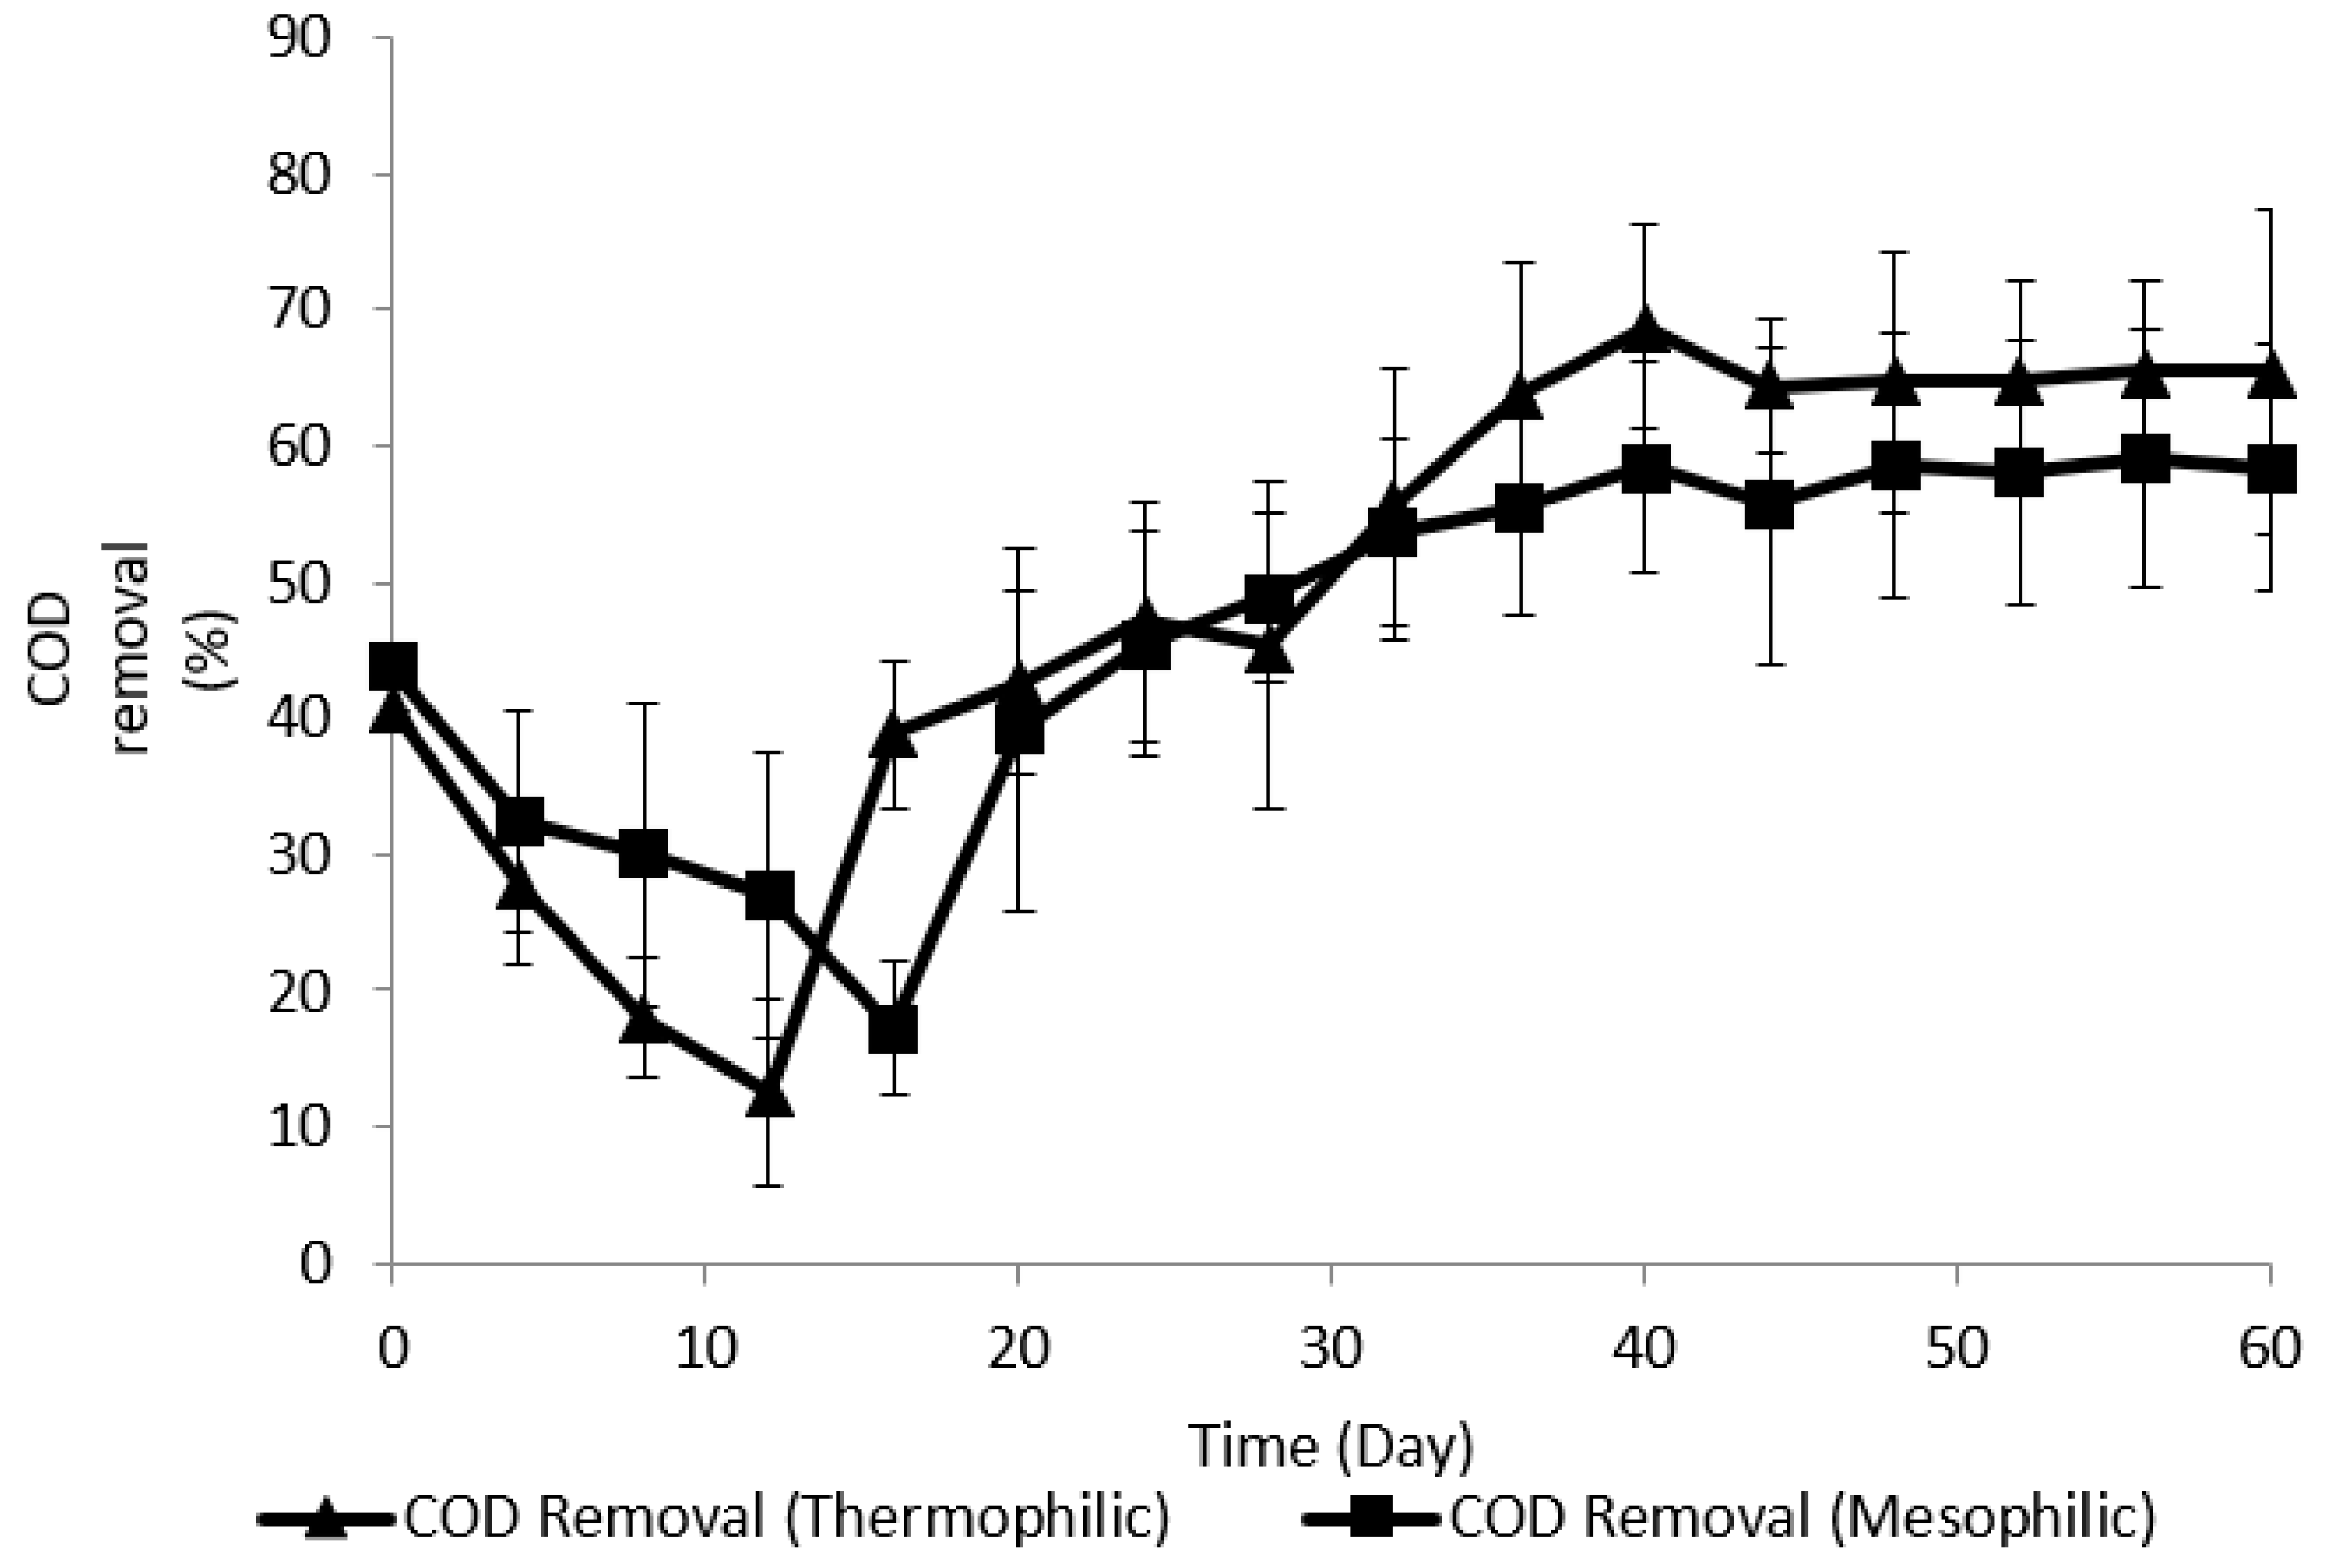
3.3. Substrate Removal

Yu et al. [27] indicated that COD removal could signify the amount of substrate converted to methane. High COD removal indicates the successful conversion of substrates into methane. Figure 3 outlines the variation of COD removal during the acclimatization period. In the early stage, COD removal under thermophilic and mesophilic conditions decreased: the former declined from 40.7% to 12.4% and the latter from 43.6% to 17.3%. This is due to the fact that methanogens did not appear to be active during this period as COD removal for both mesophilic and thermophilic conditions continued to decrease until the 12th and 16th days, respectively. Isik et al. [28] illustrated that the production rate of VFA was remarkably higher than the utilization of VFA to methane at the early stage of anaerobic digestion of methane, resulting in VFA accumulation. The excess VFA concentration retarded the anaerobic digestion and eventually increased the COD effluent. Methanogens were less active at an early stage of start-up and required some time before VFA consumption started. This statement was also supported by the elevation in VFA concentrations under mesophilic and thermophilic conditions in the same interval.
Subsequently, COD removal further increased from 12.4% to 38.8% and 17.3% to 39.2% on the 12th and 16th days onward under thermophilic and mesophilic conditions, respectively. It is believed that methanogens adapted to the new environment and started to consume the substrate that was proven by the reduction in VFA effluent. Once methanogens already adjusted to the new environment, they could effectively consume the feedstock, thereby increasing COD removal continuously. The period wherein microorganisms acclimatize to the new environment is known as lag phase [29]. A long lag phase is usually related to the substrate with high fiber content in feedstock [30]. In addition, pH values under thermophilic and mesophilic conditions increased on the 12th and 16th days, respectively, thereby reflecting the ongoing production of methane by the methanogens. Corroborative findings were reported by Wong et al. [24] and Teng et al. [31] based on their studies on the start-up operation. For Wong et al. [24], an increased of COD removal started on the 10th day, whereas for Teng et al. [31], it began to rise on the 21st day. COD removal in the study by Wong et al. [24], took a shorter time to increase, indicating that methanogens adapted earlier to the new environment.
At the end of anaerobic digestion, COD removal reached the steady state. COD removal of 64.5% ± 0.2% was registered under the thermophilic condition, whereas COD removal of 58.5% ± 0.1% was recorded under the mesophilic condition. The higher COD removal under the thermophilic condition suggested better methanogen activity compared to the mesophilic condition, thereby enabling the conversion of more substrates into methane. For biochemical reactions, increment in temperature tends to escalate the rate of degradation. According to the van’t Hoff equation, increasing the temperature by 10 °C doubles the reaction rate [32]. Similarly, this outcome is in agreement with Jeong et al. [8] who found that COD removal in the thermophilic digester was slightly higher than that in the mesophilic digester. Notably, the good result in COD removal also led to high biogas production in their study.

3.4. Variation of Volatile Suspended Solid and Total Suspended Solid

The results of VSS and total suspended solid (TSS) were plotted over time as shown in Figure 4. At the beginning of the experiment, VSS and TSS under thermophilic conditions decreased gradually with time. Mesophilic condition trends were also the same under the thermophilic condition. The VSS under mesophilic and thermophilic conditions decreased from 14.9 g/L to 12.0 g/L and from 16.7 g/L to 11.7 g/L, respectively, consistent with the results by Wong et al. [3] and Alrawi et al. [12], who stated that VSS declined because methanogens still attempted to adjust to the new environment before starting to grow. During this period, the methanogen colony was lower than the acidogenic bacteria that were responsible for the production of hydrogen, carbon dioxide, and organic acid [33]. Thus, a high concentration of acidogenic bacteria inhibited methanogen growth. The study by Wong et al. [24] experienced that VSS decreased from 34,190 mg/L to 8940 mg/L during the first 7 days of operation.
As can be observed in Figure 4, once anaerobic digestion reached the 40th day, VSS demonstrated a constant reading with less than 5% variation under thermophilic and mesophilic conditions, thereby indicating the final stage of the acclimatization period. Mesophilic and thermophilic digesters obtained VSS of 14.0 and 16.2 g/L before reaching the steady state, respectively. Teng et al. [31] found a similar trend of VSS during acclimatization, in which VSS decreased at the beginning of acclimatization before starting to increase. These results showed that VSS decreased by 21.5% after the 21st day of operation. The high concentration of VSS at the end of the anaerobic digestion was found by Teng et al. [31], indicating that good anaerobic digestion occurred. This result was also supported by high COD removal in a similar duration. Mesophilic and thermophilic conditions showed a VSS:TSS ratio up to 0.78 and 0.79, respectively. The VSS:TSS ratio is essential for determining the rate of degradation of suspended solids during anaerobic digestion. A high VSS:TSS ratio indicates a high degradation rate, while a low ratio represents minimal consumption of organic matters in the digester. Sperling et al. [34] propose that the VSS:TSS ratio should be typically between 0.70–0.85 during the anaerobic process.
Overall, higher VSS concentration was observed under the thermophilic condition with 11.1% difference compared to that under the mesophilic condition, indicating better methanogen performance. Microorganisms’ growth is dependent on aspects such as pH, temperature, and osmotic pressure. As anticipated, enzyme reaction was slow at low temperatures, thereby halting their activity. As the temperature increased, the chemical reaction also occurred at a higher rate and caused rapid cell growth. Similar to high biogas production in the thermophilic digester, high VSS concentration was compatible with the utilization of VFAs to produce methane. The same trend can be seen by Trisakti et al. [35] who claimed that mesophilic digestion obtained lower VSS in the system with a 10.3% difference compared to that in thermophilic digestion. The results in this study were consistent with those from Song et al. [36], such that low VSS associated with the mesophilic condition corresponded to high residual VFAs due to the low degradation rate.

3.5. Volatile Fatty Acids Production

Paritosh et al. [37] suggested that 65% of organic matter energy is in the form of VFA that can be converted into methane. Figure 5 shows that acetic acid, butyric acid, and propionic acid are three keys in VFAs that are responsible for methane production. The results were dominantly acetic acid (3493.9 ± 926 mg/L), followed by butyric acid (640.9 ± 277 mg/L), and propionic acid (446.6 ± 260 mg/L) in the mesophilic digester. The thermophilic digester also showed the same trend. The produced VFA was dependent on the pH change. Acetic acid and butyric acid were produced at low pH. On the other hand, high pH led to the production of propionic acid and acetic acid [38]. At an early start-up period, thermophilic and mesophilic conditions showed high VFA concentrations due to inactivity of the methanogen. Anaerobic digestion can be divided into four main phases (hydrolysis, acidogenesis, acetogenesis, and methanogenesis). During acidogenesis, fermentative bacteria are responsible for breaking down amino acids, fatty acids, and sugar into VFA. Therefore, high VFA concentrations were observed at this interval. Yacob et al. [25] also achieved a high VFA concentration at this period, and stated that VFAs accumulated from the initial start-up until they reached 970.0 mg/L as CH 3 COOH . The high concentration of VFAs was unsuitable for anaerobic digestion because it may lead to low pH that could hinder anaerobic digestion. Furthermore, washing out VSS in the system was another likely cause of VFA accumulation that can lead to acidification [39]. Washout inside the digester could be prevented by applying long enough HRT to retain methanogen inside the digester. Hence, HRT does not affect the microorganism’s growth limit. Given the increased of biogas production and COD removal with time, it was possible that the anaerobic digestion system could tolerate the concomitantly-produced VFAs. Further observation revealed that VFAs under thermophilic and mesophilic conditions subsequently started to decline as can be seen on the 12th and 16th days onward, thereby indicating the increase in methanogens and their consumption of VFAs. COD removal also began to increase simultaneously.
Moreover, it is noteworthy that the accumulation of the propionic acid could upset the biogas production as it culminated at a lower conversion rate of methane than acetic acid and butyric acid. It is known that low concentrations of propionic acid correlate with stable anaerobic digestion, whereas high concentrations of propionic acid are associated with digestion failure [40]. Work done by Demirul and Yanigun [41] recommends that propionic acid above 951.0 mg/L is not viable for anaerobic digestion. Propionic acid with a concentration of 2.0 g/L inhibited cellulose degradation, whereas a concentration of 4.0 g/L critically affected the degradation of glucose [42]. In this study, the concentration of propionic acid did not affect the system—446.6 ± 260 and 174.5 ± 180 mg/L under mesophilic and thermophilic conditions, respectively. The concentration of propionic acid must be controlled so that it does not inhibit the anaerobic digestion process.
The results display that the mesophilic condition yielded nearly twice more VFAs than its thermophilic counterpart. This result was supported by Kumar et al. [43] who discovered that VFAs in the mesophilic digester were 30% higher than those in the thermophilic digester. Consequently, a significant concentration of VFAs appeared to reduce biogas production and its stability due to the reduction in pH that can cause toxicity to anaerobic digestion. It is believed that the high concentration of VFAs under the mesophilic condition was due to the significantly lower conversion rate of VFA to methane than the VFA production. In this process, the low temperature resulted in the low reaction rate of methanogens to consume VFA.

3.6. Stability of The Digesters

The variation of pH over time for both thermophilic and mesophilic digestions is shown in Figure 6. At the early stage, thermophilic pH dropped from 7.33 to 6.70. Similarily, under the mesophilic condition, it declined from 7.40 to 6.60. Wong et al. [24] showed that in an early stage of anaerobic digestion (1st to 10th day), the pH decreased from 6.95 to 5.11 due to the prevalence of VFAs. Considerable amounts of VFA could upset the anaerobic digestion because they inhibit methanogenesis. A problem occurs when methanogens do not have sufficient time to remove organic acids, resulting in acid accumulation. Nevertheless, the anaerobic digestion system for both studies remained stable because of the high total alkalinity that acted as a buffer to neutralize the resultant VFAs. The reduction of pH at this interval did not critically affect the anaerobic digestion because biogas production continued to increase with time.
Later, pH of the mesophilic condition escalated on the 16th day while that of the thermophilic condition increased on the 12th day. Thermophilic pH increased from 6.70 to 6.75, whereas the mesophilic pH increased from 6.60 to 6.67. This indicates that the thermophilic digester took a shorter time for the methanogens to utilize the VFAs. This outcome could be clarified by the observation of lower VFAs and higher COD consumption within this duration. The consumption of VFAs by methanogens in the production of biogas likely contributed to the increased pH in the system. At the final stage of acclimatization, thermophilic and mesophilic pH only slightly fluctuated on the 36th and 48th days, respectively. Thus, anaerobic digestion reached a stable phase. Teng et al. [31] discovered a pH of 8.47 at the steady state, which was slightly similar to that of this study, thereby reflecting high COD removal efficiency. It is believed that the high COD removal represented the high removal of VFAs that could lead to a high resultant pH.
As shown in Figure 6, the range of pH for both digesters was close to the neutral condition’s pH. However, the recorded pH in the mesophilic digester was lower than that of the thermophilic digester with a 3.8% difference. The same observation was also illustrated by Labatut et al. [44] who stated that pH in the thermophilic condition was higher than that in mesophilic condition, corresponding to higher total alkalinity. Likewise, Kardos et al. [45] who studied sewage sludge revealed a higher pH (7.90 ± 0.6) in thermophilic digestion than in mesophilic digestion (7.60 ± 0.4) at the end of anaerobic digestion. Song et al. [36] proposed that the high thermophilic pH could result from the high degradation rate of nitrogenous compounds. Operating at high temperatures contributed to free ammonia formation. The production of free ammonia led to increased pH during anaerobic digestion. The authors reported a pH of 7.67 registered under the mesophilic digester, which was equivalent to 5.1% difference between mesophilic and thermophilic digesters.
It can be observed from this research that the final pH attained from mesophilic and thermophilic digestions was suitable for anaerobic digestion, in that it could yield satisfactory biogas production and COD removal. The results were consistent with findings obtained by Alrawi et al. [14] and Teng et al. [31], proving that methanogens were only active when pH was suitable for anaerobic digestion (7.35 ± 0.2) due to their sensitivity to pH changes. Non-ideal pH out of the neutral condition will impair biogas production. An excessively low pH is initiated by the accumulation of VFAs while an unreasonably high one will result in the production of additional ammonia, which is not conducive to the anaerobic process.

3.7. Total Alkalinity

Total alkalinity and VFA are two effective parameters that can be utilized for monitoring the progress of anaerobic digestion [46]. Total alkalinity acts as a pH buffer since it prevents rapid drastic changes in pH. Buffering capacity in the system is a result of bicarbonate ion that responsible for maintaining the pH between 6.50–7.60 [47]. Interestingly, the concentration of bicarbonate ion is dependent on the concentration of carbon dioxide in the gas phase. The reduction of total alkalinity can be an early sign of additional VFAs in the system, and for that reason the concentration of VFAs must be controlled to avoid anaerobic digestion failure. Based on Figure 7, the thermophilic condition exhibited a total alkalinity interval of 11,617 ± 4246 mg/L as CaCO 3 which was 15.5% higher than that under the mesophilic condition. Total alkalinity of thermophilic and mesophilic digesters increased from the beginning of the anaerobic digestion until the 48th day before stabilization started. Both pH and total alkalinity showed similar trends during the anaerobic digestion such that the increment of total alkalinity was followed by the increment of pH. Kugelman et al. [48] pointed out that high temperature could increase the breakdown of organic nitrogen into ammonium bicarbonate, which could eventually produce high total alkalinity. Girardi et al. [49] described that high total alkalinity was a result of successful VFA conversion into methane by methanogens. Total alkalinity and pH exhibited a strong correlation with VFAs. Since successful consumption of substrate will result in a low concentration of VFAs in the effluent, the pH and total alkalinity in the system will be high when the concentration of VFAs is low. In direct comparison, the total alkalinity in this study was lower than that in the study by Teng et al. [31], which was at 11,610 mg/L as CaCO 3 . Nevertheless, total alkalinity in this study still led to superior biogas production and achieved high COD removal as the VFAs were successfully balanced by total alkalinity in the system without resulting in VFA accumulation.

3.8. Overall Performance

Table 2 outlines the comparison of previous studies in the start-up period of anaerobic digestion of methane with POME as the substrate except that this study uses acidified POME. The use of acidified POME as feedstock for methane production has been explored by numerous researchers [20,50,51]. According to Krishnan et al. [52], acidified POME contains abundant acetogenic and methanogenic bacteria, which were beneficial for the acceleration of anaerobic digestion. Acidified POME was an outcome of hydrogen fermentation containing large energy that remained as VFAs. Thus, further digestion of this effluent allowed the maximum recovery of energy from VFAs [51]. Moreover, it can be clearly seen from the study conducted by Alrawi et al. [14], who deployed the highest OLR (3.4 g COD/L·d) and also the shortest HRT (20 days). The selection of OLR is vital for determining the stability of anaerobic digestion. Operating at excessively high OLR can cause overloading of organic matter inside the digester and eventually lead to anaerobic digestion failure. Meanwhile, the OLR used by Alrawi et al. [14] was nearly three times higher than that in current study (1.2 g COD/L·d). Compared to this study, the low OLR resulted in low methane production due to the insufficient substrate for the methanogens to produce additional methane. In this case, the lack of substrate became a limiting factor affecting methanogen growth. However, the production rate can still be enhanced by increasing OLR gradually so that additional substrate can be used to improve methane production. Increasing OLR slowly into the digester is crucial since methanogens require time to consume the substrate. Furthermore, it is can be noticed that despite operating at different HRT and OLR levels, the pH values of all studies were in a suitable range for methanogen growth (7.35 ± 0.2). The near-neutral pH value indicated that no accumulation of VFA occurred during digestion. The build-up of VFAs can upset anaerobic digestion because it leads to the reduction of pH and lowers biogas production. The pH obtained was the highest at 7.30 achieved by Alrawi et al. [14] and Teng et al. [31] indicating a better conversion of organic matter into methane compared to this study. As mentioned previously, high total alkalinity significantly influences pH. The high pH achieved by Teng et al. [31] corresponded to the highest total alkalinity among the studies. It was found that the results of the present study obtained higher VFA concentration in the mesophilic condition than in thermophilic condition but negatively affected anaerobic digestion as proven by the satisfactory methane production rate. Nevertheless, the high concentration of VFA resulted in low total alkalinity and pH in the mesophilic digester.

3.9. Statistical Analysis

Table 3 depicts the t-test results for biogas production under mesophilic and thermophilic conditions by using IBM SPSS Statistics 23 and p < 0.05 was considered significant. The analysis was carried out to determine whether the difference in temperatures (mesophilic and thermophilic) had a significant effect on biogas production during the acclimatization period. Biogas productivity is a beneficial indicator for determining the performance of the anaerobic digestion process. High biogas productivity indicated that anaerobic digestion had been operated successfully under optimum conditions. Based on the results, significance (2-tailed) was at 0.001. The obtained value was below 0.05, thereby indicating that a statistically significant difference exists between mesophilic and thermophilic conditions in biogas production. On the basis of the table, the thermophilic digester (0.34 L- CH 4 /L·d) successfully produced more than twice the amount of biogas than the mesophilic digester (0.14 L- CH 4 /L·d). This result verified that high thermophilic COD removal resulted in low effluent VFAs.

4. Conclusions

In the current study, we evaluated the significance of understanding the operation monitoring and acclimatization behavior during the anaerobic digestion of methane. Overall, the thermophilic digester obtained better biogas production than the mesophilic digester, with a difference of approximately 50% and required much shorter time to reach steady state during acclimatization compared to the mesophilic digester on the 44th day for the former and the 52nd day for the latter. High temperatures allowed enlarged substrate consumption, which was validated by high COD removal under the thermophilic condition. It is often assumed that the high biomass concentration under the thermophilic condition indicates good methanogenic activity to allow significant biogas production. This study emphasizes the role of VFAs and total alkalinity in monitoring the stability of the anaerobic digestion process. Total alkalinity in the system must be balanced with VFA concentration to avoid the accumulation of VFA inside the digester, which could upset the anaerobic digestion performance. In this study, the high concentration of VFAs under mesophilic and thermophilic conditions (4581.437 and 2765.106 mg/L as CH 3 COOH , respectively) were well balanced with the total alkalinity of the system. As a result, no significant decrease in pH was observed in the experiment. Precautionary steps must be considered to avoid failure of the digestion process such as maintaining pH at neutrality during feeding for effective methanogen growth. In conclusion, acclimatization must be operated under thermophilic conditions to reach the steady state in a shorter amount of time and achieve higher biogas productivity compared to mesophilic conditions. This paper demonstrates that the production of biogas inside the thermophilic digester is almost twice that of the mesophilic digester, thereby justifying the operation at a larger scale. Moreover, the operation of thermophilic digestion was more stable than that of mesophilic digestion because it resulted in lower amounts of VFA. Commonly, raw POME was discharged at high temperatures. In practical applications, operating under thermophilic conditions eliminated the necessity for a cooling pond prior to feeding in the anaerobic digester.

Author Contributions

Conceptualization, J.M.J.; Methodology, J.M.J. and P.M.A.; Software, M.A.F.H. and P.M.A.; Validation, J.M.J. and P.M.A.; Formal Analysis, M.A.F.H., J.M.J. and P.M.A.; Investigation, M.A.F.H.; Resources, J.M.J. and P.M.A.; Data Curation, M.A.F.H. and J.M.J.; Writing-Original Draft Preparation, M.A.F.H.; Writing-Review & Editing, M.A.F.H., J.M.J. and P.M.A.; Visualization, J.M.J. and A.J.A.; Supervision, J.M.J. and P.M.A.; Project Administration, J.M.J. and A.J.A.; Funding Acquisition, J.M.J.

Acknowledgments

We gratefully acknowledge the financial and technical support provided by the Universiti Kebangsaan Malaysia-Yayasan Sime Darby (UKM-YSD) Chair for Sustainable Development: Zero Waste Technology. We would also like to extend our gratitude to the Government of Malaysia and Universiti Kebangsaan Malaysia for funding this work through KK-2015-002.

Conflicts of Interest

The authors declare no conflict of interest.

References

  1. Production of Crude Palm Oil for the Month of January–December 2016 & 2017. 2018. Available online: http://bepi.mpob.gov.my/index.php/en/statistics/production/177-production-2017/792-production-of-crude-oil-palm-2017.html (accessed on 30 October 2018).
  2. Maaroff, R.M.; Md Jahim, J.; Azahar, A.M.; Abdul, P.M.; Masdar, M.S.; Nordin, D.; Abd Nasir, M.A. Biohydrogen production from palm oil mill effluent (POME) by two stage anaerobic sequencing batch reactor (ASBR) system for better utilization of carbon sources in POME. Int. J. Hydrogen Energy 2018, 44, 3395–3406. [Google Scholar] [CrossRef]
  3. Hanum, F.; Yuan, L.C.; Kamahara, H.; Aziz, H.A.; Atsuta, Y.; Yamada, T.; Daimon, H. Treatment of sewage sludge using anaerobic digestion in Malaysia: Current state and challenges. Front. Energy Res. 2019, 7. [Google Scholar] [CrossRef]
  4. Chin, M.J.; Poh, P.E.; Tey, B.T.; Chan, E.S.; Chin, K.L. Biogas from palm oil mill effluent (POME): Opportunities and challenges from Malaysia’s perspective. Renew. Sustain. Energy Rev. 2013, 26, 717–726. [Google Scholar] [CrossRef]
  5. Wu, T.Y.; Mohammad, A.W.; Jahim, J.M.; Anuar, N. Pollution control technologies for the treatment of palm oil mill effluent (POME) through end-of-pipe processes. J. Environ. Manag. 2010, 91, 1467–1490. [Google Scholar] [CrossRef] [PubMed]
  6. Gebreeyessus, G.; Jenicek, P. Thermophilic versus mesophilic anaerobic digestion of sewage sludge: A comparative review. Bioengineering 2016, 3, 15. [Google Scholar] [CrossRef]
  7. İnce, E.; İnce, M.; Önkal Engin, G. Comparison of thermophilic and mesophilic anaerobic treatment for potato processing wastewater using a contact reactor. Glob. NEST J. 2017, 19, 318–326. [Google Scholar]
  8. Jeong, J.-Y.; Son, S.-M.; Pyon, J.-H.; Park, J.-Y. Performance comparison between mesophilic and thermophilic anaerobic reactors for treatment of palm oil mill effluent. Bioresour. Technol. 2014, 165, 122–128. [Google Scholar] [CrossRef]
  9. Sulaiman, A.; Tabatabaei, M.; Yusoff, M.Z.M.; Ibrahim, M.F.; Hassan, M.A.; Shirai, Y. Accelerated start-up of a semi-commercial digester tank treating palm oil mill effluent with sludge seeding for methane production. World Appl. Sci. J. 2010, 8, 247–258. [Google Scholar]
  10. Burak, D.; Orhan, Y. Changes in microbial ecology in an anaerobic reactor. Bioresour. Technol. 2006, 97, 1201–1208. [Google Scholar] [CrossRef]
  11. Hansen, T.L.; Schmidt, J.E.; Angelidaki, I.; Marca, E.; Jansen, J.C.; Mosbæk, H.; Christensen, T.H. Measurement of methane potentials of solid organic waste. Waste Manag. 2004, 24, 393–400. [Google Scholar] [CrossRef]
  12. Massé, D.I.; Croteau, F.; Masse, L.; Danesh, S. The effect of scale-up on the digestion of swine manure slurry in psychrophilic anaerobic sequencing batch reactors. Trans. ASAE 2004, 47, 1367–1373. [Google Scholar] [CrossRef]
  13. Mir, M.A.; Hussain, A.; Verma, C. Design considerations and operational performance of anaerobic digester: A review. Cogent Eng. 2016, 3. [Google Scholar] [CrossRef]
  14. Alrawi, R.A.; Ahmad, A.; Norli, I.; Mohd Omar, A.K. Methane production during start-up phase of mesophilic semi-continues suspended growth anaerobic digester. Int. J. Chem. React. Eng. 2010, 8. [Google Scholar] [CrossRef]
  15. Sidik, U.; Razali, F.; Alwi, S.; Maigari, F. Biogas production through co-digestion of palm oil mill effluent with cow manure. Niger. J. Basic Appl. Sci. 2013, 21, 79–84. [Google Scholar] [CrossRef]
  16. Ergüder, T.; Tezel, U.; Güven, E.; Demirer, G. Anaerobic biotransformation and methane generation potential of cheese whey in batch and UASB reactors. Waste Manag. 2001, 21, 643–650. [Google Scholar] [CrossRef]
  17. Badiei, M.; Jahim, J.M.; Anuar, N.; Sheikh Abdullah, S.R. Effect of hydraulic retention time on biohydrogen production from palm oil mill effluent in anaerobic sequencing batch reactor. Int. J. Hydrogen Energy 2011, 36, 5912–5919. [Google Scholar] [CrossRef]
  18. APHA. Standard Methods for the Examination of Water and Wastewater; American Public Health Association: Washington, DC, USA; New York, NY, USA, 2005. [Google Scholar]
  19. Logan, B.E.; Oh, S.-E.; Kim, I.S.; Van Ginkel, S. Biological hydrogen production measured in batch anaerobic respirometers. Environ. Sci. Technol. 2002, 36, 2530–2535. [Google Scholar] [CrossRef]
  20. Abd Nasir, M.A.; Jahim, J.M.; Abdul, P.M.; Silvamany, H.; Maaroff, R.M.; Mohammed Yunus, M.F. The use of acidified palm oil mill effluent for thermophilic biomethane production by changing the hydraulic retention time in anaerobic sequencing batch reactor. Int. J. Hydrogen Energy 2018. [Google Scholar] [CrossRef]
  21. Seadi, T.A.; Rutz, D.; Prassl, H.; Kottner, M.; Finsterwalder, T.; Volk, S.; Janssen, R. Biogas Handbook; University of Southern Denmark: Esbjerg, Denmark, 2008. [Google Scholar]
  22. Meegoda, J.; Li, B.; Patel, K.; Wang, L. A review of the processes, parameters, and optimization of anaerobic digestion. Int. J. Environ. Res. Public Health 2018, 15, 2224. [Google Scholar] [CrossRef]
  23. Richards, M.A.; Lie, T.J.; Zhang, J.; Ragsdale, S.W.; Leigh, J.A.; Price, N.D. Exploring hydrogenotrophic. methanogenesis: A genome scale metabolic reconstruction of Methanococcus maripaludis. J. Bacteriol. 2016, 198, 3379–3390. [Google Scholar] [CrossRef]
  24. Wong, Y.S.; Ong, S.A.; Lim, K.K.; Lee, H.C. Acclimatization and performance study of acidogenesis anaerobic degradation process for palm oil mill effluent. In Proceedings of the 2011 International Conference on Environment and Industrial Innovation (IPCBEE), Singapore, 26–28 February 2011. [Google Scholar]
  25. Yacob, S.; Shirai, Y.; Hassan, M.A.; Wakisaka, M.; Subash, S. Start-up operation of semi-commercial closed anaerobic digester for palm oil mill effluent treatment. Process. Biochem. 2006, 41, 962–964. [Google Scholar] [CrossRef]
  26. Enzmann, F.; Mayer, F.; Rother, M.; Holtmann, D. Methanogens: Biochemical background and biotechnological applications. AMB Express 2018, 8. [Google Scholar] [CrossRef] [PubMed]
  27. Yu, H.-Q.; Fang, H.H.; Gu, G.-W. Comparative performance of mesophilic and thermophilic acidogenic upflow reactors. Process. Biochem. 2002, 38, 447–454. [Google Scholar] [CrossRef]
  28. Işik, M.; Sponza, D.T. Substrate removal kinetics in an upflow anaerobic sludge blanket reactor decolorising simulated textile wastewater. Process. Biochem. 2005, 40, 1189–1198. [Google Scholar] [CrossRef]
  29. Echiegu, E.A. Kinetic Models for Anaerobic Fermentation Processes—A Review. Am. J. Biochem. Biotechnol. 2015, 11, 132–148. [Google Scholar] [CrossRef]
  30. Nielfa, A.; Cano, R.; Fdz-Polanco, M. Theoretical methane production generated by the co-digestion of organic fraction municipal solid waste and biological sludge. Biotechnol. Rep. 2015, 5, 14–21. [Google Scholar] [CrossRef] [PubMed]
  31. Teng, T.T.; Wong, Y.-S.; Ong, S.-A.; Norhashimah, M.; Rafatullah, M. Start-up operation of anaerobic degradation process for palm oil mill effluent in anaerobic bench scale reactor (ABSR). Procedia Environ. Sci. 2013, 18, 442–450. [Google Scholar] [CrossRef]
  32. Switzenbaum, M.S.; Jewell, W.J. Anaerobic attached film expanded bed reactor treatment. J. Water Poll. Control. Fed. 1980, 52, 1953–1965. [Google Scholar]
  33. Idris, N.; Lutpi, N.A.; Wong, Y.S.; Izhar, T.N.T. Acclimatization study for biohydrogen production from palm oil mill effluent (pome) in continuous-flow system. E3S Web Conf. 2018, 34, 2054. [Google Scholar] [CrossRef]
  34. Sperling, M.V. Activated Sludge and Aerobic Biofilm Reactors; IWA Publishing: London, UK, 2007. [Google Scholar]
  35. Trisakti, B.; Manalu, V.; Taslim, I.; Turmuzi, M. Acidogenesis of palm oil mill effluent to produce biogas: Effect of hydraulic retention time and pH. Procedia Soc. Behav. Sci. 2015, 195, 2466–2474. [Google Scholar] [CrossRef]
  36. Song, Y.-C.; Kwon, S.-J.; Woo, J.-H. Mesophilic and thermophilic temperature co-phase anaerobic digestion compared with single-stage mesophilic- and thermophilic digestion of sewage sludge. Water Res. 2004, 38, 1653–1662. [Google Scholar] [CrossRef] [PubMed]
  37. Paritosh, K.; Kushwaha, S.K.; Yadav, M.; Pareek, N.; Chawade, A.; Vivekanand, V. Food waste to energy: An overview of sustainable approaches for food waste management and nutrient recycling. Biomed. Res. Int. 2017, 1–19. [Google Scholar] [CrossRef] [PubMed]
  38. Rabii, A.; Aldin, S.; Dahman, Y.; Elbeshbishy, E. A review on anaerobic co-digestion with a focus on the microbial populations and the effect of multi-stage digester configuration. Energies 2019, 12, 1106. [Google Scholar] [CrossRef]
  39. Diamantis, V.; Aivasidis, A. Performance of an ECSB reactor for high-rate anaerobic treatment of cheese industry wastewater: Effect of pre-acidification on process efficiency and calcium precipitation. Water Sci. Technol. 2018, 78, 1893–1900. [Google Scholar] [CrossRef] [PubMed]
  40. Bonk, F.; Popp, D.; Weinrich, S.; Sträuber, H.; Kleinsteuber, S.; Harms, H.; Centler, F. Ammonia inhibition of anaerobic volatile fatty acid degrading microbial communities. Front. Microbiol. 2018, 9. [Google Scholar] [CrossRef] [PubMed]
  41. Demirel, B.; Yenigün, O. Two-phase anaerobic digestion processes: A review. J. Chem. Technol. Biotechnol. 2002, 77, 743–755. [Google Scholar] [CrossRef]
  42. Siegert, I.; Banks, C. The effect of volatile fatty acid additions on the anaerobic digestion of cellulose and glucose in batch reactors. Process. Biochem. 2005, 40, 3412–3418. [Google Scholar] [CrossRef]
  43. Kumar, G.; Sivagurunathan, P.; Park, J.-H.; Kim, S.-H. Anaerobic digestion of food waste to methane at various organic loading rates (OLRs) and hydraulic retention times (HRTs): Thermophilic vs. mesophilic regimes. J. Environ. Eng. 2016, 21, 69–73. [Google Scholar] [CrossRef] [Green Version]
  44. Labatut, R.A.; Angenent, L.T.; Scott, N.R. Conventional mesophilic vs. thermophilic anaerobic digestion: A trade-off between performance and stability? Water Res. 2014, 53, 249–258. [Google Scholar] [CrossRef]
  45. Kardos, L.; Juhász, A.; Palkó, G.Y.; Oláh, J.; Barkács, J.; Záray, G.Y. Comparing of mesophilic and thermophilic anaerobic fermented sewage sludge based on chemical and biochemical tests. Appl. Ecol. Environ. Res. 2011, 9, 293–302. [Google Scholar] [CrossRef]
  46. Raposo, F.; Borja, R.; Martín, M.A.; de la Rubia, M.A.; Rincón, B. Influence of inoculum–substrate ratio on the anaerobic digestion of sunflower oil cake in batch mode: Process stability and kinetic evaluation. Chem. Eng. J. 2009, 149, 70–77. [Google Scholar] [CrossRef]
  47. Labatut, R.A.; Gooch, C.A. Monitoring of anaerobic digestion process to optimize performance and prevent system failure. Proceeding Got Manure Enhancing Environment. Econ. Sustain. 2012, 14, 209–225. [Google Scholar]
  48. Kugelman, I.J.; Guida, V.G. Comparative Evaluation of Mesophilic and Thermophilic Anaerobic Digestion: Phase II—Steady State Studies; National Service Centre for Environmental Publication: Cincinnati, OH, USA, 1989.
  49. Girardi, G.; Berman, J.; Redecha, P.; Spruce, L.; Thurman, J.M.; Kraus, D.; Hollmann, T.J.; Casali, P.; Caroll, M.C.; Wetsel, R.A.; et al. Complement C5a receptors and neutrophils mediate fetal injury in the antiphospholipid syndrome. J. Clin. Investig. 2003, 112, 54. [Google Scholar] [CrossRef]
  50. Mamimin, C.; Prasertsan, P.; Kongjan, P.; O-Thong, S. Effects of volatile fatty acids in biohydrogen effluent on biohythane production from palm oil mill effluent under thermophilic condition. Electron. J. Biotechnol. 2017, 29, 78–85. [Google Scholar] [CrossRef]
  51. Hans, M.; Kumar, S. Biohythane production in two-stage anaerobic digestion system. Int. J. Hydrogen Energy 2018. [Google Scholar] [CrossRef]
  52. Krishnan, S.; Singh, L.; Sakinah, M.; Thakur, S.; Wahid, Z.A.; Sohaili, J. Effect of organic loading rate on hydrogen (H2) and methane (CH4) production in two-stage fermentation under thermophilic conditions using palm oil mill effluent (POME). Energy Sustain. Dev. 2016, 34, 130–138. [Google Scholar] [CrossRef]
Figure 1. Schematic diagram of the anaerobic digestion process.
Energies 12 02473 g001
Figure 2. The range of biogas volume for thermophilic and mesophilic conditions during the acclimatization period. Notes: error bars show standard deviation of means (n = 3).
Energies 12 02473 g002
Figure 3. The range of COD removal for thermophilic and mesophilic effluents during the acclimatization period. Notes: error bars show standard deviation of means (n = 3).
Energies 12 02473 g003
Figure 4. The range of VSS and TSS for thermophilic and mesophilic conditions during the acclimatization period. Notes: error bars show standard deviation of means (n = 3).
Energies 12 02473 g004
Figure 5. The range of volatile fatty acid of thermophilic and mesophilic effluents during the acclimatization period.
Energies 12 02473 g005
Figure 6. pH range of thermophilic and mesophilic effluents during the acclimatization period. Notes: error bars show standard deviation of means (n = 3).
Energies 12 02473 g006
Figure 7. The range of total alkalinity for thermophilic and mesophilic effluents during the acclimatization period. Notes: error bars show standard deviation of means (n = 3).
Energies 12 02473 g007
Table 1. Characteristic of substrate.
ID.ParameterConcentration Range
Acidified POMERaw POME [2]
1pH5.14 ± 0.15.90 ± 0.2
2Chemical oxygen demand (g/L)44.3 ± 3.750.1 ± 1.4
3Total solid (g/L)31.2 ± 2.361.5 ± 1.5
4Total suspended solid (g/L)24.1 ± 4.442.3 ± 1.1
5Volatile suspended solid (g/L)20.4 ± 2.939.5 ± 1.3
6Volatile fatty acid (mg/L as CH 3 COOH )6383.5 ± 1348.34600.0 ± 1300.0
7Total nitrogen (mg/L)254 ± 27N/D
Table 2. Comparison of previous studies on acclimatization anaerobic digestion of methane from palm oil mill effluent.
IDParameter[31][14]Present Study
1SubstratePalm oil mill effluentPalm oil mill effluentAcidified palm oil mill effluent
2Hydraulic retention time (days) & Organic loading rate (g COD/L·d )Hydraulic retention time = 40
Organic loading rate = 1.4
Hydraulic retention time = 20
Organic loading rate = 3.4
Hydraulic retention time = 30
Organic loading rate = 1.22
3pHMesophilic (7.30)Mesophilic (7.30)Mesophilic (7.00)Thermophilic (7.20)
4Total alkalinity (mg/L as CaCO 3 )Mesophilic (11,610)N/D Mesophilic (7792)Thermophilic (9540)
5Volatile fatty acid (mg/L as CH 3 COOH )N/DN/DMesophilic (4360.3)Thermophilic (2714.2)
6Chemical oxygen demand effluent (g/L)Mesophilic (14.4)Mesophilic (47.5)Mesophilic (15.2)Thermophilic (14.3)
7Production rate (L- CH 4 /L·d)N/DN/DMesophilic (0.14)Thermophilic (0.34)
Table 3. Summary of t-test for the measured biogas production between mesophilic and thermophilic conditions.
Independent Samples TestLevene’s Test for Equality of Variancest-Test for Equality of Means
FSig.tdfsig. (2-tailed)Mean Difference
ProductivityEqual Variances Assumed13.9200.0013.745300.0010.206
Equal variances not assumed 3.745190.0010.206
Group Statistics
ConditionNMeanStd DeviationStd Error Mean
ProductivityThermophilic160.340.210.05
Mesophilic160.140.080.02

