Article

Biogas Potential from the Anaerobic Digestion of Potato Peels: Process Performance and Kinetics Evaluation

1
Faculty of Science and Engineering, University of Groningen, 9747 AG Groningen, The Netherlands
2
Union of Agricultural Co-operatives of Monofatsi, Heraklion 700 16 Crete, Greece
*
Author to whom correspondence should be addressed.
Energies 2019, 12(12), 2311; https://doi.org/10.3390/en12122311
Submission received: 17 May 2019 / Revised: 10 June 2019 / Accepted: 11 June 2019 / Published: 17 June 2019
(This article belongs to the Special Issue Biomass Processing for Biofuels, Bioenergy and Chemicals)

Abstract

:
This article intends to promote the usage of potato peels as efficient substrate for the anaerobic digestion process for energy recovery and waste abatement. This study examined the performance of anaerobic digestion of potato peels in different inoculum-to-substrate ratios. In addition, the impact of combined treatment with cow manure and pretreatment of potato peels was examined. It was found that co-digestion of potato peel waste and cow manure yielded up to 237.4 mL CH4/g VSadded, whereas the maximum methane yield from the mono-digestion of potato peels was 217.8 mL CH4/g VSadded. Comparing the co-digestion to mono-digestion of potato peels, co-digestion in PPW/CM ratio of 60:40 increased the methane yield by 10%. In addition, grinding and acid hydrolysis applied to potato peels were positively effective in increasing the methane amount reaching 260.3 and 283.4 mL CH4/g VSadded respectively. Likewise, compared to untreated potato peels, pretreatment led to an elevation of the methane amount by 9% and 17% respectively and alleviated the kinetics of biogas production.

1. Introduction

Potatoes are one of the largest crops worldwide and steadily grow hitherto as a staple food crop [1]. In the Netherlands, potatoes production is one of the major agricultural activities with more than 10 million tons produced in 2016 and approximately 50% of the potatoes undergo processing [2]. Potato peels are the main by-product of processing, producing about 8% waste by weight and its abatement is becoming a major issue. The potato industry produces on average 100 ktons of peels worldwide annually [3]. Current research is focused on the potato peel waste (PPW) recycling pathways for pharmaceutical and/or energy industries resulting in an enhanced potato peel waste management [4]. PPW is used for the production of low-value animal feed or as fertilizer in agricultural activities [5]. PPW has been previously characterized and contains starch (15–25%), non-starch polysaccharide (25–30%), acid insoluble and acid soluble lignin (15–20%), protein (18%), lipids (1%), and ash (6–10%) [6,7,8,9].
Its diverse composition can facilitate the production of bio-based products and fuels [10,11]. Peschel et al. [12] found an industrial approach for polyphenols extraction from potato peel waste. Recent studies also reported a promising method for lactic acid production with mixed microbial consortia in batch fermentation mode [13,14]. Moreover, its high content of carbon and nutrients renders it good feedstock for biogas production via the anaerobic digestion (AD) process [15]. AD is a biochemical procedure that degrades organic material and produces biogas (approximately 55–65% CH4—35–45% CO2) by facultative anaerobes and anaerobes bacteria in the absence of oxygen. AD mainly comprises three phases (hydrolysis, acidogenesis and methanogenesis) which illustrate biochemical events during the AD process [16,17,18]. AD technology has been broadly facilitated in the treatment of agricultural residuals, wastewaters, and animal slurries with primary objectives the energy production and waste reduction [19,20,21]. Versatile utilization of biogas, such as heat and power generation or vehicle fuel production, is an advantage among other gaseous biofuels [22,23]. Currently, more than 250 AD plants are operated in the Netherlands providing energy to approximately 2 million households and targeting to reduce more than 25 million metric tons CH4 equivalent of greenhouse gas emissions by 2030 [24,25]. The inoculum to substrate ratio (ISR) has been regarded as an intrinsic factor influencing the AD performance. Notable lessening of methane yield was reported from the degradation of wastes, when ISRs were over a certain level [26,27].
Simultaneous treatment of solid and/or liquid organic waste also strengthens the process performance and increases the degradation efficacy, and this is attributed to a synergistic phenomena which occurs within the digester [28,29]. Comparing with mono-digestion, co-digestion of organic wastes with different animal slurries has positively affected the performance as it enhances the buffer capacity to maintain an optimal pH for methanogenic archaea. It also provides a better carbon-to-nitrogen (C/N) ratio, and utilizes microorganisms and macro and micronutrients which exist in various wastes [30]. Several reports refer to an optimal range for the C/N ratio as 20–30 which is far from the C/N ratio of 40–70 provided by the agricultural waste [31,32,33,34]. Furthermore, substrates with too high C/N ratio would not provide the sufficient nitrogen required for the microbial growth, while substrates with low C/N ratio would inhibit the process because of the NH3 accumulation. Animal slurries contain a high amount of nitrogen that may hinder the bioreactor performance [35,36]. Pretreatment is also a parameter for further investigation as the degradation rate is affected by the composition and the characteristics of each substrate. The recalcitrance is a pivotal feature that impedes the decomposition of feedstocks and may hinder the process performance [16,37].
The present work aimed to add knowledge to the anaerobic digestion of PPW. The investigation of the anaerobic treatment of potato peels is crucial for the smooth operation and stability of continuous systems [38]. In the present report, AD performance was investigated by conducting batch experimental tests. The effect of homogenizing/grinding and acid hydrolysis as pretreatment methods are studied. The first-order and cone kinetic models were also applied for the prediction of the biogas production rate and to assess the fitting with the experimental data. This study aims to: (1) Investigate the effect of ISR on the biogas yield; (2) clarify how the addition of cow manure enhances the AD performance; and (3) provide insight of the kinetics of the PPW degradation.

2. Materials and Methods

2.1. Inoculum and Substrates

Microbial inoculum (sludge) was collected from a mesophilic operating anaerobic bioreactor from the wastewater treatment installation of Garmerwolde in Groningen, Netherlands. Cow manure was collected from a local farmer in the province of Groningen, Netherlands. Prior to their characterization and use, sludge and manure were stored at 6 °C to avoid undesirable fermentation processes. Potatoes were purchased in a local store and the peels were removed using a sharp knife and were cut into 0.5–1 cm pieces prior to use.

2.2. Experimental Design

The digestion tests were facilitated in batch mode using 500 mL glass bottles with a working volume of 400 mL operated at 36 °C for 55 days. The experimental conditions are given in Table 1. Three experimental studies were carried out to examine the influence of ISR (R1→5), co-digestion ratio (R6→8), and pretreatment method (R9→10) respectively on biogas yield by anaerobically treating in batch mode. The concentrations of the substrates were based on organic loading mass [39,40]. The amount of volatile solids (VS) of the inoculum and the substrate were calculated based on the predetermined ISRs. For all experiments, distilled water was added, and no additional nutrients/ trace elements were added to the reactors as it was assumed that they are provided by the inoculum (anaerobic sludge).
Glass reactors were sealed with rubber stoppers and being flushed for 5 min with nitrogen to maintain an anoxic environment. Thereafter, they were incubated at temperature (36 °C) and rotating speed (150 rpm). Blank trials containing only anaerobic sludge were conducted to correct the biogas produced by the inoculum itself. Batch experiments were ended when no biogas was observed. In all experiments, triplicate serum bottles were used and results were means of triplicates ± standard deviation. Samples were taken at the beginning, the end, and in four predetermined time spots during the experimental period to determine the variation of pH, volatile fatty acids (VFAs and alkalinity. The experiments were terminated when no biogas was observed.
For the first batch experiment (R1, R2, R3, R4, and R5) of studying the influence of the ISR on biogas production, potato peels were used as the sole substrate and inoculum was added based on the set ISRs of 0.25, 0.5, 1, 2, and 4. For the second study (R6, R7, and R8) of investigating the impact of simultaneous digestion on biogas production, all experimental conditions were similar as those of the first experiment, apart from the type of substrate. Briefly, ISR was fixed at 2, and potato peels were digested with cow manure (CM) according to the mixing ratios (Table 1) to reach a total organic load per reactor of 4 g VS. The last experiment (R9 and R10) was conducted to examine the impact of potato peels pretreatment on biogas production, and all experimental conditions were the same as those of the second experiment, except that potato peel waste were underwent grinding and acid hydrolysis.

2.3. Analytical Methods

The amount of total solids (TS; g/kg) and volatile solids (VS; g/kg) was determined according to the recommendations of the Standard Methods of APHA et al. (2005) [41]. PH was estimated off-line using a pH meter (HI991001, Hanna Instruments, Woonsocket, RI, USA). The titration method was applied to determine the total alkalinity (TA; mg CaCO3/L) and total volatile fatty acids (TVFAs; mg acetate/L) [42]. Chemical oxygen demand (COD; g/kg) was calculated using a test kit (Hach Lange GmbH, Germany) according to the manufacturer’s guide and was quantified with a spectrophotometer (DR/2010, Hach, USA). For the acid hydrolysis pretreatment (AHP), 20 g of PPW was boiled in 200 mL of 0.9% (w/w) H2SO4 solution for 1 h and for the grinding, a commercial grinder was used to homogenize 30 g PPW with 90 mL water. The pH of the reactor with the acid-based treated PPW was adjusted to 7 by using 1 M NaOH solution. The lignin amount of substrates was determined according to the procedures established by the National Renewable Energy Laboratory (NREL) [43].
The method used to determine the VS removal was based on the previous study [44]. The method used to estimate the biochemical biogas potential was based on a volumetric test, which considered the displacement of a liquid into the measure of biogas production [45]. The water displacement equipment used in this work can provide biogas data within the 5% accuracy [46]. Biogas composition and its correction was carried out by the procedure followed in a previous study [31]. The methane potential assay can also be used to estimate the synergistic effect of co-substrates The synergistic effect can be expressed as the additional biogas yield for co-digestion feedstocks over the weighted average of the individual feedstock’s biogas yield [47,48]. All the results were the means of replicates of triplicate ± standard deviation (SD) with an accuracy of 5%. Technical digestion time (TDT) (time needed to reach 80% of the maximal biogas yield) was used to assess the AD performance [49].

2.4. Kinetic Study

Biogas produced during the study was modeled by fitting the experimental data with two classical kinetic models to identify the kinetic parameters in order to enhance the full-scale application of the process. A regression analysis was conducted in Matlab R2015b (Mathworks, Natick, MA, USA) and Microsoft Office Excel (Microsoft Office 2010, Microsoft Corporation, Redmond, WA, USA) and the first order and cone models were used for the hydrolysis of organic matter and are described by the equations from previous studies [50,51]:
G ( t ) = G O × ( 1 e ( K t ) )
G ( t ) = G O 1 + ( K t ) n
G(t) is the cumulative biogas yield at digestion time t days (mL biogas/g VSadded), G O is the maximum biogas potential of the substrate the biogas potential (mL biogas/g VSadded), n is the shape factor, K is the hydrolysis constant (1/day), t is the time (days).

2.5. Statistical Analysis

The standardized residual is the residual divided by its standard deviation and is given by the equation:
S t a n d a r d i z e d   r e s i d u a l   ( i ) = r e s i d u a l ( i ) s t a n d a r d   d e v i a t i o n ( i )
Single-factor analysis of variances (ANOVA) in Excel software 2010 was facilitated and statistical significance was established at a P-value less than 0.05 level.

3. Results and Discussion

3.1. Characterization of Substrates and Inoculum

The characteristics of the sludge, potato peel waste and cow manure were summarized in Table 2. It is noted that the characteristics of inoculum and cow manure were different for the three experimental periods.

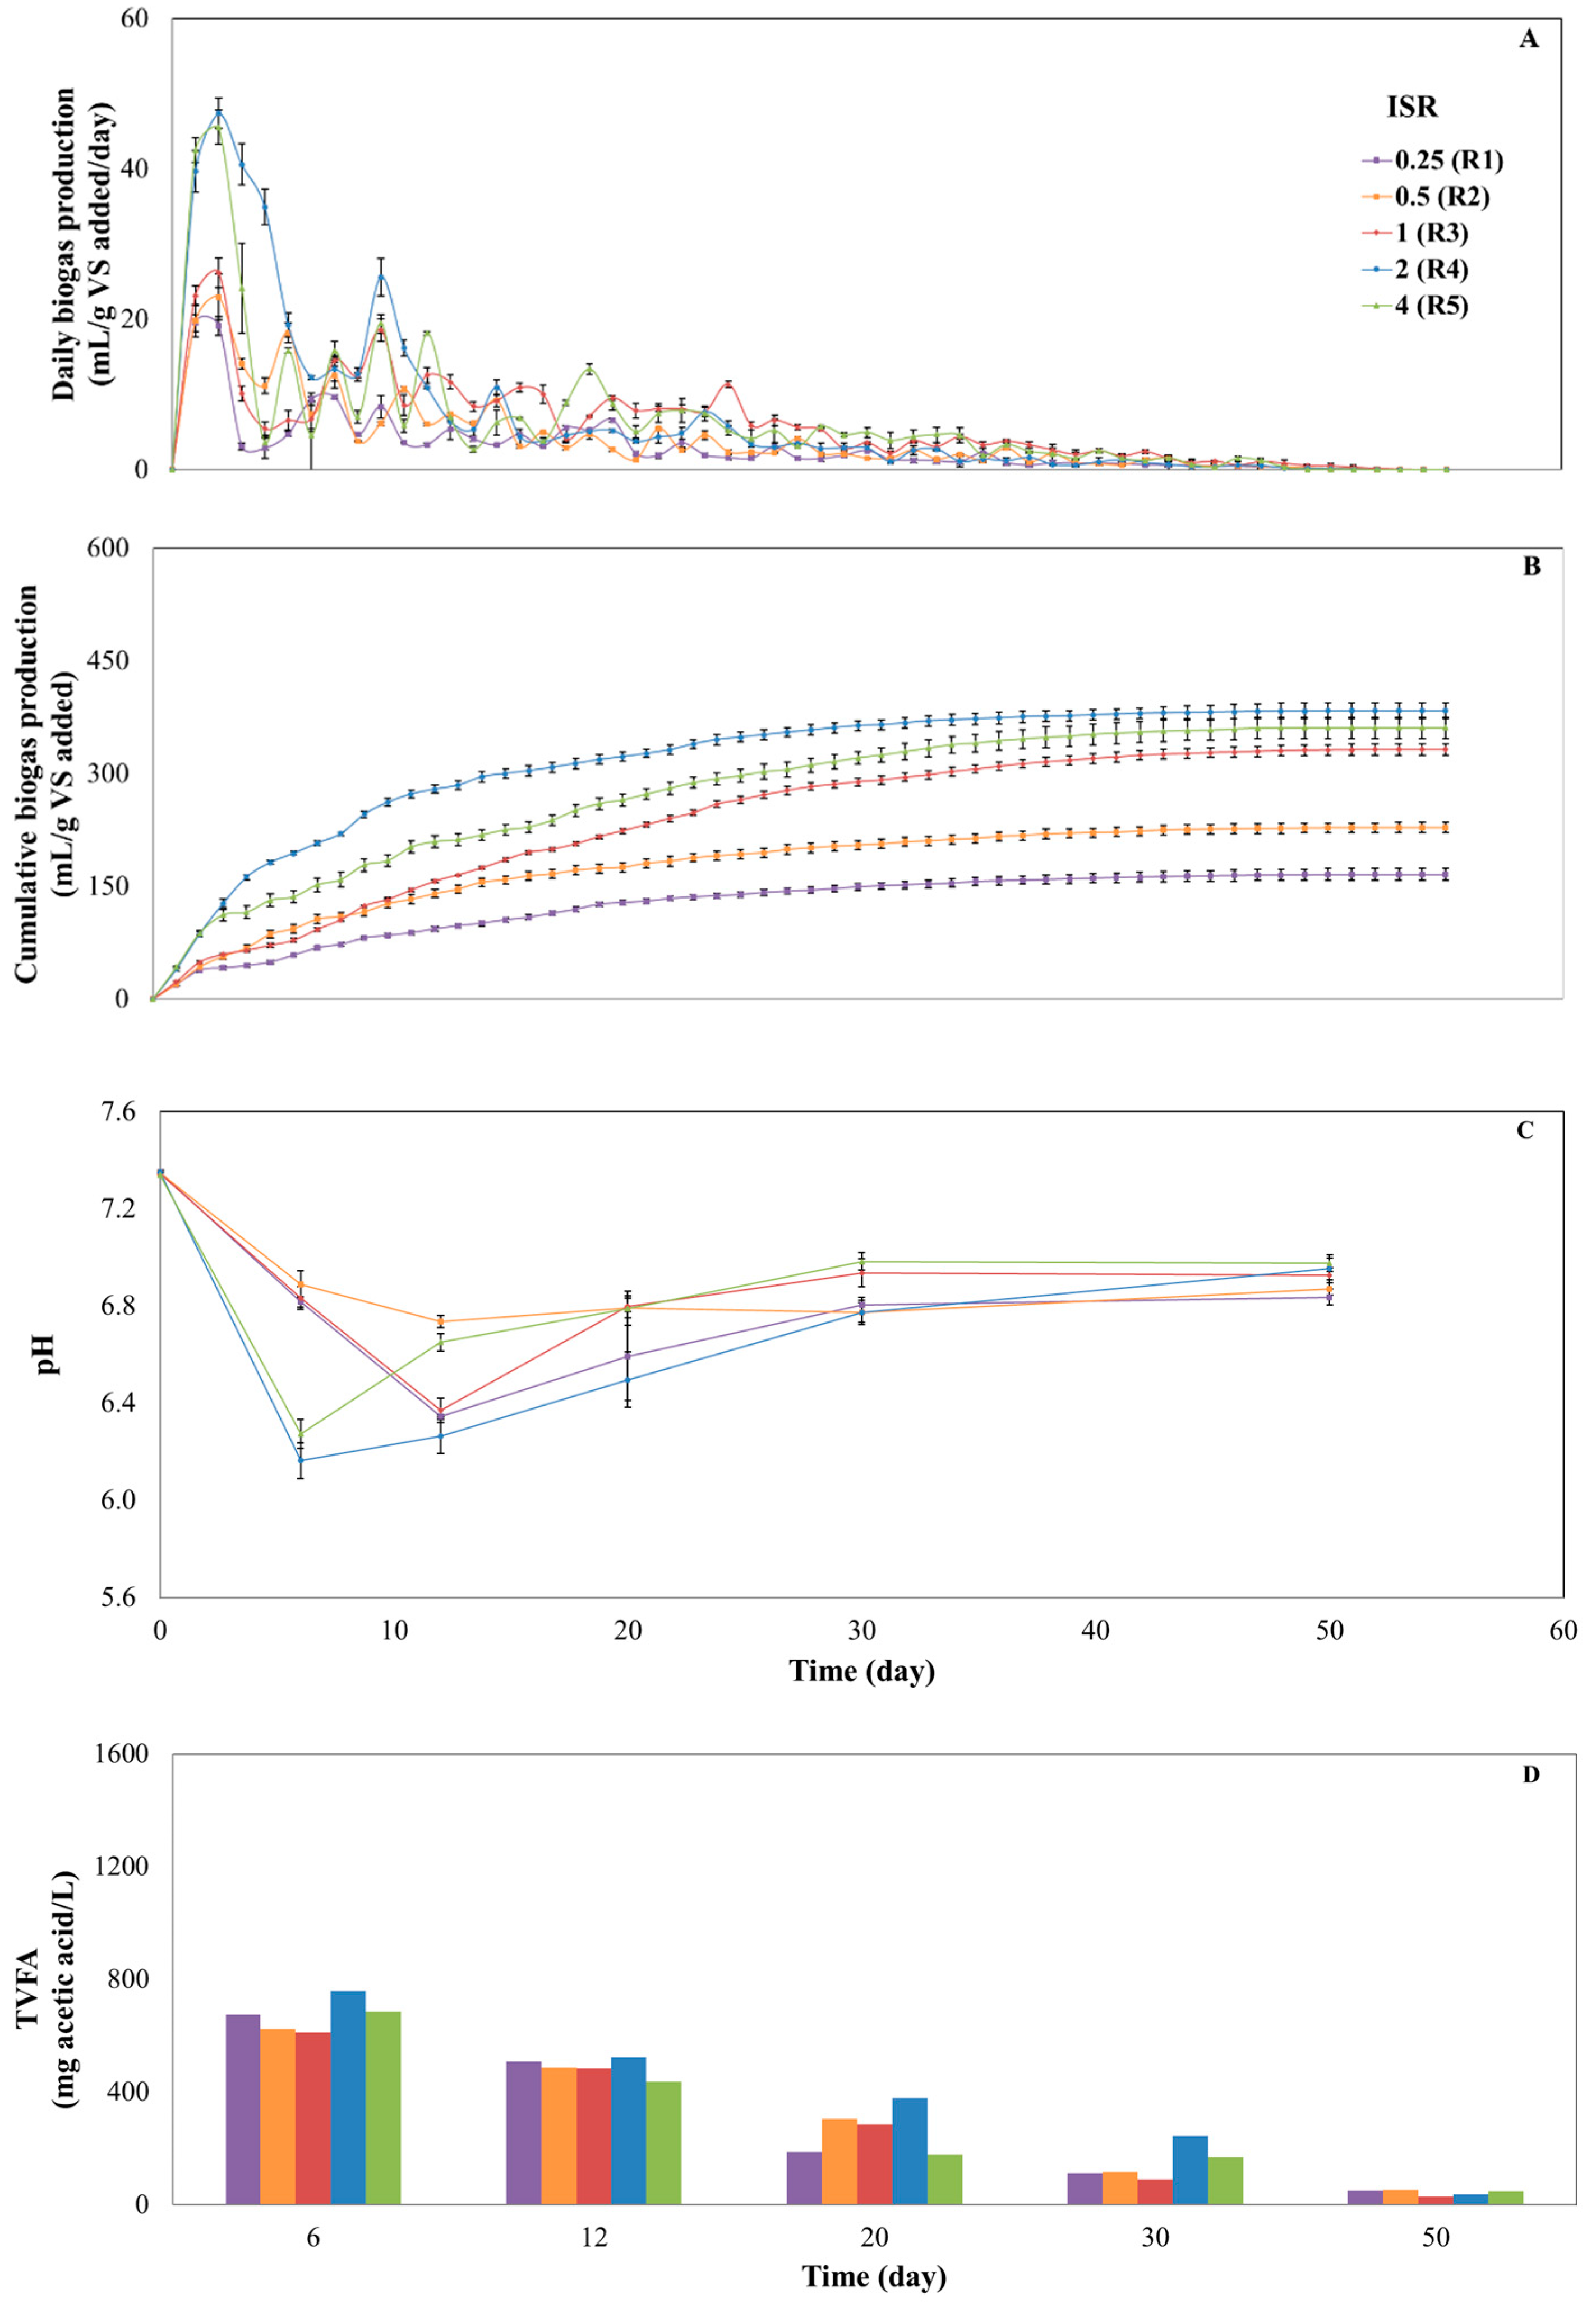
3.2. Effect of ISRs on the Mono-Digestion PPW

The cumulative biogas yield (mL/g VSadded), daily biogas production rate (mL/g VSadded/day), pH, and total organic acids (%) from the anaerobic digestion of PPW at five ISRs were investigated, and the results are given in Figure 1. For the biogas correction, control reactors were operated treating only anaerobic sludge.
Biogas production rapidly began on the first day of digestion in all of the digesters (Figure 1A). Biogas production did not show interdependence with the increase of the ISR. The highest daily biogas production rate reached 47.4 and 45.5 mL/g VSadded/day on the second day of digestion at the ISRs of 2 and 4 (Figure 1A). When compared with those obtained at these two ISRs, a decrease of biogas production was observed at a lower ISR of 0.25, 0.5 and 1. The daily biogas production for the ISR 0.25, 0.5 and 1 fluctuated during the time period of 5–20 day of digestion within the range of 4–12 mL/g VSadded/day, and then dropped to a lower level. Biogas production was maintained in the period 5–20 days with the highest level of 25.6 and 19.5 for ISR of 2 and 4. It is notable that cumulative biogas production yields at the ISRs of 0.25 and 0.5 gradually augmented from day 3 until approximately day 25 and thereafter, it is gradually decreased (Figure 1B). In the ISR of 2 and 4, the production rate started to increase slowly until day 5. After 53 days of digestion, the biogas yields of PPW at the ISRs of 2 and 4 reached 383.7 and 361.2 mL/g VSadded respectively against 332.2 mL/g VSadded achieved at the ISR of 1 (Table 3). At the ISRs of 0.25 and 0.5, biogas yield reached 165.8 and 228.1 mL/g VSadded respectively, indicating the importance of sufficient availability of sludge for the organic mass degradation.
The methane contents at the ISRs of 0.25, 0.5, 1, 2, and 4 were 50.23%, 51.12%, 53.40%, 56.75%, and 52.8%, respectively (Table 3). The methane yields were calculated to be 83.3, 116.6, 177.4, 217.8, and 190.7 mL CH4/g VSadded respectively. The methane content at the ISRs of 0.25 and 0.5 indicated that the degradation was lower than those obtained at the ISRs of 1, 2, and 4 (30.8% vs. 37.1–39.3%). The ISR of 4 showed obviously the shortest technical digestion time (TDT) of 17 days indicating the rapid degradation of the organic matter.
As shown in Table 3, the TDT at the ISRs of 0.25 and 0.5 were shorter than that obtained in the case of the ISR of 1 and 4 (22 days vs. 24 and 26 days). The TDT did not follow the tendency of degradation efficiency. Parawira et al. [52] studied the two-stage digestion of potato peels and observed high biogas yield. This might be due to the segregation of the digestion stages resulting in higher conversion efficiencies. Similar studies on the digestion of solid potato waste showed higher cumulative biogas yield than in our study, which might be due to the higher lignin percentage (approx. 20%) of the substrate, which burdens the degradation of hemicellulose components from the enzymes [53,54]. The complex structure of lignin prevents the carbohydrate-degrading microbes from attaching to the structural carbohydrates, i.e., cellulose and hemicellulose [55].
As depicted in Figure 1 and Table 3, both daily production and total biogas yield lowered when the ISRs were decreased from 1 to 0.25. Low efficiency of biogas production might be due to the insufficient methanogens, which could cause the accumulation of the volatile fatty acids in the bioreactor and thus the pH dropping. PH values in the range of 6.5–7.5 favor the growth and activity of methanogens [56,57].
The changes in VFA and pH were also recorded, and the outcomes are given in Figure 1C,D. As observed in the digestion of PPW at the ISR of 2 and 4, the pH in those digesters decreased to 6.16 and 6.27 on day 6 and slightly increased until day 12, corresponding well with higher VFA concentrations (Figure 1D) during acidogenesis of the substrate in this period. According to TVFA analysis, R1 and R2 reached 675.8 and 625.4 mg acetate/L on day 6. The digesters with ISR of 0.25 and 0.5, showed a slow decrease of the pH, which corresponds to the low availability of inoculum reaching day 12 pH of 6.35 and 6.74 respectively. TVFA levels were found to vary significantly in the two reactors at different sampling times. The AD process is regarded as stable when TVFA/TA ratio ranges between 0.23 and 0.3. In addition, the ISR of 2 showed significant higher buffer capacity maintaining an optimal pH for methanogenic archaea (Figure S1A).
VFAs are produced in anaerobic digesters and have different impacts on microbial activity. Liotta et al. referred that VFA concentration of 2100 mg/L does not inhibit the AD process stability [58]. Several studies have determined the effect of different VFAs on the dynamics of the methanogenic consortia during the anaerobic digestion resulting in variations of the process stability and efficiency [59,60]. Previous studies also reported a reduction of methane yield produced food wastes and/or green wastes at the ISR of over 4. Pellera and Gidarakos [61] verified that lower methane yields and TDT were observed in the treatment of olive pomace at the ISR of 4 than those obtained at ISRs of 0.5−1. The peak of daily biogas production at ISR of 4 was slightly higher and TDT was relatively shorter (17 days on ISR of 4, Table 3) than those obtained at the ISR = 0.5 and 1. The functional relationship between biogas yield and the inoculum-to-substrate ratio was non-linear and followed a bell curve (Figure S1B). Based on that, the maximum biogas yield was achieved at the ISR of 2 and this ratio was chosen for the following tests.

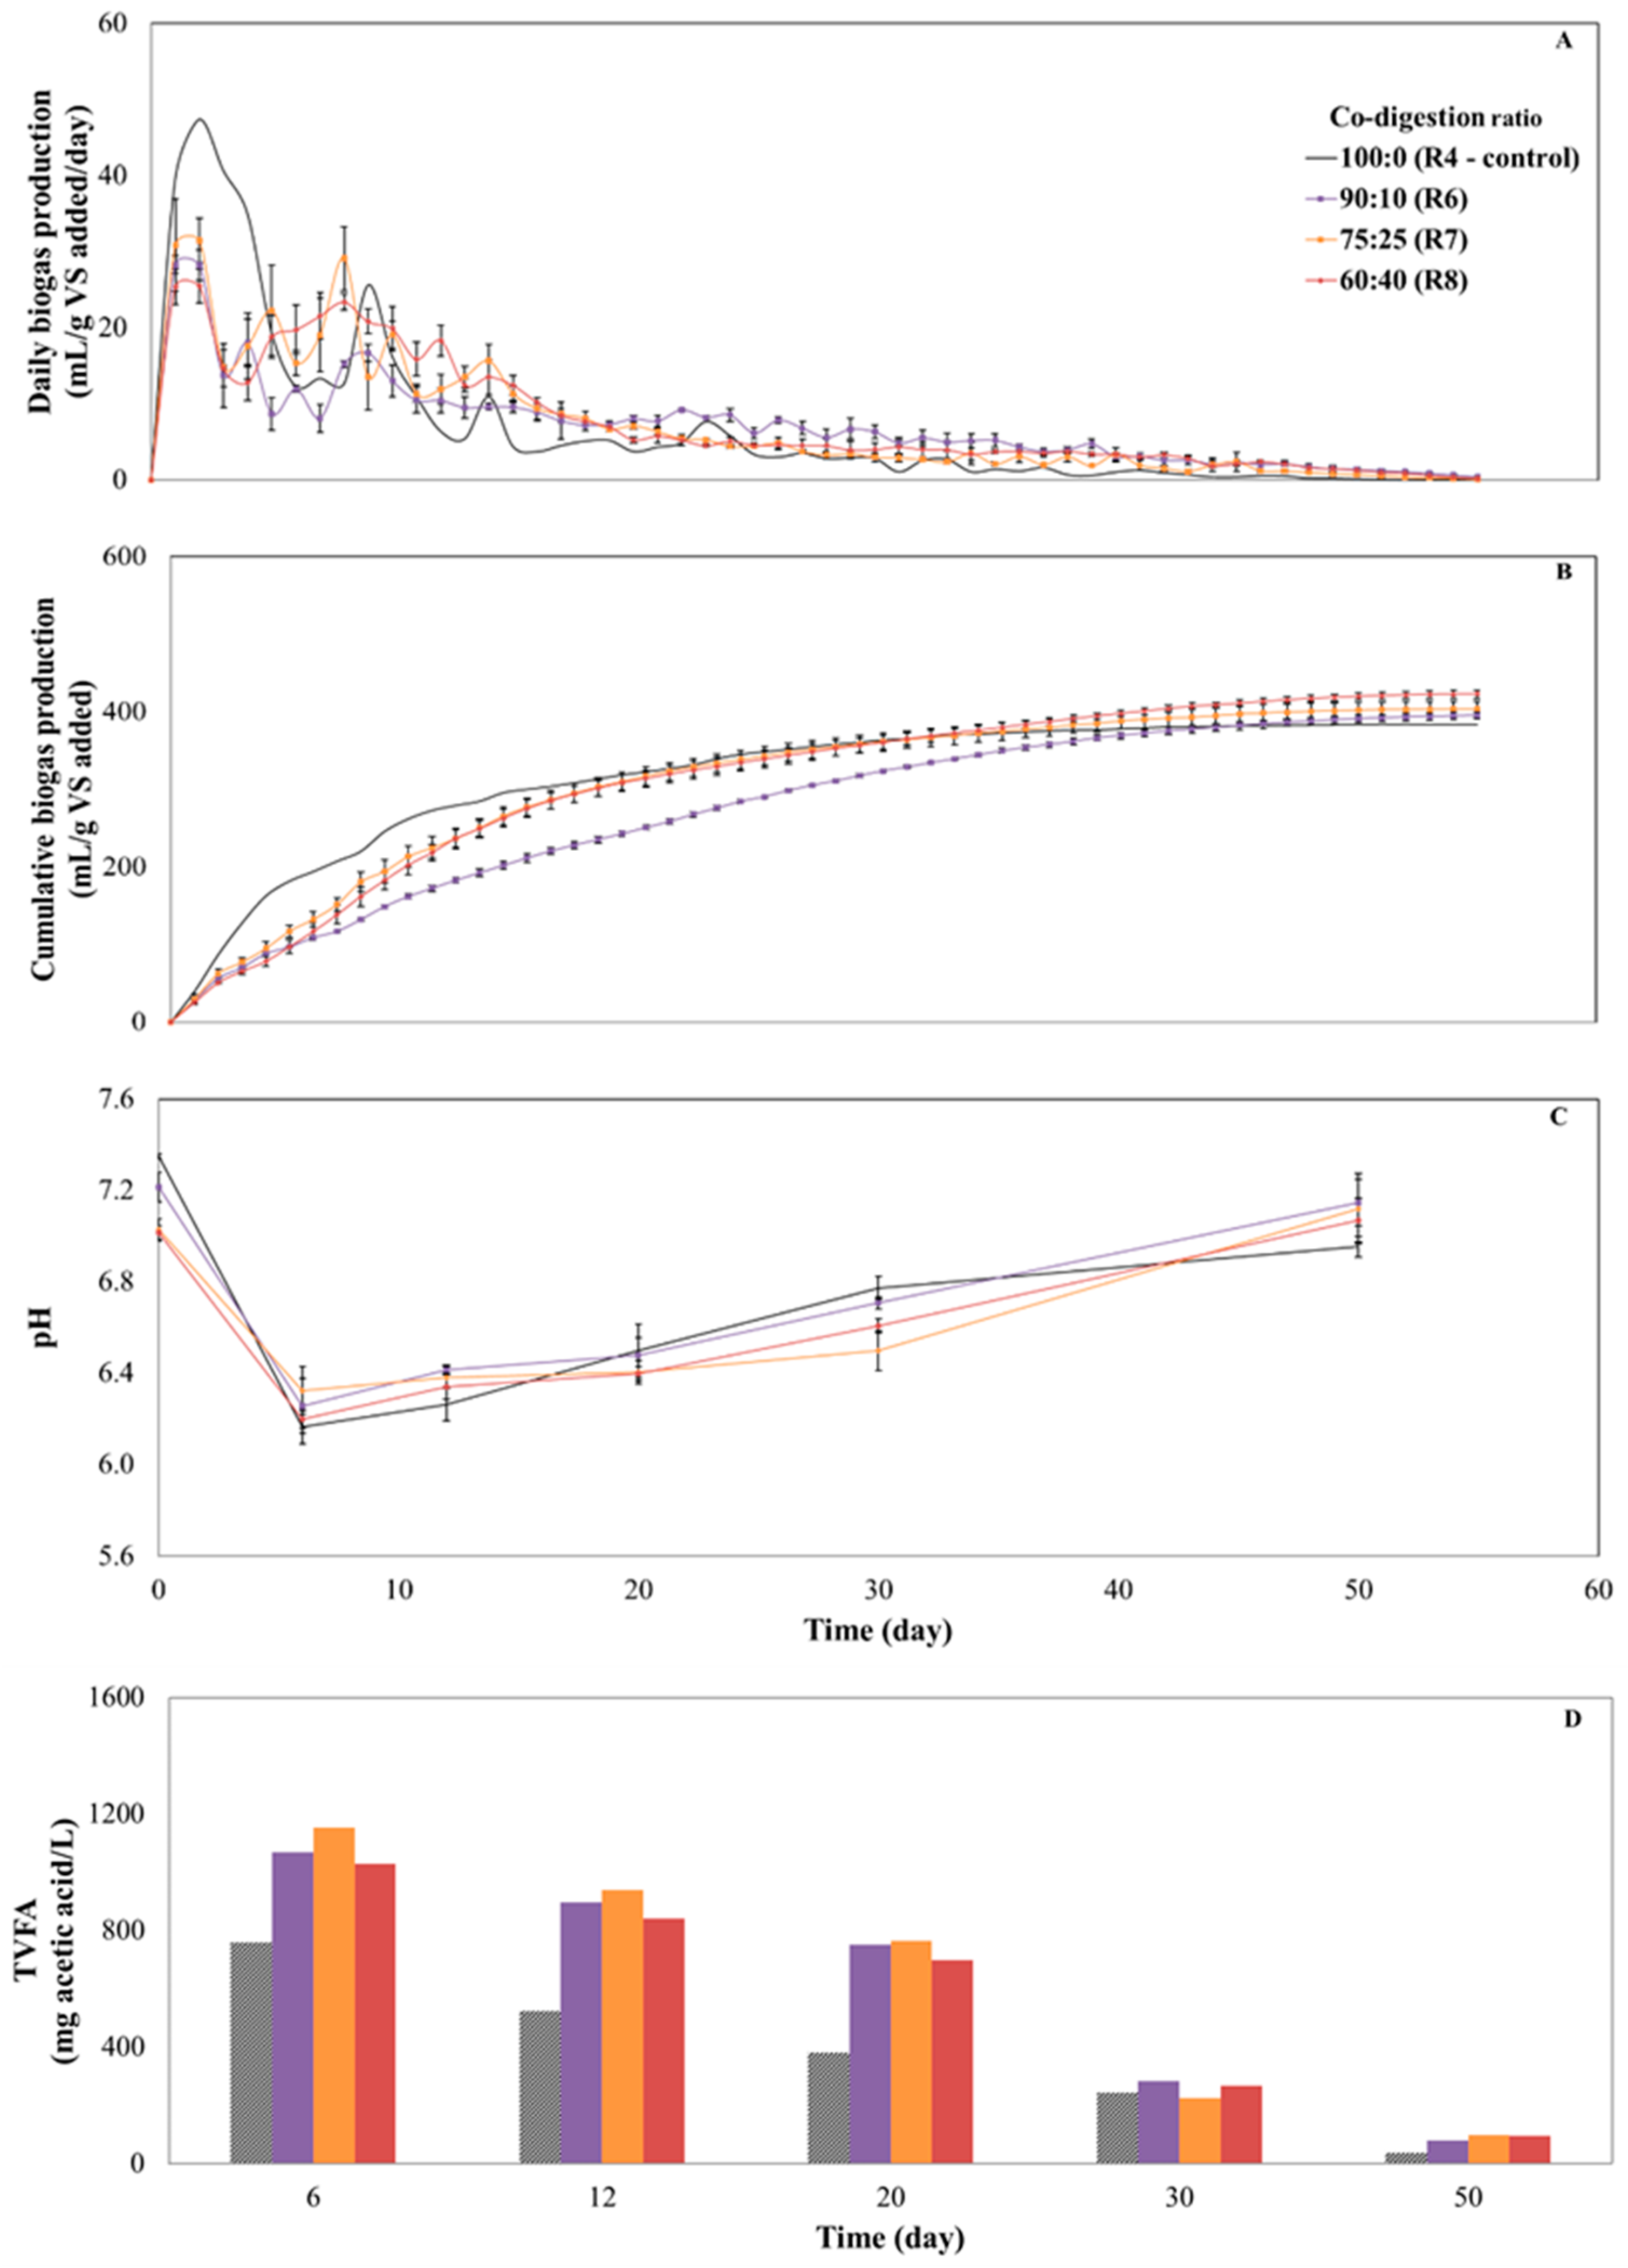
3.3. Co-Digestion of Potato Peel Waste with Cow Manure: Influence on Process Performance

To ameliorate the performance of anaerobic digestion by treating potato peel waste with cow manure, the mixing ratios of the two substrates were varied to produce different C/N ratios, while operating the digesters at the ISR of 2. The outcomes of mono-digestion of potato peel waste (R4) were used as the control. As in the anaerobic mono-digestion of potato peel waste, biogas was produced on day 6 in the reactors with the mixtures. Biogas production rapidly began on the first day of digestion in all of the digesters. Biogas production did show interdependence on the increase of cow manure fraction. The highest daily biogas production rate of R7 and R8 reached 31.5 and 25.5 mL/g VSadded/day on the second day of digestion and reactor R6 reached a daily production rate of 28.3 mL/g VSadded on the first day of the digestion (Figure 2A).
For the determination of weighted methane yield, an additional control reactor RC2 was operated treating cow manure with inoculum and the methane yield is given in Table S1. Synergistic effects were noticed in PPW/CM ratio of 75:25 and 60:40 (Table 4). When compared with that obtained without cow manure, a significant decrease was noticed in the daily biogas production rate. As seen in Figure 2A, biogas production was maintained in high level the second week of the digestion with the highest level of 16.7, 29.1, and 23.4 mL/g VSadded for the combined treatment ratios of 90:10, 75:25, and 60:40 respectively.
At PPW/CM ratio of 75:25 and 60:40, daily biogas production almost reached the former peaks on day 8 (29.14 and 23.4 mL/g VSadded/day) before decreasing to a low level on day 9. At a PPW/CM ratio of 90:10, R8 reached almost the half of the maximum biogas production (16.7 mL/g VSadded/day) on day 9 and thereafter it gradually remained at a lower level. Daily production fluctuated between day 15 and day 25 within the range of 6–11 mL/g VSadded/day, and then dropped to a low level.
After 53 days of digestion, the cumulative biogas amount in R6, R7, and R8 reached 395.46, 403.65 and 423.1 mL/g VSadded respectively against 383.7 mL/g VSadded achieved at the R4 without cow manure (Figure 2B). The cumulative biogas production observed adding cow manure was higher than the anaerobic mono-digestion of PPW.
Discrepancies in biogas and methane yields between mono-digestion and co-digestion of PPW were statistically significant. The methane percentages in R6, R7, and R8 were 52.28%, 53.40%, and 56.11% respectively, were lower than 56.75% in the mono-digestion of potato peels. The TDT at the three PPW/SM ratios was 29, 21, and 25 days, respectively, which is longer than that in R4 and the final methane yields at the three OP/SM ratios were calculated to be 206.8, 215.5, and 237.4 mL CH4/g VSadded (Table 4). Opinions vary regarding if TVFA/TA is a sufficient parameter to evaluate the AD stability, with several authors advocating ratios below 0.3 as optimal for the smooth operation of the digesters. PH variation and changes in the TVFA concentration were therefore estimated, and the outcomes are depicted in Figure 2C,D. There was a positive correlation between pH variation and TVFA concentration within the three reactors. Elevated TVFA concentrations were detected from the co-digestion reaching 1069.2, 1152.8, and 1028.1 mg acetate/L on day 6 in ratios of 90:10, 75:25, and 60:40 respectively. However, TVFAs of R7 reduced slower than those on R6 and R8 reaching 939.6 mg acetate/L on day 12. The high bicarbonate concentration most likely contributed to the system buffering (Figure S2A).
From Figure 2D, the TVFAs concentration of all the reactors dropped below 300 mg acetate/L on day 30 and remained in the range of 225–283 mg acetate/L. The TVFA showed similar performance with those in the case of R4, and at the end of digestion did not exceed the level of 100 mg/L. Combined treatment provided a better carbon/nitrogen ratio to the system. Considering the above results, the part addition of cow manure typifies an alternative method for farm-scale digestion units. The functional relationship between biogas yield and cow manure fraction added at a constant ISR was also assessed (Figure S2B). The results indicated that the biogas yield increased linearly [y = 12.637x + 369.89 (R2 = 0.9685)] with respect to an increase of cow manure fraction in the reactors. Similarly, a positive effect of cow manure in this paper was consistent with previously reported results [62,63]. Mixtures at the PPW/CM ratio of 60:40 were prepared thereafter for examining the impact of grinding and acid hydrolysis as pretreatment method on the anaerobic digestion of potato peels.

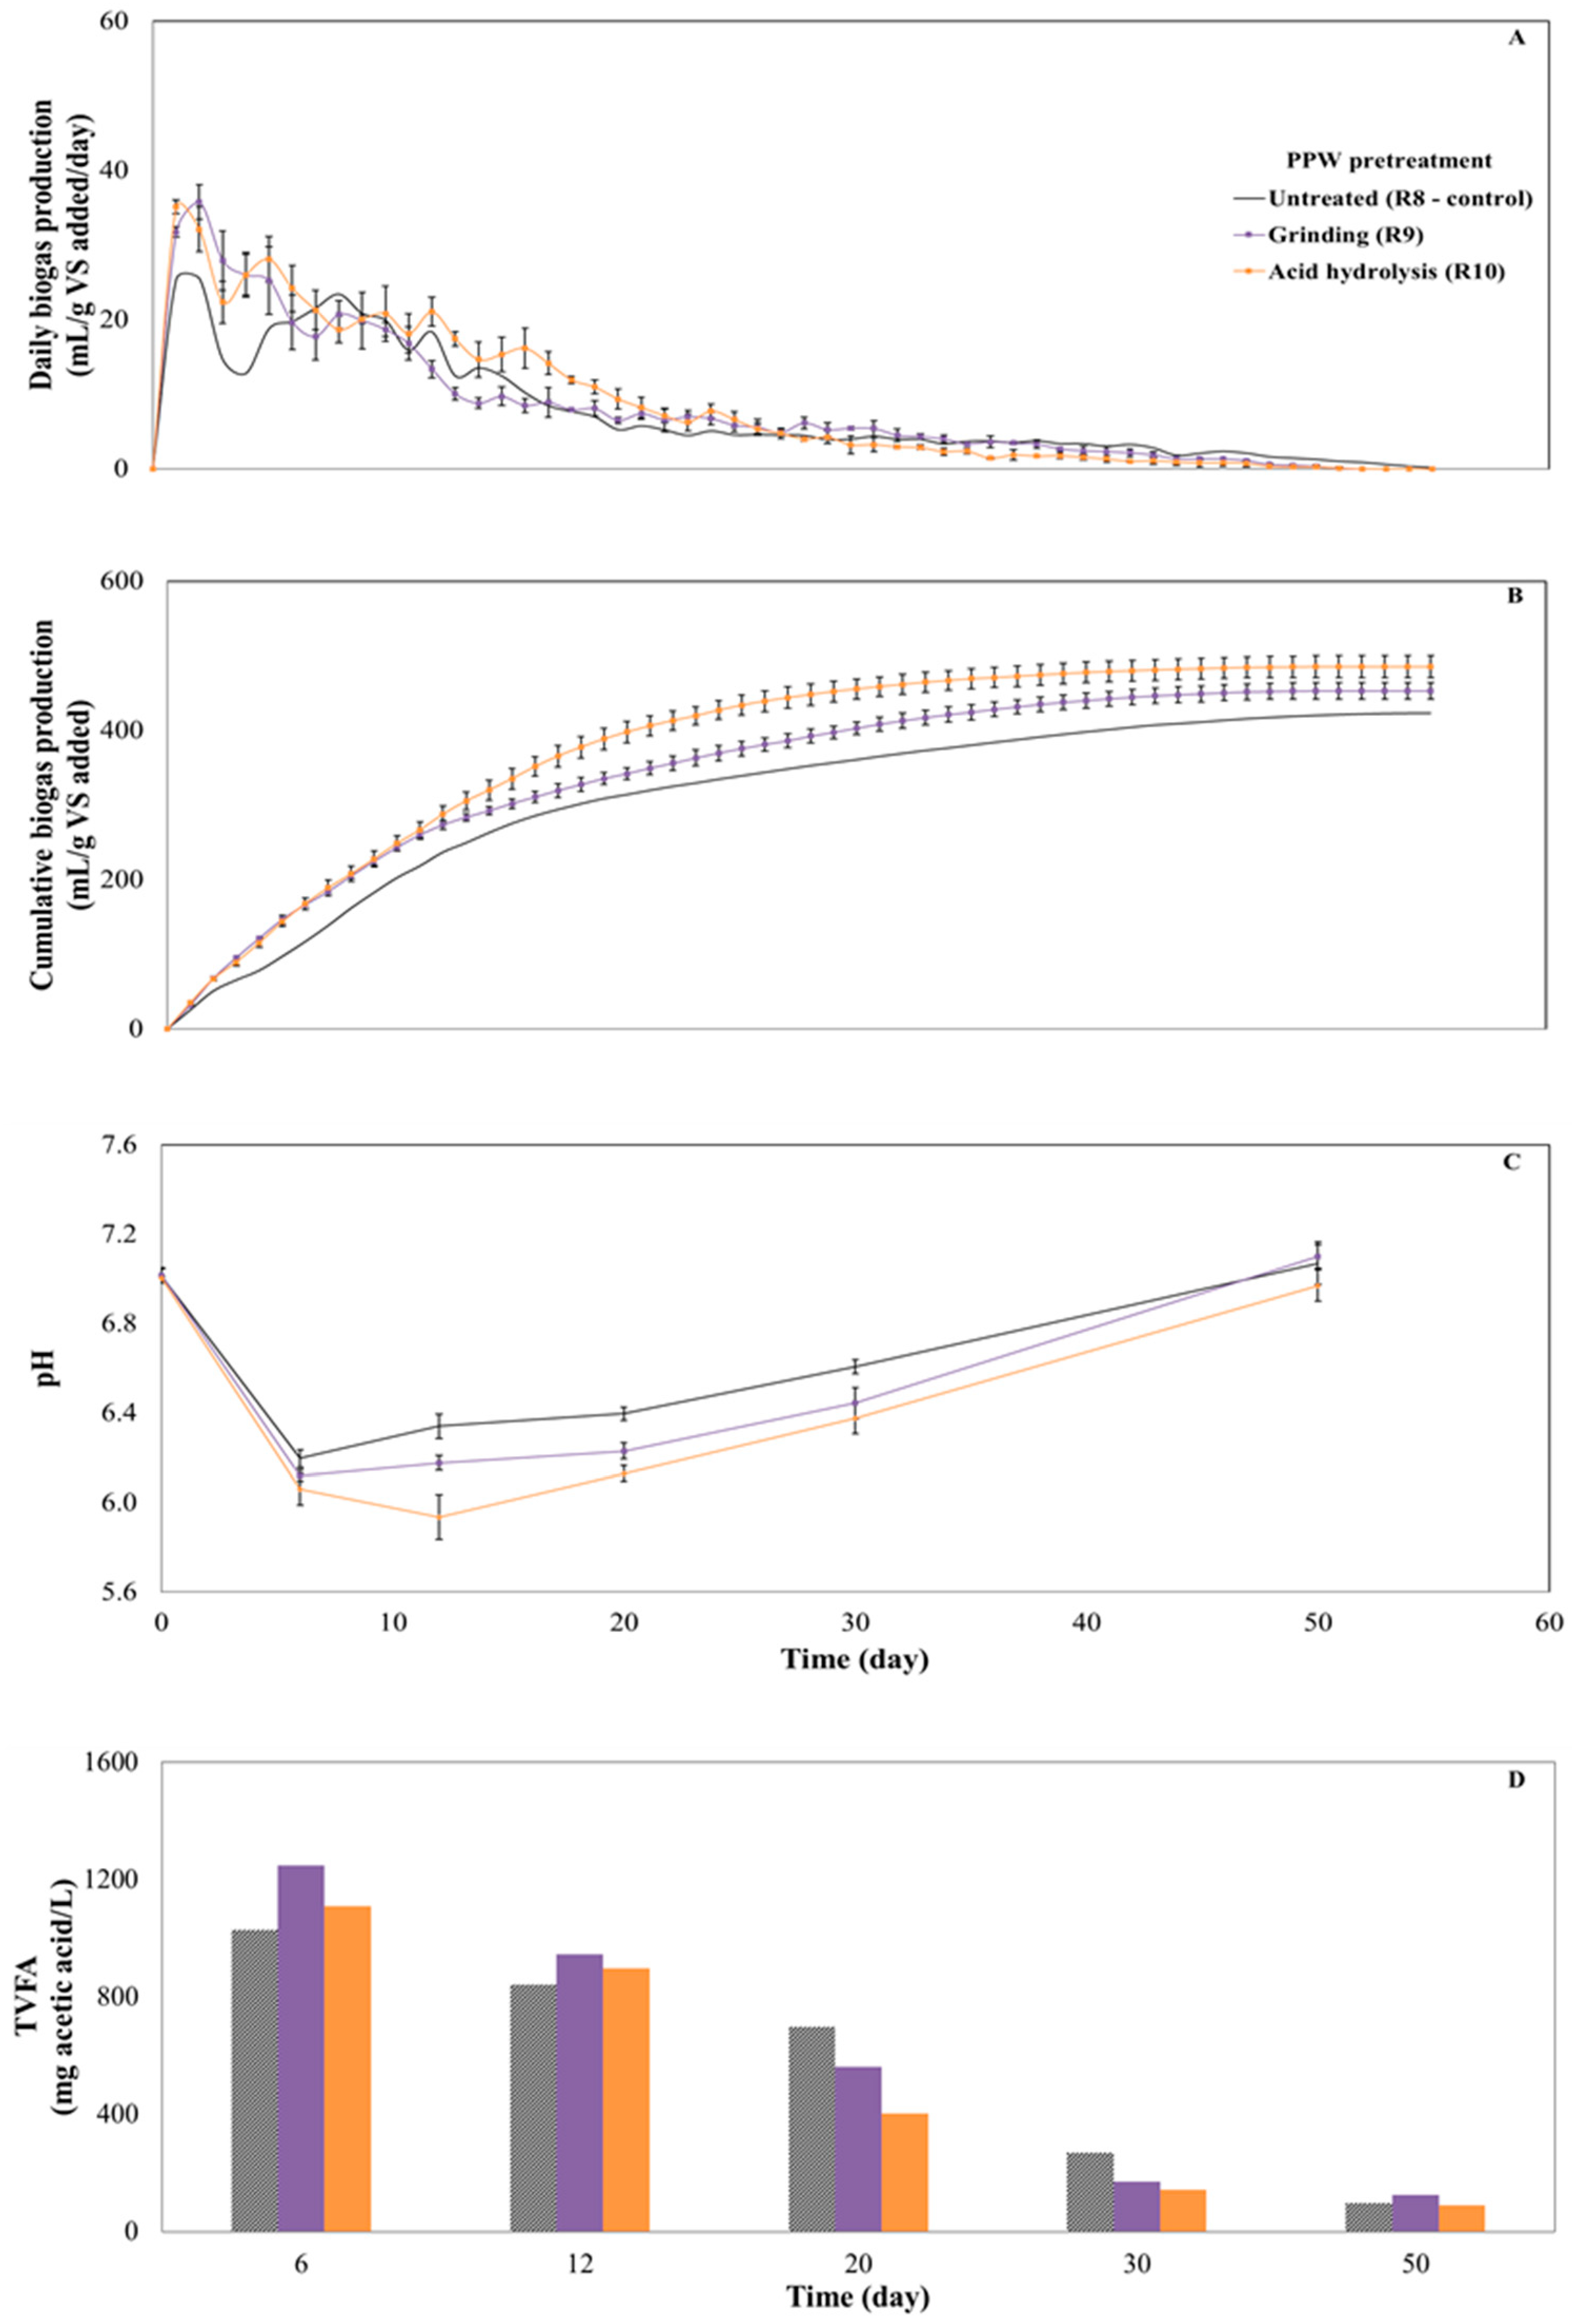
3.4. Effect of Pretreatment on Biogas Production in Co-Digestion of Potato Peels and Cow Manure
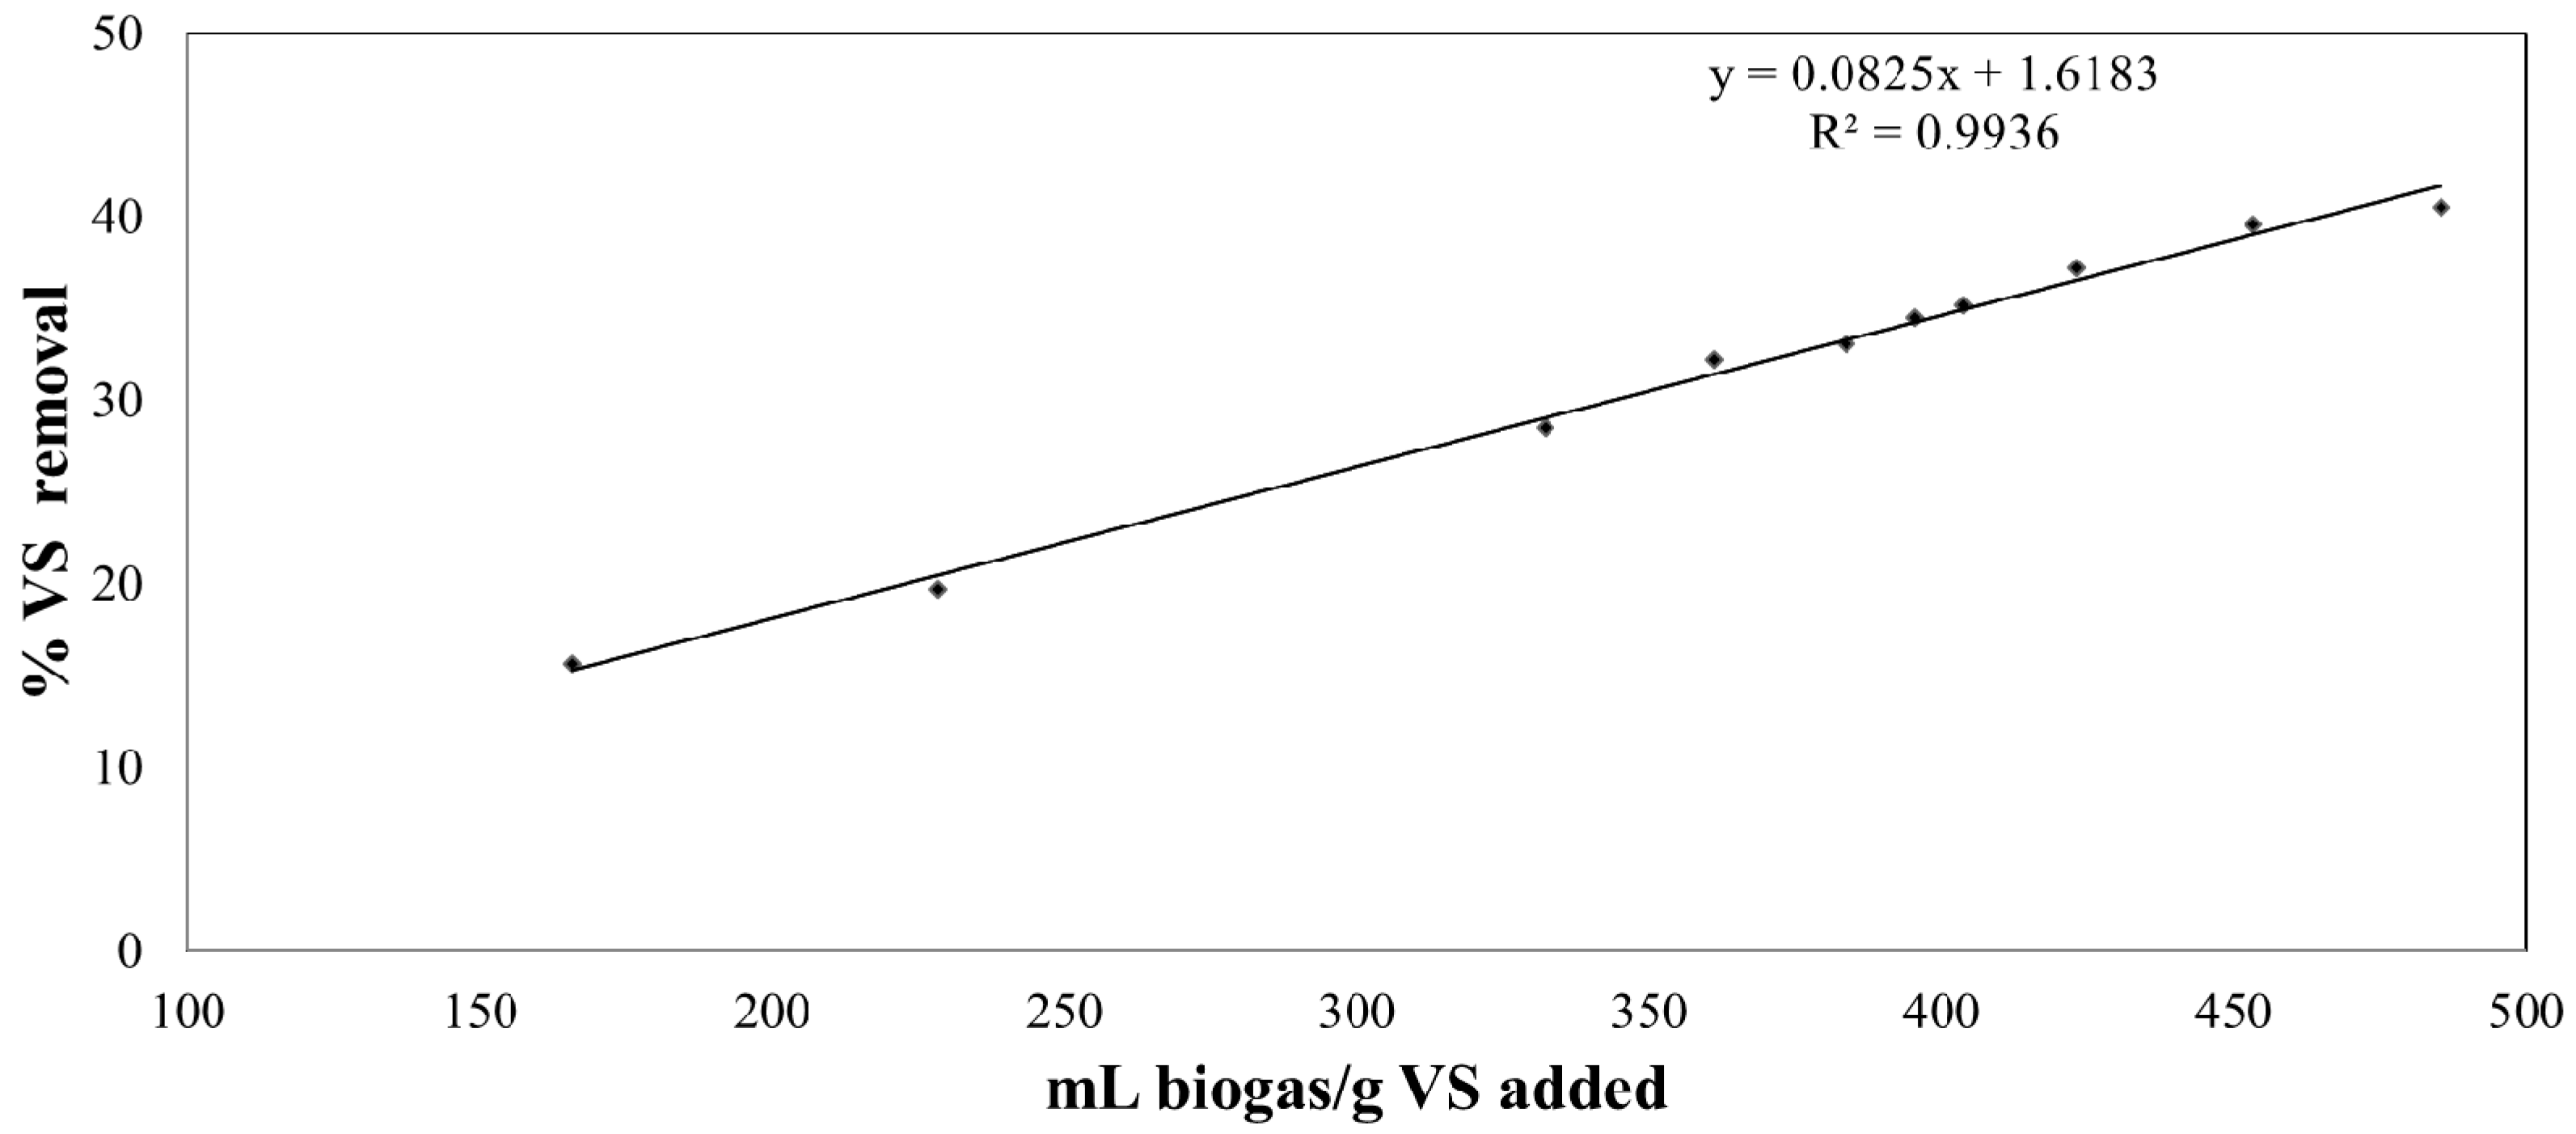
To elevate the AD efficiency, the combined treatment of PPW with CM, potato peels underwent pretreatment in a co-digestion ratio of 60:40. Grinding/homogenizing and dilute acid pretreatments were chosen to represent physical and chemical pretreatment.
The results of combined digestion of potato peels and cow manure (experimental set R8) were used as a control. Biogas production quickly began on the first day for all digesters (Figure 3A). The highest daily biogas production rate of R9 and R10 reached 35.8 and 35.1 mL/g VSadded/day on the second and the first day respectively. The two pretreatments effectively enhanced the biogas production yields of PPW. Significant high biogas yield was achieved from R9 and R10 reaching 453.2 and 485.4 mL/g VSadded respectively (Table 5). The biogas production was quicker than R8, with R10 showing a technical digestion time of 19 days (Figure 3B). The changes of VFA and pH during digestion of R9 and R10 were monitored to examine the relationship between the improvement of the degradation efficiency and the corresponding high biogas yields, and the results are shown in Figure 3C,D.
The pH in R9 followed the same trend with R8 and slightly increased until day 12, which was in line with the higher VFA concentrations (Figure 3C) during hydrolysis of the substrate in this period. In R10, pH decreased from 6.06 on day 6 to 5.94 on day 12 which might reflect an agglomeration of fatty acids which is usually associated with a lessening of the pH and lack of sufficient reactor buffering. However, on day 12, the pH increased as the methanogens quickly converted the VFAs to biogas indicating the sufficient response of the process to a possible imbalance between acidogens and methanogens. Volatile fatty acids are important intermediates of carbohydrates, lipids, and proteins degradation, and affect the efficiency of the AD process [64]. The methane production content (Table 5) in the experiment was increased by pretreatment of potato peels, such as acid hydrolysis and grinding treatments. The fast production of VFAs can decrease the pH and, thus impede the methanogenesis step.
Therefore, a smooth and stable reactor operation depends on the balance between VFAs and alkalinity (Figure S3). The performance of VFAs generation, conversion, and accumulation in reactor R9 and R10 are given in Figure 3D. The main difference between the R9 and R10 with R8 was the rapid response to TVFAs production and accumulation. From day 6 to day 12, the concentration of TVFA in R9 and R10 decreased from 1248.7 and 1109.6 mg acetate/L to 945.3 and 896.5 mg acetate/L respectively. These two reactors had a similar TVFA profile. However, the produced and increased TVFAs were converted rapidly without causing inhibition because of sufficient alkalinity (Figure S3). Higher biogas yield upon pretreatment is envisaged due to the reduced cellulose crystallinity and the lessening of lignin content [65].
The dilute acid pretreatment revealed an increment in the amount of biogas produced and justifies the enhanced biomass reactivity, a fact that is attributed to the incremental release of the sugars (monomers and oligomers). Depending on the pretreatment poignancy (time, acid concentration and temperature), sugars can be converted to aldehydes, such as furfural and hydroxymethylfurfural. Under controlled conditions, removal of hemicellulose from biomass displays the cellulose to microorganisms and increases the glucose yield [66]. Mancini et al. [67] reported the positive effect of chemical pretreatment on biogas production of wheat straw. This step enhances the susceptibility of the cellulosic components. In addition, other pretreatment methods would be useful to be applied to determine the effect on anaerobic digestion performance as they have advantages and limitations, and their application cannot be based on their influence on the AD process [68]. However, an economic analysis would be interesting to be conducted in order to evaluate which pretreatment has the best potential for full-scale applications.

3.5. VS Removal

From another view, the relationship of cumulative biogas yield and VS% removal was plotted (Figure 4). Based on the obtained data in this study, a linear regression equation was established (y = 0.085x + 1.6183).
As expected, the increment of cumulative biogas yield follows similar to the raised degradation percentage of the organic material. The high correlation coefficient (R2) indicated that there was a positive correlation between biogas yield and VS reduction.

3.6. Kinetics Results and Correlation with Process Parameters

Outcomes of the kinetic study using the first order and cone models are summarized in Table 6 and Table 7. Both models were found to have a good fit with the experimental data. In the first experiment, R1 and R2 showed good degradation rates, however, the biogas yields remained at a lower level. One possible reason for poor biogas yield could be methanogens growth inhibition due to the fast PPW’s acidification and slow methanogenesis rate. The R4 with the ISR of 2 showed efficient performance providing the highest K value (0.911 d−1) reaching 383.7 mL/g VSadded of biogas yield.
During the second experiment, all reactors showed lower K values than the mono-digestion of PPW (R4) because the manure has a higher percentage of complex carbohydrates [35]. Although the hydrolysis was slower, microbial interactions from inoculum and manure favored the whole process performance degradation. The pretreatment positively affected the process performance and increased the biogas yield. Acid hydrolysis pretreated PPW showed high hydrolysis rate and increased the biogas yield. The difference between experimental and predicted values was low (0.52%) in the case of acid hydrolysis.
To assess the soundness of the results, the predicted values were plotted against the experimental results (Figures S4–S6). The low values of RMSE reflect the model’s high ability to accurately predict the bioactivities. The statistical indicators (RMSE and R2) are given in Table 6 and Table 7 providing the picture of kinetics study. In addition, to evaluate the accuracy of all replicates, the standardized residuals were calculated and plotted in Figure S7.
According to the kinetic study, this study concluded that the kinetic parameters can be affected by the process conditions. Therefore, the effects of these process parameters (ISR, co-digestion ratio, VS removal rate and pH) on kinetic parameters (G and K) were examined based on Pearson’s correlation analysis (Table S2). In this case, the biogas production potential was significantly increased by a co-digestion ratio (r = 0.742, P < 0.05) and the VS removal rate (r = 0.994, P < 0.01), but decreased by pH (r = −0.753, P < 0.05). The hydrolysis constant (k) did not show any relevance to the process parameters or to biogas production potential.

4. Conclusions

This study investigated the impact of inoculum-to-substrate ratios, co-digestion ratios and pretreatment methods on the anaerobic digestion performance of potato peels. The overall results showed that co-digesting of acid based pretreated PPW with cow manure in a ratio of 60:40 reinforces biogas production and increases methane content. Specifically, biogas yields in the ISR of 2 showed the highest biogas yield and the lowest technical digestion time in comparison to other ISRs indicating that an appropriate amount of sludge is required for efficient operation. Moreover, the addition of cow manure in general improved the process efficiency with the PPW:CM ratio of 60:40 being ideal and reaching 423.1 mL/g VSadded of biogas yield. Notwithstanding this, the pretreatment methods applied to PPW affected positively the degradation yielding of 453.2 and 485.4 mL/g VSadded for grinding and acid hydrolysis as pretreatments respectively. It is noteworthy that pretreated potato peels show good potential for enhancement of biogas production and increment of the energy output by co-digesting with cow manure while providing a stable anaerobic digestion process.

Supplementary Materials

The following are available online at https://www.mdpi.com/1996-1073/12/12/2311/s1, Additional tables and figures are given in the supplementary file.

Author Contributions

Conceptualization, S.A.; writing—original draft, S.A.; software, Y.L.; writing—review & editing, V.A. and G.J.W.E.

Funding

This research received no external funding.

Conflicts of Interest

The authors declare no conflict of interest.

References

  1. FAO. FAOSTAT Agricultural Data. Food and Agricultural Commodities Production. Available online: http://faostat.fao.org/site/339/default.aspx (accessed on 12 June 2014).
  2. VAVI. Association for the Potato Processing Industry. Available online: http://www.vavi.nl/index.shtml (accessed on 26 November 2018).
  3. Chang, K.C. Polyphenol antioxidants from potato peels: Extraction, optimization and application to stabilizing lipid oxidation in foods. In Proceedings of the National Conference on Undergraduate Research (NCUR), Ithaca College, NY, USA, 31 March–2 April 2011. [Google Scholar]
  4. Wu, D. Recycle Technology for Potato Peel Waste Processing: A Review. Procedia Environ. Sci. 2016, 31, 103–107. [Google Scholar] [CrossRef] [Green Version]
  5. Nelson, M.L. Utilization and application of wet potato processing coproducts for fishing cattle. J. Anim. Sci. 2010, 88, 133–142. [Google Scholar] [CrossRef] [PubMed]
  6. Mader, J.; Rawel, H.; Kroh, L. Composition of phenolic compounds and glycoalkaloids a-solanine and a-chaconine during commercial potato processing. J. Agric. Food Chem. 2009, 57, 6292–6297. [Google Scholar] [CrossRef]
  7. Schieber, A.; Stintzing, F.C.; Carle, R. By-products of plant food processing as a source of functional compounds—Recent developments. Trends Food Sci. Technol. 2001, 12, 401–413. [Google Scholar] [CrossRef]
  8. Camire, M.E.; Violette, D.; Dougherty, M.P.; McLaughlin, M.A. Potato peel dietary fiber composition: Effects of peeling and extrusion cooking processes. J. Agric. Food Chem. 1997, 45, 1404–1408. [Google Scholar] [CrossRef]
  9. Liang, S.; McDonald, A.G. Chemical and thermal characterization of potato peel waste and its fermentation residue as potential resources for biofuel and bioproducts production. J. Agric. Food Chem. 2014, 62, 8421–8429. [Google Scholar] [CrossRef] [PubMed]
  10. Liang, S.; Han, Y.; Wei, L.; McDonald, A.G. Production and characterization of bio-oil and bio-char from pyrolysis of potato peel wastes. Biomass Convers. Biorefin. 2015, 5, 237–246. [Google Scholar] [CrossRef]
  11. Arapoglou, D.; Varzakas, T.; Vlyssides, A.; Israilides, C. Ethanol production from potato peel waste (PPW). Waste Manag. 2010, 30, 1898–1902. [Google Scholar] [CrossRef]
  12. Peschel, W.; Sanchez-Rabaneda, F.; Diekmann, W.; Plescher, A.; Gartzia, I.; Jimenez, D.; Lamuela-Raventos, R.; Buxaderas, S.; Codina, C. An industrial approach in the search of natural antioxidants from vegetable and fruit wastes. Food Chem. 2006, 97, 137–150. [Google Scholar] [CrossRef]
  13. Liang, S.; Gliniewicz, K.; Mendes-Soares, H.; Settles, M.L.; Forney, L.J.; Coats, E.R.; McDonald, A.G. Comparative analysis of microbial community of novel lactic acid fermentation inoculated with different under fined mixed cultures. Bioresour. Technol. 2015, 179, 268–274. [Google Scholar] [CrossRef]
  14. Liang, S.; McDonald, A.G.; Coats, E.R. Lactic acid production from potato peel waste by anaerobic sequencing batch fermentation using undefined mixed culture. Waste Manag. 2015, 45, 51–56. [Google Scholar] [CrossRef] [PubMed]
  15. Chiumenti, A.; Boscaro, D.; da Borso, F.; Sartori, L.; Pezzuolo, A. Biogas from fresh spring and summer grass: Effect of the harvesting period. Energies 2018, 11, 1466. [Google Scholar] [CrossRef]
  16. Achinas, S.; Achinas, V.; Euverink, G.J.W.M. A technological overview of biogas production from biowaste. Engineering 2017, 3, 299–307. [Google Scholar] [CrossRef]
  17. Li, W.W.; Yu, H.Q. Advances in energy-producing anaerobic biotechnologies for municipal wastewater treatment. Engineering 2016, 2, 438–446. [Google Scholar] [CrossRef]
  18. Chen, J.F. Green chemical engineering. Engineering 2017, 3, 283–284. [Google Scholar] [CrossRef]
  19. Sahajwalla, V. Green Processes: Transforming Waste into Valuable Resources. Engineering 2018, 4, 309–310. [Google Scholar] [CrossRef]
  20. Matsakas, L.; Gao, Q.; Jansson, S.; Rova, U.; Christakopoulos, P. Green conversion of municipal solid wastes into fuels and chemicals. Electron. J. Biotechnol. 2017, 26, 69–83. [Google Scholar] [CrossRef]
  21. RedCorn, R.; Fatemi, S.; Engelberth, A.S. Comparing end-use potential for industrial food-waste sources. Engineering 2018, 4, 371–380. [Google Scholar] [CrossRef]
  22. Solarte-Toro, J.C.; Chacón-Pérez, Y.; Cardona-Alzate, C.A. Evaluation of biogas and syngas as energy vectors for heat and power generation using lignocellulosic biomass as raw material. Electron. J. Biotechnol. 2018, 33, 52–62. [Google Scholar] [CrossRef]
  23. Achinas, S.; Achinas, V. Biogas combustion: An introductory briefing. In Biogas: Production, Applications and Global Developments; Vico, A., Artemio, N., Eds.; Nova Science Publishers, Inc.: New York, NY, USA, 2017; pp. 179–193. [Google Scholar]
  24. Chen, P.; Anderson, E.; Addy, M.; Zhang, R.; Cheng, Y.; Peng, P.; Ma, Y.; Fan, L.; Zhang, Y.; Lu, Q.; et al. Breakthrough technologies for the biorefining of organic solid and liquid wastes. Engineering 2018, 4, 574–580. [Google Scholar] [CrossRef]
  25. EBA. Biogas Report 2014—Biogas Production in Europe; European Biogas Association: Bruxelles, Belgium, 2015. [Google Scholar]
  26. Fabbri, A.; Serranti, S.; Bonifazi, G. Biochemical methane potential (BMP) of artichoke waste: The inocolum effect. Waste Manag. Res. 2014, 32, 207–214. [Google Scholar] [CrossRef] [PubMed]
  27. Valenti, F.; Porto, S.M.C.; Cascone, G.; Arcidiacono, C. Potential biogas production from agricultural by-products in Sicily. A case study of citrus pulp and olive pomace. J. Agric. Eng. 2017, 48, 196–202. [Google Scholar] [CrossRef]
  28. Scaglione, S.; Caffaz, S.; Ficara, E.; Malpei, F.; Lubello, C. A simple method to evaluate the short-term biogas yield in anaerobic codigestion of WAS and organic wastes. Water Sci. Technol. 2008, 58, 1615–1622. [Google Scholar] [CrossRef] [PubMed]
  29. Dinuccio, E.; Gioelli, F.; Cuk, D.; Rollè, L.; Balsari, P. The use of co-digested solid fraction as feedstock for biogas plants. J. Agric. Eng. 2013, 44, 153–159. [Google Scholar] [CrossRef]
  30. Achinas, S.; Euverink, G.J.W. Feasibility study of biogas production from hardly degradable material in co-inoculated bioreactor. Energies 2019, 12, 1040. [Google Scholar] [CrossRef]
  31. Gomez, X.; Cuetos, M.J.; Cara, J.; Moran, A.; Garcia, A.I. Anaerobic co-digestion of primary sludge and the fruit and vegetable fraction of the municipal solid wastes: Conditions for mixing and evaluation of the organic loading rate. Renew. Energy 2006, 31, 2017–2024. [Google Scholar]
  32. Bolzonella, D.; Innocenti, L.; Cecchi, F. BNR wastewater treatments and sewage sludge anaerobic mesophilic digestion performances. Water Sci. Technol. 2002, 46, 199–208. [Google Scholar] [CrossRef]
  33. Perazzolo, F.; Mattachini, G.; Tambone, F.; Calcante, A.; Provolo, G. Nutrient losses from cattle co-digestate slurry during storage. J. Agric. Eng. 2016, 47, 94–99. [Google Scholar] [CrossRef]
  34. Pontoni, L.; Panico, A.; Salzano, E.; Frunzo, L.; Iodice, P.; Cavinato, F. Innovative parameters to control the efficiency of anaerobic digestion process. Chem. Eng. Trans. 2015, 43, 2089–2094. [Google Scholar]
  35. Cavinato, C.; Fatone, F.; Bolzonella, D.; Pavan, P. Thermophilic anaerobic co-digestion of cattle manure with agro-wastes and energy crops: Comparison of pilot and full-scale experiences. Bioresour. Technol. 2010, 101, 545–550. [Google Scholar] [CrossRef]
  36. Naik, L.; Gebreegziabher, Z.; Tumwesige, V.; Balana, B.B.; Mwirigi, J.; Austin, G. Factors determining the stability and productivity of small-scale anaerobic digesters. Biomass Bioenergy 2014, 70, 51–57. [Google Scholar] [CrossRef]
  37. Mancini, G.; Papirio, S.; Lens, P.N.L.; Esposito, G. Solvent pretreatments of lignocellulosic materials to enhance biogas production: A review. Energy Fuels 2016, 30, 1892–1903. [Google Scholar] [CrossRef]
  38. Nelson, M.J.; Nakhla, G.; Zhu, J. Fluidized-bed bioreactor applications for biological wastewater treatment: A review of research and developments. Engineering 2017, 3, 330–342. [Google Scholar] [CrossRef]
  39. Bolzonella, D.; Pavan, P.; Battistoni, P.; Cecchi, F. Mesophilic anaerobic digestion of waste activated sludge: Influence of the solid retention time in the wastewater treatment process. Process Biochem. 2005, 40, 1453–1460. [Google Scholar] [CrossRef]
  40. Fabbri, A.; Bonifazi, G.; Serranti, S. Micro-scale energy valorization of grape MARCS in winery production plants. Waste Manag. 2015, 36, 156–165. [Google Scholar] [CrossRef] [PubMed]
  41. APHA-AWWA-WEF. Standard Methods for the Examination of Water and Wastewater; APHA-AWWA-WEF: Washington, DC, USA, 2005. [Google Scholar]
  42. Lossie, U.; Pütz, P. Targeted Control of Biogas Plants with the Help of FOS/TAC. Practice Report Hach-Lange. 2008. Available online: https://www.semanticscholar.org/paper/Targeted-control-of-biogas-plants-with-the-help-of-Lossie-Putz/b71fa7e5578e02348b65d22f7be11844e646c7c8 (accessed on 16 December 2018).
  43. Sluiter, A.; Hames, B.; Ruiz, R.; Scarlata, C.; Sluiter, J.; Templeton, D.; Crocker, D. Determination of structural carbohydrates and lignin in biomass. Lab. Anal. Proced. 2008, 1617, 1–16. [Google Scholar]
  44. Wickham, R.; Galway, B.; Bustamante, H.; Nghiem, L.D. Biomethane potential evaluation of co-digestion of sewage sludge and organic wastes. Int. Biodeterior. Biodegrad. 2016, 13, 3–8. [Google Scholar] [CrossRef]
  45. Morosini, C.; Conti, F.; Torretta, V.; Rada, E.C.; Passamani, G.; Schiavon, M.; Cioca, L.I.; Ragazzi, M. Biochemical methane potential assays to test the biogas production from the anaerobic digestion of sewage sludge and other organic matrices. WIT Trans. Ecol. Environ. 2016, 205, 235–244. [Google Scholar]
  46. WRC. Equipment for Measurement of Gas Production at Low Rates of Flow; Technical Memorandum TM104—Water Research Centre: Swindon, UK, 1975. [Google Scholar]
  47. Dinuccio, E.; Balsari, P.; Gioelli, F.; Menardo, S. Evaluation of the biogas productivity potential of some Italian agro-industrial biomasses. Bioresour. Technol. 2010, 101, 3780–3783. [Google Scholar] [CrossRef]
  48. Labatut, R.A.; Angenent, L.T.; Scott, N.R. Biochemical methane potential and biodegradability of complex organic substrates. Bioresour. Technol. 2011, 102, 2255–2264. [Google Scholar] [CrossRef]
  49. Luna-del Risco, M.; Normak, A.; Orupõld, K. Biochemical methane potential of different organic wastes and energy crops from Estonia. Agron. Res. 2011, 9, 331–342. [Google Scholar]
  50. Stone, R.J. Improved statistical procedure for the evaluation of solar radiation estimation models. Sol. Energy 1993, 51, 289–291. [Google Scholar] [CrossRef]
  51. Bhattarai, S.; Oh, J.H.; Euh, S.H.; Kafle, G.K.; Kim, D.H. Simulation and model validation of sheet and tube type photovoltaic thermal solar system and conventional solar collecting system in transient states. Sol. Energy Mater. Sol. Cells 2012, 103, 184–193. [Google Scholar] [CrossRef]
  52. Parawira, W.; Murto, M.; Read, J.S.; Mattiasson, B. A study of two-stage anaerobic digestion of solid potato waste using reactors under mesophilic and thermophilic conditions. Environ. Technol. 2007, 28, 1205–1216. [Google Scholar] [CrossRef] [PubMed]
  53. Parawira, W.; Murto, M.; Zvauya, R.; Mattiasson, B. Anaerobic batch digestion of solid potato waste alone and in combination with sugar beet leaves. Renew. Energy 2004, 29, 1811–1823. [Google Scholar]
  54. Muhondwa, J.P.; Martienssen, M.; Burkhardt, M. Feasibility of anaerobic digestion of potato peels for biogas as mitigation of greenhouse gases emission potential. Int. J. Environ. Res. 2015, 9, 481–488. [Google Scholar]
  55. Cater, M.; Zorec, M.; Logar, R.M. Methods for improving anaerobic lignocellulosic substrates degradation for enhanced biogas production. Springer Sci. Rev. 2014, 2, 51–61. [Google Scholar] [CrossRef]
  56. Franchi, O.; Rosenkranz, F.; Chamy, R. Key microbial populations involved in anaerobic degradation of phenol and p-cresol using different inocula. Electron. J. Biotechnol. 2018, 35, 33–38. [Google Scholar] [CrossRef]
  57. Świątek, M.; Lewicki, A.; Szymanowska, D.; Kubiak, P. The effect of introduction of chicken manure on the biodiversity and performance of an anaerobic digester. Electron. J. Biotechnol. 2019, 37, 25–33. [Google Scholar] [CrossRef]
  58. Liotta, F.; Esposito, G.; Fabbricino, M.; van Hullebusch, E.D.; Lens, P.N.L.; Pirozzi, F.; Pontoni, L. Methane and VFA production in anaerobic digestion of rice straw under dry, semi-dry and wet conditions during start-up phase. Environ. Technol. 2016, 37, 505–512. [Google Scholar] [CrossRef]
  59. Franke-Whittle, I.H.; Walter, A.; Ebner, C.; Insam, H. Investigation into the effect of high concentrations of volatile fatty acids in anaerobic digestion on methanogenic communities. Waste Manag. 2014, 34, 2080–2089. [Google Scholar] [CrossRef] [PubMed] [Green Version]
  60. Wang, Y.; Zhang, Y.; Wang, J.; Meng, L. Effects of volatile fatty acid concentrations on methane yield and methanogenic bacteria. Biomass Bioenergy 2009, 33, 848–853. [Google Scholar] [CrossRef]
  61. Pellera, F.M.; Gidarakos, E. Effect of substrate to inoculum ratio and inoculum type on the biochemical methane potential of solid agro-industrial waste. J. Environ. Chem. Eng. 2016, 4, 3217–4229. [Google Scholar] [CrossRef]
  62. Cestonaro, T.; de Mendonça Costa, M.S.S.; de Mendonça Costa, L.A.; Rozatti, M.A.T.; Pereira, D.C.; Lorin, H.E.F.; Carneiro, L.J. The anaerobic co-digestion of sheep bedding and >50% cattle manure increases biogas production and improves biofertilizer quality. Waste Manag. 2015, 46, 612–618. [Google Scholar] [CrossRef] [PubMed]
  63. Alvarez, R.; Liden, G. Low temperature anaerobic digestion of mixtures of llama, cow and sheep manure for improved methane production. Biomass Bioenergy 2009, 33, 527–533. [Google Scholar] [CrossRef]
  64. Wang, Q.; Kuninobu, M.; Ogawa, H.I.; Kato, Y. Degradation of volatile fatty acids in highly efficient anaerobic digestion. Biomass Bioenergy 1999, 16, 407–416. [Google Scholar] [CrossRef]
  65. Achinas, S.; Euverink, G.J.W. Consolidated briefing of biochemical ethanol production form lignocellulosic biomass. Electron. J. Biotechnol. 2016, 23, 44–53. [Google Scholar] [CrossRef]
  66. Johnson, D.K.; Elander, R.E. Treatment for enhanced digestability of feedstocks. In Biomass Recalcitrance: Deconstructing the Plant Cell Wall for Bioenergy; Himmel, M.E., Ed.; Blackwell Pub.: Oxford, UK, 2008; pp. 436–453. [Google Scholar]
  67. Mancini, G.; Papirio, S.; Lens, P.N.L.; Esposito, G. Increased biogas production from wheat straw by chemical pretreatments. Renew. Energy 2018, 119, 608–614. [Google Scholar] [CrossRef]
  68. Galbe, M.; Zacchi, G. Pretreatment: The key to efficient utilization of lignocellulosic materials. Biomass Bioenergy 2012, 46, 70–78. [Google Scholar] [CrossRef]
Figure 1. Effect of the inoculum-to-substrate ratio on the daily biogas production (A), the cumulative biogas production (B), the pH (C), and total volatile fatty acids (TVFA) accumulation (D), from the anaerobic digestion of potato peels.
Energies 12 02311 g001
Figure 2. The effect of the co-digestion ratio on the cumulative biogas production (A), the daily biogas production (B), the pH (C), and the TVFA accumulation (D).
Energies 12 02311 g002
Figure 3. The effect of the pretreatment on the cumulative biogas production (A), the daily biogas production (B), the pH (C), and the TVFA accumulation (D).
Energies 12 02311 g003
Figure 4. The relationship between biogas yield and volatile solids (VS) removal.
Energies 12 02311 g004
Table 1. Experimental conditions of the batch tests.
ParticularExperimental Design
ISR
(based on VS)
Co-Digestion Ratio
(based on VS)
Organic Load
(g VS added per L)
Pretreatment
Experiment 1
R10.25100:010-
R20.5100:010-
R31100:010-
R42100:010-
R54100:010-
Experiment 2
R6290:1010-
R7275:2510-
R8260:4010-
Experiment 3
R9260:4010Grinding
R10260:4010Acid hydrolysis
Table 2. Physical and chemical characteristics of the substrates used in the batch tests.
ParameterInoculumPotato Peels Waste (PPW)Cow Manure (CM)
TS (g/kg)50.9 (0.2)144.0 (4.3)144.6 (1.5)
VS (g/kg)29.1 (1.2)139.4 (4.8)119.4 (1.1)
VS/TS0.600.970.78
COD (g/kg)47.2 (1.0)123.8 (4.2)138.4 (1.9)
pH7.36NANA
Insoluble lignin (%TS)NA19.1 (0.7)24.6 (2.5)
Soluble lignin (%TS)NA1.59 (0.1)1.2 (0.4)
Ash (%)NA0.58 (0.1)5.5 (1.1)
Table 3. Results from the mono-digestion of PPW.
ParameterISR
0.25 (R1)0.5 (R2)1 (R3)2 (R4)4 (R5)
Biogas yield
(mL/g VSadded)
165.8 ± 7.9228.1 ± 6.8332.2 ± 7.6383.7 ± 10.7361.2 ± 14.4
Methane content
(%)
50.2 ± 0.551.1 ± 1.752.4 ± 0.556.8 ± 0.353.8 ± 0.3
Methane yield
(mL/g VSadded)
83.3 ± 0.9116.6 ± 3.9177.4 ± 2.3217.7 ± 1.2190.7 ± 2.9
VSadded degradation
(%)
15.6 ± 1.219.7 ± 3.028.5 ± 2.133.1 ± 2.732.1 ± 3.4
Technical digestion time
(d)
2222261724
Table 4. Results from the co-digestion of potato peels with cow manure.
ParameterCo-Digestion Ratio
90:10 (R6)75:25 (R7)60:40(R8)
Biogas yield
(mL/g VSadded)
395.4 ± 4.3403.7 ± 9.8423.1 ± 5.2
CH4 content
(%)
52.3 ± 1.653.4 ± 2.356.1 ± 0.8
CH4 yield
(mL/g VSadded)
206.7 ± 3.6215.5 ± 7.6237.4 ± 3.1
Weighted methane yield
(mL/g VSadded)
211.6202.5193.3
Differential (EMY-weighted MY)
(mL/g VSadded)
−4.913.144.2
Synergistic effectNoYesYes
VSadded degradation
(%)
34.5 ± 2.835.2 ± 4.337.2 ± 4.7
Technical digestion time
(day)
292125
Table 5. Results from the combined treatment of pretreated PPW and CM.
ParameterPretreatment
Grinding/Homogenizing (R9)Acid Hydrolysis (R10)
Biogas yield
(mL/g VSadded)
453.2 ± 11.0485.4 ± 14.6
Methane content
(%)
57.5 ± 1.458.3 ± 0.8
Methane yield
(mL/g VSadded)
260.3 ± 3.2283.4 ± 2.7
VSadded degradation
(%)
39.5 ± 2.540.5 ± 3.2
Technical digestion time
(day)
2319
Table 6. Results from the 1-order model.
Reactor1-Order
K
(1/day)
R2RMSEMeasured
(mL/g VSadded)
Predicted
(mL/g VSadded)
R10.07410.99344.05165.8163.3
R20.07330.99776.46228.1224.6
R30.0670.978616.57332.2324.9
R40.09110.032315.49383.7381.6
R50.06670.032315.30361.2353.1
R60.05370.992414.15395.4376.9
R70.07670.9995.49403.7398.6
R80.0660.99438.89423.1413.3
R90.07020.998210.47453.2444.9
R100.09210.990919.38485.4482.9
Table 7. Results from the cone model.
ReactorCone
K
(1/day)
nR2RMSEMeasured
(mL/g VSadded)
Predicted
(mL/g VSadded)
R10.11081.690.96578.273165.8158.4
R20.12581.590.97629.187228.1217.9
R30.08172.030.972416.51332.2317.3
R40.1761.510.981812.54383.7371.6
R50.11551.550.948121.59361.2341.7
R60.07981.790.96521.17395.4368.9
R70.10981.780.987112.61403.7387.8
R80.09581.800.988612.77423.1402.7
R90.11291.680.977918.13453.2432.9
R100.11111.980.983817.56485.4472.2

