Article

Life Cycle Assessment of Low-Rank Coal Utilization for Power Generation and Energy Transportation

1
School of Electrical and Electronic Engineering, North China Electric Power University, Beijing 102206, China
2
Key Laboratory of Condition Monitoring and Control for Power Plant Equipment of MOE, North China Electric Power University, Beijing 102206, China
*
Author to whom correspondence should be addressed.
Energies 2019, 12(12), 2365; https://doi.org/10.3390/en12122365
Submission received: 5 June 2019 / Revised: 14 June 2019 / Accepted: 17 June 2019 / Published: 19 June 2019
(This article belongs to the Special Issue Life Cycle Assessment of Renewable Energy Sources)

Abstract

:
In China, the electricity load is concentrated in the east, but low-rank coal resources are concentrated in the west. To solve this contradiction, in this study, three cases for energy transmission about power system with and without solar energy were studied by life cycle assessment (LCA). Case 1 directly combusts low-rank coal to generate electricity in western China and transmits it to eastern China by grid. Cases 2 and 3 upgrade low-rank coal and transport it to eastern China for power generation. With the evaluating indicators and various stages of LCA, the impact of each case on the environment was compared clearly. The results show that over 90% of the pollutant emission comes from coal combustion throughout the life cycle. The pollutant emission of upgraded coal transportation is less than 5%. With low-rank coal upgrading then combusting, the total emission is less than that of direct combustion. In particular, with solar energy added, the emission of combustion can be further reduced. On the bases of LCA, analytic hierarchy process (AHP) was used to establish the connection of these four evaluation indicators to comprehensively evaluate the performance of the three cases through the objective function of AHP, which provided guidance for the energy transmission and utilization in the eastern and western China. Finally, sensitive analysis shows the main major factors affecting system performance on the system. The results show that the Case 3, which integrates with solar energy, performs best in the whole life scale.

1. Introduction

In China, western regions have abundant coal resources, while eastern demand for electricity is great, which creates an imbalance in energy supply and demand. If the electric power generated in the west China can be transferred to the eastern via the electric gird, the problem of imbalance between energy supply and demand can be partly solved. However, more than half of the coal reserves in the western China are low-rank coals [1], suffering from high moisture content and relative low power generation efficiency, leading to a uneconomic pattern to directly transferring electric power from the west China to the east China [2]. In addition to electric power transmission, directly transportation of coal from the western China to the east where it is demand is also a pattern for energy transfer. Unfortunately, the low-rank coals also have a low heating value [3], highly reactive nature, and highly spontaneous combustion potential, and thus it is neither economical nor safe to transport the raw low-rank coal directly for a long distance. It should be also noted that, in addition to efficient energy transportation, Xinjiang has a large amount of electricity demand in recent years. Therefore, it is also significant to pay attention to the improvement of local power generation efficiency in Xinjiang while ensuring efficient power transmission.
Low-temperature oxidative pyrolysis is a feasible process for low rank-coal upgrading [4,5,6], in which coal particles are allowed to react with a small amount of oxygen and a mild thermal oxidation reaction will occur. The active oxygenated functional groups will be cracked and part of the volatile matter as well as moisture will be correspondingly released and removed. Kaji et al. [7] and Ogunsola et al. [8] carried out a series of pyrolysis experiments on different kinds of low-rank coals at different operation temperatures (200–600 °C), and found the water-holding capacity and the spontaneous combustion potential would be reduced due to decomposition of oxygen-containing groups and decrement of the equilibrium moisture. Xu et al. [9] found that when the water per kilogram of raw coal is removed by 0.1 kg, the efficiency of the power plant can be increased by 0.6 to 0.9%, mainly because the reduction of the flue gas improves the efficiency of the boiler. Guan et al. [10] found that the oxygenated functional groups would gradually crack, releasing CO2 and H2O during the pyrolysis at 150–450 °C; meanwhile, the trend of oxygen absorption capacity of the treated lignite would decrease with increasing temperature for pyrolysis. Xu [9] proposed a power generation and upgrading system that uses steam heat to upgrade low-grade coal while generating electricity. The electricity generated by this system is used for local electricity load in Xinjiang, and the upgraded coal will be transported to eastern China for power generation. The results show that improved quality coal is easier to transport and has higher power generation efficiency. The gross cost of electricity (COE) is also lower than directly electricity transportation.
However, it should be pointed out that the conventional low-rank upgrading often uses the heat of steam to provide the heat of upgrading, of which the energy consumed is essentially from the coal combustion. Recently, Xu [11] also proposed a solar-assisted low-rank coal upgrading and power generation system, incorporating coal predrying, low-temperature pyrolysis and power generation. In the proposed system, the low-rank coal is effectively converted into value-added coal that can be exported, and the solar energy supplied to the predrying and low-temperature pyrolysis of coal in a cascade manner. The upgraded coal with higher calorific value can be achieved, and could be transported to the east China by the railway. Clearly, from the perspective of the thermodynamics, this concept could save part of the coal, which is originally consumed to supply the energy required for coal drying and low-temperature pyrolysis, and promotes coal conversion efficiency and obtains satisfactory solar energy conversion efficiency [12]. The economics of the proposed solar-aided low-rank coal upgrading and power generation system also superior to the conventional one.
Although the coal upgrading can decrease the gross COE and the solar integration can further improve the low-rank coal upgrading, the environment footprint in the whole life cycle of these systems unknown. In other words, the pollutant and greenhouse gases emissions of the direct transportation of electric power generated from the low-rank coal (Case 1) or upgraded coal with conventional method low-rank coal (Case 2) and upgraded coal with solar energy integration (Case 3) from the whole life cycle should be further assessed.
LCA is a tool for evaluating the environmental factors related to a product or service and its environmental impact throughout the life cycle, which is one of the hotspots at home and abroad. The entire life cycle usually includes raw material collection and equipment production, transportation, use, reuse, maintenance and decommissioning processes [13]. At present, a variety of different life cycle impact assessment methods based on the midpoint model and the endpoint model have been formed internationally. Many scholars have applied LCA to the research of coal-fired power generation systems, solar thermal power systems, and solar thermal hybrid systems. Whitaker et al. [14] used LCA to evaluate a power tower concentrating solar power facility, finding its LCA indicators perform well. Varun et al. [15] analyzed the carbon emissions of renewable energy power generation systems by LCA, finding that for an optimum selection of the electricity sources there should be some mixed technologies so that load on environment can be reduced and electricity distribution is possible.
In this study, the LCA method was adopted to analyze the life cycle inventory and life cycle range of these three systems (Cases 1–3) and calculate their pollutant emissions and primary energy consumption; then, the analytic hierarchy process (AHP) was adopted to comprehensively evaluate system consumption and emissions performance and discussed it under different conditions. In order not to lose universality, AHP analysis took into account the degree of regional development and different perspective. Therefore, the analysis of Cases 1–3 is also of reference value to the utilization of energy in other regions. Finally, with sensitive analysis, the main factors affecting the performance of the system are discussed. Through analysis of the results, it can be deduced that the primary cause of Case 2 and 3 emissions being lower than Case 1 is that the main emissions of thermal power are generated during operation. Therefore, although there will be more investment for coal upgrading in the early stage, the profit is considerable.

2. Cases Description

2.1. Systems Description

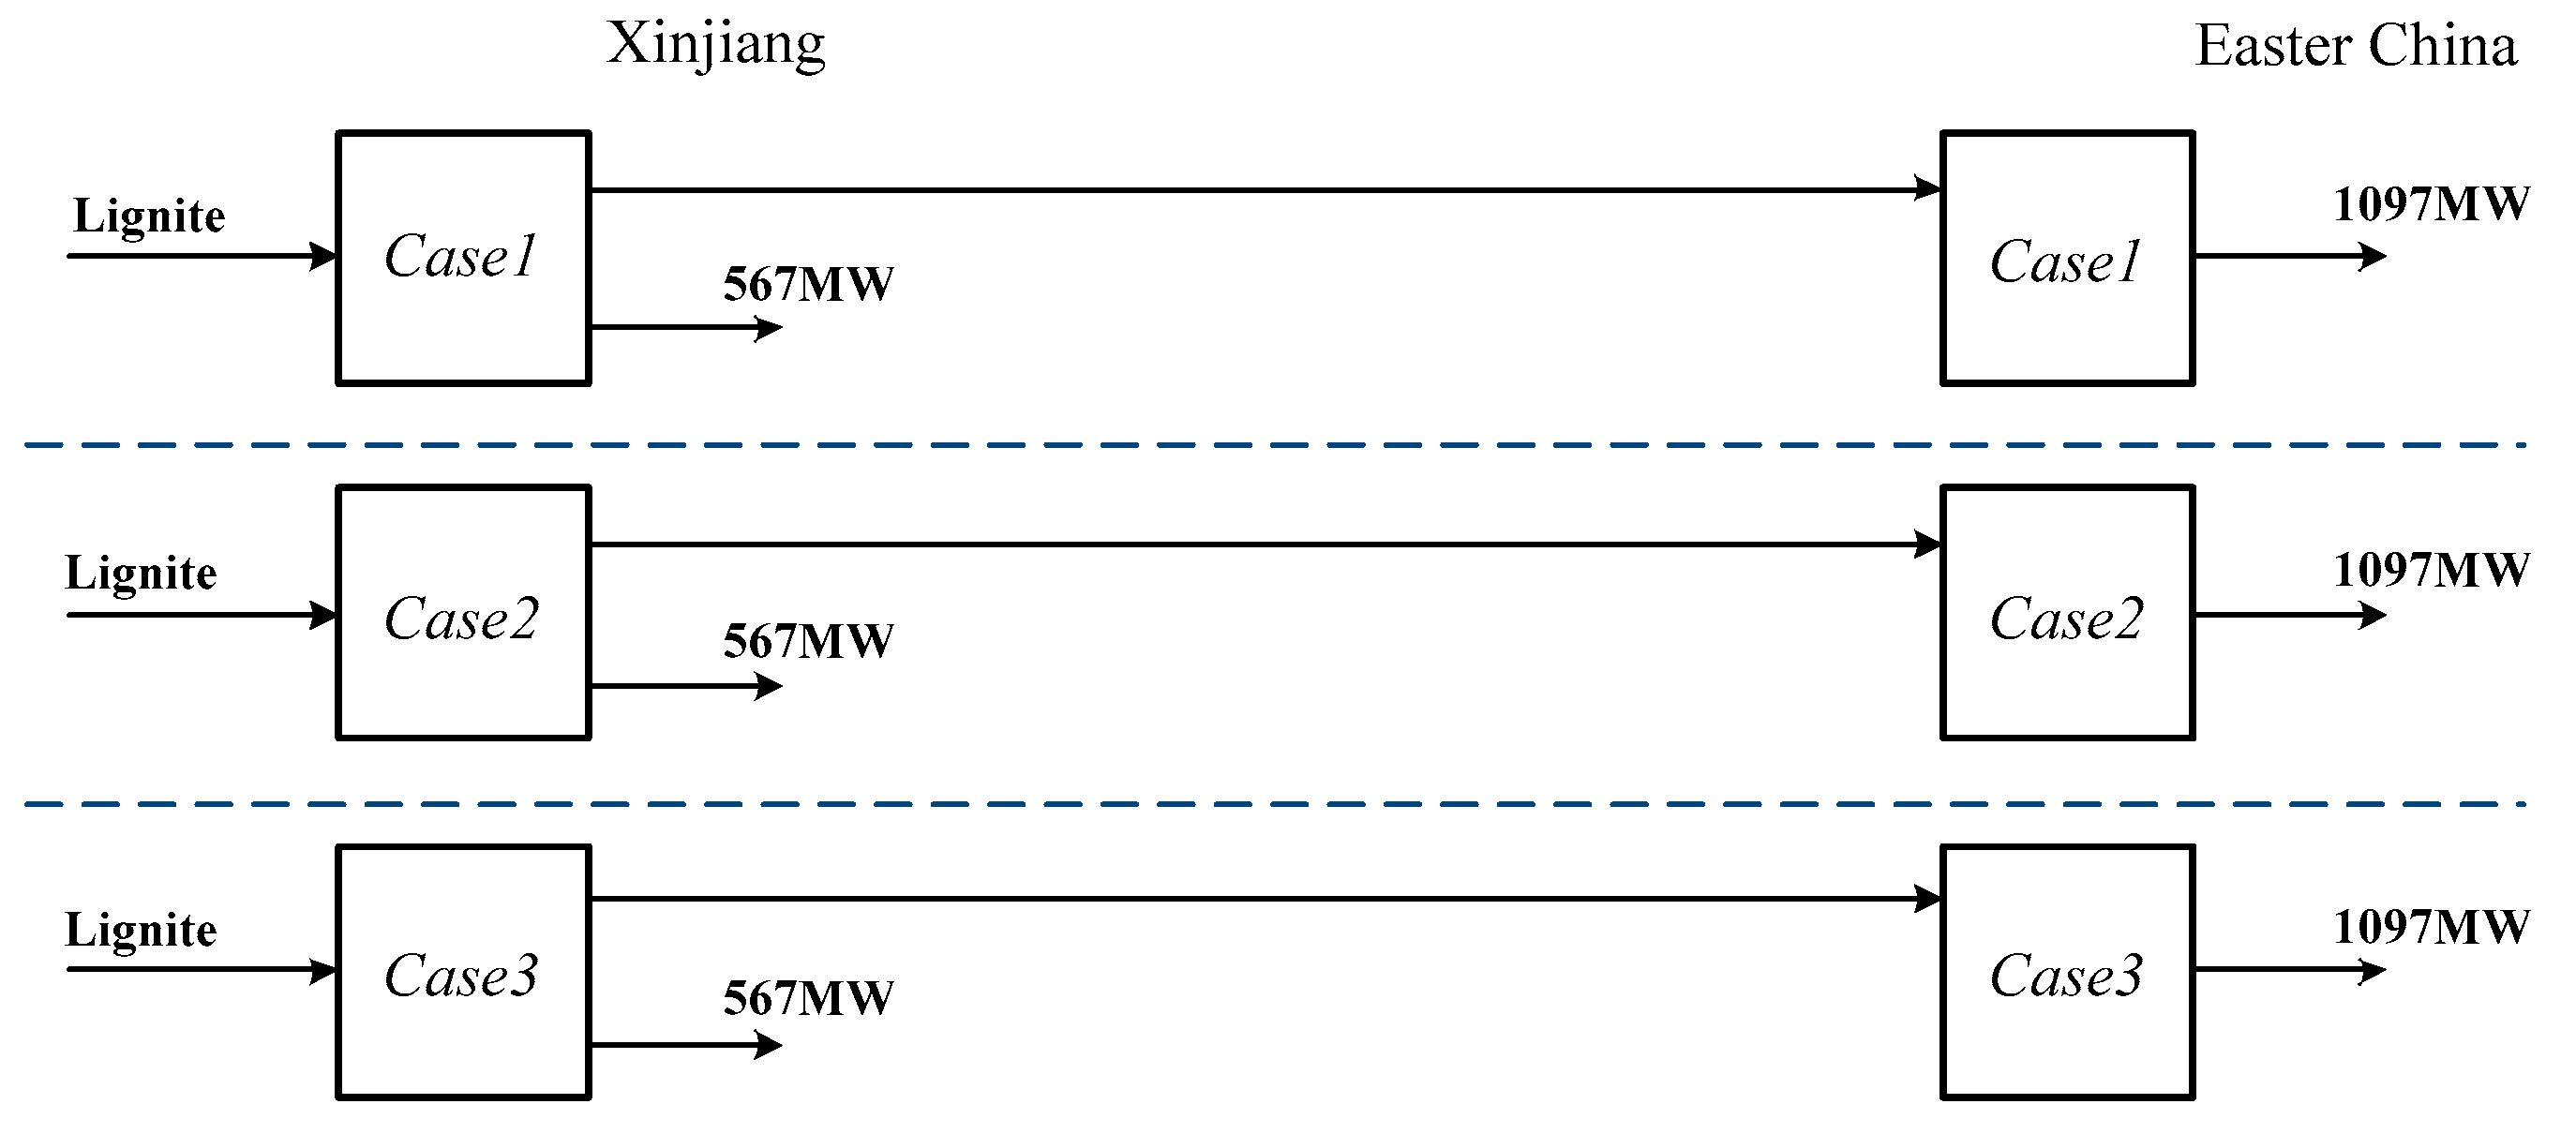
2.1.1. Case 1: Low-Rank Coal Fueled Power Generation and Electric Power Transmission

Figure 1 depicts a scheme of direct-fired low-rank coal for power generation in Xinjiang, in which part of the generated electric power is used locally and the rest is transported to eastern China by the gird. Obviously, in the west China, it is necessary to build several new power plants with suitable capacity to satisfy both the local consumption and long distance electric power transmission. The energy loss occurs in both power generation process and the electric power transmission. From the perspective of the whole life scale, the pollutant and greenhouse gases of the power plants construction should be considered.
Because of the high moisture content and low calorific value of low-rank coal, this power generation method is inefficient and seriously pollutes the environment.

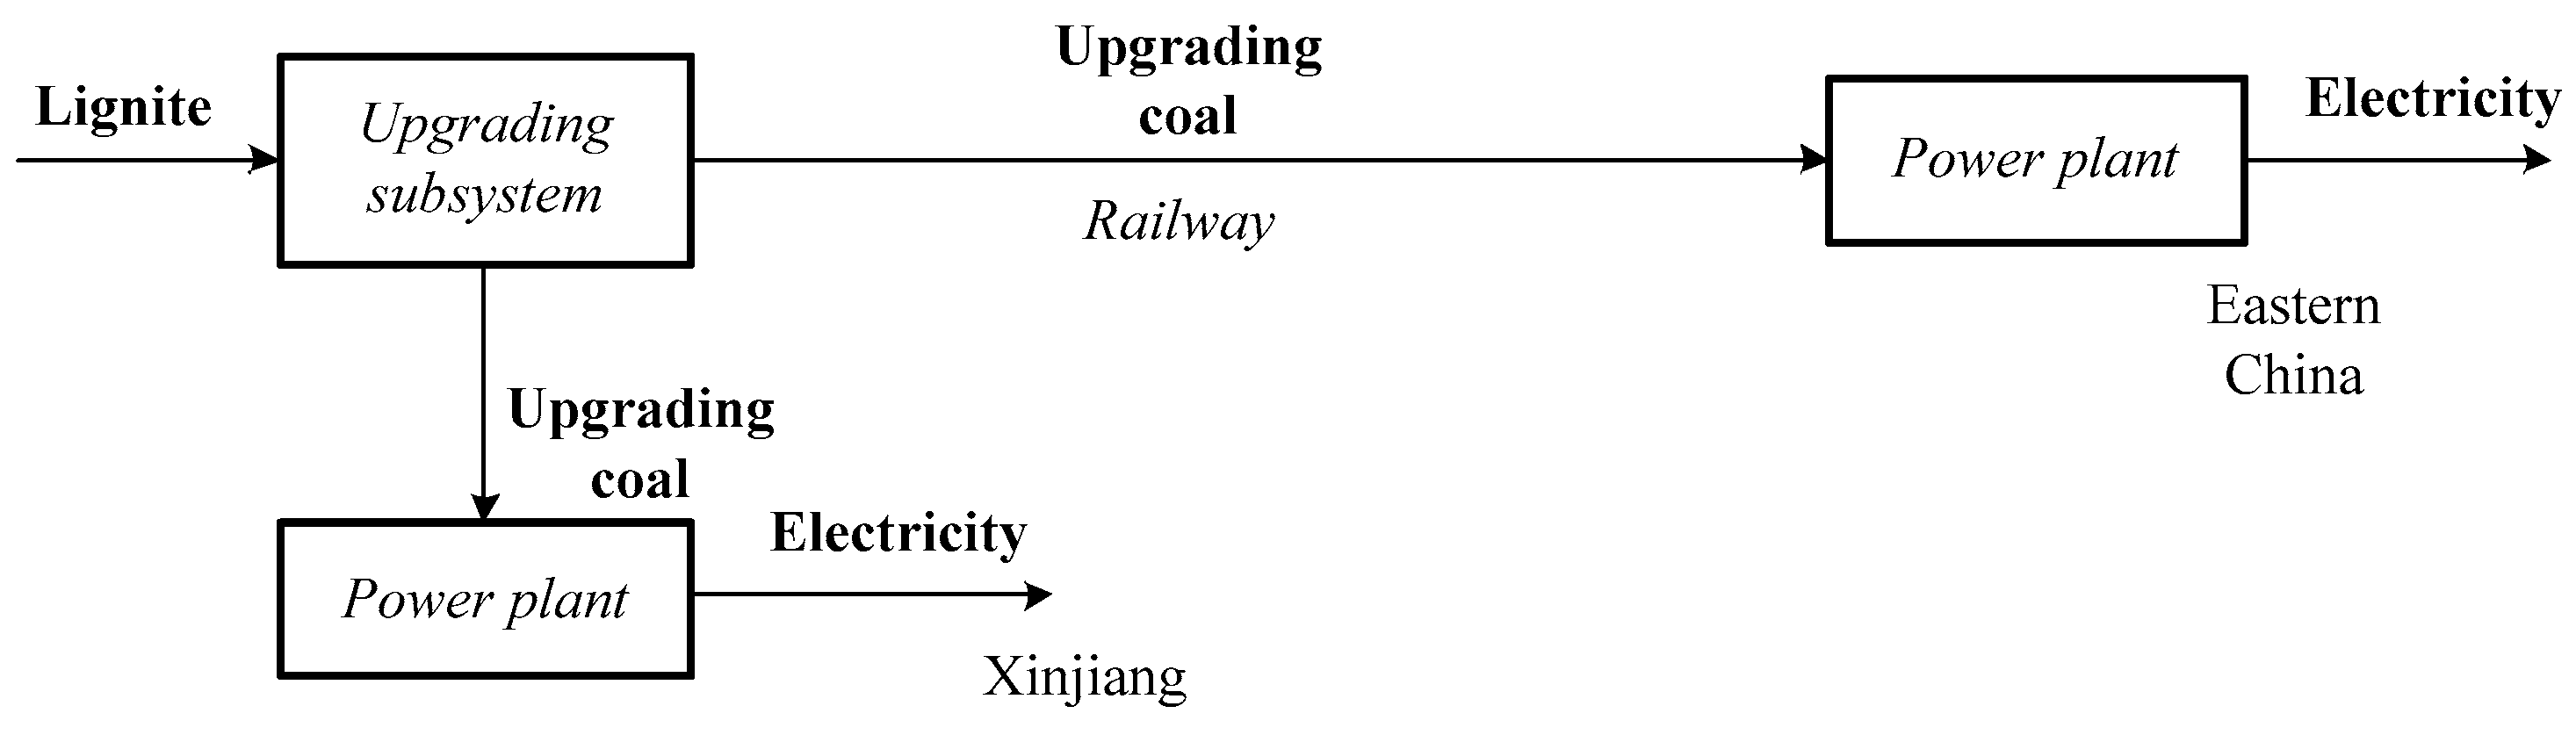
2.1.2. Case 2: Conventional Low-Rank Coal Upgrading and Upgraded Coal (UGC) Transportation

Figure 2 depicts the concept of the conventional low-rank coal upgrading, power generation, and upgraded coal transportation pattern. Compared with Case 1, the local low-rank coal is first upgraded to increase its caloric value, and then, part of the upgraded coal product is used for power generation in Xinjiang province, and the rest upgraded coal is transported by the railway to eastern China. Clearly, the power generation efficiency of power plants in Xinjiang province would be greater than that the Case 1. From the perspective of the whole life scale, the pollutant and greenhouse gases of the power plants construction, coal transportation, and railway construction should be considered.
By reducing the moisture content and propensity for spontaneous of low-rank coal through upgrading, safe and efficient transportation can be realized. However, the heat for upgrading comes from waste steam. Whether the power generation efficiency is improved or not in the whole life still needs to be studying.

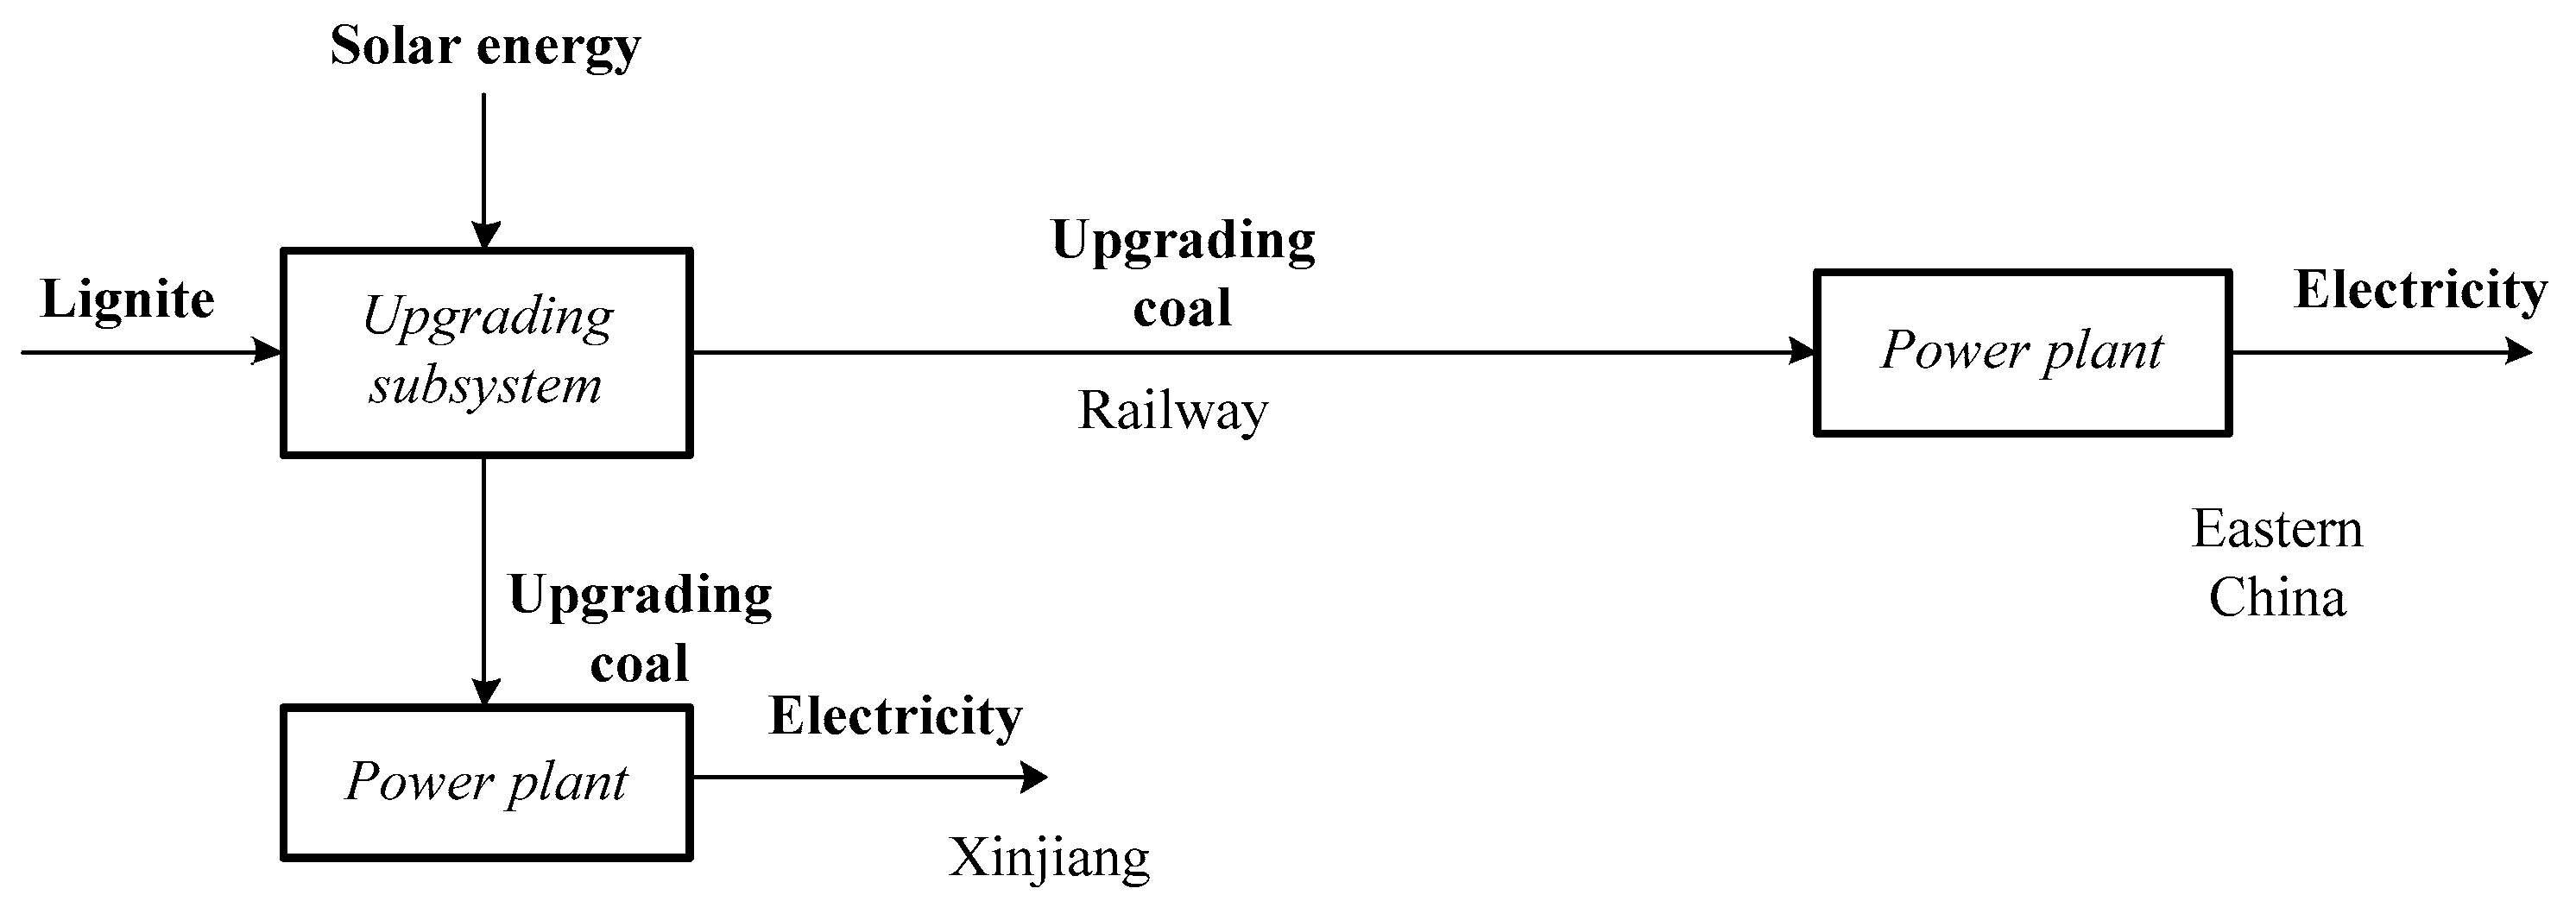
2.1.3. Case 3: Solar–Hybrid Coal Upgrading Power Generation and UGC Transportation

Figure 3 depicts the scheme of solar–hybrid upgrading, power generation and upgraded coal transportation pattern. The low-rank coal will be upgraded in Xinjiang province using the solar energy. Part of the upgraded coal will be consumed to generate electricity locally, and the rest will be transported by the railway to the eastern China to generate electricity. Comparing with the conventional low-rank coal upgrading technologies, the required heat is provided by solar energy rather than fossil fuel combustion, which decreases the fuel consumption and GHG emissions. Clearly, in this case, from the perspective of the whole life scale, in addition to the pollutant and GHG emissions from the power plants construction, the solar field related materials production and manufacture process will also bring about pollutant and GHG emissions.
Compared with Case 2, solar energy is aided, which can provide the heat for upgrading and reduce the heat consumption of coal.

2.2. Initial Conditions and Assumptions

This study follows the principle of equal power production, which is based on minimum upgrading and generating unit of the Case 2 proposed by Xu [9]. Figure 4 shows the principle of power generation calculation. The unit consists of an upgrading system and three 600MW generator sets, where 197kg/s lignite can be converted into 567MW electric energy and 84.1kg/s UGC. 84.1kg/s UGC can generate 1097 MW electricity for the user-side in eastern China. In order to compare the performance of the three systems, it is necessary to ensure that Case 1 and Case 3 also supply 567MW of electricity locally and can produce upgraded coal that can supply 1097 MW of electricity for eastern China.
To simplify the calculation, some main assumptions are adopted here:
(1)
The operating hours for all power plants are calculated as 4500 hours per annum.
(2)
Both the electric power and upgraded coal transportation is 3000 km.
Additionally, some other detailed operation conditions are shown in Table 1 [9,11]. The average DNI is designed at 610 W/m2 [16] and the average efficiency of the solar collector is 56.2% [11].
Considering the setting of the exhaust gas and the flue gas compositions, the boiler efficiency of low-rank coal and UGC can reach 92.95% and 93.83%, respectively. Due to the improvement of the quality, the upgraded coal has higher boiler efficiency. Steam turbines and generators are mechanical components whose efficiency is hardly affected by the type of coal, so these two parameters are the same for the three cases. According to the main assumptions above, it can be calculated that the amount of coal used in each case are 201.3kg/s, 197.7 kg/s, and 191.4kg/s.

3. Life Cycle Assessment (LCA) Analysis

3.1. LCA Methodology

LCA is a theory based on the conservation of energy flow and material flow, which determine the scope and goal of the study. The traditional method to analyze the utilization of coal and solar energy usually only considers efficiency; emission is neglected. However, the emission of the whole life cycle such as the manufacture, transportation, and operation of the solar energy equipment should be considered.

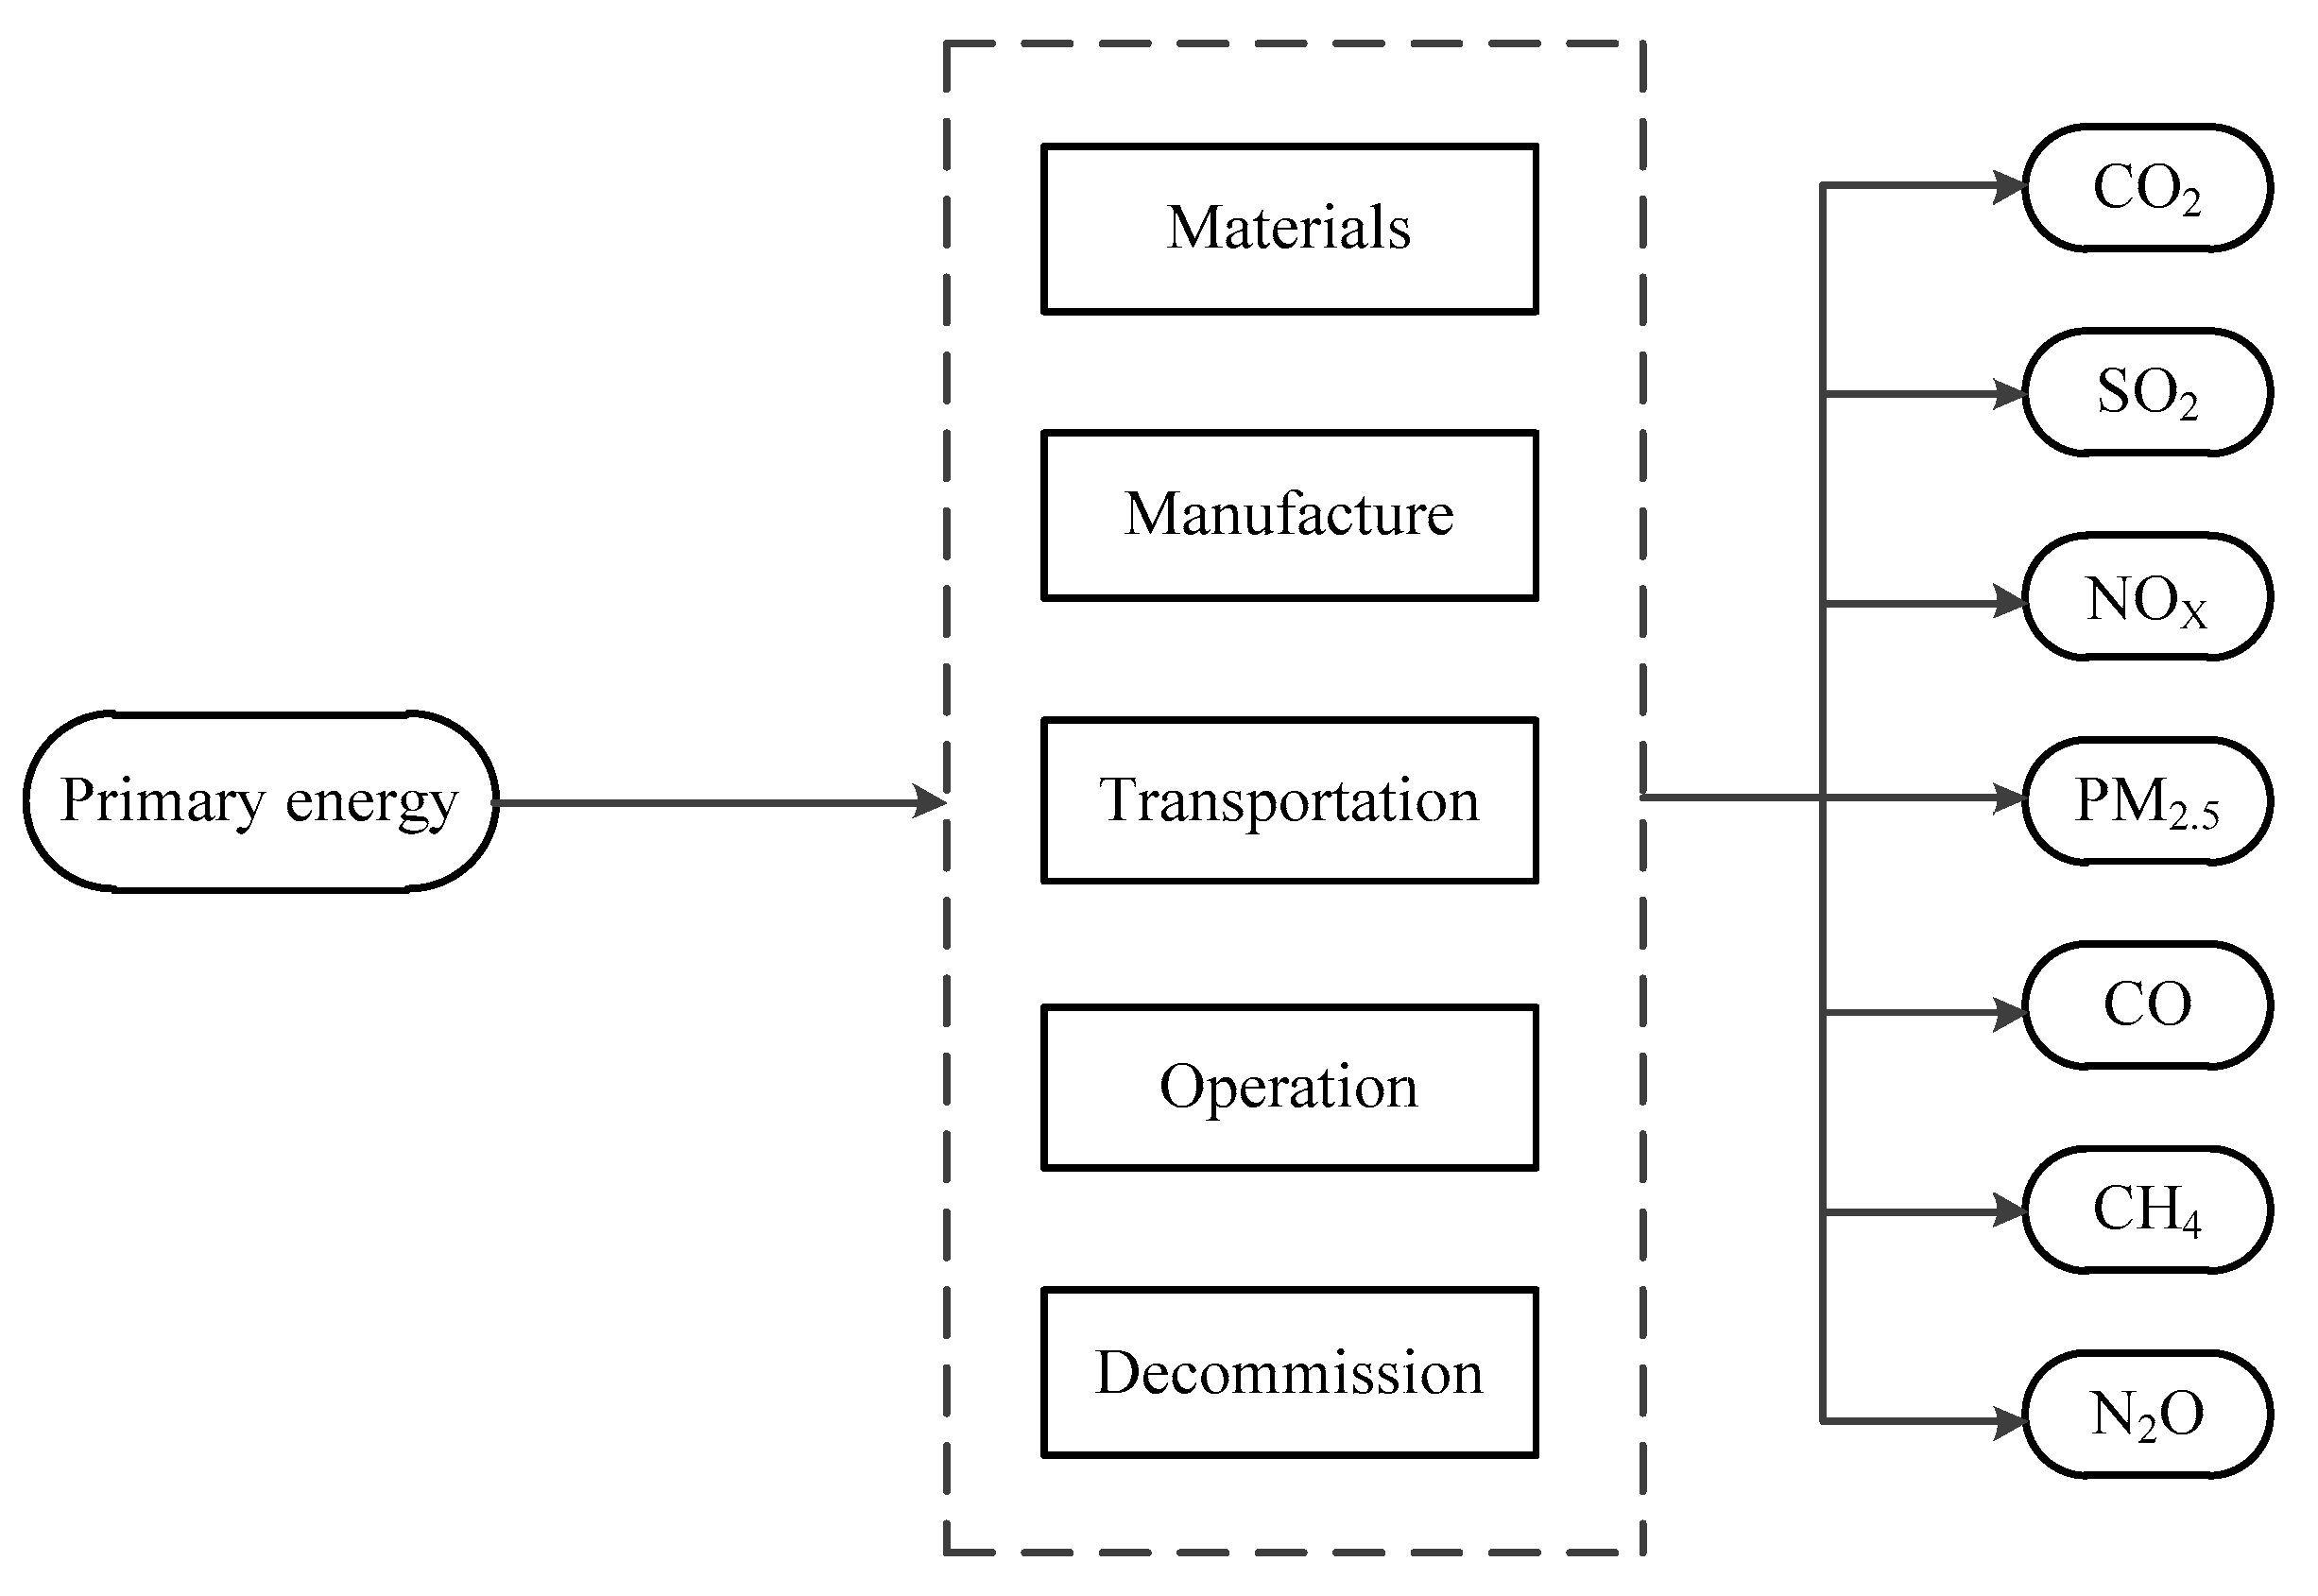
3.1.1. Goal and Scope

The goal and scope of the LCA analysis is shown in Figure 5 with the aim of calculating the primary energy consumption and the emissions of greenhouse gases such as CO2, CO, and CH4; acid gases such as SO2 and NOx; and particulate matter (PM) 2.5 of Cases 1–3. The scopes of the systems are materials, manufacture, transportation, operation, and decommission.
‘‘Materials” refers to the energy consumption and pollutant emissions in the process of exploitation and transportation of raw materials such as steel and glass for power plant equipment and upgrading equipment. ‘‘Manufacture” refers to the building process of each equipment unit and the power system, for example the boiler, turbine, generator, and other materials for construction. The “transportation” process is composed of two parts: one is the transportation of materials during the construction of power plants and the other is the transportation of coal. It is obvious that both the transportation of low-rank coal to the power plant and the transportation of the upgraded coal should be taken into account. In this study, two coal transportation patterns are considered railway and road. The “operation” process is mainly caused by fuel combustion, desulfurization, and the denitration process in power plants. The ‘‘decommission” phase refers to the energy consumption and pollutant emissions of the demolition process after the unit is retired. No clear policy exists on the disposal process. Thus, this stage is not considered.

3.1.2. Life Cycle Inventory

The measurement indexes of the systems consisting of primary energy consumption and pollutant emissions can be described by the following formulas.
E = E r m + E m f + E t r + E o p
P = P r m + P m f + P t r + P o p
where E is the primary energy consumption; Erm, Emf, Etr, and Eop are the primary energy consumption in materials, manufacture transportation, operation, and fuel stage, respectively; P is the pollutant emission mass vector, and Prm, Pmf, Ptr, and Pop are the pollutant emissions in materials, transportation, operation, and fuel stage, respectively.
Specifically, the elements that make up the vector Px are as follows
  P x = [ P x - CO 2 P x - SO 2 P x - NO x P x - PM 2.5 P x - CO P x - CH 4 P x - N 2 O ] T
where subscript “x” represents “rm”, “mf”, “tr”, and “op”.
As for the materials phase, the specific calculations can be obtained by
E r m = i = 1 5 j = 1 3 m j ( i ) × E r m ( j )
P r m , k = i = 1 5 j = 1 3 m j ( i ) × P r m , k ( j ) , ( k = 1 , 2 , , 7 )
where mj(i) represents the quality of the material j required for building the equipment i and Erm(j) and Prm,k(j) represent the primary energy consumption and the k-th pollutant emission mentioned in Equation (3) for 1 kg of material j, respectively. (i = 1, 2, 3, 4, and 5 represent generators and their auxiliary equipment, upgrading equipment, trough heat exchanger, power line, and pylon, respectively. j = 1, 2, and 3 represent steel, aluminum, and glass.)
For the manufacture phase, the specific calculation can be obtained by the following empirical formulas.
E m f = S × ( E g + E t )
P m f , k = S × ( P g , k + P t , k ) , ( k = 1 , 2 , , 7 )
where S is the generator capacity; Eg and Et are primary energy consumption of the steam turbine and boiler unit, respectively; Pg,k and Pg,k are the k-th pollutant emission of generating unit and boiler unit, respectively. (i = 1, 2, 3, 4, 5, 6, and 7 represent CO2, SO2, NOX, PM2.5, CO, CH4, and N2O, respectively.) The primary energy consumption and pollutant emission from the construction process of the long-distance electric power transmission, railways, and highways are long-standing and are beyond the LCA boundary, and thus it is not considered in this study.
For the transportation phase, the specific calculations can be obtained by
E t r = i = 1 5 j = 1 3 m j ( i ) × L j × E 1 + r = 1 2 c = 4 6 m c × L c × E r
P t r , k = i = 1 5 j = 1 3 m j ( i ) × L j × P 1 , k + r = 1 2 c = 4 6 m c × L c × P r , k , ( k = 1 , 2 , , 7 )
where Lj represents the distance traveled by the j-th material. (r = 1 and 2 represent road and railway, respectively. c = 4, 5, and 6 represent raw lignite, UGC without solar energy, and UGC with solar energy, respectively.)
For the operation phase, the specific calculations can be obtained by
E o p = c = 1 3 W c × η b , 1 × L H V 1 η b , c × L H V c + c = 1 3 W c × E D E , c L H V c × η b , c × η i × η g
P o p , k = c = 1 3 W c L H V c × η b , c × η t × η g × C c , k + c = 1 3 W c D E c × P D E c , k , ( k = 1 , 2 , , 7 )
where Wc represents the electric power generated from the coal as fuel. ηb,c is the the boiler efficiency of the coal; LHVc is the lower heating value of th coal. ηt and ηg are the efficiency of the steam turbine and generator, respectively; Cc,k is the pollutant emission of unit mass of the coal. This study only considers the denitration process because the emissions from the desulfurization process are quite small and are negligible compared with the denitration process. DEc is the relationship between the amount of ammonia and electricity by the coal. EDE,c and PDEc,k are primary energy consumption of the k-th pollution emission in the denitration process, respectively.
Table 2 is a summary of the meaning of the aforementioned numbers in these projects.
Taking environmental problems into account, the above-mentioned pollution can be summarized in three categories: globe warming potential (GWP), acidification potential (AP), and respiratory effects potential (REP), which can be recorded as CO2-eq, SO2-eq, and PM2.5-eq, respectively, by multiplying a row vector shown in Table 3 [17,18].
Through the conversion factors of the corresponding global warming potential, acidification potential, and respiratory effects potential, CO2-eq, SO2-eq, and PM2.5-eq can be obtained with the following formulas.
[ CO 2 eq ] = F G W P × P
[ SO 2 eq ] = F A P × P
[ PM 2.5 eq ] = F R E P × P

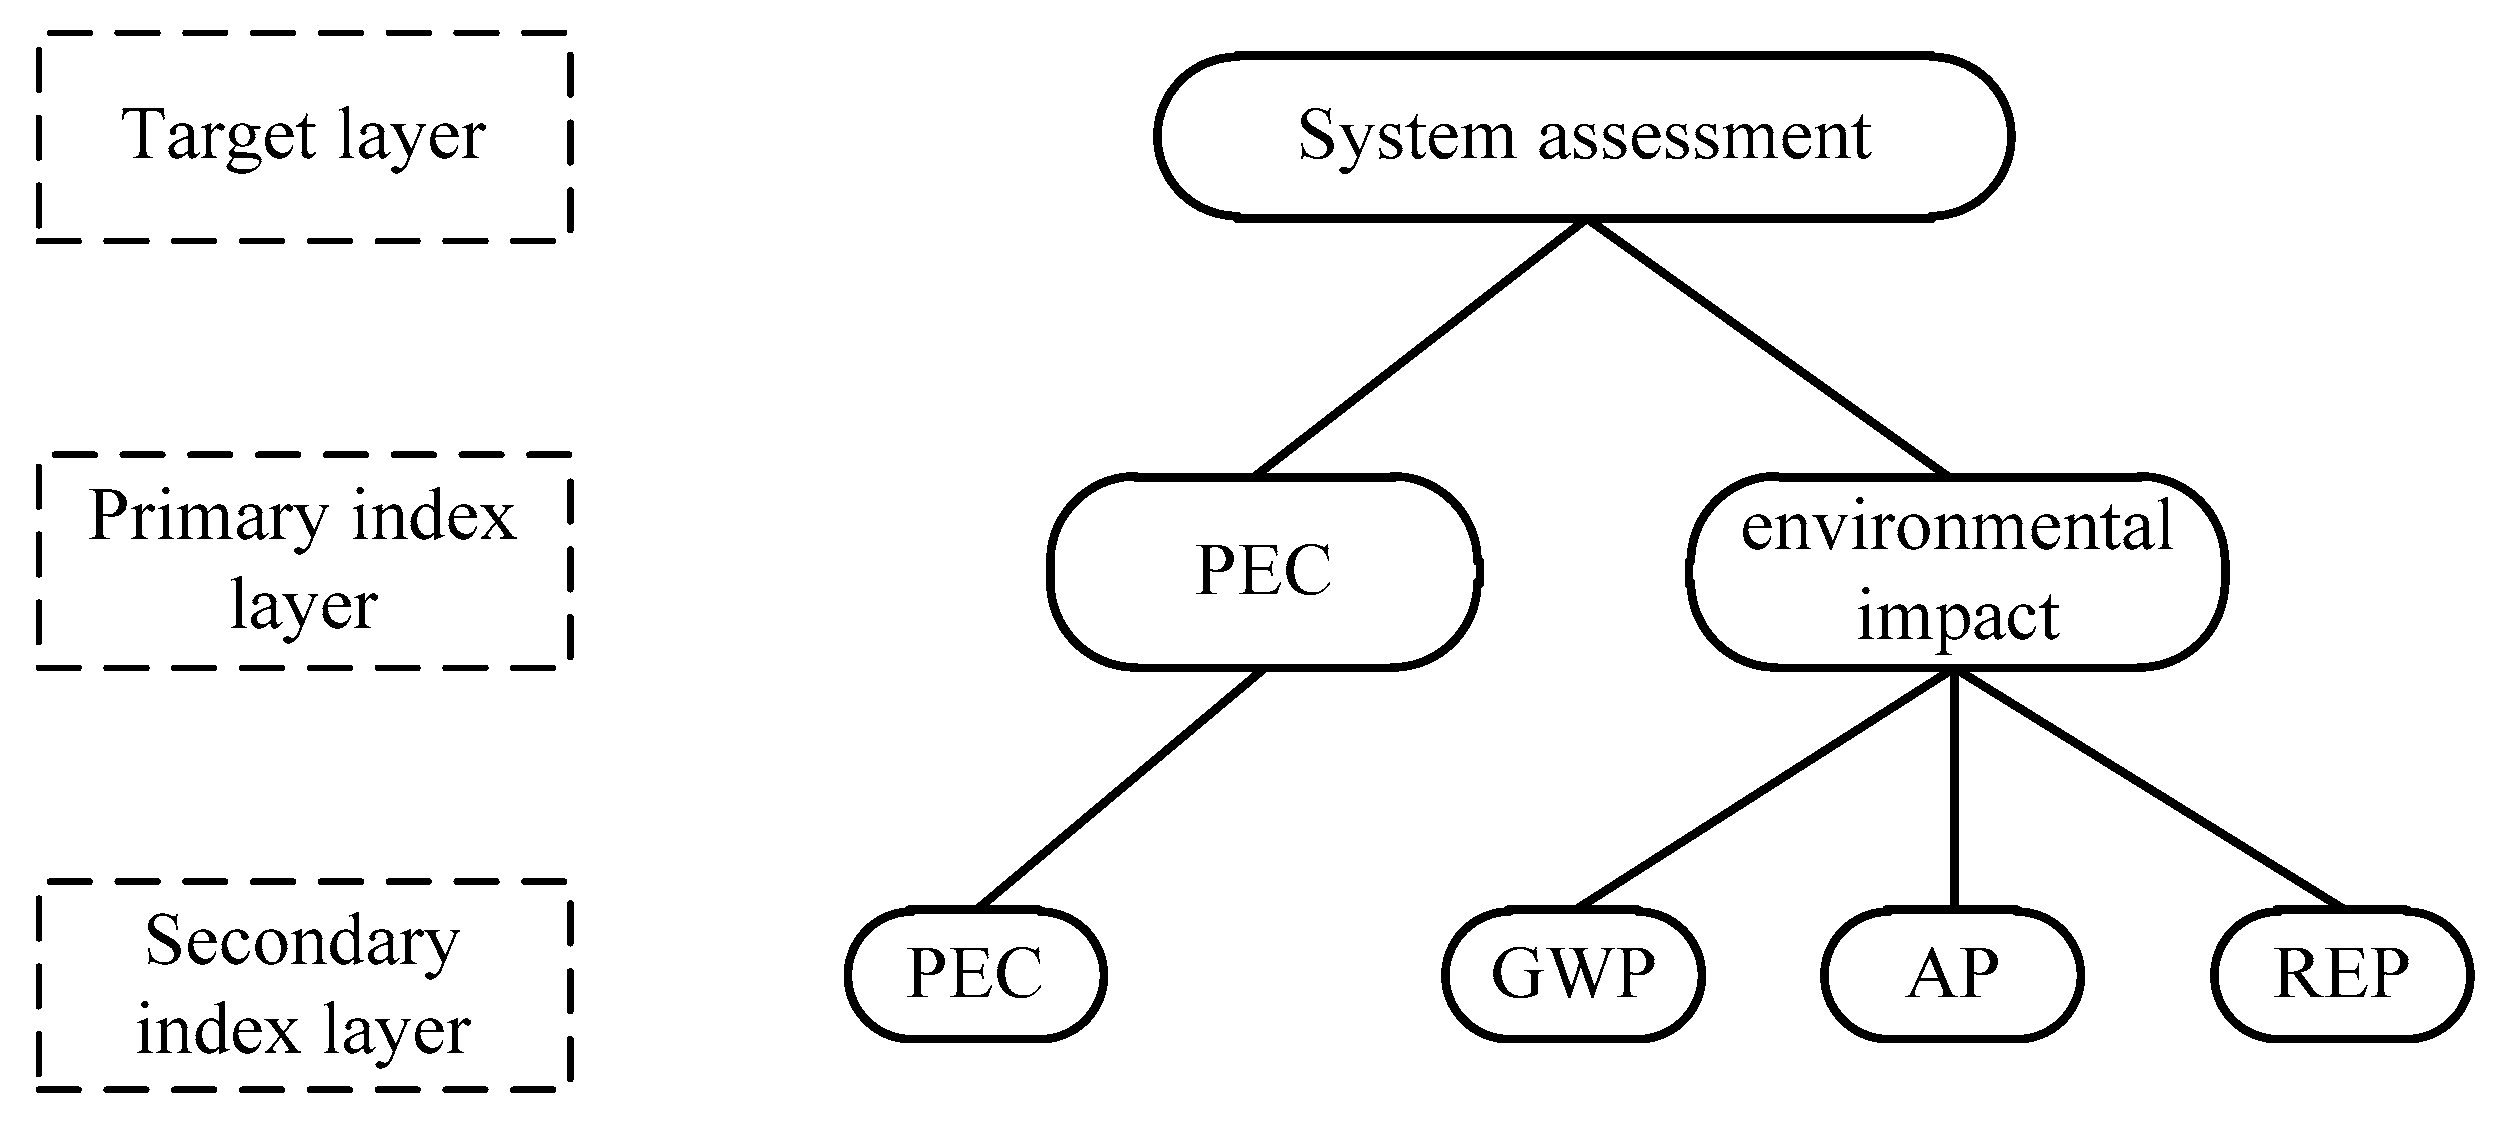
3.2. Analytic Hierarchy Process (AHP) Analysis

Taking primary energy consumption and environmental impact forms into account, this study adopted an integrated index based on analytic hierarchy process (AHP) introduced by Thomas L. Saaty [19]. AHP decomposes the relevant factors of complex systems into goals, criteria, and schemes. The corresponding scale is given and the judgment matrix is constructed by comparing the relative importance between the two factors. The scale objectively quantifies the subjective judgments of different types of factors, obtaining the weight values of different factors or evaluation objects to provide a basis for decision-making and evaluation of a complex system.
The comparison matrix is usually expressed in the following form.
A = ( a i j ) n × n = [ a 11 a 12 a 1 n a 21 a 22 a 2 n a n 1 a n 2 a n n ]
According to Saaty’s theory, the meaning of scale aij is shown in Table 4.
In AHP, it is necessary to check whether A is reasonable to confirm whether the weight vector is reasonable by consistency test. The constraint condition is as follows
C R = λ n n 1 × 1 R I < 0.1
where λ is defined as the maximum eigenvalue of matrix A. CR, RI, and n represent the consistency ratio, consistency indicator, and the order of A, respectively. For the different n, Saaty has figured out the consistency indicator on Table 5.
For an N-layer model, the weight vector of the lowest layer to the target layer, w(N) can be calculated by the following formulas.
W ( k ) = [ w 1 ( k ) w 2 ( k ) w m k ( k ) ]
w ( N ) = W ( N ) × W ( N 1 ) × × W ( 3 ) × w ( 2 )
where wi(k) is the k-th weight vector for the i-th index in the (k − 1)-th layer.

3.2.1. Hierarchical Model

According to the nature of the goal, the goal is divided into different hierarchical structures, such as the target layer, primary index layer and the secondary index layer. The upper layer has a dominant relationship with the next layer. Based on the AHP, the life cycle assessments of these three systems comprehensively consider the primary energy consumption (PEC) and environmental impact, and a hierarchical result model should be required. As shown in Figure 6, PEC and environmental impact comprise the primary indicator level, and environmental impact, including GWP, AP, and REP, comprises the secondary indicator layer.
Where GWP, AP, REP, and PEC are the global warming potential, acidification potential, respiratory effects potential, and primary energy consumption, respectively.

3.2.2. Object Function

To achieve the object function, the relationship between GWP, AP, REP, and PEC should be established. First of all, the dimensions should be unified. As a result, all variables should be divided by their base values to convert them to standard values:
G W P ( E P ) = CO 2 eq CO 2 eq ( B a s e )
A P ( E P ) = SO 2 eq SO 2 eq ( B a s e )
R E P ( E P ) = PM 2.5 eq PM 2.5 eq ( B a s e )
P E C ( E P ) = P E C P E C ( B a s e )
The base values of the environmental impact factors are usually the total emission of a geographical range. This article adopts the air quality of China, GB3095-2012 [20], which is the total emission on average to population. The object functions derived from AHP can be expressed in the following form.
F = α 1 · G W P ( E P ) + α 2 · A P ( E P ) + α 3 · R E P ( E P ) + α 4 · P E C ( E P )
where α1, α2, α3, and α4 are elements of weight vector w; F is the value of the objective function, of which the unit is the product of population and year (p·y). Its meaning can be understood as the equivalent resident population living consumption [21]. However, the actual situation is diverse. As a result, this article will analyze these data from two dimensions: region and perspective, nine cases totally.

4. Case Study

4.1. Basic Data for LCA Analysis

For the material stage, the materials to build the three systems, the energy consumption, and emission levels of these materials, and the emissions and energy consumption of transporting these materials to the power station need to be considered. The pollutant emissions and primary energy consumption (PEC) of the unit raw materials in the construction phase are shown in Table 6 [22]. These emissions in this table are mainly produced in the exploitation, processing and transportation of raw materials. The specific materials of the adopted equipment are shown in Table 7 [23]. These are the main materials for building power plants; some of the materials that are rarely used have been ignored. For the manufacture phase, the basic data for the plant manufacturing is shown in Table 8 [24]. These emissions are converted according to the manufacturing capacity of the thermal power plant. Particularly, in Case 3, the materials and manufacturing process of the solar energy upgrading equipment should be considered separately. The total energy consumption and pollution emissions of the materials and manufacturing processes can be calculated according to the area. The specific data are shown in Table 9 and Table 10 [11]. The upgrading equipment is mainly composed of solar panel and trough heat exchanger. The transportation of the equipment is mainly determined by the transportation distance and the weight of the equipment. The specific data are shown in Table 11 and Table 12 [23]. In the operation phase, both the fuel combustion process and the desulfurization and denitration processes are considered. In these three cases, the composition of coal is shown in Table 13 [25], which is the basic data used to calculate coal emissions. The comparison of flue gas composition with and without removal device can be calculated and shown in Table 14. The relationship between the amounts of ammonia and coal is shown in Table 15 [26], which shows the amount of ammonia used for denitrification when using the corresponding coal for 1 kWh electricity. PEC and pollution emissions from the manufacture of ammonia are shown in Table 16. In addition, SO2, NOX, and dust within the flue gas must be removed before being released into the atmosphere; PEC has been calculated as standard value.
Although the cases investigated in this study are located in China, due to the diffusivity of polluting gases, the system’s pollution emissions will inevitably have a global impact. Therefore, in addition to considering local and regional impacts, global impacts must be considered as well. As a result, the performance of the system should be assessed from local, regional, and global perspectives. Global regions are usually divided into developed regions, developing regions, and underdeveloped regions. Combined with different perspectives, there are nine situations that need to be considered in total [27]. The AHP comparison matrices of the target of different region are shown in Table 17 [28]. The comparison matrices of the environmental impact of different perspectives are shown in Table 18 [28]. These matrices reflect the relative importance between different emissions and PEC in different regions and at different perspective of view. The standardized base values for environmental impact factors are shown in Table 19 [20]. The base values in this table reflect the contribution of GWP, AP, REP, and PEC to the environment impact. Then weight vector w can be calculated with Equation(16) and Equation(17).

4.2. Results and Discussion

According to eqts.1–11, the main pollutant emissions and primary energy consumption of these three systems are listed in the Table A1 and Table A2. It can be found that the pollutant emissions and PEC in the combustion phase is far greater than the other phases. The pollution emissions and PEC during transportation are almost negligible. In addition, it can be found that the manufacturing process of solar equipment will produce 30152062.08 kg CO2. It is worth notation that LCA is more comprehensive than conventional power plant analysis methods. Especially for solar energy generation processes, traditional analytical methods usually only calculate the energy conversion rate without considering the pollution emissions and PEC in the preparation process to use the energy [29], but the results of LCA indicates that the process of creating conditions for utilizing solar energy also has emissions and PEC. Figure 7 shows the normalized pollutant emissions and PEC over the whole life cycle. From it we can find that CO2 emissions are mainly produced by coal combustion during the operational phase, which account for more than 90% throughout the life cycle, because the main component of coal is carbon. Other pollutant emissions are mainly caused by materials, The SO2, NOX, and PM2.5 emissions of materials accounted for nearly 60% and the CO, CH4, and N2O accounted for more than 90% because pollutant emissions from the production of materials are diverse. Compared with low-rank coal direct power generation, low-rank coal upgraded power generation has obvious advantages in reducing greenhouse gas emissions and reducing resource consumption. For CO2, Case 3 performs best because it uses solar energy to provide process heat for coal upgrading, reducing coal consumption. For CO emissions, both Cases 2 and 3 are higher than Case 1. This difference is mainly caused by transportation, because exhaust of the vehicle contains a large amount of CO. Figure 8 shows GWP, AP, and REP of these three systems over the whole life cycle. It is clear that Case1 has the highest level and Case3 has the lowest for these three indicators. Combustion has the largest proportion in GWP, which is because the greenhouse effect of thermal power plants is mainly generated and operated. AP and REP are mainly caused by other stages, especially materials, because the production of materials, such as iron and glass, produces pollutants with acidification potential and respiratory effects. UGC systems are superior to lignite system in these three indicators, especially AP and REP, because lignite contains a lot of sulfur and nitrogen impurities, while UGC removes some impurities. The reason why GWP of Case 3 is lower than the other two systems is that it uses solar energy to provide energy for the coal drying process.
According to Equations (12) and (13), the weight vector of PEC, GWP, AP, and REP in different regions and from different perspectives can be calculated; the results are shown in Table 20. It should be noticed that the environmental impact share caused by the same environmental impact type is significantly different from these three perspectives. The life cycle assessment of a system cannot be limited to local or a single situation. It is also necessary to consider its impact on a region, or the world, and analyze its scope of application; in different situations, there are different objective functions. From a global perspective, the most important environmental impact type is GWP, and its evaluation weight accounts for more than 60%. GWP has not received such great attention locally, where its weight is 33%. Primary energy consumption varies significantly depending on the degree of development of the region. Developed regions and moderately developed regions do not pay much attention to primary energy consumption, while in underdeveloped regions the primary energy consumption has a higher evaluation weight, which reveals that developed regions may be better at using natural resources to create economic benefits [30].
The comprehensive evaluation results of each indicator using AHP are shown in Figure 9. The types of emissions are often diverse. Only one type of emission is considered comprehensive. In addition, PEC should also be considered. Compared with the method of multiplying each index by a subjective coefficient and summing [31], AHP is more objective and persuasive. The AHP object functions F come from three perspectives for three levels of development of Cases 1–3, whose meaning can be understood as the equivalent resident population living consumption. From a local perspective, the value of F for the developed region is the smallest, indicating that these cases of long-distance energy transportation are the most acceptable for developed regions. It is worth noting that this is seen from the perspective of local users. Obviously, users in eastern China are suitable for this method. Specifically, Case 3 is the best for eastern China. Moreover, it can be found that in all situations, Case3 is always doing well, which means that the scope of application of Case3 is wide and can adapt to the requirements of different developed regions.

4.3. Sensitive Analysis

The sensitivity analysis of the systems analyzes some of the main factors affecting the performance of the system. The method is to make certain parameters of the system change within a certain range then observe the evaluation results to summarize the conclusions. It does not require analysis of all factors, but only those that are important or influential. In the study of this paper, there are two most important parameters for life cycle assessment: life cycle time pan and global per capita CO2 emission equivalent.

4.3.1. Effect of Life Span

Under normal circumstances, coal-fired power plants can last up to 30 years. The life cycle of the calculated case in this paper is calculated in 25 years. In the sensitivity analysis, we will discuss the performance of the three systems of 20–30year life span. The results are shown as follows. Figure 10, Figure 11 and Figure 12 reflect the impact of the life span on total emissions. It can be found that in the interval of 20 to 30 years, emissions are growing at an approximately constant rate, and the GWP of Case 3 is always significantly lower than the other two systems. With increasing span time, the gap between the emission of the systems with upgrading phase and that of the system without upgrading phase is gradually increased because the impact of the fixed investment of the previous upgrading equipment on the whole life cycle is gradually reduced. Figure 10, Figure 11 and Figure 12 reflect the impact of the life cycle on the average annual emissions equivalent. By calculating the annual average emissions, it is possible to more intuitively observe the changes in the performance of the systems with the life span. It can be seen from the figures that as the life of the system increases, the performance of the systems gradually increases.

4.3.2. Effect of Total Global Pollution Emissions

On the whole, the effect of unit discharge of pollutants on the environment will vary with the total global emissions, in other words, the impact of pollution emissions on the environment is nonlinear. Therefore, when assessing the performance of the system, it is also necessary to consider global pollution emissions. The greenhouse effect is the most globalized, so the sensitivity of the greenhouse effect to the objective function of the evaluation is analyzed. We took the global annual per capita CO2 emission equivalent as a variable, and the results are as shown in Figure 13. It can be seen that in the case of an increase in global greenhouse gas emissions, the equivalent resident population living consumption of these three systems will decrease, but this cannot be mistaken for they with less emissions as the environment deteriorates. Rather, under this polluted condition, the emission share caused by the systems is reduced. Therefore, comparing the three systems makes more sense. Regardless of whether global CO2-eq is large or small, Case 3 is always more competitive than the other two systems. However, as CO2-eq continues to increase, the advantage of Case 3 over Case 2 will decrease.

5. Conclusions

In this study, the main study object is a solar hybrid low-rank coal upgrading and power generation system; the reference systems are also studied accordingly. According to LCA, The results show the following.
(1)
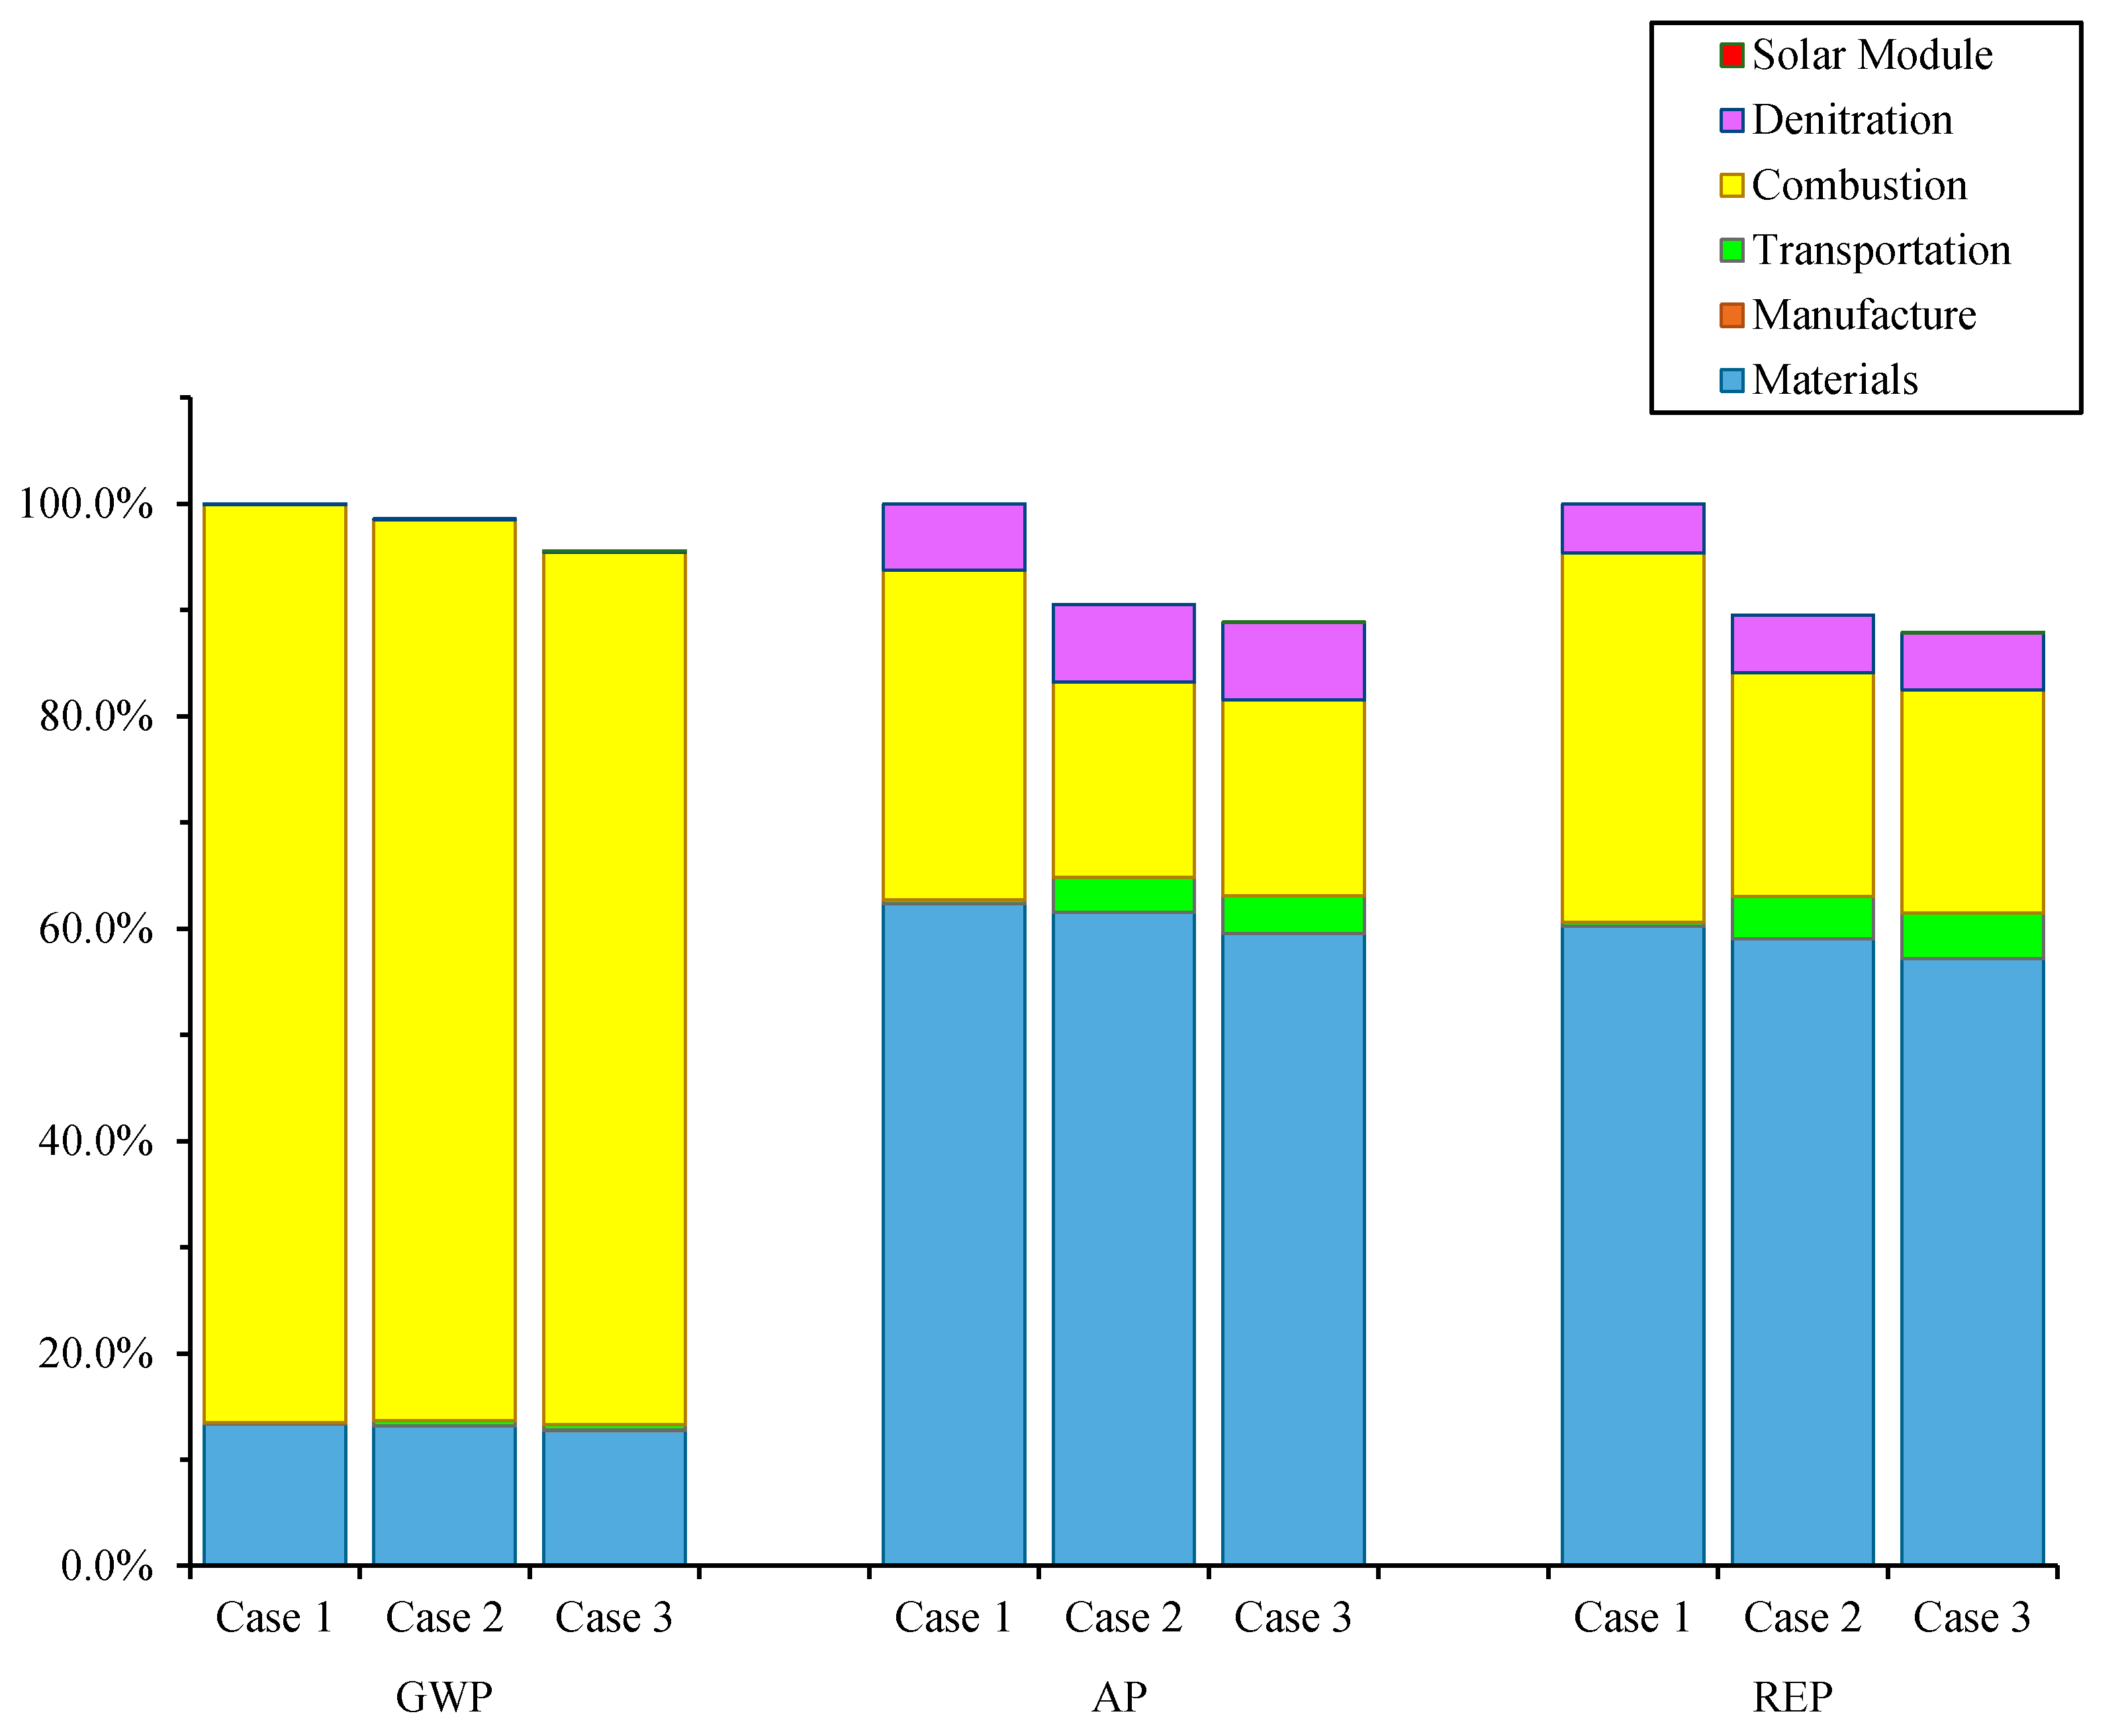
From the perspective of the whole life cycle, upgrading the low-rank coal to power generation will help reduce pollution emissions and primary energy consumption. Whether it is solar upgrading or traditional nonsolar upgrading, it has a significant effect in reducing the acidification potential of the system and the potential of respiratory effects, but the traditional upgrading is not effective in reducing the greenhouse effect potential of the system, while the effect of the solar upgrading system is clear.
(2)
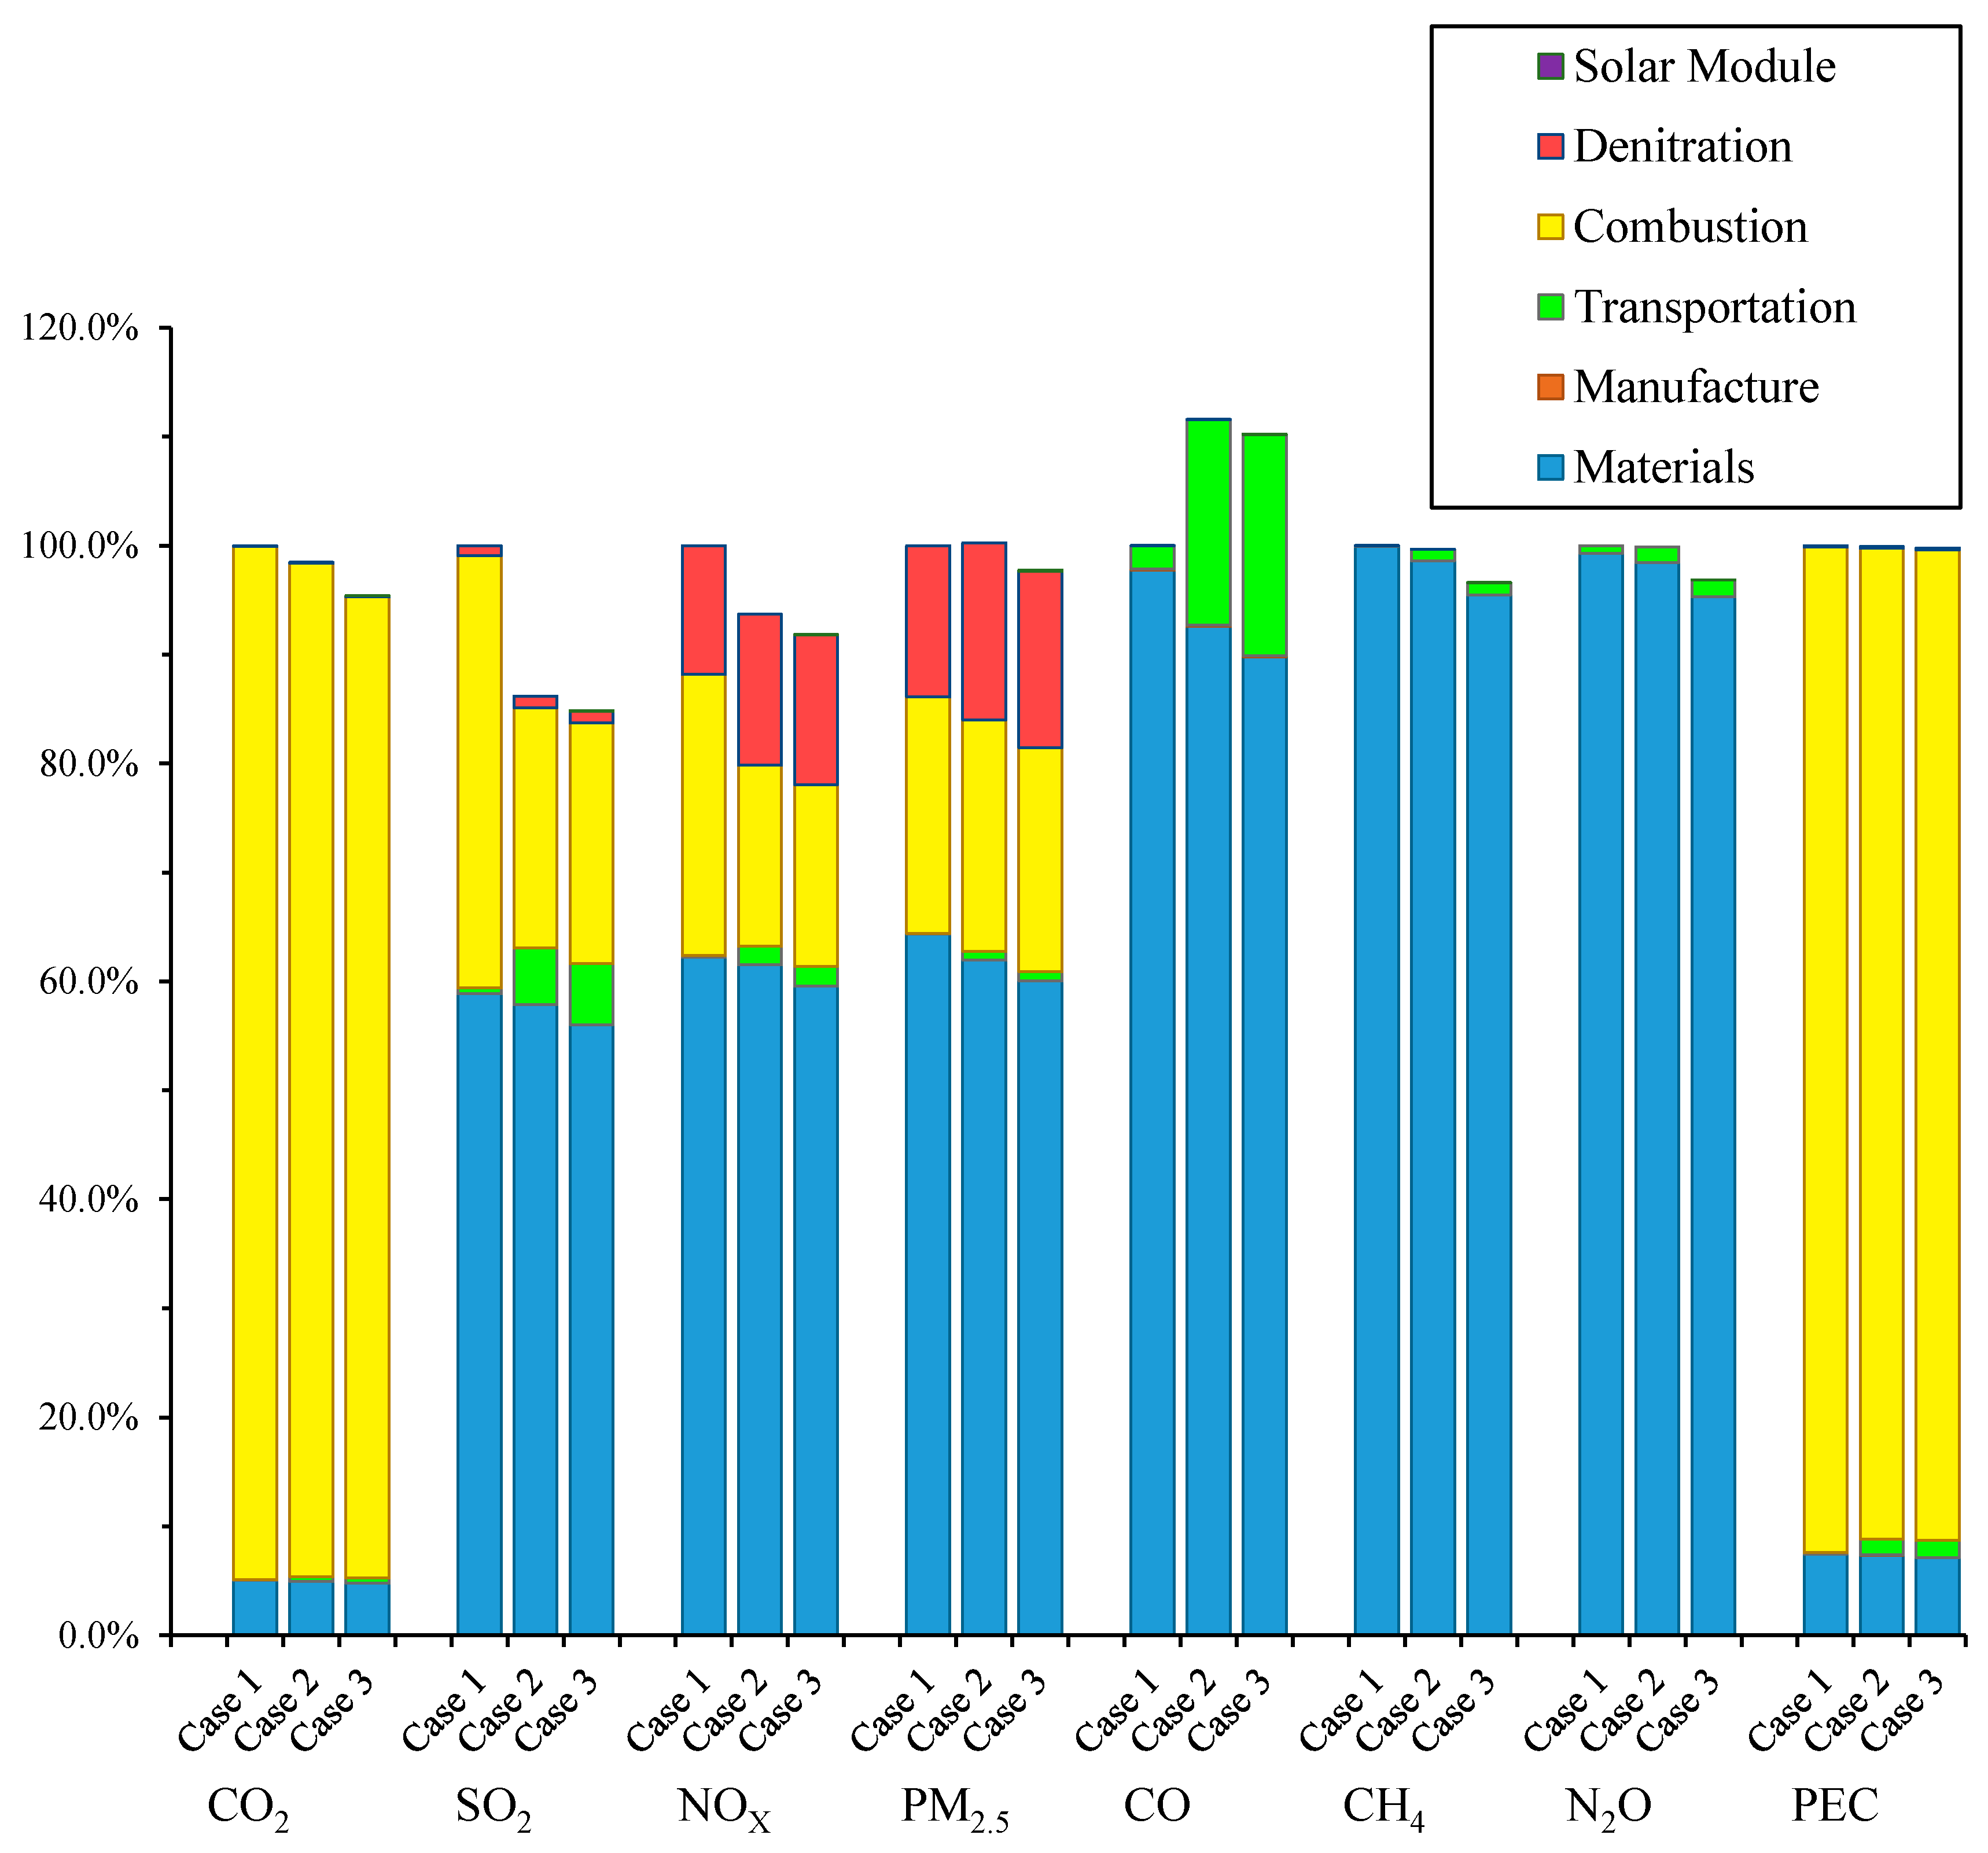
Pollution emissions and primary energy consumption are mainly concentrated in the operational phase, which produces more than 90% CO2 and consumes more than 90% primary energy of the life cycle. As a result the greenhouse effect potential of the system depends mainly on this stage. Emissions and consumption during coal transportation are only a small fraction of the total. Manufacturing coal upgrading equipment and solar energy collection equipment also account for a small percentage. This shows that it is feasible to carry out long-distance transportation after upgrading low-rank coal.
(3)
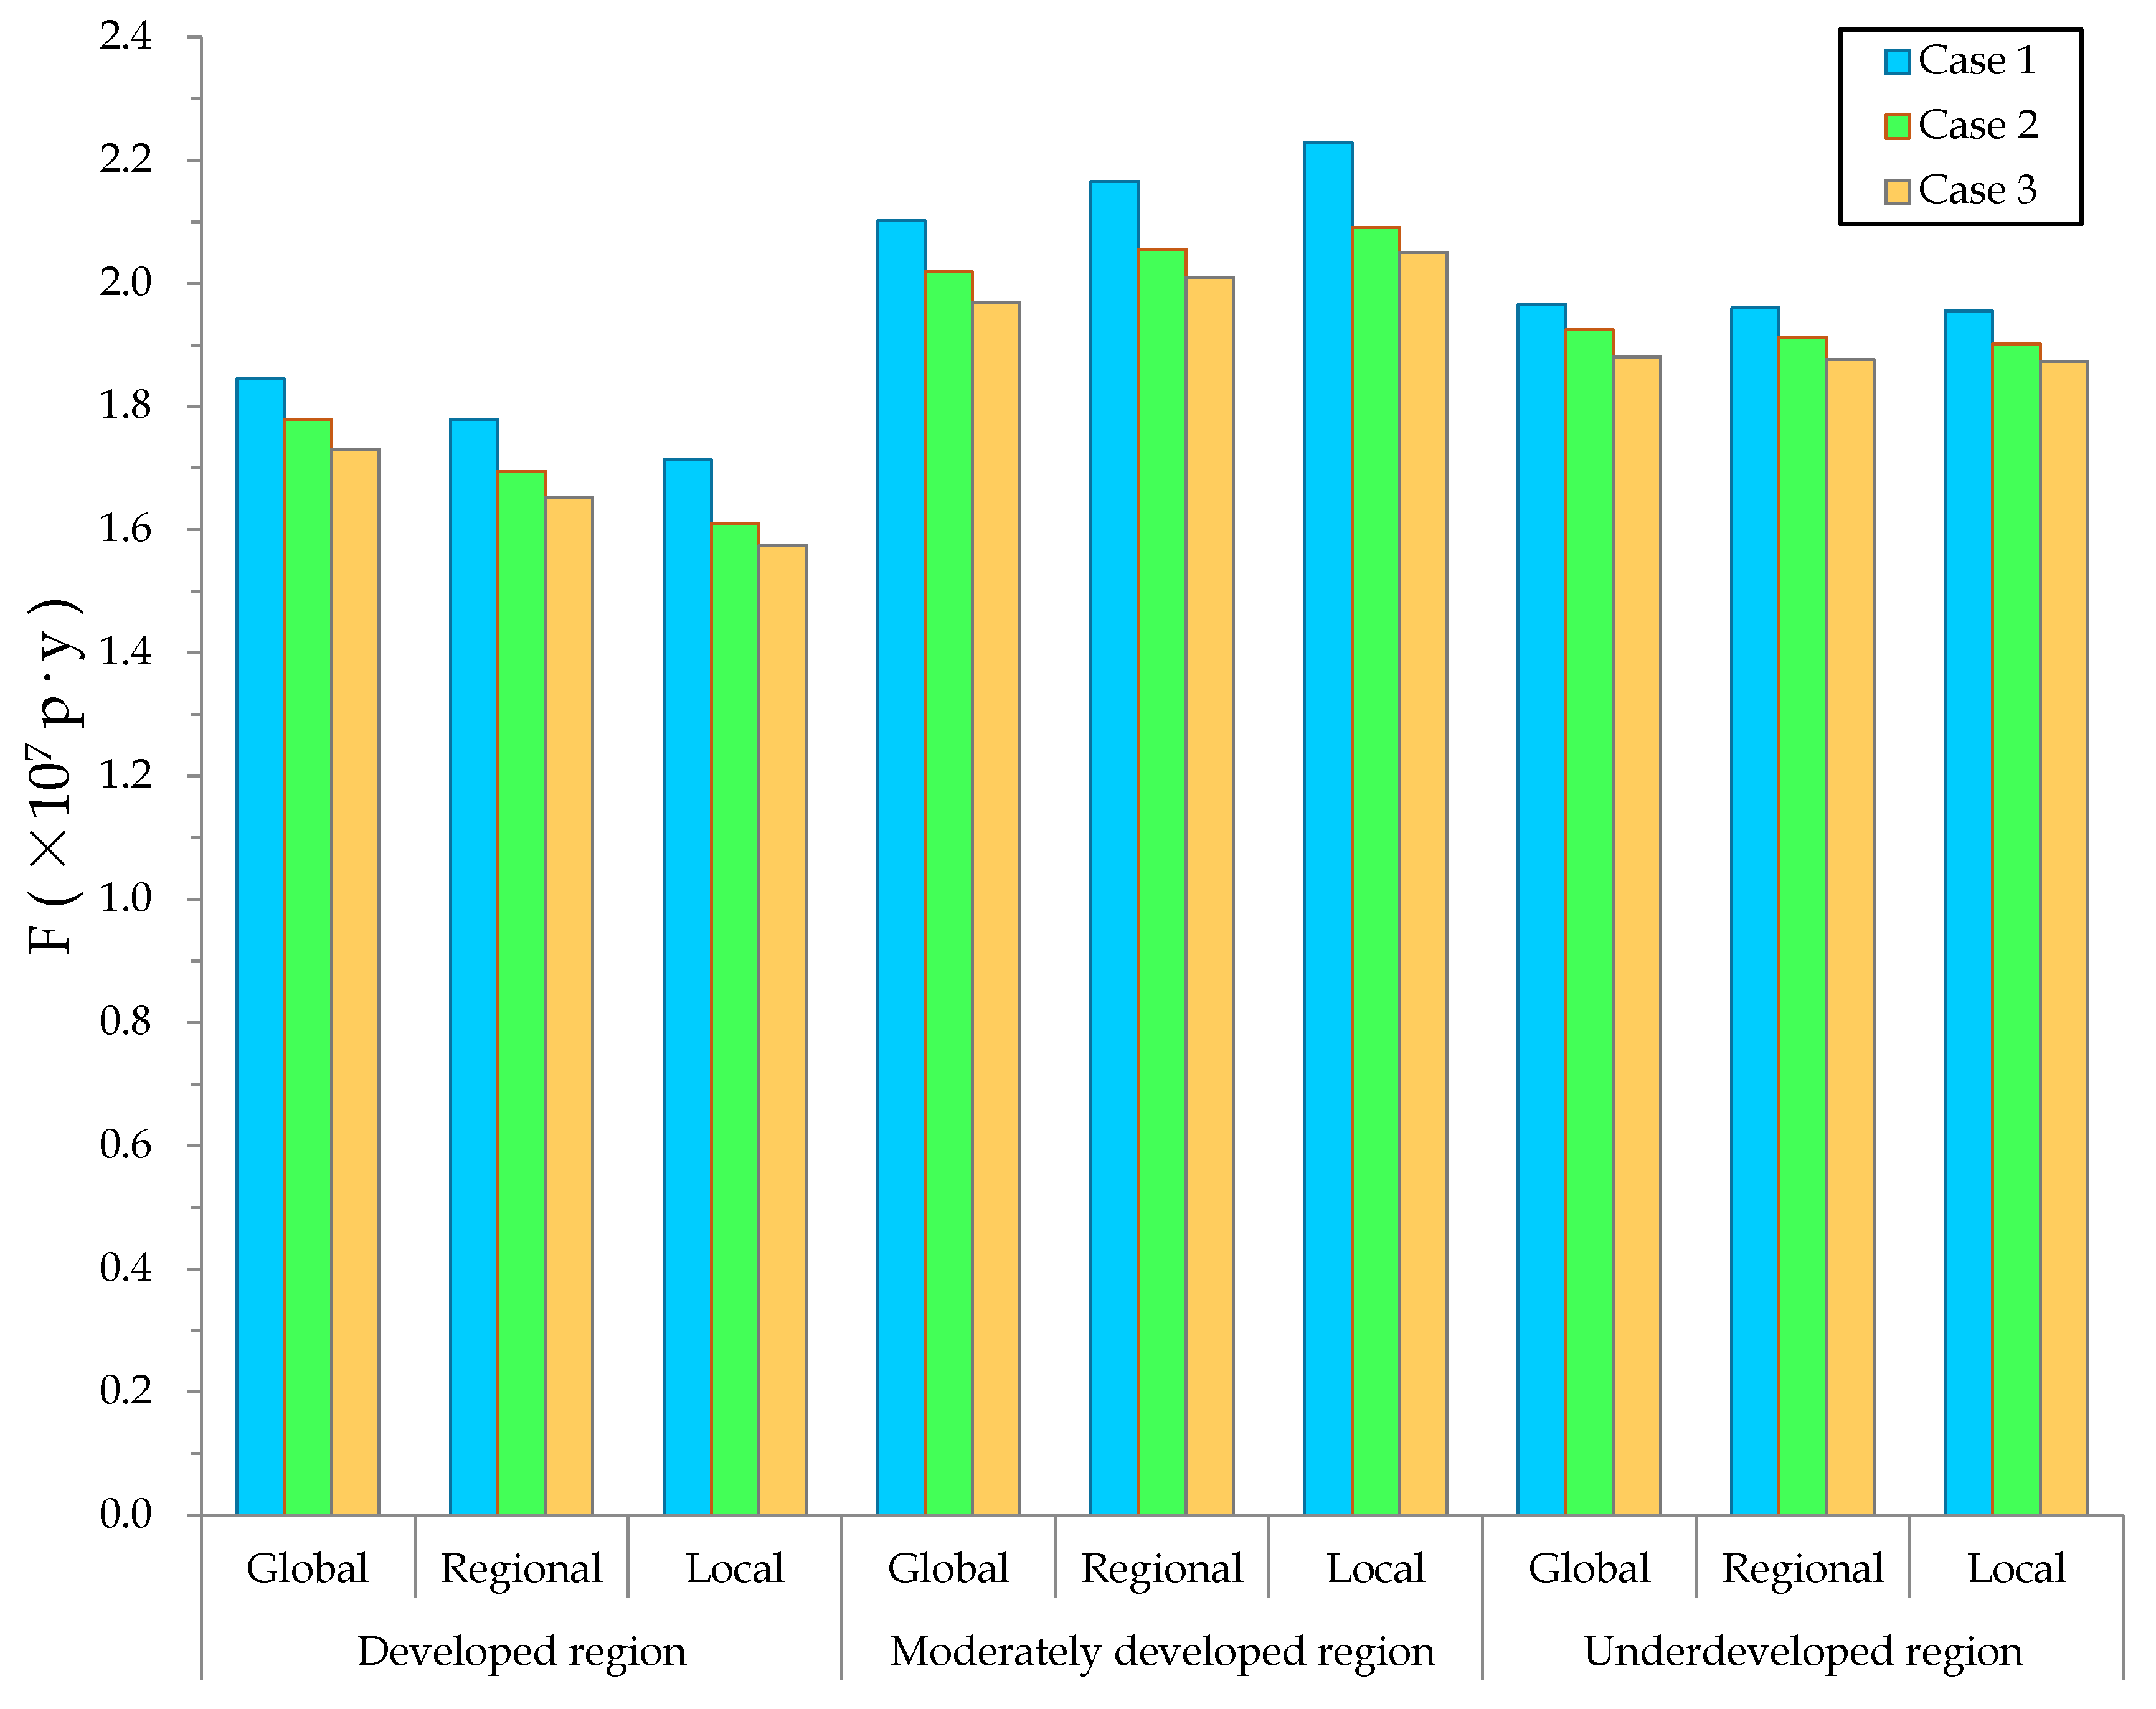
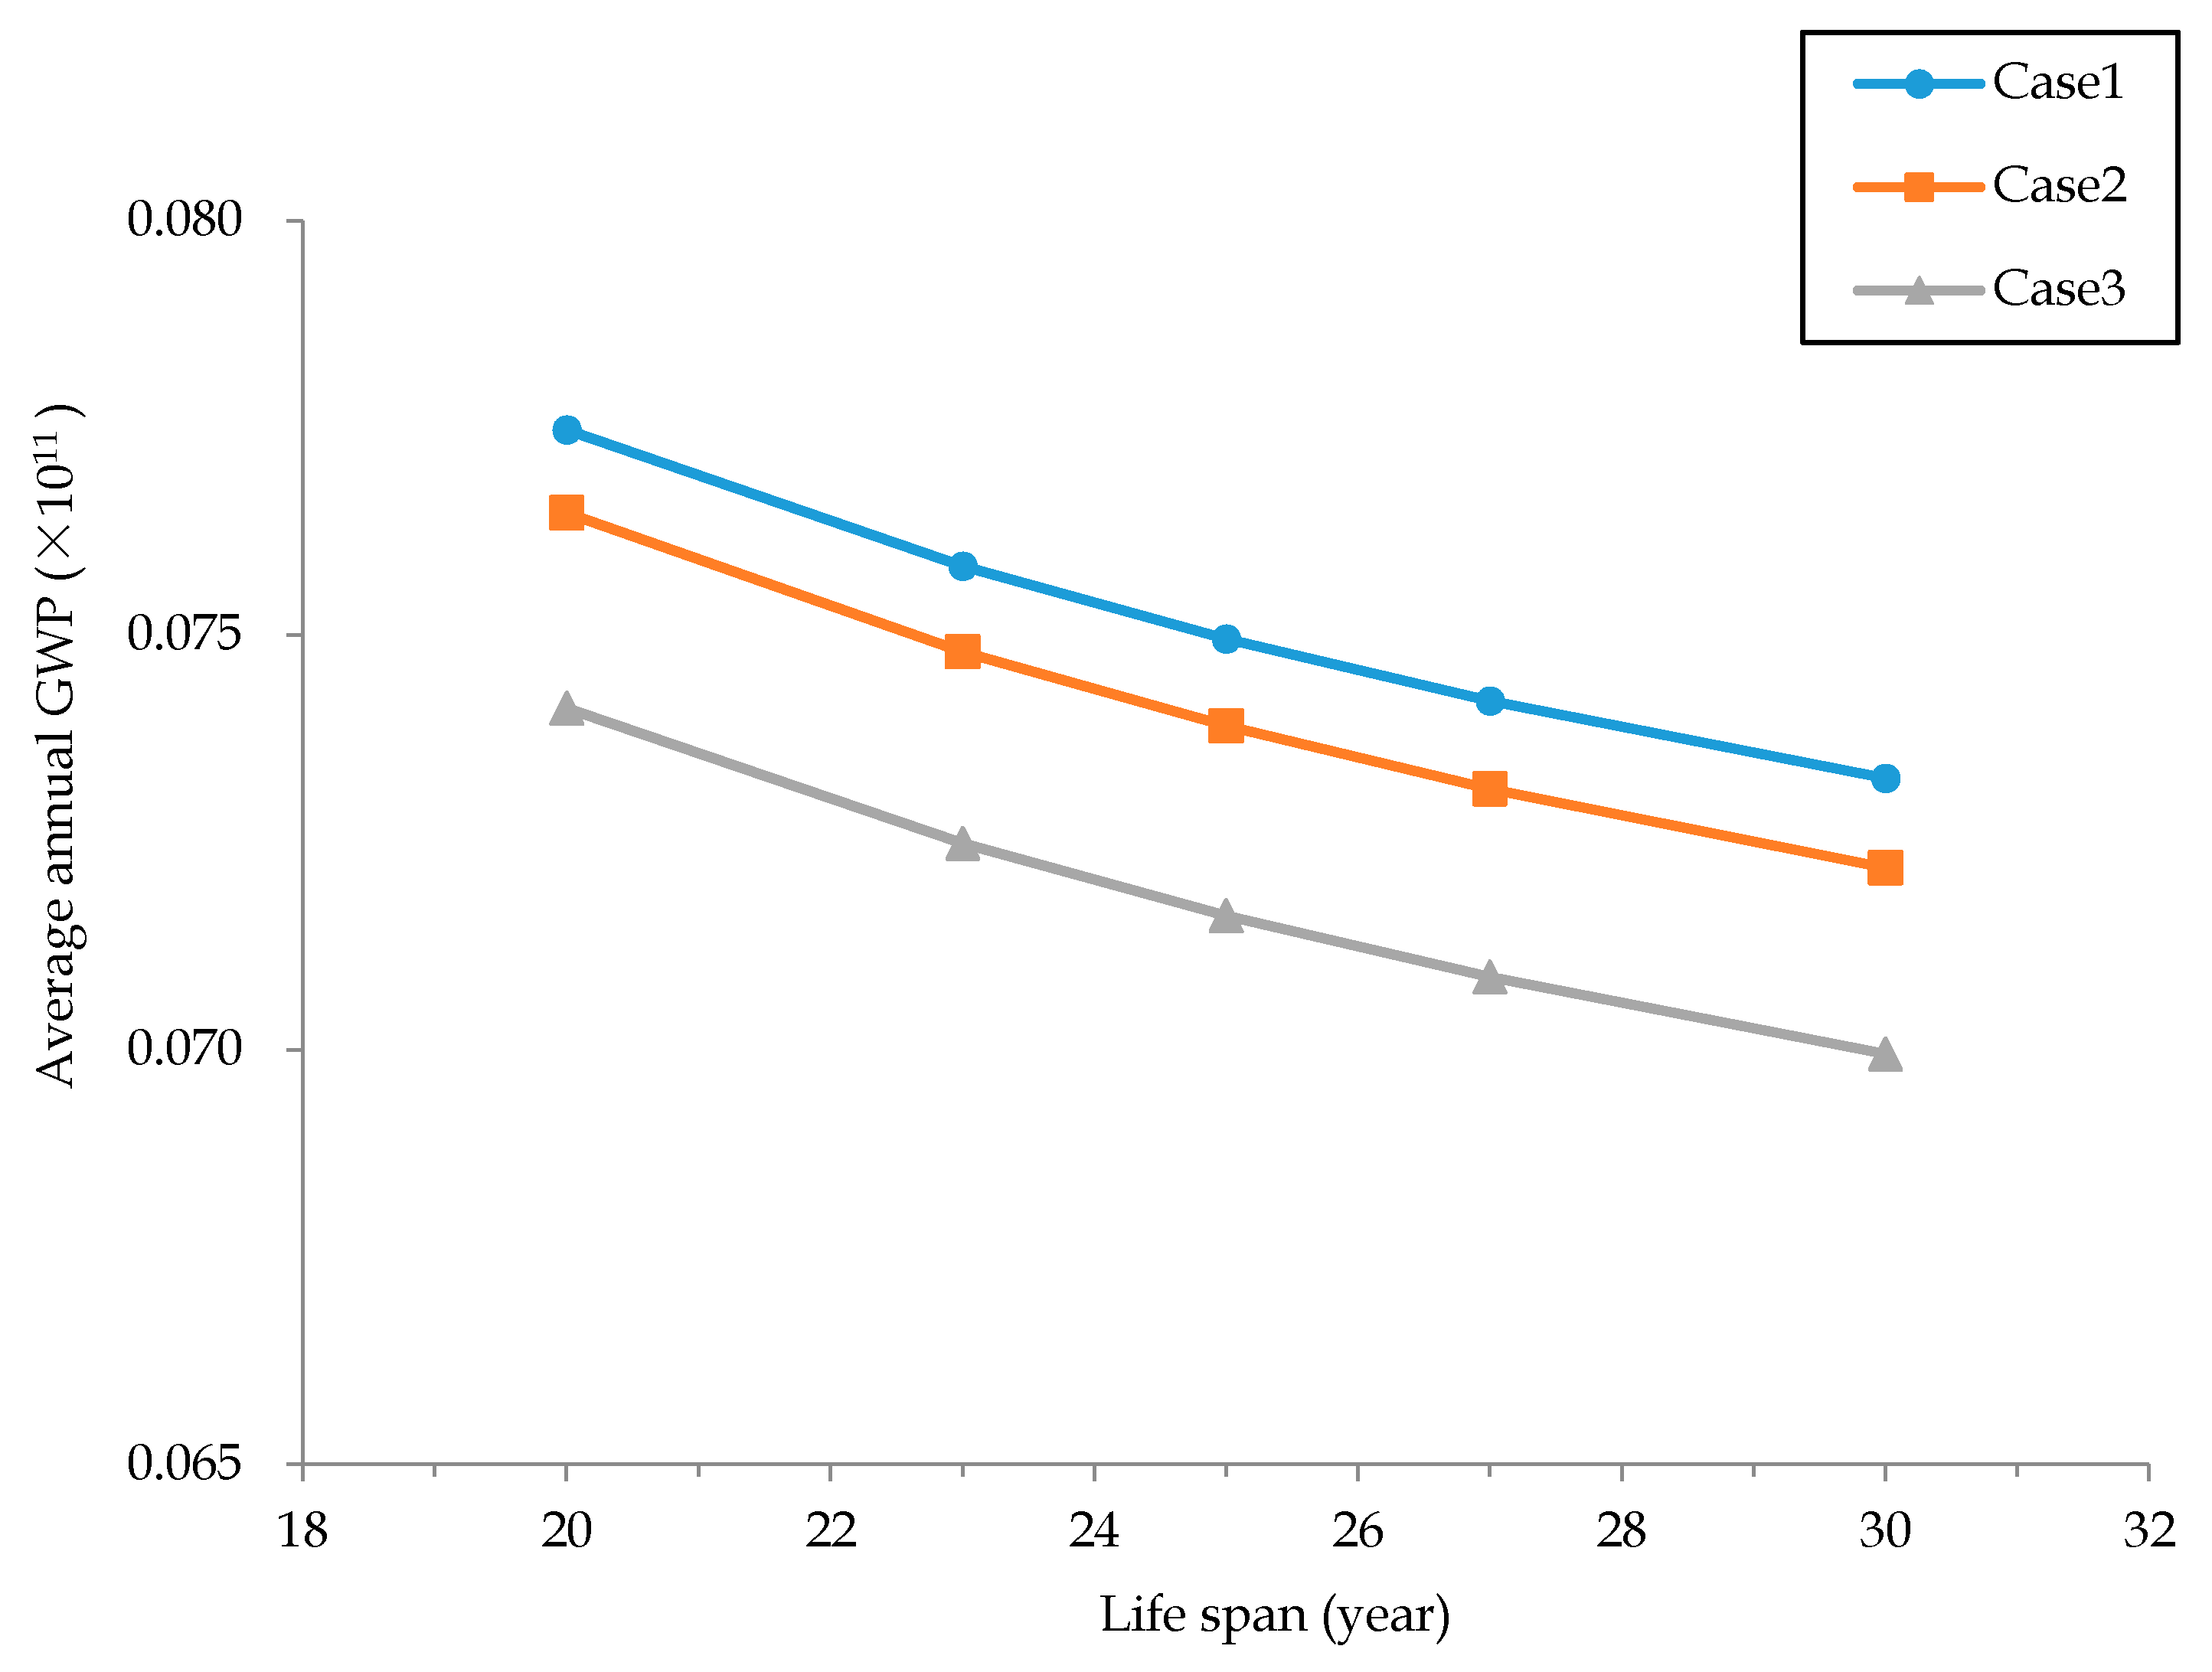
Uncertainty analysis shows that system performance will vary with life cycle and global total pollution emissions. Specifically, as the life span increases, the proportion of fixed investment in the construction process will gradually decrease over the entire life cycle, resulting in an increase in the comprehensive performance of the system. In particular, the advantages of solar low-rank coal upgrading and power generation systems relative to the reference system will be further revealed. The impact of global pollution emissions on the system is mainly reflected in the cumulative effect of global pollution. Solar low-rank coal upgrading and power generation systems can effectively mitigate the trend of pollution and have good competitiveness.

Author Contributions

Conceptualization: L.Y. and C.X.; Formal Analysis: L.Y. and C.X.; Methodology: L.Y.; Supervision: C.X.; Writing—Original Draft: L.Y.; Writing—Review & Editing: L.Y. and C.X.

Funding

This research was funded by National Natural Science Foundation of China (No. 51706065) and the Fundamental Research Funds for the Central Universities (No. 2019MS014).

Acknowledgments

This work is supported by the National Natural Science Foundation of China (No. 51706065) and the Fundamental Research Funds for the Central Universities (No. 2019MS014).

Conflicts of Interest

The authors declare no conflict of interest.

Nomenclature/Abbreviations

GWPglobal warming potential
APacidification potential
REPrespiratory potential
PECprimary energy consumption
COEgross cost of electricity
UGCupgraded coal
GHGgreenhouse gas
LCAlife cycle assessment
AHPanalytic hierarchy process

Appendix A

Table A1. LCA results of Cases 1–3.
IndexCaseMaterialsManufactureTransportationOperationAmmonia ModuleSolar ModuleTotal
CO2
(kg)
Case18646733800.0010737445.9759091692.52162020801882.58157546156.170.00170894910977.24
Case28454037875.0010737445.97748319280.60158909125395.09184425013.730.00168306645010.40
Case38187875721.1710737445.97804187264.80153870685416.47183307384.4930152062.08163086945294.98
SO2
(kg)
Case182083106.982086.77731311.9955370663.451260025.660.00139447194.84
Case280676087.602086.777257975.1830785924.011474997.900.00120197071.46
Case378120930.922086.777794215.4330836451.371466059.3098815.42118318559.22
NOX
(kg)
Case1133400264.102436.74341331.1355370663.4525372873.130.00214487568.54
Case2131932857.002436.743668316.0435662927.1629701724.180.00200968261.12
Case3127735099.602436.743940561.0935735109.1029521729.5373072.83197008008.89
PM2.5
(kg)
Case136467826.00838.8951684.6012301771.267875160.120.0056697280.88
Case235126370.00838.89450325.6312056929.989218736.580.0056853201.08
Case334031302.85838.89483325.0311674769.649162870.3677231.5055430338.27
CO
(kg)
Case122704270.0022909.48499452.540.002172.890.0023228804.91
Case221506925.0022909.484388210.680.002543.600.0025920588.75
Case320862052.1222909.484709954.830.002528.1912448.4925609893.11
CH4
(kg)
Case1490195375.2035.95397220.700.00252.660.00490592884.52
Case2483792324.0035.955070117.210.00295.770.00488862772.93
Case3468461383.9435.955449610.310.00293.9820515.77473931839.95
N2O
(kg)
Case119645200.00119.84135354.940.000.000.0019780674.78
Case219473075.00119.84285502.390.000.000.0019758697.24
Case318852536.95119.84302002.090.000.00484.9219155143.81
PEC
(kWh)
Case135454678.7829959.06557006.11438072254.63625321.270.00474739219.85
Case235023361.1029959.066951011.49431601376.28732006.960.00474337714.90
Case333910042.8329959.067470752.04431601376.28727570.950.00473739701.16
Table A2. LCA results of Cases 1–3.
IndexCaseMaterialsManufactureTransportationOperationAmmonia ModuleSolar ModuleSummary
GWPCase125098961489.20 10844080.61 110891715.12 162020801882.58 157557980.71 0.00 187399057148.22
Case224714850704.00 10844080.61 956462116.28 158909125395.09 184438855.65 0.00 184775721151.64
Case323932437394.74 10844080.61 1026379595.03 153870685416.47 183321142.53 30770563.38 179054438192.76
APCase1189214931.85 3876.38 1064992.23 94130127.86 19021036.85 0.00 303434965.17
Case2186660240.00 3876.38 10025648.09 55749973.03 22266204.82 0.00 274705942.31
Case3180732276.51 3876.38 10764009.67 55851027.73 22131269.97 150305.85 269632766.10
REPCase1232445808.49 5534.78 1543576.72 134117230.85 17881070.81 0.00 385993221.64
Case2227990793.54 5534.78 15340973.29 81249063.75 20931749.84 0.00 345518115.19
Case3220781601.49 5534.78 16474502.68 80984559.97 20804901.88 286902.66 339338003.45

References

  1. An, L. Analysis of low-rank coal upgrading technology on the present situation and development. J. Petrochem. Ind. Technol. 2018, 25, 281. [Google Scholar]
  2. Osman, H.; Jangam, S.V.; Lease, J.D. Drying of low-rank coal (LRC)da review of recent patents and innovations. Dry Technol. 2010, 29, 1763–1783. [Google Scholar] [CrossRef]
  3. Xu, C.; Bai, P.; Xin, T. A novel solar energy integrated low-rank coal fired power generation using coal pre-drying and an absorption heat pump. Appl. Energy 2017, 200, 170–179. [Google Scholar] [CrossRef]
  4. Li, C.Z. Advances in the Science of Victorian Brown Coal; Elsevier Ltd.: Oxford, UK, 2004. [Google Scholar]
  5. Robinson, P.J.; Luyben, W.L. Simple dynamic gasifier model that runs in aspen dynamics. Ind. Eng. Chem. Res. 2008, 47, 7784–7792. [Google Scholar] [CrossRef]
  6. Hayashi, J.I.; Miura, K. Advances in the Science of Victorian Brown Coal: Chapter 4: Pyrolysis of Victorian Brown Coal; Elsevier Ltd.: Oxford, UK, 2004. [Google Scholar]
  7. Kaji, R.; Muranaka, Y.; Otsuka, K. Water absorption by coals: Effects of pore structure and surface oxygen. Fuel 1986, 65, 288–291. [Google Scholar] [CrossRef]
  8. Ogunsola, O.I.; Mikula, R.J. Effect of thermal upgrading on spontaneous combustion characteristics of western Canadian low rank coals. Fuel 1992, 71, 3–8. [Google Scholar] [CrossRef]
  9. Xu, C.; Xu, G.; Zhao, S. A theoretical investigation of energy efficiency improvement by coal pre-drying in coal fired power plants. Energy 2012, 44, 720–731. [Google Scholar] [CrossRef]
  10. Guan, J.; He, D.; Song, B. Lignite thermal upgrading and its effect on surface properties. Adv. Mater. Res 2012, 524–527, 887–893. [Google Scholar] [CrossRef]
  11. Xu, C.; Xin, T.; Xu, G. Thermodynamic analysis of a novel solar-hybrid system for low-rank coal upgrading and power generation. Energy 2017, 141, 1737–1749. [Google Scholar] [CrossRef]
  12. Xu, C.; Xin, T.; Li, X. A thermodynamic analysis of a solar hybrid coal-based direct-fired supercritical carbon dioxide power cycle. Energy Convers. Manag. 2019, 196, 77–91. [Google Scholar] [CrossRef]
  13. Piatkowski, N.; Wieckert, C.; Steinfeld, A. Experimental investigation of a packed-bed solar reactor for the steam-gasification of carbonaceous feedstocks. Fuel Process. Technol. 2009, 90, 360–366. [Google Scholar] [CrossRef]
  14. Michael, B.W.; Garvin, A.H.; John, J.B.; Craig, S.T. Life cycle assessment of a power tower concentrating solar plant and the impacts of key design alternatives. J. Environ. Sci. Technol. 2013, 47, 5896–5903. [Google Scholar]
  15. Varun; Bhat, I.K.; Ravi, P. LCA of renewable energy for electricity generation systems—A review. Renew. Sustain. Energy Rev. 2009, 13, 1067–1073. [Google Scholar] [CrossRef]
  16. Hong, H.; Zhao, Y.; Jin, H. Proposed partial repowering of a coal-fired power plant using low-grade solar thermal energy. Int. J. Thermodyn. 2011, 14, 21–28. [Google Scholar]
  17. Wang, J.; Zhai, Z.J.; Zhang, C. Environmental impact analysis of BCHP system in different climate zones in China. Energy 2010, 35, 4208–4216. [Google Scholar] [CrossRef]
  18. Wang, J.; Yang, Y.; Mao, T. Life cycle assessment (LCA) optimization of solar-assisted hybrid CCHP system. Appl. Energy 2015, 146, 38–52. [Google Scholar] [CrossRef]
  19. Saaty, T.L. The Analytic Hierarchy Process; McGraw-Hill Company: New York, NY, USA, 1980. [Google Scholar]
  20. GB3059-2012. Available online: http://www.mee.gov.cn/hjzl/ (accessed on 17 June 2019).
  21. Shindina, T.; Streimikis, J.; Sukhareva, Y.; Nawrot, Ł. Social and Economic Properties of the Energy Markets. Econ. Sociol. 2018, 11, 334–344. [Google Scholar] [CrossRef]
  22. Nation environmental protection agency of China. Production and Emission of Industrial Pollutant Manual; China Environment Science Press: Beijing, China, 1996.
  23. Jing, Y.Y.; Bai, H.; Wang, J.J. Life cycle assessment of a solar combined cooling heating and power system in different operation strategies. Appl. Energy 2012, 92, 843–853. [Google Scholar] [CrossRef]
  24. Dong, W. Study on Multidimensional Analysis of Thermal Economy of Unit Thermal Power Unit Generation; Shanghai University of Electric Power: Shanghai, China, 2016. [Google Scholar]
  25. Wang, X.; Xu, Z.; Wei, B. The ash deposition mechanism in boilers burning Zhundong coal with high contents of sodium and calcium: A study from ash evaporating to condensing. Appl. Therm. Eng. 2015, 80, 150–159. [Google Scholar] [CrossRef] [Green Version]
  26. Gu, Y.Z.; Wang, S.M. Ammonia slip in denitration system of coal-fired power plant and emission characteristics of fine particulate matters derived from slipped ammonia. Mod. Chem. Ind. 2017, 37, 19–23. [Google Scholar]
  27. Tvaronavičienė, M.; Prakapienė, D.; Garškaitė-Milvydienė, K.; Prakapas, R.; Nawrot, Ł. Energy efficiency in the long run in the selected European countries. Econ. Sociol. 2018, 11, 245–254. [Google Scholar] [CrossRef] [PubMed]
  28. Leiden University. Institute of Environmental science (CML) 2012 [EB/OL]. Available online: http://cml.leiden.edu/research/industrialecology/ (accessed on 24 September 2012).
  29. Zhu, Y.; Zhai, R.R.; Zhao, M.M.; Yang, Y.P. Analysis of solar contribution evaluation method in solar aided coal-fired power plants. Energy Proc. 2014, 61, 1610–1613. [Google Scholar] [CrossRef]
  30. Makarenko, D.; Streimikiene, D. Quality of life and environmentally responsible behavior in energy sector. J. Int. Stud. 2014, 7, 179–192. [Google Scholar]
  31. Zhai, R.R.; Li, C. Life cycle assessment of solar aided coal-fired power system with and without heat storage. Energy Convers. Manag. 2016, 111, 453–465. [Google Scholar] [CrossRef]
Figure 1. Power generation and transmission system.
Energies 12 02365 g001
Figure 2. Conventional upgrading, power generation, and coal transport system.
Energies 12 02365 g002
Figure 3. Solar–hybrid upgrading, power generation, and coal transport system.
Energies 12 02365 g003
Figure 4. Calculation principle.
Energies 12 02365 g004
Figure 5. Goal and system boundary of the life cycle assessment (LCA) analysis.
Energies 12 02365 g005
Figure 6. The structure of analytic hierarchy process.
Energies 12 02365 g006
Figure 7. Normalized life cycle pollutant emissions and PEC results.
Energies 12 02365 g007
Figure 8. Normalized Life cycle GWP, AP, and REP emissions.
Energies 12 02365 g008
Figure 9. LCA results of CO2-eq, SO2-eq, and PM2.5-eq emissions.
Energies 12 02365 g009
Figure 10. Effect of life span on average annual GWP.
Energies 12 02365 g010
Figure 11. Effect of life span on average annual AP.
Energies 12 02365 g011
Figure 12. Effect of life span on average annual REP.
Energies 12 02365 g012
Figure 13. Effect of global annual per capita CO2-eq on F.
Energies 12 02365 g013
Table 1. Detailed operation condition.
ItemSymbolUnitValue
boiler efficiency
(Case 1)
η1%92.95
boiler efficiency
(Case 2)
η2%93.83
boiler efficiency
(Case 3)
η3%93.83
steam turbineηt%47.3
generator efficiencyηg%99.0
Table 2. The meaning of the numbers.
Item1234567
iGenerators and their auxiliary equipmentUpgrading equipmentTrough heat exchangerPower linePylon--
jSteelAluminumGlass----
kCO2SO2NOXPM2.5COCH4N2O
c---Raw ligniteUGC without solar energyUGC with solar energy-
rRoadRailway-----
Table 3. Conversion factors between various pollutant emissions for globe warming potential (GWP), acidification potential (AP), and respiratory effects potential (REP).
PollutantFGWP (g CO2-eq/g)FAP (g SO2-eq/g)FREP (g PM2.5-eq/g)
CO2100
SO2011.9
NOX00.70.3
PM2.5001
CO300
CH42100
N2O3100.70
Table 4. 1–9 scale of the meaning of aij.
Scale aijMeaning
1The effect of Ci and Cj is the same
3The effect of Ci is slightly stronger than that of Cj
5The effect of Ci is stronger than that of Cj
7The effect of Ci is evidently stronger than that of Cj
9The effect of Ci is overwhelmingly stronger than that of Cj
2,4,6,8The effect ratio of Ci and Cj is between the 2 adjacent grades
1, 1/2, …1/9The effect ratio of Ci and Cj is the reciprocal of the above
Table 5. Numerical value of consistency index of RI.
n1234567891011
RI000.580.901.121.241.321.411.451.491.51
Table 6. The exploitation pollutant emissions and primary energy consumption (PEC) of unit raw materials.
MaterialsCO2 (g)SO2 (g)NOx (g)PM2.5 (g)CO (g)CH4 (g)N2O (g)PEC (kWh)
Steel (kg)2000.0009.7004.00015.00025.00053.0000.0001.700
Aluminum (kg)25800.000205.50094.700290.00014.00024.0000.00036.100
Glass (kg)132.3001.1003.7007.0000.0000.0000.0000.600
Coal (kWh)43.7500.4200.6900.1800.1062.5200.1020.183
NH3 (kg)2771.38822.165446.333138.5320.0380.0040.00011.000
Table 7. Equipment material of direct coal-fired power plant.
MaterialsGenerators and Their Auxiliary EquipmentUpgrading EquipmentTrough Heat ExchangerPower LinePylon
Steel (t)16936-11628423904375000
Aluminum (t)0-0151500
Glass (t)0-6223900
Table 8. Basic data for plant manufacturing.
UnitCO2
(kW/kg)
SO2
(kW/kg)
NOX
(kW/kg)
PM2.5
(kW/kg)
CO
(kW/kg)
CH4
(kW/kg)
N2O
(kW/kg)
PEC
(kW/kWh)
Power unit4455.0631 0.8658 1.0110 0.3481 9.5053 0.0149 0.0497 12.4303
Boiler unit110.0140 0.0214 0.0250 0.0086 0.2347 0.0004 0.0012 0.3070
Table 9. Materials of solar–hybrid upgrading.
EquipmentSolar PanelTrough Heat Exchanger
Area(m2)373014183200
Table 10. The PEC and pollutant emissions of solar upgrading equipment.
EquipmentCO2
(kg/m2)
SO2
(kg/m2)
NOX
(kg/m2)
PM2.5
(kg/m2)
CO
(kg/m2)
CH4
(kg/m2)
N2O
(kg/m2)
PEC (kWh)
Solar panel16.290.150.06500.003050.0550.00130
Trough heat exchanger131.420.230.270.420.060.000.000.00
Table 11. The pollutant and PEC of different transportation methods.
TransportationCO2 (g)SO2 (g)NOx (g)PM2.5 (g)CO (g)CH4 (g)N2O (g)PEC (kWh)
Railway (103 kg)−1km−16.7720.0650.0330.0040.0390.0460.0020.063
Road (103 kg)−1km−12099.4213.1590.9428.9420.1436.4090.9
Table 12. The distance of each item.
ItemSteel
(km)
Glass
(km)
Aluminum
(km)
Equipment
(km)
Lignite
(km)
UGC
(km)
Case 12002002009002000
Case 2, 32002002001002003000
Table 13. Ultimate and proximate analyses data of three different coals.
ItemsUltimate AnalysisLHVProximate Analysis
CdafHdafOdafNdafSdaf(MJ/kg)AdFCdVdMar
Raw lignite79.783.4515.480.690.6019.337.3964.2128.3926.40
UGC without solar energy88.373.477.390.410.3629.458.6775,3715.963.09
UGC with solar energy81.853.5013.480.630.5527.187.6966.7925.532.75
Note: ar—as received basis; d—dry basis; daf—dry and free basis.
Table 14. Comparison of flue gas composition with and without removal device.
PollutantNon-disposition/Disposition/Difference Value
SO2 (g/kWh)NOX (g/kWh)
Raw lignite2.772/0.332/2.4401.459/0.332/1.127
UGC with solar energy2.358/0.107/2,2511.144/0.153/0.991
UGC without solar energy1.404/0.107/1.2970.828/0.153/0.675
Table 15. Relationship between the amount of ammonia and electricity.
CoalAmmonia (g/kWh)
Raw lignite0.442944444
UGC without solar energy0.263196313
UGC with solar energy0.382219877
Table 16. PEC and pollution emissions from the manufacture of ammonia.
MaterialsCO2 (kg)SO2 (kg)NOX (kg)PM2.5 (kg)CO (kg)CH4 (kg)N2O (kg)PEC (kWh)
Ammonia (kg−1)2.7713880.0221650.4463330.1385320.0000380.0000042.77138811.00
Table 17. The comparison matrix of the target of different region.
RegionThe Comparison Matrix of the Target
Developed region [ 1 1 / 2 2 1 ]
Moderately developed region [ 1 1 1 1 ]
Underdeveloped region [ 1 2 1 / 2 1 ]
Table 18. The comparison matrix of environmental impact of different perspective.
PerspectiveThe Comparison Matrix of Environmental Impact
Global [ 1 2 5 1 / 2 1 4 1 / 5 1 / 4 1 ]
regional [ 1 1 / 6 1 / 4 6 1 3 4 1 / 3 1 ]
Local [ 1 1 / 2 1 / 5 2 1 1 / 4 5 4 1 ]
Table 19. Standardized base values for environmental impact factors.
ItemBase ValueUnit
GWP9487.061kg CO2-eq·(p·y)−1
AP35.70132kg SO2-eq·(p·y)−1
REP14.05832kg PM2.5-eq·(p·y)−1
PEC25.00kWh·(p·y)−1
Table 20. The weight vector of PEC, GWP, AP, and REP in different regions and from different perspectives.
Perspective GlobalRegionalLocal
Region
α10.66670.50000.3333
Developed regionα20.18980.28480.3797
α30.11100.16650.2220
α40.03250.04870.0649
α10.66670.50000.3333
Moderately
developed region
α20.02840.04260.0568
α30.21470.32210.4295
α40.09020.13530.1804
α10.66670.50000.3333
Underdeveloped
region
α20.03890.05840.0779
α30.06660.09990.1332
α40.22780.34170.4556

