Experimental Investigation of Surfactant Partitioning in Pre-CMC and Post-CMC Regimes for Enhanced Oil Recovery Application

 , and
, and
Abstract
:1. Introduction
2. Materials and Methods
2.1. Materials
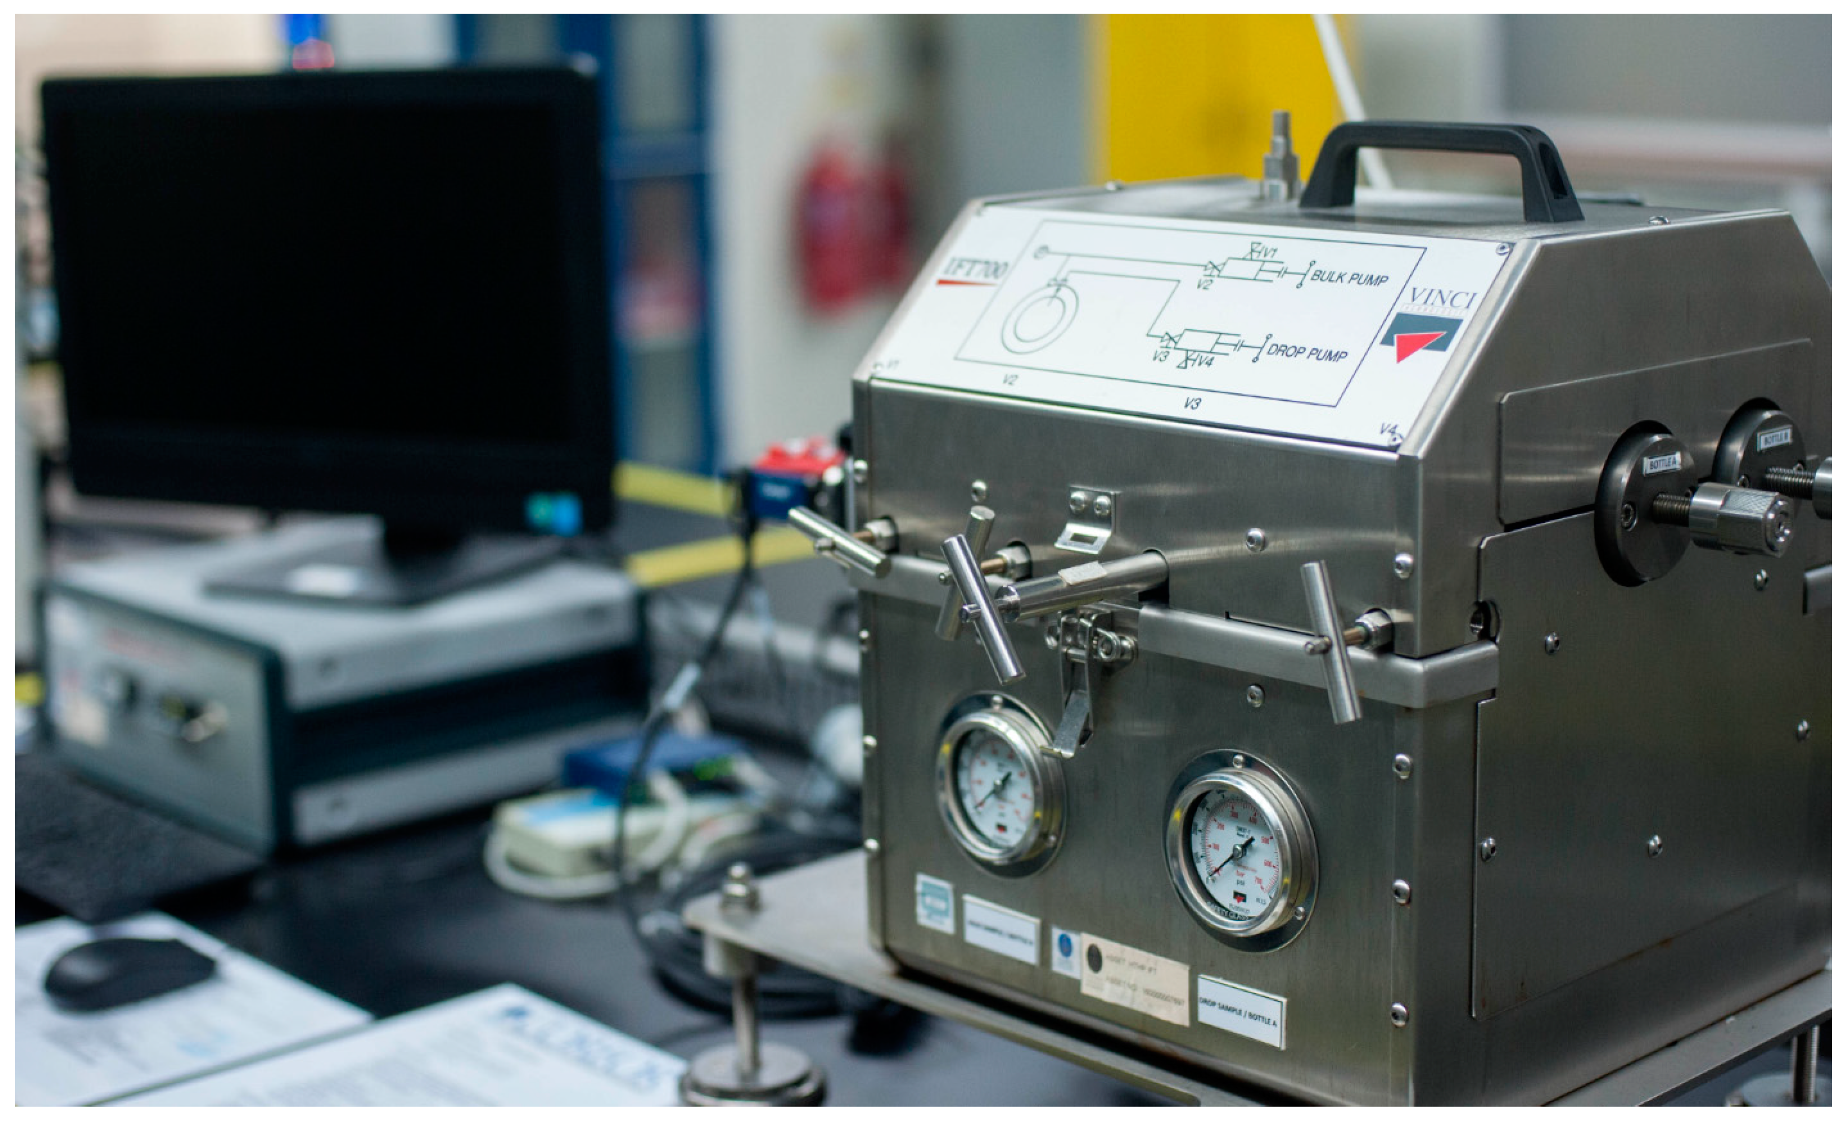
2.2. Apparatus and Methods
2.2.1. Surface Tension Measurement
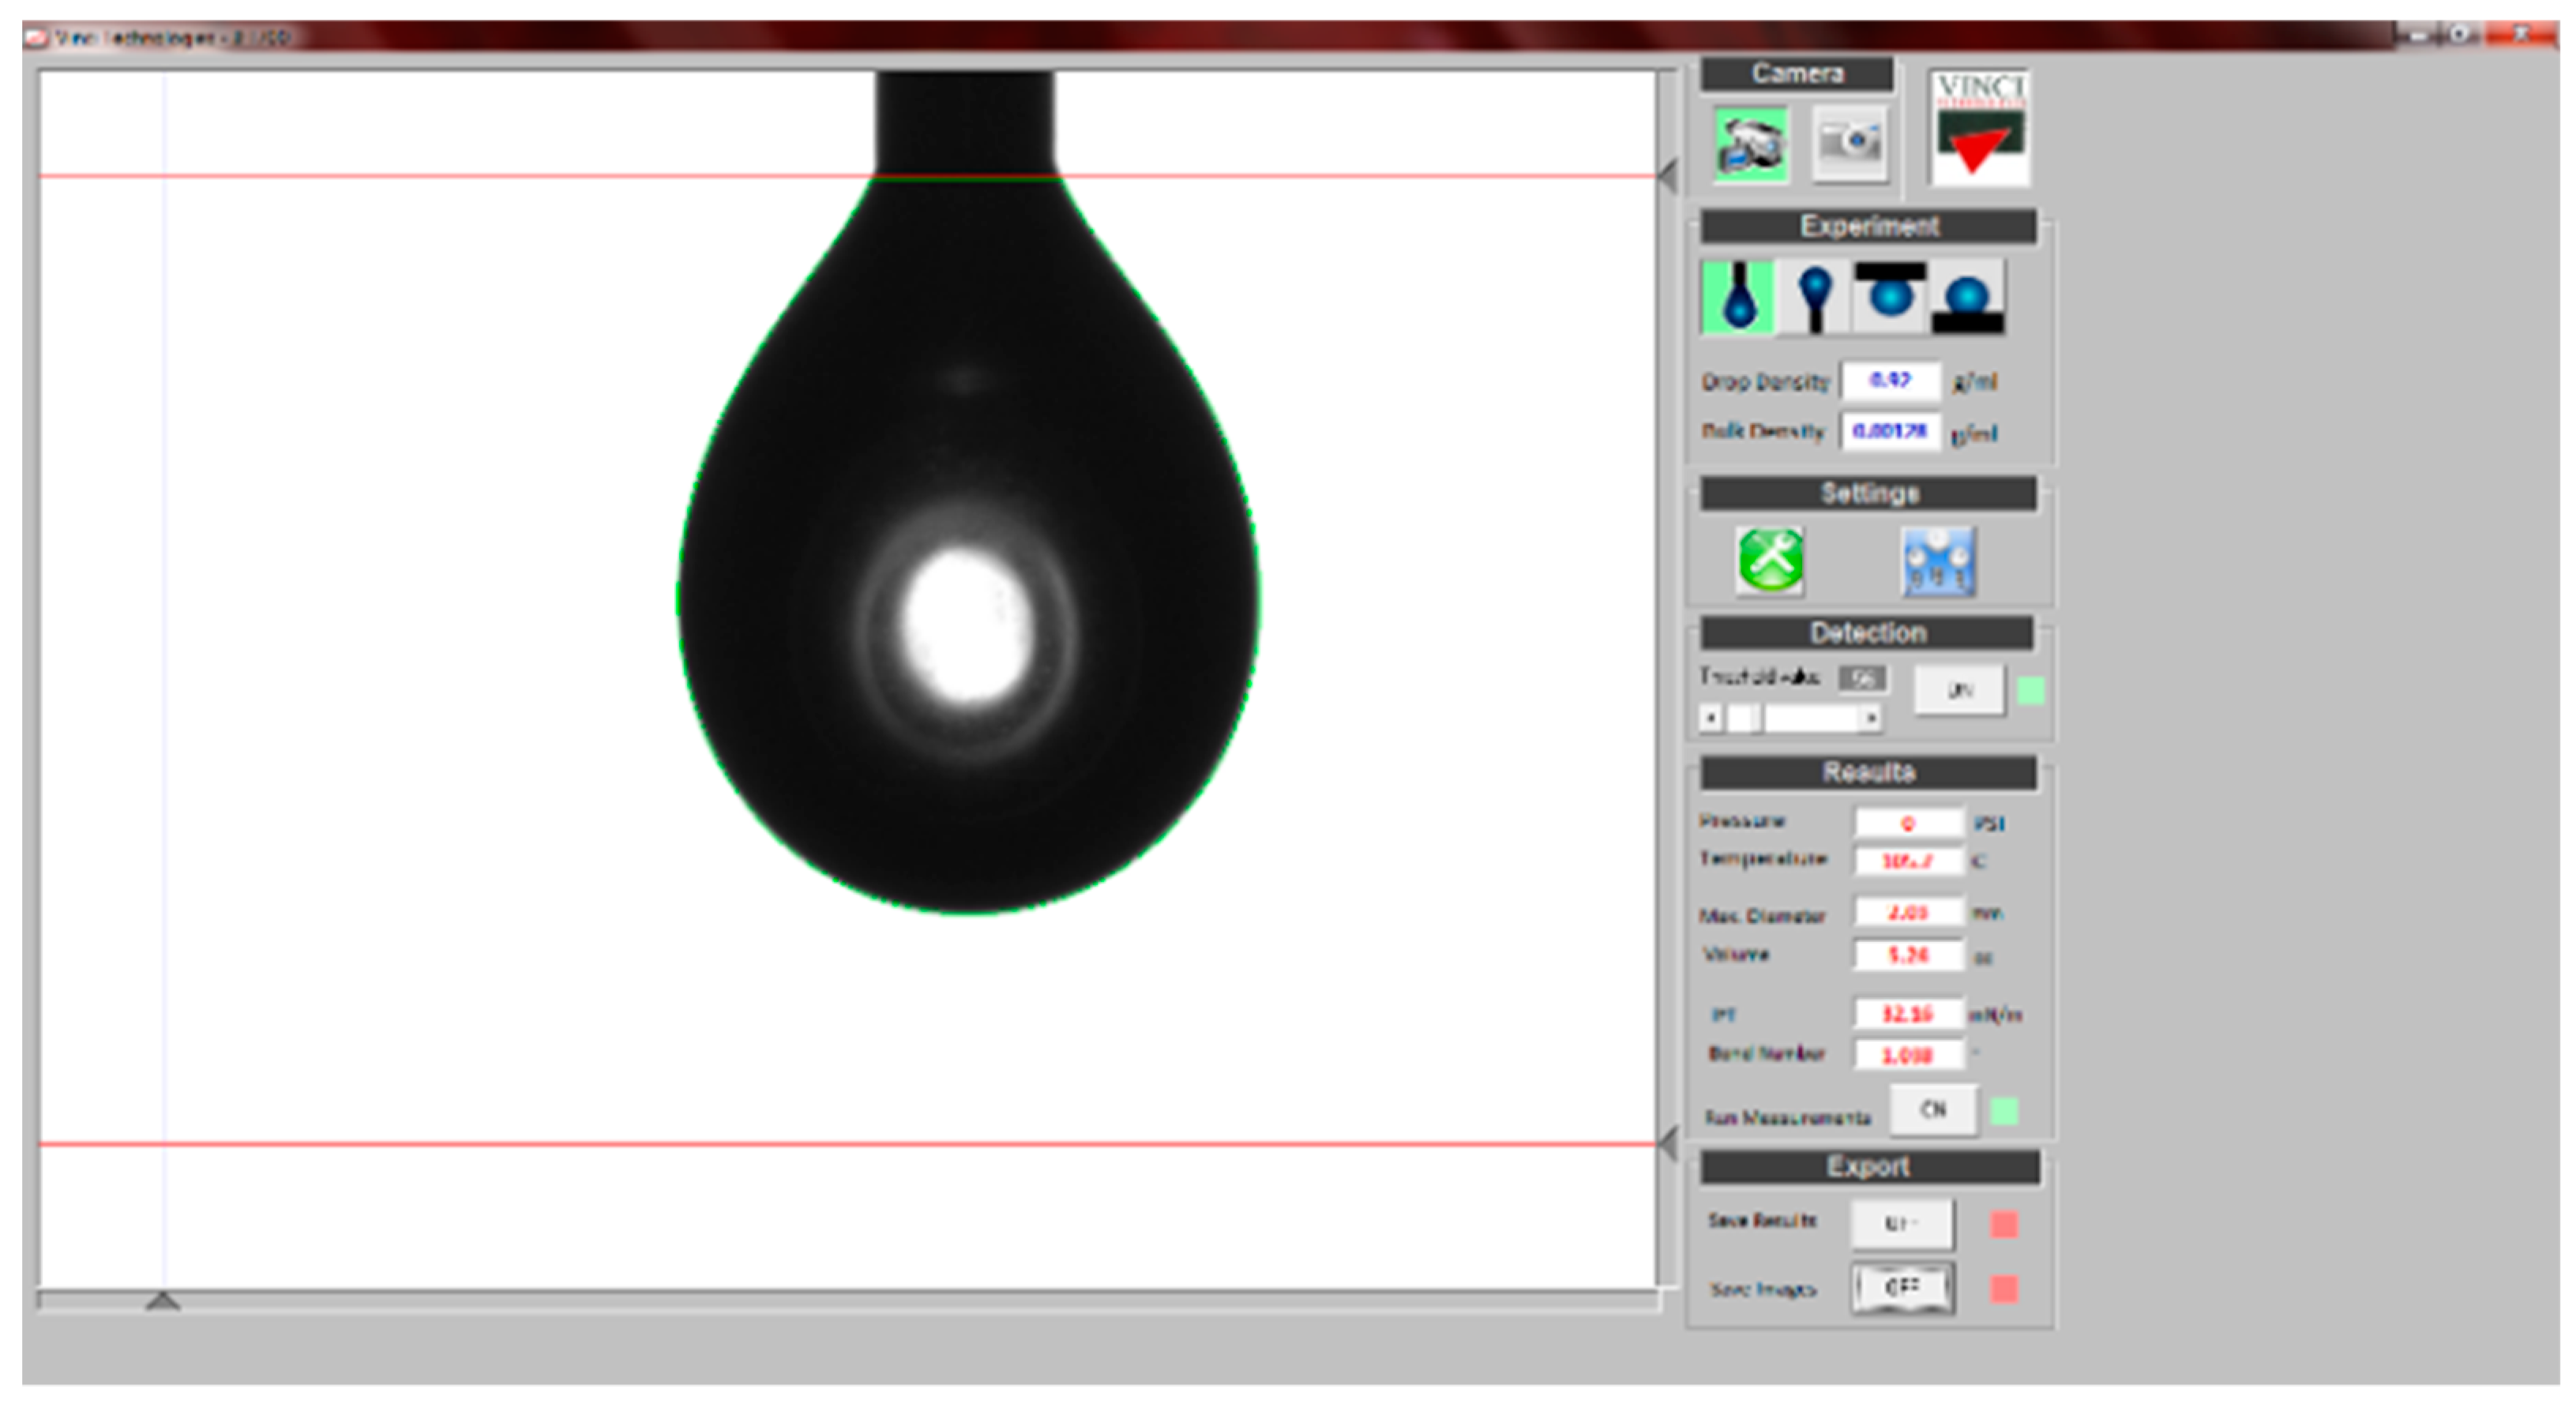
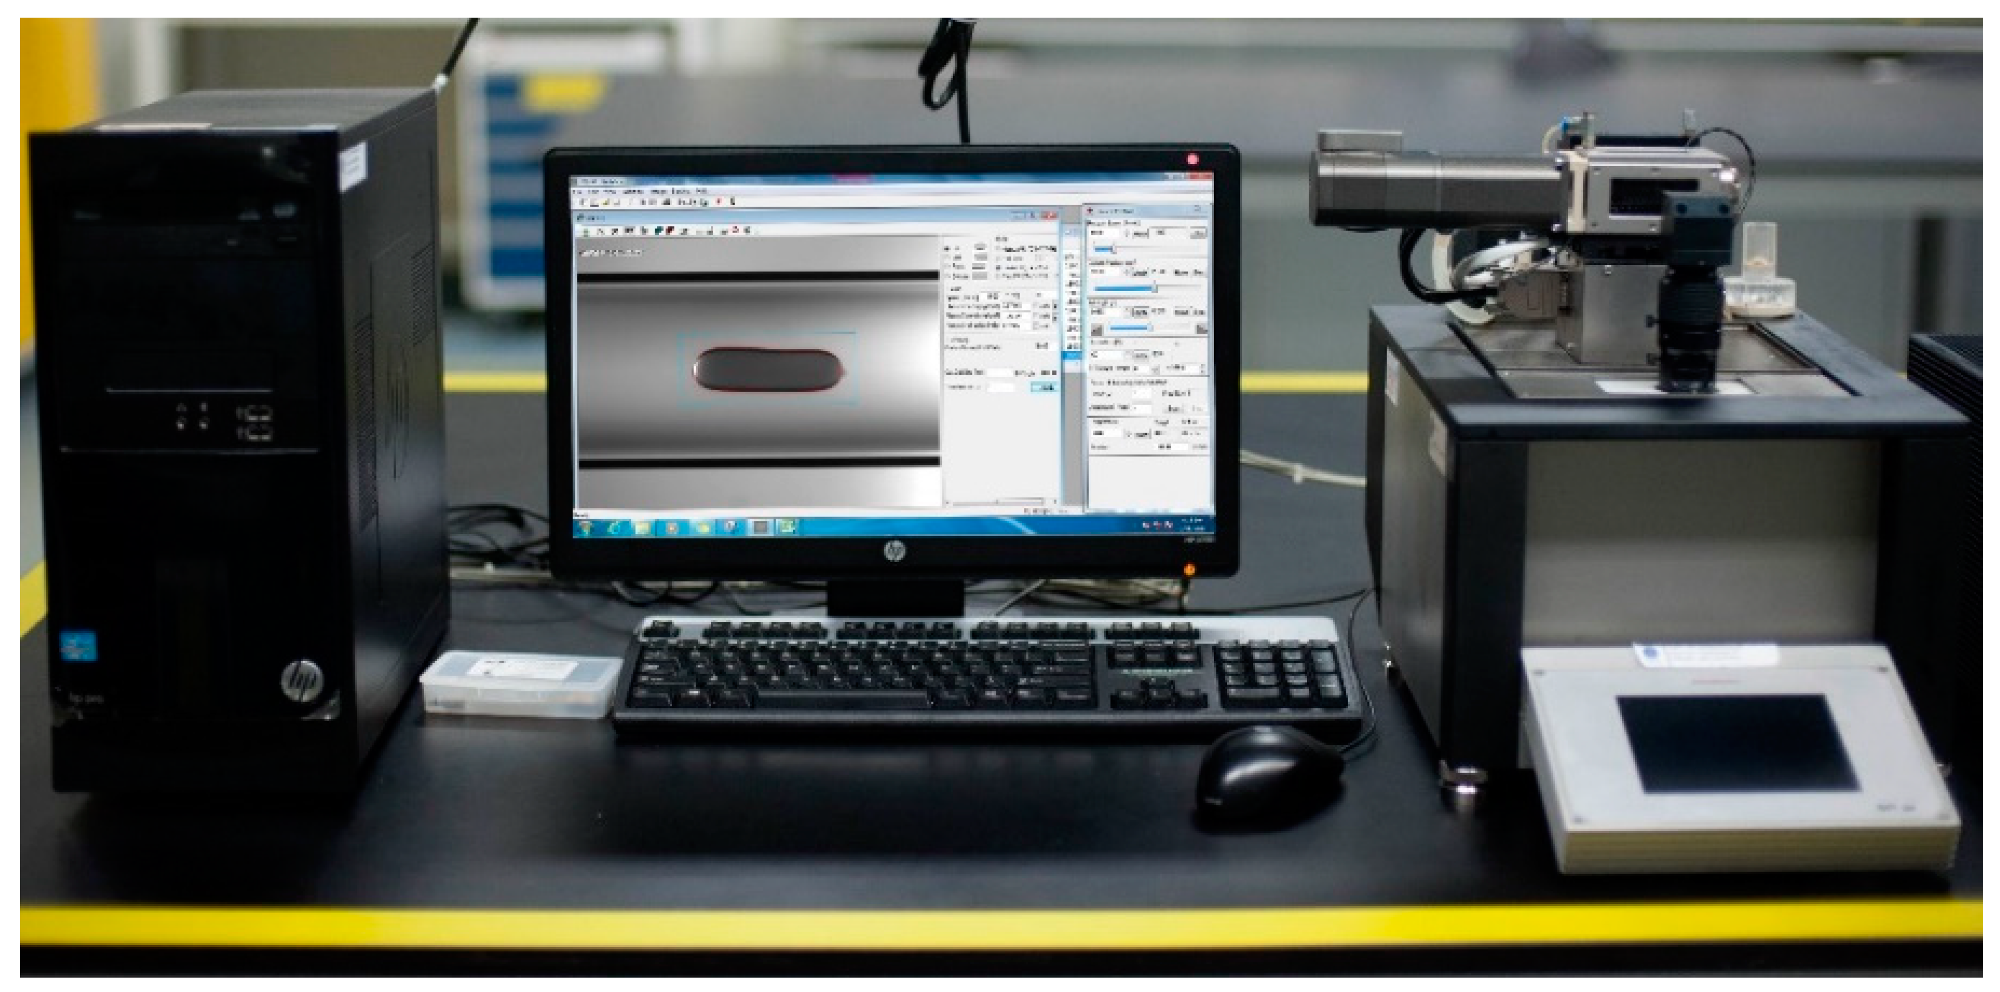
2.2.2. Interfacial Tension Measurement
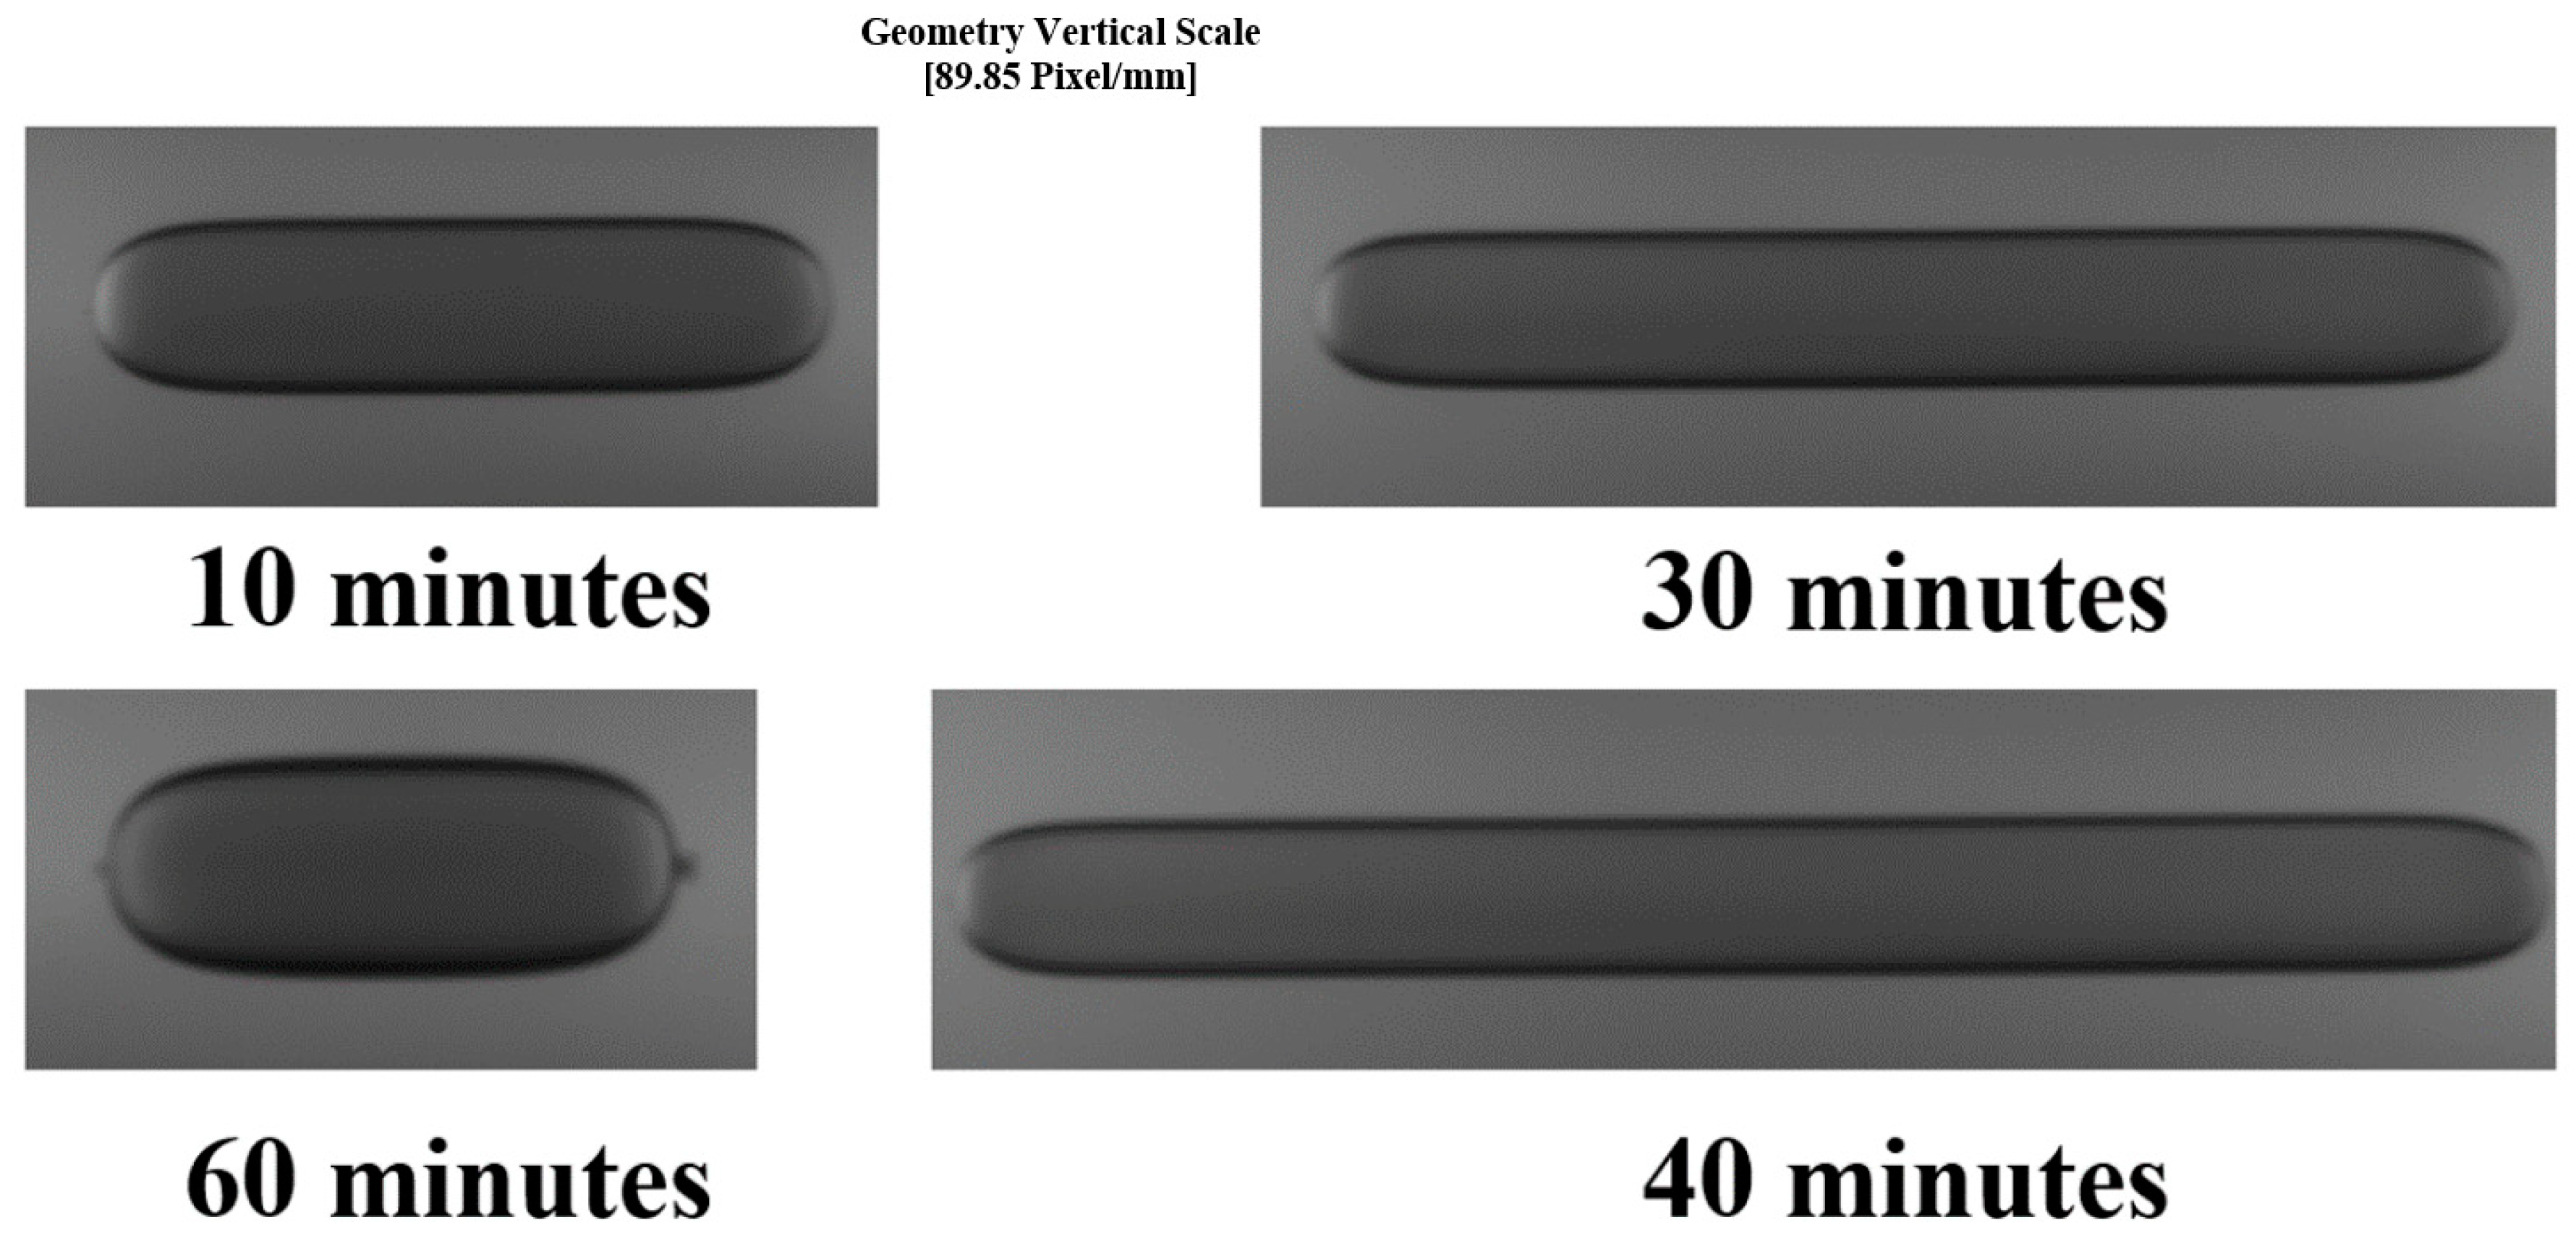
2.2.3. Surfactant Partitioning Test
Surfactant Partitioning in the Pre-cmc Rregime
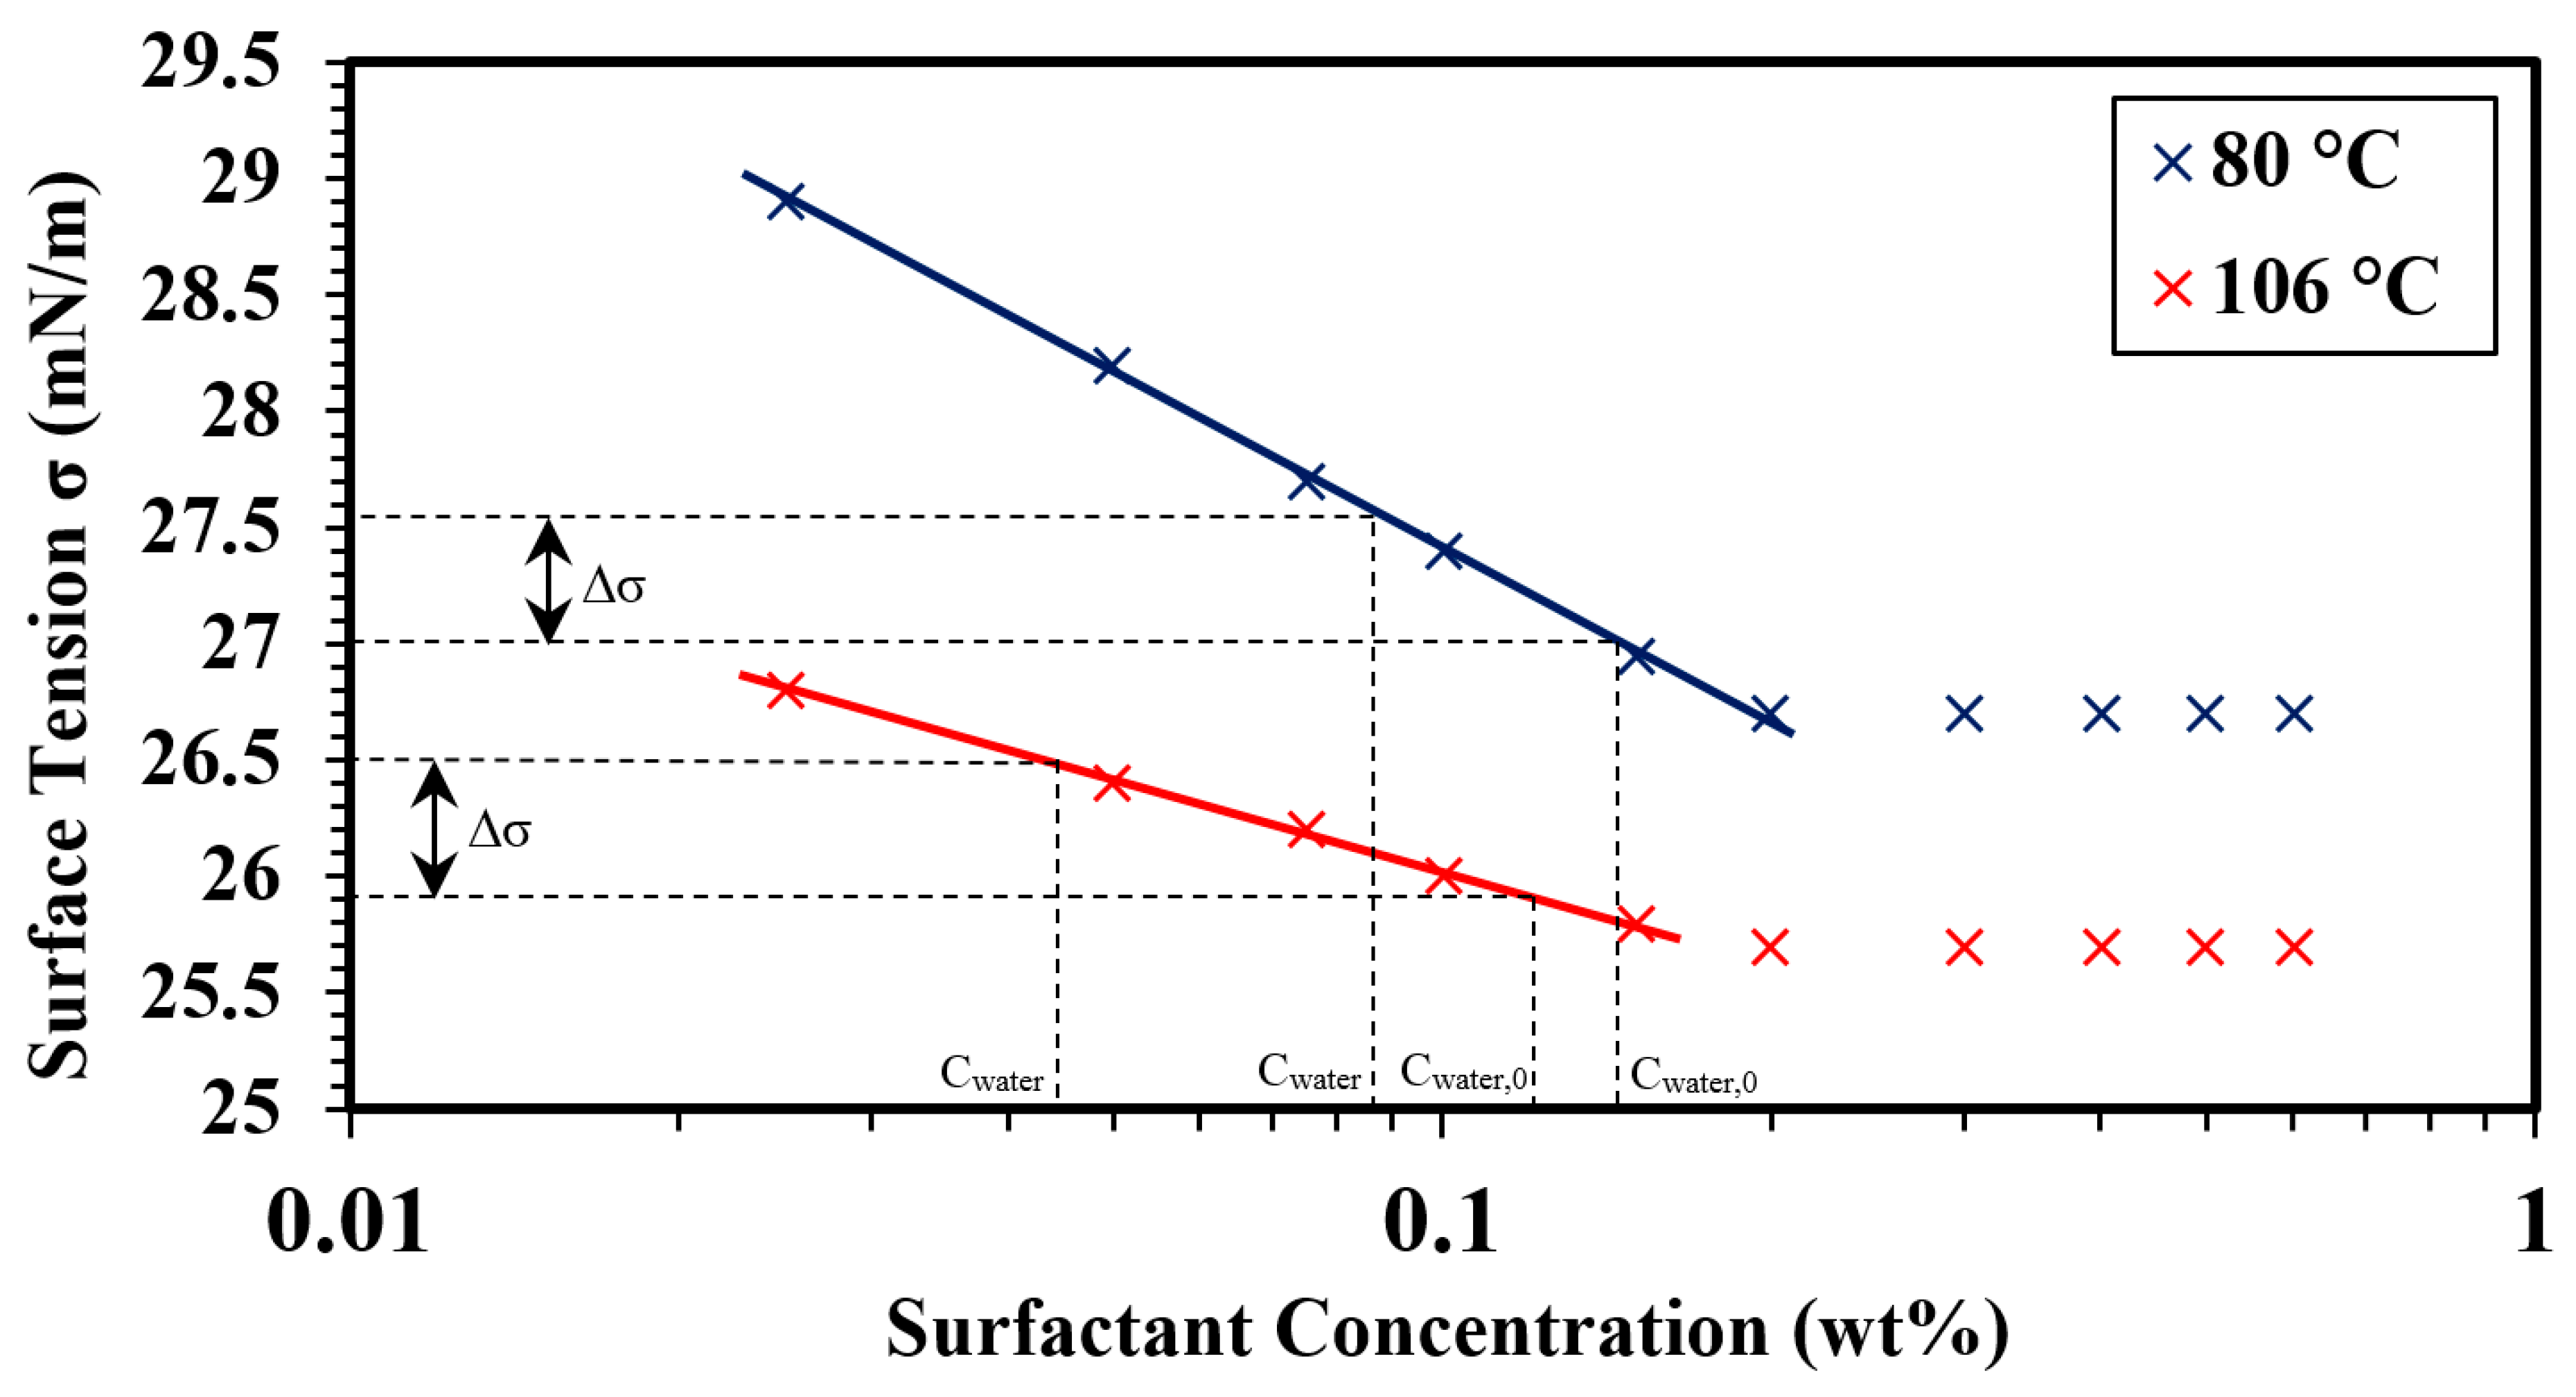
Surfactant Partitioning in the Post-cmc Regime
3. Results and Discussion
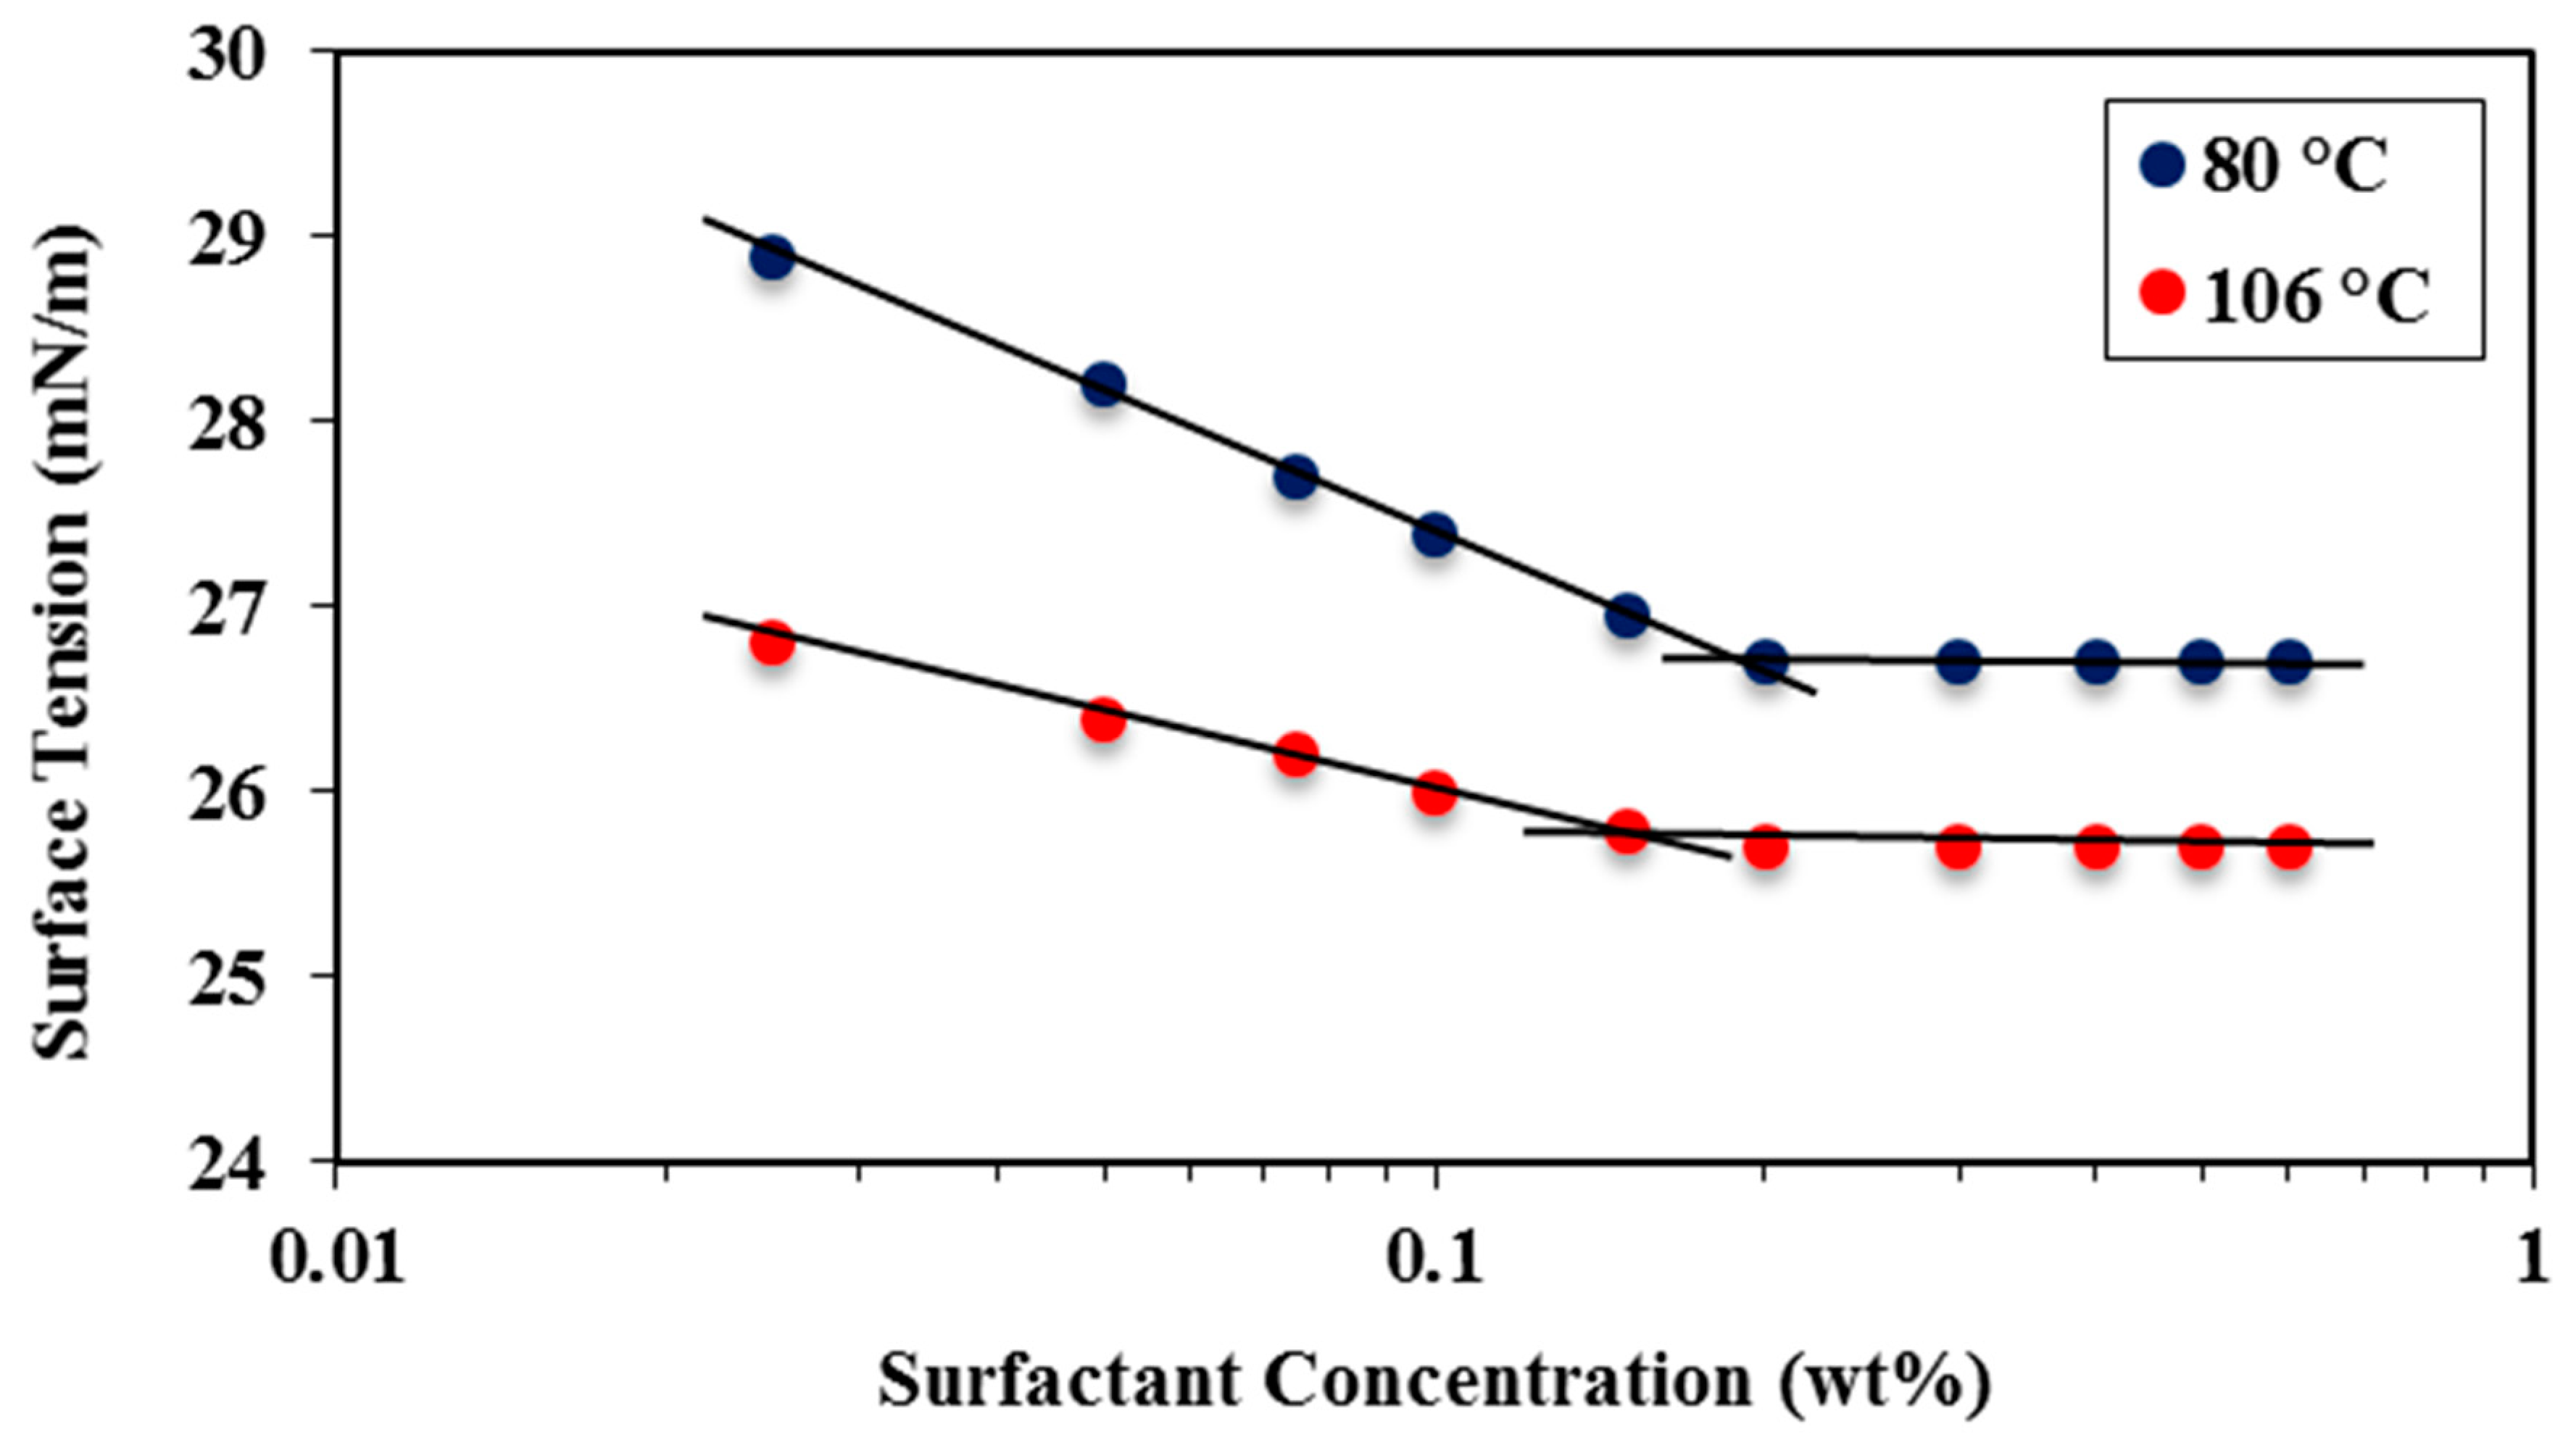
3.1. Surface Tension Measurements (CMC Determination)
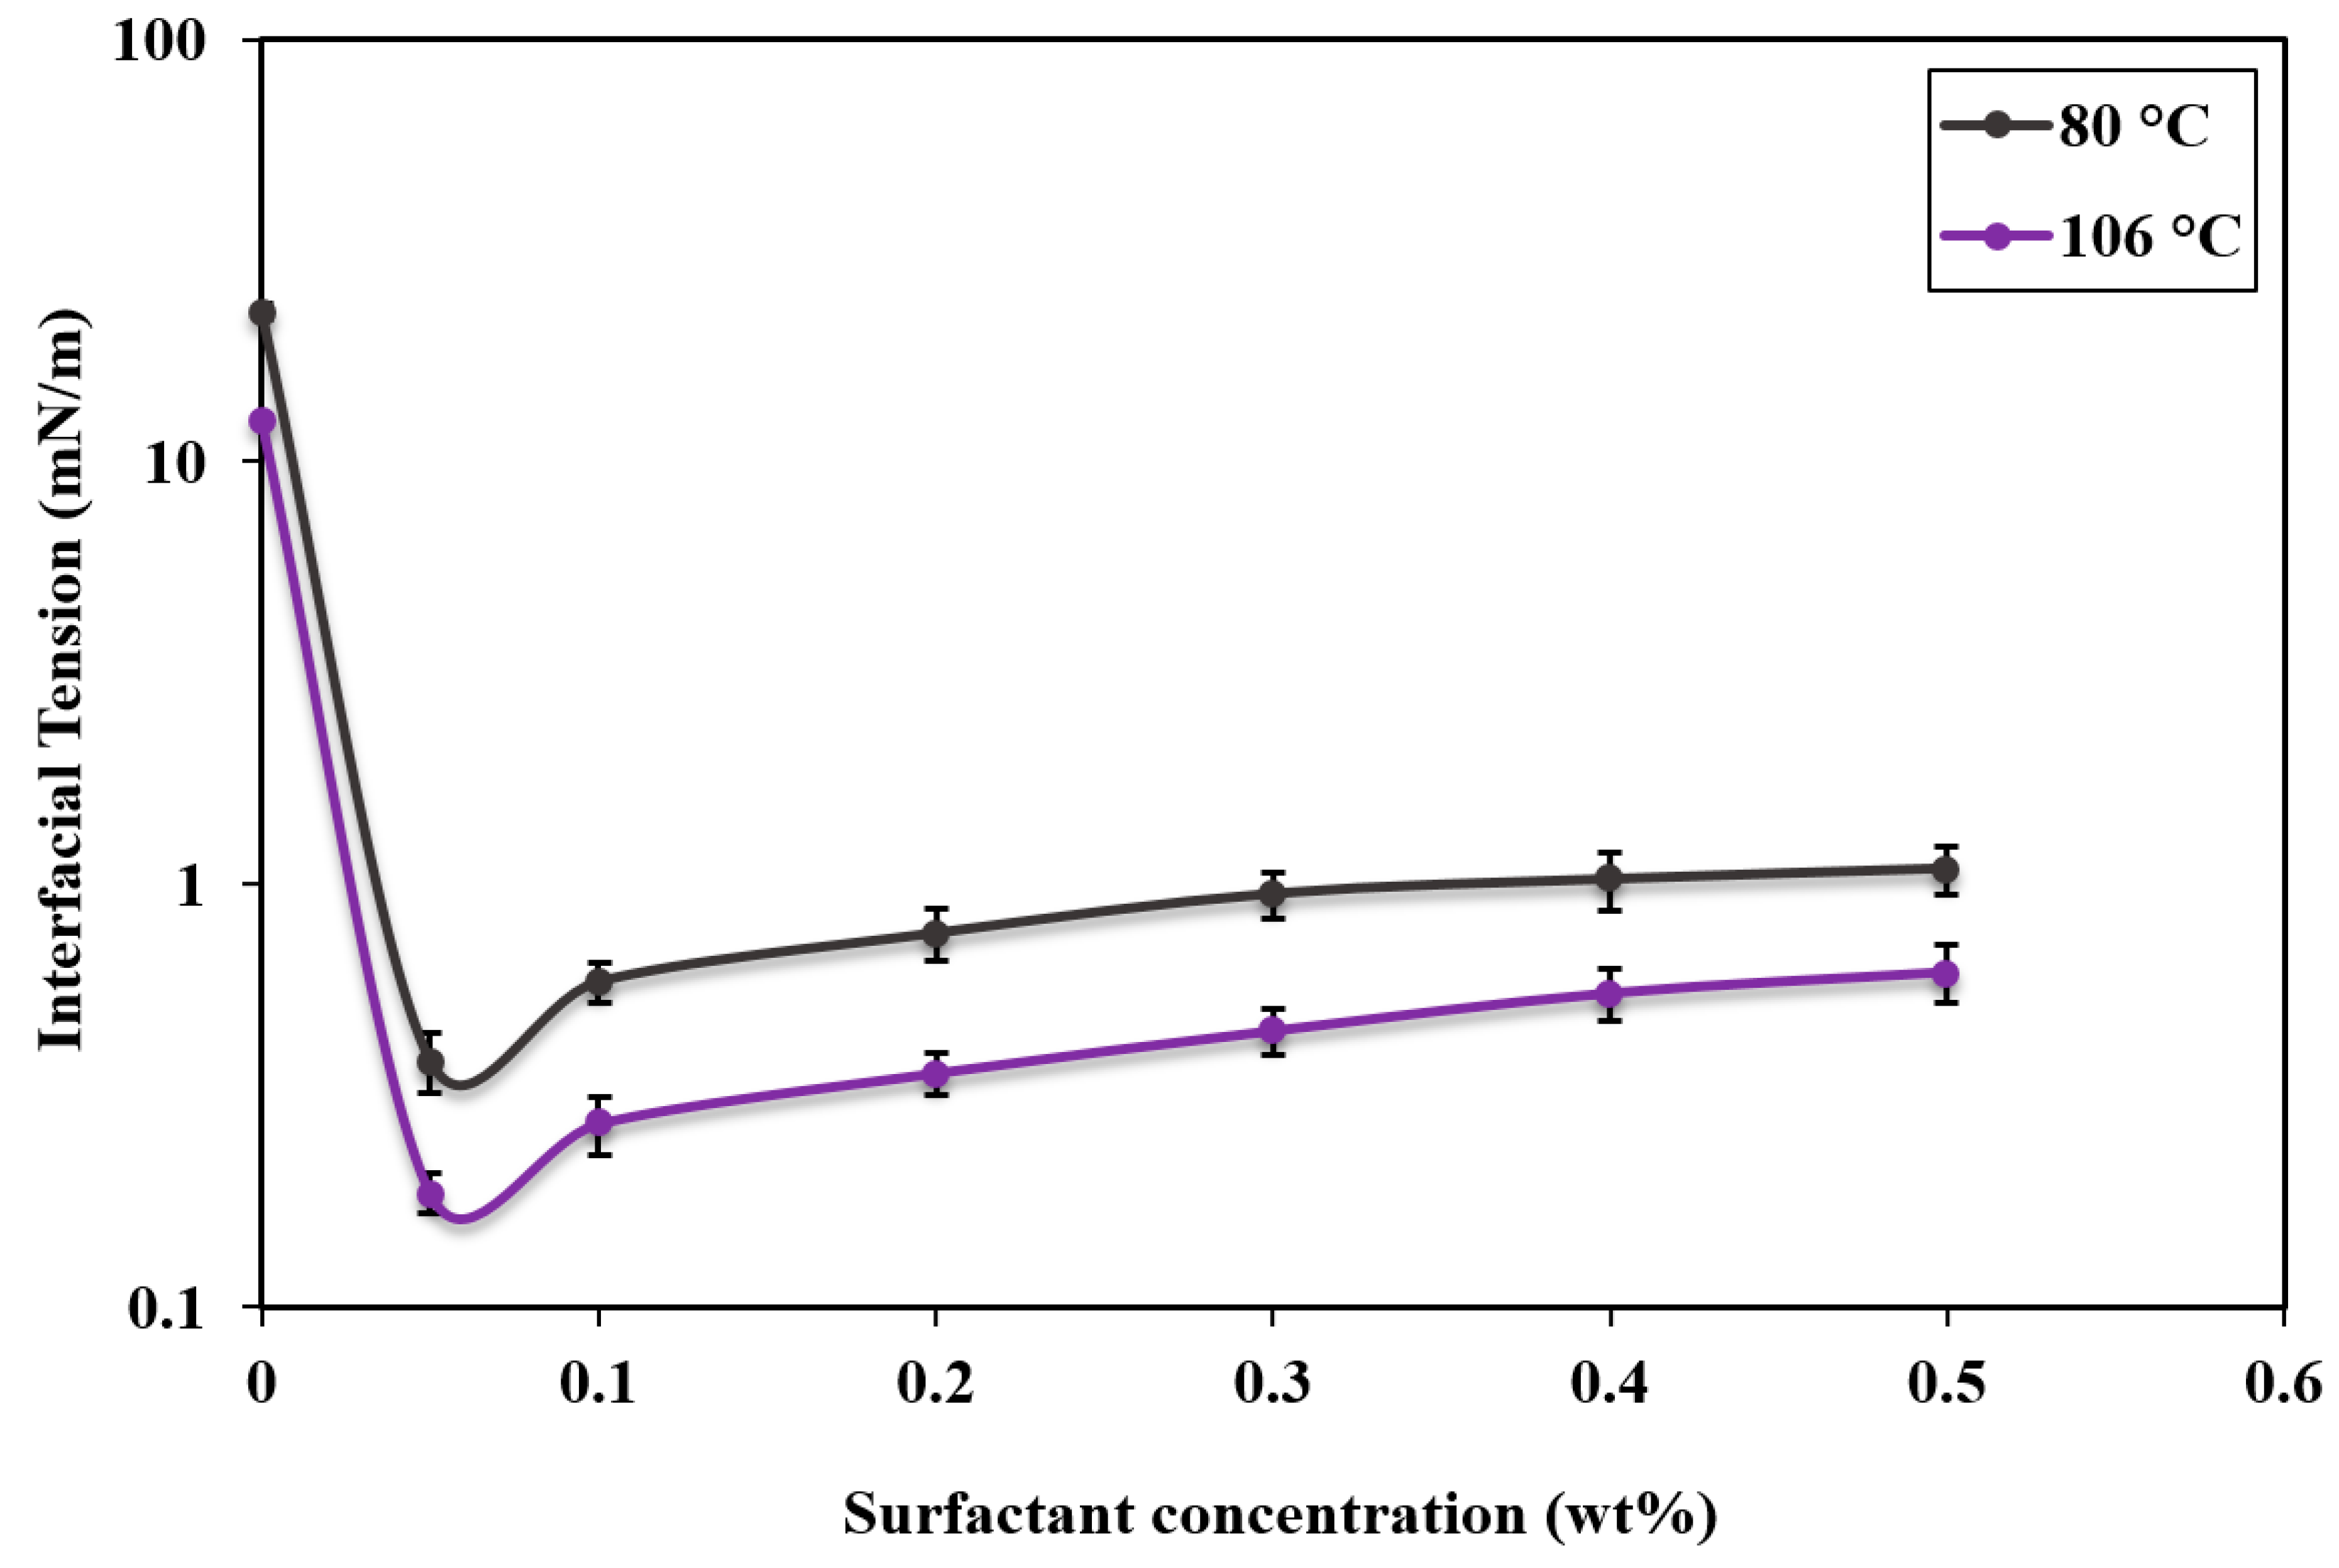
3.2. Interfacial Tension of Crude Oil in the Presence of APG
3.3. Surfactant Partitioning in the Pre-cmc Regime
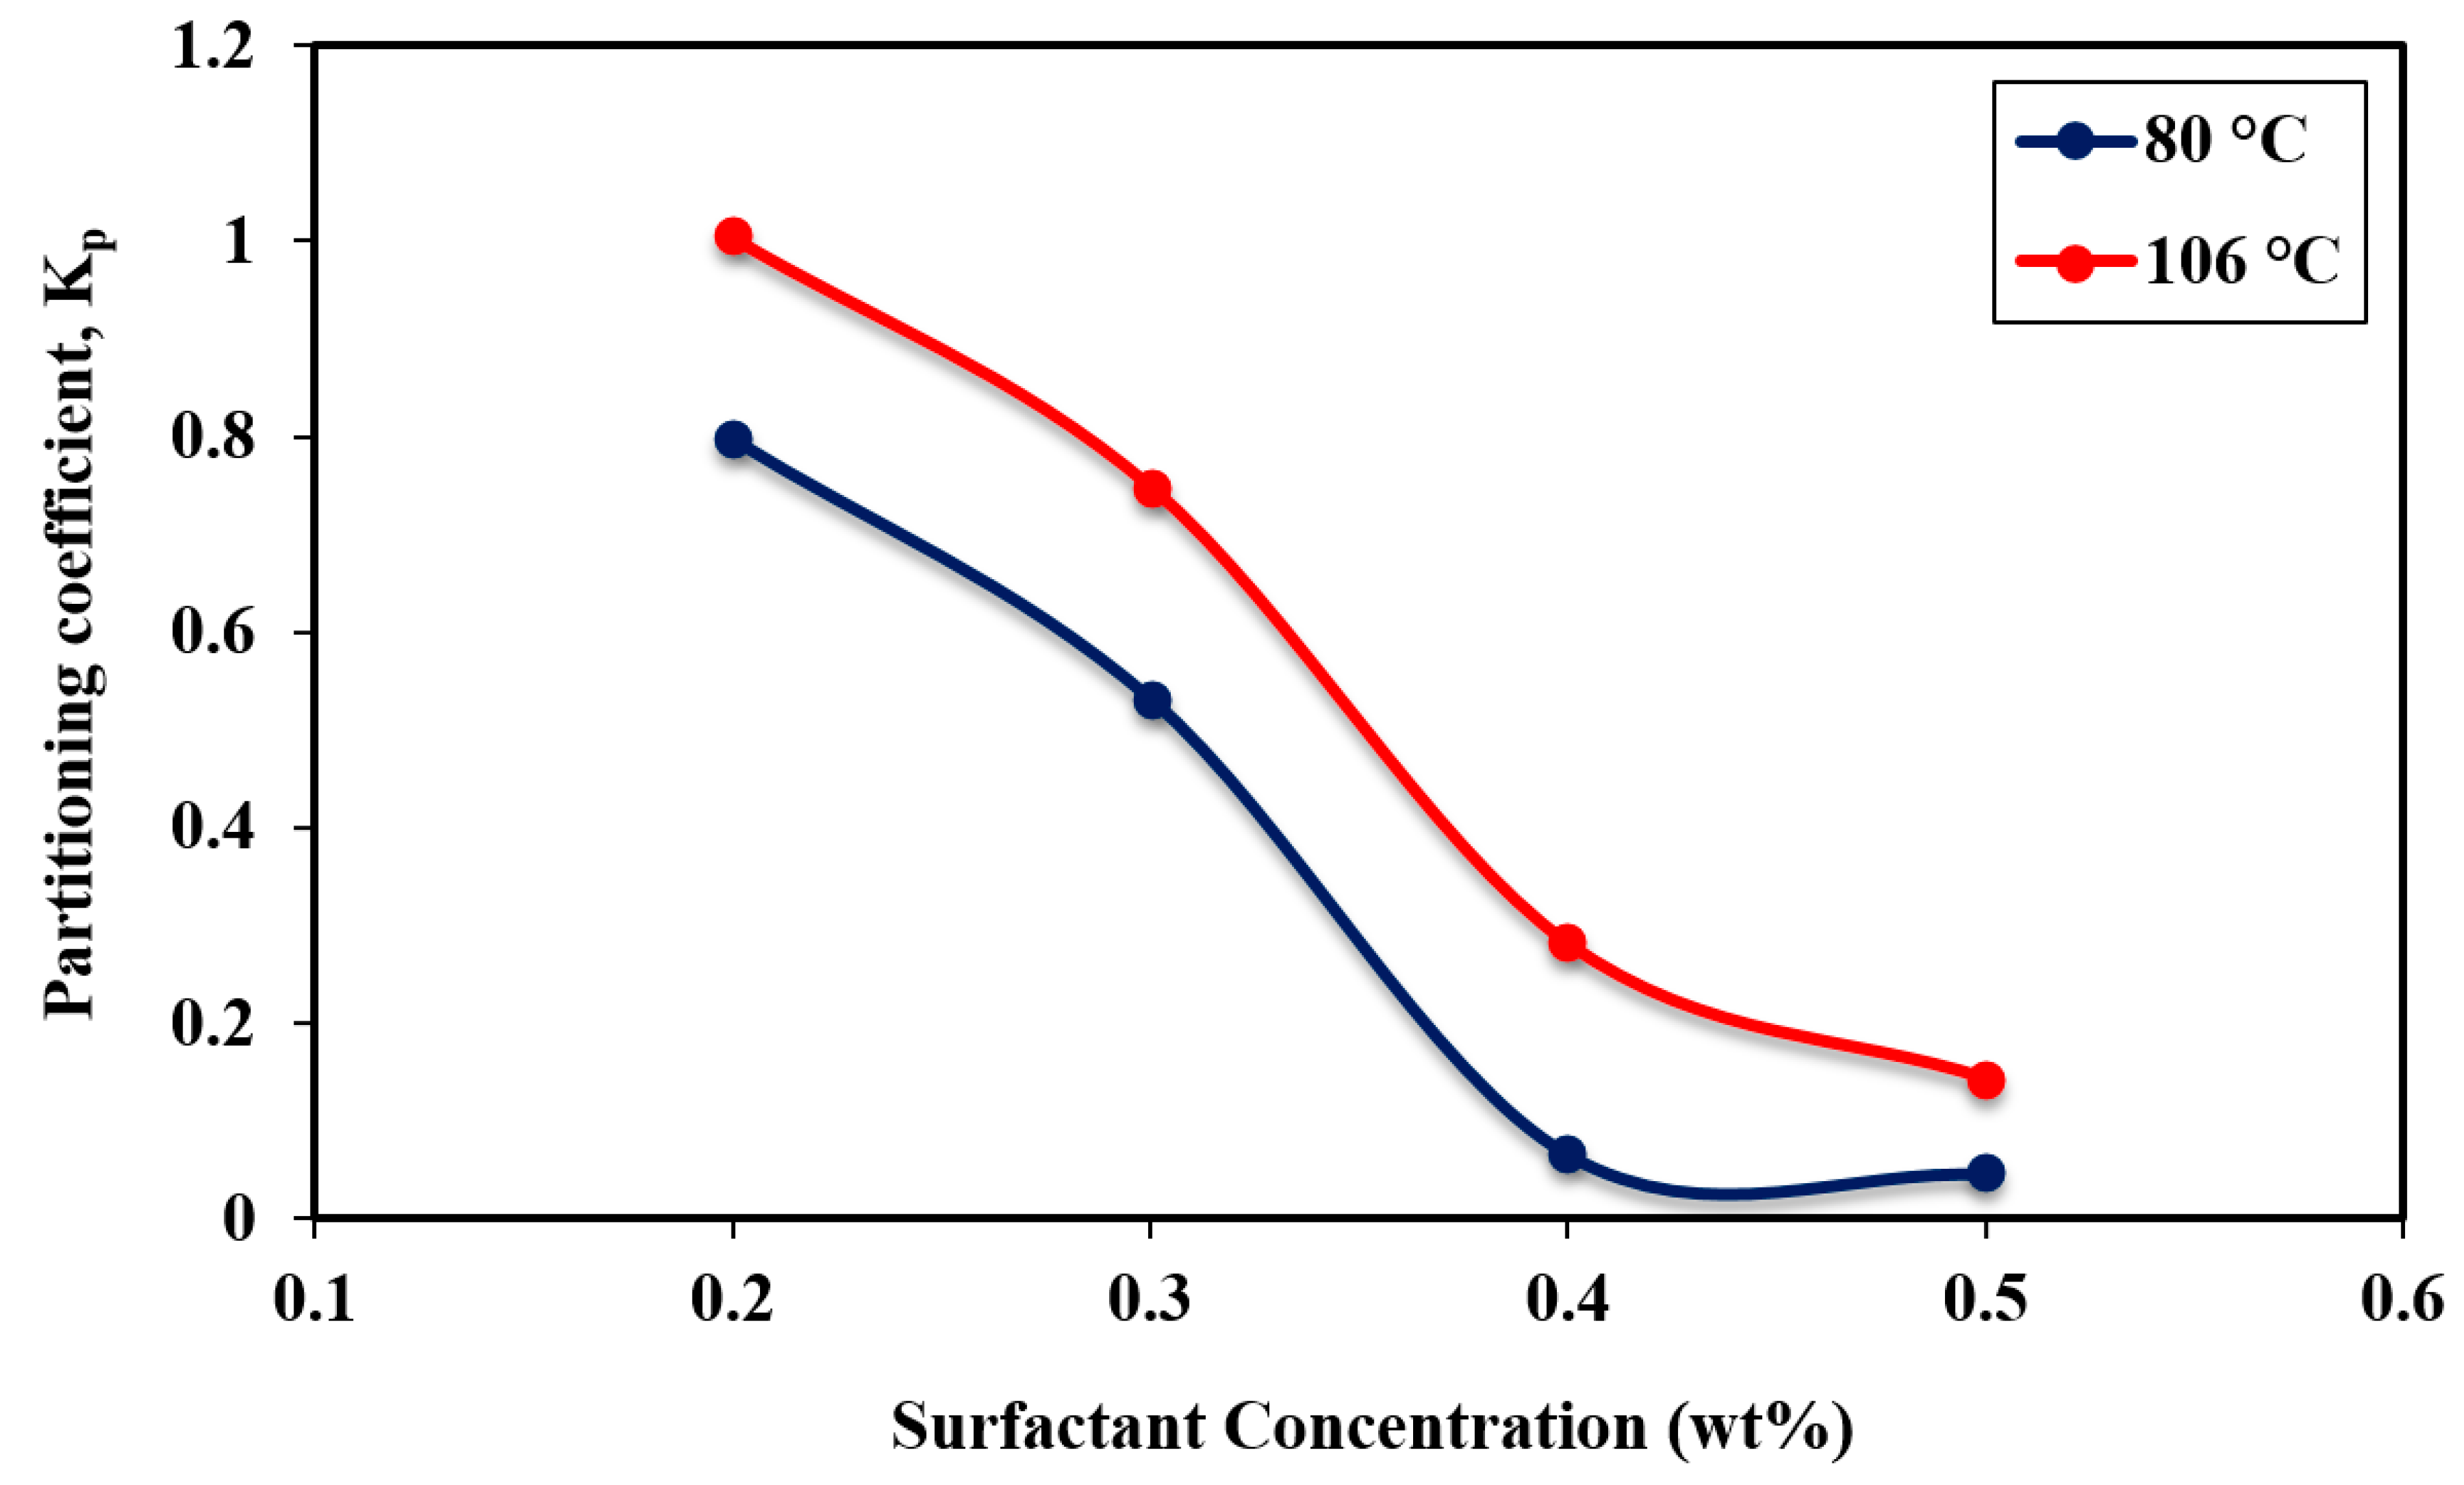
3.4. Surfactant Partitioning in the Post-cmc Regime
4. Conclusions
- Based on the surface tension measurements for APG, the CMC was found to be around 0.19 wt% and 0.17 wt% at 80 °C and 106 °C, respectively.
- The IFT reduction in the oil/water system was significantly affected by the increase of surfactant concentration and temperature. The lowest IFT value in the IFT profile was at 0.05 wt%, which was about 0.38 mN/m and 0.18 mN/m at 80 °C and 106 °C, respectively. Also, the temperature had a significant influence on the IFT, where the increase in temperature from 80 °C to 106 °C showed a considerable IFT reduction.
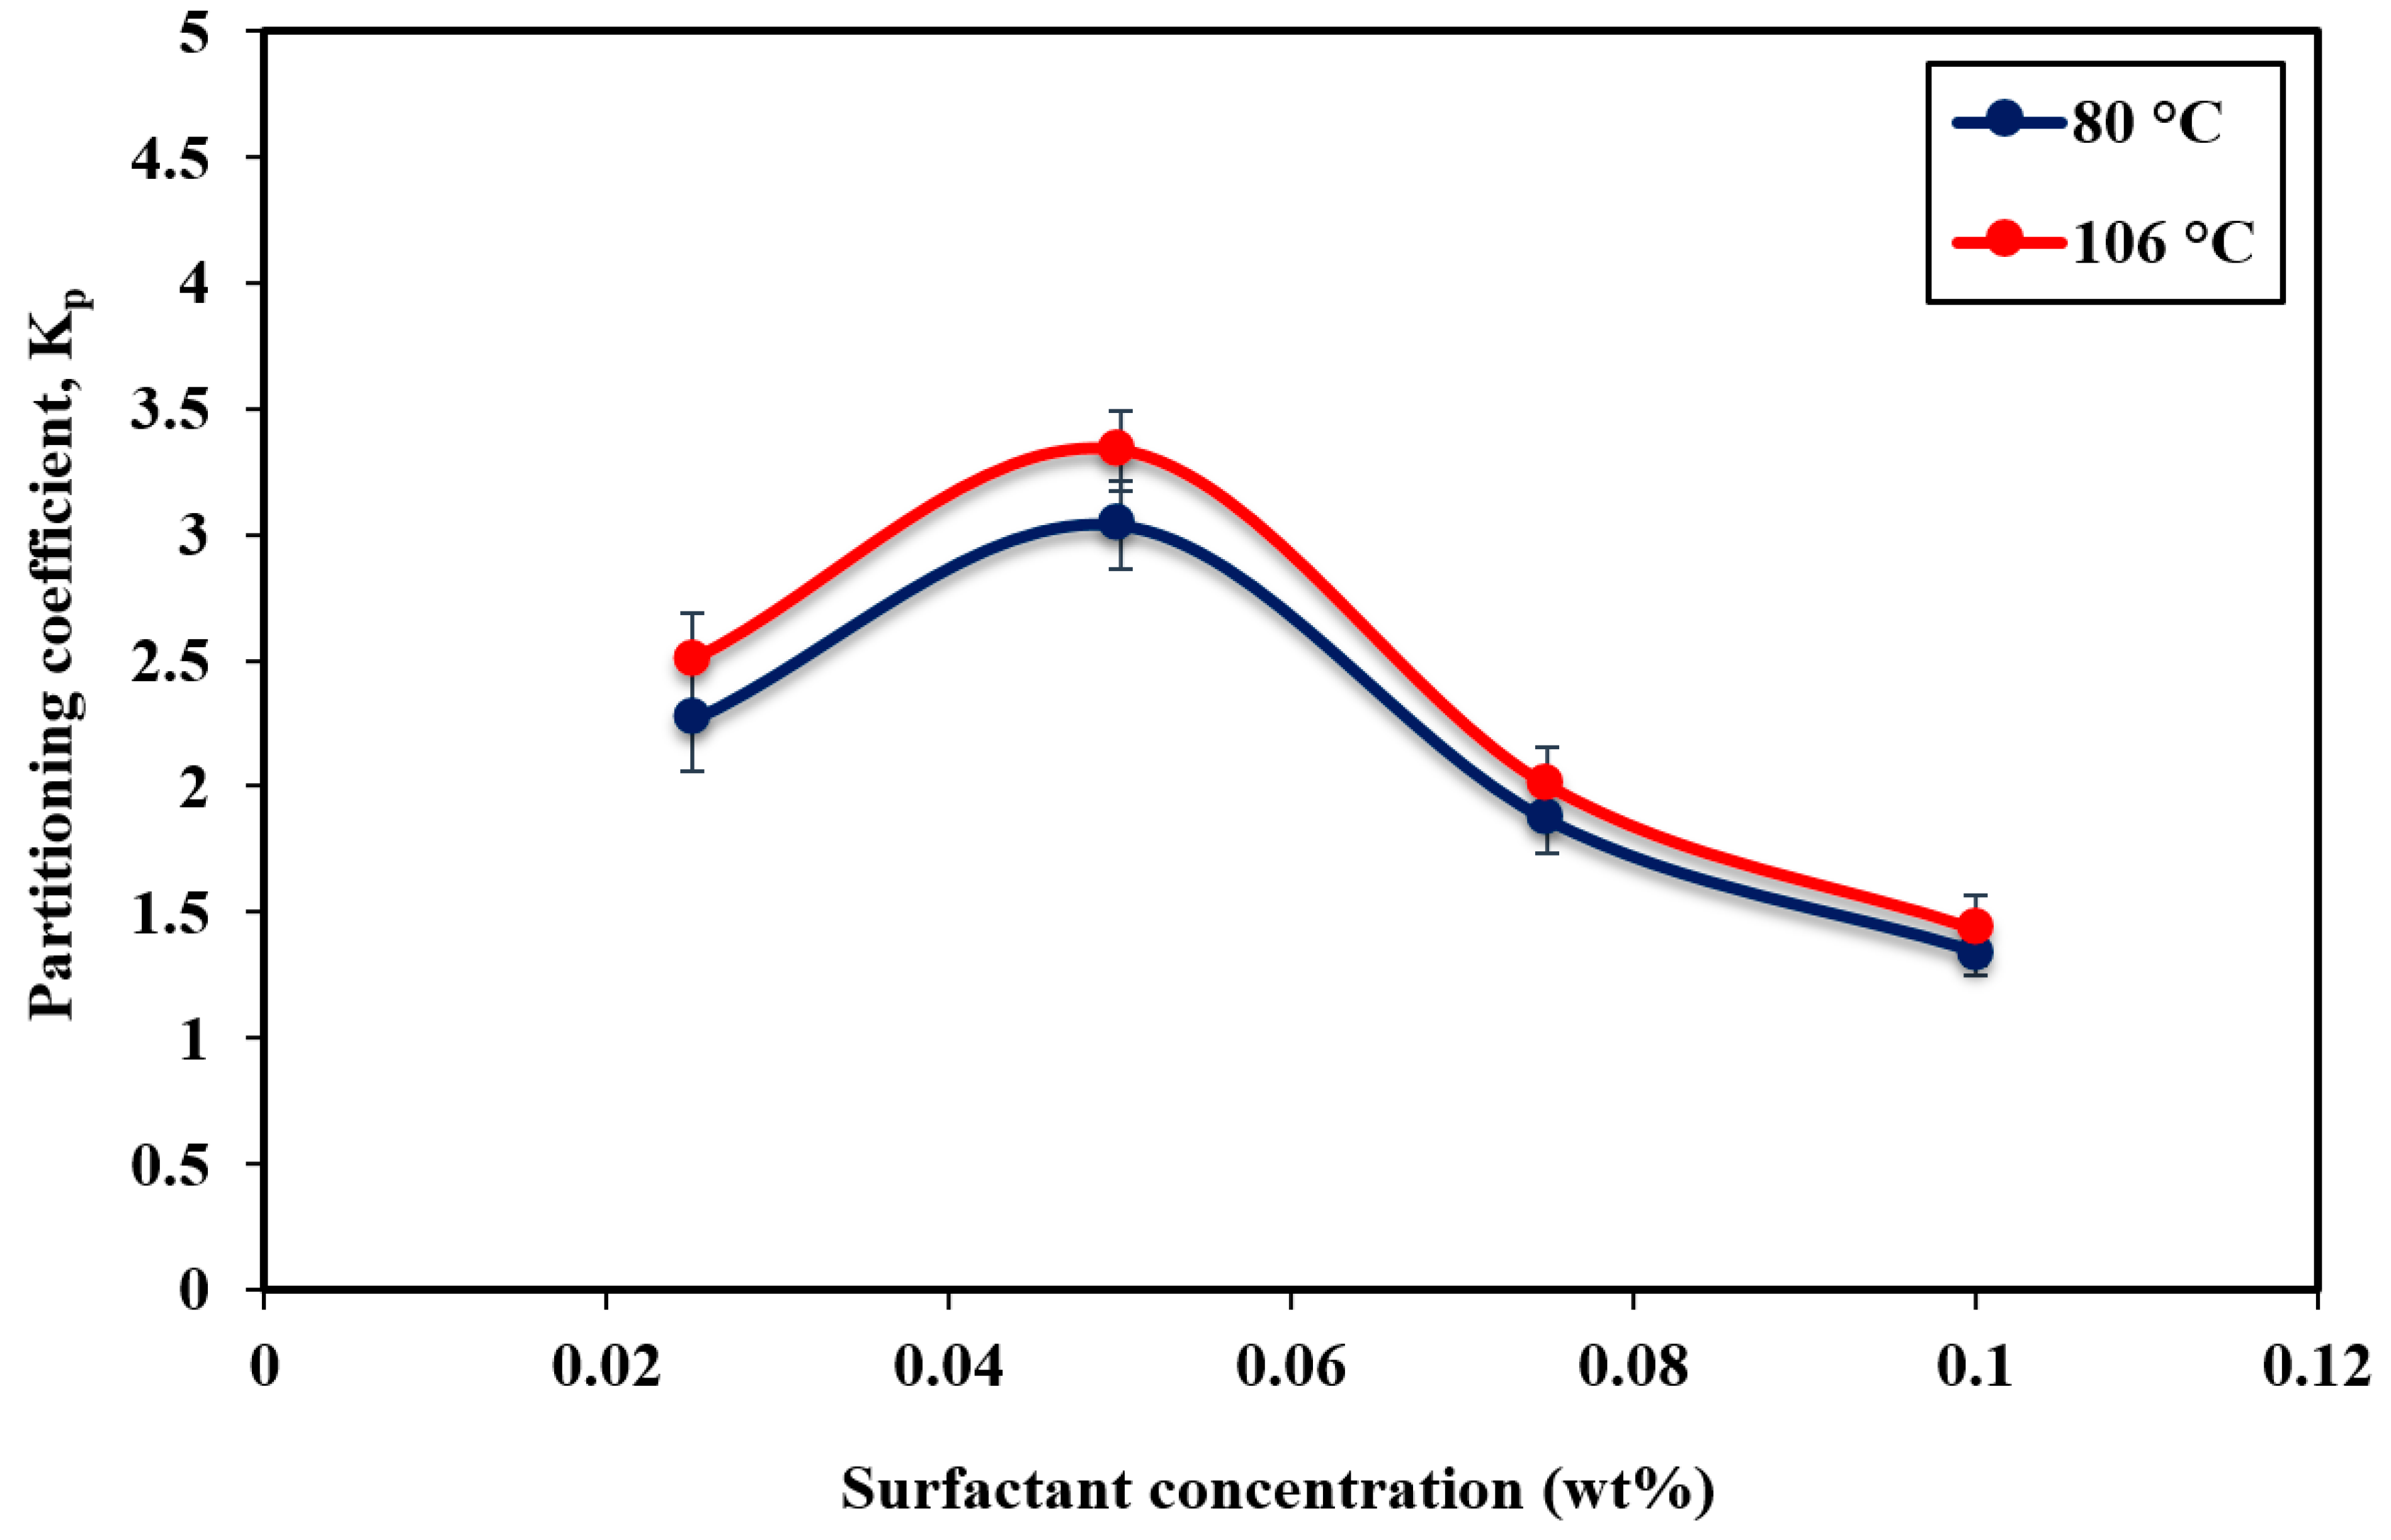
- The partitioning test results for APG in the pre-cmc regime with correspondence to the IFT results showed that the partitioning coefficient increased below 0.05 wt%. Beyond this concentration, the increase of surfactant concentration caused the partitioning coefficient to decrease. The increase of temperature from 80 °C to 106 °C increases the partitioning rate of surfactant molecules into the water-oil interface causing a reduction in IFT. The highest partitioning amount was observed at 0.05 wt% corresponding to the lowest IFT value and it was about 3 and 3.3 at 80 °C and 106 °C, respectively.
- The study of the partitioning of APG in the post-cmc regime illustrated that above CMC, the partitioning coefficient decreases as thr surfactant concentration increases, indicating that not all surfactant molecules are at the interface which results in an increase in IFT. The partitioning coefficient value in the post-cmc regime was lower than that in the pre-cmc regime. The effect of temperature on the partitioning in the post-cmc region has the same impact as in the pre-cmc region, where additional partitioned surfactant molecules arise at the water-oil interface at 106 °C.
Author Contributions
Funding
Conflicts of Interest
References
- Shafie, A.; Yahya, N.; Kashif, M.; Zaid, H.M.; Soleimani, H.; Alnarabiji, M.S. The Band Structures of Single-Walled Carbon Nanotubes and ZnO Nanoparticles Used for Oil Recovery in Water Flooding System. J. Nano Res. 2013, 26, 101–110. [Google Scholar] [CrossRef]
- Alnarabiji, M.S.; Yahya, N.; Shafie, A.; Solemani, H.; Chandran, K.; Bee, S.; Hamid, A.; Azizi, K. The Influence of Hydrophobic Multiwall Carbon Nanotubes Concentration on Enhanced Oil Recovery. Procedia Eng. 2016, 148, 1137–1140. [Google Scholar] [CrossRef] [Green Version]
- Adil, M.; Lee, K.; Zaid, H.M.; Latiff, N.R.A.; Alnarabiji, M.S. Experimental study on electromagnetic-assisted ZnO nanofluid flooding for enhanced oil recovery (EOR). PLoS ONE 2018, 13, 1–18. [Google Scholar] [CrossRef] [PubMed]
- Alnarabiji, M.S.; Yahya, N.; Hamid, S.B.A.; Azizli, K.A.; Kashif, M.; Qureshi, S.; Alqasem, B. The Role of Surface Area of ZnO Nanoparticles as an Agent for some Chemical Reactions. Defect Diffus. Forum 2014, 354, 201–213. [Google Scholar] [CrossRef]
- Belhaj, A.F.; Elraies, K.A.; Janjuhah, H.T.; Tasfy, S.F.H.; Yahya, N.; Abdullah, B.; Umar, A.A.; Ghanem, O.B.; Alnarabiji, M.S. Electromagnetic waves-induced hydrophobic multiwalled carbon nanotubes for enhanced oil recovery. J. Pet. Explor. Prod. Technol. 2019, 4–7. [Google Scholar] [CrossRef]
- Demirbas, A.; Alsulami, H.E.; Hassanein, W.S. Utilization of Surfactant Flooding Processes for Enhanced Oil Recovery (EOR). Pet. Sci. Technol. 2015, 33, 1331–1339. [Google Scholar] [CrossRef]
- Ahmed, S.; Elraies, K.A.; Hashmet, M.R.; Alnarabiji, M.S. Empirical modeling of the viscosity of supercritical carbon dioxide foam fracturing fluid under different downhole conditions. Energies 2018, 11, 782. [Google Scholar] [CrossRef]
- Kedar, V.; Bhagwat, S.S. Effect of salinity on the IFT between aqueous surfactant solution and crude oil. Pet. Sci. Technol. 2018, 36, 835–842. [Google Scholar] [CrossRef]
- Mosayebi, A.; Angaji, M.T.; Khadiv-parsi, P. The effect of temperature on the interfacial tension between crude oil and ethoxylated nonylphenols. Pet. Sci. Technol. 2016, 34, 1315–1322. [Google Scholar] [CrossRef]
- Alnarabiji, M.S.; Yahya, N.; Nadeem, S.; Adil, M.; Baig, M.K.; Ghanem, O.B.; Azizi, K.; Ahmed, S.; Maulianda, B.; Klemeš, J.J.; et al. Nanofluid enhanced oil recovery using induced ZnO nanocrystals by electromagnetic energy: Viscosity increment. Fuel 2018, 233, 632–643. [Google Scholar] [CrossRef]
- Thomas, S.; Ali, S.M.F. Micellar Flooding and ASP—Chemical Methods for Enhanced Oil Recovery. In Proceedings of the Annual Technical Meeting, Calgary, AB, Canada, 14–18 June 1999. [Google Scholar]
- Alnarabiji, M.S.; Yahya, N.; Bee Abd Hamid, S.; Azizli, K.A.; Shafie, A.; Solemani, H. Microwave Synthesis of ZnO Nanoparticles for Enhanced Oil Recovery. Adv. Mater. Res. 2014, 1024, 83–86. [Google Scholar] [CrossRef]
- Chen, F.; Mccool, C.S.; Green, D.W.; Willhite, G.P. Experimental and Modeling Study of the Transport of Chromium Acetate Solutions Through Carbonate Rocks. SPE J. 2010. [Google Scholar] [CrossRef]
- Sandersen, S.B. Enhanced Oil Recovery with Surfactant Flooding. Ph.D. Thesis, Technical University of Denmark, Kongens Lyngby, Denmark, 2012; pp. 1–162. [Google Scholar]
- Hirasaki, G.J.; Miller, C.A.; Puerto, M. Recent Advances in Surfactant EOR. Soc. Pet. Eng. 2011. [Google Scholar] [CrossRef]
- Mccool, C.S.; Panneswar, R.; Willhite, G.P. Interpretation of Differential Pressure in Laboratory Surfactant/Polymer Displacements. Soc. Pet. Eng. J. 1983, 791–803. [Google Scholar] [CrossRef]
- Myers, D. Surfactant Science and Technology Surfactant Science; John Wiley & Sons, Inc.: Hoboken, NJ, USA, 2006; ISBN 9780471680246. [Google Scholar]
- Belhaj, A.F.; Elraies, K.A.; Mahmood, S.M.; Zulkifli, N.N.; Akbari, S.; Hussien, O.S. The effect of surfactant concentration, salinity, temperature, and pH on surfactant adsorption for chemical enhanced oil recovery: A review. J. Pet. Explor. Prod. Technol. 2019, 1–13. [Google Scholar] [CrossRef]
- Ravera, F.; Ferrari, M.; Liggieri, L.; Miller, R.; Passerone, A. Measurement of the Partition Coefficient of Surfactants in Water/Oil Systems. Langmuir 1997, 13, 4817–4820. [Google Scholar] [CrossRef]
- Catanoiu, G.; Carey, E.; Patil, S.R.; Engelskirchen, S.; Stubenrauch, C. Partition coefficients of nonionic surfactants in water/n-alkane systems. J. Colloid Interface Sci. 2011, 355, 150–156. [Google Scholar] [CrossRef] [PubMed]
- Young, T.J.; Nelson, C.W.; Lyons-bell, C.; Moore, J.D. Fluid Phase Equilibria High temperature and pressure water/oil interfacial tension benchmark data for the Ninth Industrial Fluid Properties Simulation Challenge. Fluid Phase Equilib. 2018, 476, 6–8. [Google Scholar] [CrossRef]
- Yuan, C.D.; Pu, W.F.; Wang, X.C.; Sun, L.; Zhang, Y.C.; Cheng, S. Effects of Interfacial Tension, Emulsification, and Surfactant Concentration on Oil Recovery in Surfactant Flooding Process for High Temperature and High Salinity Reservoirs. Energy Fuels 2015, 29, 6165–6176. [Google Scholar] [CrossRef]
- Aoudia, M.; Al-Maamari, R.S.; Nabipour, M.; Al-Bemani, A.S.; Ayatollahi, S. Laboratory study of alkyl ether sulfonates for improved oil recovery in high-salinity carbonate reservoirs: A case study. Energy Fuels 2010, 24, 3655–3660. [Google Scholar] [CrossRef]
- Jia, B.; Tsau, J.; Barati, R. A review of the current progress of CO2 injection EOR and carbon storage in shale oil reservoirs. Fuel 2019, 236, 404–427. [Google Scholar] [CrossRef]
- Miller, C.A.; Neogi, P. Interfacial Phenomena (Equilibrium and Dynamic Effects); Taylor & Francis Group: Abingdon, UK, 2008; ISBN 1420044427. [Google Scholar]
- Mo, D.; Jia, B.; Yu, J.; Liu, N.; Lee, R. Study Nanoparticle-Stabilized CO2 Foam for Oil Recovery at Different Pressure, Temperature, and Rock Samples. In Proceedings of the SPE Improved Oil Recovery Symposium, Tulsa, OK, USA, 12–16 April 2014; pp. 1–11. [Google Scholar]
- Salager, J.; Marquez, N.; Graciaa, A.; Lachaise, J. Partitioning of Ethoxylated Octylphenol Surfactants in Microemulsion-Oil-Water Systems: Influence of Temperature and Relation between Partitioning Coefficient and Physicochemical Formulation. Langmuir 2000, 5534–5539. [Google Scholar] [CrossRef]
- Ren, G.; Zhang, H.; Nguyen, Q. Effect of Surfactant Partitioning on Mobility Control During Carbon-Dioxide Flooding. SPE J. 2013, 18, 752–765. [Google Scholar] [CrossRef]
- Tadmouri, R.; Zedde, C.; Routaboul, C.; Micheau, J.C.; Pimienta, V. Partition and water/oil adsorption of some surfactants. J. Phys. Chem. B 2008, 112, 12318–12325. [Google Scholar] [CrossRef] [PubMed]
- Acosta, E.; Szekeres, E.; Sabatini, D.A.; Harwell, J.H. Supersolubilization in Surfactant Microemulsions. Langmuir 2003, 38, 186–195. [Google Scholar] [CrossRef]
- Rosen, M.J.; Kunjappu, J.T. Surfactants and Interfacial Phenomena, 4th ed.; John Wiley & Sons: Hoboken, NJ, USA, 2012; ISBN 9780470541944. [Google Scholar]
- Boza Troncoso, A.; Acosta, E. The UNIFAC model and the partition of alkyl and alkylphenol ethoxylate surfactants in the excess phases of middle phase microemulsions. Fluid Phase Equilib. 2015, 397, 117–125. [Google Scholar] [CrossRef]
- Torrealba, V.A.; Johns, R.T. Partition Coefficient Relations in Surfactant-Oil-Brine Systems for Improved Description of Microemulsion Phase Behavior. In Proceedings of the SPE EOR Conference at Oil and Gas West Asia, Muscat, Oman, 21–23 March 2016. [Google Scholar]
- Kazemzadeh, Y.; Parsaei, R.; Riazi, M. Experimental study of asphaltene precipitation prediction during gas injection to oil reservoirs by interfacial tension measurement. Colloids Surfaces A Physicochem. Eng. Asp. 2015, 466, 138–146. [Google Scholar] [CrossRef]
- Viades-Trejo, J.; Gracia-Fadrique, J. Spinning drop method. From Young-Laplace to Vonnegut. Colloids Surfaces A Physicochem. Eng. Asp. 2007, 302, 549–552. [Google Scholar] [CrossRef]
- Zhang, D.L.; Liu, S.; Yan, W.; Puerto, M.; Hirasaki, G.J.; Miller, C.A.; Rice, U. Favorable Attributes o f Alkali-Surfactant-Polymer Flooding. In Proceedings of the SPE/DOE Symposium on Improved Oil Recovery, Tulsa, OK, USA, 22–26 April 2006. [Google Scholar]
- Ravera, F.; Ferrari, M.; Liggieri, L. Adsorption and partitioning of surfactants in liquid-liquid systems. Adv. Colloid Interface Sci. 2000, 88, 129–177. [Google Scholar] [CrossRef]
- El-Hamouz, A. Effect of surfactant concentration and operating temperature on the drop size distribution of silicon oil water dispersion. J. Dispers. Sci. Technol. 2007, 28, 797–804. [Google Scholar] [CrossRef]
- Fuseni, A.B.; Al-zahrani, B.H.; Alsofi, A.M.; Aramco, S. Critical Micelle Concentration of Different Classes of EOR Surfactants under Representative Field Conditions. In Proceedings of the SPE Kingdom of Saudi Arabia Annual Technical Symposium and Exhibition, Dammam, Saudi Arabia, 24–27 April 2017. [Google Scholar]
- Kumar, S.; Mandal, A. Studies on interfacial behavior and wettability change phenomena by ionic and nonionic surfactants in presence of alkalis and salt for enhanced oil recovery. Appl. Surf. Sci. 2016, 372, 42–51. [Google Scholar] [CrossRef]
- HUA, X.Y.; ROSEN, M.J. Dynamic Surface Tension of Aqueous Surfactant Solutions: I. basic paremeters. J. Colloid Interface Sci. 1988, 124, 652–659. [Google Scholar]
- Kamal, M.S.; Hussein, I.A.; Sultan, A.S. Review on Surfactant Flooding: Phase Behavior, Retention, IFT, and Field Applications. Energy Fuels 2017, 31, 7701–7720. [Google Scholar] [CrossRef]
- Gao, B.; Sharma, M.M. A family of alkyl sulfate gemini surfactants. 2. Water-oil interfacial tension reduction. J. Colloid Interface Sci. 2013, 407, 375–381. [Google Scholar] [CrossRef] [PubMed]
- Kim, Y.H.; Wasan, D.T. Effect of Demulsifier Partitioning on the Destabilization of Water-in-Oil Emulsions. Ind. Eng. Chem. Res. 1996, 1141–1149. [Google Scholar] [CrossRef]


| Temperature (°C) | Density (g/cm3) | API |
|---|---|---|
| 25 | 0.8048 | 44.64 |
| 80 | 0.75825 | 49.0 |
| 106 | 0.7412 | 50.62 |
| Ion | Concentration (ppm) |
|---|---|
| Sodium (Na) | 10080 |
| Calcium (Ca) | 380 |
| Magnesium (Mg) | 1222 |
| Potassium (K) | 386.5 |
| Strontium (Sr) | 6.456 |
| Chloride (Cl) | 18520 |
| Bicarbonate (HCO3) | 148 |
| Sulphate (SO4) | 2000 |
| Time | Mobile Phase A | Mobile Phase B |
|---|---|---|
| 0–2 min | 85 | 15 |
| 20–35 min | 15 | 85 |
| 36–40 min | 85 | 15 |
© 2019 by the authors. Licensee MDPI, Basel, Switzerland. This article is an open access article distributed under the terms and conditions of the Creative Commons Attribution (CC BY) license (http://creativecommons.org/licenses/by/4.0/).
Share and Cite
Belhaj, A.F.; Elraies, K.A.; Alnarabiji, M.S.; Shuhli, J.A.B.M.; Mahmood, S.M.; Ern, L.W. Experimental Investigation of Surfactant Partitioning in Pre-CMC and Post-CMC Regimes for Enhanced Oil Recovery Application. Energies 2019, 12, 2319. https://doi.org/10.3390/en12122319
Belhaj AF, Elraies KA, Alnarabiji MS, Shuhli JABM, Mahmood SM, Ern LW. Experimental Investigation of Surfactant Partitioning in Pre-CMC and Post-CMC Regimes for Enhanced Oil Recovery Application. Energies. 2019; 12(12):2319. https://doi.org/10.3390/en12122319
Chicago/Turabian StyleBelhaj, Ahmed Fatih, Khaled Abdalla Elraies, Mohamad Sahban Alnarabiji, Juhairi Aris B M Shuhli, Syed Mohammad Mahmood, and Lim Wan Ern. 2019. "Experimental Investigation of Surfactant Partitioning in Pre-CMC and Post-CMC Regimes for Enhanced Oil Recovery Application" Energies 12, no. 12: 2319. https://doi.org/10.3390/en12122319
APA StyleBelhaj, A. F., Elraies, K. A., Alnarabiji, M. S., Shuhli, J. A. B. M., Mahmood, S. M., & Ern, L. W. (2019). Experimental Investigation of Surfactant Partitioning in Pre-CMC and Post-CMC Regimes for Enhanced Oil Recovery Application. Energies, 12(12), 2319. https://doi.org/10.3390/en12122319